Embed Size (px)
Citation preview

Green Jobs and the Ohio Economy
June 2011
Career PathwaysBuilding the Workforce for a green economy
Career PathwaysBuilding the Workforce for a green economy
P a r t 4
E d u c a t i o n a n d T r a i n i n g P r o g r a m s

Green Jobs and the Ohio Economy
Part 4
Education and Training Programs
June 2011
Prepared by the
Voinovich School of Leadership and Public Affairs Ohio University
for the
Bureau of Labor Market Information Office of Workforce Development
Ohio Department of Job and Family Services
in cooperation with the
U.S. Department of Labor Employment and Training Administration
This workforce solution was funded by a grant awarded by the U.S. Department of Labor’s Employment and Training Administration. The solution was created by the grantee and does not necessarily reflect the official position of the U.S. Department of Labor. The Department of Labor makes no guarantees, warranties, or assurances of any kind, express or implied, with respect to such information, including any information on linked sites and including, but not limited to, accuracy of the information or its completeness, timeliness, usefulness, adequacy, continued availability, or ownership. This solution is copyrighted by the institution that created it. Internal use by an organization and/or personal use by an individual for non-commercial purposes is permissible. All other uses require the prior authorization of the copyright owner.

i
Acknowledgments This report would not have been possible without the generous assistance provided by many individuals and organizations. The Voinovich School of Leadership and Public Affairs would like to acknowledge the guidance and support provided by the project sponsors and partners:
Sponsors:
• Ohio Board of Regents (OBR) • Ohio Department of Job and Family Services (ODJFS)
Partners:
• Ohio Environmental Council (OEC) • Center for Urban and Public Affairs (CUPA) at Wright State University
In addition, the Ohio Green Pathways Advisory Panel (OGPAP) played an instrumental role in several aspects of the project, and dozens of institutions within the University System of Ohio (USO) provided program information directly for this report or indirectly through previous work conducted by project sponsors and partners.
Special thanks are owed to the following individuals who generously shared their knowledge and insights with project researchers: Dale Arnold, Ohio Farm Bureau; Jay Bahr, Ohio Department of Development; Teny L. Bannick, Architect; Dan Barringer, DBArchitects; Jeffrey Bates, Columbus State Community College; Sherry Becker, The Career Center – Adult Technical Training; Lori Bedson, Richland County Job and Family Services; Mary Benedict, BioOhio; Ann Benfield, Apollo Career Center; Jack A. Bialosky, Jr., Bialosky & Partners Architects; Dean Bortz, Columbus State Community College; Erin Bowser, Horizon Wind Energy; Bruce Braine, American Electric Power; Dan Burklo, Northwest State Community College; Nicole Campbell, Burgess & Niple, Inc.; Travis Chapin, Bowling Green State University; Larry Cherveny, Cincinnati State Technical College; Ronald Choia, AirTAB International; Dave Compaan, AltE Store; Tonya Conrath, Tri-County Adult Career Center; John Cotton, Ohio University; Daniel P. Coyne, Youngstown State University; Crown Equipment Corporation; Joseph Deak, Lakeland Community College; John DeCola, Kent State University; William Deffenbaugh, Penta Career Center; Courtney Deoreo, Lorain County Community College; Kathy Derheimer, Ohio Department of Development; Daniel Durfee, Zane State College; Wayne Earley, PolymerOhio; Scott Easton, Westoff, LLC; Duncan Estep, Loraine County Community College; Michael Evans, Ohio Department of Development; Susan Everett, Clark State Community College; Larry Feist, Cincinnati State Technical Community College; Byron Finch, Miami University; David Fish, Ashtabula County Job and Family Services; Pamela Frugoli, Employment Training Administration; Frank Fuller, Stark State College; Aaron Gaynor, The EcoPlumbers; Lee Geise, Blue-Green Alliance; David Grabski, Cuyahoga Community College; Katie Grayem, American Electric Power; Michelle Greenfield, Third Sun Solar; Maarten Uijt De Haag, Ohio University; Jane Harf, University Clean Energy Alliance of Ohio; Janet Hartley, Bowling Green State University; Marilyn

ii
Hortsman, Allen County Job and Family Services; William Hotz, Terra Community College; Jerry Hutton, Hocking College; Jalal Jalali, Youngstown State University; Daniel W. Jones, Turner Construction Co.; Karen Joslin, Joslin Construction Consulting; John Kennedy, ATA Beilharz Architects; Dong-Shik Kim, University of Toledo; John Kelly Kissock, University of Dayton; Natalie Kruse, Ohio University; Nancy Kukay, North Central State College; Steve Lipster, International Brotherhood of Electrical Workers; Jason Long, Black Diamond Construction Co.; Thomas Looker, Edison State Community College; Thomas H. Lovdal, T.H. Lovdal & Co. LTD; Richard Lubinski, Think Energy Management, LLC; Christi Lynch, Ohio Department of Development; Andrew Maciejewski, Ohio Department of Job and Family Services; Sonia Marcus, Ohio University; Rich Markham, PolymerOhio; Jay McCreary, Marion Technical College; Kim McKinley, Tri-County Adult Career Center; Jon Meola, CT Consultants; David Mertz, Belmont Technical College; Larry Miller, Shawnee State University; Ray Miller, University of Cincinnati; Dominique Mosley, UPS Logistics Technologies; Frank Neely, Workforce Investment Board of Southwest Missouri; Paul Orban, BDHP Architecture; David Panich, Panich & Noel Architects; Joy Pothoff, Bowling Green State University; Steve Potter, The Ohio State University; Ann Randazzo, Center for Energy Workforce Development; Jon Ratner, Forest City Enterprises, Inc.; Eric Robey, Rhodes State College; Jim Rosen, Apollo Career Center; Keith Saunders, Rio Grande University; Mark Schaff, Occupational Supply-Demand System; David Schmidt, Wright State University; Ruth Seiple, University of Cincinnati; Tom Selis, Rhodes State College; Susan Shearer, Stark State College; Randy Shoup, H & S Plumbing; Dave Siravo, Owens Community College; Robert Slabodnick, North Central State College; Kevin Snape, Cuyahoga Community College; Jonathan Sowash, TechGROWTH Ohio; Bill Spratley, Green Energy Ohio; Mahesh Srinivasan, University of Akron; Ann Stankovic, Cleveland State University; David Strickland, Scioto County Career Technical Center; David Sturbois, Sturbois Enterprises; Bill Tacon, BioOhio; Reed Tarkington, Four Seasons Environmental, Inc.; Tina Trombley, Washington State Community College; Oya Tukel, Cleveland State University; Dennis Ulrich, Cincinnati State Technical and Community College; Janice Urbanik, Cincinnati State Technical and Community College; John Villers, Upper Valley Joint Vocational School; Kathleen Williams, Workforce One – Job and Family Services of Butler County; Jeff Wilson, HGTV; S.T. Yang, The Ohio State University Ohio Bioprocessing Research Consortium; and Frank Zangara, Ohio Department of Development. The project team included the following individuals from the Voinovich School of Leadership and Public Affairs at Ohio University:
Mathew Austin Rachel Barnette Sara Lichtin Boyd Rachael Brainard Holly Craycraft Kyle Gumto
Emily Hawley Zachary Holl Amanda Janice Kate Leeman Josh Lundfelt Scott Miller Barry Oches Vlad Pascal Cindy Poole Steven Porter Mayla Puckett Dina Rouff
Kelli Coughlin Schoen David Simon Matt Trainer Lezlee Ware Nicole Yandell

iii
.
Table of Contents Acknowledgments .......................................................................................................................... i
Table of Contents ......................................................................................................................... iii
Index of Tables and Figures ......................................................................................................... v
Executive Summary ...................................................................................................................... 1
Defining Green Jobs .................................................................................................................. 1
Best Practices in Green-Related Education and Training ......................................................... 2
Green Pathways Database ....................................................................................................... 5
Introduction ................................................................................................................................... 6
Project Background and Overview ............................................................................................ 6
Green Jobs, Innovation and the University System of Ohio ...................................................... 6
Defining Green Jobs .................................................................................................................. 7
Green Career Pathways .......................................................................................................... 12
Best Practices in Green Jobs Education and Training ................................................................ 14
Introduction and Overview ....................................................................................................... 14
Best Practice One: The program is based on an assessment of regional workforce demands. ................................................................................................................................................ 19
Best Practice Two: The program’s curriculum is informed by industry input. .......................... 24
Best Practice Three: The program has clearly defined strategies for measuring success, such as ongoing assessments of curricula and learning outcomes. ................................................ 28
Best Practice Four: The program includes hands-on training with equipment of the type likely to be used in the workplace. .................................................................................................... 33
Best Practice Five: The program provides workplace experience for students through internship or apprenticeship opportunities. .............................................................................. 37
Best Practice Six: The program is designed and implemented in partnership with the many agents involved with green jobs promotion and preparation, including labor unions, community organizations, state and local government agencies, other educators and/or employers. ............................................................................................................................... 41
iv
Best Practice Seven: The program is purposefully situated within a larger green career pathway. This may entail transfer articulation agreements with other schools, outreach to secondary schools, etc. ........................................................................................................... 48
Green Pathways Database ......................................................................................................... 55
Introduction .............................................................................................................................. 55
Data Sources ........................................................................................................................... 56
References .................................................................................................................................. 60
Appendix A: Acronyms Used in This Report ............................................................................... 64
Appendix B: O*Net Green Occupations .................................................................................... 65
Appendix C: Organizations Identified by Survey Respondents .................................................. 72
Appendix D: Educator Survey Methodology ............................................................................... 74
Appendix E: Educator Survey Instrument ................................................................................... 77
Appendix F: Green Jobs Training and Education Survey Frequency Tables ............................. 88
Appendix G: Green Pathways Database Methodology ............................................................... 98
Introduction and Overview ....................................................................................................... 98
Key Resources Utilized ........................................................................................................... 98
Methodological Challenges ..................................................................................................... 99
Appendix H: Overview of Green-Related Programs in the University System of Ohio Based on IPEDS Data ............................................................................................................................... 108
Appendix I: Maps of University System of Ohio Institutions with Green-Related Programs ..... 115

v
Index of Tables and Figures Table 1. Green Jobs Definitions Related to O*Net Green Occupation Categories ....................... 9
Table 2. Targeted Sectors of Ohio’s Green Economy ................................................................ 10
Table 3. O*Net Green Economy Sectors .................................................................................... 11
Table 4. Which of the following statements apply to the creation of your program? ................... 21
Table 5. Does your program use any of the following methods to evaluate its effectiveness? ... 30
Table 6. About what percentage of the required coursework is spent on hands-on training? .... 34
Table 7. Does your program have a partnership with any of the following types of organizations? .................................................................................................................................................... 44
Table 8. Services Provided by Program Partners ....................................................................... 45
Table 9. Which of the following statements apply to your program? .......................................... 53
Figure 1. Key Information in Database ....................................................................................... 56
Table 10. Green-Related Programs at an Ohio Technical College ........................................... 101
Table 11. Potential CIP codes for a Mechanical Engineering Technology Program ................ 103
Table 12. SOC Codes Related to CIP 48.0501: Machining Tool Technology .......................... 105
Table 13. Programs by Type of Institution in the Green Pathways Database and IPEDS ........ 109
Table 14. Public and Private Green-Related Programs ............................................................ 109
Table 15. Public Green-Related Programs in the USO by Type of Institution .......................... 110
Table 16. Green-Related Programs in the USO by Type of Degree or Certificate ................... 111
Table 17. Green-Related Postsecondary Awards, Certificates and Diplomas in the USO by Subcategory .............................................................................................................................. 112
Table 18. Green-Related Programs in the USO by Green Sector ............................................ 114

1
Executive Summary This part of Green Jobs and the Ohio Economy presents the results of research relating to:
• Definitions of green jobs and their significance to Ohio’s education and workforce development community;
• Best practices in green-related education and training programs nationally and within the University System of Ohio (USO); and
• Development of a “Green Pathways Database” including green-related education and training programs within the USO linked to occupations and sectors of the green economy.
Green-related education and training programs within the USO are important to Ohio because they contribute to Ohio’s economy by supporting the growth of green jobs, but their value extends beyond these areas. Green-related training and education supports innovation and therefore warrants attention as an important contributor to wealth creation in Ohio and global competitiveness. The USO’s green-related Centers of Excellence demonstrate the strong ties between industry partnerships, research, education and the attraction and retention of critical workforce talent to Ohio.
Defining Green Jobs Three key types of green jobs definitions are relevant to Ohio’s educators and workforce development professionals: output-based, skills-based and sector-based. Output-based definitions include all jobs required to produce a green product or service, regardless of whether green-related skills or knowledge are required for each job. Skills-based definitions focus on jobs that require green-related skills or knowledge, regardless of whether or not the product or service produced is green. For example, skills-based green jobs may exist in industries that do not produce green output but still require green-related skills or knowledge among some workers in order to operate in a more environmentally sustainable manner. Sector-based definitions seek to categorize green jobs by industry and are typically utilized to narrow the application of output-based or skills-based definitions to particular sectors such as renewable energy or manufacturing.
All three types of green jobs definitions are reflected in the research described in this report. The broadest aspect of this research – the development of a green-related program database – utilizes a definitional framework established by the Occupational Information Network (O*Net). The O*Net framework captures both output-based and skills-based definitions within three categories of green occupations: increased demand, enhanced skills and new and emerging. The survey of Ohio educators conducted as part of the research into best practices in green jobs training and education was similarly broad in its dissemination to over 800 programs relating to all three of O*Net’s green occupation categories.
In terms of sectors, the research described in this report utilizes two complementary approaches. The research regarding best practices focuses on the following seven sectors that are particularly important for Ohio:

2
• Renewable Energy • Energy Efficiency • Manufacturing • Advanced Energy • Bioscience • Green Building • Agriculture/Biomass
The Green Pathways Database utilizes these seven sectors as well as a more inclusive set of twelve sectors defined by O*Net. Programs in the database are linked to occupations (with some exceptions), which are in turn linked to sectors within each of these frameworks.
Best Practices in Green-Related Education and Training For this report, best practices in green-related education and training are activities that have been identified as the most effective strategies for providing students with the skills and knowledge that are in demand by employers in the green economy.
In order to identify and prioritize best practices in green-related education and training, Voinovich School researchers drew upon interviews with Ohio educators and employers, conducted a literature review and consulted with project sponsors and the Ohio Green Pathways Advisory Panel (OGPAP). Seven best practices were prioritized as a result of this process. Researchers then used case study research and a survey of educators to gather information about how these best practices are implemented nationally and in Ohio. A survey was deployed to contacts for 806 programs selected from the Green Pathways Database and 269 responses were utilized in the analysis. Over 30 case studies of nationally exemplary programs and Ohio programs were developed in order to illustrate implementation of the seven best practices.
The following are the seven prioritized best practices as well as select information gathered about each best practice from case studies and the educator survey.
1. The training program and its curriculum are based on an assessment of regional workforce demands.
This best practice consists of accessing labor demand projections, consulting with local employers, or otherwise establishing that a green jobs training or education program is preparing students for occupations that are in demand locally.
When asked about the reasons behind the creation of their programs, the vast majority of the surveyed educators (80.6 percent) reported that employer requests and/or a perceived need in the labor market played a role in prompting their programs’ development. Employer requests seemed to be a significant prompt for the creation of certificate and associate’s programs in particular.
2. The program’s curriculum is informed by industry input.

3
This best practice requires maintaining close contact with industry to ensure that program curricula reflect the latest industry standards.
A total of 63.7 percent of surveyed educators stated that industry standards and/or certification criteria were used in the development of program curricula. Programs that produce certificates and associate’s degrees appear particularly likely to use industry standards during program creation.
While most programs reported using industry standards and/or certification criteria for curricula development, a much smaller percentage of programs (14.2 percent) indicated that students actually sit for a certifying exam as part of the program or upon completion of the program.
Survey respondents reported that they consult the standards of all of the key certifying organizations identified in the national best practice research conducted for this report. Appendix C lists those programs and all other organizations whose credentialing requirements and/or industry standards survey respondents reported consulting (either by consulting the standards during curriculum development or by preparing students to sit for the associated certifying exams).
3. The program has clearly defined strategies for measuring success, such as ongoing assessments of curricula and learning outcomes.
This best practice stresses the need for setting clearly defined goals and regularly monitoring a program’s progress toward those goals.
When surveyed, 84.5 percent of responding educators indicated that they solicited student feedback as a form of program evaluation. In addition, 68.7 percent reported that their curricula are reviewed on a regular basis, and 53.2 percent indicated that they track student employment status after graduation.
4. The program includes hands-on training with equipment of the type likely to be used in the workplace.
This best practice requires that green jobs education and training programs supplement lecture and online instruction with hands-on components that allow students the opportunity to interact with up-to-date equipment.
A total of 78.7 percent of surveyed Ohio educators reported that hands-on training is one of the instructional methods used in their program. Associate’s programs and certificate programs most frequently selected this option (93.8 percent and 84.0 percent, respectively).
5. The program provides workplace experience for students through internship or apprenticeship opportunities.
This best practice stresses the value of providing students the opportunity to gain real-world work experience prior to graduation.
When surveyed, 64.9 percent of the responding educators reported that they offer either a required or optional internship component to their students. Internships appear more common in programs that produce bachelor’s (84.4 percent) and associate’s degrees (77.2 percent) and
4
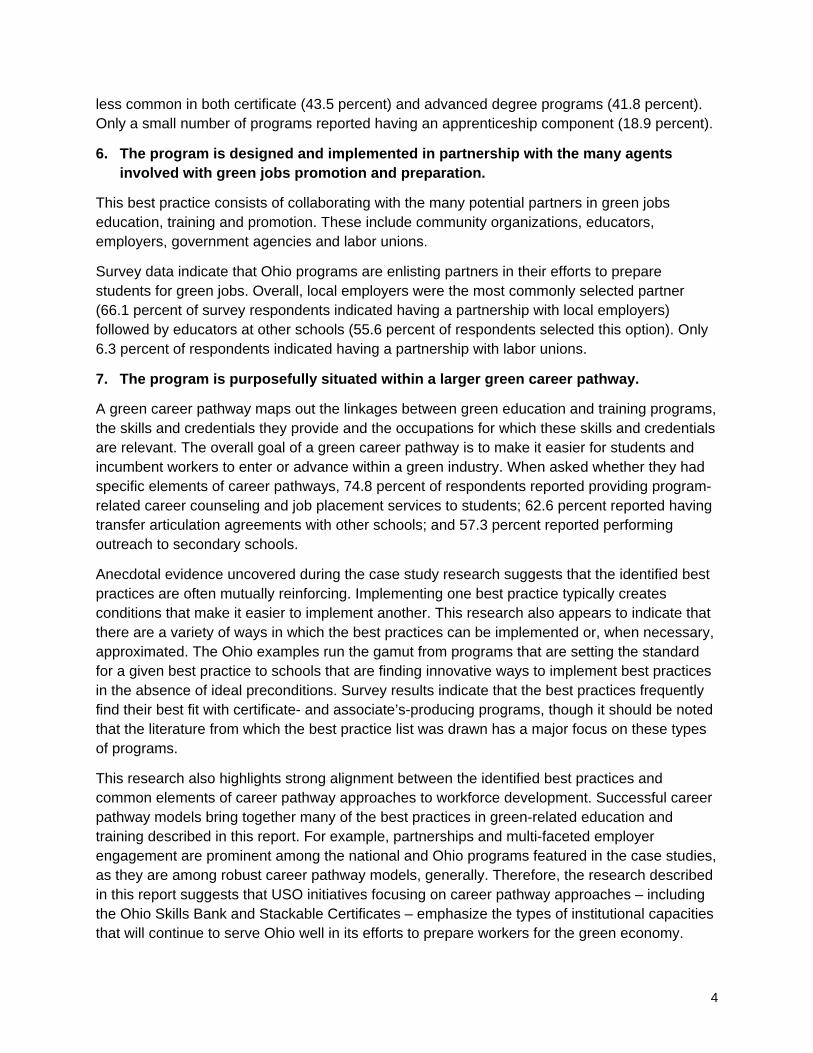
less common in both certificate (43.5 percent) and advanced degree programs (41.8 percent). Only a small number of programs reported having an apprenticeship component (18.9 percent).
6. The program is designed and implemented in partnership with the many agents involved with green jobs promotion and preparation.
This best practice consists of collaborating with the many potential partners in green jobs education, training and promotion. These include community organizations, educators, employers, government agencies and labor unions.
Survey data indicate that Ohio programs are enlisting partners in their efforts to prepare students for green jobs. Overall, local employers were the most commonly selected partner (66.1 percent of survey respondents indicated having a partnership with local employers) followed by educators at other schools (55.6 percent of respondents selected this option). Only 6.3 percent of respondents indicated having a partnership with labor unions.
7. The program is purposefully situated within a larger green career pathway.
A green career pathway maps out the linkages between green education and training programs, the skills and credentials they provide and the occupations for which these skills and credentials are relevant. The overall goal of a green career pathway is to make it easier for students and incumbent workers to enter or advance within a green industry. When asked whether they had specific elements of career pathways, 74.8 percent of respondents reported providing program-related career counseling and job placement services to students; 62.6 percent reported having transfer articulation agreements with other schools; and 57.3 percent reported performing outreach to secondary schools.
Anecdotal evidence uncovered during the case study research suggests that the identified best practices are often mutually reinforcing. Implementing one best practice typically creates conditions that make it easier to implement another. This research also appears to indicate that there are a variety of ways in which the best practices can be implemented or, when necessary, approximated. The Ohio examples run the gamut from programs that are setting the standard for a given best practice to schools that are finding innovative ways to implement best practices in the absence of ideal preconditions. Survey results indicate that the best practices frequently find their best fit with certificate- and associate’s-producing programs, though it should be noted that the literature from which the best practice list was drawn has a major focus on these types of programs.
This research also highlights strong alignment between the identified best practices and common elements of career pathway approaches to workforce development. Successful career pathway models bring together many of the best practices in green-related education and training described in this report. For example, partnerships and multi-faceted employer engagement are prominent among the national and Ohio programs featured in the case studies, as they are among robust career pathway models, generally. Therefore, the research described in this report suggests that USO initiatives focusing on career pathway approaches – including the Ohio Skills Bank and Stackable Certificates – emphasize the types of institutional capacities that will continue to serve Ohio well in its efforts to prepare workers for the green economy.

5
Reflecting overlaps between the green economy and the broader economy, examples of green-related career pathways suggest that such pathways can often be embedded within or tied to pathway approaches focusing upon traditional industries.
Green Pathways Database The researchers worked with project partners and sponsors to develop a “Green Pathways Database” – an inventory of over 1,300 green-related programs within the University System of Ohio linked to pertinent occupations and sectors within Ohio’s green economy. The database will enable the Ohio Department of Job and Family Services (ODJFS) and the Ohio Board of Regents (OBR) to make program information available online in a searchable format for use by job-seekers, education-seekers, educators and employers. The data will be made available at two complementary websites: http://ohiolmi.com/research/research.htm (to be established by ODJFS) and http://www.ohiogreenpathways.org (to be established by OBR).
The Green Pathways Database is comprised primarily of green-related programs previously identified in two-year and four-year program catalogs developed by OBR in partnership with the Ohio Environmental Council (OEC) and the Ohio Green Pathways Advisory Panel in 2009-2010. In addition, the research team contacted 96 USO institutions (two-year schools, four-year schools and adult career centers) to identify additional programs not included in these program catalogs. Individual program information was then linked to O*Net-identified green occupations and sectors to the extent possible. This process revealed that some of the programs identified by USO schools do not appear to be linked to green-related occupations, while some programs that appear to be linked to green-related occupations were not identified by their schools. This reflects the many ambiguities involved in defining green jobs.
Points to consider regarding the database and its value include the following:
• The database is a snapshot in time. Within the USO, green education and training programs are constantly being added and other programs enhanced with green-related content.
• There is substantial variation in how individual institutions define green-related programming, and this is reflected in the database.
• The database indicates which programs appear to be linked to green-related occupations and which do not.
• The database could serve as a starting point for the development of regional inventories of green-related training and education programs, a key component of career pathways.

6
Introduction Project Background and Overview Ohio University’s Voinovich School of Leadership and Public Affairs was engaged in 2010 by the Ohio Board of Regents and the Ohio Department of Job and Family Services to conduct research focusing on green-related education and training programs within the University System of Ohio. The two key purposes of this research are as follows:
• Identify best practices in green-related education and training programs nationally and examine the extent to which these best practices are being implemented among the USO’s green-related programs.
• Develop a Green Pathways Database including the USO’s green-related education and training programs linked to occupations and sectors within the green economy.
The anticipated outcomes of this research include:
• The dissemination of information across Ohio’s educational and workforce development community regarding best practices in green-related education and training programs as well as national and Ohio models exemplifying these best practices.
• The establishment of an online, searchable database of green-related education and training programs within the University System of Ohio, organized by sectors and occupations within the green economy.
Green Jobs, Innovation and the University System of Ohio The USO’s green-related education and training programs are important to consider because they have the potential to enhance Ohio’s economy by supporting the growth of green jobs. More broadly, green-related training and education supports innovation and therefore warrants attention as an important contributor to wealth creation in Ohio and global competitiveness.1 Further, from a workforce development perspective, a relationship exists between green-related education and science, technology, engineering and mathematics (STEM) education since over 40 percent of STEM-related occupations can also be classified as green.2
In addition to education and training roles, many USO institutions drive green-related innovation through research and development efforts. The USO’s Centers of Excellence provide and attract public and private investment to industries that drive innovation and economic development in the state’s economy.3 The state’s 42 Centers of Excellence include 24 in the following green-related categories: advanced energy; agriculture, food production and bioproducts; enabling technologies; and advanced transportation and aerospace. The goals and metrics identified by each of these centers illustrate the strong, symbiotic linkages between economic innovation and the development and retention of workforce talent in Ohio. A map of Ohio’s green-related Centers of Excellence is provided in Appendix I of this report.
1 Nidumolu, Prahalad, and Rangaswami, “Key Driver of Innovation,” 60. 2 For a good review of these issues, see Kuenzi, “Science, Technology, Engineering.” 3 “Ohio Centers of Excellence: About this Site,” Ohio.gov: University System of Ohio, accessed May 23, 2011, http://ohiocentersofexcellence.ning.com/.
7
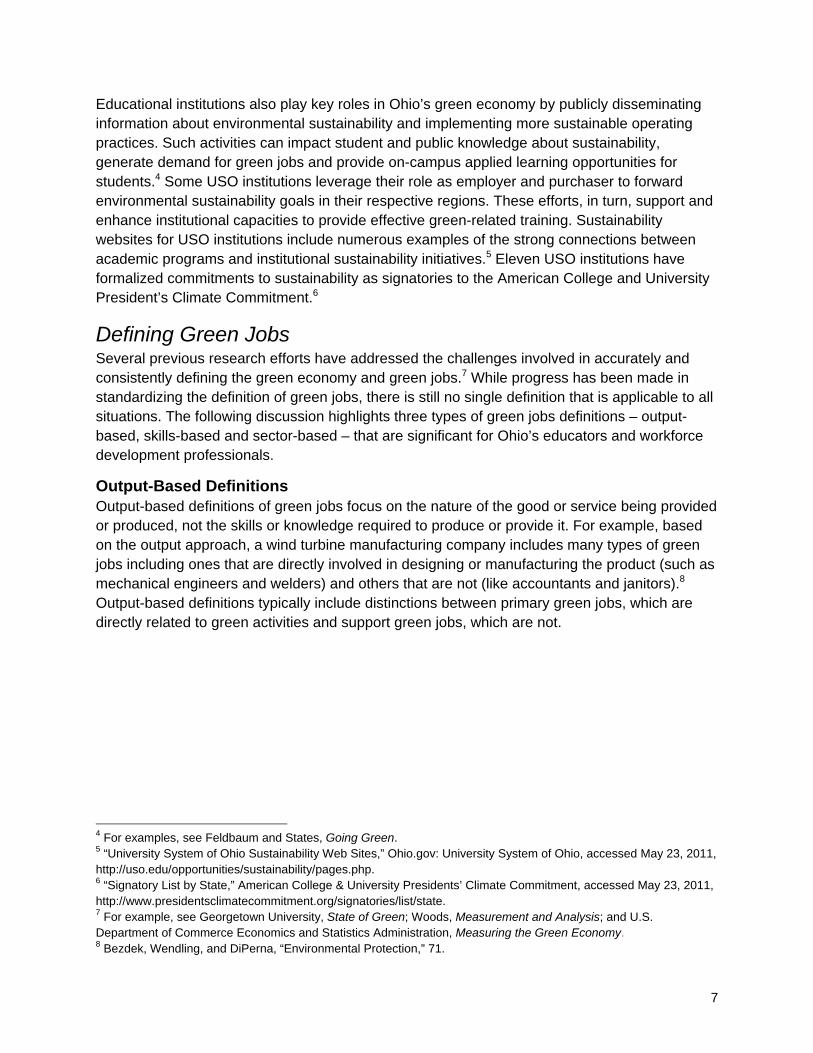
Educational institutions also play key roles in Ohio’s green economy by publicly disseminating information about environmental sustainability and implementing more sustainable operating practices. Such activities can impact student and public knowledge about sustainability, generate demand for green jobs and provide on-campus applied learning opportunities for students.4 Some USO institutions leverage their role as employer and purchaser to forward environmental sustainability goals in their respective regions. These efforts, in turn, support and enhance institutional capacities to provide effective green-related training. Sustainability websites for USO institutions include numerous examples of the strong connections between academic programs and institutional sustainability initiatives.5 Eleven USO institutions have formalized commitments to sustainability as signatories to the American College and University President’s Climate Commitment.6
Defining Green Jobs Several previous research efforts have addressed the challenges involved in accurately and consistently defining the green economy and green jobs.7 While progress has been made in standardizing the definition of green jobs, there is still no single definition that is applicable to all situations. The following discussion highlights three types of green jobs definitions – output-based, skills-based and sector-based – that are significant for Ohio’s educators and workforce development professionals.
Output-Based Definitions Output-based definitions of green jobs focus on the nature of the good or service being provided or produced, not the skills or knowledge required to produce or provide it. For example, based on the output approach, a wind turbine manufacturing company includes many types of green jobs including ones that are directly involved in designing or manufacturing the product (such as mechanical engineers and welders) and others that are not (like accountants and janitors).8 Output-based definitions typically include distinctions between primary green jobs, which are directly related to green activities and support green jobs, which are not.
4 For examples, see Feldbaum and States, Going Green. 5 “University System of Ohio Sustainability Web Sites,” Ohio.gov: University System of Ohio, accessed May 23, 2011, http://uso.edu/opportunities/sustainability/pages.php. 6 “Signatory List by State,” American College & University Presidents’ Climate Commitment, accessed May 23, 2011, http://www.presidentsclimatecommitment.org/signatories/list/state. 7 For example, see Georgetown University, State of Green; Woods, Measurement and Analysis; and U.S. Department of Commerce Economics and Statistics Administration, Measuring the Green Economy. 8 Bezdek, Wendling, and DiPerna, “Environmental Protection,” 71.
8
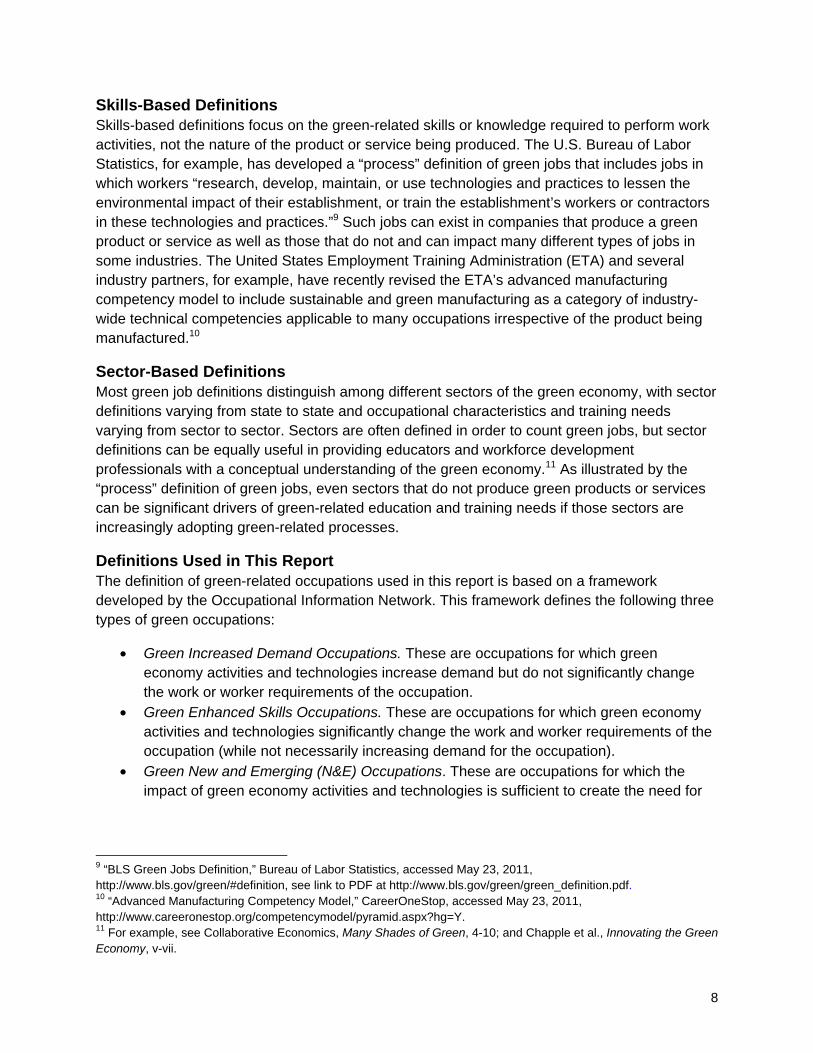
Skills-Based Definitions Skills-based definitions focus on the green-related skills or knowledge required to perform work activities, not the nature of the product or service being produced. The U.S. Bureau of Labor Statistics, for example, has developed a “process” definition of green jobs that includes jobs in which workers “research, develop, maintain, or use technologies and practices to lessen the environmental impact of their establishment, or train the establishment’s workers or contractors in these technologies and practices.”9 Such jobs can exist in companies that produce a green product or service as well as those that do not and can impact many different types of jobs in some industries. The United States Employment Training Administration (ETA) and several industry partners, for example, have recently revised the ETA’s advanced manufacturing competency model to include sustainable and green manufacturing as a category of industry-wide technical competencies applicable to many occupations irrespective of the product being manufactured.10
Sector-Based Definitions Most green job definitions distinguish among different sectors of the green economy, with sector definitions varying from state to state and occupational characteristics and training needs varying from sector to sector. Sectors are often defined in order to count green jobs, but sector definitions can be equally useful in providing educators and workforce development professionals with a conceptual understanding of the green economy.11 As illustrated by the “process” definition of green jobs, even sectors that do not produce green products or services can be significant drivers of green-related education and training needs if those sectors are increasingly adopting green-related processes.
Definitions Used in This Report The definition of green-related occupations used in this report is based on a framework developed by the Occupational Information Network. This framework defines the following three types of green occupations:
• Green Increased Demand Occupations. These are occupations for which green economy activities and technologies increase demand but do not significantly change the work or worker requirements of the occupation.
• Green Enhanced Skills Occupations. These are occupations for which green economy activities and technologies significantly change the work and worker requirements of the occupation (while not necessarily increasing demand for the occupation).
• Green New and Emerging (N&E) Occupations. These are occupations for which the impact of green economy activities and technologies is sufficient to create the need for
9 “BLS Green Jobs Definition,” Bureau of Labor Statistics, accessed May 23, 2011, http://www.bls.gov/green/#definition, see link to PDF at http://www.bls.gov/green/green_definition.pdf. 10 “Advanced Manufacturing Competency Model,” CareerOneStop, accessed May 23, 2011, http://www.careeronestop.org/competencymodel/pyramid.aspx?hg=Y. 11 For example, see Collaborative Economics, Many Shades of Green, 4-10; and Chapple et al., Innovating the Green Economy, v-vii.

9
unique work or worker requirements, in turn suggesting the need for the development of an occupational definition that did not previously exist.12
Table 1 illustrates how these three categories of green occupations relate to the definitions discussed above. The table presents relationships that are generally applicable, although there may be exceptions. Output-based criteria apply to all three types of occupations because all three types are required in order to produce green-related output (products or services). Skills-related criteria apply primarily to the enhanced skills and new and emerging categories. Primary green jobs tend to be in the enhanced skills and new and emerging categories, while support jobs tend to be in the increased demand category.
Table 1. Green Jobs Definitions Related to O*Net Green Occupation Categories
Increased Demand
Enhanced Skills
New and Emerging
Output-Based x x xSkills-Based x x
Primary Green Jobs x xSupport Green Jobs x
7 Targeted Ohio Sectors x x x12 O*Net Sectors x x x
O*Net Green Occupation CategoriesGreen Jobs Definitions
Output-based definitions are meaningful to educators and workforce development professionals, because they highlight the demand for a wide range of occupations within the green economy. Although they may not require green-related knowledge, skills or curricula, the demand for these occupations is nonetheless important to meet. Skills-related definitions are also important because they point educators and workforce development professionals to the types of occupations that are most likely to require green-related curricular content.
In addition to the O*Net occupational categories, this report utilizes two complementary definitions of green economy sectors. The best practice research focuses primarily on sectors of particular significance to Ohio (see Table 2). These sectors correspond closely with those targeted for the employer survey conducted by Wright State University and described in Part 3 of Green Jobs and the Ohio Economy. Programs in the Green Pathways Database are linked to occupations in each of these seven sectors as well as occupations in a more inclusive set of twelve sectors defined by O*Net and shown in Table 3.
12 Dierdorff et al., Greening of the World, 4.
10
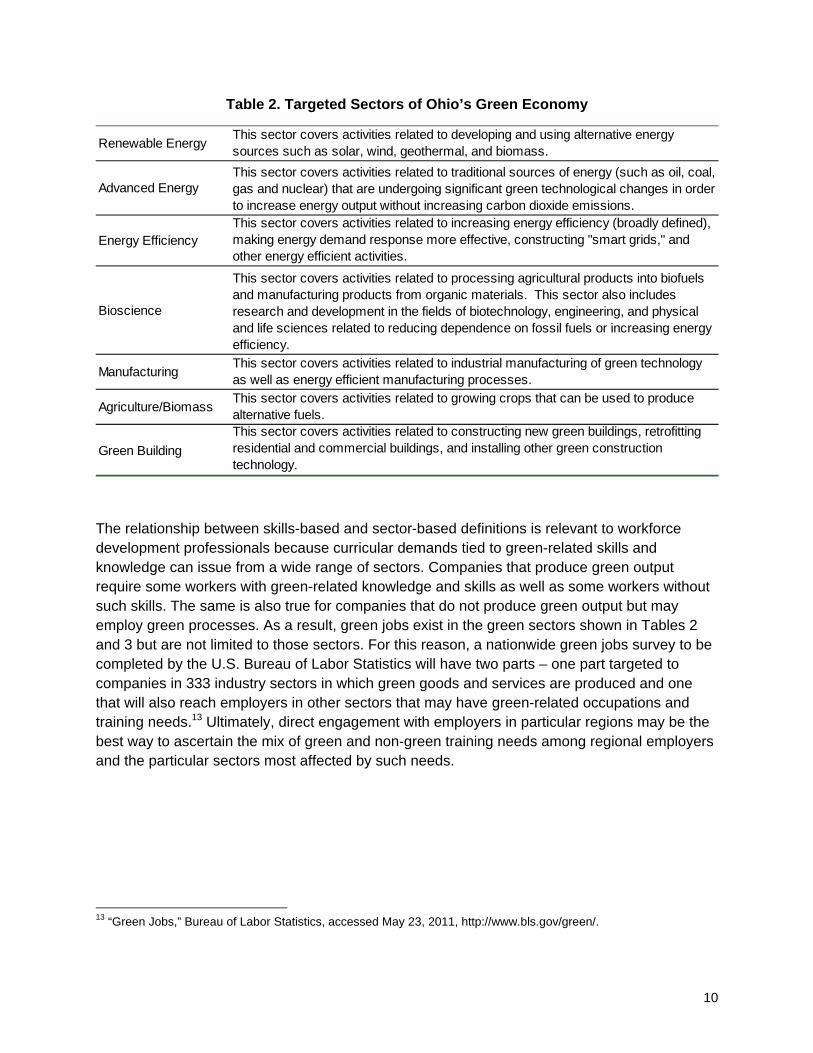
Table 2. Targeted Sectors of Ohio’s Green Economy
Renewable Energy This sector covers activities related to developing and using alternative energy sources such as solar, wind, geothermal, and biomass.
Advanced EnergyThis sector covers activities related to traditional sources of energy (such as oil, coal, gas and nuclear) that are undergoing significant green technological changes in order to increase energy output without increasing carbon dioxide emissions.
Energy EfficiencyThis sector covers activities related to increasing energy efficiency (broadly defined), making energy demand response more effective, constructing "smart grids," and other energy efficient activities.
Bioscience
This sector covers activities related to processing agricultural products into biofuels and manufacturing products from organic materials. This sector also includes research and development in the fields of biotechnology, engineering, and physical and life sciences related to reducing dependence on fossil fuels or increasing energy efficiency.
ManufacturingThis sector covers activities related to industrial manufacturing of green technology as well as energy efficient manufacturing processes.
Agriculture/BiomassThis sector covers activities related to growing crops that can be used to produce alternative fuels.
Green BuildingThis sector covers activities related to constructing new green buildings, retrofitting residential and commercial buildings, and installing other green construction technology.
The relationship between skills-based and sector-based definitions is relevant to workforce development professionals because curricular demands tied to green-related skills and knowledge can issue from a wide range of sectors. Companies that produce green output require some workers with green-related knowledge and skills as well as some workers without such skills. The same is also true for companies that do not produce green output but may employ green processes. As a result, green jobs exist in the green sectors shown in Tables 2 and 3 but are not limited to those sectors. For this reason, a nationwide green jobs survey to be completed by the U.S. Bureau of Labor Statistics will have two parts – one part targeted to companies in 333 industry sectors in which green goods and services are produced and one that will also reach employers in other sectors that may have green-related occupations and training needs.13 Ultimately, direct engagement with employers in particular regions may be the best way to ascertain the mix of green and non-green training needs among regional employers and the particular sectors most affected by such needs.
13 “Green Jobs,” Bureau of Labor Statistics, accessed May 23, 2011, http://www.bls.gov/green/.

11
Table 3. O*Net Green Economy Sectors
Agriculture and Forestry This sector covers activities related to using natural pesticides, efficient land management or farming, and aquaculture.
Energy and Carbon Capture and StorageThis sector covers activities related to capturing and storing energy and/or carbon emissions, as well as technologies related to power plants using the integrated gasification combined cycle (IGCC) technique.
Energy EfficiencyThis sector covers activities related to increasing energy efficiency (broadly defined), making energy demand response more effective, constructing "smart grids," and other energy efficient activities.
Energy Trading This sector covers financial services related to buying and selling energy as an economic commodity, as well as carbon trading projects.
Environment Protection This sector covers activities related to environmental remediation, climate change adaptation, and ensuring or enhancing air quality.
Governmental and Regulatory AdministrationThis sector covers activities by public and private organizations associated with conservation and pollution prevention, regulation enforcement, and policy analysis and advocacy.
Green ConstructionThis sector covers activities related to constructing new green buildings, retrofitting residential and commercial buildings, and installing other green construction technology.
Manufacturing This sector covers activities related to industrial manufacturing of green technology as well as energy efficient manufacturing processes.
Recycling and Waste ReductionThis sector covers activities related to solid waste and wastewater management, treatment, and reduction, as well as processing recyclable materials.
Renewable Energy Generation
This sector covers activities related to developing and using energy sources such as solar, wind, geothermal, and biomass. This sector also includes traditional, non-renewable sources of energy undergoing significant green technological changes (e.g., oil, coal, gas, and nuclear).
Research, Design, and Consulting ServicesThis sector encompasses "indirect jobs" to the green economy which includes activities such as energy consulting or research and other related business services.
TransportationThis sector covers activities related to increasing efficiency and/or reducing environmental impact of various modes of transportation including trucking, mass transit, and freight rail.
Sources: O'Net, Greening of the World of Work
Shades of Green Where to draw the line between green and non-green occupations is often difficult because of the mix of output-based, skills-based and sector-based variables previously discussed. Ohio’s workforce development professionals face the equally challenging task of understanding “shades of green,” or the mix of green and non-green skills that are pertinent to green-related occupations and program curricula. For example, research indicates that the mechanical engineer occupation entails the ability to perform 27 different tasks, including 21 defined as non-green and 6 defined as green.14 Similar task analysis conducted for 133 other green occupations shows that the proportion of green-related tasks varies substantially among occupations regarded as green.15 As the previous discussion of sectors makes clear, workforce development professionals also confront “shades of green” challenges at company and sector
14 “O*NET® Research & Technical Reports,” O*NET Resource Center, accessed May 23, 2011, http://www.onetcenter.org/reports/GreenTask.html. 15 Ibid.

12
levels, because green-related training needs apply only partially and at different levels of intensity in any given company or sector.
Green Career Pathways Through initiatives, including the Ohio Skills Bank and Stackable Certificates, the University System of Ohio has emphasized the importance of demand-driven, regionally based and institutionally collaborative workforce development approaches that focus on career progressions in targeted industries.16 These efforts have placed Ohio among a handful of states regarded as national leaders in the development of statewide career pathway systems.17
Successful career pathway models bring together many of the best practices in green-related education and training described in this report. First, employer engagement and other types of partnerships are central to effective career pathway approaches as well as many of the best practices discussed in this report. In fact, there are few aspects of best practices in green-related education and training that do not involve partnerships, particularly those forged with relevant employers. Collaborations among USO institutions and their partners are reflected in articulation agreements, equipment-sharing, curriculum-sharing, data-sharing, joint research and other activities that enable each institution’s respective resources to have greater impact.
Second, many green-related career pathway models reflect the extensive overlap among green and non-green career progressions in some industries. These overlaps also reflect the reality that green-related workforce needs are not confined to green-specific industries. For example, sectors such as construction and manufacturing increasingly require green-related knowledge and skills.
As a result of these overlaps, regional green-related career pathway approaches can often be embedded within or tied to existing pathway systems developed to address the needs of more traditional, non-green industries. In a given region, for example, the construction industry may have the scale to justify the development of a related regional career pathway system, while the current size of the green construction industry may not alone provide that justification. In another region, a concentration of firms involved in science or engineering may warrant the development of a career pathway system including, but not limited to, green jobs. For example, these firms may collectively generate substantial demand for mechanical engineers even if only a small proportion of the firms are engaged in green-related activities. In this circumstance, the justification for developing a pathway system to meet this demand would be only partially green-related.
Third, regional career pathway approaches typically entail developing an inventory of related education and training programs. The Green Pathways Database described in this report provides a strong foundation for the development of such program inventories in each of Ohio’s regions. As appropriate in each region, the programs in the database can be supplemented with
16 “Ohio Skills Bank,” Ohio.gov: University System of Ohio, accessed May 23, 2011, http://uso.edu/opportunities/ohioskillsbank/index.php; Endel and Spence, The Ohio Skills Bank; and Columbus State Community College, Ohio Stackable Certificates. 17 Community College Bridges to Opportunity Initiative, Career Pathways Toolkit, 7.

13
programs from outside the USO to create a more comprehensive inventory of programs in each region.

14
Best Practices in Green Jobs Education and Training Introduction and Overview This part of Green Jobs and the Ohio Economy discusses best practices in green jobs education and training. It includes an explanation of seven best practices and offers case studies of schools nationally and in Ohio that implement these best practices. In addition, this chapter presents selected findings from a survey of educators in the University System of Ohio.
This report uses the phrase “best practices” to mean those activities that are said to be particularly effective for accomplishing a goal or set of goals.18 For the purposes of this report, best practices in green jobs education and training are defined as those activities that are effective for providing students with the skills and knowledge that are in demand by employers in the green economy.
Identification of Best Practices for Green Jobs Education and Training In order to identify best practices in green jobs education and training, Voinovich School researchers conducted a broad search that included a literature review, an examination of data from employer and educator interviews and consultation with project sponsors and the Ohio Green Pathways Advisory Panel. The literature review quickly revealed that only a small number of organizations have formally identified best practices for green jobs preparation, and some of these organizations have created lists that are based on a specific sector of the green economy.19 Given the absence of an adequate number of formally-identified best practices, researchers inferred best practices from some of the literature on green jobs preparation. For example, the criteria used by the Sustainability, Education and Economic Development Center to identify “quality green programs” were incorporated into the best practice list, as were the criteria for award programs such as the American Wind Energy Association’s Seal of Approval for wind energy training programs.20 For the initial list of best practices, researchers included potential best practices from sector-specific literature as well as literature that covered green jobs training in general.
After this search was completed and an initial list of best practices was identified, other researchers replicated the search to verify that the list was accurate and reasonably comprehensive. The resulting list of best practices was then assessed to identify areas of overlap. Duplicates were removed and sector-specific practices that also appeared as general 18 The phrase “best practices” often refers to strategies or programs that have been evaluated rigorously and found to be highly effective and efficient. (For example, see “Colorado Best Practices,” Office of Interagency Prevention Systems, accessed May 5, 2011, http://www.colorado.gov/cs/Satellite/Best-Practices-V2/BPV/1216289092765.) Using this definition of best practices is not possible for this study because the research on green jobs education and training is still developing and there is not yet an extensive body of research from which to draw. Instead, this report uses a definition of best practices that is closer to the idea of promising practices or effective practices. 19 An example of a sector-specific list of best practices would be Interstate Renewable Energy Council, Best Practices Recommended Guidelines. An example of a more general list of best practices would be Ella Baker Center for Human Rights, Making Green Work. 20 “Quality Green Program,” Sustainability, Education and Economic Development Center, accessed December 22, 2010, http://theseedcenter.org/Resources/What-is-a-Quality-Green-Program-; “Seal of Approval Program,” American Wind Energy Association, accessed December 21, 2010, http://www.awea.org/learnabout/education/awea_soa.cfm.
15
best practices were recoded as general best practices. Once this process was completed, an additional researcher followed the same procedure with the original list of all best practices and the two resulting lists were triangulated. This process, described by Patton as “investigator triangulation,” was used to make sure that the literature was reviewed and sorted as systematically as possible and with minimal interpretive bias. 21
As a result of this process, the overall list changed from one of general and sector-specific best practices to a list of general best practices only. The vast majority of sector-specific best practices identified through the best practice search appeared to be the result of the application of a general best practice to the particulars of a given industry. For example, best practices that centered on the use of particular types of training equipment were viewed as the sector-specific application of the general best practice that calls for utilizing up-to-date training equipment.
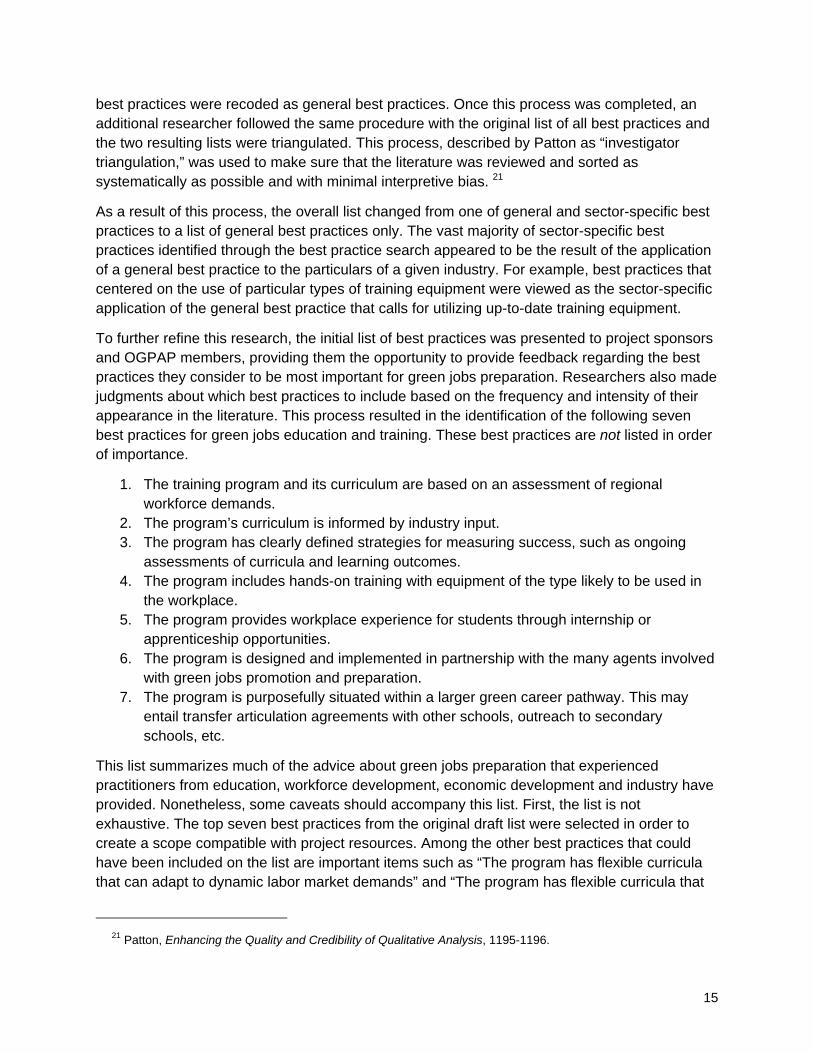
To further refine this research, the initial list of best practices was presented to project sponsors and OGPAP members, providing them the opportunity to provide feedback regarding the best practices they consider to be most important for green jobs preparation. Researchers also made judgments about which best practices to include based on the frequency and intensity of their appearance in the literature. This process resulted in the identification of the following seven best practices for green jobs education and training. These best practices are not listed in order of importance.
1. The training program and its curriculum are based on an assessment of regional workforce demands.
2. The program’s curriculum is informed by industry input. 3. The program has clearly defined strategies for measuring success, such as ongoing
assessments of curricula and learning outcomes. 4. The program includes hands-on training with equipment of the type likely to be used in
the workplace. 5. The program provides workplace experience for students through internship or
apprenticeship opportunities. 6. The program is designed and implemented in partnership with the many agents involved
with green jobs promotion and preparation. 7. The program is purposefully situated within a larger green career pathway. This may
entail transfer articulation agreements with other schools, outreach to secondary schools, etc.
This list summarizes much of the advice about green jobs preparation that experienced practitioners from education, workforce development, economic development and industry have provided. Nonetheless, some caveats should accompany this list. First, the list is not exhaustive. The top seven best practices from the original draft list were selected in order to create a scope compatible with project resources. Among the other best practices that could have been included on the list are important items such as “The program has flexible curricula that can adapt to dynamic labor market demands” and “The program has flexible curricula that
21 Patton, Enhancing the Quality and Credibility of Qualitative Analysis, 1195-1196.

16
can adapt to students’ varying experience levels.” The list of seven best practices should thus be viewed as a list of some of the best practices that are most frequently mentioned in the literature and that project sponsors and OGPAP members deemed to be particularly relevant for Ohio.
Second, these best practices are not mutually exclusive. For example, making sure that there is sufficient industry demand for graduates of a program (best practice number one) can be part of the same process as making sure program graduates have the credentials or industry-determined skill sets that employers will require (best practice number two). Similarly, a school that establishes close partnerships with community organizations (best practice number six) can use these partnerships to provide some of the supportive services that students need to advance along a green career pathway (best practice number seven). Almost all of the best practices, if implemented, will help a program to implement other best practices as well.
Third, the existing literature from which these best practices are drawn tends to focus heavily on the role that community colleges play in green jobs education and training. This does not mean that the identified best practices apply only to community colleges (in fact, some of the case studies in this report show how other types of institutions are implementing these best practices), but it may mean that these best practices often find their best fit with programming at the community college level.
Finally, as has been pointed out elsewhere, care should be taken when assessing a best practice or promising practice.22 Transferring a practice to a new setting requires “the assessment and application of knowledge, ideas, skills and lessons learned. Because one size does not fit all, some level of adaptation is usually required in the replication process in a new setting.”23 For this reason, this chapter includes lengthier case studies that provide some detail on the ways these practices were conceived and implemented, as well as many shorter case studies that show the variety of ways in which these best practices can be adapted and implemented.
National Examples of Best Practice Implementation The literature that produced the list of best practices also includes many examples of institutions across the country that implement these best practices with exceptional fidelity and success. Researchers contacted representatives of some of these national programs and used semi-structured interview guides to gather details about the implementation of the best practice under study. Once each interview was completed, the interviewer produced a case study that was then sent to the program contact for review. In the remainder of this chapter, each case study is presented after the explanation of the best practice to which it relates. The inclusion of a national case study with each best practice explanation is intended to provide more detail on the ways that these best practices can be implemented. In the case of best practice number six – “The program is designed and implemented in partnership with the many agents involved with green jobs promotion and preparation” – two national case studies are included in order to cover the multiple types of partnerships that programs can have.
22 Bolin, Promising Practices, 7-16. 23 Ibid, 9.

17
Ohio Examples of Best Practice Implementation Researchers also conducted interviews with Ohio educators to generate case studies of the various ways Ohio schools implement the best practices. Several sources were consulted to identify Ohio schools to contact. The national literature on green jobs training and promotion mentions several Ohio schools, and these schools were approached for interviews. Information collected from Ohio educators and employers earlier in the project provided several leads, and researchers also asked project sponsors for the names of Ohio programs that might be implementing the best practices under study.
Once a list of potential schools was identified, researchers contacted the schools to ascertain whether the best practice was in fact being implemented. If so, they used interview guides to gather information about the best practice. Researchers wrote up the information in the form of brief case studies, which were then sent to the program contact for review. Four Ohio case studies are included with each best practice in order to illustrate the variety of ways that Ohio schools have been found to implement the best practice. This should not be viewed as an exhaustive list, as the researchers identified many programs within the USO that are implementing each of the best practices.
Survey of Educators within the University System of Ohio The Voinovich School researchers conducted a survey of educators within the University System of Ohio in order to assess the extent to which the seven best practices are being implemented in green-related programs within the USO. The survey also provides information on each program’s demographics and its role in the green economy. In addition to findings shared in this chapter, frequency tables are provided in Appendix F and the survey methodology is described in Appendix D.
Program Demographics and Student Enrollment Among those responding to the survey, 81.8 percent have been in place more than five years and 5.6 percent of the programs started in the last year. Among certificate programs, 21.6 percent have been in place two years or less, compared to 11 percent of associate’s programs and 4.1 percent of bachelor’s programs. Almost all of the programs (97.3 percent) offer courses for academic credit.
Respondents were asked to estimate the minimum length of time to complete the program. A total of 62.2 percent of respondents reported their program takes two years or less to complete, with 29.1 percent indicating four years. From July 1, 2009 to June 30, 2011, the programs’ enrollment ranged from zero to 2,000 with a median enrollment size of 30 students. During the same period, the number of degrees and certificates programs awarded ranged from zero to 300, while the median number of awards conferred was seven.
Industry Sector and Preparation for Employment in the Green Economy Respondents were asked to select from a list the industry sector or sectors in which each program prepares students to work. Among all of the programs responding to the survey, 90.8 percent associated themselves with one or more of the seven green industry sectors. Programs selected the renewable energy sector (47.5 percent) most often, followed by the energy efficiency sector (44.8 percent) and the manufacturing sector (42.5 percent). Almost half of the

18
respondents (47.9 percent) indicated their program prepares students to work in one or two of the listed sectors while 17.2 percent selected five or more of the sectors.
Looking at the programs by the type of degree they offer, over half of the certificate programs (51.0 percent) indicate they prepare students to work in the energy efficiency sector with 46.9 percent of certificate programs selecting manufacturing. Manufacturing was the most frequently chosen sector for associate’s degree programs (43.2 percent). The most common sector selected among bachelor’s degree and advanced degree programs was renewable energy with 60.0 percent and 63.3 percent, respectively.
To determine the extent to which a program offers training or education in green-related skills, programs were asked to identify whether or not such skills were embedded in the program’s required or elective coursework. Over half of the programs (56.7 percent) indicated green-related skills are embedded in all or some of their program’s required coursework with another 18.3 percent of the programs offering green skills training in their elective coursework. Looking at green education and training by sector, 81.1 percent of programs preparing students for the green building sector offer green skills training in all or some of the required coursework, compared to 55.9 percent of programs preparing students for the manufacturing sector.
Overview of Chapter The remainder of this chapter is organized around the seven best practices. Each section begins with a brief discussion of the best practice and a national case study of the best practice’s implementation. Then, pertinent data from the USO educator survey are presented, followed by four brief case studies that illustrate some of the ways Ohio schools are implementing the best practice. As mentioned, the section pertaining to best practice number six (“The program is designed and implemented in partnership with the many agents involved with green jobs promotion and preparation”) includes two national case studies instead of one in order to illustrate the many types of partnerships that are possible. The section pertaining to best practice number seven (“The program is purposefully situated within a larger green career pathway”) contains a considerably longer explanation of the best practice than is found in other sections because career pathways include components of all the other best practices.

19
“The danger is that communities will rush to create green workforce development programs, producing skilled workers for jobs that do not yet exist in sufficient number or permanence.”
-from Greener Pathways: Job and Workforce Development in the
Clean Energy Economy
Best Practice One: The program is based on an assessment of regional workforce demands. Explanation of Best Practice The literature on green jobs preparation contains frequent cautions against creating training programs that prepare students for jobs that are not available in the area at the time students complete the program.24 To avoid this potential problem, much of the existing literature on green jobs training recommends that educators develop or gain access to regional workforce demand projections during the initial stages of program development. This enables program developers to identify the occupations for which their programs should prepare students, thereby increasing the chances that graduates of the program can obtain and keep employment.
Labor market data is often useful in predicting job openings on the local labor market, but such data can be very difficult to generate and/or to interpret. As Bozell and Liston note, “The demand in today’s green sector is mostly not real, but projected. It is being driven primarily by government incentives and funding designed to create a market and by venture capital investments.”25 Aside from the nature of the data itself, another complicating factor is that most educators do not have the resources to generate this data or to gain access to it once it is produced. One Ohio manufacturing educator reported in an interview that there “is no easy way to obtain workforce projections directly from employers…It is time consuming and employers in this area do not readily reply to requests from schools for information.”
When educators cannot gain access to labor market data collected by another organization and cannot collect these data themselves, the literature suggests methods for approximating this step. Other ways to understand employer training needs include holding roundtables with area employers or sending out surveys to local employers to ask them for less formal demand projections.26 The literature also stresses including local employers on program advisory boards for many reasons, including the role that advisory boards typically play in approving proposals for the creation of new programs. Having local employers on an advisory board allows them the chance to provide input on the relevance of the program to their companies’ current and future needs.
24 Sources for this best practice include: Bozell and Liston, Building Effective Green Energy, 5-6; Ella Baker Center for Human Rights, Making Green Work, 10-11; Feldbaum and States, Building a Sustainable Future, 15; Interstate Renewable Energy Council, Best Practices Recommended Guidelines, 6; “Quality Green Program,” Sustainability, Education and Economic Development Center, accessed December 22, 2010, http://theseedcenter.org/Resources/What-is-a-Quality-Green-Program-; Saha, Enhancing State Clean Energy, 2; and White and Walsh, Jobs and Workforce Development, 27, 46. 25 Bozell and Liston, Building Effective Green Energy, 5-8. 26 Ella Baker Center for Human Rights, Making Green Work, 10-11.

20
Nationally-Recognized Example Los Angeles Trade-Technical College (LATTC), Division of Workforce and Economic Development, Los Angeles, California. According to Dean Leticia Barajas, “We needed to make sure that the students in our community programs would actually be ready for employment upon graduation.” To achieve this goal, school administrators began by consulting existing data on local workforce needs and projections, such as those developed by local economic development departments. They soon discovered that these sources tended to focus on traditional job categories and often contained little information on emerging occupations, including those related to the green economy. As a result, LATTC recognized the need to develop its own data. This included commissioning targeted studies from field-specific researchers as well as gathering information directly from local employers.
LATTC pursued several strategies for engaging industry representatives in these discussions. First, they built upon the school’s existing relationships as well as those of adjunct faculty members who could serve as a bridge between academia and key green employment sectors such as construction, design, manufacturing and transportation. An industry collaborative was formed to facilitate further communication, but administrators soon learned that many executives were more open in one-on-one conversations. In response, they provided key employers with individual tours, access to faculty and input on curricular content. According to Dean Barajas, response time is critical. “Being able to develop an idea, pilot and launch it within a couple months’ time maximum has been a way that we’ve been able to demonstrate to our industry partners that we’re credible.”
Based on these efforts, LATTC identified specific occupations, such as solar panel installation and energy auditing, to be targeted for additional resources and development. For example, to be eligible for program innovation support through the Division of Workforce and Economic Development, departments needed to demonstrate that they met three or more criteria related to preparing students for target occupations. In addition, a majority of faculty within the department had to voluntarily agree to be willing to transform both the content and delivery method of their curriculum to ensure their program aligned with the emerging needs of students and employers. This strategy is credited with transforming the organization’s culture by encouraging faculty to be actively engaged in change efforts, allowing LATTC to expand its capacity without hiring new staff. For example, members of the carpentry faculty participated in professional development training to become certified in energy efficiency and weatherization, allowing the school to offer energy auditing courses.
This level of research is time-consuming and difficult. However, according to LATTC’s President Roland “Chip” Chapdelaine, “It is our opinion that it is unethical for us to develop programs for which there are no jobs available at the other end. The trick – how do you time it so you aren’t too far ahead of the curve, preparing students two years before there are jobs?” To manage this issue, LATTC attempts to slowly introduce emerging technologies into the curriculum, doing research and training faculty members to ensure coverage of critical concepts and job skills. As it becomes more certain that related jobs will develop, a certificate or degree program is created, with limited enrollments at the beginning and capacity expansions to meet developing demand as needed.

21
Ohio Survey Results While the survey data collected from Ohio educators do not specify whether the responding programs have gained access to formal workforce projections, they do suggest that the majority of green jobs education and training programs are being developed in response to perceived industry needs. When asked about the reasons behind the creation of their programs, the vast majority of the responding educators (80.6 percent) reported that employer requests and/or a perceived need in the labor market played a role in prompting their programs’ development. Table 4 summarizes the reasons for program development selected by survey respondents.
Table 4. Which of the following statements apply to the creation of your program?
Frequency PercentThe program was created in response to employer requests for education/training in this field.
137 59.3%
The program was created in response to student requests for education/training in this field.
73 31.6%
The program was created in response to a perceived current need in the labor market.
148 64.1%
The program was created in response to a perceived future need in the labor market.
120 51.9%
The program was created because of increased funding for green education/training.
5 2.2%
The program has been in place for many years. 16 6.9%Other 13 5.6%Note: Thirty-eight respondents did not answer this question. Respondents could choose multiple responses.
• Respondents most frequently selected the option The program was created in response to a perceived current need in the labor market (64.1 percent). A majority of respondents also identified a perceived future need as a reason for the program’s creation (51.9 percent).
• Over half of respondents (59.3 percent) also indicated that the program was a result of employer requests for a specific type of training.
When the respondents’ answers are sorted by type of program (certificate, associate’s, bachelor’s, or advanced degree) employer requests stand out as a substantial prompt for the creation of certificate and associate’s programs. Among certificate programs, 71.4 percent indicated that their program was created in response to employer requests, while 87.2 percent of associate degree programs reported this to be the case.
Employer requests also appear to be a big driver of program creation for relatively new programs. Among programs that began operating between one and two years ago, 81.8 percent

22
reported that program creation was prompted by employer requests, as opposed to 57.4 percent of programs that were created over five years ago.
Ohio Examples Ohio schools are implementing this best practice in a variety of ways. Some have found ways to access labor market data through industry associations. When not able to access labor market data directly, schools have developed relationships with local employers to identify workforce needs. Many have included industry representatives on their program advisory boards to ensure that industry representatives review program content.
Cuyahoga Community College, Green Building/Energy Efficiency Workforce Development Program. Cuyahoga Community College’s (Tri-C) Workforce Development Office has an active advisory committee that offers leadership and direction in curriculum development for Tri-C’s Green Building/Energy Efficiency Program. Comprised of both faculty and industry leaders, this group performs formal outcome assessments to identify gaps between employer needs and curriculum design as well as to track changes in workforce demand over time. This information is regularly examined to formulate recommendations regarding appropriate curricular updates. According to Kevin Snape, Vice President of Sustainability, “As an educational institution, we are sometimes in a vacuum…Our advisory committee guides us on our priorities, keeps us abreast of industry needs, evaluates what is working and what is not and informs us of future expectations in the workforce.”
North Central State College, Integrated Systems Technology. When designing the Integrated Technology Systems program at North Central State College (NCSC), program coordinators worked closely with the area’s largest local manufacturer, along with several of the manufacturer’s “feeder” companies. The program also created a more formal advisory committee composed of industry representatives to guide program development. More recently, NCSC has been able to access workforce demand projections compiled by the Regional Manufacturing Coalition. According to Workforce Director Nancy Kukay, the assessment of local workforce demand was a critical component of the program’s formation. Through this process, NCSC gathered specific information about the types of training needed. Without that detailed input, she says, “We would not have training equipment that replicates the manufacturing processes, and would not have the hands-on component to the courses that employers have reported to be critical.”
Rio Grande Community College, Engineering Technology. Rio Grande’s Power Plant Operator and Mechanical Maintenance Programs were both developed in collaboration with American Electric Power (AEP). As the primary local employer of program graduates, AEP’s training needs have played an important role in shaping the curriculum. This influence is underscored by the recent decision to discontinue the Power Plant Operator Program in direct response to shifting AEP workforce demand. AEP’s role in this program further extends to providing instructional support, paid summer internships, scholarships and even hosting some courses at its facilities. This level of collaboration benefits both industry and students by ensuring an effective match between educational content and industry needs.

23
Washington State Community College, Workforce Development Green Academy. In 2008, Ohio passed legislation establishing ambitious benchmarks for reducing the state’s energy demands and increasing the proportion of energy obtained from alternative sources. This new law, combined with information gathered at conferences and from informal conversations with local employers, led administrators at Washington State Community College to believe the time might be right for establishing a series of green construction courses. To further assess the idea, the school hosted a “lunch and learn” session attended by representatives from local utilities, contractors and HVAC-related businesses. At this event, Workforce Development staff presented their research findings and then asked participating businesses to provide feedback based on their knowledge of the local economy and to identify the specific courses that would be most useful.

24
“Employers are the best and most up-to-date source of information on which certifications and levels of education are required for a particular green job.”
-from Preparing the Workforce for a “Green Jobs” Economy
Best Practice Two: The program’s curriculum is informed by industry input. Explanation of Best Practice This best practice stresses the need for educators to maintain close contact with relevant employers in order to ensure that the education or training program is meeting industry needs for specific skills sets, knowledge and competencies. This is especially important in the field of green jobs education and training, which prepares students for work in industries whose technologies are rapidly evolving. To implement this best practice, programs are encouraged to establish channels for receiving regular input from industry. These channels can include advisory committees and other methods that allow industry representatives to provide information about specific and current industry needs.
One application of this best practice suggests that educators look to see if the industry for which they prepare students has produced formal recommendations for training and skill sets. In addition, educators can make certain that their student’s skill sets include in-demand skills by tailoring the curriculum to meet industry-recognized standards and certification requirements.27 One of the more fundamental building blocks of a program’s curriculum can be an industry-created task analysis.28 For example, the North American Board of Certified Energy Practitioners (NABCEP) has created task analyses for solar PV installers, solar thermal installers, PV technical salespersons and small wind installers.
Another building block for curricula can be the certification requirements for a certain field. For example, the requirements for Leadership in Energy and Environmental Design (LEED) Certification can be used to develop courses in green building, or Residential Energy Services Network (RESNET) certification requirements can inform energy efficiency programming.
Many green jobs training programs are in fields that are still new or that are rapidly evolving, and industry standards may not yet be codified into task analyses or certification requirements. However, even in the absence of established industry standards, green jobs educators can secure input through close collaboration with industry representatives. One way to accomplish this is to incorporate industry representatives into advisory committees that approve and revise curriculum. Another way is to use the Developing A CurriculUM Method
27 Sources for this best practice include: Green for All, Pathways out of Poverty, 2, 6; Interstate Renewable Energy Council, Best Practices Recommended Guidelines, 8-9; “Quality Green Program,” Sustainability, Education and Economic Development Center, accessed December 22, 2010, http://theseedcenter.org/Resources/What-is-a-Quality-Green-Program-; and White and Walsh, Jobs and Workforce Development, 39. 28 IREC defines a task analysis as “what people do, under what working conditions they do it, what they must know to do it, and the skills they must have to do it.” Interstate Renewable Energy Council, Best Practices Recommended Guidelines, 8.
25
(DACUM), which uses a combination of surveys, interviews and focus groups to develop curriculum content.29
Nationally-Recognized Example Michigan State University, Supply Chain Management Department, East Lansing, Michigan. The Supply Chain Management program at Michigan State University makes a concerted effort to keep in touch with key business partners by bringing representatives to campus three to five times each year. “Given the nature of supply chain management, it is critical to have these ongoing relationships with industry,” says Department Chair David Closs, “They help us stay relevant.”
To encourage this ongoing interaction, the program provides a variety of different opportunities for businesses to get involved. A Supply Chain Management Council was formed about 25 years ago, originally to help foster interested companies’ involvement in supply chain related research. Although the focus of this effort has evolved over time, the group continues to meet on campus once or twice each year, discussing topics of shared interest with both faculty and students as well as participating in events organized by the student chapter of the Supply Chain Management Association, including an annual career fair and three-day leadership academy.
Businesses also have the opportunity to work one-on-one with faculty members to develop a “live case.” This involves utilizing a recent, real-world challenge faced by the company to help students better understand a particular supply chain management issue. A representative from the business sets up the problem for the class and then the students discuss possible strategies for addressing it, either in teams or as a group. In addition to increasing student engagement, this interactive approach provides the business with an alternative strategy for evaluating students’ abilities and identifying potential future recruits.
Several key companies also helped develop and sponsor Michigan State University’s Supply Chain Operations Decision Environment (SCODE) intercollegiate supply chain team competition. Over the course of a morning, student teams from up to 15 schools virtually manage a company’s supply chain for 13 weeks, starting with deciding whether to locate a new factory in Asia, Latin America or Europe. During the competition, “students really get to see how marketing decisions affect the supply chain or how procurement decisions affect logistics,” says Professor Closs. “You can talk about that in class, but for students to have the opportunity to actually experience it is priceless.” Industry participation was particularly critical to this project because of the challenge and expense involved in developing this type of interactive computer program and hosting the annual competition.
Perhaps because of the diversity of participation opportunities, Michigan State’s Supply Chain Management program has been successful at maintaining its connection with specific company representatives over time, helping them to build relationships with peers and faculty members
29 Interstate Renewable Energy Council, Best Practices Recommended Guidelines, 9. For examples of green-related DACUMs see “DACUM=Developing A CurriculUM,” Advanced Technology Environmental and Energy Center, accessed June 14, 2011, http://www.ateec.org/learning/instructor/dacum.htm.

26
as well as their interest in Michigan State. Although a variety of successful industry engagement models exist, Professor Closs says, “We keep the focus on the students and go from there.”
Ohio Survey Results Most of the surveyed Ohio educators indicated that their program implements this best practice. Specifically, 63.7 percent of respondents reported that industry standards and/or certification criteria were used in the development of program curricula. Programs that produce certificates and associate’s degrees in particular appear to use industry standards during program creation. A total of 72.0 percent of certificate programs and 79.0 percent of associate’s programs indicated that industry standards and/or certifications were used in the development of program curricula. When the data is sorted according to the industry sectors for which each program prepares students, the sector most frequently reporting the use of industry standards and/or certification criteria is green building (74.3 percent) and the sector least frequently reporting this is bioscience (46.0 percent).
While most programs reported using industry standards and/or certification criteria for curricula development, a much smaller percentage of programs (14.2 percent) indicated that students actually sit for a certifying exam as part of the program or upon completion of the program. Certificate programs appear most likely to prepare students for specific certifying exams. A total of 38.0 percent of certificate programs indicated that students sit for a certifying exam during or after the program, compared to 12.3 percent for associate’s programs and even lower percentages of bachelor’s and advanced degree programs. When the data is broken down by industry sector, the sectors most frequently reporting that students sit for a certifying exam are green building (21.1 percent) and energy efficiency (18.2 percent) while the sector least frequently reporting this is bioscience (9.7 percent).
Survey respondents were also asked which organizations’ standards and certifying exams they used (either by consulting the standards during curriculum developing or by preparing students to sit for the certifying exams). Respondents were given a choice of the key certifying organizations identified through the best practice research and were able to write in the name of other organizations. Appendix C provides a list of the certifying organizations identified by the best practice research as well as a list of the additional organizations written in by respondents. All of the key certifying organizations identified in the best practice research were selected by survey respondents, indicating that the Ohio schools completing the survey are consulting the key credentialing requirements in the targeted sectors.
Ohio Examples Ohio schools have used a variety of tactics to tailor their green programming to industry standards. Some programs are explicitly designed to provide a specific certification to students upon successful completion of the program. Other programs reflect industry input in alternative ways, for example by transforming a Purchasing major into a Supply Chain and Operations Management major to reflect the changed skill sets in the industry. Advisory committees again play an important role in creating an avenue for industry input into education and training programs.

27
Apollo Career Center, Light Commercial/Residential Construction Program. The Environmental Protection Agency (EPA) requires certification for technicians who will be working with refrigerants due to the negative environmental impact caused by the improper handling and disposal of these substances. In response, Apollo Career Center’s HVAC curriculum has been structured to incorporate the EPA’s Section 608 Technician Certification into the curriculum. Students learn the required information in the classroom and have the opportunity to practice what they have learned in the lab under the supervision of a certified instructor. In addition, the test fee is included in the cost of the 108-hour program, and test preparation activities are built into the coursework. “Working from an EPA certification standard and making sure the students can achieve that certification is helpful,” says staff member Jim Rosen. “Employers appreciate their hands-on experience, and they’re looking for that certification.”
The Career Center – Adult Technical Training, Manufacturing Skill Standards Council (MSSC) Industrial Certification. Working with area manufacturers, the Career Center is utilizing materials produced by the Manufacturing Skill Standards Council (MSSC) to further develop the knowledge and skills of Ohio’s production workers. MSSC is a nationwide, industry-led effort that has developed a training, assessment and certification system with four modules, including Manufacturing Processes and Production, Quality Assurance, Maintenance Awareness and Safety. These modules were developed with input from 700 companies, and participants who complete all four modules will earn the MSSC Certified Production Technician Certification.
Owens Community College, Alternative Energy and Sustainable Systems Technology. Owens Community College has formed an advisory committee to help support the development of its new associate’s degree in Alternative Energy and Sustainable Systems Technology. This group includes program faculty as well as representatives from the energy sector such as First Energy, Alternative Energy Solutions, Dovetail Solar and Wind and others. Based on their experience, committee members provide input on degree requirements, course content and resource allocation decisions. For example, at a recent meeting, attendees were asked to review and provide feedback on various alternative energy training simulators that program administrators are considering purchasing.
Miami University, Supply Chain and Operations Management. Miami University developed its Supply Chain and Operations Management Program in direct response to a shift in industry practices. Prior to 2000, the school was known for its Purchasing major. However, with increased technology, outsourcing and globalization, businesses throughout the country began to recognize the strategic value of integrating purchasing decisions with previously separate areas such as transportation and operations. As the field became broader and more fully integrated, Miami University transformed its Purchasing major into first a Supply Chain Management major and, eventually, a Supply Chain and Operations Management major. To reflect this new orientation, the entire curriculum was transformed, ultimately resulting in an interdisciplinary course of study that combines classes in marketing, management and information systems.

28
“Plan up front to measure green jobs programs and make them better.”
-from Greener Pathways: Jobs and Workforce Development in
the Clean Energy Economy
Best Practice Three: The program has clearly defined strategies for measuring success, such as ongoing assessments of curricula and learning outcomes. Explanation of Best Practice According to this best practice, green jobs education and training programs should set clearly stated goals and regularly assess their progress toward these goals.30 There are two main aspects to this best practice. The first aspect is the process of setting goals and measuring programs’ progress toward them. Specifically, program developers are encouraged to clearly identify program goals and specify the data that will indicate whether the program is achieving those goals. The effectiveness of this effort is also dependent upon the development of appropriate systems to collect and assess the data required for this analysis.
There are many recommendations for how to assess a program’s progress. Indicators of success may include student employment status ninety days, six months and one year after graduation; salaries earned by program graduates; and additional educational credentials or certifications earned by program graduates. Indicators that students are on track to achieve these goals may include student progress through the program as well as feedback from students, faculty and internship employers. Ways to acquire data about these indicators include conducting student exit surveys, administering pre- and post-tests of students’ knowledge in particular content areas and establishing formal mechanisms for soliciting feedback from employers regarding students’ levels of preparedness.
The second aspect of this best practice stresses that the goal-setting and measurement process should be one that strengthens the program’s ability to produce graduates whose skills meet the needs of industry. To achieve this objective, programs are encouraged to devise industry-relevant learning outcomes, frequently review these outcomes and closely monitor students’ ability to achieve these outcomes. This process is a part of the overall goal setting and evaluation process.
Advisory committees play an important role in this best practice as well. The advisory committee can be a crucial part of goal-setting and program review and can also be a valuable resource for identifying and updating industry-relevant learning outcomes.
30 Sources for this best practice include: Association for the Advancement of Sustainability in Higher Education, Sustainability Curriculum; Ella Baker Center for Human Rights, Making Green Work, 23; Green for All, Pathways out of Poverty, 2, 7; “Quality Green Program,” Sustainability, Education and Economic Development Center, accessed December 22, 2010, http://theseedcenter.org/Resources/What-is-a-Quality-Green-Program-; and White and Walsh, Jobs and Workforce Development, 46.

29
Nationally-Recognized Example Iowa State University, Department of Agricultural and Biosystems Engineering, Continuous Curricular Improvement Process, Ames, Iowa. Iowa State University’s Department of Agricultural and Biosystems Engineering originally began developing its Continuous Curricular Improvement Process in the mid-1990s in response to related Accreditation Board for Engineering and Technology (ABET) requirements. Since then, the process has continued to develop and, according to Department Chair Rames Kanwar, “it keeps our faculty inspired to keep evolving and to know that they are valued for their teaching ability.”
Every three years, the department works with various constituents, including an advisory board made up of representatives from agriculture and industry, to review the program’s mission, goals and objectives. This information is combined with relevant accreditation and recognition criteria to generate a list of specific student learning outcomes. Next, the department’s curriculum is examined to determine which outcomes are addressed by each course and to ensure adequate coverage.
Annually, each faculty member meets with a curriculum committee made up of ten colleagues known for their high-quality teaching. The presenting faculty member has ten minutes to describe a particular course, discussing how the content, methodology and assignments work together to address one or more student learning outcomes. Following this, the committee recognizes the strengths of the class and also offers ideas about how it could potentially be improved. “It is important to understand the culture of the department.” cautions Dr. Kanwar. “If overly critical, this could become negative, but we work hard to keep the input positive and to emphasize improvement of the program so that faculty don’t take it personally.”
In addition to these faculty assessments, a variety of other sources are used to measure achievement of the defined student learning outcomes, including student portfolios, internship evaluations, capstone course performance, Fundamentals of Engineering (FE) exam results, and two-year post-graduate employer evaluations. Further, specific targets have been established for each measurement. For example, for a student to obtain credit for an internship, the supervisor must complete an online evaluation of the student, rating his/her performance on a 1-5 scale regarding the frequency of performing 61 key actions related to 14 work competencies. Students are expected to attain at least an 85 percent achievement in each category. Work competencies that receive consistently lower ratings can be further examined to identify the specific areas in which students need additional work.
Further information is gathered as part of the annual assessment process, including course evaluations, student exit surveys, placement statistics, program reviews and five-year post-graduation student surveys. In consultation with the same external advisory committee that helps define the student learning outcomes, the curriculum committee utilizes this data to develop recommendations for further improving the program.
This process is time consuming. However, as Dr. Kanwar sees it, the effort is worthwhile because “by regularly obtaining feedback and using it to improve our curriculum, we are ensuring that our students are receiving the best possible education.”

30
Ohio Survey Results Ohio educators were asked about some of the methods that programs use to gather information needed for ongoing program assessment. In particular, educators were asked if they formally reviewed curricula on an annual or semi-annual basis, requested feedback from students or employers and/or tracked program graduates’ employment status after graduation. Table 5 summarizes the answers to this question.
Table 5. Does your program use any of the following methods to evaluate its effectiveness?
Frequency PercentThe program curriculum is formally reviewed on an annual or semi-annual basis.
160 68.7%
Students are asked to provide formal feedback on their experience in the program.
197 84.5%
There is a system in place to track students' employment status after completion of the program.
124 53.2%
Employers of program graduates are asked for formal feedback on the program.
100 42.9%
Other measures of evaluation or review are used. 64 27.5%Note: Thirty-six respondents did not answer this question. Respondents could choose multiple responses.
• The most frequently selected assessment mechanism was the solicitation of student feedback (84.5 percent). The high percentage of responses may in part be due to the standard practice of asking students to complete course evaluations.
• Many respondents (68.7 percent) also reported that their curricula are reviewed on an annual or semi-annual basis.
• A majority of respondents (53.2 percent) reported that they track student employment status after graduation.
When the data are sorted by the sector for which programs prepare students, more manufacturing programs (52.7 percent) reported asking employers for formal feedback than any other sector. The sector selecting this option least often was bioscience (24.6 percent).
When sorted by degree type, programs that produce advanced degrees appear less likely to ask employers for feedback (14.6 percent), and programs producing associate’s degrees and certificates appear more likely to ask for this type of feedback (63.6 percent and 56.8 percent, respectively).
31
Ohio Examples Ohio educators employ a variety of methods to ensure continuous improvement of their programs. Accreditation processes, for example, can help programs put systems in place that allow for careful evaluation and improvement. Some programs also develop review systems that are integrated into their home institution’s larger evaluation processes.
Rhodes State College, Concrete Technology. Rhodes State College’s Concrete Technology program uses a variety of outcome measurement methods to ensure student success. One central method is the collection and analysis of feedback obtained through student evaluations and during faculty/student advising sessions. In addition, employers are asked to evaluate the skills of students who participate in a Field Experience, and this information is utilized to inform curricular changes. These efforts dovetail with a college-wide effort to improve overall effectiveness. Based on a self-study completed in 2008, Rhodes State College has defined mission criteria and strategies for fulfilling this mission. Key performance indicators have also been established to measure the school’s progress, and this data is being tracked through a centralized electronic database.
University of Dayton, Mechanical and Aerospace Engineering. The University of Dayton’s Mechanical and Aerospace Engineering program is accredited by the Accreditation Board for Engineering and Technology (ABET). As part of this process, the program is expected to develop educational objectives that are aligned with ABET standards as well as the needs of students and employers. Further, the department is required to design an evaluation process to ensure that these objectives are attained. Finally, evidence must be shown that this evaluation data is being utilized to further improve the program over time. The University of Dayton accomplishes these goals through a series of assessments conducted with students, graduates, faculty and employers.
The Ohio State University, Agricultural Technical Institute. In 1999, Ohio State’s Agricultural Technical Institute (ATI) became one of the first participants in the Higher Learning Commission’s Academic Quality Improvement Program (AQIP). As part of this alternative accreditation process, ATI developed a Systems Portfolio documenting its context, processes, results and improvements. Data is currently collected and analyzed in a variety of key areas, including student retention, graduation and placement rates as well as internship and employer ratings regarding current and former students’ knowledge and skills. In addition, each major is reviewed every five years to make recommendations for investing in new equipment, additional personnel, curricular upgrades and other program enhancement efforts. Further strategies for assessing student learning continue to be developed as part of the AQIP process.
University of Cincinnati, Center for Cooperative Education Research and Innovation. In 1906, the University of Cincinnati founded the first cooperative education program in the country and currently maintains an independent office designed to coordinate co-op placements across the university. In addition to facilitating the development of cross-disciplinary co-op teams, the Center for Cooperative Education Research and Innovation is developing systematic methods for tracking the impact of this program for both students and businesses. Through a grant obtained from the Department of Education, this office has developed a Corporate Feedback System designed to gather data that can be used to leverage additional support as well as

32
identify strategies for further enhancing the school’s curriculum. Two reports have been published on this research and can be downloaded from the Center’s website.

33
“Employers in the residential energy efficiency industry have expressed concerns that existing training programs in many community colleges do not have the capability and resources to combine classroom and lab training with field training, producing graduates with limited practical experience and hands-on training.”
-from Enhancing State Clean Energy Workforce Training to Meet Demand
Best Practice Four: The program includes hands-on training with equipment of the type likely to be used in the workplace. Explanation of Best Practice According to this best practice, green jobs preparation should not solely consist of classroom lecture or online instruction. Instead, green jobs education and training should provide students with the opportunity to perform the tasks under study.31 This hands-on training can be provided in a variety of ways, including laboratory components, fieldwork and extra-curricular opportunities like contests that require hands-on application of green-related concepts.
An important qualifier to this best practice is that the hands-on training should be performed on up-to-date equipment or software of the type that students will be expected to use in the workplace. This is especially important given the rapid technological development that characterizes many green occupations. However, a common note in the literature and a common theme in the interviews conducted with Ohio educators is that the cost of this training equipment can be prohibitive. When directly obtaining (and maintaining) up-to-date equipment is not possible, the literature suggests other ways to provide hands-on training to students, most of which center on partnerships. For example, educators may enter into cost-sharing or resource-sharing agreements with other schools and then share training equipment. Educators may also gain use of equipment and software through collaborations with research facilities or employers in order to provide the necessary training equipment for their students.
Nationally-Recognized Example Mesalands Community College, Wind Energy Technology, Tucumcari, New Mexico. Mesalands Community College’s Wind Energy Technology program prepares students for careers as wind energy technicians, an occupation that is in high demand locally due to the multiple wind farms operating in the region. For Jim Morgan, Director of the North American Wind Research and Training Center (NAWRTC) at Mesalands, attempting to teach these students without providing hands-on learning opportunities would be like “training automotive mechanics without the use of a car or training commercial truckers with a pickup truck.”
In keeping with this philosophy, students in Mesalands’ wind energy program spend over half of their time in hands-on training. For much of their training, students have access to the NAWRTC’s utility-scale General Electric 1.5 megawatt turbine. When in operational mode, the
31 Sources for this best practice include: Interstate Renewable Energy Council, Best Practices Recommended Guidelines, 6-7; “Quality Green Program,” Sustainability, Education and Economic Development Center, accessed December 22, 2010, http://theseedcenter.org/Resources/What-is-a-Quality-Green-Program-; and interviews with Ohio employers.

34
turbine generates data that students practice accessing and interpreting with the help of the NAWRTC’s OSIsoft PI system and SKF @ptitude Management System. When in shut-down mode, the turbine’s tower provides students with the opportunity to practice their climbing skills. Students also have access to an extensive array of simulators in the College’s mechanical and electrical labs.
Acquiring the necessary equipment and expertise for this project required obtaining assistance from several state legislators and leveraging resources from a wide variety of sources, including seven million dollars in General Obligation Bonds from the state of New Mexico, grants from the Department of Labor, the New Mexico Energy, Mineral and Natural Resources Department and donations of equipment and software such as the OSIsoft and SKF systems. Since the facilities have become available, their presence on campus has attracted the interest of several new research partners, including Sandia National Laboratories, the University of California (Los Angeles), Washington University in St. Louis and the New Mexico Institute of Mining and Technology.
Ohio Survey Results Hands-on training appears to be a common element of green jobs training and education in the surveyed Ohio schools. When asked about the instructional methods used in their programs, most Ohio educators (78.7 percent) reported that hands-on training is one of the methods used in their program. Associate’s programs and certificate programs most frequently selected this option (93.8 percent and 84.0 percent, respectively).
Within those programs that selected hands-on training as one of their instructional methods, the amount of hands-on training required by a program varies widely. Table 6 summarizes the percent of hands-on training that programs reported requiring from their students.
Table 6. About what percentage of the required coursework is spent on hands-on training?
Frequency Percent24% or fewer 55 30.4%25% to 49% 45 24.9%50% to 74% 65 35.9%75% or more 16 8.8%Total 181 100.0%Note: Nineteen respondents did not answer this question.

35
Ohio Examples Schools in Ohio provide a variety of hands-on training opportunities to their students through labs, contests and fieldwork.
Belmont Technical College, Building Preservation and Restoration. According to David Mertz, Building Preservation and Restoration Program Coordinator, “It is the hands-on component that brings students to Belmont, and it is the hands-on component – along with a thorough understanding of the technical side of the business – that provides them with their employment opportunities after they graduate.” This hands-on training is provided in many ways, including workshops that supplement coursework and a series of four field labs. The field labs can be completed at sites around the Ohio Valley, such as at churches needing repair of their stained glass windows or at a one-room schoolhouse in Steubenville. Some field labs are conducted further away, with past sites including the Officer’s Quarters at West Point and Frank Lloyd Wright’s Fallingwater. While training on campus, students have access to the department’s historic field lab house as well as 12,000 square feet of dedicated lab space with a woodworking shop, a paint and glass shop, a drafting room, a model and mold making shop, a library and extensive computer facilities. Students also have access to other labs on campus where they can practice welding, metalworking, HVAC repair and computer-aided drafting. Preservation students also have the opportunity to complete a preservation internship at the end of their program.
Hocking College, NABCEP Entry Level Solar PV Installer Program & Advanced Energy and Fuel Cells Program. Students enrolled in renewable energy programs at the Hocking College Energy Institute spend two thirds of their time in hands-on training exercises and one-third of their time in the classroom. Equipment available to students in the College’s advanced energy and solar PV installer programs include: fuel cells; four solar “mini-homes” with different types of roofs that can be disassembled and rebuilt; a wind generator that can be tied into a grid and constructed and disassembled as needed while students learn to do net metering; a natural gas refueling station; a bio-fuel testing laboratory; and scaffolding and safety harnesses for use in Occupational Safety and Health standards training. Hocking College Energy Institute is currently in the process of working with American Electric Power to acquire smart grid equipment as well.
Kent State University, Sustainable Technology Project Contest. Students enrolled in Kent State’s College of Technology have the opportunity to acquire hands-on training (and to win up to $1,000) by competing in the College’s Sustainable Technology Project Contest. Teams of two to six students gain valuable understanding of the design process as they attempt to create the most successful submission. Examples of projects include a biogas digester that uses campus-generated product and an electric/fuel cell model vehicle. Submissions are judged for their originality, quality, level of difficulty and the degree to which they embody sustainability and ‘going green.’ “This has been a great way to provoke thought through hands-on practical application of real world issues,” said John DeCola, Director of Advancement. “We plan on continuing this student activity into the foreseeable future as it has proven to increase awareness of the issues at hand and provides a frontline experience for our Manufacturing,

36
Construction, Aero and IT students to confront the complexity of the decisions we make daily on sustainability choices.”
Shawnee State University, Plastics Engineering Technology. Students in the Plastics Engineering Technology program receive equal parts classroom instruction and laboratory experience. During their lab time, students use software such as Inventor, Moldflow Plastics Insight, ANSYS and Mastercam. They also use a variety of equipment including injection molding machines, extruders, blow molders, a rotational molder, compression molding machines and thermoformers. Students are required to take a senior year course in which they pick a plastic part to make, design the part, go through the analysis phase, build a model and use appropriate machinery to make the part. Larry Miller, a Professor for Shawnee State University states, “You learn most by doing. The more I can have my students work with the machines, the more they get out of my lectures and the more valuable they will be in the long run.”

37
“Students who have done an internship are getting multiple offers…and the salaries are looking good.”
-Ohio educator (supply chain)
“Because of the students’ hands-on experience, they’re going to really find out what particular area they’re interested in.”
-Ohio educator (bioscience)
Best Practice Five: The program provides workplace experience for students through internship or apprenticeship opportunities. Explanation of Best Practice This best practice indicates the need not only for hands-on training, but also for training in how to operate in the workplace.32 Internships (or co-ops) can serve a variety of purposes, often depending on the type of program in which it is situated. For introductory-level programs, internships can give students a chance to try the work associated with an occupation in order to make a decision about pursuing a career in that field. In programs more directly linked to specific occupations, internships can provide some of the hands-on training that otherwise would have to be acquired through on-the-job training at an employer’s expense. Internships also have the benefit of providing training in “world of work” skills such as time management and communication. As one Ohio employer reported, “Good people and presentation skills are important because an engineer is not just going to be locked up in a cube all day. You can have some really good ideas but if you can’t communicate well with a client, it might never take place.”
Apprenticeships are often more formal steps in a particular career pathway and may be prerequisites for employment in a specific company or industry. For example, Registered Apprenticeships are the main entry points for certain careers in green building, renewable energy and advanced energy.33 Like internships, they provide training in a real-world work environment and typically enhance a potential employee’s attractiveness to employers.
Nationally-Recognized Example Cape Cod Community College, Environmental Technology and Clean Energy Program, Cooperative Work Experience, West Barnstable, Massachusetts. The Cooperative Work Experience at Cape Cod Community College (CCCC) began as an effort to involve students in remediation efforts at local Superfund cleanup sites. Since that time, CCCC has worked with a variety of partners, including the National Science Foundation, to increase funding for the co-op program. As a result, the program has grown to include small wind companies, the Environmental Protection Agency, the Massachusetts Audubon Society, the Cape Cod Center for Sustainability and many other employers.
Students in the Environmental Technology and Clean Energy Associate’s Program, as well as students pursuing any of the eight certificates offered by the department, can find employment sites suitable for gaining experience in their specific areas of study. According to Program Coordinator Hank Colletto, the co-op experience helps students decide what careers they 32 Sources for this best practice include: Interstate Renewable Energy Council, Best Practices Recommended Guidelines, 7; Ventre and Weissman, Survey of Industry Needs, 2; and interviews conducted with Ohio employers. 33 US Department of Labor, Greening of Registered Apprenticeship, 29-30.
38
eventually want to pursue by allowing them to try related activities, such as assisting with energy audits, conducting independent research projects for their employers, or performing public outreach for environmental causes.
In order to make sure that students and employers get the most out of the co-op experience, CCCC has a variety of structures in place. Faculty advisors work with students to locate employment sites and to tailor the co-op experience to each student’s particular interests. Faculty members also perform site visits. Employers are asked to complete an evaluation of students’ performance, and students in turn complete an evaluation of the internship. Students also are required to keep an internship journal and write an essay about their experiences. When these requirements are met to the program’s satisfaction, students can receive course credit for the experience.
According to Colletto, the co-op program has all the expected benefits for students, such as helping them gain a competitive edge on the job market and providing a hands-on component to complement coursework. In addition to those benefits, however, the Cooperative Work Experience has had positive impacts on the program itself. In order to make the Cooperative Work Experience a success, CCCC has had to forge close working relationships with employers, which have had a host of beneficial effects, including helping to keep the program in tune with changing workforce development needs.
Ohio Survey Results The majority of surveyed programs (64.9 percent) reported that they offer either a required or optional internship component to their students. When the data is broken down by degree type, internships appear more common in programs that produce bachelor’s degrees (84.4 percent) and associate’s degrees (77.2 percent) and less common in certificate producing programs (43.5 percent) and advanced degree programs (41.8 percent).
When assessed by sector, agriculture programs most often reported that they offer required or optional internship programs (78.6 percent), while advanced energy programs least often reported that they offer required or optional internship programs (59.3 percent).
Only a small number of programs reported having an apprenticeship component (18.9 percent). Among the programs that offer apprenticeships, most are associate’s or certificate programs. A total of 22.8 percent of associate’s programs and 18.4 percent of certificate programs reported having an apprenticeship opportunity associated with the program.
Ohio Examples Since very few of the Ohio schools reported offering apprenticeship opportunities, the following case studies focus on internship opportunities. Many schools are offering students the chance to earn money and college credit while refining career goals and enhancing their employability through internships.
Clark State Community College, Agricultural Engineering Technology. The Agricultural Engineering Technology students at Clark State Community College complete a 400-hour co-op in the spring of their first year that is designed to broaden the array of skills students will bring to potential employers after graduation. While many students come to the program with some type

39
of experience, co-op coordinators find areas the students have not worked in so as to expand students’ skill sets and create new job prospects. To ensure that the co-op experience is achieving its desired goals, participating students receive individualized learning objectives and goals for their co-op experience and are then evaluated every two-weeks by their employers. In classes prior to their co-op, students learn additional “world-of work” skills by updating resumes and cover letters and practice interviewing techniques.
Marion Technical College, Alternative Energy Program. As part of the process of seeking employer input for the Alternative Energy program at Marion Technical College, program developers learned that local employers were looking for job candidates with more work experience. The Alternative Energy program then added a co-op component to the program to provide their program graduates with these in-demand work experiences. As part of the co-op process, students work with faculty to find the co-op site that best matches their skills and interests. They then meet with their faculty advisor and co-op supervisor three times over the course of the experience to develop learning objectives and monitor progress. The Alternative Energy program actively recruits employers for this program and has secured the first co-op agreement between a local Honda company and a two-year co-op program. Dean of Engineering and Workforce Development Jay McCreary reported that, “Since we incorporated a required co-op portion to our program, companies are begging for our students.”
Wright State University, Environmental Sciences Internship Program. Students in the Environmental Sciences Internship Program at Wright State University spend 400 hours working with environmental practitioners from industry, business, or government. A unique feature of this program is its flexibility. Students can find their own internship site or work with the Intern Director and Wright State University Office of Career Services to find an employer. Students can choose to spend the whole internship with one employer, or they can take a multi-program approach and work with several employers. Students can also decide if they want to gain in-depth knowledge of a specific topic area (such as environmental toxicology or hazardous material treatment) or if they want to develop a breadth of knowledge by becoming involved in multiple topic areas. Students are guided through this process by the Environmental Sciences Intern Director and have a designated field counselor at their internship site. Wright State University faculty members are also available to come to the site to help the field counselor and the student plan work activities. Students complete activity reports each week of the internship, prepare a written report about their whole internship experience and present these findings as part of a required course. Department of Earth and Environmental Sciences Director for Undergraduate Programs David Schmidt reported that, “During an internship, students gain practical experience in organizing and budgeting time, projecting a professional image and interacting with co-workers. An internship allows students to ‘try on for size’ an area of work that interests them, which tends to provide greater confidence for recent graduates who are at the onset of career employment.”
Youngstown State University, Power Plant Technology. Youngstown State University’s ATS program in Power Plant Technology offers students the opportunity to complete an eight- to ten-week, compensated and evaluated power plant field experience. Youngstown State is able to offer this opportunity because of its close cooperation with local power generating companies who partner with the school to provide hands-on training opportunities to students and to serve

40
as placement sites for students in the internship program. According to Program Coordinator Daniel P. Coyne, “I can say we are doing something right, because the employers are generally pleased with our graduates and the graduating students, after going through the program, are generally pleased with their education.”

41
“A successful green-collar job-training program is built upon cross-sector partnerships. . . From curriculum development to relationships with potential employers and unions, multiple partners help ensure that the program will truly prepare participants to enter the green-collar workforce.”
-from Making Green Work: Best Practices in Green-Collar Job Training
Programs
Best Practice Six: The program is designed and implemented in partnership with the many agents involved with green jobs promotion and preparation, including labor unions, community organizations, state and local government agencies, other educators and/or employers. Explanation of Best Practice A call for partnering is one of the most frequent recommendations in the literature about effective green jobs preparation.34 The premise behind this best practice is that there are many parties involved in green jobs preparation and promotion that have the skills and resources to enhance a school’s green jobs programming. Potential partners in green jobs preparation include educators, labor unions, government agencies, community organizations and employers.
Educators. While some types of green jobs training and education may be relatively new, there are already existing curricula and other education materials available to educators developing green programming. Feldbaum advises, “Join forces with leading green community colleges or existing regional/national collaboratives to avoid reinventing the wheel. Draw on their expertise and experiences and access their resources on best practices and strategies, innovative teaching methods and curricula, technical support and networking opportunities.”35
Another reason for partnering with other educators is that green jobs preparation often involves adding green skills and credentials to traditional occupations, so a training program can often be built upon the foundation of existing programs and curricula. Educators seeking to prepare students for green jobs should take advantage of the resources already available for providing the more traditional components of a curriculum. As the Ella Baker Center notes, “Existing job training programs and educational institutions may provide a platform into which to embed green-collar curriculum and credentials (which, in turn, gives your program greater credibility and cache).”36
Labor Unions. Labor unions provide apprenticeship training, which is a key training component for some types of green jobs. Partnerships between educators and labor unions can ensure that students are prepared for necessary apprenticeships and help to avoid unnecessary duplication 34 Sources for this best practice include: Bozell and Liston, Building Effective Green Energy, 3, 27; Cleary and Kopicki, Preparing the Workforce, 9; Ella Baker Center for Human Rights, Making Green Work, 12-13; Feldbaum and States, Building a Sustainable Future, 29; Goldman et al., Energy Efficiency Services Sector, xvii; Interstate Renewable Energy Council, Best Practices Recommended Guidelines, 7; U.S. Department of Labor, Greening of Registered Apprenticeship, 22-27; and White and Walsh, Jobs and Workforce Development, 2-3, 47. 35 Feldbaum and States, Building a Sustainable Future, 29. 36 Ella Baker Center for Human Rights, Making Green Work, 13.

42
between the two phases of training. As the Ella Baker Center also notes, “Unions can help develop your curriculum so that your graduates are eligible for union apprenticeships, and they can agree to special entry linkages for your graduates.”37
Government Agencies. Government agencies and government officials can be very helpful for securing the necessary funding for green jobs training and education. Government officials can also raise the profile of efforts to establish cross-sector partnerships, making them more likely to succeed.
Community Organizations. Just as there are many types of community organizations, there are many types of roles that these organizations can play in green jobs preparation. One particularly important role played by organizations like local workforce boards is the provision of support services to students who need help in order to access green jobs training and education.
Local Employers. A typical manner in which employers partner with green jobs training and education programs is through membership on program advisory committees, as has already been mentioned frequently in this chapter. In this capacity, employers can provide input on workforce demand and desired industry credentials and skill sets. As program advisors, these representatives can also review curricula and suggest updates as industry needs evolve. Regardless of whether they participate in advisory committees, employers can also donate training equipment, serve as internship or apprenticeship sites and provide instructors with extensive experience in the field. The Interstate Renewable Energy Council (IREC) advises solar training programs to “Develop alliances and establish an active advisory committee with business and industry…for program support, potential adjunct faculty, internship opportunities, donations of equipment and supplies and news about changing technology and skill sets.”38
Nationally-Recognized Examples The Empowerhouse Team: Parsons The New School for Design and Milano The New School for Management and Urban Policy, New York, New York, in partnership with Stevens Institute of Technology, Hoboken, New Jersey. Parsons The New School for Design has been actively involved in student-based design/build projects for over ten years. For example, architecture students worked with New Orleans residents to plan and build one of the first structures erected after Hurricane Katrina, a multi-use building incorporating both an information center and much-needed laundry facilities. Despite this experience, Parsons’ lack of an engineering program made it an unlikely candidate for the Solar Decathlon, a highly selective biannual contest in which intercollegiate teams compete to design and build the most attractive, affordable and energy-efficient solar homes.
To overcome this difficulty, Parsons created the Empowerhouse team involving over 100 students, including engineering majors from nearby Stevens Institute of Technology as well as Parsons students majoring in architecture, design, media studies, environmental studies and even fashion design. Further, the team also incorporates policy and finance students from Milano The New School for Management and Urban Policy. According to Dean Joel Towers, 37 Ibid. 38 Interstate Renewable Energy Council, Best Practices Recommended Guidelines, 7.

43
this cross-discipline collaboration is critical to the pedagogical value of the project. “You’re not going to resolve complicated problems like climate change or healthcare if you don’t know how to work across disciplinary boundaries,” says Towers. “In the 21st Century, that kind of knowledge and working methodology is essential, and we want to model it for students.”
In addition, Parsons decided to approach the Solar Decathlon as a social entrepreneurship project exploring strategies for moving communities toward increased sustainability and affordability simultaneously. To that end, the Empowerhouse team is also partnering with Washington D.C.’s Department of Housing and Development; a Washington, D.C. chapter of Habitat for Humanity and the nearby community of Deamwood. In collaboration with these groups, the team will be designing and building a two-family passive solar residence. One unit will be erected by volunteers on a Deamwood housing lot donated by the city. The second unit will be built by students on the Washington Mall and, upon conclusion of the contest, will be transported to Deamwood and joined to the first unit. In addition to providing an affordable, energy efficient residence for two low-income families, the Empowerhouse team hopes to develop design solutions that can be incorporated into future home plans utilized by Habitat for Humanity chapters throughout the United States. “When I was raising money for this project,” says Dean Towers, “I encouraged people to focus not on winning the competition but on changing the housing industry.”
Finally, the Empowerhouse team also partnered with Deamwood residents during each step of the project. “The worst mistake you can make,” says Milano professor John Clinton “is parachuting in with all the answers and not learning from the community itself.” When asked to offer advice to other schools considering similar projects, Dean Towers identified this approach as the central key to success. In addition to ensuring that students respect the value of community-based knowledge, he suggests that encouraging an on-going dialogue between academia and real-world problem-solving “provides an education that enables students to be able to integrate new knowledge and respond to new challenges throughout their lives.”
Pacific Northwest Center of Excellence for Clean Energy (PNCECE) at Centralia College, Smart Grid Project, Centralia, Washington. Smart grid technology is designed to increase efficiency by enhancing a system’s ability to measure and respond to shifts in energy demand. To meet the growing need for workers in this emerging field, Centralia College’s PNCECE has taken the lead in developing the Smart Grid Project, a collaborative effort funded by the Department of Energy and involving numerous partners in five states.
One of the major components of this project is the identification of in-demand skill sets for energy workers in ten targeted occupations. To achieve this, PNCECE has partnered with industry and labor to learn about their specific needs and with Washington State University Extension’s Energy Office to establish related skill standards and career lattices. In turn, this information will serve as the basis for new or revised curriculum for community college programs such as the Power Operations Program at Centralia College as well as modules for industry to use for on-the-job training. Once these materials are produced, they will be sent to a multi-sector Smart Grid Educational Task Force which is tasked with providing oversight of the project’s educational products.
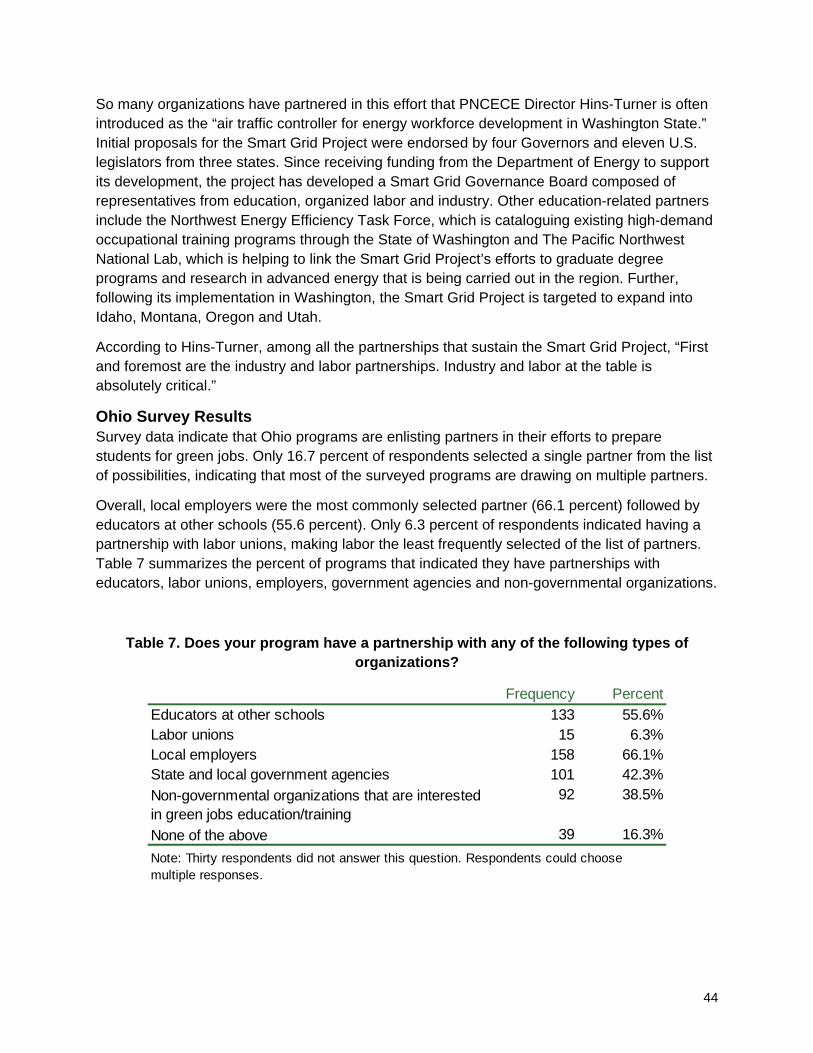
44
So many organizations have partnered in this effort that PNCECE Director Hins-Turner is often introduced as the “air traffic controller for energy workforce development in Washington State.” Initial proposals for the Smart Grid Project were endorsed by four Governors and eleven U.S. legislators from three states. Since receiving funding from the Department of Energy to support its development, the project has developed a Smart Grid Governance Board composed of representatives from education, organized labor and industry. Other education-related partners include the Northwest Energy Efficiency Task Force, which is cataloguing existing high-demand occupational training programs through the State of Washington and The Pacific Northwest National Lab, which is helping to link the Smart Grid Project’s efforts to graduate degree programs and research in advanced energy that is being carried out in the region. Further, following its implementation in Washington, the Smart Grid Project is targeted to expand into Idaho, Montana, Oregon and Utah.
According to Hins-Turner, among all the partnerships that sustain the Smart Grid Project, “First and foremost are the industry and labor partnerships. Industry and labor at the table is absolutely critical.”
Ohio Survey Results Survey data indicate that Ohio programs are enlisting partners in their efforts to prepare students for green jobs. Only 16.7 percent of respondents selected a single partner from the list of possibilities, indicating that most of the surveyed programs are drawing on multiple partners.
Overall, local employers were the most commonly selected partner (66.1 percent) followed by educators at other schools (55.6 percent). Only 6.3 percent of respondents indicated having a partnership with labor unions, making labor the least frequently selected of the list of partners. Table 7 summarizes the percent of programs that indicated they have partnerships with educators, labor unions, employers, government agencies and non-governmental organizations.
Table 7. Does your program have a partnership with any of the following types of organizations?
Frequency PercentEducators at other schools 133 55.6%Labor unions 15 6.3%Local employers 158 66.1%State and local government agencies 101 42.3%Non-governmental organizations that are interested in green jobs education/training
92 38.5%
None of the above 39 16.3%Note: Thirty respondents did not answer this question. Respondents could choose multiple responses.

45
Survey respondents were also asked about the nature of their partnerships with these organizations. Table 8 summarizes respondents’ answers to questions about the services provided by program partners.
Table 8. Services Provided by Program Partners
Educators at other schools
(n=133)
Labor Unions (n=15)
Local Employers
(n=158)
State and Local
Government Agencies (n=101)
Non-Governmental Organizations
(n=92)
Percent Percent Percent Percent Percent
Assistance with curriculum development 37.7% 63.6% 60.4% 31.9% 38.4%
Review existing curriculum 52.6% 72.7% 68.8% 36.3% 43.8%
Participation in the program's advisory committee 49.1% 90.9% 81.2% 47.3% 64.4%
Help with internship, co-op, and/or apprenticeship opportunities for students 25.4% 72.7% 78.6% 61.5% 53.4%
Assistance with job placement for students 19.3% 72.7% 65.6% 47.3% 47.9%
Assistance with student referrals 71.9% 81.8% 63.0% 57.1% 57.5%
Donation of training equipment 11.4% 27.3% 48.1% 14.3% 26.0%
Teaching assistance (serving as guest instructors or adjunct faculty, providing tours of relevant facilities, etc.) 40.4% 63.6% 63.6% 37.4% 35.6%
Other 6.1% 9.1% 2.6% 4.4% 1.4%
• The most common purpose of partnerships with educators is curriculum review and membership on a program’s advisory committee.
• The most common purposes behind partnerships with labor unions are membership on a program’s advisory committee and referral of students to the program.
• The most common services provided by local employers are participation on a program advisory committee and help with internship or apprenticeship opportunities.
• State and local government agencies appear to most frequently provide help with internship and apprenticeships as well as with making referrals to the program.
• Non-governmental organizations most frequently participate in advisory committees and make referrals to green jobs training or education programs.
When the data are sorted by degree type, certificate and associate’s programs appear most likely to partner with local employers (95.2 percent and 88.2 percent, respectively). No bachelor’s programs indicated partnering with a labor union.
Ohio Examples The case studies in this section provide illustrations of partnerships that include industry, education, community organizations and government agencies.

46
Stark State College of Technology, Fuel Cell Technology. Stark State College’s Fuel Cell Technology program has forged extensive partnerships with industry, government and other educators. Stark State is a part of the Great Lakes Fuel Cell Education Partnership, a six-state collaboration focusing on advancing fuel cell education and training. Partnerships with the Ohio Department of Development and Ohio Third Frontier have provided funding for training equipment that allows the school to be one of only a few training labs with piped-in hydrogen. Another major partner is Rolls-Royce Fuel Cell Systems, Inc., which is the charter tenant of Stark State’s Fuel Cell Prototyping Center. Rolls-Royce has provided cost sharing support for the program and provides students with hands-on training opportunities. According to Director of Alternative Energy Susan Shearer, it has been “a real blessing to have the Rolls-Royce advanced technology team in our backyard.”
Lorain County Community College, Wind Technology Program. The Wind Technology Program at Lorain County Community College has partnered with many types of organizations to enhance students’ experiences and to share resources with others. For example, while many wind programs have difficulty providing hands-on training for utility-scale wind turbines, the program at Lorain County Community College has obtained access to the 225 kilowatt Vestas wind turbine at the Great Lakes Science Center for utility-scale training. In addition, the program has established curriculum sharing agreements with Lakeland Community College, Stark State and Cuyahoga County Community College. The program draws on the expertise of members of the International Brotherhood of Electrical Workers, NASA, the Great Lakes Science Center and Case Western University to inform curricular decisions and locate potential internship sites. These relationships also help the Wind Technology Program identify guest speakers for green technology forums. Program Coordinator Duncan Estep says these and other partnerships help the school “keep meeting the real needs of industry.”
Bowling Green State University, Supply Chain Management. The relationship between industry and the Supply Chain Management Program at Bowling Green State University is formalized in the Supply Chain Management Institute, created in 2000. According to Institute Director Janet Hartley, the institute is composed of representatives from 17 local and national companies and was formed to “…help us build stronger partnerships with industry.” Institute members help to add real-world content to supply chain classes by providing guest speakers, serving as internship sites and providing input on curricular decisions. The Institute also encourages on-going dialogue between players in the evolving discipline of supply chain management through regular on-campus meetings. One recent gathering was held in partnership with the Toledo affiliate of the National Association of Purchasing Management and brought together over 160 students, faculty and supply chain management professionals.
Ohio University, Master of Science in Environmental Studies. The Ohio University Environmental Studies Program partners with local non-profit organizations and government agencies to offer students an alternative to a traditional thesis. Students are given the option of performing a 100+ hour leadership project. For example, one student is currently helping a local nonprofit watershed group to investigate a potentially controversial waterway improvement effort by researching the technical requirements of the job, identifying potential funding sources and conducting a public opinion survey with local residents. Similarly, another student recently

47
worked with the City of Athens to assess the effect of parking regulations on local driving habits and to use this information to inform future parking policy decisions. These partnerships provide real-world experience for students as well as capacity-enhancing assistance for local nonprofit and government agencies.

48
Best Practice Seven: The program is purposefully situated within a larger green career pathway. This may entail transfer articulation agreements with other schools, outreach to secondary schools, etc. Explanation of Best Practice This best practice suggests that, “To the extent possible and relevant, green job training should be developed in a career pathways framework.”39 This means applying the traditional career pathways approach within a newer, green context.
Traditional Career Pathways Career pathways are defined as “a series of connected education and training programs and support services that enable individuals to secure employment within a specific industry or occupational sector and to advance over time to successively higher levels of education and employment in that sector.”40 Career pathways thus focus on two parallel progressions– among occupations on the one hand and training/education credentials on the other hand – within a given industry or occupational field. The core purpose of the model is to align a continuum of degrees or certifications with a continuum of occupations through which a student or worker can progress in strategically targeted industries. Many of the sources cited in this section include helpful diagrams or tables depicting career and/or program progressions.
To identify the skills, knowledge and abilities relevant to each portion of the career pathway, some pathways are built on competency models such as those designed by the Center for Energy Workforce Development (CEWD) for energy generation, transmission and distribution or the green construction competency model developed by the State of Missouri.41 A competency model is a collection of capabilities that together define successful performance in a particular work setting.42 In partnership with industry representatives, the U.S. Department of Labor (DOL) has developed competency models in high-growth industries and areas of emerging technology, including some that are particularly significant for green-related education and training purposes in Ohio. Examples of these are advanced manufacturing, aerospace, automation, bioscience, construction, energy, mechatronics and water sector.43
Career pathway models can take a variety of forms. They may be conceptual models, industry- or career-oriented models, or region-specific models. Conceptual models typically illustrate transitions from one stage of education or supports to another and can include the following types of transitions:
39 White and Walsh, Jobs and Workforce Development; 2, 7, 47. Other sources for this best practice include: Cleary and Kopicki, Preparing the Workforce, 9-10; Ella Baker Center for Human Rights, Making Green Work, 17-18; Feldbaum and States, Building a Sustainable Future, 15; Jenkins and Spence, Career Pathways, 1-26; and Woodrum, Building Green Pathways. 40 Jenkins and Spence, Career Pathways, 2. 41 Center for Energy Workforce Development, Energy Industry Competency Model; and Missouri Department of Economic Development, Green Industry Competency Model. 42 “Competency Model Clearinghouse,” CareerOneStop, accessed May 23, 2011, http://www.careeronestop.org/competencymodel/. 43 Ibid.

49
• High school to community college • Job readiness and wrap-around support services to pre-college preparation such as
Adult Basic Literacy Education (ABLE), GED or ESL to post-secondary credits • High school or GED to short-term industry/occupation certificate • Short-term industry/occupation certificate to one-year or two-year technical diploma • Technical diploma or credentials to associate’s degree • Associate’s degree to bachelor’s degree • Bachelor’s degree to advanced post-secondary degree
There are numerous versions of conceptual career pathway models, some of which can be found in reports focusing on green-related career pathways.44
Generic industry-oriented or career-oriented pathway models are meant to be generally applicable in a given industry or career field but are not specific to a geographic area. Examples that are pertinent to green jobs include energy efficiency/weatherization and manufacturing.45 Region-specific career pathways apply conceptual, industry-oriented, or career-oriented pathway models to a specific region and facilitate progressions among certification/degrees offered by a specific institution or institutions. Institutions in the State of Oregon, for example, have developed over 250 different career pathway roadmaps and over 150 career pathway certificates which are posted online.46 Some of these illustrate pathways within single institutions while others illustrate pathways among two or more institutions.
While all definitions of career pathway approaches are not identical, common elements include the following:
• A data-driven focus on high-demand and high opportunity jobs in strategically targeted industries within a region;
• Education and training programs that are responsive to employer demand within the region in terms of both quantity (matching supply with demand) and quality (ensuring that curriculum addresses employer-identified competencies);
• Clear and transparent roadmaps illustrating sequences of education and training leading to credentials that are meaningful among employers;
• An institutional scope that stretches from secondary education through adult career centers, two-year colleges and four-year universities;
• Partnerships among multiple entities, often coordinated by an intermediary institution;
44 White and Walsh, Greener Pathways, 7; and van Lier, Woodrum, and Gordon, Mapping Green Career Pathways, 5. 45 Marcy Drummond, “Training a Green Pipeline” (lecture, California Utilities Diversity Council Green Energy Summit, Sacramento, CA, June, 2010); Bozell and Liston, Effective Green Energy Programs, 11; Jennifer M. Cleary, “Addressing Employer Skill Needs” (lecture, New Ideas in Educating a Workforce in Renewable Energy and Energy Efficiency National Conference, Albany, NY, November 18-20, 2009); and Workforce Development Council of Seattle-King County, Map Your Career. 46 “Career Pathways,” MyPathCareers.org, accessed May 23, 2011, http://www.mypathcareers.org/resources/career-pathways.
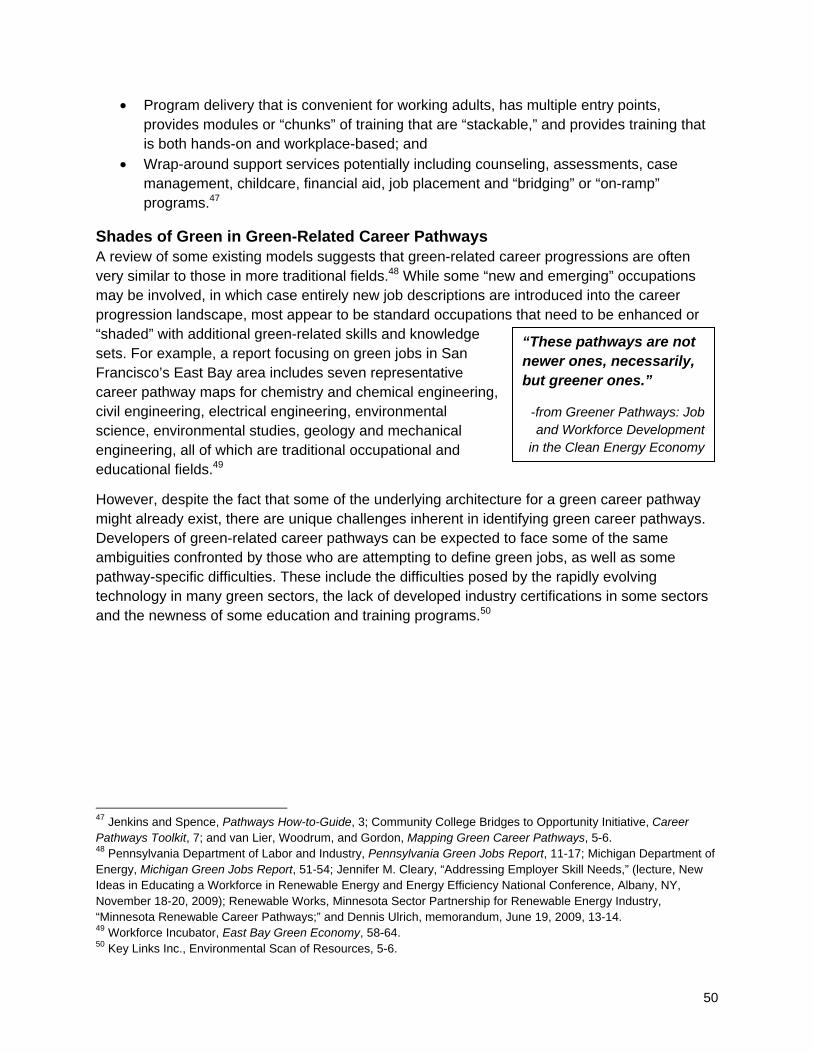
50
“These pathways are not newer ones, necessarily, but greener ones.”
-from Greener Pathways: Job and Workforce Development
in the Clean Energy Economy
• Program delivery that is convenient for working adults, has multiple entry points, provides modules or “chunks” of training that are “stackable,” and provides training that is both hands-on and workplace-based; and
• Wrap-around support services potentially including counseling, assessments, case management, childcare, financial aid, job placement and “bridging” or “on-ramp” programs.47
Shades of Green in Green-Related Career Pathways A review of some existing models suggests that green-related career progressions are often very similar to those in more traditional fields.48 While some “new and emerging” occupations may be involved, in which case entirely new job descriptions are introduced into the career progression landscape, most appear to be standard occupations that need to be enhanced or “shaded” with additional green-related skills and knowledge sets. For example, a report focusing on green jobs in San Francisco’s East Bay area includes seven representative career pathway maps for chemistry and chemical engineering, civil engineering, electrical engineering, environmental science, environmental studies, geology and mechanical engineering, all of which are traditional occupational and educational fields.49
However, despite the fact that some of the underlying architecture for a green career pathway might already exist, there are unique challenges inherent in identifying green career pathways. Developers of green-related career pathways can be expected to face some of the same ambiguities confronted by those who are attempting to define green jobs, as well as some pathway-specific difficulties. These include the difficulties posed by the rapidly evolving technology in many green sectors, the lack of developed industry certifications in some sectors and the newness of some education and training programs.50
47 Jenkins and Spence, Pathways How-to-Guide, 3; Community College Bridges to Opportunity Initiative, Career Pathways Toolkit, 7; and van Lier, Woodrum, and Gordon, Mapping Green Career Pathways, 5-6. 48 Pennsylvania Department of Labor and Industry, Pennsylvania Green Jobs Report, 11-17; Michigan Department of Energy, Michigan Green Jobs Report, 51-54; Jennifer M. Cleary, “Addressing Employer Skill Needs,” (lecture, New Ideas in Educating a Workforce in Renewable Energy and Energy Efficiency National Conference, Albany, NY, November 18-20, 2009); Renewable Works, Minnesota Sector Partnership for Renewable Energy Industry, “Minnesota Renewable Career Pathways;” and Dennis Ulrich, memorandum, June 19, 2009, 13-14. 49 Workforce Incubator, East Bay Green Economy, 58-64. 50 Key Links Inc., Environmental Scan of Resources, 5-6.

51
Career Pathways and Other Best Practices In many respects this best practice can be viewed as the culmination of the preceding best practices. While the previous six best practices may be implemented for their own sake and do not need to be premised on a desire to build a unified educational and employment track, to varying degrees they are all components of a successful effort to develop a green career pathway. The first best practice (“The training program and its curriculum are based on an assessment of regional workforce demands”) requires the type of assessment that is needed in order to target the industries or occupations for which the career pathway will be developed. The second best practice (“The program’s curriculum is informed by industry input”) involves securing information about relevant competencies, credentials and certifications that are needed to map out the types of training an individual must acquire to advance through a career pathway. The third best practice (“The program has clearly defined strategies for measuring success, such as ongoing assessments of curricula and learning outcomes”) is less obviously tied to the career pathways approach, but it does include the type of curricular review that is necessary to maintain an institution’s relevance to a career pathway and is clearly consistent with the continuous improvement model that is recommended for career pathway development.51
The fourth best practice (“The program includes hands-on training with equipment of the type likely to be used in the workplace”) requires the type of information about current technologies that is needed to successfully map out the competencies individuals must acquire as they progress through a career pathway. The fifth best practice (“The program provides workplace experience for students through internship or apprenticeship opportunities”) provides students with the opportunity to make connections and gain experiences that will advance them on their career pathway and requires a mapping out of the correct linkages between education and training programs and occupation-specific work experiences. Finally, the sixth best practice (“The program is designed and implemented in partnership with the many agents involved with green jobs promotion and preparation”) is a key feature of career pathway development. Not only are partnerships needed to conduct the pathway mapping process, but partnerships are necessary to build the linkages that facilitate students’ and workers’ progression along the defined pathway.
Nationally-Recognized Example Austin Community College, Renewable Energy Programming, Austin, Texas. Austin Community College (ACC) has purposefully developed its renewable energy training programs to meet the workforce development needs of a diverse student body. Beginning in 2004 with an entry-level solar installer certificate program, the program has grown into a wide array of credit and non-credit courses. This growth has been designed to encourage entry-level students to embark upon green energy careers and to help more experienced workers to advance within their chosen professions.
To make sure potential students have the information and support they need to begin renewable energy training, ACC has worked closely with area workforce boards and other community organizations. Through these partnerships they have developed the “Cool Austin Jobs” website 51 Jenkins and Spence, The Career Pathways How-to Guide, 5-6, 22-25.
52
to provide guidance about the renewable energy industry and related ACC programs. In addition, agreements with local workforce boards have been established under which ACC agrees to offer trainings on a flexible schedule to meet the needs of participating students. In return, the workforce board recruits participants, pays their tuition, provides wrap-around services such as assistance with transportation or childcare and offers career and placement services.
Through a one-year grant from the Department of Labor’s Women’s Bureau, ACC has also launched a “Women in Green” campaign to encourage more women to enter the renewable energy field. The campaign included extensive outreach in the form of focus groups, a speaker’s bureau, a “Women in Green” website, a telephone hotline and the collaboration of local workforce boards and non-profit agencies. In some of the targeted training classes, female enrollment rapidly grew from 10 percent to 75 percent.
ACC has also made a concerted effort to identify the specific features of the green career pathways their students are on, as opposed to more traditional career pathways. ACC has participated in the Texas I-35 Renewable Energy Corridor Consortium, which has performed a systematic assessment of certain renewable energy curricula for all schools along the I-35 corridor between Dallas and San Antonio. The purpose of the review was to identify the places where green skills needed to be added or updated and then to make these “greened” curricula available throughout the state. ACC also serves as a NABCEP testing facility and students regularly sit for the NABCEP PV Entry Level Exam. At times, students have been able to accrue enough installation experience on community-based projects to qualify for the more advanced NABCEP PV Installer Certification Exam.
These continuing efforts to track the evolving skill sets and credentialing requirements of green occupations, as well as extensive efforts to attract and support students, mean that Austin Community College is positioned to help a wide array of students to enter and advance in the renewable energy field.
Ohio Survey Results Surveyed programs were asked about a few specific elements of career pathways, including outreach to secondary schools, articulation agreements and program-specific career and placement services. Table 9 summarizes their responses.

53
Table 9. Which of the following statements apply to your program?
Frequency PercentThe program performs outreach to secondary schools (K-12 system) to recruit students.
118 57.3%
The program has transfer articulation agreements in place with other schools.
129 62.6%
Students in the program are provided with program-related career counseling and job placement services.
154 74.8%
Note: Sixty-three respondents did not answer this question. Respondents could choose multiple responses.
Transfer articulation agreements are most associated with programs that produce associate’s degrees (91.0 percent). Associate’s programs were also the degree type that most frequently indicated performing outreach to secondary schools (71.8 percent).
Ohio Examples The following case studies include an example of a systematic effort to map out green career pathways for one region in Ohio. The additional case studies provide information on how other Ohio schools have been able to implement some of the components of green career pathways, including articulation agreements and outreach.
Lakeland Community College, Biotechnology Science Associate Degree and Certificate. The Biotechnology Science program at Lakeland Community College has a number of arrangements in place to help pave students’ way along a green career pathway. For students entering the program, opportunities exist to receive college credit for biotechnology courses their senior year of high school through a pilot program with Ohio’s TechPrep program. Department of Labor Biotechnology scholarships are also available for entering students who are unemployed, dislocated, or incumbent workers. For students already at the college level, Lakeland Community College has transfer agreements for biotechnology courses with Ursuline College, Case Western Reserve, Kent State University and Cleveland State University. An additional agreement allows Ursuline College students to complete biology requirements with Lakeland's Biotechnology Science courses and allows Lakeland students to transfer to Ursuline College with junior-level status.
Penta Career Center, HVAC/R Program. Penta Career Center’s Adult HVAC/R training program is approved by the Toledo Heating and Air Conditioning Contractors Association as a substitute for the required 576 hours of classroom training needed in an apprenticeship program. As a result, graduates hired as apprentices do not need to go back to school or repeat classes. Students are attracted to the program through outreach activities to the Adult Basic and Literacy Program and social agencies, as well as targeted mailings and collaboration with Catholic Charities and the Ohio Department of Job and Family Services. Students at Penta

54
Career Center may also take advantage of articulation agreements with Owens Community College and Franklin University.
Zane State College, Energize Appalachian Ohio Program. According to Program Director Dan Durfee, Zane State College’s Energize Appalachian Ohio Program has been carefully “situated within a larger green energy career pathway.” The program is a Department of Labor-funded effort to provide customized training to unemployed, incumbent and dislocated workers in the energy industry. In partnership with many educators, employers and government agencies, the program targets 94 occupations and designs programming that gives workers the basic and cross-functional technical skills needed to help them gain employment or advance in their current job. Enrolled students are provided with job placement and retention services and program coordinators also work with local WIA agencies to ensure they receive employability skills training and have access to any required supportive services.
Region 5 Workforce Collaborative. Multiple partners in this Economic Development Region established the Region 5 Workforce Collaborative (R5WC) in 2008 in order to develop a career pathway approach for meeting workforce development needs in the areas of health care, advanced manufacturing and green jobs. R5WC is composed of 16 member organizations including adult career-technical centers, community colleges, universities, workforce development consortia, state and local government agencies, a distance learning center and Workforce Investment Boards. To develop the career pathway related to green jobs, R5WC’s Green Job Task Force compiled a list of close to 80 green-related training programs in the region and identified their linkages with environmental, mechanical, electrical and construction-related job tracks. The task force then developed a job ladder from entry-level to higher-level job classifications and aligned educational requirements with each job level. The task force chose to prioritize the development of the construction track in order to take advantage of complementary work being done by the Greater Cincinnati Workforce Network.
Dennis Ulrich, Executive Director of the Workforce Development Center at Cincinnati State Technical and Community College, says that two of the initial challenges faced by R5WC were making sense of a complicated green jobs landscape and building collaborative relationships among all partners. Beginning with a narrower focus on construction-related green jobs was one way to tackle the difficult green jobs landscape. As for fostering collaboration among partners, says Ulrich, “People had to sublimate their primary interest, which is generating revenue as stand-alone entrepreneurial units.” Once this barrier was overcome, a career pathways framework was able to highlight the complementary nature of much of the region’s green jobs resources.
55
Green Pathways Database Introduction The greening of the economy presents both opportunities and challenges for Ohio’s education and workforce development community, as reviewed in the introduction to this report. Many institutions within the University System of Ohio have made substantial progress in addressing these issues, as illustrated by the case studies and survey results provided in the preceding chapter. These programs include green-specific ones such as those focusing on renewable energy and green building as well as more traditional programs that have been enhanced with green-related content such as those focusing on manufacturing, engineering or environmental sciences. Currently, however, there is no centralized resource that educators, workforce and economic development professionals, employers and those seeking jobs or education can utilize to access information about how USO programs relate to occupations and sectors within the green economy.
This chapter describes the development of a Green Pathways Database including over 1,300 green-related programs within the USO. Building upon the previous work of the Ohio Board of Regents, the Ohio Environmental Council and the Ohio Green Pathways Advisory Panel, this database is intended to assist:
• Education and job-seekers who are interested in obtaining information about programs that may prepare them for careers related to the green economy;
• Employers who are seeking information about programs that can train workers with the knowledge and skills required in the green economy;
• Educators who are seeking information to help them develop green-related programs or to identify complementary programs that could be linked together through career pathway approaches or other partnerships;
• Economic development professionals who need program and occupation information in order to support business attraction and retention efforts;
• Workforce development professionals who need program and occupation information in order to effectively guide education- and job-seekers; and
• Policymakers looking to assess, support, expand, or fill gaps in Ohio’s green-related education and training infrastructure.
In developing content for the database, the Voinovich School reviewed several existing websites as examples of how green jobs information can be organized and provided in an online environment.52 Information from the resulting database will be provided in searchable format at two complementary websites: http://ohiolmi.com/research/research.htm (to be established by the Ohio Department of Job and Family Services) and http://www.ohiogreenpathways.org (to be established by the Ohio Board of Regents). These websites will provide users with the opportunity to search for green-related education programs in multiple ways including by sector,
52 See, for example, http://www.careeronestop.org/; http://www.mypathcareers.org/; http://www.onetonline.org/; http://ohiolmi.com/asp/SB/SkillsBank.htm; http://www.iseek.org/.

56
occupation, economic development region and type of degree or certificate. For example, individuals interested in pursuing a career in renewable energy could access a list of occupations linked to the renewable energy sector and the degree and certificate programs which may prepare them for these occupations. Alternatively, education seekers can search for a particular type of degree program, such as an associate’s degree, to see the green occupations and related educational opportunities in that degree category available in their region.
The remainder of this chapter provides an overview of the information contained in the Green Pathways Database, the sources and methods used to develop the database and some methodological issues related to developing and maintaining the database. A more detailed methodological description is provided in Appendix G.
Data Sources The database contains three main types of information:
• Green-related occupations linked to sectors of the green economy; • Green-related degree and certificate programs offered within the USO; and • A crosswalk which links programs to occupations.
Figure 1 provides an illustration of the key information categories in the database.
Figure 1. Key Information in Database

57
Green-Related Occupations and Sectors A list of green-related occupations linked to twelve green economy sectors was obtained from The Greening of the World of Work, a report published by the Occupational Information Network.53 O*Net is a primary source of occupational information in the U.S, providing detailed information including knowledge, skills and tasks for each occupation.
The introduction to this report provides definitions of the twelve green economy sectors and three types of green-related occupations defined by O*Net: increased demand, enhanced skills and new and emerging. These categories include traditional occupations which have increased in demand due to the green economy as well as occupations for which the required skills and knowledge have been substantially impacted by green economy activities and technologies. These occupations are listed in Appendix B.
The sector-occupation linkages in the O*Net framework enable database users to see more specifically the aspects of the green economy to which each occupation is related. In addition, O*Net’s three categories of occupations can provide database users with a basic understanding of why each occupation is characterized as green.
Green-Related Education and Training Programs A list of green-related certificate and degree programs within the USO was generated through a multi-stage research and screening process which built upon work previously completed by the Ohio Board of Regents, the Ohio Environmental Council and the Ohio Green Pathways Advisory Panel through the Ohio Green Pathways Project.54 As a result of this work, a catalog of green-related programs in the USO’s two-year schools was produced in 2010, profiling over 500 programs at 23 community colleges and 13 adult career centers across the State of Ohio. 55 A similar catalog for four-year schools within the USO was in development when Ohio University began work on the program database, and a draft of this catalog was provided to Ohio University by OEC in November, 2010.
In addition, in August, 2010, the researchers directly contacted 96 institutions within the USO – including two-year schools, four-year schools and adult career centers – to solicit information about green-related programming. Finally, a search of college and university websites was conducted to identify additional green-related programs not captured previously.
The lists of green-related education programs were then combined and duplicates removed. The resulting list of programs was screened through additional web searches in order to determine the status of the program and to collect general program information.
Classification of Instructional Program (CIP) codes were assigned to each program to facilitate the linking of programs to occupations within the program database. The CIP coding system is
53 Dierdorff et al., Greening of the World. 54 See “Ohio Green Pathways Advisory Panel,” University System of Ohio, accessed April 25, 2011, http://www.uso.edu/opportunities/sustainability/green-pathways/index.php; and “Ohio Green Pathways: Unleashing the Power of Green,” Ohio Environmental Council, accessed April 25, 2011, http://www.theoec.org/Pathways.htm. 55 See “Ohio Green Pathways”, link to development of a program catalog and Web site, Ohio.gov: University System of Ohio, accessed April 25, 2001, http://www.uso.edu/opportunities/sustainability/green-pathways/documents /GreenPathwaysCatalog.pdf.

58
produced and periodically updated by the National Center for Education Statistics (NCES) within the U.S. Department of Education and is commonly used for classifying post-secondary instructional programs in the United States.56
Linking Occupations and Programs The Occupational Supply Demand System (OSDS)57 was utilized to help draw connections between occupations and the identified green-related programs. OSDS links the Standard Occupational Classification (SOC) codes contained in the O*Net data to the CIP codes assigned to the programs. This linkage is what permits users to identify programs that provide the skills and knowledge required for each occupation included in the database.
Database Methodological Issues Appendix G provides a detailed description of several methodological challenges encountered during the development of the Green Pathways Database. These limitations are summarized here.
First, the definition of green-related education and training programs is open to interpretation, and USO institutions that have identified green-related programs to date have not utilized identical criteria. For example, some of the institution-identified programs are linkable to green-related occupations and some are not. All programs identified by institutions were included in the database along with information about whether or not each is linked to a green occupation. For approximately nine percent of the programs in the database (124 out of 1,327), a link between the program and one of the green occupations identified by O*Net could not be established.
Second, the Integrated Postsecondary Educational Data System (IPEDS) was consulted as a potential source for information on green-related programs in the USO since it is a recognized source of information on post-secondary educational programs and institutions in Ohio and the nation. The IPEDS database includes CIP codes for all listed programs, and in combination with the SOC-CIP crosswalk from OSDS, it may be used to identify additional green-related programs that are not included in the Green Pathways Database. However, because there is no program name field that exists in both datasets to use to match a program in one dataset to the other, these two databases cannot be merged.
IPEDS provides a different picture of the number of green-related programs within the USO and the distribution of programs across program and institution types, compared to the Green Pathways Database. To illustrate this, Appendices H and I include tables and maps regarding green-related programs in the USO based on IPEDS data.
Third, the assignment of CIP codes to programs presents methodological challenges. In relation to maintaining the Green Pathways Database, these challenges will continue to arise. Because institutions typically assign CIP codes to their own programs, very similar programs may be
56 “Integrated Postsecondary Education Data,” IES National Center for Education Statistics, accessed May 27, 2011, http://nces.ed.gov/ipeds/cipcode/Default.aspx?y=55. 57 “Occupational Supply Demand System,” Georgia Career Information Center, accessed May 23, 2011, http://www.occsupplydemand.org/.

59
assigned different CIP codes by different institutions. Therefore similar programs may not consistently link to the same green-related occupations within the database.

60
References Advanced Technology Environmental and Energy Center. “DACUM=Developing A CurriculUM.”
http://www.ateec.org/learning/instructor/dacum.htm. American College & University Presidents’ Climate Commitment. “Signatory List by State.”
http://www.presidentsclimatecommitment.org/signatories/list/state. American Wind Energy Association. “AWEA Seal of Approval Program.”
http://www.awea.org/learnabout/education/awea_soa.cfm. Association for the Advancement of Sustainability in Higher Education. Sustainability Curriculum
in Higher Education: A Call to Action. Lexington, KY: Association for the Advancement of Sustainability in Higher Education, 2010. http://www.aashe.org/files/A_Call_to_Action_final (2).pdf.
Bezdek, Roger H., Robert M. Wendling, and Paula DiPerna. “Environmental Protection, the Economy, and Jobs: National and Regional Analyses.” Journal of Environmental Management 86 (2008): 63-79.
Bolin, Barbara. The Role of Context and Transferability in Learning from Promising Practices: A Report from the Midwestern Education to Workforce Policy Initiative and the MHEC Promising Practices Series. Minneapolis, MN: Midwestern Higher Education Compact, 2008. http://www.mhec.org/pdfs/031808pp-context&trnsferability.pdf.
Bozell, Maureen, and Cynthia Liston. Building Effective Green Energy Programs in Community Colleges. New York: Workforce Strategy Center, 2010. http://www.workforcestrategy .org/images/pdfs/publications/green_energy_programs_2010-05.pdf.
Bureau of Labor Statistics. “Green Jobs.” http://www.bls.gov/green/ Bureau of Labor Statistics. “Measuring Green Jobs: The BLS Green Jobs Definition.”
http://www.bls.gov/green/home.htm#definition. Bureau of Labor Statistics. “Standard Occupational Classification.”
http://www.bls.gov/soc/home.htm CareerOneStop. “Advanced Manufacturing Competency Model.”
http://careeronestop.org/competencymodel/pyramid.aspx?hg=Y. CareerOneStop. “Competency Model Clearinghouse.”
http://www.careeronestop.org/competencymodel/. CareerOneStop. “Pathways to Career Success.” http://www.careeronestop.org/. Center for Energy Workforce Development. Energy Industry Competency Model: Generation,
Transmission and Distribution. Washington DC: Center for Energy Workforce Development, (n.d.). http://www.cewd.org/documents/energymodel.pdf.
Chapple, Karen, Malo Hutson, Cynthia Kroll, T. William Lester, Larry Rosenthal, Emilio Martinez de Velasco, Ana Mileva, Sergio Montero, Anita Roth, and Laura Wiles. Innovating the Green Economy in California Regions. Berkeley: Center for Community Innovation, 2010. http://communityinnovation.berkeley.edu/reports/cci-ucb_innovating-green-econ-ca-regions _2010.pdf.
Cleary, Jennifer M. “Addressing Employer Skill Needs with Green Talent Networks.” Presented at the New Ideas in Educating a Workforce in Renewable Energy and Energy Efficiency National Conference, Albany, NY, November 18-20, 2009. http://irecusa.org/wp-content/uploads/2009/11/Cleary.pdf.
Cleary, Jennifer, and Allison Kopicki. Preparing the Workforce for a “Green Jobs” Economy. New Brunswick, NJ: John J. Heldrick Center for Workforce Development, 2009. http://gseta.typepad.com/Heldrich%20Center_Green%20Jobs%20Brief.pdf.
Collaborative Economics. Many Shades of Green: Regional Distribution and Trends in California’s Green Economy. San Francisco: Next 10, 2011. http://next10.org/next10/publications/pdf/2011_Many_Shades_of_Green_FINAL.pdf.
61
Columbus State Community College Business and Industry Division. Ohio Stackable Certificates: Models for Success. Columbus, OH: Community Research Partners, 2008. http://www.communityresearchpartners.org/uploads/publications/Ohio_Stackable _Certificates_Models_for_Success.pdf.
Community College Bridges to Opportunity Initiative. Career Pathways Toolkit. New York: Workforce Strategy Center, 2007. http://www.communitycollegecentral.org/careerpathways /careerpathways03272007.pdf.
Dierdorff, Erich C., Jennifer J. Norton, Donald W. Drewes, Christina M. Kroustalis, David Rivkin, and Phil Lewis. Greening of the World of Work: Implications for O*NET®-SOC and New and Emerging Occupations. Raleigh, NC: National Center for O*NET Development, 2009. http://www.onetcenter.org/dl_files/Green.pdf.
Drummond, Marcy. “Developing, Cultivating, and Training a Green Pipeline.” Presented at the California Utilities Diversity Council Green Energy Summit-Advanced Diversity in the New Green Energy Economy, Sacramento, CA, June 2010. http://college.lattc.edu/green/files/2010/08/CUDC-Green-Summit_06_28_2010.pdf.
Ella Baker Center for Human Rights, Green-Collar Jobs Campaign. Making Green Work: Best Practices in Green-Collar Job Training. Oakland: Ella Baker Center, 2011. http://www.ellabakercenter.org/downloads/gcjc/making-green-work.pdf.
Endel, Barbara, and Christopher Spence. The Ohio Skills Bank: Innovations and Promising Practices. Cincinnati: KnowledgeWorks Foundation, 2009. http://www.shifting-gears.org/images/ohioskillsbankinnovations.pdf.
Feldbaum, Mindy, and Hollyce States. Going Green: The Vital Role of Community Colleges in Building a Sustainable Future and Green Workforce. Washington, DC: National Council for Workforce Education and the Academy for Educational Development, 2009. http://www.aed .org/Publications/loader.cfm?url=/commonspot/security/getfile.cfm&pageid=29784.
Georgetown University: Center on Education and the Workforce. State of Green: The Definition and Measurement of Green Jobs. Washington DC: Georgetown University, 2010. http://cew.georgetown.edu/uploadedfiles/Literature%20Review_Green.pdf.
Georgia Career Information Center, Georgia State University. “Occupational Supply Demand System.” Last modified February 2011. http://www.occsupplydemand.org/.
Goldman, Charles A., Jane S. Peters, Nathaniel Albers, Elizabeth Stuart, and Merrian C. Fuller. Energy Efficiency Services Sector: Workforce Education and Training Needs. Berkeley: Ernesto Orlando Lawrence Berkeley National Laboratory, Environmental Energy Technologies Division, 2010. http://eetd.lbl.gov/EA/EMP/reports/lbnl-3163e.pdf.
Green for All. Green Pathways out of Poverty: Workforce Development Initiatives. Oakland: Green for All, [2009?]. See link to PDF. http://www.greenforall.org/what-we-do/building-a
-movement /community-of-practice/green-pathways-out-of-poverty-workforce-development-initiatives.
IES National Center for Education Statistics. “Integrated Postsecondary Education Data System (IPEDS): CIP 2010.” http://nces.ed.gov/ipeds/cipcode/Default.aspx?y=55.
Interstate Renewable Energy Council. IREC Renewable Energy Training: Best Practices Recommended Guidelines. Latham, NY: Interstate Renewable Energy Council, 2010. http://irecusa.org/wp-content/uploads/2009/10/BestPracticesFormatted2010Final2410.pdf.
iSeek: Minnesota’s Career, Education, and Job Resource. “What do You Seek?.” http://www.iseek.org/.
Jenkins, Davis, and Christopher Spence. The Career Pathways How-to-Guide. New York: Workforce Strategy Center, 2006. http://www.workforcestrategy.org/images/pdfs/publications/WSC_howto_10.16.06.pdf.
Key Links Inc. Green Career Pathways Statewide Roadmap Project: Environmental Scan of Resources. Portland, OR: Key Links, 2010. See link to PDF. http://worksourceoregon.org/index.php/career-pathways/398-green-statewide-career
62
-pathway-roadmaps-project. Kuenzi, Jeffrey J. “Science, Technology, Engineering, and Mathematics (STEM) Education:
Background, Federal Policy, and Legislative Action.” Congressional Research Service Reports (January 2008). http://digitalcommons.unl.edu/cgi/viewcontent.cgi?article=1034&context=crsdocs.
Michigan Department of Energy, Labor and Economic Growth. Michigan Green Jobs Report 2009: Occupations & Employment in the New Green Economy. Detroit, MI: Michigan Department of Energy, Labor and Economic Growth, 2009. http://www.milmi.org/admin/uploadedPublications/1604_GreenReport_E.pdf.
Mariani, Matthew. “O*NET Update.” Occupational Outlook Quarterly (Fall 2001): 26-27. Accessed April 25, 2011. http://www.bls.gov/opub/ooq/2001/fall/art04.pdf.
Mariani, Matthew. “Replace with a Database: O*NET Replaces the Dictionary of Occupational Titles.” Occupational Outlook Quarterly (Spring 1999): 3-9. Accessed April 25, 2011. http://www.bls.gov/opub/ooq/1999/Spring/art01.pdf.
MyPathCareers.org. “Learn More about Hundreds of Career Opportunities.” http://www.mypathcareers.org/.
National Center for Education Statistics. “CIP 2010.” http://nces.ed.gov/ipeds/cipcode/Default.aspx?y=55
National Center for Education Statistics. “What Are the Steps in the IPEDS Data Collection Process?” http://nces.ed.gov/ipeds/submit_data/lifecycle_text.asp.
Nidumolu, Ram, C.K. Prahalad, and M.R. Rangaswami. “Why Sustainability is Now the Key Driver of Innovation.” Harvard Business Review (September 2009): 57-64. http://www.acteonline.org/uploadedFiles/Why%20Sustainability%20Is%20Now%20the %20Key%20Driver%20of%20Innovation%20Harvard%20Review.pdf.
Office of Interagency Prevention Systems. “Colorado Best Practices: Why are Best Practices Important?” http://www.colorado.gov/cs/Satellite/Best-Practices-V2/BPV/1216289092765.
Ohio Department of Job and Family Services: Ohio Labor Market Information. “Ohio Skills Bank Data Tool.” Last modified February 3, 2010. http://ohiolmi.com/asp/SB/SkillsBank.htm.
Ohio Environmental Council. “Unleashing the Power of Green: Ohio Green Pathways.” http://www.theoec.org/Pathways.htm.
Ohio.gov: University System of Ohio. “Ohio Centers of Excellence: About this Site.” http://ohiocentersofexcellence.ning.com/.
Ohio.gov: University System of Ohio. “Ohio Skills Bank.” http://uso.edu/opportunities/ohioskillsbank/index.php.
Ohio.gov: University System of Ohio. “University System of Ohio Sustainability Web Sites.” http://uso.edu/opportunities/sustainability/pages.php.
Ohio.gov: University System of Ohio: Ohio Green Pathways. “Green Pathways Catalog.” http://www.uso.edu/opportunities/sustainability/green-pathways/documents /GreenPathwaysCatalog.pdf.
O*NET OnLine. “Browse by STEM Discipline.” http://www.onetonline.org/find/stem?t=0&g=Go. O*NET Resource Center. “O*NET® Research & Technical Reports.”
http://www.onetcenter.org/reports/GreenRef.html. O*NET Resource Center. “The Green Economy.” http://www.onetcenter.org/green.html. O*NET Resource Center. “The O*NET® Content Model.”
http://www.onetcenter.org/content.html. Patton, Michael Q. "Enhancing the Quality and Credibility of Qualitative Analysis." HSR: Health
Services Research 34 (1999): 1189-1208. Pennsylvania Department of Labor and Industry. The Pennsylvania Green Jobs Report: Part 1
January 2010. Harrisburg, PA: Pennsylvania Department of Labor and Industry, 2010. http://www.paworkstats.state.pa.us/admin/gsipub/htmlarea/uploads/Green_Jobs_Report
63
_Part_I.pdf. Renewable Works, Minnesota Sector Partnership for Renewable Energy Industry. “Minnesota
Renewable Career Pathways: Ethanol.” http://www.iseek.org/iseek/industry/energy/static/EthanolCareerPathway2.pdf.
Saha, Devashree. Enhancing State Clean Energy Workforce Training to Meet Demand. Washington, DC: National Governors Association Center for Best Practices, 2010. http://www.nga.org/Files/pdf/1011CLEANENERGYWORKFORCE.PDF.
Schaff, Mark. Manual about Applications of Labor Market Information (LMI) for Economic and Workforce Development. n.p.: privately printed, 2008. http://www.occsupplydemand.org/OSD_Research/LMI_ManualForEconWorforceDev.pdf.
Sustainability, Education & Economic Development Center. "What is a Quality Green Program?" http://theseedcenter.org/Resources/What-is-a-Quality-Green-Program-.
Ulrich, Dennis N. “Summary: Region 5 Green Stackable Certificate & Asset Map.” Memorandum, private collection, June 19, 2009.
U.S. Department of Commerce Economics and Statistics Administration. Measuring the Green Economy. Washington DC: Economics and Statistics Administration, 2010. http://www.esa.doc.gov/sites/default/files/reports/documents/greeneconomyreport_0.pdf.
U.S. Department of Labor: Employment and Training Administration. The Greening of Registered Apprenticeship: An Environmental Scan of the Impact of Green Jobs on Registered Apprenticeship and Implications for Workforce Development. Washington DC: U.S. Department of Labor, 2009. http://www.doleta.gov/OA/pdf/Greening_Apprenticeship.pdf.
Van Lier, Piet, Amanda Woodrum, and Kate Gordon. Mapping Green Career Pathways: Job Training Infrastructure and Opportunities in Ohio. San Francisco, CA: Apollo Alliance, 2010. http://apolloalliance.org/wp-content/uploads/2010/01/mappingreportohiojan27.pdf.
Ventre, Jerry, and Jane M. Weissman. Workforce Development: A Survey of Industry Needs and Training Approaches. Latham, NY: Interstate Renewable Energy Council, [2009?]. http://irecusa.org/fileadmin/user_upload/ASES_09/ASES2009VentreWeissmanWorkforce PaperFinal.pdf.
White, Sarah, and Jason Walsh. Greener Pathways: Jobs and Workforce Development in the Clean Energy Economy. Madison, WI: Center on Wisconsin Strategy, 2008. http://www.greenforall.org/resources/greener-pathways-jobs-and-workforce-development-in.
Woods, Jim. Measurement and Analysis of Employment in the Green Economy. n.p.: Workforce Information Council, 2009. http://www.workforceinfocouncil.org/Documents /WICGreenJobs StudyGroupReport-2009-10-01t.pdf.
Workforce Development Council of Seattle-King County. Map Your Career. Seattle: Workforce Development Council of Seattle-King County, 2010. http://seakingwdc.org/pdf/other-reports/CareerMaps2010.pdf.

64
Appendix A: Acronyms Used in This Report Acronym DetailABET Accreditation Board for Engineering and Technology ACC Austin Community CollegeAEP American Electric PowerANSYS Analysis SystemAQIP Academic Quality Improvement ProgramATI Agricultural Technical InstituteAWEA American Wind Energy AssociationBLS Burea of Labor StatisticsCCCC Cape Cod Community CollegeCIP Classification of Instructional ProgramDACUM Developing a Curriculum Method DOL Department of LaborEPA Environmental Protection AgencyETA Employment Training AdministrationFE Fundamentals of EngineeringHVAC Heating, Ventilation and Air ConditioningHVAC/R Heating, Ventilation, Air Conditioning and RefrigerationIPEDS Integrated Postsecondary Educational Data SystemIREC Interstate Renewable Energy Council LATTC Los Angeles Trade-Technical CollegeLEED Leadership in Energy and Environmental DesignMSSC Manufacturing Skill Standards CouncilNABCEP North American Board of Certified Energy PractitionersNAWRTC North American Wind Research and Training CenterNCES National Center for Educational StatisticsNCSC North Central State CollegeOGPAP Ohio Green Pathways Advisory PanelOBR Ohio Board of RegentsODJFS Ohio Department of Job and Family ServicesOEC Ohio Environmental CouncilO*Net Occupational Information NetworkOSDS Occupational Supply Demand SystemPNCECE Pacific Northwest Center of Excellence for Clean EnergyR5WC Region Five Workforce CollaborativeRESNET Residential Energy Services NetworkSCODE Supply Chain Operations Decision Environment SEED Center Sustainaibility, Education and Economic Development CenterSOC Standard Occupational ClassificationSTEM Science, Technology, Engineering and MathematicsUSO University System of Ohio

65
Appendix B: O*Net Green Occupations 58 59
58 SOC code 99.999 in the following tables indicates that there is not a corresponding SOC code for the listed occupation. 59 The sources for the information in the following tables are: Dierdorff, Erich C., Jennifer J. Norton, Donald W. Drewes, Christina M. Kroustalis, David Rivkin, and Phil Lewis. Greening of the World of Work: Implications for O*NET®-SOC and New and Emerging Occupations. Raleigh, NC: National Center for O*NET Development, 2009. http://www.onetcenter.org/dl_files/Green.pdf; and http://www.onetonline.org/.

66
O*Net Green Increased Demand Occupations
Root SOC C
ode
Root Occ
upatio
n
O*NET S
OC Cod
e
O*NET O
ccup
ation
Agricu
lture
& Forestr
y
Energy
and C
arbon C
aptur
e
and S
torage
Ene
rgy E
fficien
cyEne
rgy Trad
ingEnv
ironm
ental
Prot
ectio
n
Govern
emnt
and R
egula
tory
Admini
strati
on
Green C
onstr
uctio
nMan
ufactur
ingRecy
cle an
d Was
te
Reducti
onRene
wable
Energy
Genera
tion
Research
, Desig
n and
Consultin
g Service
sTrans
portati
on45-2011 Agricultural Inspectors 45-2011.00 Agricultural Inspectors x x17-3011 Architectural and Civil Drafters 17-3011.01 Architectural Drafters x47-2011 Boilermakers 47-2011.00 Boilermakers x x53-3021 Bus Drivers, Transit and Intercity 53-3021.00 Bus Drivers, Transit and Intercity x47-2051 Cement Masons and Concrete
Finishers47-2051.00 Cement Masons and Concrete
Finishersx
17-2041 Chemical Engineers 17-2041.00 Chemical Engineers x51-9011 Chemical Equipment Operators and
Tenders51-9011.00 Chemical Equipment Operators and
Tendersx
51-8091 Chemical Plant and System Operators
51-8091.00 Chemical Plant and System Operators
x
19-4031 Chemical Technicians 19-4031.00 Chemical Technicians x19-2031 Chemists 19-2031.00 Chemists x x27-1021 Commercial and Industrial
Designers27-1021.00 Commercial & Industrial Designers x x
15-1032 Computer Software Engineers, Systems Software
15-1032.00 Computer Software Engineers, Systems Software
x
51-4011 Computer-Controlled Machine Tool Operators, Metal and Plastic
51-4011.00 Computer-Controlled Machine Tool Operators, Metal and Plastic
x
47-2031 Carpenters 47-2031.01 Construction Carpenters x43-4051 Customer Service Representatives 43-4051.00 Customer Service Representatives x51-4031 Cutting, Punching, and Press
Machine Setters, Operators, and Tenders, Metal and Plastic
51-4031.00 Cutting, Punching, and Press Machine Setters, Operators, and Tenders, Metal and Plastic
x
43-5032 Dispatchers, Except Police, Fire, and Ambulance
43-5032.00 Dispatchers, Except Police, Fire, and Ambulance
x
51-4032 Drilling and Boring Machine Tool Setters, Operators, and Tenders, Metal and Plastic
51-4032.00 Drilling and Boring Machine Tool Setters, Operators, and Tenders, Metal and Plastic
x
51-2022 Electrical and Electronic Equipment Assemblers
51-2022.00 Electrical and Electronic Equipment Assemblers
x
49-2094 Electrical and Electronics Repairers, Commercial and Industrial Equipment
49-2094.00 Electrical and Electronics Repairers, Commercial and Industrial Equipment
x x
49-9051 Electrical Power-Line Installers and Repairers
49-9051.00 Electrical Power-Line Installers and Repairers
x
47-2111 Electricians 47-2111.00 Electricians x17-3023 Electrical and Electronic
Engineering Technicians17-3023.01 Electronics Engineering Technicians x
51-2031 Engine and Other Machine Assemblers
51-2031.00 Engine and Other Machine Assemblers
x
19-2041 Environmental Scientists and Specialists, Including Health
19-2041.00 Environmental Scientists and Specialists, Including Health
x
25-9021 Farm and Home Management Advisors
25-9021.00 Farm and Home Management Advisors
x
45-1011First-Line Supervisors of Farming, Fishing, and Forestry Workers
45-1011.07 First-Line Supervisors/Managers of Agricultural Crop and Horticultural Workers
x
45-1011 First-Line Supervisors of Farming, Fishing, and Forestry Workers
45-1011.05 First-Line Supervisors/Managers of Logging Workers
x
49-1011 First-Line Supervisors/Managers of Mechanics, Installers, and Repairers
49-1011.00 First-Line Supervisors/Managers of Mechanics, Installers, and Repairers
x
51-1011 First-Line Supervisors/Managers of Production and Operating Workers
51-1011.00 First-Line Supervisors/Managers of Production and Operating Workers
x
33-3031 Fish and Game Wardens 33-3031.00 Fish and Game Wardens x19-4093 Forest and Conservation
Technicians19-4093.00 Forest & Conservation Technicians x
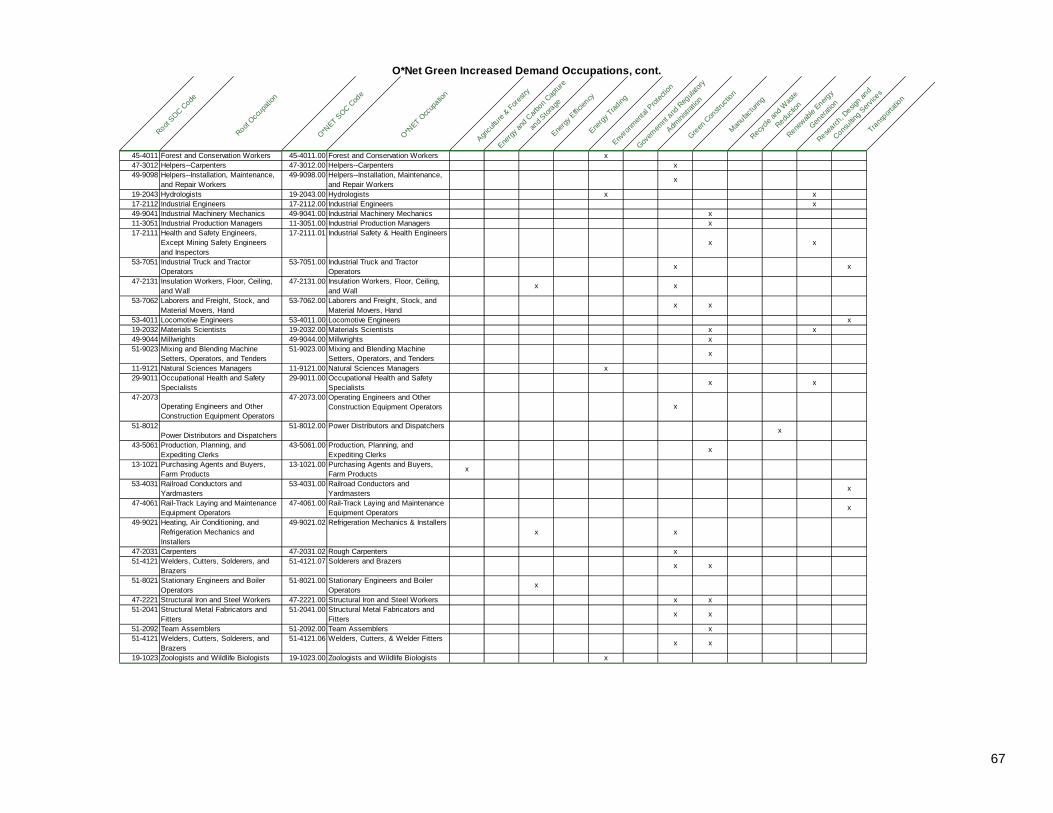
67
O*Net Green Increased Demand Occupations, cont.
Root SOC C
ode
Root Occ
upatio
n
O*NET S
OC Cod
e
O*NET O
ccup
ation
Agricu
lture
& Forestr
y
Energy
and C
arbon C
aptur
e
and S
torage
Ene
rgy E
fficien
cyEne
rgy Trad
ingEnv
ironm
ental
Prot
ectio
n
Govern
emnt
and R
egula
tory
Admini
strati
on
Green C
onstr
uctio
nMan
ufactur
ingRecy
cle an
d Was
te
Reducti
onRene
wable
Energy
Genera
tion
Research
, Desig
n and
Consultin
g Service
sTrans
portati
on45-4011 Forest and Conservation Workers 45-4011.00 Forest and Conservation Workers x47-3012 Helpers--Carpenters 47-3012.00 Helpers--Carpenters x49-9098 Helpers--Installation, Maintenance,
and Repair Workers49-9098.00 Helpers--Installation, Maintenance,
and Repair Workersx
19-2043 Hydrologists 19-2043.00 Hydrologists x x17-2112 Industrial Engineers 17-2112.00 Industrial Engineers x49-9041 Industrial Machinery Mechanics 49-9041.00 Industrial Machinery Mechanics x11-3051 Industrial Production Managers 11-3051.00 Industrial Production Managers x17-2111 Health and Safety Engineers,
Except Mining Safety Engineers and Inspectors
17-2111.01 Industrial Safety & Health Engineersx x
53-7051 Industrial Truck and Tractor Operators
53-7051.00 Industrial Truck and Tractor Operators
x x
47-2131 Insulation Workers, Floor, Ceiling, and Wall
47-2131.00 Insulation Workers, Floor, Ceiling, and Wall
x x
53-7062 Laborers and Freight, Stock, and Material Movers, Hand
53-7062.00 Laborers and Freight, Stock, and Material Movers, Hand
x x
53-4011 Locomotive Engineers 53-4011.00 Locomotive Engineers x19-2032 Materials Scientists 19-2032.00 Materials Scientists x x49-9044 Millwrights 49-9044.00 Millwrights x51-9023 Mixing and Blending Machine
Setters, Operators, and Tenders51-9023.00 Mixing and Blending Machine
Setters, Operators, and Tendersx
11-9121 Natural Sciences Managers 11-9121.00 Natural Sciences Managers x29-9011 Occupational Health and Safety
Specialists29-9011.00 Occupational Health and Safety
Specialistsx x
47-2073Operating Engineers and Other Construction Equipment Operators
47-2073.00 Operating Engineers and Other Construction Equipment Operators x
51-8012Power Distributors and Dispatchers
51-8012.00 Power Distributors and Dispatchers x
43-5061 Production, Planning, and Expediting Clerks
43-5061.00 Production, Planning, and Expediting Clerks
x
13-1021 Purchasing Agents and Buyers, Farm Products
13-1021.00 Purchasing Agents and Buyers, Farm Products
x
53-4031 Railroad Conductors and Yardmasters
53-4031.00 Railroad Conductors and Yardmasters
x
47-4061 Rail-Track Laying and Maintenance Equipment Operators
47-4061.00 Rail-Track Laying and Maintenance Equipment Operators
x
49-9021 Heating, Air Conditioning, and Refrigeration Mechanics and Installers
49-9021.02 Refrigeration Mechanics & Installersx x
47-2031 Carpenters 47-2031.02 Rough Carpenters x51-4121 Welders, Cutters, Solderers, and
Brazers51-4121.07 Solderers and Brazers x x
51-8021 Stationary Engineers and Boiler Operators
51-8021.00 Stationary Engineers and Boiler Operators
x
47-2221 Structural Iron and Steel Workers 47-2221.00 Structural Iron and Steel Workers x x51-2041 Structural Metal Fabricators and
Fitters51-2041.00 Structural Metal Fabricators and
Fittersx x
51-2092 Team Assemblers 51-2092.00 Team Assemblers x51-4121 Welders, Cutters, Solderers, and
Brazers51-4121.06 Welders, Cutters, & Welder Fitters x x
19-1023 Zoologists and Wildlife Biologists 19-1023.00 Zoologists and Wildlife Biologists x

68
O*Net Green Enhanced Skills Occupations
Root SOC C
ode
Root Occ
upatio
n
O*NET S
OC Cod
e
O*NET O
ccup
ation
Agricu
lture
& Forestr
y
Energy
and C
arbon C
aptur
e
and S
torage
Ene
rgy E
fficien
cyEne
rgy Trad
ing
Enviro
nmen
tal P
rotec
tion
Govern
emnt
and R
egula
tory
Admini
strati
on
Green C
onstr
uctio
nMan
ufactur
ing
Recycle
and W
aste
Reducti
on
Renewab
le Energ
y
Genera
tion
Research
, Desig
n and
Consultin
g Service
s
Transport
ation
17-2011 Aerospace Engineers 17-2011.00 Aerospace Engineers x x19-4011 Agricultural and Food Science
Technicians19-4011.01 Agricultural Technicians x
51-2011 Aircraft Structure, Surfaces, Rigging, and Systems Assemblers
51-2011.00 Aircraft Structure, Surfaces, Rigging, and Systems Assemblers
x
23-1022 Arbitrators, Mediators, and Conciliators
23-1022.00 Arbitrators, Mediators, and Conciliators
x x
17-1011 Architects, Except Landscape and Naval
17-1011.00 Architects, Except Landscape and Naval
x x
19-2021 Atmospheric and Space Scientists 19-2021.00 Atmospheric and Space Scientists x x49-3023 Automotive Service Technicians and
Mechanics49-3023.02 Automotive Specialty Technicians x
17-2051 Civil Engineers 17-2051.00 Civil Engineers x x x47-4011 Construction and Building
Inspectors47-4011.00 Construction and Building
Inspectorsx x
47-2061 Construction Laborers 47-2061.00 Construction Laborers x11-9021 Construction Managers 11-9021.00 Construction Managers x x47-5041 Continuous Mining Machine
Operators47-5041.00 Continuous Mining Machine
Operatorsx
17-3023 Electrical and Electronic Engineering Technicians
17-3023.03 Electrical Engineering Technicians x
17-2071 Electrical Engineers 17-2071.00 Electrical Engineers x x x x17-3024 Electro-Mechanical Technicians 17-3024.00 Electro-Mechanical Technicians x17-2072 Electronics Engineers, Except
Computer17-2072.00 Electronics Engineers, Except
Computerx x
11-9041 Engineering Managers 11-9041.00 Engineering Managers x x17-3025 Environmental Engineering
Technicians17-3025.00 Environmental Engineering
Techniciansx
17-2081 Environmental Engineers 17-2081.00 Environmental Engineers x x19-4091 Environmental Science and
Protection Technicians, Including Health
19-4091.00 Environmental Science and Protection Technicians, Including Health
x
11-9012 Farmers and Ranchers 11-9012.00 Farmers and Ranchers x13-2051 Financial Analysts 13-2051.00 Financial Analysts x x x x11-1021
General and Operations Managers11-1021.00 General and Operations Managers
x x
19-4041 Geological and Petroleum Technicians
19-4041.02 Geological Sample Test Technicians
x x
19-4041 Geological and Petroleum Technicians
19-4041.01 Geophysical Data Technicians x
19-2042 Geoscientists, Except Hydrologists and Geographers
19-2042.00 Geoscientists, Except Hydrologists and Geographers
x x
47-4041 Hazardous Materials Removal Workers
47-4041.00 Hazardous Materials Removal Workers
x x x
49-9021 Heating, Air Conditioning, and Refrigeration Mechanics and Installers
49-9021.01 Heating and Air Conditioning Mechanics and Installers x x
17-3026Industrial Engineering Technicians
17-3026.00 Industrial Engineering Technicians x
51-9061 Inspectors, Testers, Sorters, Samplers, and Weighers
51-9061.00 Inspectors, Testers, Sorters, Samplers, and Weighers
x x
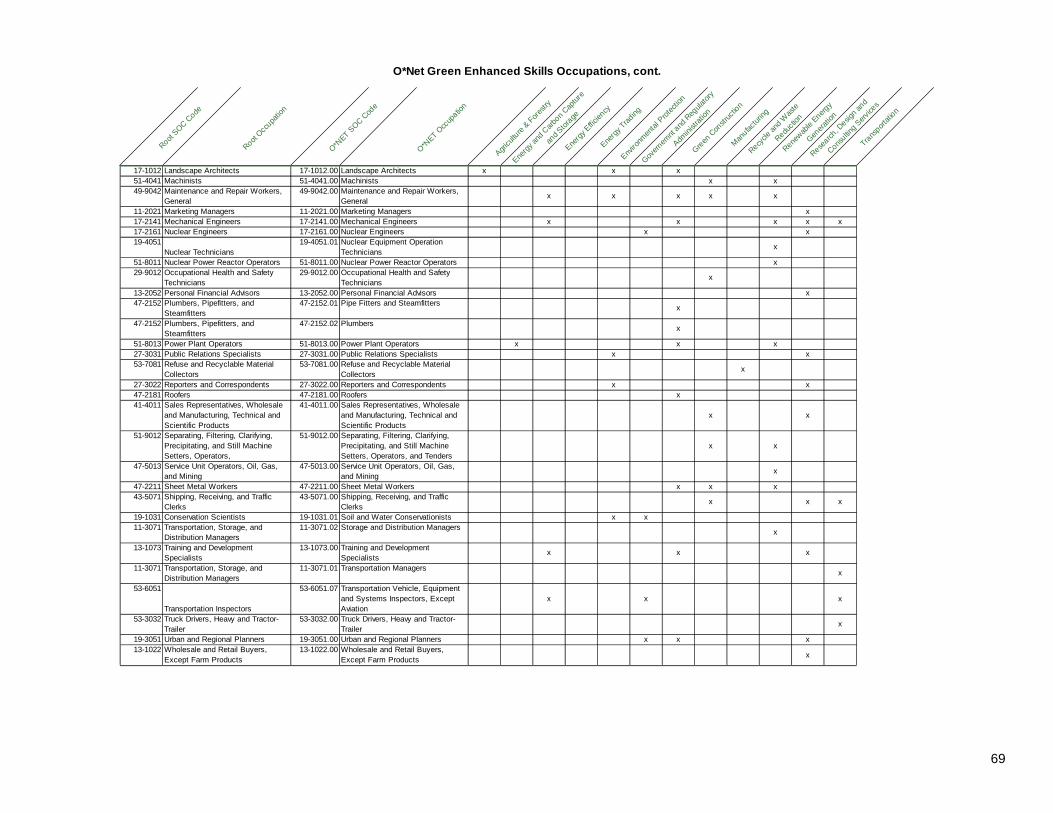
69
O*Net Green Enhanced Skills Occupations, cont.
Root SOC C
ode
Root Occ
upatio
n
O*NET S
OC Cod
e
O*NET O
ccup
ation
Agricu
lture
& Forestr
y
Energy
and C
arbon C
aptur
e
and S
torage
Ene
rgy E
fficien
cyEne
rgy Trad
ing
Enviro
nmen
tal P
rotec
tion
Govern
emnt
and R
egula
tory
Admini
strati
on
Green C
onstr
uctio
nMan
ufactur
ing
Recycle
and W
aste
Reducti
on
Renewab
le Energ
y
Genera
tion
Research
, Desig
n and
Consultin
g Service
s
Transport
ation
17-1012 Landscape Architects 17-1012.00 Landscape Architects x x x51-4041 Machinists 51-4041.00 Machinists x x49-9042 Maintenance and Repair Workers,
General49-9042.00 Maintenance and Repair Workers,
Generalx x x x x
11-2021 Marketing Managers 11-2021.00 Marketing Managers x17-2141 Mechanical Engineers 17-2141.00 Mechanical Engineers x x x x x17-2161 Nuclear Engineers 17-2161.00 Nuclear Engineers x x19-4051
Nuclear Technicians19-4051.01 Nuclear Equipment Operation
Techniciansx
51-8011 Nuclear Power Reactor Operators 51-8011.00 Nuclear Power Reactor Operators x29-9012 Occupational Health and Safety
Technicians29-9012.00 Occupational Health and Safety
Techniciansx
13-2052 Personal Financial Advisors 13-2052.00 Personal Financial Advisors x47-2152 Plumbers, Pipefitters, and
Steamfitters47-2152.01 Pipe Fitters and Steamfitters x
47-2152 Plumbers, Pipefitters, and Steamfitters
47-2152.02 Plumbers x
51-8013 Power Plant Operators 51-8013.00 Power Plant Operators x x x27-3031 Public Relations Specialists 27-3031.00 Public Relations Specialists x x53-7081 Refuse and Recyclable Material
Collectors53-7081.00 Refuse and Recyclable Material
Collectorsx
27-3022 Reporters and Correspondents 27-3022.00 Reporters and Correspondents x x47-2181 Roofers 47-2181.00 Roofers x41-4011 Sales Representatives, Wholesale
and Manufacturing, Technical and Scientific Products
41-4011.00 Sales Representatives, Wholesale and Manufacturing, Technical and Scientific Products
x x
51-9012 Separating, Filtering, Clarifying, Precipitating, and Still Machine Setters, Operators,
51-9012.00 Separating, Filtering, Clarifying, Precipitating, and Still Machine Setters, Operators, and Tenders
x x
47-5013 Service Unit Operators, Oil, Gas, and Mining
47-5013.00 Service Unit Operators, Oil, Gas, and Mining
x
47-2211 Sheet Metal Workers 47-2211.00 Sheet Metal Workers x x x43-5071 Shipping, Receiving, and Traffic
Clerks43-5071.00 Shipping, Receiving, and Traffic
Clerksx x x
19-1031 Conservation Scientists 19-1031.01 Soil and Water Conservationists x x11-3071 Transportation, Storage, and
Distribution Managers11-3071.02 Storage and Distribution Managers x
13-1073 Training and Development Specialists
13-1073.00 Training and Development Specialists
x x x
11-3071 Transportation, Storage, and Distribution Managers
11-3071.01 Transportation Managers x
53-6051
Transportation Inspectors
53-6051.07 Transportation Vehicle, Equipment and Systems Inspectors, Except Aviation
x x x
53-3032 Truck Drivers, Heavy and Tractor-Trailer
53-3032.00 Truck Drivers, Heavy and Tractor-Trailer
x
19-3051 Urban and Regional Planners 19-3051.00 Urban and Regional Planners x x x13-1022 Wholesale and Retail Buyers,
Except Farm Products13-1022.00 Wholesale and Retail Buyers,
Except Farm Products x

70
O*Net Green New and Emerging Occupations
Root SOC C
ode
Root Occ
upatio
n
O*NET S
OC Cod
e
O*NET O
ccup
ation
Agricu
lture
& Forestr
y
Energy
and C
arbon C
aptur
e
and S
torage
Ene
rgy E
fficien
cyEne
rgy Trad
ing
Enviro
nmen
tal P
rotec
tion
Govern
emnt
and R
egula
tory
Admini
strati
on
Green C
onstr
uctio
nMan
ufactur
ing
Recycle
and W
aste
Reducti
on
Renewab
le Energ
y
Genera
tion
Research
, Desig
n and
Consultin
g Service
s
Transport
ation
99-9999 n/a 99-9999.99 Air Quality Control Specialists x17-3027 Mechanical Engineering
Technicians17-3027.01 Automotive Engineering Technicians x
17-2141 Mechanical Engineers 17-2141.02 Automotive Engineers x x17-2199 Engineers, All Other 17-2199.01 Biochemical Engineers x x51-8099 Plant and System Operators, All
Other51-8099.01 Biofuels Processing Technicians x
11-3051 Industrial Production Managers 11-3051.03 Biofuels Production Managers x11-9041 Engineering Managers 11-9041.01 Biofuels/Biodiesel Technology and
Product Development Managersx
99-9999 n/a 99-9999.99 Biomass Plant Engineers x51-8099 Plant and System Operators, All
Other51-8099.03 Biomass Plant Technicians x
11-3051 Industrial Production Managers 11-3051.04 Biomass Production Managers x11-9199 Managers, All Other 11-9199.11 Brownfield Redevelopment Specialists
and Site Managersx
99-9999n/a
99-9999.99Carbon Capture and Sequestration Systems Installers
x
99-9999 n/a 99-9999.99 Carbon Credit Traders x99-9999 n/a 99-9999.99 Carbon Trading Analysts x11-1011 Chief Executives 11-1011.03 Chief Sustainability Officers x19-2041 Environmental Scientists and
Specialists, Including Health19-2041.01 Climate Change Analysts x
11-9199 Managers, All Other 11-9199.02 Compliance Managers x17-3029 Engineering Technicians, Except
Drafters, All Other17-3029.02 Electrical Engineering Technologists x x
17-3029 Engineering Technicians, Except Drafters, All Other
17-3029.03 Electromechanical Engineering Technologists
x x
17-3029 Engineering Technicians, Except Drafters, All Other
17-3029.04 Electronics Engineering Technologists x x
13-1199 Business Operations Specialists, All Other
13-1199.01 Energy Auditors x x
41-3099 Sales Representatives, Services, All Other
41-3099.01 Energy Brokers x
17-2199 Engineers, All Other 17-2199.03 Energy Engineers x x x99-9999 n/a 99-9999.99 Environmental Certification Specialists x19-3011 Economists 19-3011.01 Environmental Economists x19-2041 Environmental Scientists and
Specialists, Including Health19-2041.02 Environmental Restoration Planners x
13-2099 Financial Specialists, All Other 13-2099.01 Financial Quantitative Analysts x43-5011 Cargo and Freight Agents 43-5011.01 Freight Forwarders x17-2141 Mechanical Engineers 17-2141.01 Fuel Cell Engineers x x17-3029 Engineering Technicians, Except
Drafters, All Other17-3029.10 Fuel Cell Technicians x
15-1099 Computer Specialists, All Other 15-1099.07 Geographic Information Systems Technicians
x
15-1099 Computer Specialists, All Other 15-1099.06 Geospatial Information Scientists and Technologists
x
11-3051 Industrial Production Managers 11-3051.02 Geothermal Production Managers x49-9099 Installation, Maintenance, and
Repair Workers, All Other49-9099.01 Geothermal Technicians x
11-2011 Advertising and Promotions Managers
11-2011.01 Green Marketers x
99-9999n/a
99-9999.99Greenhouse Gas Emissions Permitting Consultants
x
99-9999n/a
99-9999.99Greenhouse Gas Emissions Report Verifiers
x
51-8099 Plant and System Operators, All Other
51-8099.04 Hydroelectric Plant Technicians x
11-3051 Industrial Production Managers 11-3051.06 Hydroelectric Production Managers x19-2041 Environmental Scientists and
Specialists, Including Health19-2041.03 Industrial Ecologists x
17-3029 Engineering Technicians, Except Drafters, All Other
17-3029.05 Industrial Engineering Technologists x x
13-2099 Financial Specialists, All Other 13-2099.03 Investment Underwriters x x13-1081 Logisticians 13-1081.02 Logistics Analysts x x x13-1081 Logisticians 13-1081.01 Logistics Engineers x x x11-9199 Managers, All Other 11-9199.06 Logistics Managers x x x17-3029 Engineering Technicians, Except
Drafters, All Other17-3029.06 Manufacturing Engineering
Technologistsx x
17-2199 Engineers, All Other 17-2199.04 Manufacturing Engineers x x
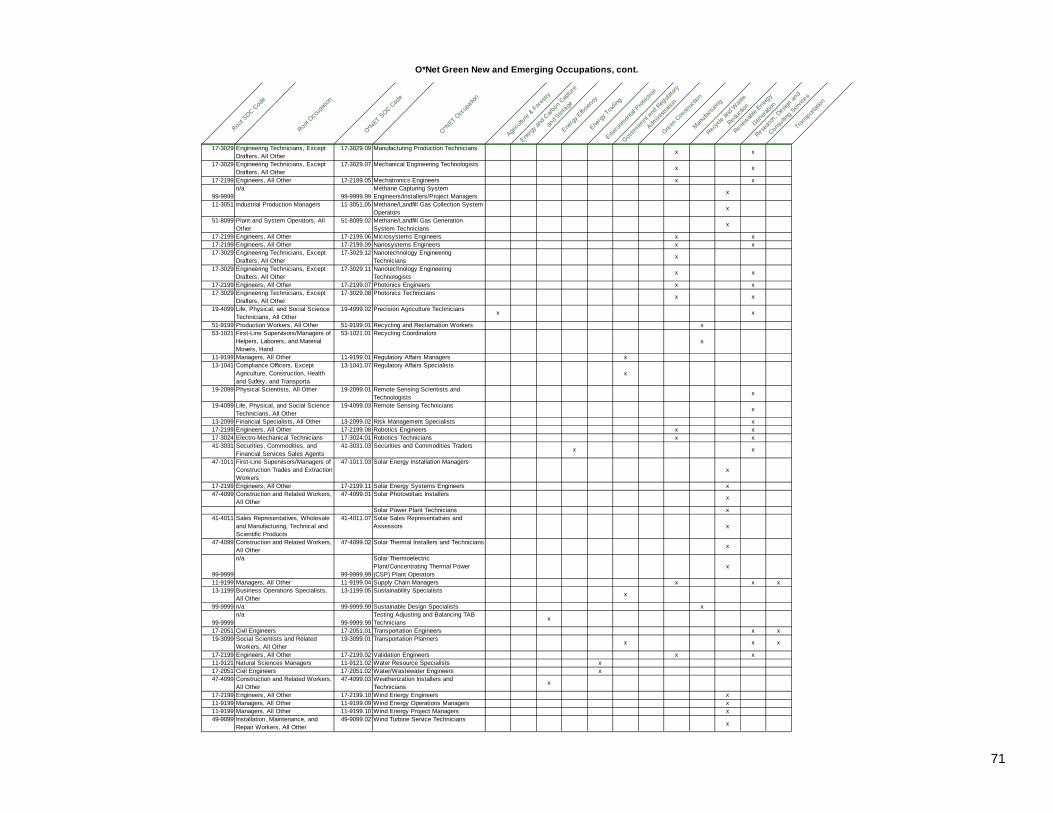
71
O*Net Green New and Emerging Occupations, cont.
Root SOC C
ode
Root Occ
upatio
n
O*NET S
OC Cod
e
O*NET O
ccup
ation
Agricu
lture
& Forestr
y
Energy
and C
arbon C
aptur
e
and S
torage
Ene
rgy E
fficien
cyEne
rgy Trad
ing
Enviro
nmen
tal P
rotec
tion
Govern
emnt
and R
egula
tory
Admini
strati
on
Green C
onstr
uctio
nMan
ufactur
ing
Recycle
and W
aste
Reducti
on
Renewab
le Energ
y
Genera
tion
Research
, Desig
n and
Consultin
g Service
s
Transport
ation
17-3029 Engineering Technicians, Except Drafters, All Other
17-3029.09 Manufacturing Production Technicians x x
17-3029 Engineering Technicians, Except Drafters, All Other
17-3029.07 Mechanical Engineering Technologists x x
17-2199 Engineers, All Other 17-2199.05 Mechatronics Engineers x x
99-9999n/a
99-9999.99Methane Capturing System Engineers/Installers/Project Managers
x
11-3051 Industrial Production Managers 11-3051.05 Methane/Landfill Gas Collection System Operators
x
51-8099 Plant and System Operators, All Other
51-8099.02 Methane/Landfill Gas Generation System Technicians
x
17-2199 Engineers, All Other 17-2199.06 Microsystems Engineers x x17-2199 Engineers, All Other 17-2199.09 Nanosystems Engineers x x17-3029 Engineering Technicians, Except
Drafters, All Other17-3029.12 Nanotechnology Engineering
Techniciansx
17-3029 Engineering Technicians, Except Drafters, All Other
17-3029.11 Nanotechnology Engineering Technologists
x x
17-2199 Engineers, All Other 17-2199.07 Photonics Engineers x x17-3029 Engineering Technicians, Except
Drafters, All Other17-3029.08 Photonics Technicians x x
19-4099 Life, Physical, and Social Science Technicians, All Other
19-4099.02 Precision Agriculture Technicians x x
51-9199 Production Workers, All Other 51-9199.01 Recycling and Reclamation Workers x53-1021 First-Line Supervisors/Managers of
Helpers, Laborers, and Material Movers, Hand
53-1021.01 Recycling Coordinatorsx
11-9199 Managers, All Other 11-9199.01 Regulatory Affairs Managers x13-1041 Compliance Officers, Except
Agriculture, Construction, Health and Safety, and Transporta
13-1041.07 Regulatory Affairs Specialistsx
19-2099 Physical Scientists, All Other 19-2099.01 Remote Sensing Scientists and Technologists
x
19-4099 Life, Physical, and Social Science Technicians, All Other
19-4099.03 Remote Sensing Technicians x
13-2099 Financial Specialists, All Other 13-2099.02 Risk Management Specialists x17-2199 Engineers, All Other 17-2199.08 Robotics Engineers x x17-3024 Electro-Mechanical Technicians 17-3024.01 Robotics Technicians x x41-3031 Securities, Commodities, and
Financial Services Sales Agents41-3031.03 Securities and Commodities Traders x x
47-1011 First-Line Supervisors/Managers of Construction Trades and Extraction Workers
47-1011.03 Solar Energy Installation Managersx
17-2199 Engineers, All Other 17-2199.11 Solar Energy Systems Engineers x47-4099 Construction and Related Workers,
All Other47-4099.01 Solar Photovoltaic Installers x
Solar Power Plant Technicians x41-4011 Sales Representatives, Wholesale
and Manufacturing, Technical and Scientific Products
41-4011.07 Solar Sales Representatives and Assessors x
47-4099 Construction and Related Workers, All Other
47-4099.02 Solar Thermal Installers and Technicians x
99-9999
n/a
99-9999.99
Solar Thermoelectric Plant/Concentrating Thermal Power (CSP) Plant Operators
x
11-9199 Managers, All Other 11-9199.04 Supply Chain Managers x x x13-1199 Business Operations Specialists,
All Other13-1199.05 Sustainability Specialists x
99-9999 n/a 99-9999.99 Sustainable Design Specialists x
99-9999n/a
99-9999.99Testing Adjusting and Balancing TAB Technicians
x
17-2051 Civil Engineers 17-2051.01 Transportation Engineers x x19-3099 Social Scientists and Related
Workers, All Other19-3099.01 Transportation Planners x x x
17-2199 Engineers, All Other 17-2199.02 Validation Engineers x x11-9121 Natural Sciences Managers 11-9121.02 Water Resource Specialists x17-2051 Civil Engineers 17-2051.02 Water/Wastewater Engineers x47-4099 Construction and Related Workers,
All Other47-4099.03 Weatherization Installers and
Techniciansx
17-2199 Engineers, All Other 17-2199.10 Wind Energy Engineers x11-9199 Managers, All Other 11-9199.09 Wind Energy Operations Managers x11-9199 Managers, All Other 11-9199.10 Wind Energy Project Managers x49-9099 Installation, Maintenance, and
Repair Workers, All Other49-9099.02 Wind Turbine Service Technicians
x

72
Organization NameIdentified by
Survey Respondents*
Key Organizations Identified by Research Team**
AALAS (American Association for Laboratory Animal Science) xAAMA (The American Association of Medical Assistants) xABET (Accreditation Board for Engineering and Technology) xABIH (American Board of Industrial Hygiene) xACCE (American Council for Construction Education) x xACS (American Chemical Society) xAEE (Association of Energy Engineers) x xAFS (American Fisheries Society) xAHRI (Air-conditioning, Heating, and Refrigeration Institute) xAIC (American Institute of Constructors) xAIChE (American Institute of Chemical Engineers) xAICP (American Institute of Certified Planners) xAIP (American Institute of Physics) xAPICS (Advancing Productivity, Innovation, and Competitive Success from The Association for Operations Management) xAPLD (Association of Professional Landscape Designers) xARC/STSA (Accreditation Review Council on Education in Surgical Technology and Surgical Assisting) xARI (Air-Conditioning and Refrigeration Institute) xASBMB (American Society for Biochemistry and Molecular Biology) xASCE (American Society of Civil Engineers) xASE (Automotive Service Excellence) xASEM (American Society for Engineering Management) x xASHRAE (American Society of Heating, Refrigeration and Air Conditioning Engineers) x xASLA (American Society of Landscape Architects) xASME (American Society of Mechanical Engineers) x xASQ (American Society for Quality) x xASTM (American Society for Testing and Materials) xATMAE (The Association of Technology, Management, and Applied Engineering) xAWEA (American Wind Energy Association) x xAWMA (Air & Waste Management Association) xAWS (American Welding Society) xAWWA (American Water Works Association) xBEAC (Board of Environmental, Health and Safety Auditor Certifications) x xBPI (Building Performance Institute) x xCEPH (Council on Education for Public Health) xCIG (Certified Interpretative Guide) xCMA (Certified Medical Assistant) xCSCMP(Council of Supply Chain Management Professionals) xCSI (Construction Specifications Institute) xEHAC (Environmental Health Accreditation Council) xEPA (Environmental Protection Agency) xEPA 608 Refrigerant Recycling Rule (Environmental Protection Agency) xETA (Electronics Technicians Association) xFDA's GLP (U.S. Food and Drug Administration's Good Laboratory Practices) xIBEW (International Brotherhood of Electrical Workers) xIEC (The International Electrotechnical Commission) xIEEE (Institute of Electrical and Electronics Engineers) x xIGHSPA (International Ground Source Heat Pump Association) x xIIE (Institute of Industrial Engineers) x x
Appendix C: Organizations Identified by Survey Respondents
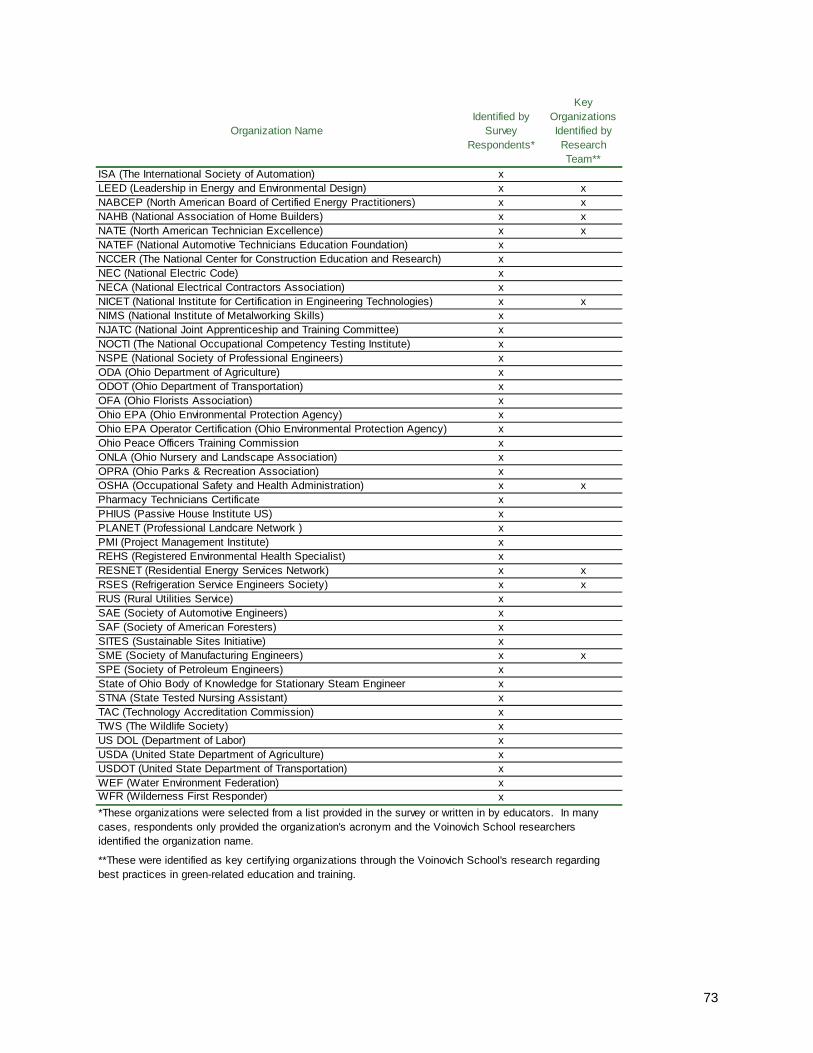
73
Organization NameIdentified by
Survey Respondents*
Key Organizations Identified by Research Team**
ISA (The International Society of Automation) xLEED (Leadership in Energy and Environmental Design) x xNABCEP (North American Board of Certified Energy Practitioners) x xNAHB (National Association of Home Builders) x xNATE (North American Technician Excellence) x xNATEF (National Automotive Technicians Education Foundation) xNCCER (The National Center for Construction Education and Research) xNEC (National Electric Code) xNECA (National Electrical Contractors Association) xNICET (National Institute for Certification in Engineering Technologies) x xNIMS (National Institute of Metalworking Skills) xNJATC (National Joint Apprenticeship and Training Committee) xNOCTI (The National Occupational Competency Testing Institute) xNSPE (National Society of Professional Engineers) xODA (Ohio Department of Agriculture) xODOT (Ohio Department of Transportation) xOFA (Ohio Florists Association) xOhio EPA (Ohio Environmental Protection Agency) xOhio EPA Operator Certification (Ohio Environmental Protection Agency) xOhio Peace Officers Training Commission xONLA (Ohio Nursery and Landscape Association) xOPRA (Ohio Parks & Recreation Association) xOSHA (Occupational Safety and Health Administration) x xPharmacy Technicians Certificate xPHIUS (Passive House Institute US) xPLANET (Professional Landcare Network ) xPMI (Project Management Institute) xREHS (Registered Environmental Health Specialist) xRESNET (Residential Energy Services Network) x xRSES (Refrigeration Service Engineers Society) x xRUS (Rural Utilities Service) xSAE (Society of Automotive Engineers) xSAF (Society of American Foresters) xSITES (Sustainable Sites Initiative) xSME (Society of Manufacturing Engineers) x xSPE (Society of Petroleum Engineers) xState of Ohio Body of Knowledge for Stationary Steam Engineer xSTNA (State Tested Nursing Assistant) xTAC (Technology Accreditation Commission) xTWS (The Wildlife Society) xUS DOL (Department of Labor) xUSDA (United State Department of Agriculture) xUSDOT (United State Department of Transportation) xWEF (Water Environment Federation) xWFR (Wilderness First Responder) x*These organizations were selected from a list provided in the survey or written in by educators. In many cases, respondents only provided the organization's acronym and the Voinovich School researchers identified the organization name.
**These were identified as key certifying organizations through the Voinovich School's research regarding best practices in green-related education and training.

74
Appendix D: Educator Survey Methodology Survey Overview A survey of green-related programs within the University System of Ohio was developed in order to query educators regarding the implementation of best practices in green jobs education and training. In addition, the survey collected information about the programs’ demographics including student enrollment data, sector identification and the depth of preparation provided for work in the green economy.
Question Development Survey questions were designed to focus on the seven best practices in green jobs education and training described in the body of this report. Previous surveys reviewed as resources for question development included the Missouri Green Training Provider Survey60 and New York Green Jobs Training Survey.61 The survey instrument sought to collect information on programs’ size, their role in the green economy, curricula creation, program evaluation and program partnerships. The unit of analysis for the survey is the program level. The survey instrument went through a review process with project partners and was pilot tested with educators, green employers and various other individuals familiar with post-secondary education in Ohio and green programming in particular. The survey instrument is provided in Appendix E.
Program Selection Project staff created a web version of the survey for distribution via e-mail to a contact person identified for programs in the Green Pathways Database. Identifying these individuals and locating their e-mail address was a major undertaking involving the following activities.
Phase 1 • All programs in the Green Pathways Database62 that do not appear to offer a degree or
certificate or appear to be exclusively on-line programs were omitted from the survey contact list. The exclusively on-line programs were excluded because the third-party vendors of these online programs are typically responsible for program content.
Phase 2 (974 programs) • School websites were reviewed and departments were contacted as needed to
determine the most appropriate contact person for each program, potentially including: o A program chair, coordinator or advisor o A listed contact individual o Faculty/staff in the department with relevant teaching emphasis o Administrative assistants/department secretaries
Phase 3 (Detailed follow-up with 503 programs)
• Individual contacts associated with five or more programs were contacted in order to:
60 https://worksmart.ded.mo.gov/includes/secure_file.cfm?ID=36&menuID=5193 61 http://www.urbanresearch.org/lmis/new-york-green-jobs-training-survey 62 The final Green Pathways Database includes programs that were not selected for the survey as well as programs that were added after the survey was deployed. Please see Appendix G for a detailed description of the process by which green education and training programs were identified.

75
o Verify that they were the correct contact o If not, request help to find the most appropriate contact
• Additional attempts were made to find a contact person for programs still lacking a contact person following the completion of Phase 2 activities.
Ultimately, 519 persons were identified as contacts for the survey, including 316 contacts associated with one program each and 203 contacts associated with two or more programs. For example, some institutions have only one contact person for multiple certificate and associate’s programs connected to industrial training programs. At the extreme, it was confirmed that one educational institution had a single contact person responsible for 23 green-related programs. In order to encourage participation in the survey, project staff limited the number of surveys any individual contact would receive and established a prioritization process for selecting the programs to be surveyed.
Program Prioritization In consultation with representatives of project sponsors and partners, researchers limited survey distribution to no more than three surveys per contact. For the remaining 39 contacts associated with four or more programs each, a prioritization process was established for selecting three programs for each contact:
• Emphasis was given to programs associated with the largest number of jobs. These are typically certificate and associate’s degree programs, not bachelor’s degree, master’s degree or other advanced programs. Associate’s degree programs were selected over certificate programs of the same title since cursory research indicated that associate’s programs tend to graduate more students.
• Emphasis was given to programs preparing students for employment in the seven industry sectors of primary interest: renewable energy, advanced energy, energy efficiency, bioscience, manufacturing, agriculture/biomass and green building.
Using these guidelines, project sponsor and partner representatives made the final selection of the programs to include in the survey. Where it was impossible to prioritize three programs, a randomization technique was applied to select three programs. The survey sample was not randomly selected, and therefore is most likely not fully representative of all programs listed in the Green Pathways Database, and some programs were added to the database after the survey was disseminated.
Distribution and Response On February 24, 2011, 803 web-surveys were distributed to 521 contacts via e-mail using the Voinovich School’s dedicated software program. Weekly e-mail reminders were sent to non-responding contacts for two weeks. The list of survey contacts was continually updated as responses were received from initial contacts. During the deployment, three additional programs were added to the sample. One program contact requested to complete the survey in paper form, and this request was accommodated. At the conclusion of the survey deployment, 269 surveys were available for analysis for a response rate of 33.4 percent. Responses to the survey were used to update information in the Green Pathways Database, including updating program names, removing programs that are no longer in operation and other details.

76
As with all surveys, non-response bias is an important consideration. One factor that may have caused such bias in this survey is the extent to which the program contacts believe their programs are green. Program contacts that believe their programs are green may have been more likely to participate in the survey than those contacts that do not self-identify as green.
Analysis For the survey items, the analysis included frequencies, comparisons between groups and means, where appropriate. The research team reviewed categorical items and collapsed or recoded as necessary. Due to item nonresponse, the number of respondents varied across questions. All percentages are based on the number of responses to that particular item. Frequency tables for the survey questions are located in Appendix F.

77
Appendix E: Educator Survey Instrument
GREEN JOBS TRAINING AND EDUCATION SURVEY
Please answer the following questions about your (degree type) in (program name) offered at (school name). For each question, please circle the answer that best describes your program and if applicable, provide us with additional details. If you do not know the answer to a question, please choose “Don’t know” and continue to the next question.
1. Is the above program name and certificate/degree type correct?
• Yes
• No
2. If you answered “Yes” above, please skip to question #3. If “No,” please enter the correct
information below. Correct program name______________________________________ Correct certificate/degree type _______________________________
3. How long has your program been in place?
• The program has not yet been offered
• Less than one year
• Between 1 and 2 years
• Between 3 and 5 years
• More than 5 years
• This program has been discontinued
• Don’t know
If your program has not yet been offered or has been discontinued, please discontinue the survey now and we thank you for your participation.

78
4. What industry sector(s) does your program prepare students to work in?
Please select all that apply. • Renewable Energy
o This sector covers activities related to developing and using alternative energy sources such as solar, wind, geothermal and biomass.
• Advanced Energy o This sector covers activities related to traditional sources of energy
(such as oil, coal, gas and nuclear) that are undergoing significant green technological changes in order to increase energy output without increasing carbon dioxide emissions.
• Energy Efficiency o This sector covers activities related to increasing energy efficiency
(broadly defined), making energy demand response more effective, constructing "smart grids," and other energy efficient activities.
• Bioscience o This sector covers activities related to processing agricultural products
into biofuels and manufacturing products from organic materials. This sector also includes research and development in the fields of biotechnology, engineering and physical and life sciences related to reducing dependence on fossil fuels or increasing energy efficiency.
• Manufacturing o This sector covers activities related to industrial manufacturing of
green technology as well as energy efficient manufacturing processes.
• Agriculture/Biomass o This sector covers activities related to growing crops that can be used
to produce alternative fuels. • Green Building
o This sector covers activities related to constructing new green buildings, retrofitting residential and commercial buildings and installing other green construction technology.
• Other (Please specify)________________________________
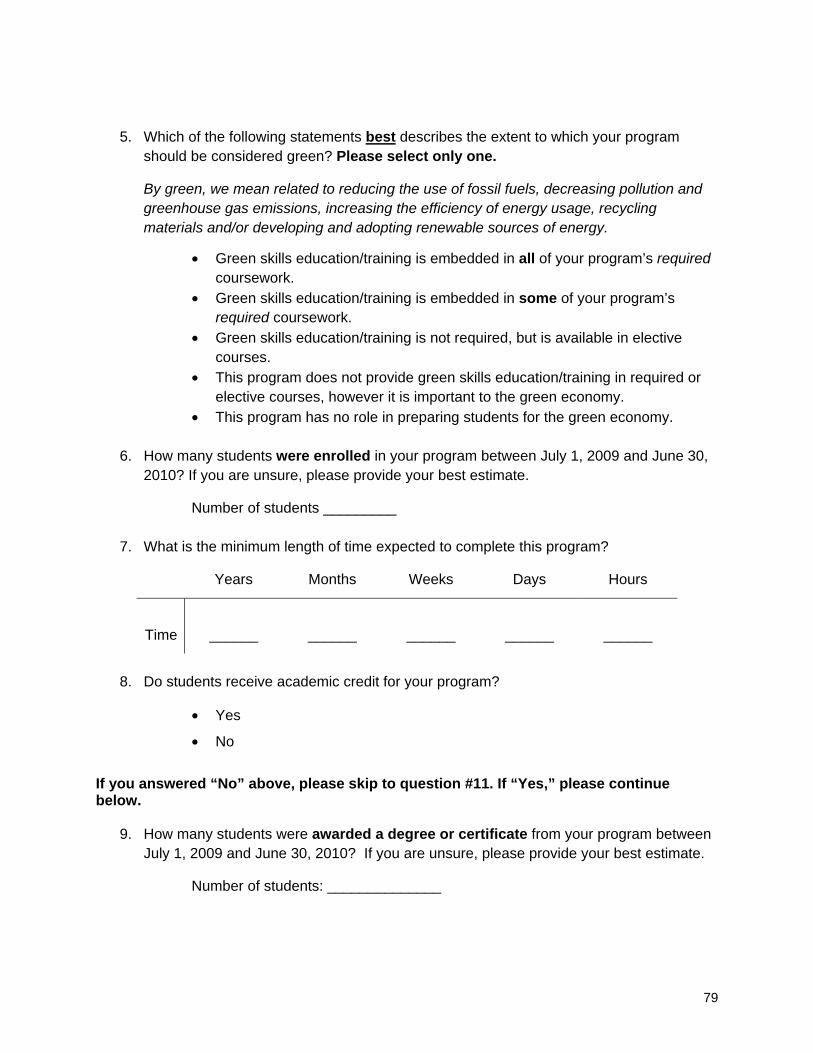
79
5. Which of the following statements best describes the extent to which your program should be considered green? Please select only one.
By green, we mean related to reducing the use of fossil fuels, decreasing pollution and greenhouse gas emissions, increasing the efficiency of energy usage, recycling materials and/or developing and adopting renewable sources of energy.
• Green skills education/training is embedded in all of your program’s required coursework.
• Green skills education/training is embedded in some of your program’s required coursework.
• Green skills education/training is not required, but is available in elective courses.
• This program does not provide green skills education/training in required or elective courses, however it is important to the green economy.
• This program has no role in preparing students for the green economy.
6. How many students were enrolled in your program between July 1, 2009 and June 30, 2010? If you are unsure, please provide your best estimate.
Number of students _________
7. What is the minimum length of time expected to complete this program?
Years Months Weeks Days Hours
Time ______ ______ ______ ______ ______
8. Do students receive academic credit for your program?
• Yes
• No
If you answered “No” above, please skip to question #11. If “Yes,” please continue below.
9. How many students were awarded a degree or certificate from your program between
July 1, 2009 and June 30, 2010? If you are unsure, please provide your best estimate.
Number of students: ______________

80
10. How many credit hours are required to be awarded this degree or certificate?
Minimum number of credit hours: _____________
11. Which of the following statements apply to the creation of your program? Please select all that apply.
• The program was created in response to employer requests for education/training in this field.
• The program was created in response to student requests for education/training in this field.
• The program was created in response to a perceived current need in the labor market.
• The program was created in response to a perceived future need in the labor market.
• The program was created because of increased funding for green education/training.
• Other (Please specify)_______________________________ • Don’t know
12. Were industry standards and/or certification criteria used to develop your program’s curriculum?
• Yes
• No
• Don’t know
If you answered “No” or “Don’t know,” please skip to question #14. If “Yes,” please continue below with question #13.
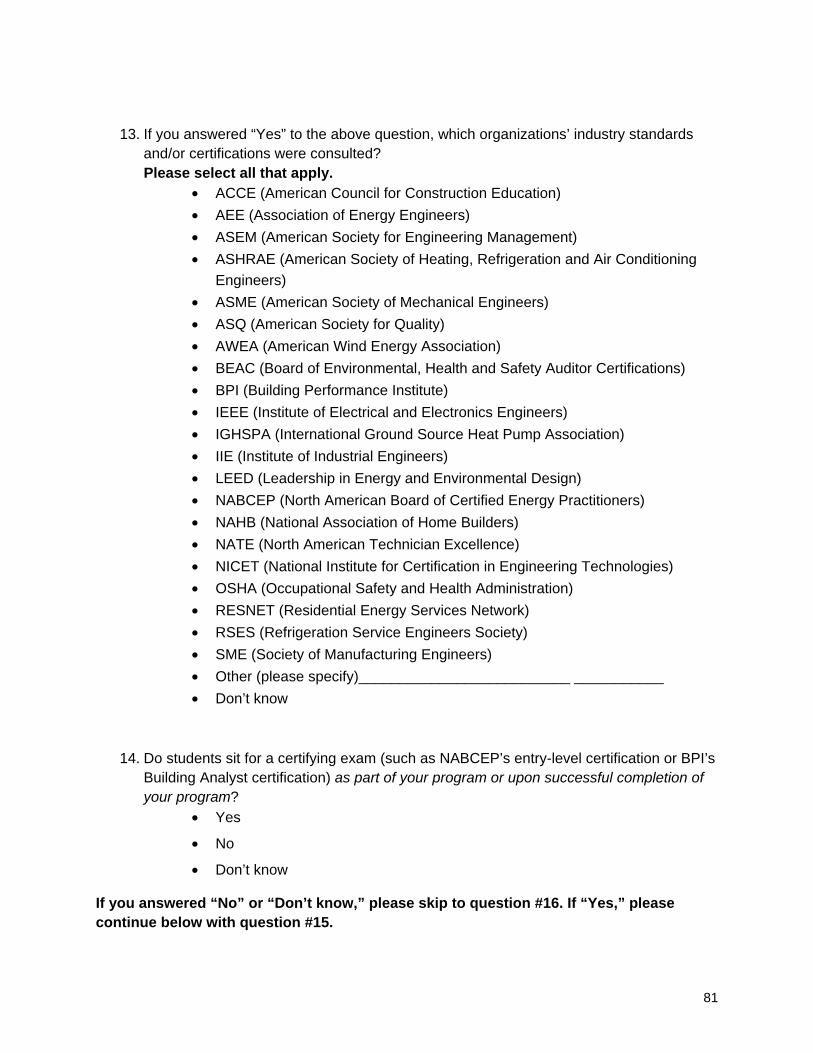
81
13. If you answered “Yes” to the above question, which organizations’ industry standards and/or certifications were consulted?
Please select all that apply. • ACCE (American Council for Construction Education) • AEE (Association of Energy Engineers) • ASEM (American Society for Engineering Management) • ASHRAE (American Society of Heating, Refrigeration and Air Conditioning
Engineers) • ASME (American Society of Mechanical Engineers) • ASQ (American Society for Quality) • AWEA (American Wind Energy Association) • BEAC (Board of Environmental, Health and Safety Auditor Certifications) • BPI (Building Performance Institute) • IEEE (Institute of Electrical and Electronics Engineers) • IGHSPA (International Ground Source Heat Pump Association) • IIE (Institute of Industrial Engineers) • LEED (Leadership in Energy and Environmental Design) • NABCEP (North American Board of Certified Energy Practitioners) • NAHB (National Association of Home Builders) • NATE (North American Technician Excellence) • NICET (National Institute for Certification in Engineering Technologies) • OSHA (Occupational Safety and Health Administration) • RESNET (Residential Energy Services Network) • RSES (Refrigeration Service Engineers Society) • SME (Society of Manufacturing Engineers) • Other (please specify)__________________________ ___________ • Don’t know
14. Do students sit for a certifying exam (such as NABCEP’s entry-level certification or BPI’s Building Analyst certification) as part of your program or upon successful completion of your program?
• Yes
• No
• Don’t know
If you answered “No” or “Don’t know,” please skip to question #16. If “Yes,” please continue below with question #15.

82
15. If you answered “Yes” to the above question, what organizations sponsor a certifying
exam that students sit for as part of your program or upon successful completion of your program? Please select all that apply.
• AEE (Association of Energy Engineers) • ASEM (American Society for Engineering Management) • ASHRAE (American Society of Heating, Refrigeration and Air Conditioning
Engineers) • ASME (American Society of Mechanical Engineers) • ASQ (American Society for Quality) • BEAC (Board of Environmental, Health and Safety Auditor Certifications) • BPI (Building Performance Institute) • IEEE (Institute of Electrical and Electronics Engineers) • IGHSPA (International Ground Source Heat Pump Association) • IIE (Institute of Industrial Engineers) • LEED (Leadership in Energy and Environmental Design) • NABCEP (North American Board of Certified Energy Practitioners) • NATE (North American Technician Excellence) • NICET (National Institute for Certification in Engineering Technologies) • RESNET (Residential Energy Services Network) • RSES (Refrigeration Service Engineers Society) • SME (Society of Manufacturing Engineers) • Other (Please specify)__________________________ ___________ • Don’t know
16. Which of the following instructional methods are used in your program’s required courses? Please select all that apply.
• Classroom instruction
• Web-based instruction
• Hands-on training (other than co-op, internship or apprenticeship)
• Don’t know
17. If your program’s courses contain hands-on-training, about what percentage of the
required coursework is spent on hands-on training? Percentage of required coursework _______________%
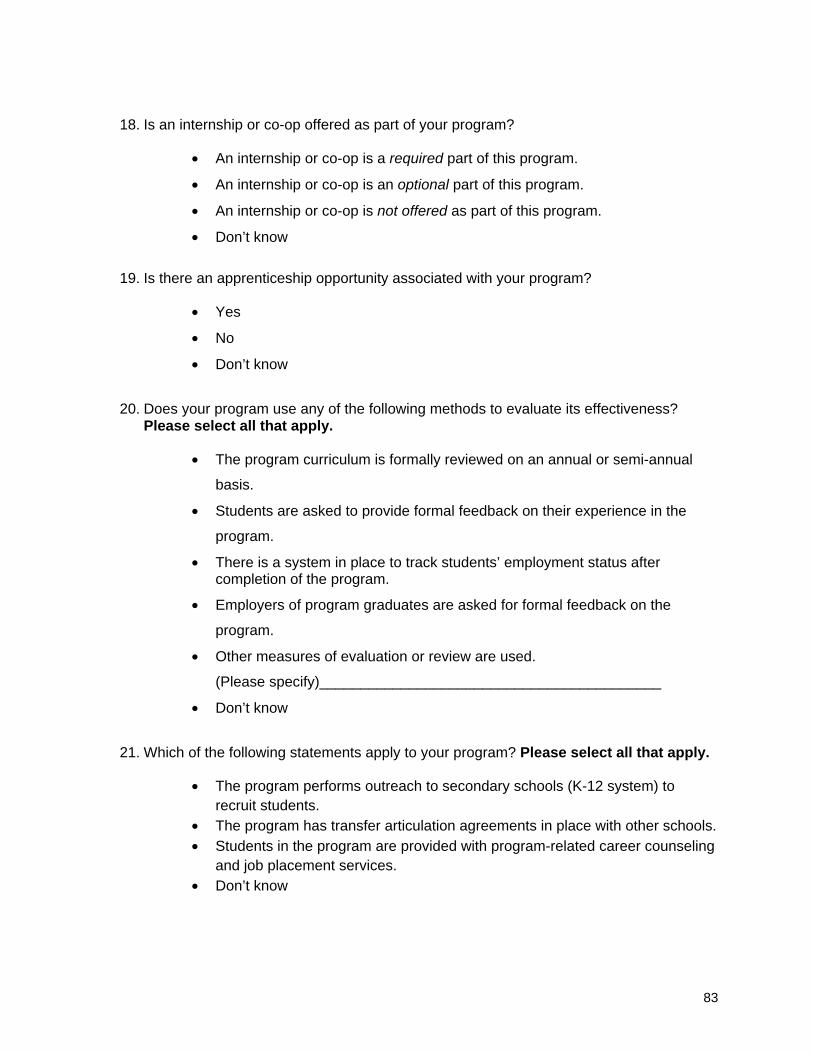
83
18. Is an internship or co-op offered as part of your program?
• An internship or co-op is a required part of this program.
• An internship or co-op is an optional part of this program.
• An internship or co-op is not offered as part of this program.
• Don’t know
19. Is there an apprenticeship opportunity associated with your program?
• Yes
• No
• Don’t know
20. Does your program use any of the following methods to evaluate its effectiveness?
Please select all that apply.
• The program curriculum is formally reviewed on an annual or semi-annual
basis.
• Students are asked to provide formal feedback on their experience in the
program.
• There is a system in place to track students’ employment status after completion of the program.
• Employers of program graduates are asked for formal feedback on the
program.
• Other measures of evaluation or review are used.
(Please specify)__________________________________________
• Don’t know
21. Which of the following statements apply to your program? Please select all that apply.
• The program performs outreach to secondary schools (K-12 system) to recruit students.
• The program has transfer articulation agreements in place with other schools. • Students in the program are provided with program-related career counseling
and job placement services. • Don’t know

84
The following question asks about any formal or informal partnerships your program may have with other groups involved with green jobs training and promotion. These partners may assist your program in a variety of ways, including (but not limited to) providing advice about the program curriculum, helping with internships or job placement and/or referring students to your program.
22. Does your program have a partnership with any of the following types of organizations?
Please select all that apply. • Educators at other schools
• Labor unions
• Local employers
• State and local government agencies
• Non-governmental organizations that are interested in green jobs education/training (such as professional organizations, chambers of commerce and local non-profit training programs)
• None of the above
• Don’t know
For each of the potential partners listed above, there is a question regarding the services they provide. If you answered “None of the above” or “Don’t know,” please skip to question #28. For any partners identified, please find the appropriate question(s) below.
23. If “Educators at other schools” are involved with your program, are any of these services
provided to your program by educators at other schools? Please select all that apply.
• Assistance with curriculum development
• Review existing curriculum
• Participation in the program’s advisory committee
• Help with internship, co-op and/or apprenticeship opportunities for students
• Assistance with job placement for students
• Referring students to your program
• Donation of training equipment
• Teaching assistance (serving as guest instructors or adjunct faculty, providing tours of relevant facilities, etc.)
• Other (Please specify)________________________
• Don’t know

85
24. If “Labor unions” are involved with your program, are any of these services provided to your program by labor unions? Please select all that apply.
• Assistance with curriculum development
• Review existing curriculum
• Participation in the program’s advisory committee
• Help with internship, co-op and/or apprenticeship opportunities for students
• Assistance with job placement for students
• Referring students to your program
• Donation of training equipment
• Teaching assistance (serving as guest instructors or adjunct faculty, providing tours of relevant facilities, etc.)
• Other (Please specify)________________________
• Don’t know
25. If “Local employers” are involved with your program, are any of these services provided to your program by local employers? Please select all that apply.
• Assistance with curriculum development
• Review existing curriculum
• Participation in the program’s advisory committee
• Help with internship, co-op and/or apprenticeship opportunities for students
• Assistance with job placement for students
• Referring students to your program
• Donation of training equipment
• Teaching assistance (serving as guest instructors or adjunct faculty, providing tours of relevant facilities, etc.)
• Other (Please specify)________________________
• Don’t know

86
26. If “State and local government agencies” are involved with your program, are any of these services provided to your program by State and local government agencies? Please select all that apply.
• Assistance with curriculum development
• Review existing curriculum
• Participation in the program’s advisory committee
• Help with internship, co-op and/or apprenticeship opportunities for students
• Assistance with job placement for students
• Referring students to your program
• Donation of training equipment
• Teaching assistance (serving as guest instructors or adjunct faculty, providing tours of relevant facilities, etc.)
• Other (Please specify)________________________
• Don’t know
27. If “Non-governmental organizations” are involved with your program, are any of these services provided to your program by non-governmental organizations? Please select all that apply.
• Assistance with curriculum development
• Review existing curriculum
• Participation in the program’s advisory committee
• Help with internship, co-op and/or apprenticeship opportunities for students
• Assistance with job placement for students
• Referring students to your program
• Donation of training equipment
• Teaching assistance (serving as guest instructors or adjunct faculty, providing tours of relevant facilities, etc.)
• Other (Please specify)________________________
• Don’t know

87
28. Is there any other information about your program, in particular, or green education/training, in general, that you would like to include? __________________________________________________________________________________________________________________________________________________________________________________________________________________
Thank you for your participation in this project. When the Green Jobs Report is published on the web, we will forward you the link to this report.

88
Appendix F: Green Jobs Training and Education Survey Frequency Tables
3. How long has your program been in place? Frequency PercentLess than one year 15 5.6%Between 1 and 2 years 11 4.1%Between 3 and 5 years 23 8.6%More than 5 years 220 81.8%Total 269 100.0%
If your program has not yet been offered or has been discontinued, please discontinue the survey now and we thank you for your participation.
4. What industry sector(s) does your program prepare students to work in? (Please select all that apply.)
Frequency PercentRenewable Energy 124 47.5%Advanced Energy 102 39.1%Energy Efficiency 117 44.8%Bioscience 78 29.9%Manufacturing 111 42.5%Agriculture/Biomass 63 24.1%Green Building 78 29.9%Other 84 32.2%
Note: Eight respondents did not answer this question. Respondents could choose multiple responses.

89
5. Which of the following statements best describes the extent to which your program should be considered green?
Frequency PercentGreen skills education/training is embedded in all your program's required coursework. 20 7.9%Green skills education/training is embedded in some of your program's required coursework. 123 48.8%Green skills education/training is not required, but is available in elective courses. 46 18.3%This program does not provide green skills education/training in required or elective courses. 50 19.8%This program has no role in preparing students for the green economy. 13 5.2%Total 252 100.0%Note: Seventeen respondents did not answer this question.
6. How many students were enrolled in your program between July 1, 2009 and June 30, 2010?
Mean Median Minimum Maximum71.1 30 0 2,000
Note: Seventeen respondents did not answer this question.
7. What is the minimum length of time expected to complete this program?
Frequency PercentOne year or less 46 18.1%13 months to 2 years 112 44.1%25 months to 47 months 11 4.3%4 years 74 29.1%More than 4 years 11 4.3%Total 254 100.0%Note: Fifteen respondents did not answer this question.
8. Do students receive academic credit for your program?
Frequency PercentYes 255 97.3%No 7 2.7%Total 262 100.0%Note: Seven respondents did not answer this question.

90
If you answered "No" above, please skip to question #11. If "Yes," please continue below.
9. How many students were awarded a degree or certificate from your program between July 1, 2009 and June 30, 2010?
Mean Median Minimum Maximum15.7 7 0 300
Note: Sixteen respondents did not answer this question.
Question #10 (How many credit hours are required to be awarded this degree or certificate?) was omitted due to inconsistency of responses.
11. Which of the following statements apply to the creation of your program? (Please select all that apply.)
Frequency PercentThe program was created in response to employer requests for education/training in this field. 137 59.3%The program was created in response to student requests for education/training in this field. 73 31.6%The program was created in response to a perceived current need in the labor market. 148 64.1%The program was created in response to a perceived future need in the labor market. 120 51.9%The program was created because of increased funding for green education/training. 5 2.2%The program has been in place for many years. 16 6.9%Other 13 5.6%
Note: Thirty-eight respondents did not answer this question. Respondents could choose multiple responses.
12. Were industry standards and/or certifications used to develop your program's curriculum?
Frequency PercentYes 142 63.7%No 81 36.3%Total 223 100.0%Note: Forty-six respondents did not answer this question.
If you answered "No" or "Don't know," please skip to question #14. If "Yes, please continue below with question #13
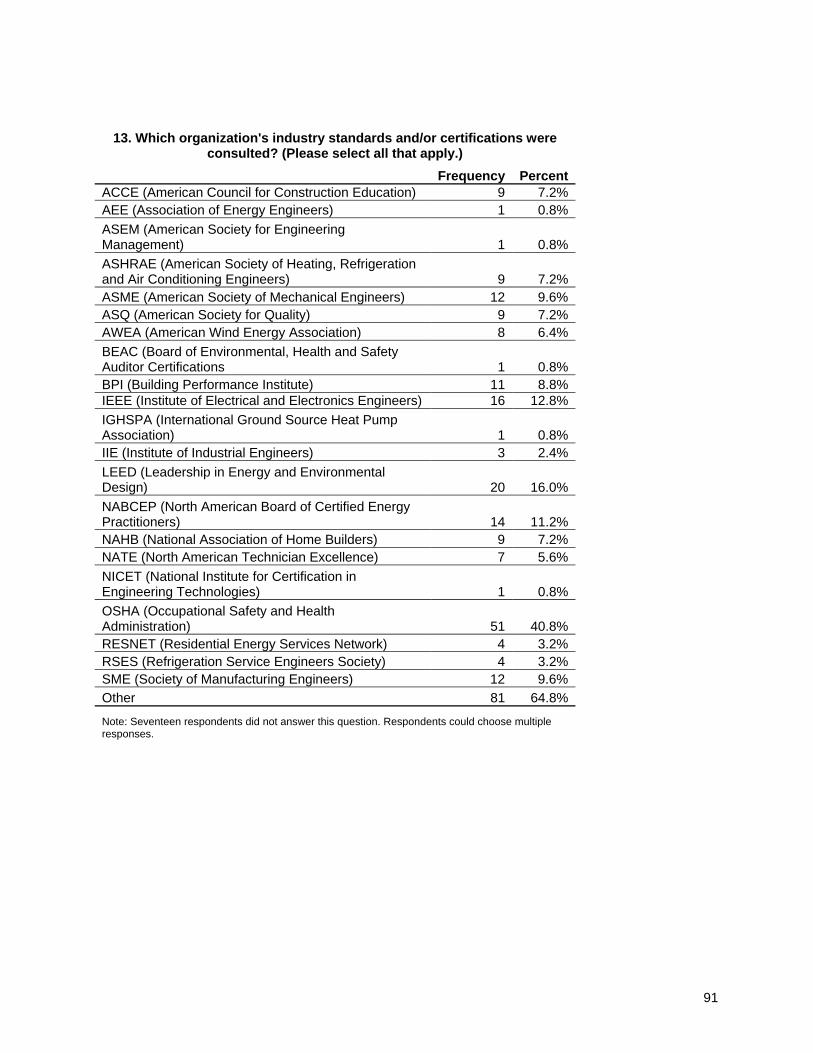
91
13. Which organization's industry standards and/or certifications were consulted? (Please select all that apply.)
Frequency PercentACCE (American Council for Construction Education) 9 7.2%AEE (Association of Energy Engineers) 1 0.8%ASEM (American Society for Engineering Management) 1 0.8%ASHRAE (American Society of Heating, Refrigeration and Air Conditioning Engineers) 9 7.2%ASME (American Society of Mechanical Engineers) 12 9.6%ASQ (American Society for Quality) 9 7.2%AWEA (American Wind Energy Association) 8 6.4%BEAC (Board of Environmental, Health and Safety Auditor Certifications 1 0.8%BPI (Building Performance Institute) 11 8.8%IEEE (Institute of Electrical and Electronics Engineers) 16 12.8%IGHSPA (International Ground Source Heat Pump Association) 1 0.8%IIE (Institute of Industrial Engineers) 3 2.4%LEED (Leadership in Energy and Environmental Design) 20 16.0%NABCEP (North American Board of Certified Energy Practitioners) 14 11.2%NAHB (National Association of Home Builders) 9 7.2%NATE (North American Technician Excellence) 7 5.6%NICET (National Institute for Certification in Engineering Technologies) 1 0.8%OSHA (Occupational Safety and Health Administration) 51 40.8%RESNET (Residential Energy Services Network) 4 3.2%RSES (Refrigeration Service Engineers Society) 4 3.2%SME (Society of Manufacturing Engineers) 12 9.6%Other 81 64.8%
Note: Seventeen respondents did not answer this question. Respondents could choose multiple responses.

92
14. Do students sit for a certifying exam as part of your program or upon successful completion of your program?
Frequency PercentYes 36 14.2%No 217 85.8%Total 253 100.0%Note: Sixteen respondents did not answer this question.
If you answered "No" or "Don't know," please skip to question #16. If "Yes," please continue below with question #15.
15. What organizations sponsor a certifying exam that students sit for as part of your program or upon successful completion of your program?
Frequency PercentASQ (American Society for Quality) 1 2.9%BPI (Building Performance Institute) 2 5.9%LEED (Leadership in Energy and Environmental Design) 1 2.9%NABCEP (North American Board of Certified Energy Practitioners) 5 14.7%OSHA (Occupational Safety and Health Administration) 7 20.6%SME (Society of Manufacturing Engineers) 1 2.9%Other 29 85.3%
Note: Two respondents did not answer this question. Respondents could choose multiple responses.
16. Which of the following instructional methods are used in your program's required courses? (Please select all that apply.)
Frequency PercentClassroom instruction 252 99.2%Web-based instruction 93 36.6%Hands-on training (other than co-op, internship, or apprenticeship) 200 78.7%
Note: Fifteen respondents did not answer this question. Respondents could choose multiple responses.

93
17. About what percentage of the required coursework is spent on hands-on training?
Frequency Percent24% or fewer 55 30.4%25% to 49% 45 24.9%50% to 74% 65 35.9%75% or more 16 8.8%Total 181 100.0%Note: Nineteen respondents did not answer this question.
18. Is an internship or co-op offered as part of your program?
Frequency PercentAn internship or co-op is a required part of this program 56 22.9%An internship or co-op is an optional part of this program 103 42.0%An internship or co-op is not offered as part of this program 86 35.1%Total 245 100.0%Note: Twenty-four respondents did not answer this question.
19. Is there an apprenticeship opportunity associated with your program?
Frequency Percent Yes 44 18.9% No 189 81.1% Total 233 100.0% Note: Thirty-six respondents did not answer this question.

94
20. Does your program use any of the following methods to evaluate its effectiveness? (Please select all that apply.)
Frequency PercentThe program curriculum is formally reviewed on an annual or semi-annual basis. 160 68.7%Students are asked to provide formal feedback on their experience in the program. 197 84.5%There is a system in place to track students' employment status after completion of the program. 124 53.2%Employers of program graduates are asked for formal feedback on the program. 100 42.9%Other measures of evaluation or review are used. 64 27.5%
Note: Thirty-six respondents did not answer this question. Respondents could choose multiple responses.
21. Which of the following statements apply to your program? (Please select all that apply.)
Frequency PercentThe program performs outreach to secondary schools (K-12 system) to recruit students. 118 57.3%The program has transfer articulation agreements in place with other schools. 129 62.6%Students in the program are provided with program-related career counseling and job placement services. 154 74.8%
Note: Sixty-three respondents did not answer this question. Respondents could choose multiple responses.
22. Does your program have a partnership with any of the following types of organizations? (Please select all that apply.)
Frequency PercentEducators at other schools 133 55.6%Labor unions 15 6.3%Local employers 158 66.1%State and local government agencies 101 42.3%Non-governmental organizations that are interested in green jobs education/training 92 38.5%None of the above 39 16.3%Note: Thirty respondents did not answer this question. Respondents could choose multiple responses.
If you answered “None of the above” or “Don’t know” to question #22, please skip to question #28. For any partners identified, please answer the appropriate question(s) below.

95
23. Are any of these services provided to your program by educators at other schools? (Please select all that apply.)
Frequency Percent Assistance with curriculum development 43 37.7% Review existing curriculum 60 52.6% Participation in the program's advisory committee 56 49.1% Help with internship, co-op and/or apprenticeship opportunities for students 29 25.4% Assistance with job placement for students 22 19.3% Referring students to your program 82 71.9% Donation of training equipment 13 11.4% Teaching assistance (serving as guest instructors or adjunct faculty, providing tours of relevant facilities, etc.) 46 40.4% Other 7 6.1%
Note: Nineteen respondents did not answer this question. Respondents could choose multiple responses.
24. Are any of these services provided to your program by labor unions? (Please select all that apply.)
Frequency Percent Assistance with curriculum development 7 63.6% Review existing curriculum 8 72.7% Participation in the program's advisory committee 10 90.9% Help with internship, co-op and/or apprenticeship opportunities for students 8 72.7% Assistance with job placement for students 8 72.7% Referring students to your program 9 81.8% Donation of training equipment 3 27.3% Teaching assistance (serving as guest instructors or adjunct faculty, providing tours of relevant facilities, etc.) 7 63.6% Other 1 9.1% Note: Four respondents did not answer this question. Respondents could choose multiple responses.

96
25. Are any of these services provided to your program by local employers? (Please select all that apply.)
Frequency Percent Assistance with curriculum development 93 60.4% Review existing curriculum 106 68.8% Participation in the program's advisory committee 125 81.2% Help with internship, co-op and/or apprenticeship opportunities for students 121 78.6% Assistance with job placement for students 101 65.6% Referring students to your program 97 63.0% Donation of training equipment 74 48.1% Teaching assistance (serving as guest instructors or adjunct faculty, providing tours of relevant facilities, etc.) 98 63.6% Other 4 2.6%
Note: Four respondents did not answer this question. Respondents could choose multiple responses.
26. Are any of these services provided to your program by state and local government? (Please select all that apply.)
Frequency Percent Assistance with curriculum development 29 31.9% Review existing curriculum 33 36.3% Participation in the program's advisory committee 43 47.3% Help with internship, co-op and/or apprenticeship opportunities for students 56 61.5% Assistance with job placement for students 43 47.3% Referring students to your program 52 57.1% Donation of training equipment 13 14.3% Teaching assistance (serving as guest instructors or adjunct faculty, providing tours of relevant facilities, etc.) 34 37.4% Other 4 4.4%
Note: Ten respondents did not answer this question. Respondents could choose multiple responses.

97
27. Are any of these services provided to your program by non-government organizations that are interested in green jobs education/training?
(Please select all that apply.)
Frequency Percent Assistance with curriculum development 28 38.4% Review existing curriculum 32 43.8% Participation in the program's advisory committee 47 64.4% Help with internship, co-op and/or apprenticeship opportunities for students 39 53.4% Assistance with job placement for students 35 47.9% Referring students to your program 42 57.5% Donation of training equipment 19 26.0% Teaching assistance (serving as guest instructors or adjunct faculty, providing tours of relevant facilities, etc.) 26 35.6% Other 1 1.4%
Note: Nineteen respondents did not answer this question. Respondents could choose multiple responses.

98
Appendix G: Green Pathways Database Methodology Introduction and Overview This appendix supplements the Green Pathways Database chapter by providing methodological details regarding the development of the database. Information from the database will be provided in searchable format at two complementary websites to be established by the Ohio Department of Job and Family Services and the Ohio Board of Regents, respectively: http://ohiolmi.com/research/research.htm and http://www.ohiogreenpathways.org.
Key Resources Utilized To develop the program database, the researchers utilized the following key resources:
• Institutions within the University System of Ohio (USO) • The Occupational Information Network (O*Net) • The Occupational Supply Demand System (OSDS)
Institutions within the University System of Ohio (USO) Individual USO institutions provided information about green-related education and training programs through a process described in the Green Pathways Database chapter of this report.
The Occupational Information Network (O*Net) A 2009 O*Net document entitled The Greening of the World of Work was utilized as the basis for defining green occupations and linking occupations to sectors of the green economy.63 O*Net’s definitions of green occupations and sectors are provided in the introduction to this report, and a list of O*Net-defined green occupations is provided in Appendix B.
The Occupational Information Network (O*Net) was created by the U.S. Department of Labor and several other partners in 1998 and has since become a robust repository of occupational information in the United States.64 O*Net utilizes the Standard Occupational Classification (SOC) system for assigning codes and titles to occupations and provides detailed information about skills, knowledge, abilities and other aspects of each SOC code and title.65 In recent years, O*Net has directly performed or compiled a substantial amount of research in relation to green jobs.66
63Dierdorff et al., Greening of the World. 64Mariani , Replace with a Database; Idem, O*NET Update. See http://www.onetonline.org/ for occupational information available online. 65“Standard Occupational Classification,” Bureau of Labor Statistics, accessed April 25, 2011, http://www.bls.gov/soc/home.htm; and “The O*NET® Content Model,” O*NET Resource Center, accessed April 25, 2011, http://www.onetcenter.org/content.html. 66“The Green Economy,” O*NET Resource Center, accessed April 25, 2011, http://www.onetcenter.org/green.html.
99
The Occupational Supply Demand System (OSDS) The Occupational Supply Demand System (OSDS) was utilized to help draw connections between occupations and education and training programs. OSDS provides “units of analysis” that link occupational codes (SOC codes and titles) to Classification of Instructional Program (CIP) codes and titles.67 Linking SOC codes and CIP codes first required assigning the appropriate CIP codes to Ohio programs – a challenge discussed in detail below.
It should be noted that the SOC-CIP connections shown within the OSDS “units of analysis” are not identical to those shown at O*Net Online. OSDS includes only a subset of the occupational and instructional code linkages that are evident at O*Net Online because one of OSDS’s primary purposes is to facilitate the comparison of educational supply with occupational demand. In facilitating such comparisons, the OSDS “units of analysis” exclude some SOC-CIP relationships shown at O*Net Online in an effort to avoid demand for certain occupations being counted multiple times in relation to a number of different CIP codes.68 OSDS was chosen as the preferred source for the SOC-CIP crosswalk utilized in developing the Green Pathways Database because it is consistent with the use of the OSDS “units of analysis” by the State of Ohio’s Labor Market Information Bureau in other applications.69
Methodological Challenges There were three persistent methodological challenges in creating the green program database:
• Defining green-related programs; • Reconciling program information provided directly by USO institutions with program
information available from the Integrated Post-Secondary Educational Data System (IPEDS); and
• Assigning Classification of Instructional Program (CIP) codes to programs.
Defining Green-Related Programs Two issues were confronted in defining green-related programs – one relating to occupational linkages and one related to degree- or certificate-granting status.
First, the definition of green-related education and training programs is open to interpretation, and USO institutions that have identified green-related programs to date have not utilized identical criteria. For example, some of the institution-identified programs are linkable to green-related occupations and some are not. All programs identified by institutions were included in the database along with information about whether or not each is linked to a green occupation. For approximately nine percent of the programs in the database (124 out of 1,327), a link to a green occupation identified by O*Net could not be established.
67“Occupational Supply Demand System,” Georgia Career Information Center, last modified February 2011, accessed April 25, 2001, http://www.occsupplydemand.org/. 68 Pamela Frugoli, Employment Training Administration, e-mail message to Zachary Holl, June 1, 2011. 69See, for example, “Ohio Skills Bank Data,” Ohio Department of Job and Family Services: Ohio Labor Market Information, last modified February 3, 2010, accessed April 25, 2011, http://ohiolmi.com/asp/SB/SkillsBank.htm; and Schaff, “Labor Market Information,” 10-12.

100
Second, researchers attempted to narrow the database to programs that granted a degree or certificate, but were unable to ascertain with certainty whether this criterion was met by each program. If an institution identified a program as green-related but researchers could not confirm that the program yields a degree or certificate for students, the program was kept in the database but its degree- or certificate-granting status was noted as unclear. There are 157 programs (about 12 percent of the total) in this category.
Reconciling Institution-Identified Programs with IPEDS-Identified Programs Researchers utilized two basic approaches to identify green-related education and training programs in the University System of Ohio. One approach focused on the programs defined as green-related by USO institutions themselves through the process explained in the Green Pathways Database chapter. A second approach focused on programs listed in a database obtained from IPEDS.
The two approaches differ mainly in how programs are named. There is no program name field that exists in both datasets that can be used as a way to match a program in one to a program in the other. The set of institution-identified programs includes program names and descriptions, but no CIP titles or codes, while the reverse is true for the IPEDS database, which provides CIP codes and CIP titles, but not the program names that institutions actually use in their own course catalogs or in other media. As a result of these differences, it is not possible to reconcile and combine the two sets of programs into a single, unified database of non-duplicated programs.
While some matches can be reasonably made between CIP titles in the IPEDS database and program names in the school-identified dataset, these cases are in the minority. For most programs in the institution-identified dataset, there is no reasonable match to a CIP title in the IPEDS database. Table 10 provides an illustration of this challenge in reference to one example school in the database.

101
Table 10. Green-Related Programs at an Ohio Technical College
Green-related Programs in IPEDS Dataset (n=24) Green-related Programs in School-Identified Dataset (n=10)Accounting Building Preservation/Restoration (1) Architectural Engineering Technology/Technician Civil Engineering Technology(1)Business Administration and Management, General Heating, Ventilation, and Air Conditioning (HVAC) (1)Business Communications Heating, Ventilation, and Air Conditioning (HVAC) (2)Business Information and Data Processing Services, Other Industrial Electronics (1)Business, General Power Plant Technology (1)Child Growth, Care and Development Studies Tooling and Machining (1) Computer and Information Sciences, Other Tooling and Machining (2)Computer Graphics Welding Technology (1)Computer Programming Welding Technology (2)Corrections/Correctional Administration Data Processing Technology/Technician Electrical, Electronic and Communications Engineering Technology/TechnicianEngineering Technology, General Enterprise Management and Operation, General General Office/Clerical and Typing Services Heating, Air Conditioning and Refrigeration Technology/Technician Machine Tool Technology/Machinist Machinist/Machine Technologist Management Information Systems and Services, Other System, Networking, and LAN/WAN Management/Manager Web Page, Digital/Multimedia and Information Resources Design Welder/Welding Technologist Welding Technology/Welder Sources: IPEDS and Green Pathways 2-year program catalog. O'Net Online was consulted in order to complete instructuional program titles that were incomplete in IPEDS.Notes: (1) = Associate's Degree Program, (2) = Certificate Program
Since these two datasets cannot be reconciled and combined, only one could be realistically utilized as the foundation for the Green Pathways Database. The school-identified programs were chosen over the IPEDS-identified programs for this purpose for two reasons. First, building on the recent work of USO institutions to identify green-related programs is preferable to building an IPEDS-based online database that does not align well with the information provided by these institutions. Second, in order for an online program inventory to be user-friendly, the information it provides must align well with the information provided by schools in their own course catalogs, websites and other media. Since the programs in the IPEDS database cannot be reasonably linked to the actual program names used by schools, it becomes impractical to populate the database with important program details available in school materials but not included in IPEDS.
Assigning CIP Codes to Programs CIP codes present both benefits and challenges in identifying green-related programs. On the benefit side, CIP codes provide an efficient and consistent way to link programs to green occupations (SOC codes) using the SOC-CIP crosswalk from OSDS. However, assigning the appropriate CIP codes to programs entails two essential methodological issues.

102
First, like traditional occupations, green occupations can be related to multiple CIP codes. For example, Solar Thermal Installers and Technicians can be potentially related to eleven different CIP codes within OSDS’s “unit of analysis” for General Construction.
Second, since the CIP-SOC crosswalk from OSDS was utilized to make program-occupation linkages in the Green Pathways Database, it is essential to assign CIP codes that are included in this crosswalk rather than selecting from the longer list of potential CIP codes available from the National Center for Education Statistics (NCES).70 For example, there is a CIP code and title – 15.0505: Solar Energy Technology – that seems like a potentially good option to consider for the Solar Thermal Installation program. However, this CIP code is not among the eleven options linked to the Solar Thermal Installer and Technician occupation in OSDS.
To identify the most appropriate CIP code for each program in the Green Pathways Database, Voinovich school researchers attempted to create the strongest alignment among four key variables: program description, SOC code and title, reported green occupation and CIP code and title. Reported green occupations are occupational titles identified by O*Net in developing The Greening of the World of Work and are listed in the appendices to that document. This process was applied somewhat differently in each case depending on the relative strength of these alignments. Ultimately, CIP code assignments fell into the following five categories.
Category 1 (43 percent of programs): There is clear alignment across program information, CIP code, SOC code and reported occupation. Among the programs in the database, these are the best-case scenarios because there are relatively clear relationships among the four variables being considered. For example, the Bachelor’s (B.S.) in Construction Management program at the University of Cincinnati is described as follows on the school website:
The bachelor of science degree in construction management is a recognized credential for a professional executive career in construction. Graduates typically are employed by general contractors, specialty contractors, construction management firms, building owners, corporate builders, developers, engineering firms, manufacturers, utility companies, government agencies, educational and health institutions. They often gain responsibility quickly, becoming job-site superintendents, project managers and officers of companies. Placement opportunities are available worldwide.71
This description aligns relatively well with a green occupation reported by O*Net (Construction Manager), which in turn links to a similar SOC title (11-9021: Construction Managers) and the CIP title that was ultimately assigned to the program (52.2001: Construction Management).72
70 “CIP 2010,” National Center for Education Statistics, accessed May 23, 2011, http://nces.ed.gov/ipeds/cipcode/Default.aspx?y=55 71“Construction Management,” University of Cincinnati, accessed April 25, 2011, http://www.uc.edu/degreeprograms/Program.aspx?program=20BSCM-CM. 72Other green occupations identified by O*NET that are linked to SOC 11-9021: Construction Managers and CIP 52.2001 Construction Management are Energy Efficient Site Foreman, Site Supervising Technical Operator, Weatherization Operations Manager, Environmental Construction Engineer, Program Manager –Environmental Construction, Solar Commercial Installation Electrician Foreman, and Solar Installation Manager/Project Foreman. See Dierdorff et al., Greening of the World, 64-80.
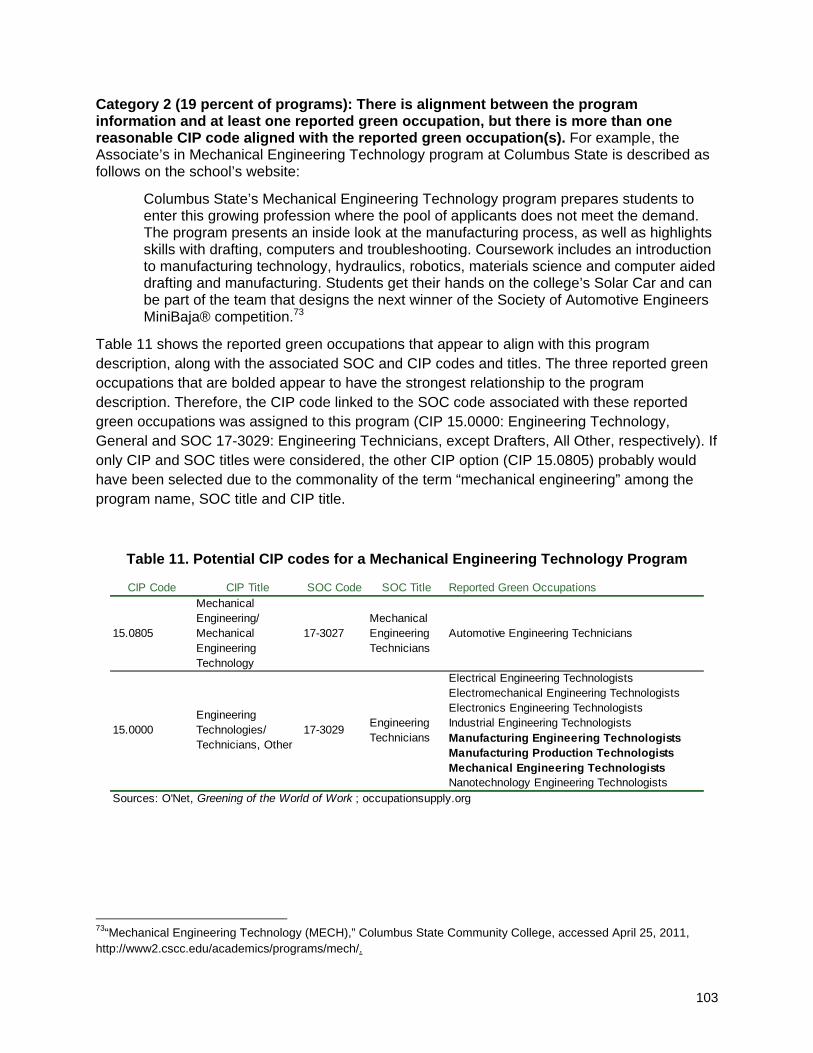
103
Category 2 (19 percent of programs): There is alignment between the program information and at least one reported green occupation, but there is more than one reasonable CIP code aligned with the reported green occupation(s). For example, the Associate’s in Mechanical Engineering Technology program at Columbus State is described as follows on the school’s website:
Columbus State’s Mechanical Engineering Technology program prepares students to enter this growing profession where the pool of applicants does not meet the demand. The program presents an inside look at the manufacturing process, as well as highlights skills with drafting, computers and troubleshooting. Coursework includes an introduction to manufacturing technology, hydraulics, robotics, materials science and computer aided drafting and manufacturing. Students get their hands on the college’s Solar Car and can be part of the team that designs the next winner of the Society of Automotive Engineers MiniBaja® competition.73
Table 11 shows the reported green occupations that appear to align with this program description, along with the associated SOC and CIP codes and titles. The three reported green occupations that are bolded appear to have the strongest relationship to the program description. Therefore, the CIP code linked to the SOC code associated with these reported green occupations was assigned to this program (CIP 15.0000: Engineering Technology, General and SOC 17-3029: Engineering Technicians, except Drafters, All Other, respectively). If only CIP and SOC titles were considered, the other CIP option (CIP 15.0805) probably would have been selected due to the commonality of the term “mechanical engineering” among the program name, SOC title and CIP title.
Table 11. Potential CIP codes for a Mechanical Engineering Technology Program
CIP Code CIP Title SOC Code SOC Title Reported Green Occupations
15.0805
Mechanical Engineering/ Mechanical Engineering Technology
17-3027Mechanical Engineering Technicians
Automotive Engineering Technicians
Electrical Engineering TechnologistsElectromechanical Engineering TechnologistsElectronics Engineering TechnologistsIndustrial Engineering TechnologistsManufacturing Engineering TechnologistsManufacturing Production TechnologistsMechanical Engineering TechnologistsNanotechnology Engineering Technologists
Sources: O'Net, Greening of the World of Work ; occupationsupply.org
15.0000Engineering Technologies/ Technicians, Other
17-3029 Engineering Technicians
73“Mechanical Engineering Technology (MECH),” Columbus State Community College, accessed April 25, 2011, http://www2.cscc.edu/academics/programs/mech/.

104
Category 3 (34 percent of programs): There are no reported green occupations that clearly align with the program description, but there are SOC codes/titles that do. For example, the Associate’s in Plastics Engineering Technology program at Northwest State is described as follows on the school’s website:
Plastics is one of the fastest growing manufacturing industries today…Students will receive specialized training in thermoplastic materials, injection molding and plastics testing. Graduates will also be skilled in various processes such as blow molding, extrusion and thermoforming. Career Options: Job titles in this field can include Molding Technician, Production Supervisor, Design and Development and Quality Control Technician to name a few...An increase in workers trained in the field will stem from manufacturers substituting plastic parts for those that had been manufactured from metal in the past.74
In this example, there are no reported green occupations in O*Net’s The Greening of the World of Work that appear to align directly with the emphasis of the program – in this case, plastics. However, a search of SOC codes identified several codes related to plastics and/or other aspects of the online program description, as shown in Table 12. All of these SOC codes are related to CIP 48.0501: Machining Tool Technology, which is the CIP code ultimately assigned to this program. It is interesting to note that there is a CIP code for Plastics Engineering Technology (15.0607), but it maps to an SOC code that does not appear to be as strongly related to the emphasis of this particular program.75
74“Plastics Engineering Technology,” Northwest State Community College, accessed April 25, 2011, http://www.northweststate.edu/Academics/Engineering/pdf/Plastics.pdf. 75This CIP code maps to SOC 17-3029:Engineering Technicians, Except Drafters, All Other, which is related to the following reported green occupations: Electrical Engineering Technologists, Electromechanical Engineering Technologists, Electronics Engineering Technologists, Industrial Engineering Technologists, Manufacturing Engineering Technologists, Manufacturing Production Technologists, Mechanical Engineering Technologists. See “13 O*Net SOC codes matching ‘17-3029,’” O*Net Online, accessed May 23, 2011, http://www.onetonline.org/find/quick?s=17-3029.

105
Table 12. SOC Codes Related to CIP 48.0501: Machining Tool Technology
SOC Code SOC TitleReported Green
Occupation51-4011 Computer-Controlled Machine Tool Operators, Metal and
PlasticCNC Operators
51-4021 Extruding and Drawing Machine Setters, Operators, and Tenders, Metal and Plastic
None
51-4031 Cutting, Punching, and Press Machine Setters, Operators, and Tenders, Metal and Plastic
Cutting, Punching and Press Machine Operators
51-4032 Drilling and Boring Machine Tool Setters, Operators, and Tenders, Metal and Plastic
Drilling & Boring Operators
51-4033 Grinding, Lapping, Polishing, and Buffing Machine Tool Setters, Operators, and Tenders, Metal and Plastic
None
51-4034 Lathe and Turning Machine Tool Setters, Operators, and Tenders, Metal and Plastic
None
51-4035 Milling and Planing Machine Setters, Operators, and Tenders, Metal and Plastic
None
Geo-thermal Heat Pump MachinistsHydro-electric Component MachinistsMachinistsWind Turbine Machinists
51-4052 Computer-Controlled Machine Tool Operators, Metal and Plastic
None
51-4061 Model Makers, Metal and Plastic None51-4062 Patternmakers, Metal and Plastic None51-4072 Molding, Coremaking, and Casting Machine Setters,
Operators, and Tenders, Metal and PlasticNone
51-4081 Multiple Machine Tool Setters, Operators, and Tenders, Metal and Plastic
None
51-4191 Heat Treating Equipment Setters, Operators, and Tenders, Metal and Plastic
None
51-4193 Plating and Coating Machine Setters, Operators, and Tenders, Metal and Plastic
None
51-4194 Tool Grinders, Filers, and Sharpeners None51-4199 Metal Workers and Plastic Workers, All Other NoneSources: O'Net, Greening of the World of Work ; occupationsupply.org
Machinists51-4041
Category 4 (3 percent of programs): There are no reported green occupations or SOC codes/titles that align well with the program description. This is the least preferred approach to matching programs to CIP codes because the occupational linkages are very unclear. For programs in this category, an appropriate match to the program description could not be found among the SOC titles included in the OSDS “units of analysis” or the reported green occupations provided in O*Net’s The Greening of the World of Work. In some cases, this may be explained by the fact that the OSDS “units of analysis” only include a subset of potential SOC-CIP relationships as described previously in this appendix. In these cases, the CIP codes associated with the closest SOC options available were assigned to the program. Example
106
program names in this category include Master of Public Administration, Public Health, Entrepreneurship and International Hospitality.
Category 5 (less than 1 percent of programs): There is no CIP code associated with the program or SOC code. In a small number of cases, programs in the database could not be reasonably linked to any SOC or CIP code. Example program names in this category include Going Green at Home and Going Green in the Workplace. In these cases, no CIP code was assigned.
The methodology described above for assigning CIP codes to programs does not always offer the specificity and/or flexibility necessary to manage all possible situations. As is evident at the OSDS website and in several of the examples discussed above, CIP codes often link to more than one SOC code and vice versa. There are numerous CIP codes that could be reasonably assigned to some programs in the database, each of which may then be linked to multiple SOC codes and reported green occupations. Therefore, assigning only one CIP code to each program in the database has the potential to suggest a more limited range of program-occupation linkages than is actually the case for some programs.
Nonetheless, this approach was taken in an effort to most clearly highlight the linkages between programs and the green economy. Given the limiting nature of this approach, the researchers made every reasonable effort to avoid characterizing any program too narrowly. Where possible, a general CIP code – typically ending in .0000 (general) or .9999 (other) – was selected over more specific options in order to avoid suggesting a program description that is too narrow. In reference to the Solar Thermal Installation program described above, for example, the pertinent SOC code maps to fairly specific CIP titles such as Ironworking and Plumbing as well as Construction Trades, General. In such cases, the more general option was typically selected.
It would certainly be reasonable to assign more than one CIP code to some programs so that an SOC-CIP crosswalk would illustrate more program-occupation relationships than the Green Pathways Database currently does. However, it is probably advisable to seek some level of input or consensus among USO institutions regarding the assignment of CIP codes to programs for the purposes of the green program database. Such an effort is probably best facilitated by first reviewing the single CIP codes currently assigned to each program and then moving on to multiple-code assignments as warranted and agreed upon by participating institutions.
Additional Comments on Database Contents and Methodology A detailed data dictionary has been provided to the project sponsors in order to explain all of the fields in the Green Pathways Database. Below are comments regarding some of the fields.
Degree Types. Degree types were collapsed into broad categories in order to minimize the number of unique degree types within the database and make it more user-friendly. For example, there are three different types of associate’s degrees among the identified programs: A.A.B., A.A.S. and A.T.S. The database has one field that collapses such degree variants into one category – in this case, associate’s degree – and then another field that provides more specific information about degree type as appropriate.

107
School Contact Information. The database does not include individual people as contacts for each program since it is anticipated that such information is likely to become inaccurate as personnel involved in each program may change. Rather, a school webpage address is provided for each program. Every effort was made to find the specific web page that has the closest relationship to the program and was an active page as of March 30, 2011. In cases where there is a pdf document that provides information about the program, the webpage from which the pdf can be accessed was provided instead of a link to the pdf itself, so that users would then be able to navigate to other parts of the respective websites.
108
Appendix H: Overview of Green-Related Programs in the University System of Ohio Based on IPEDS Data As discussed in the body of this report and in Appendix G, it is not possible to reconcile the two key datasets regarding green-related programs in Ohio: the programs identified by USO institutions and the programs identified within a database obtained from the Integrated Post-Secondary Educational Data System (IPEDS). Consequently, only one of these datasets could be used as the initial foundation for the Green Pathways Database. The set of programs identified by institutions was chosen for this purpose primarily because the information it contains is more consistent with the information provided by schools themselves in school media.
However, to provide an overview of green-related education and training programs in the University System of Ohio, the IPEDS database has important strengths.
The IPEDS database includes the CIP codes and titles assigned to each program by the respective schools. CIP codes, in turn, enable programs to be linked systematically to green-related occupations (SOC codes) using the O*Net and OSDS resources described in Appendix G. For this reason, the IPEDS database provides a more inclusive approach to identifying green-related programs, compared to the set of school-identified programs. For illustration, there is only one accounting program among the set of institution-identified programs because only one school reported such a program as being green, whereas the IPEDS database includes many accounting programs that may be considered green, because they are linked to a green occupation (Financial Analyst) through a CIP-SOC crosswalk.76
For these reasons, some green-related programs within the USO that are identifiable in the IPEDS database are not currently included in the Green Pathways Database. The Green Pathways Database includes 1,327 programs, while the IPEDS database includes 2,450 programs within the USO that can be defined as green based on CIP-SOC linkages. As a consequence, the set of IPEDS-identified programs may more accurately convey the extent of the green-related educational infrastructure within the University System of Ohio. Table 13 summarizes the number of USO programs identifiable as green, by institution type, within the IPEDS database compared to the Green Pathways Database.
76 SOC 13-2051: Financial Analyst is an “enhanced skills” green occupation linked to the following reported green occupations in the O’NET framework: Alternative Financing Specialists/Government Incentives, Energy Efficiency Finance Managers, Green Material Value-added Assessors, and Renewable Energy System Finance Specialists. Dierdorff et al., Greening of the World, 64-80.

109
Table 13. Programs by Type of Institution in the Green Pathways Database and IPEDS
Adult Career Centers
Two-Year Colleges
Four-Year Universities Total
Green Pathways Database 191 592 544 1,327IPEDS 176 928 1,346 2,450
Number of Programs
The following tables are based upon IPEDS data.77 Appendix I provides maps showing the locations of the USO institutions with green-related programs included in the IPEDS database.
Public and Private Postsecondary Green-Related Programs As Table 14 indicates, there are over 4,000 public and private post-secondary programs in the State of Ohio that can be defined as green-related according to IPEDS and an SOC-CIP crosswalk. About 60 percent of these programs (2,450 programs) are public programs, and about 40 percent (1,597 programs) are private.
Table 14. Public and Private Green-Related Programs
Private for profit Private non-profit
1 264 61 153 4782 348 46 46 4403 56 8 98 1624 253 60 170 4835 383 55 89 5276 63 - 134 1977 80 21 41 1428 201 106 283 5909 378 41 96 515
10 106 2 37 14511 196 - 28 22412 122 22 - 144
Total 2,450 422 1,175 4,047 Total Percent 60.5% 10.4% 29.0% 100.0%Source: IPEDS
Economic Development
Region
Number of Programs
Public Private
Total
77 The Ohio Department of Job and Family Services provided an IPEDS database to Ohio University in December 2010. This database includes information on programs for the calendar year beginning July 1, 2008 and ending June 30, 2009, and was the most recent version of IPEDS data available for the purposes of this report. For more information on the IPEDS data collection process, see National Center for Educational Statistics, “What are the Steps,” http://nces.ed.gov/ipeds/submit_data/lifecycle_text.asp.

110
Green-Related Programs in the USO by Type of Institution Table 15 shows green-related programs in the USO by type of institution. Among the 2,450 green-related programs in the USO, according to IPEDS and an SOC-CIP crosswalk, over half (54.9 percent) are provided by four-year universities, while 37.9 percent are provided by two-year schools and 7.2 percent are provided by adult career centers.
Table 15. Public Green-Related Programs in the USO by Type of Institution
1 21 59 184 2642 17 147 184 3483 12 40 4 564 11 158 84 2535 8 120 255 3836 12 47 4 637 17 21 42 808 20 103 78 2019 24 52 302 37810 15 81 10 10611 5 77 114 19612 14 23 85 122
Total 176 928 1,346 2,450 Total Percent 7.2% 37.9% 54.9% 100.0%Source: IPEDS
Economic Development
Region
Number of Programs
Adult Career Centers
Two-year Technical and Community
Colleges
Four-year Colleges and Universities
Total

111
Green-Related Programs in the USO by Type of Degree or Certificate Table 16 shows green-related programs in the USO by type of degree or certificate. Among the 2,450 green-related USO programs according to IPEDS and an SOC-CIP crosswalk, the largest degree/certificate categories are associate’s degrees (29.6 percent of the total), postsecondary awards, certificates and diplomas (25.9 percent) and bachelor’s degrees (23.5 percent). The remainder is comprised of master’s degrees (14.7 percent of the total), doctoral degrees (6.1 percent) and first professional degrees or certificates (0.30 percent).
Table 16. Green-Related Programs in the USO by Type of Degree or Certificate
Economic Development
Region
Postsecondary Awards,
Certificates, Diplomas
First Professional Degrees or Certificates
Associate’s Degrees
Bachelor’s Degrees
Master’s Degrees
Doctoral Degrees
Grand Total
1 41 1 50 66 57 49 2642 70 1 128 89 49 11 3483 25 - 27 4 - - 564 72 - 103 47 29 2 2535 84 1 90 104 68 36 3836 36 - 23 4 - - 637 31 - 35 14 - - 808 65 2 67 36 26 5 2019 99 2 55 109 80 33 37810 40 - 66 - - - 10611 44 - 50 55 33 14 19612 27 - 31 47 17 - 122
Total 634 7 725 575 359 150 2,450 Total Percent 25.9% 0.3% 29.6% 23.5% 14.7% 6.1% 100.0%Source: IPEDS
Table 17 shows postsecondary awards, certificates and diplomas among the USO’s green-related programs by subcategory. Among the green-related USO programs that grant awards, certificates, or diplomas, over 90 percent are either one-year or one-to-two-year programs (52.2 percent and 39.9 percent, respectively).

112
Table 17. Green-Related Postsecondary Awards, Certificates and Diplomas in the USO by Subcategory
Less than 1 year 1-2 Years 2-4 Years
1 23 14 1 2 1 412 33 32 1 4 - 703 13 12 - - - 254 42 29 1 - - 725 32 47 1 4 - 846 22 14 - - - 367 15 16 - - - 318 12 44 - 9 - 659 67 12 1 18 1 9910 19 21 - - - 4011 34 8 - 2 - 4412 19 4 - 4 - 27
Total 331 253 5 43 2 634 Total Percent 52.2% 39.9% 0.8% 6.8% 0.3% 100.0%Source: IPEDS
Postsecondary Awards, Certificates, or DiplomasEconomic Development
Region
Post-Baccalaureate
Certificates
Post-Master’s Certificates Total

113
Green-Related Programs in the USO by Green Sector Table 18 illustrates how the USO’s green-related programs relate to sectors of the green economy based upon O*Net’s definition of green sectors, IPEDS and an SOC-CIP crosswalk. Because programs can relate to more than one green occupation, and green occupations can relate to more than one sector, the total number of programs (6,076) includes duplicates and therefore does not match the total number of green-related programs in the USO (2,450) shown in previous tables.

114
Table 18. Green-Related Programs in the USO by Green Sector
Econom
ic
Developm
ent
Region
Agricu
lture
& Fore
stry
Energy
and
Carbon C
aptur
e
and S
torage
Ene
rgy E
fficien
cyEne
rgy Trad
ingEnv
ironm
ental
Protec
tion
Govern
emnt
and
Regulat
ory
Admini
strati
on
Green
Constru
ction
Manufac
turing
Recycle
and
Waste R
educti
onRene
wable
Energy
Genera
tion
Research
, Desig
n
and C
onsu
lting
Service
sTrans
portati
on
Total*
1 39 0 60 9 95 61 50 63 1 45 128 60 6112 37 0 80 20 86 92 56 131 10 72 193 101 8783 6 0 14 4 14 17 6 22 1 8 30 21 1434 38 0 75 12 54 66 47 93 2 58 141 77 6635 35 0 86 20 103 101 69 112 3 57 251 100 9376 12 0 22 6 10 20 13 27 16 28 20 1747 13 0 18 1 18 19 14 36 2 13 32 21 1878 28 0 57 9 40 58 41 76 45 113 66 5339 45 0 79 28 128 103 60 96 4 70 229 101 94310 18 0 29 4 22 23 17 49 1 25 50 27 26511 15 0 35 9 75 47 28 42 28 115 51 44512 11 0 28 7 33 27 23 35 2 24 73 34 297
Total 297 - 583 129 678 634 424 782 26 461 1,383 679 6,076 Source: IPEDS*Because programs can relate to more than one green occupation, and green ocupations can relate to more than one sector, the total number includes duplicates and therefore does not match the total number of public programs (2,450 programs) shown in Table 2.

115
Appendix I: Maps of University System of Ohio Institutions with Green-Related Programs

116
77
71
80
75
75
74
7780
70
71
70
76
90
35
35
33
50
23
2350
33
32
EDR1
EDR2
EDR3
EDR4
EDR5
EDR6
EDR7
EDR8
EDR9
EDR10
EDR11
EDR12
University System of Ohio Institutions with Green-Related Programs
Institution TypeAdult Career Centers
Two-year Technical and Community Colleges
Four-year Colleges and Universities
0 10 20 30 405
Miles
Sources: Integrated Postsecondary Education Data System (IPEDS), Ohio Dept. of Natural Resources, Ohio Dept. of Transportation, Ohio Dept. of DevelopmentMap Creation: D. SimonVoinovich School of Leadership and Public AffairsOhio UniversityApril 2011Note: EDR = Economic Development Region

117
The Ohio StateUniversity-Main Campus
Central OhioTechnicalCollege
Columbus StateCommunity College
Adult & CommunityEducation,Columbus City Schools The Ohio State
University-Newark Campus
Ohio University-Lancaster Campus
Delaware AreaCareer Center
Eastland-FairfieldCareer and Technical Schools
Ohio Hi PointJoint VocationalSchool District
Career and Technology Education Centers (CTEC) of Licking
71
70 70
71
35
23
33
33
3523
33
UNIONDELAWARE
FAIRFIELD
FAYETTE
FRANKLIN
LICKING
LOGAN
MADISON
PICKAWAY
Institution TypeAdult Career Centers
Two-year Technical and Community Colleges
Four-year Colleges and Universities
0 4 8 122
Miles
University System of Ohio Institutionswith Green-Related Programs
Economic Development Region 1
Sources: Integrated Postsecondary Education Data System (IPEDS), Ohio Dept. of Natural Resources, Ohio Dept. of Transportation, Ohio Dept. of DevelopmentMap Creation: D. SimonVoinovich School of Leadership and Public AffairsOhio UniversityApril 2011

118
Bowling Green StateUniversity-FirelandsBowling Green State
University-MainCampus EHOVE
CareerCenter
Northwest StateCommunityCollege
Toledo City SchoolsAdult & ContinuingEducation
OwensCommunityCollege
Terra CommunityCollege
The Universityof Toledo
SanduskyCareerCenter
Penta CareerCenter
Vanguard-SentinelCareer Center
SANDUSKY
WILLIAMS
WOODDEFIANCE ERIE
FULTON
HENRY
LUCAS
OTTAWA
23
75
80
Institution TypeAdult Career Centers
Two-year Technical and Community Colleges
Four-year Colleges and Universities
0 8 16 244
Miles
University System of Ohio Institutions with Green-Related Programs
Economic Development Region 2
Sources: Integrated Postsecondary Education Data System (IPEDS), Ohio Dept. of Natural Resources, Ohio Dept. of Transportation, Ohio Dept. of DevelopmentMap Creation: D. SimonVoinovich School of Leadership and Public AffairsOhio UniversityApril 2011

119
ApolloCareerCenter
RhodesStateCollege
The Ohio StateUniversity-LimaCampus
Wright StateUniversity-Lake
Campus
VantageCareerCenter
75
23
33
PUTNAM
ALLEN
AUGLAIZE
VAN WERT
HANCOCK
HARDIN
MERCER
PAULDING
Institution TypeAdult Career Centers
Two-year Technical and Community Colleges
Four-year Colleges and Universities
0 3 6 91.5
Miles
University System of Ohio Institutionswith Green-Related Programs
Economic Development Region 3
Sources: Integrated Postsecondary Education Data System (IPEDS), Ohio Dept. of Natural Resources, Ohio Dept. of Transportation, Ohio Dept. of DevelopmentMap Creation: D. SimonVoinovich School of Leadership and Public AffairsOhio UniversityApril 2011
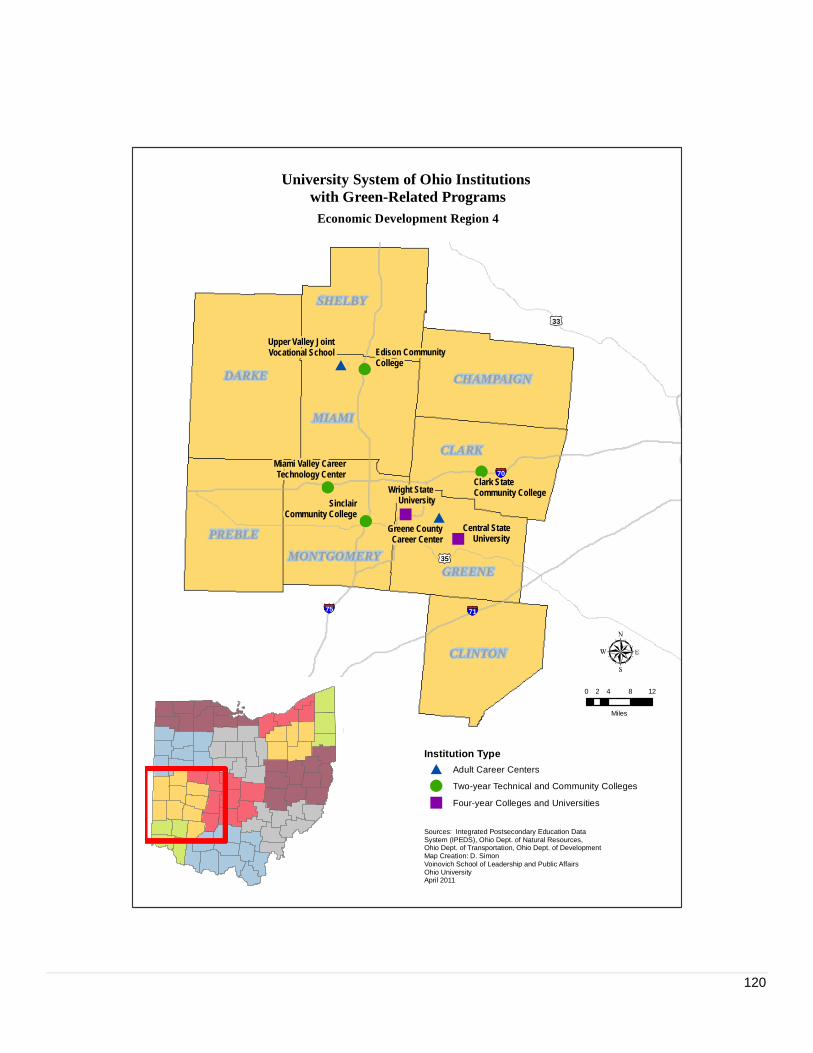
120
Central StateUniversity
Clark StateCommunity College
Edison Community College
Miami Valley CareerTechnology Center
SinclairCommunity College
Upper Valley JointVocational School
Wright State University
Greene CountyCareer CenterPREBLE
SHELBY
CHAMPAIGN
CLARK
CLINTON
DARKE
GREENE
MIAMI
MONTGOMERY
74
75
70
71
35
33
Institution TypeAdult Career Centers
Two-year Technical and Community Colleges
Four-year Colleges and Universities
0 4 8 122
Miles
University System of Ohio Institutions with Green-Related Programs
Economic Development Region 4
Sources: Integrated Postsecondary Education Data System (IPEDS), Ohio Dept. of Natural Resources, Ohio Dept. of Transportation, Ohio Dept. of DevelopmentMap Creation: D. SimonVoinovich School of Leadership and Public AffairsOhio UniversityApril 2011

121
Butler Technology &Career DevelopmentSchools - D. RussellLee Career Center
University ofCincinnati-Main
Campus
Cincinnati StateTechnical and Community
College
University ofCincinnati-ClermontCollege
Universityof Cincinnati-RaymondWalters College
Great OaksInstitute of Technologyand Career Development
MiamiUniversity-Oxford Warren County
Career Center
74
71
75
32
BUTLER
CLERMONT
WARREN
HAMILTON
Institution TypeAdult Career Centers
Two-year Technical and Community Colleges
Four-year Colleges and Universities
0 4 8 122
Miles
University System of Ohio Institutions with Green-Related Programs
Economic Development Region 5
Sources: Integrated Postsecondary Education Data System (IPEDS), Ohio Dept. of Natural Resources, Ohio Dept. of Transportation, Ohio Dept. of DevelopmentMap Creation: D. SimonVoinovich School of Leadership and Public AffairsOhio UniversityApril 2011

122
RICHLAND
ASHLAND
SENECA
CRAWFORDWYANDOT
HURON
KNOX
MARION
MORROW
AshlandCounty-West HolmesCareer Center
MarionTechnicalCollege
North CentralState College
The Ohio State University-Mansfield Campus
The Ohio State University-Marion Campus
Tri-RiversCareer Center
Madison AdultCareer Center
Pioneer Careerand TechnologyCenter
75
80
71
23
33
Institution TypeAdult Career Centers
Two-year Technical and Community Colleges
Four-year Colleges and Universities
University System of Ohio Institutions with Green-Related Programs
Economic Development Region 6
Sources: Integrated Postsecondary Education Data System (IPEDS), Ohio Dept. of Natural Resources, Ohio Dept. of Transportation, Ohio Dept. of DevelopmentMap Creation: D. SimonVoinovich School of Leadership and Public AffairsOhio UniversityApril 2011
0 5 10 152.5
Miles

123
Gallia Jackson VintonJoint VocationalSchool District
Lawrence CountyJVSD-Collins Career Center
Ohio University-Chillicothe Campus
Ohio University-Southern Campus
ShawneeStateUniversity
Southern StateCommunityCollege
Pickaway RossJoint VocationalSchool District
Scioto CountyCareer TechnicalCenter
ADAMS
ROSS
SCIOTO
BROWN
VINTON
GALLIA
HIGHLAND
JACKSON
LAWRENCE
PIKE
71 33
35
5033
35
23
50
32
Institution TypeAdult Career Centers
Two-year Technical and Community Colleges
Four-year Colleges and Universities
0 4 8 122
Miles
University System of Ohio Institutions with Green-Related Programs
Economic Development Region 7
Sources: Integrated Postsecondary Education Data System (IPEDS), Ohio Dept. of Natural Resources, Ohio Dept. of Transportation, Ohio Dept. of DevelopmentMap Creation: D. SimonVoinovich School of Leadership and Public AffairsOhio UniversityApril 2011
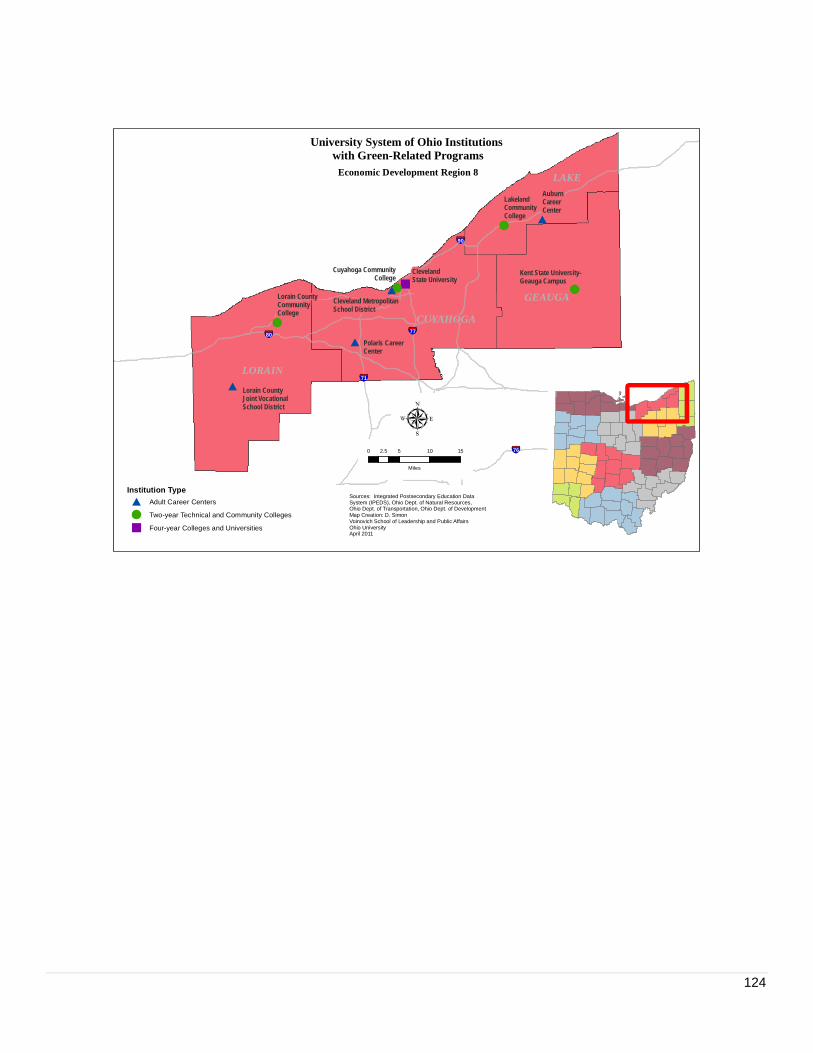
124
AuburnCareerCenter
ClevelandState University
Cuyahoga CommunityCollege
Kent State University-Geauga Campus
LakelandCommunityCollege
Lorain CountyCommunityCollege
Polaris CareerCenter
Lorain CountyJoint VocationalSchool District
Cleveland Metropolitan School District
CUYAHOGA
GEAUGA
LAKE
LORAIN
90
71
77
80
80
7780
76
77
76
Institution TypeAdult Career Centers
Two-year Technical and Community Colleges
Four-year Colleges and Universities
0 5 10 152.5
Miles
University System of Ohio Institutions with Green-Related Programs
Economic Development Region 8
Sources: Integrated Postsecondary Education Data System (IPEDS), Ohio Dept. of Natural Resources, Ohio Dept. of Transportation, Ohio Dept. of DevelopmentMap Creation: D. SimonVoinovich School of Leadership and Public AffairsOhio UniversityApril 2011

125
The Universityof Akron
The University of AkronWayne College
Canton City SchoolsAdult Education
Kent StateUniversity-
Stark Campus
Kent StateUniversity
Medina CountyCareer Center
The Ohio State UniversityAgricultural Technical Institute
Stark State Collegeof Technology
Portage LakesCareer Center
Alliance City Schools-Adult Education and
Alliance Career CentreWayne County
SchoolsCareer Center
STARK
SUMMIT
WAYNE
MEDINA
PORTAGE
77
7671
80
Institution TypeAdult Career Centers
Two-year Technical and Community Colleges
Four-year Colleges and Universities
0 4 8 122
Miles
University System of Ohio Institutions with Green-Related Programs
Economic Development Region 9
Sources: Integrated Postsecondary Education Data System (IPEDS), Ohio Dept. of Natural Resources, Ohio Dept. of Transportation, Ohio Dept. of DevelopmentMap Creation: D. SimonVoinovich School of Leadership and Public AffairsOhio UniversityApril 2011
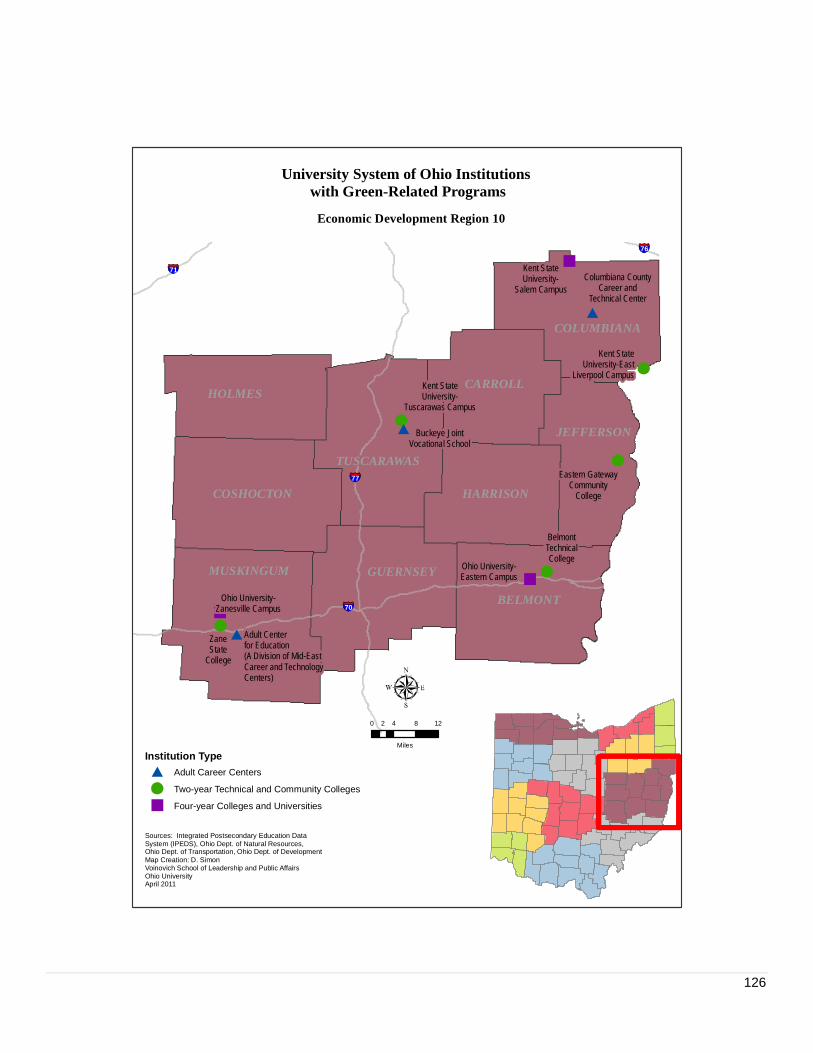
126
BelmontTechnicalCollege
Columbiana CountyCareer and
Technical Center
Eastern GatewayCommunity
College
Kent StateUniversity-East
Liverpool CampusKent StateUniversity-
Tuscarawas Campus
Kent StateUniversity-
Salem Campus
ZaneState
College
Ohio University-Eastern Campus
Ohio University-Zanesville Campus
Buckeye JointVocational School
Adult Centerfor Education(A Division of Mid-EastCareer and TechnologyCenters)
BELMONT
CARROLL
TUSCARAWAS
COLUMBIANA
COSHOCTON
GUERNSEY
HARRISON
HOLMES
JEFFERSON
MUSKINGUM
77
70
76
71
Institution TypeAdult Career Centers
Two-year Technical and Community Colleges
Four-year Colleges and Universities
0 4 8 122
Miles
University System of Ohio Institutions with Green-Related Programs
Economic Development Region 10
Sources: Integrated Postsecondary Education Data System (IPEDS), Ohio Dept. of Natural Resources, Ohio Dept. of Transportation, Ohio Dept. of DevelopmentMap Creation: D. SimonVoinovich School of Leadership and Public AffairsOhio UniversityApril 2011

127
HockingCollege
OhioUniversity
Tri-CountyCareer Center
Washington StateCommunity College
Washington CountyCareer CenterATHENS
WASHINGTONHOCKING
MEIGS
MONROE
MORGAN
NOBLEPERRY
77
70
Institution TypeAdult Career Centers
Two-year Technical and Community Colleges
Four-year Colleges and Universities
0 4 8 122
Miles
University System of Ohio Institutions with Green-Related Programs
Economic Development Region 11
Sources: Integrated Postsecondary Education Data System (IPEDS), Ohio Dept. of Natural Resources, Ohio Dept. of Transportation, Ohio Dept. of DevelopmentMap Creation: D. SimonVoinovich School of Leadership and Public AffairsOhio UniversityApril 2011

128
AshtabulaCounty JointVocational School
Choffin Career and Technical Center
Kent StateUniversity-Ashtabula Campus
Kent StateUniversity-
Trumbull Campus
Youngstown StateUniversity
Mahoning CountyCareer and
Technical Center
Trumbull Career and Technical Center
ASHTABULA
TRUMBULL
MAHONING
80
76
90
Institution TypeAdult Career Centers
Two-year Technical and Community Colleges
Four-year Colleges and Universities
0 4 8 122
Miles
University System of Ohio Institutions with Green-Related Programs
Economic Development Region 12
Sources: Integrated Postsecondary Education Data System (IPEDS), Ohio Dept. of Natural Resources, Ohio Dept. of Transportation, Ohio Dept. of DevelopmentMap Creation: D. SimonVoinovich School of Leadership and Public AffairsOhio UniversityApril 2011
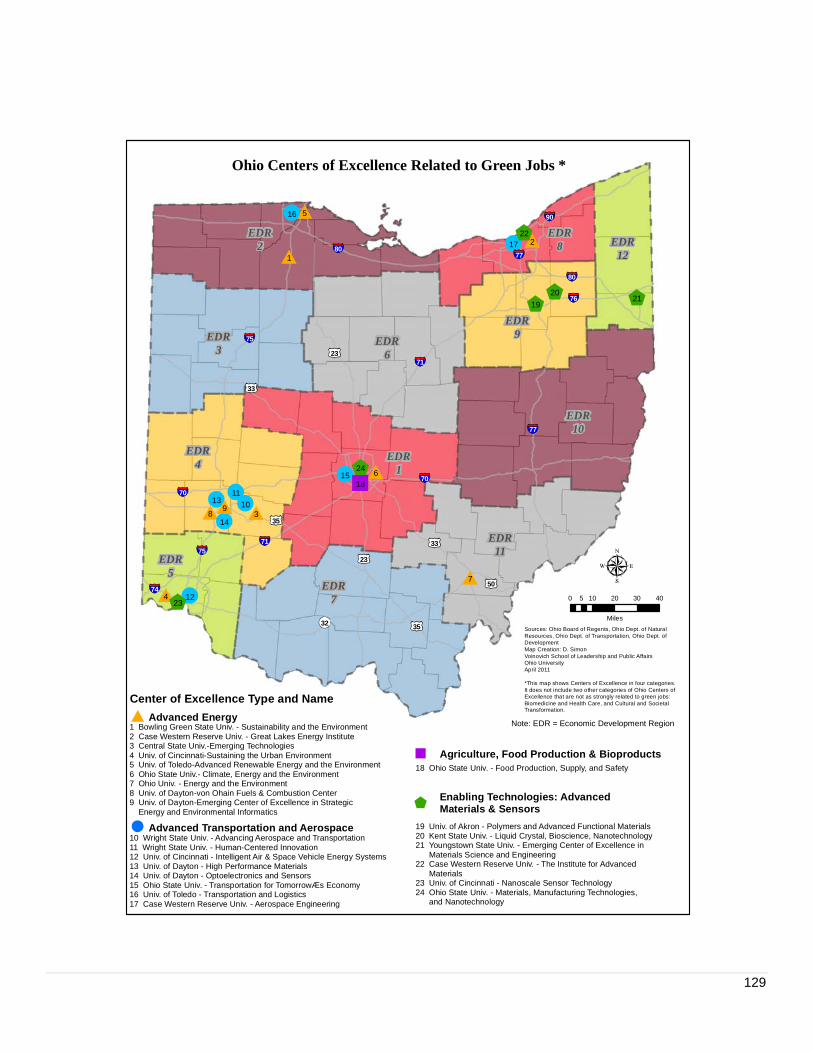
129
77
71
80
75
75
74
7780
70
71
70
76
90
35
35
33
23
23
50
33
32
EDR1
EDR2
EDR3
EDR4
EDR5
EDR6
EDR7
EDR8
EDR9
EDR10
EDR11
EDR12
19
1
2
3
4
8
20
6
7
5
10
21
1722
1223
13
14
9
1518
24
16
11
Ohio Centers of Excellence Related to Green Jobs *
0 10 20 30 405
Miles
1 Bowling Green State Univ. - Sustainability and the Environment2 Case Western Reserve Univ. - Great Lakes Energy Institute3 Central State Univ.-Emerging Technologies4 Univ. of Cincinnati-Sustaining the Urban Environment5 Univ. of Toledo-Advanced Renewable Energy and the Environment6 Ohio State Univ.- Climate, Energy and the Environment7 Ohio Univ. - Energy and the Environment8 Univ. of Dayton-von Ohain Fuels & Combustion Center9 Univ. of Dayton-Emerging Center of Excellence in Strategic Energy and Environmental Informatics
10 Wright State Univ. - Advancing Aerospace and Transportation11 Wright State Univ. - Human-Centered Innovation12 Univ. of Cincinnati - Intelligent Air & Space Vehicle Energy Systems13 Univ. of Dayton - High Performance Materials14 Univ. of Dayton - Optoelectronics and Sensors15 Ohio State Univ. - Transportation for TomorrowÆs Economy16 Univ. of Toledo - Transportation and Logistics17 Case Western Reserve Univ. - Aerospace Engineering
19 Univ. of Akron - Polymers and Advanced Functional Materials20 Kent State Univ. - Liquid Crystal, Bioscience, Nanotechnology21 Youngstown State Univ. - Emerging Center of Excellence in Materials Science and Engineering22 Case Western Reserve Univ. - The Institute for Advanced Materials23 Univ. of Cincinnati - Nanoscale Sensor Technology24 Ohio State Univ. - Materials, Manufacturing Technologies, and Nanotechnology
18 Ohio State Univ. - Food Production, Supply, and Safety
Enabling Technologies: Advanced Materials & Sensors
Agriculture, Food Production & Bioproducts
Advanced Transportation and Aerospace
Advanced Energy
Center of Excellence Type and Name
Sources: Ohio Board of Regents, Ohio Dept. of Natural Resources, Ohio Dept. of Transportation, Ohio Dept. of DevelopmentMap Creation: D. SimonVoinovich School of Leadership and Public AffairsOhio UniversityApril 2011
*This map shows Centers of Excellence in four categories. It does not include two other categories of Ohio Centers of Excellence that are not as strongly related to green jobs: Biomedicine and Health Care, and Cultural and Societal Transformation.
Note: EDR = Economic Development Region

Search for jobs.
Visit OhiomeansJobs.com
Locate talented employees.
Office of Workforce DevelopmentP.o. Box 1618Columbus, OH 43216-1618
Bureau of Labor Market Information Business Principles for Workforce Development
Partner with the workforce and economic development community.
Develop and deploy new information solution tools and systems for the workforce and economic development community.
Provide products and services that are customer and demand driven.
Be known as an important and reliable source for information solutions that support workforce development goals and outcomes.
For additional information, visit http://OhioLMI.com or call the Ohio Bureau of Labor Market Information at 1-888-296-7541 or 614-752-9494.
John R. Kasich, Governor State of Ohio http://Ohio.gov
Michael B. Colbert, Director Ohio Department of Job and Family Services
http://jfs.ohio.gov
Office of Workforce Development http://jfs.ohio.gov/owd/
Bureau of Labor Market Information http://OhioLMI.com
(06/2011)
An Equal Opportunity Employer and Service Provider