Embed Size (px)
Citation preview
ED 035 812
AUTHORTITLE
PUB DATENOTE
EDRS PRICEDESCRIPTORS
IDENTIFIERS
ABSTRACT
DOCUMENT RESUME
AC 006 260
STANLEY, CHARLTCN S.THE USE OF PSYCHOLOGICAL TESTS IN PREDICTINGVOCATIONAL SUCCESS OF DISADVANTAGED ADULTS.DEC 6851P.; M. ED. THESIS
EDRS PRICE MF-$00 25 HC-$2.65ACHIEVEMENT, ADULTS, APTITUDE, *CULTURALLYDISADVANTAGED, INTELLIGENCE, JOB PLACEMENT, JOBTRAINING, MASTERS THESES, *PREDICTIVE ABILITY(TESTING), *PSYCHOLOGICAL TESTS, PSYCHOMOTOR SKILLS,READING ACHIEVEMENT, *SUCCESS FACTORS, *VOCATIONALINTERESTSGENERAL APTITUDE TEST BATTERY, ST. LOUIS EVALUATIONAND TRAINING CENTER, WECHSLER ADULT INTELLIGENCESCALE
A STUDY OF THE RELATIONSHIP BETWEEN CERTAIN TESTSCORES AND PROBABLE TRAINING AND VOCATIONAL SUCCESS WAS MADE.EXAMINED WERE THREE MAJOR TRAINING AREAS: POWER SEWING MACHINE, NURSEAIDE, AND CLERICAL OFFICE WORK. SIX TESTS WERE TESTED FOR THEIRABILITY TO PREDICT SUCCESS: THE WAIS REVISED BETA; PURDUE PEGBOARD;ENGLISH, CALIFCRNIA SURVEYS OF READING, ARITHMETIC, AND SPELLING; THEGATB; AND THE WONDERLIC PERSONNEL TEST. TWO SEPARATE CRITERIA FORSUCCESS WERE ESTABLISHED, AGAINST WHICH THESE TESTS WERE CHECKED FORPREDICTIVE ABILITY: SUCCESS IN TRAINING, AND THE ABILITY TO REMAINEMPLOYED AFTER SIX MONTHS.. NO CLEAR PATTERNS EMERGED ON THEEXPECTANCY TABLES. ON THE TEACHER RATED GROUP, MOST OF THE RESULTSWERE INCONCLUSIVE. A CLEAR CUTOFF POINT WAS SEEN ON THE WAIS VERBALIQ AT THE DULL-NORMAL RANGE (WECHSLER CLASSIFICATION SYSTEM). THISWAS NOT SEEN ON THE PERFORMANCE IQ TABLE WHERE THERE SEEMED TO BE NOPATTERN. READING ACHIEVEMENT SEEMED TO FALL ABOVE THE SEVENTH GRADELEVEL ALTHOUGH LOW READING ACHIEVEMENT SEEMED TO HAVE LITTLE TO DOWITH TEACHER RATINGS. IN THE NURSE AIDE GROUP PLACEMENT FAILURES WEREUNCOMMON. (AUTHOR/NL)
u.l. DEPARTMENT OF HEALTH, EDUCATION & WELFARE
OFFICE Of EDUCATION
THIS DOCUMENT HAS SEEN REPRODUCED EXACTLY AS RECEIVED FROM THE
PERSON OR ORGANIZATION ORIGINATING IT. POINTS Of VIEW OR OPINIONS
STATED DO NOT NECESSARILY REPRESENT OFFICIAL OFFICE Of EDUCATION
POSITION OR POLICY.
THE USE OF PSYCHOLOGICALTESTS IN PREDICTING
VOCATIONAL SUCCESS OFDISADVANTAGED ADULTS
Charlton S. Stanley, M. Ed.Director of Guidance Services
Christian Brothers CollegeMemphis, TN 38104
December 1968

TABLE OF CONTENTS
CHAPTER PAGE
INTRODUCTION 1
I. THE PROBLEM AND DEFINITIONS OF TEEMS USED
The Problem 3
Statement of the problem 3
Definitions of Terms Used
The tests used .......... ...... 5
II. THE GROUPS STUDIED ..... 8
. III. RESULTS OF THE STUDY ..... .. : .... 9
The Instructor Rated Group ......... ..... ....... 9
Technique 9
Rtsults. ...... ....... OOOOO ....... 10
The Job Placed Group. . OOOOOOOOO ..... .... 16
Technique 16
Results 17
IV. SUMMARY AND CONCLUSIONS . 0.41 .. 01, ......... 40,Summary 40
Conclusions ..... .... 41
BIBLIOGRAPHY' OOOOO OOOOOO OOOOOOO 44
ii
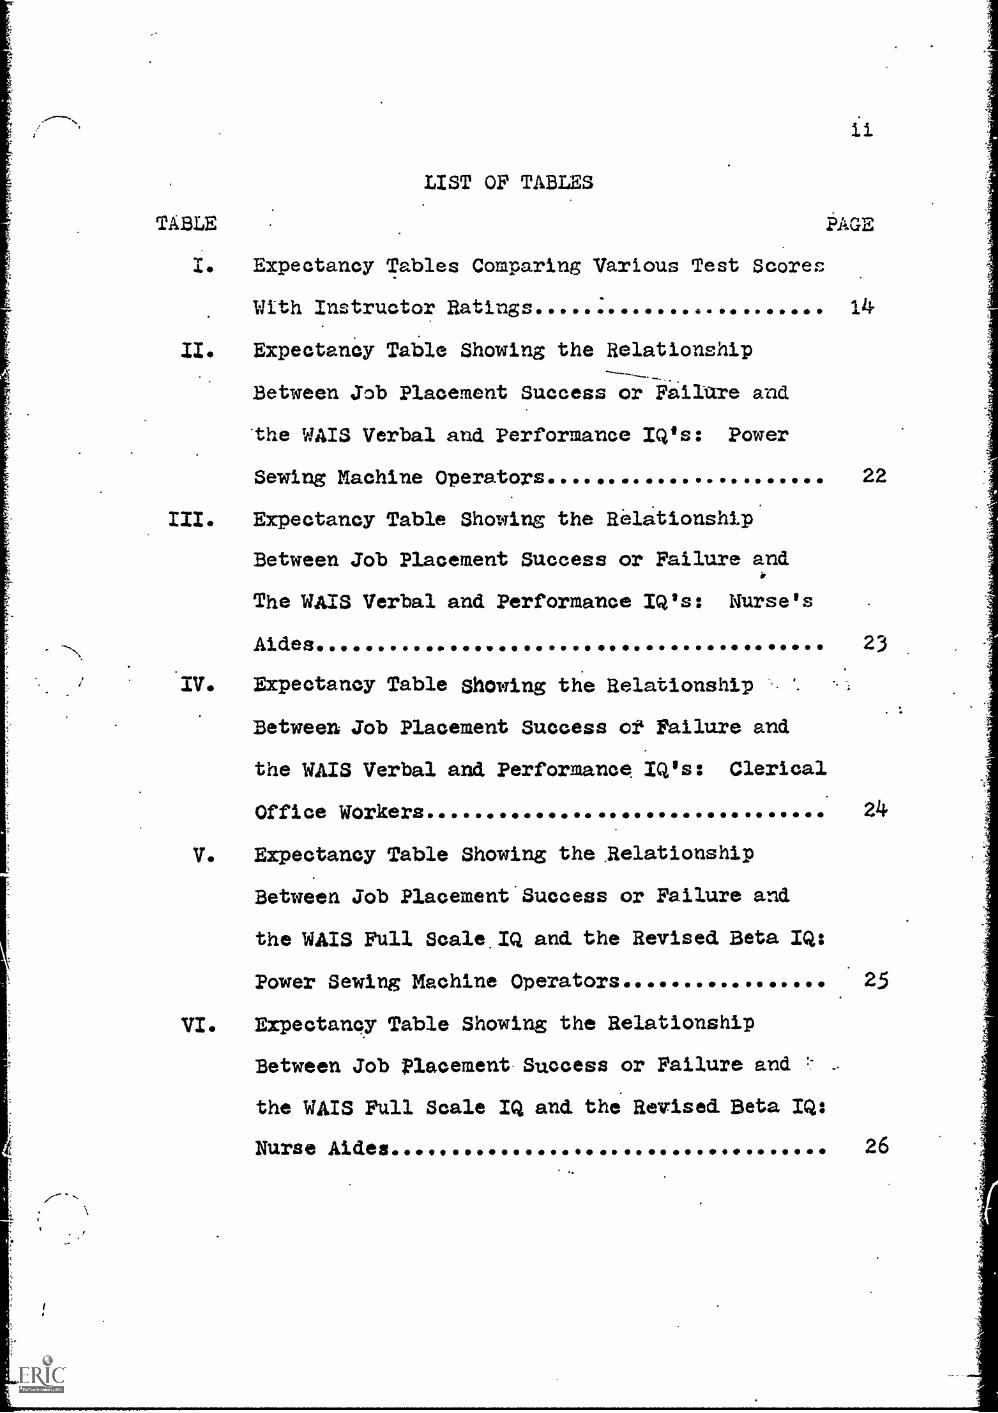
LIST OF TABLES
TABLE PAGE
I. Expectancy Tables Comparing Various Test Scores
With Instructor Ratings ***** : * 004,0**4 ***** *OW 14
II. Expectancy Table Showing the Relationship
Between Job Placement Success or Failure and
the WAIS Verbal and Performance IQ's: Power
Sewing Machine Operators ......... ********* 4,410410
III. Expectancy Table Showing the Relationship
Between Job Placement Success or Failure and
The WAIS Verbal and Performance IQ's: Nurse's
Aides........ OOOOOOOOOOOOOOO 000 OOOOOOOOO 0000000
22
23
IV. Expectancy Table showing the Relationship .
Between Job Placement Success of Failure and
the WAIS Verbal and Performance IQ's: Clerical
Office Workers.. OOOOO 214.
V. Expectancy Table Showing the .Relationship
Between Job Placement'Success or Failure and
the WAIS Full Scale.IQ and the Revised Beta IQ:
Power Sewing Machine Operators OOOOOOO .......... 25
VI. Expectancy Table Showing the Relationship
Between Job Placement Success or Failure and
the WAIS Full Scale IQ and the Revised Beta IQ:
Nurse Aides 26
iii
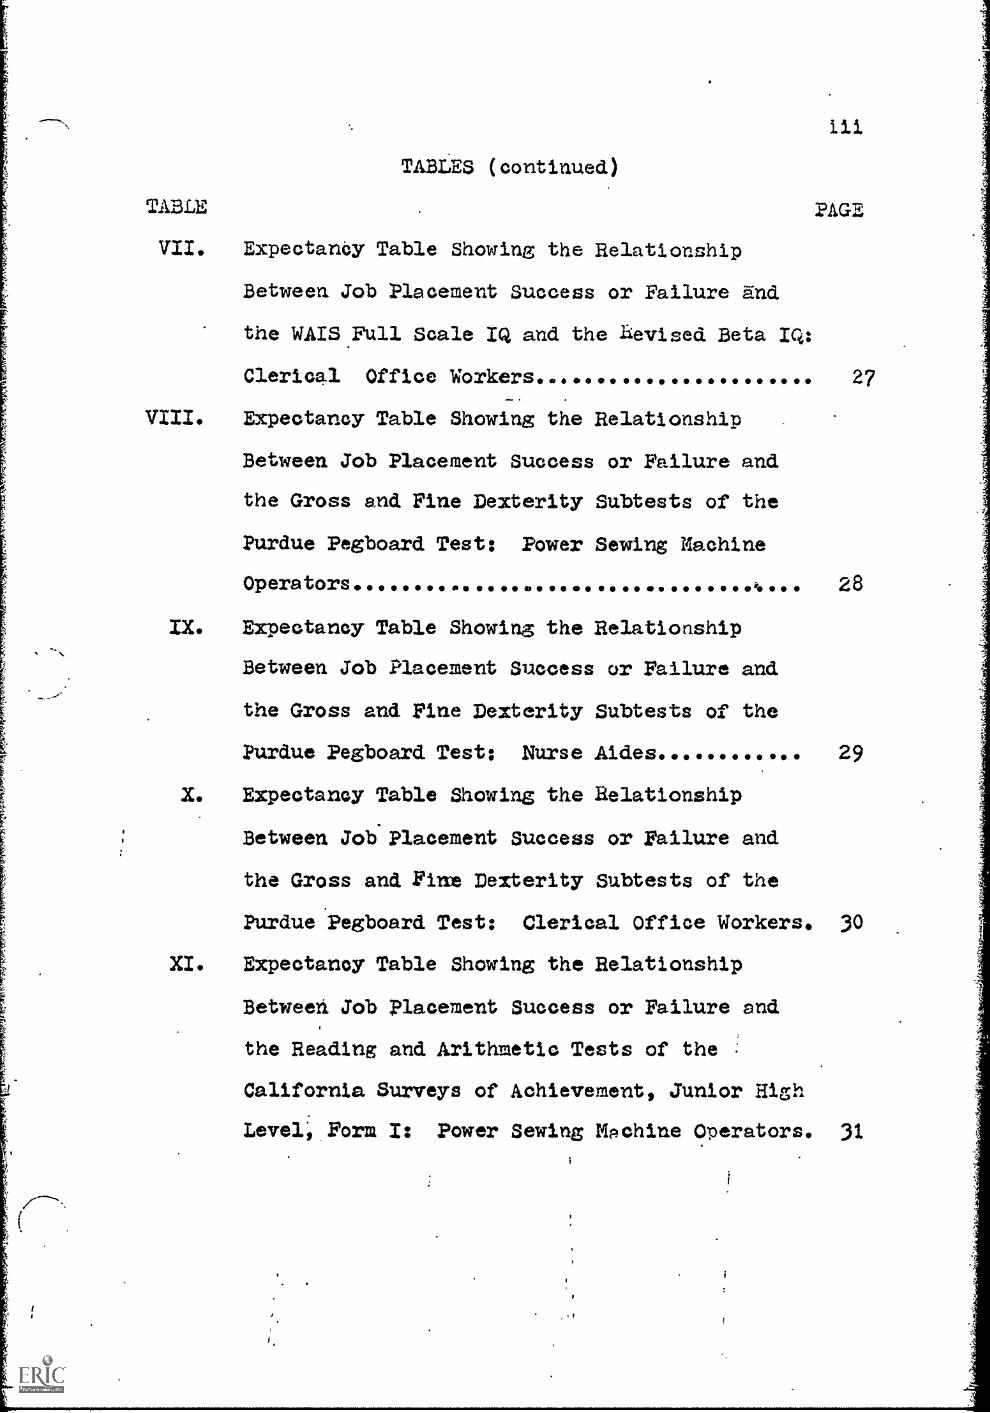
TABLES (continued)
TABLE PAGE
VII. Expectandy Table Showing the Relationship
Between Job Placement Success or Failure and
the WAIS Full Scale IQ and the Revised Beta IQ:
Clerical Office Workers OOOOO 27
VIII. Expectancy Table Showing the Relationship
Between Job Placement Success or Failure and
the Gross and Fine Dexterity Subtests of the
Purdue Pegboard Test: Power Sewing Machine
Operators.OOOOO . 00000 .k. 28
IX. Expectancy Table Showing the Relationship
Between Job Placement Success or Failure and
the Gross and Fine Dexterity Subtests of the
Purdue Pegboard Test: Nurse Aides... ......... 29
X. Expectancy Table Showing the Relationship
Between Job Placement Success or Failure and
the Gross and Fine Dexterity Subtests of the
Purdue Pegboard Test: Clerical Office Workers. 30
XI. Expectancy Table Showing the Relationship
Between Job Placement Success or Failure and
the Reading and Arithmetic Tests of the
California Surveys of Achievement, Junior High
Level, Form I: Power Sewing Machine Operators. 31
1
iv
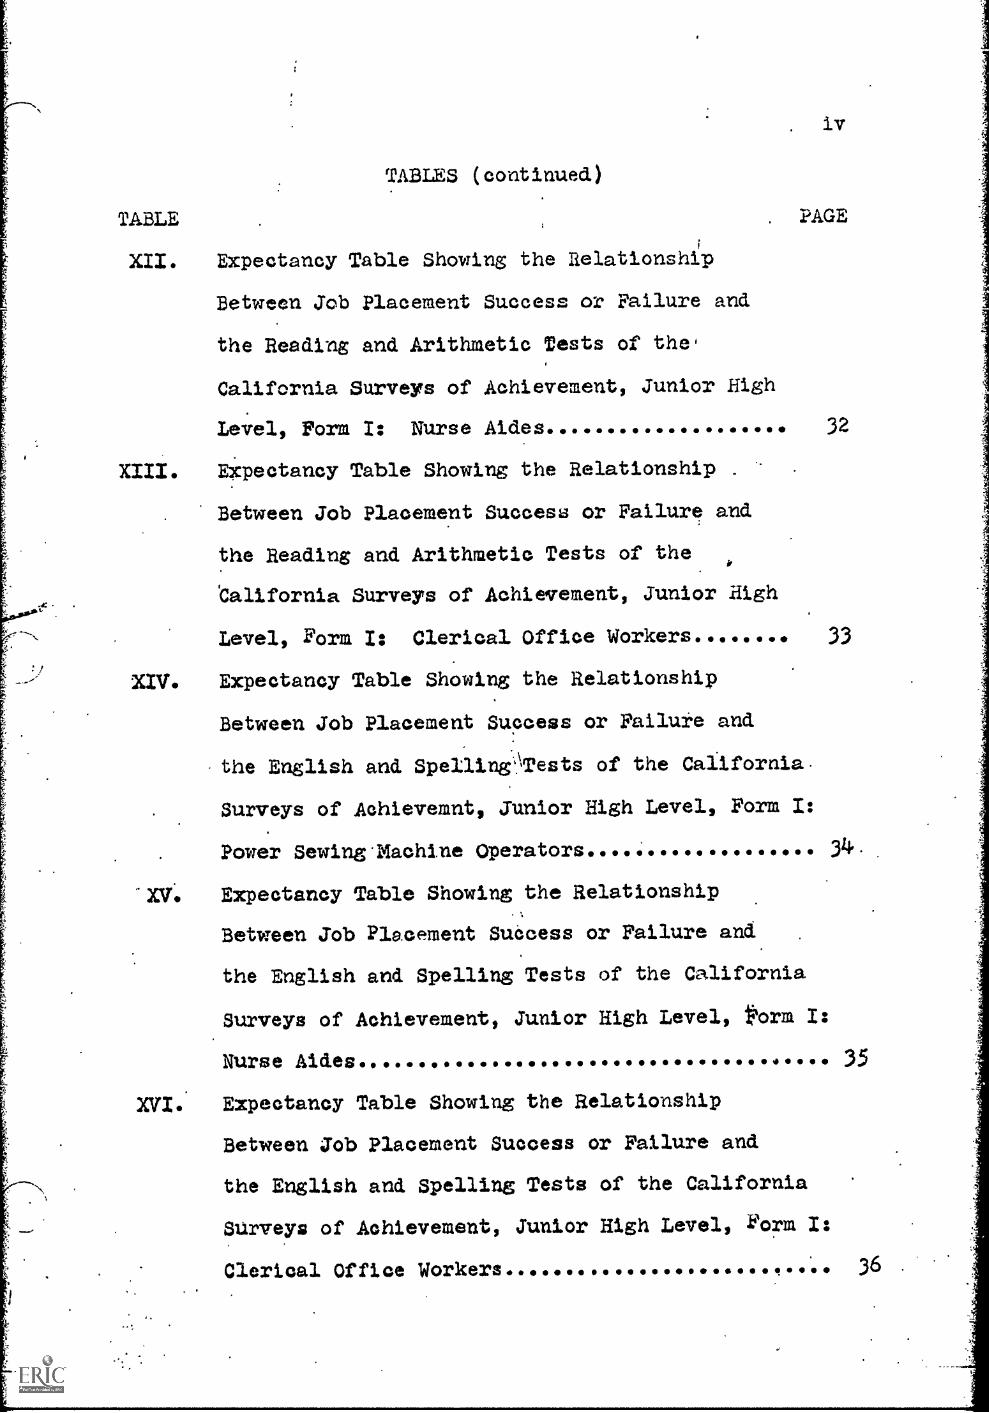
TABLES (continued)
TABLE PAGE
XII. Expectancy Table Showing the Relationship
Between Job Placement Success or Failure and
the Reading and Arithmetic Tests of the
California Surveys of Achievement, Junior High
Level, Form I: Nurse Aides 32
XIII. EXpectancy Table Showing the Relationship
Between Job Placement Success or Failure and
the Reading and Arithmetic Tests of the
California Surveys of Achievement, Junior High
Level, Form I: Clerical Office Workers........ 33
XIV. Expectancy Table Showing the Relationship
Between Job Placement Success or Failure and
the English and Spelling Tests of the California.
Surveys of Aehievemnt, Junior High Level, Form I:
Power Sewing'Machine Operators 34.
XV. Expectancy Table Showing the Relationship
Between Job Placement Success or Failure and
the English and Spelling Tests of the California
Surveys of Achievement, Junior High Level, Form I:
Nurse Aides ........ OOOOO 0000000000000111 OOOOO 0044,00111 35
XVI. Expectancy Table Showing the Relationship
Between Job Placement Success or Failure and
the English and Spelling Tests of the California
SUrveys of Achievement, Junior High Level, Form I:
Clerical Office Workers. 36
V
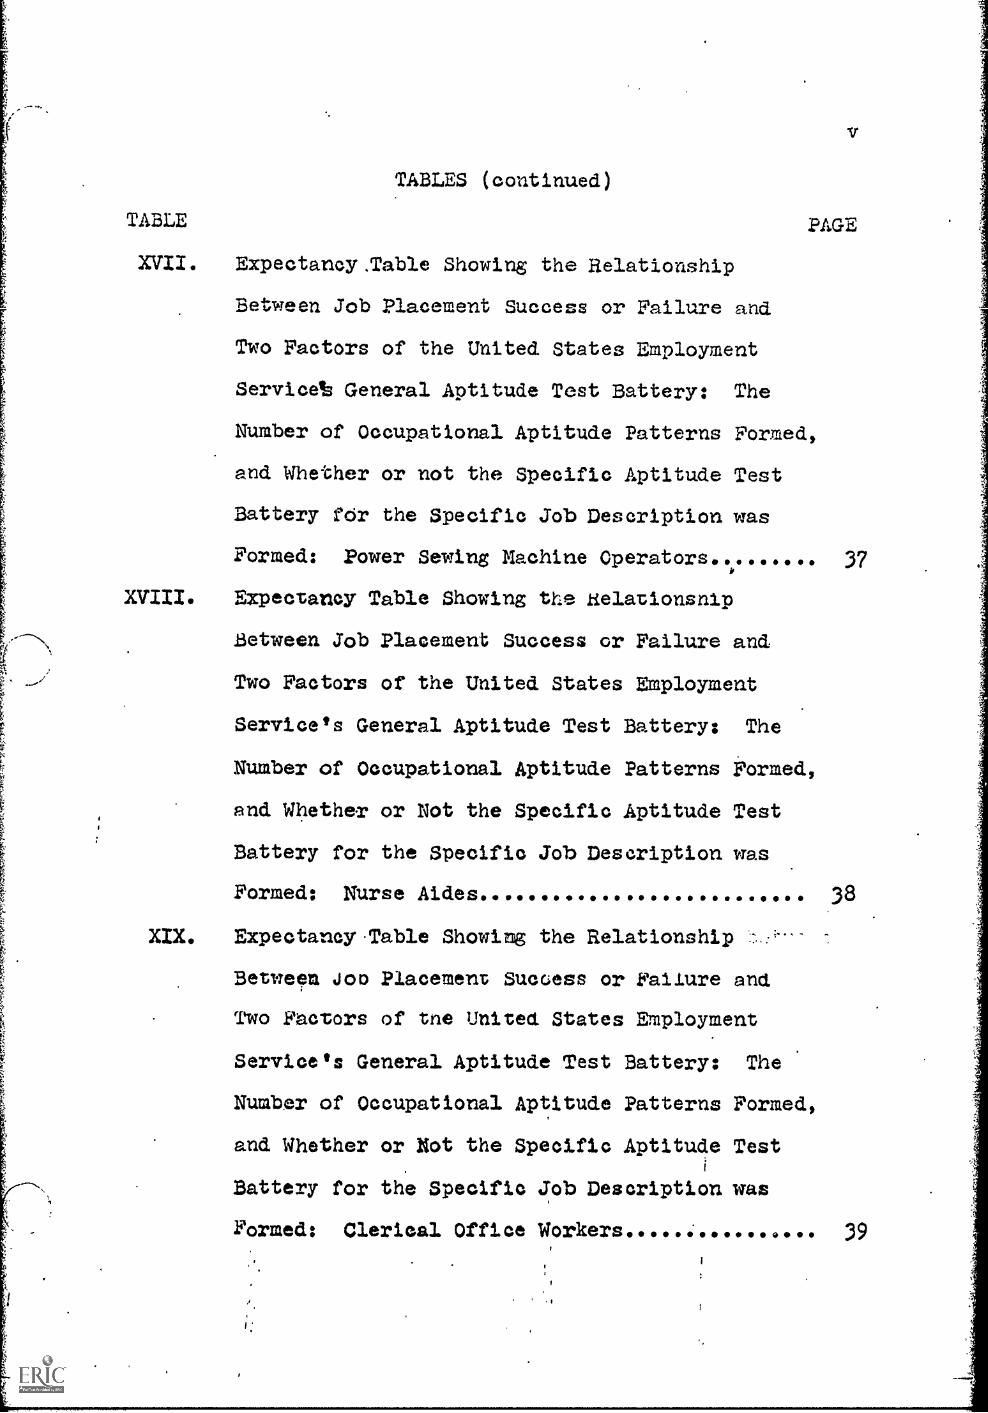
TABLES (continued)
TABLE PAGE
XVII. Expectancy.Table Showing the Relationship
Between Job Placement Success or Failure and
Two Factors of the United States Employment
Services General Aptitude Test Battery: The
Number of Occupational Aptitude Patterns Formed,
and Whether or not the Specific Aptitude Test
Battery tdr the Specific Job Description was
Formed: Power Sewing Machine Operators O .0. OO .... 37
XVIII. Expectancy Table Showing the Kelationsnip
Between Job Placement Success or Failure and
Two Factors of the United States Employment
Service's General Aptitude Test Battery: The
Number of Occupational Aptitude Patterns Formed,
and Whether or Not the Specific Aptitude Test
Battery for the Specific Job Description was
Formed: Nurse Aides 38
XIX. Expectancy Table Showing the Relationship
Between Jon Placement Success or Failure and
Two Factors of tne United States Employment
Service's General Aptitude Test Battery: The
Number of Occupational Aptitude Patterns Formed,
and Whether or Not the Specific Aptitude Testi
Battery for the Specific Job Description was
Formed: Clerical Office Workers ................. 39

LIST OF FIGURES
FIGURE
vi
PAGE
I. Client Rating questionnaire 13
INTRODUCTION
The St. Louis.Evaluation and Training Center is a
Federally funded agency operated by the Jewish Employment
and Vocational Service of St. Louis, Missouri. The function
of the center is to accept clients who have been referred by
other agencies. Prior to such referrals, the clients are
certified as meeting Office of Economic Opportunity criteria
as poverty level 'hard-core' unemployed. Briefly, this means
that the individual has less than poverty index income, or is
unemployed and unable to find work because of lack of salable
work skills, socially unacceptable behavior patterns, or other
educational or cultural deficiencies.
Upon, arrival at the Center, the clients are sent to the
Counseling and Testing Department. There, he is tested in an
evaluation procedure which lasts from two to four days. During
this time, he also sees a vocational counselor several times.
After the evaluation is completed, the -counselor assigned to
the client makes. a recommendation for the client to either enter
a training program at the Center, or to be referred to some other
more appropriate agency. The referral is based upon the subject's
test results, his specific interests and goals, and whether there
are vacancies in the various training areas. As one would suspect,
'clinical intuition' plays aajor role in the referral process.
If the referral is to a training program within the
2
Center itself, the client is brought into the program at the
earliest vacancy. . After from six to sixteen weeks, depending
upon the course, the client is 'graduated'. At this time,
the Placement Department attempts to locate a job acceptable to
the client. Upon successful placement, the client is followed
up after six months to learn if he has been successful in his
work. If at any time the placement officer learns of a place-
ment failure, he will attempt immediate re-placement.

CHAPTER I
THE PROBLEM AND DEFINITIONS OF TERMS USED
Some question has arisen at the St. Louis Evaluation
and Training Center about the relative value of the various
tests given the clients. Some of the vocational counseling
staff has been of the opinion that cutting scores should be
firmly adhered to when setting criteria for entrance into the
various training programs. Other counselors have taken a
contrary stand, saying that tests are relatively unimportant
and should be secondary to clinical intuition. This paper
will present some experimental data in an attempt to show
the frequency of certain test scores as predictors of future
lsuccess'.in training and at work. This evidence is not
presented in an attempt to prove or disprove the argument of
either of the cited viewpoints.
I. THE PROBLEM
Statement of the problem,. It was the purpose of this
study (1) to compare the test scores, on various tests, of
certain individuals with the rating of their instructors in
pre-vocational training courses; (2) to compare the test
scores, on various tests, with the individual's ability to
rind and keep a job related to the area for which they were
trained at the Center.
L.
II. DEFINITIONS OF TERMS USED
Trainin3. Three training areas were used in this
study. They are:(1) Nurse Aide Training, (2) Clerical
Training, and (3) Power Sewing Machine Operation.
Nurse aide training is a twelve week course at the
Center. The instructor is a registered nurse, graduate of
Jewish Hospital of St. Louis. The total course takes twelve
weeks. The first eight weeks are spent at the Center, the
trainees learning to take temperatures, blood pressure, make
beds, give baths, and perform the other basic functions of
the hospital attendant. The final four weeks are spent at
DePaul Hospital of St. Louis, giving the trainees'clinical
experience., During this phase of the training, the students
actually help the regular hospital staff care for patients.
Clerical training is a sixteen, week course at the
Center. Time for dompletibn of the course,is not required
to be held to the specific lergth of time specified, but is
based on the average length of time for the average trainee
to be able to pass the Federal Civil Service Test for clerk-
typists. The trainee is given intensive typing training, as
well as. instruction in the operation of duplicating machines,
english usage, office procedures, and special assistance with
any other area of weakness.
Power sewing machine operation'is an approximatley
5
eight week course. Like the other courses, it too is held
at the Center. The trainee is presented first with. a high
speed single needle sewing machine such as used by the garment
industry. After learning the basic seams, the trainee is
advanced to double needle, furring, and other more sophisti-
cated equipment. Degree of such advancement depends upon the
. ability of the individual student, as determined by the
Anstructor.
The tests used. A total of six tests are used in this
study. These six tests yield a total of thirteen separate
scores or indices of measurement.
The Wechsler Adult Intelligence Scale (WAIS) is an
individually administered intelligence test. The test is.
made up of eleven subtests, five of which are performance, or
non-verbal; the remaining six are designed to measure various
verbal abilities. Thus, the WAIS yields a Verbal IQ, Performance
IQ, and a Full Scale IQ.
The Revised Beta is a non-verbal IQ test originally
developed to test illiterates by the Army. There are six
subtests, several of which are similar to those used on the
non-verbal portion of the WAIS. The first civilian version of
the Beta was copyrighted in 1931.
The Wonderllo Personnel Test is an instrument used
by many industries and offices to screen applicants. There are
6
fifty questions to be answered in a twelve minute time limit.
Scores are not converted, but simply reported in raw score
form. The manual gives information about cutoff scores for
various occupations, ranging from janitor to engineer.
The Purdue Pegboard is a test of manipulative dexterity.
Individual trials are given for the right, left, and both
hands, which are tdtaled for an index of gross digital dexter-
ity. Fingertip, or fine dexterity is measured by the number
of assemblies the individual can make utilizing very tiny
parts.
The United States Employment Service-__(USES) General
Aptitude Test, Battery (GATE) is a multipart aptitude. test,
designed to:measure the ability of an individual to perform
specific jobs. There are at present thirty-six Occupational
Aptitude Patterns (OAPs). These are empirically derived
patterns of.cutoff scores for various occupations. For instance,
pattern number thirty -six is the pattern for courtroom steno-
graphers. Two-thirds of all courtroom stenographers made OAP.
thirty-sixt.so if a subject makes this OAP, the manual says -'
he will have 411 excellent potential for becoming a courtroom
stenographer if this is his vocational goal.
The California Surveys of Achievement are a battery of
four academic achievement tests. They are: Reading, Arithmetic,
Language (grammar), and Spelling. The test used at the

7
Center is the Junior High Level, Form 1, for use with grades
seven, eight, and nine.
CHAPTER II
THE GROUPS STUDIED
The groups which constitute the subject of this investi-
gation are representative of the clientele of the Center. All
of the subjects were female. The mean age of the two groups
was twenty-four, with a range from eighteen to forty-four. All
the subjects had family incomes less than three thousand dollars
-per annum. The racial balance of the groups was eighty-five
per cent Negro, and fifteen per cent white. Maritial status
could be roughly equally divided between single, married, and
formerly married. Only one of the trainees claimed to have
a police record (for peace disturbance), but no effort was made
to investigate the veracity of those who claimed to have no
record. None of the trainees were reported as having a vocation-
ally limiting physical handicap. Slightly less than one fourth
of the individuals investigated claimed to have completed high
school.
CTIAPTER III.
RESULTS OF THE STUDY
To report on the problem of prediction from test results,
the basic method, and the one which seems to be the most widely
used, is the expectancy table. For our purposes, the multiple
entry expectancy table described by Wesman (1966) seemed to be
the most appropriate.
The first of the groups studied are those who were rated
by their training instructor as to relevant job skills. The
second group consisted of a group of former trainees actually
placed on jobs. Somewhat different approaches were made with
the two groups. The first groups several test scores were
compared directly with the instructor's ratings. For the
second group, the subjects' performance in the world of work
was compared.with their test scores also, but in this case
the'test scores were compared with each other in an effort to
see if there was a relationship,.however crude, within the tests
themselves.
I. THE INSTRUCTOR RATED GROUP
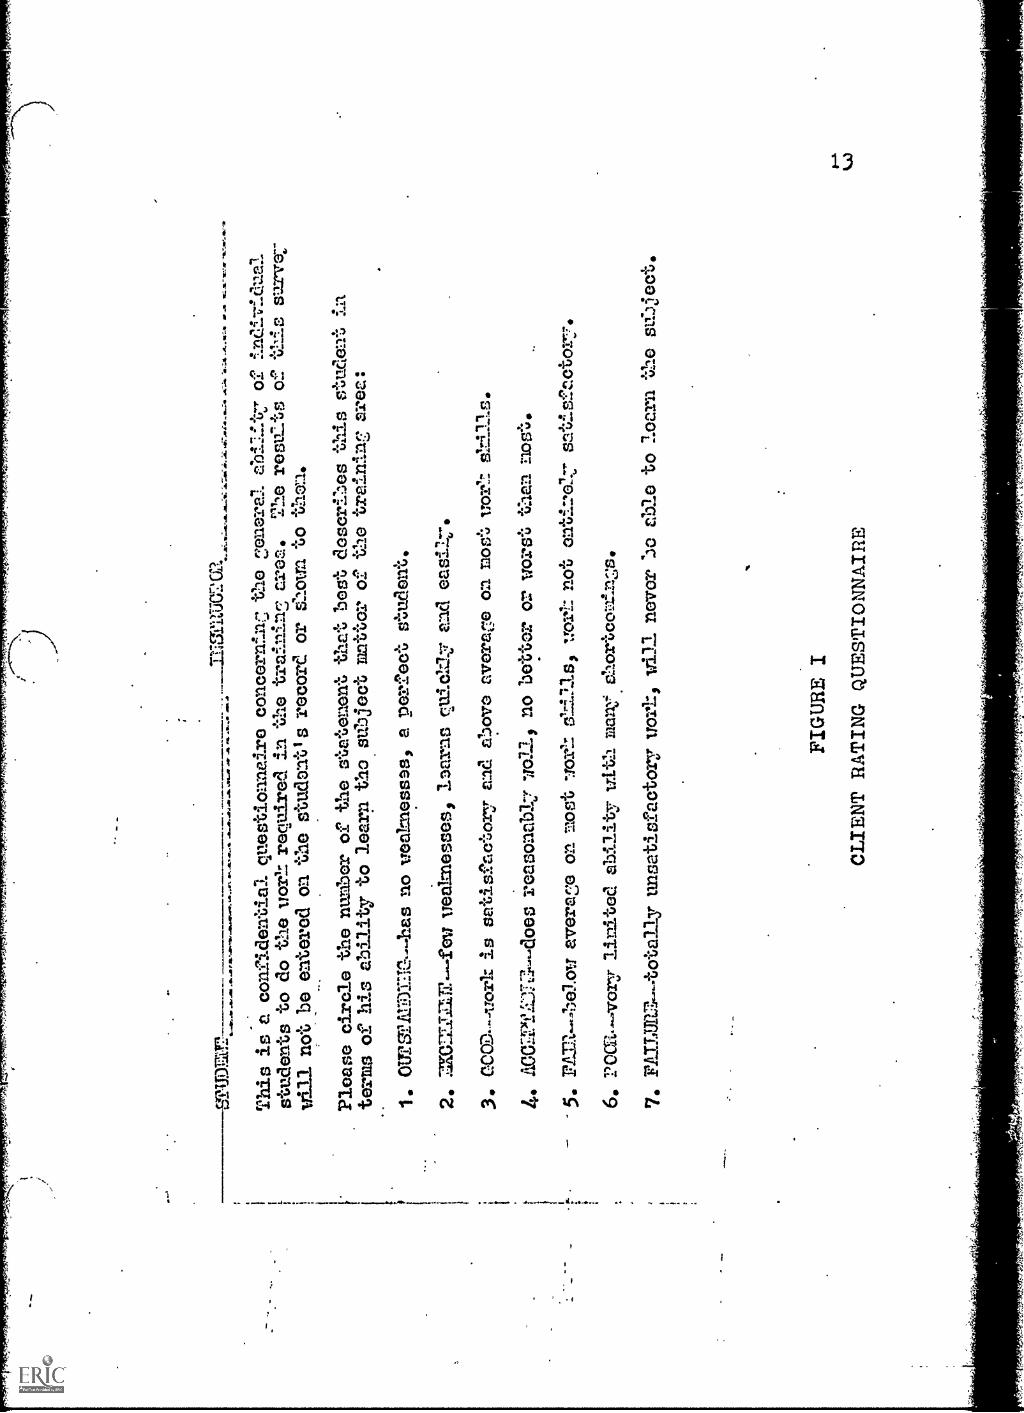
Technique. The training instructors were handed a five
by eight inch card and told: "Rate each student in the training
claas according to his actual skill. Absenteeism, personality
differences, or other bad habits are to be disregarded." The
cards were printed on one side, and the instructor was told to
10
disregard the markings on the reverse side where the test
scores. were to be recorded. In order to reduce the chance
of influencing the ratings, the actual test scores were not
recorded until after the ratings were collected from the
instructors. An illustration of the survey card may be seen
in Figure I.
When the expectancy tables were prepared, it was found
that only from the Clerical training class were there enough
scores to be useable. Because of a technical problem with
the files of the students, over half the files of the active
students were unavailable. As a result, the Sewing and Nurse
Aide students could not be meaningfully atudied.
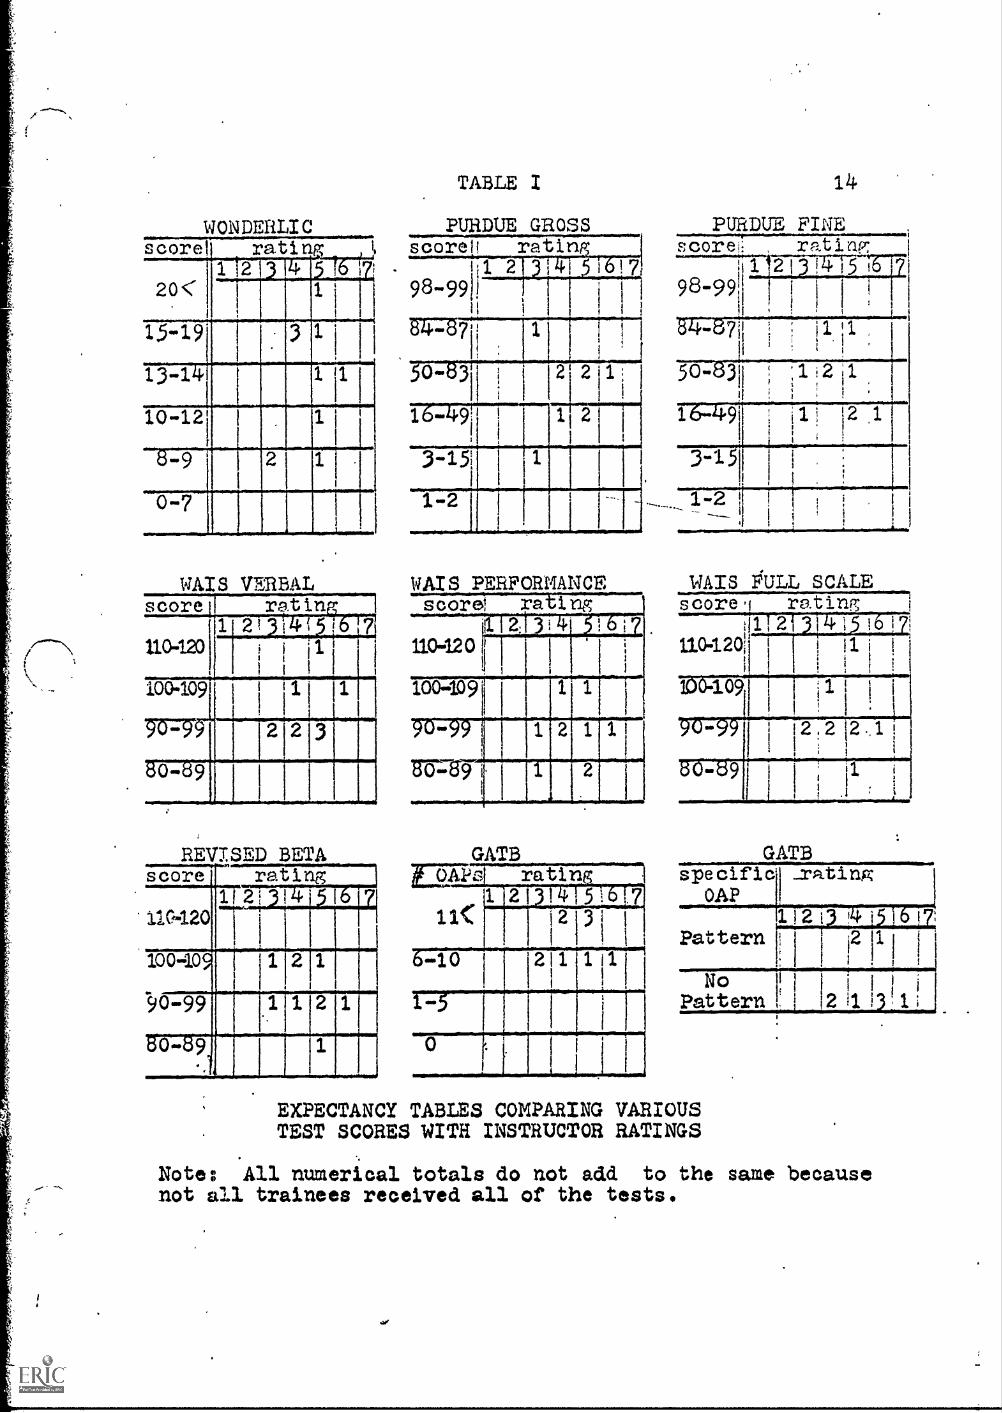
Results. Although most employers using the Wonderlic
Personnel 'Test use a minimum cutting score of twenty (20) for
screening clerk-typist applicants, the two highest rated trainees
fell into the 10-12 score group. The three students rated at
the "acceptable" level were in the 15-19 group, while the.single
highest score student rated". "fair" on the instructors report.
No score of any clerical trainee in the sample fell below ten.
On the Purdue Pegboard Test of Manipulative Dexterity,
the only two students rated with an above average rating scored
at one standard deviation above and below the mean, respectively.
The single lowest rated student made a gross dexterity score
above the mean. Those trainees rated as "acceptable" and "fair"
were fairly evenly distributed near the mean. On the.fine
fingertip dexterity portion of the Purdue, the two highest
rated individuals fell within one standard deviation fram.
the mean, the ones rated "acceptable" were from one to two
standard deviations above the mean while none were below the
mean. Those rated below average ..anged from one standard
deviation below the mean to one above. The single lowest
rated person'was in the thirty-fifth percentile.
The WAIS scores indicate a sharper delineation of cut-
off scores on the Verbal IQ than on the Performance IQ. Most
of the scores fell in the dull-normal range (Wechsrer classification
system), including the two highest scores. Both these individuals
scored lower on the Performance test than on the Verbal. This
phenomenon extended to all but two of the cases studied. The
Revised Beta IQ scores very closely paralleled the WAIS Performance
scores, while the WAIS Full Scale IQ tended toward the difference
between the WAIS Verbal and Performance scores.
The reading achievement of the trainees fell almost
completely above the :seventh grade level. Interestingly enough,
the single score at the sixth grade level was one of the two
highest rated persons. Most of the trainees were reading above
the tenth grade level. Arithmetic achievement was much more
scattered and showed no particular pattern. The'lowest scores
were at the fifth grade level, and the highest at the ninth. All
of the below average rated students scored from the sixth to the
eighth grade levels. The Language usage test resembles the
12
Arithmetic test in that the scores are scattered and there is
little discernable pattern. The highest scores on this instru-
ment are those of the average and below students, while the
two best students are among the lowest scores. The lowest
rated and the highest rated students made identical Language
scores. The Spelling test shows the two highest rated students...
scoring no lower than the ninth grade level, the average
students, with one exception at the tenth grade level, and
the blow average students at the ninth grade or below.
An interesting pattern appears when the number of
OAPs made on the GATB were counted. None of the students
made from six to ten OAPs, while half made eleven or more
' and half made from one to five. None of the trainees made
no OAPs. More than half of those making more than eleven
patterns were rated below average, while the two best students
made five or fewer patterns.
The OAPs, which categorize office and clerical workers
are: 9; 13; 23; 36. If any of the students made any one*or
more of these pattetns, they were entered in the row marked
"Pattern". If none of these specific OAPs were made, they
were placed in the row marked "No Pattern". ApproximiTtely
two thirds of the clerical trainees made no specific pattern
for the work they were learning to do. Both the'top rated
students were in the "No Pattern" grbup, as'was the lowest
rated.
JO. a
nt ..
..111
0111
...S
IY-.
..1.0
1,A
1.ar
rt1.
11-.
1, A
O J
.{ 1
,1,
am. a
llul
ina4
-4-A
..et
MI
This is a confidential ogres tionnaire concernfm47the nneral abilit7 of indiv'dua7
students to do the vol.!: require
in the trainins area.
The results e iPfs surve:
11611 not be entered on the studont'srecord or Shoun to then.
Please circle the nuMber of the statement
VI:tat best describes this studelt in
terms of his ability to learn tao sUbjectmatter of the traininr? area
1. OUTS2111-0=--has no veaknessas, a perfect
student.
2. MOLTUT--few veahnesses, 1Darns rmich:ly
and easi:147.
3.
MO
D--
--ir
oric
is sau/s4,4cuory and above averarm on most Ito-o
shins.
AC
CE
PTZ
TL
Idoe
sreacioncabk7 -Jell, no
bettor or verso u aaa Licsu.
F.M
.13e
lou
aver
eoo
or -
.out
vori
: not
snt:I
sfcc
tor'7
.
6. T'Ocla. vary limited ability vith manshortconin;,:s.
7. FAILUMtotally unsatisfactory vcrh, vill never be able to learn
the su7Jject.
FIG
UR
E I
CL
IEN
T R
AT
ING
QU
EST
ION
NA
IRE
'
WON DERLI Cscore rating
20<3 5
1
15-19 31 1
13-14
v1
1 1
10-12 1
8-9 2 1 .
0-7
WAIS VERBALscore ratin110-120
1 2 3 7. :1
100409
W7-9.---1 i
2 2 3
60 -89
REVISED BETAscore rating117777110420
100409 1 2 1
'0-994 1 1 2 1
60-89' 1
.1
TABLE I
PURDUE GROSSscore rating
98-9912 3 51 7
1347=S7 1
50 -fl3`
1
2 2 1
3-151
1
1 -2I
WAIS PERFORMANCE
2c(212x1;u1rig
g 711
I .
110-120
100-109 1
1 2 1 1
1315:3-9 ! 1 2
GATB1.20s rating
II<1 213 4 516 7
2 31
6-10 211 1111
1-5
0
14
PURDUE FINEscore- rating;-----704275T7377798-99 Hill
! 1 ,i!
; H
50.831 ;1 i2 11
. 1 1
16-49 11 I 12 ,1i
3-15
1-2 ri
WAIS FULL SCALEscore, rating
d1r21314151617110120!
i i
.
*4 109 1
.. do. 22 2..1
11
1
1
GATBspecific _rating
OAP112i3 415 617
Pattern i 1 12 111 I
No12 11 IPattern 3:1;
EXPECTANCY TABLES COMPARING VARIOUSTEST SCORES WITH INSTRUCTOR RATINGS
Note: All numerical totals do not add to the same becausenot all trainees received all of the tests.
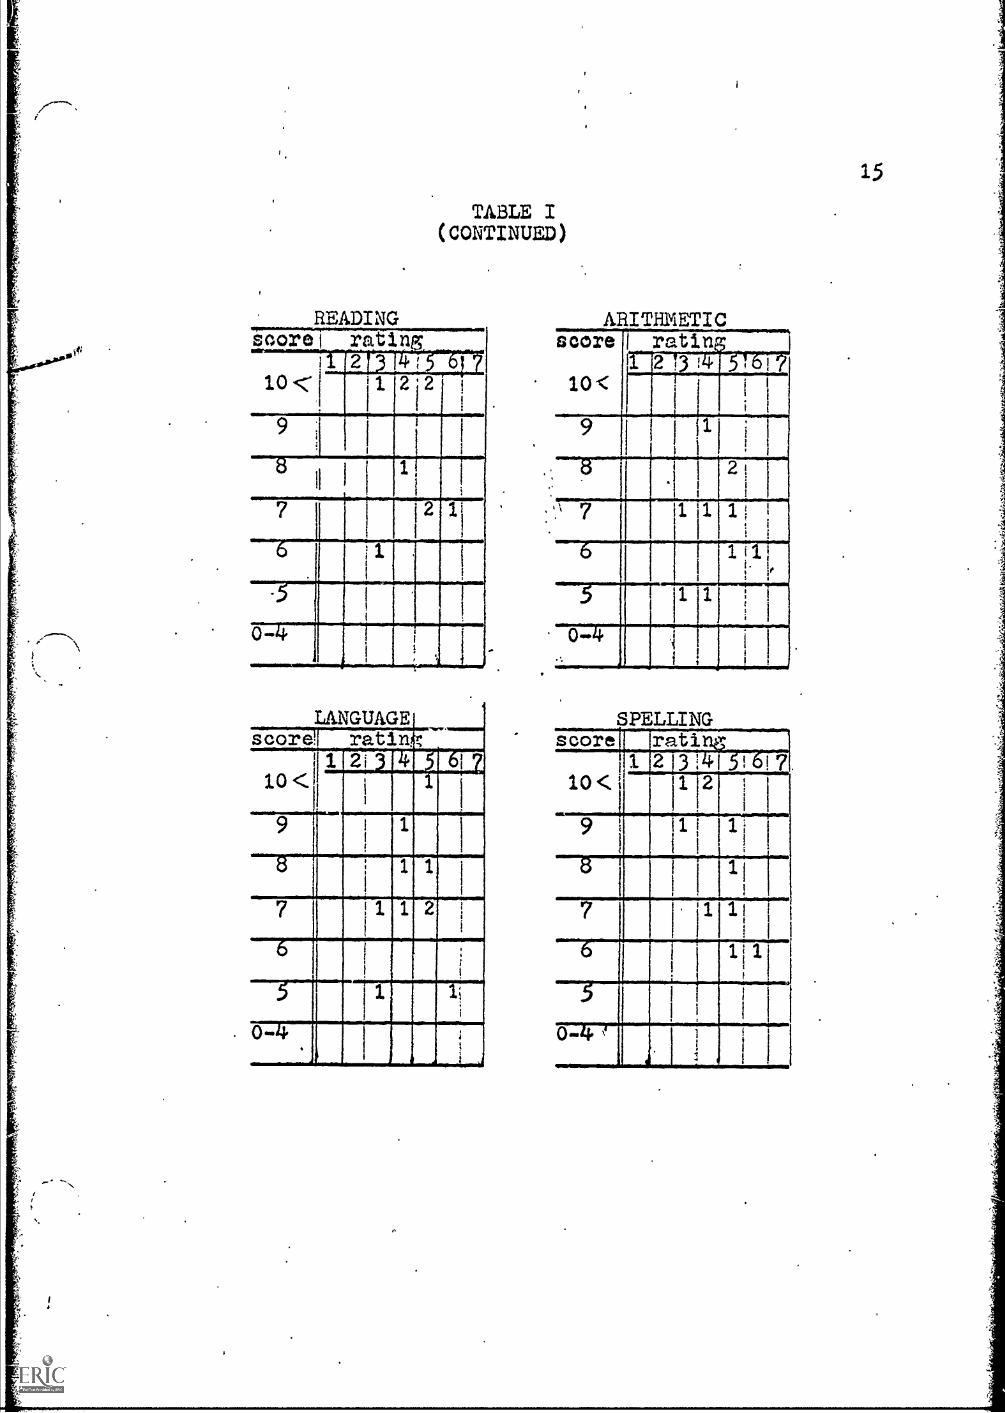
TABLE I(CONTINUED)
READINGsoorc--10<
2 3
11229
8
7 21j6 1 .
:
0-4 I
LANGUAGEscore ratinfr.10 <
1 2i 4 6
i1
9 1 1
8 14 1"
7 11I
1 2
I !
5 1;
0-4.
..
I
i
I . r - i ,A
ARITHMETICscore
10<
ratin_$.'1 2'3 4 Pb 7"
.
9 1
8
.;
i. 1 1 '
6 1 1 1-. 1 ,
5.
0.14.. .
SPELLINGscore 1 MEMO=
2 3 . 710<t
112
i7-4.1.!
11
1 1
7-1H,111
I
0-4
15
16
II. THE JOB PLACED GROUP
Technique. The criteria used for "success" in this
group was whether the client could be employed or remain
employed after hiring. Only those who were still employed
in jobs directly related to their training were used. Also,
persons who were employed in their area of training, but were
transferred,. promoted, or otherwise no longer working within
the area of their competency were not used. Our interest was
directed only toward those who were trained and subsequently
attempted employment in the same field of work.
At the time this study was made, only those files in
the Center's Placement Department were available. Of these
available files, only the files which were current for the
months of July and August 1968 provided follow-up information.
This six -month follow -up consisted of personal contact with
the former trainee to learn if he/she had successfully completed
six months of work for the same employer.
Each placed trainee's file was checked to record the
test scores made when the client was initially evaluated. This
portion of the study was identical with the previously cited
Instructor Rated Group. The test scores were paired for.
comparison purposes in dyads which had customarily been used
bythe Center's vocational counselors for evaluative purposes.
So that the success/non-success data could be directly compared
17
with the two tests in each dyad, and with each other, the
double entry expectancy table described by Wesman (1966) was
used.
Results. Most of the clients in this group were first
evaluated at the Center prior to the adoption of the Wonderlic
Personnel Test. For this reason, the Wonderlic was omitted
from the expectancy tables.
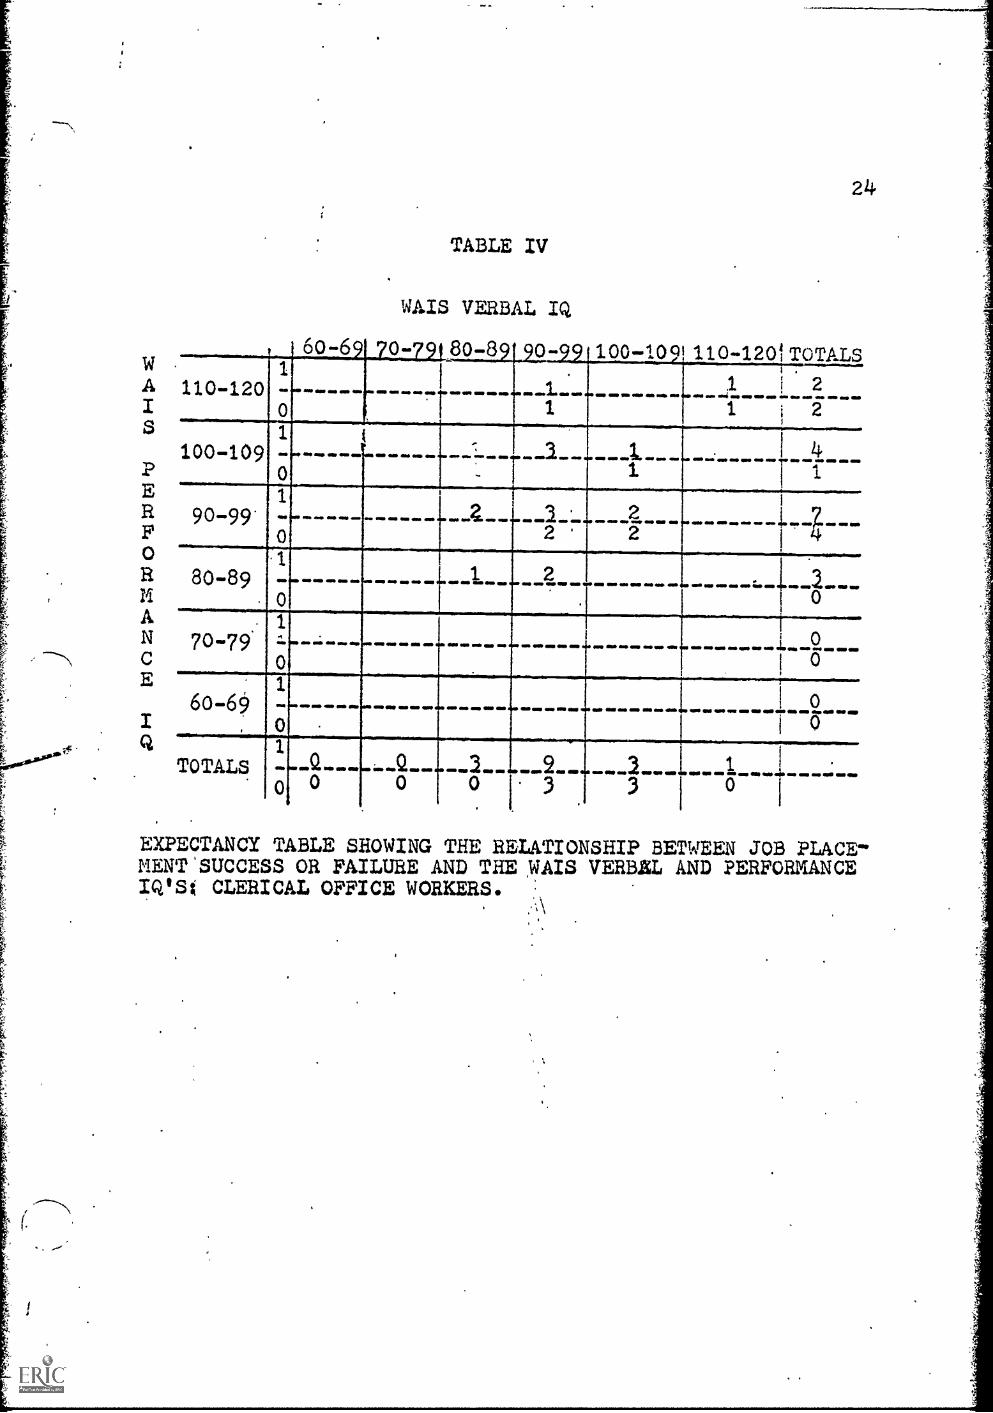
With the Clerical trainees, both the greatest success
on the WAIS Verbal and. Performance scales came at the lower
half of the Normal range (Wechsler, 1955, p.20), as well as
the greatest numbers of failures. Proportionally, a greater
number of failures occured in the Bright-Normal range than
did successes on the Performance scale; wheras, a greater
number succeeded in the dull-normal range than failed. The
same phenomenon occurs on the WAIS Verbal scale. The failures
are equally divided entirely within the normal range above
and below the mean of the test, while more-successes occur
in the low-to-dull-normal range than above the mean.
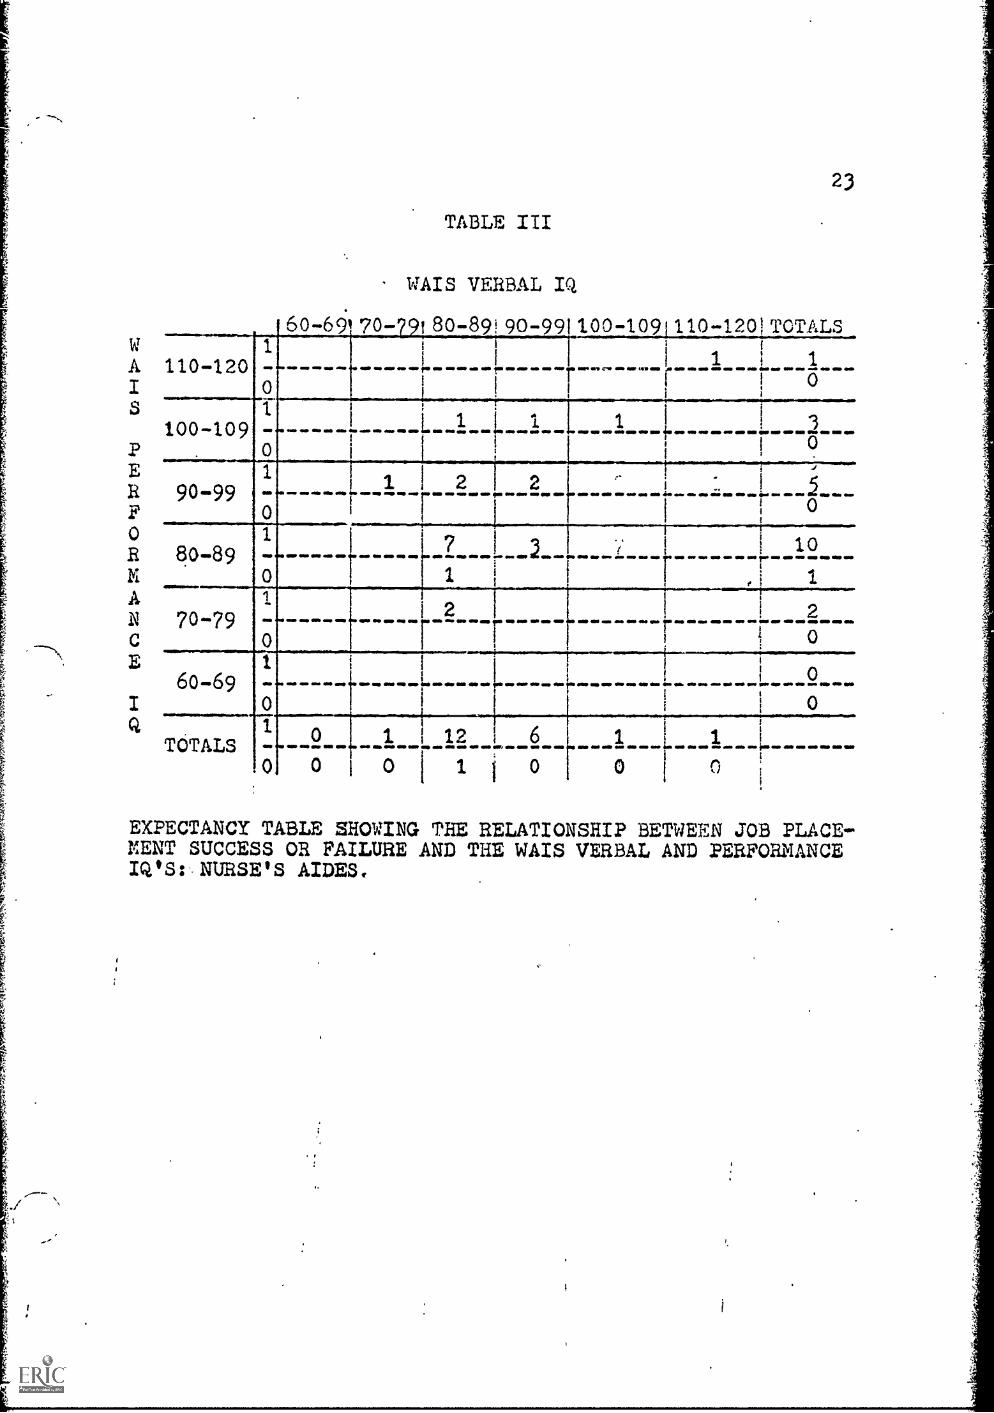
Little can be determined from the WAIS Verbal/Performance
comparison in the Nurse Aide group because despite diligent
search, only one placement failure was located. On both the
Verbal and Performance scales, the greatest concentration of
scores occur-in the dull-normal range. It is in this range
that the single failure also occurs.
18
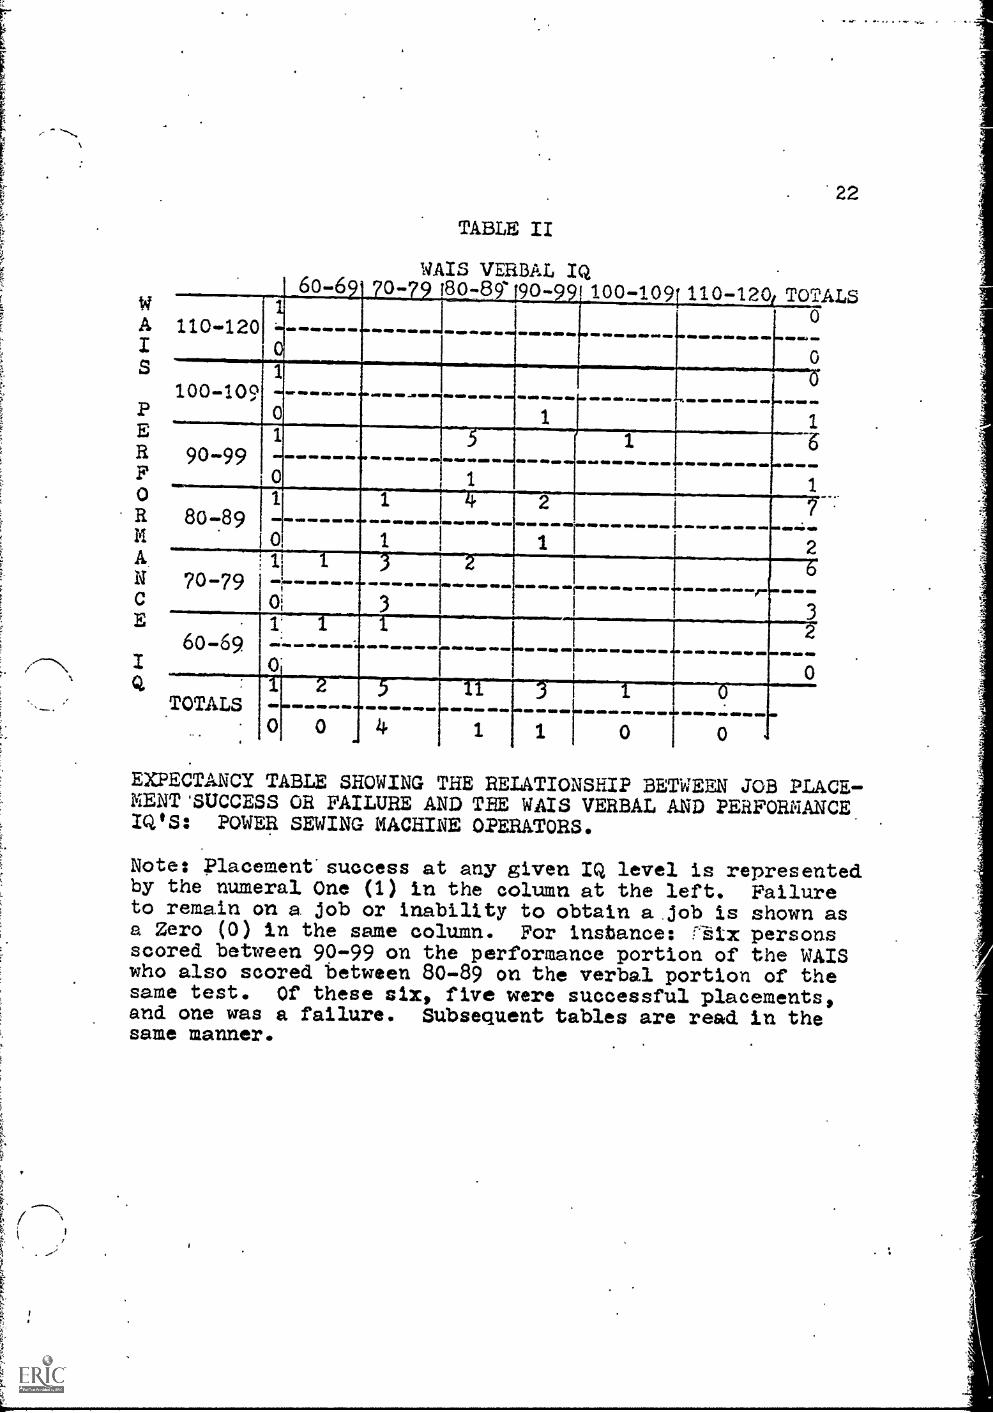
Again, with the WAIS VerbalPerformance comparison of
successes versus failures in the sewing group, we find a more
or less normal distribution of scores in both the success group
and failure group. In the Verbal range, we find the greatest
failure concentration to success ratio in the borderline 'IQ
range (Wechsler classification). Despite this, the. two lowest
scores in both the Verbal and Performance IQs were successful
on the job. both these individuals scored in Wechsler's
mentally defective classification. The single highest Performance9
score, which was in the upper half of the normal range, was
listed as a failure. On the Performance scale, we find the
greatest likelyhood of job success if the subject scores above
eighty IQ.
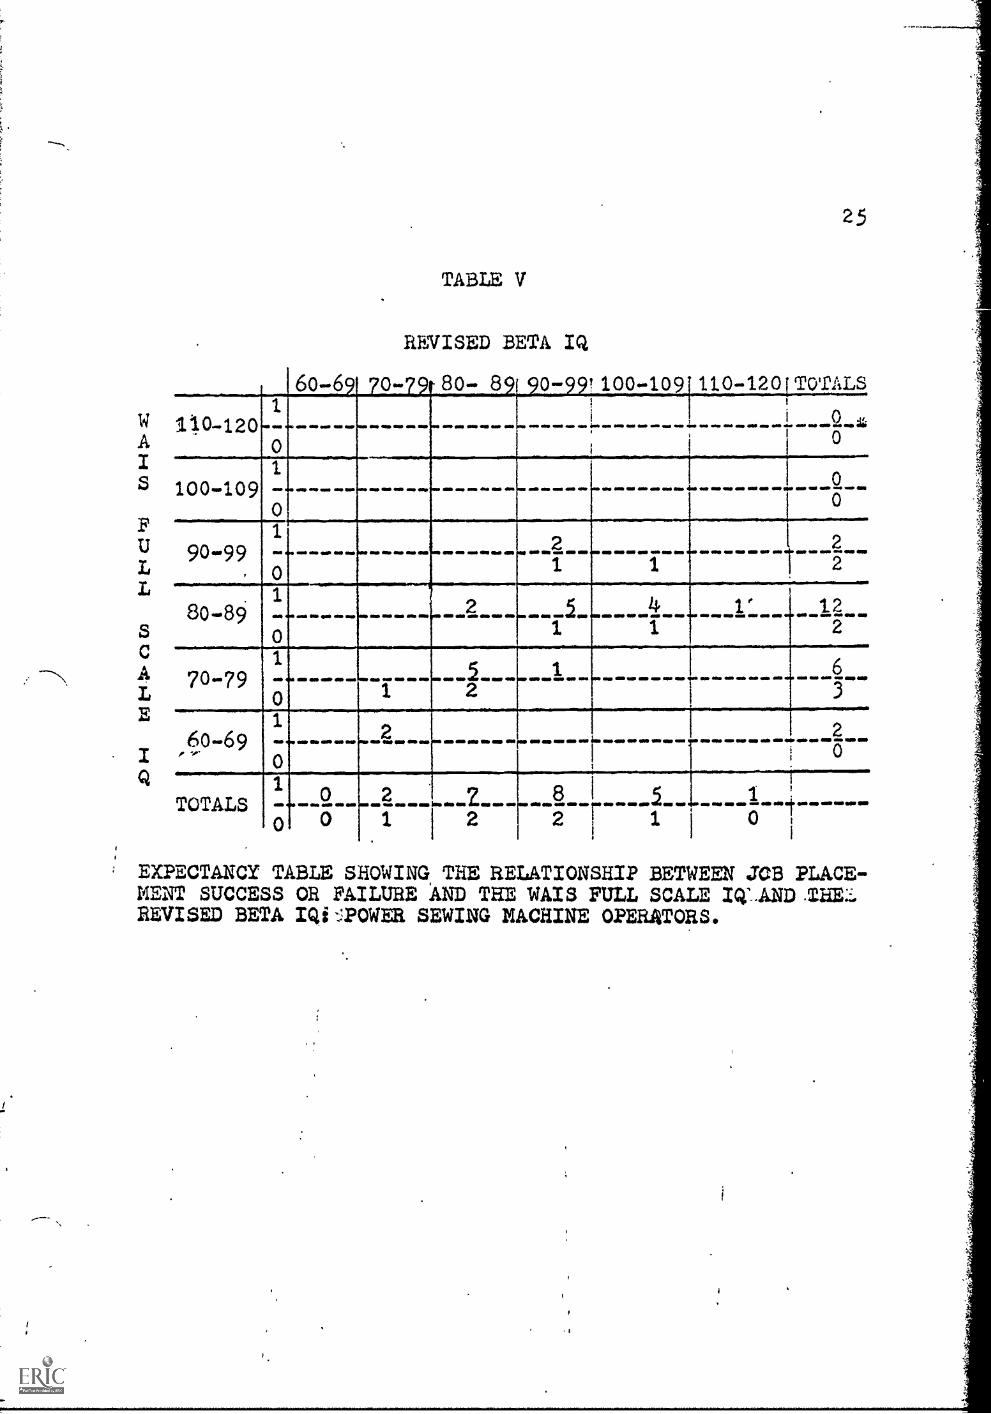
The next expectancy table is a comparison of the WAIS
Full Scale IQ with the Revised Beta IQ.
Almost all the results fall above an IQ of ninety. In
actuality, although the expectancy table cells do not reflect
it, virtually all of the IQs in the ninety range are above
ninety -five.
The highest single proportion of failures to successes
on the WAIS comes at the lower side of the normal range. On
the Beta results, a similar characteristic is noted, although
there were fewer, numerically, below one hundred IQs on the
Beta than the WAIS.
19
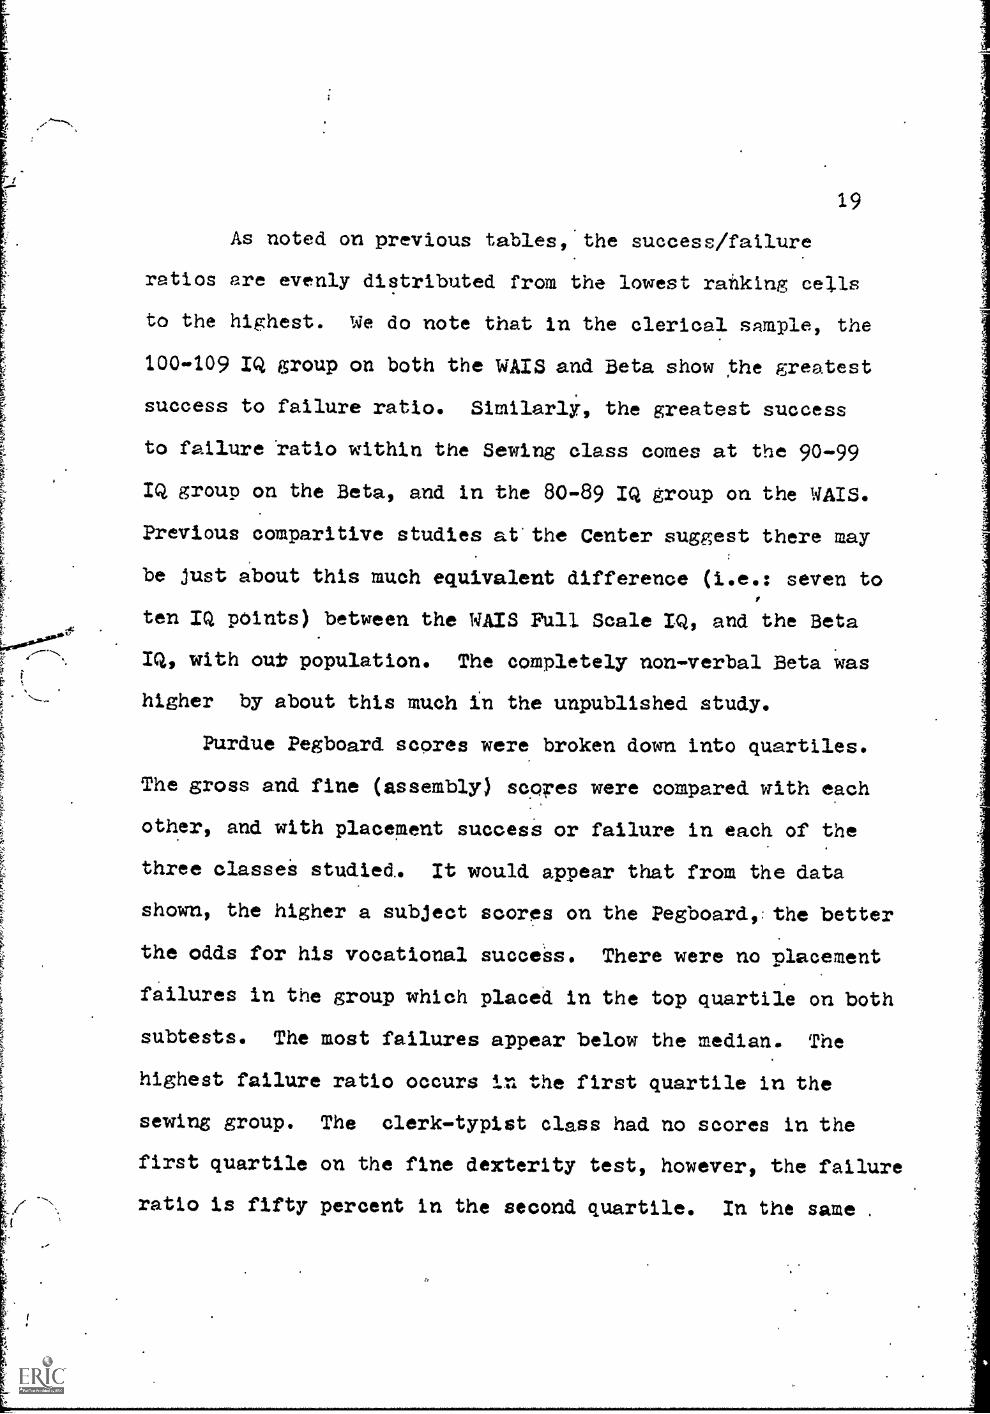
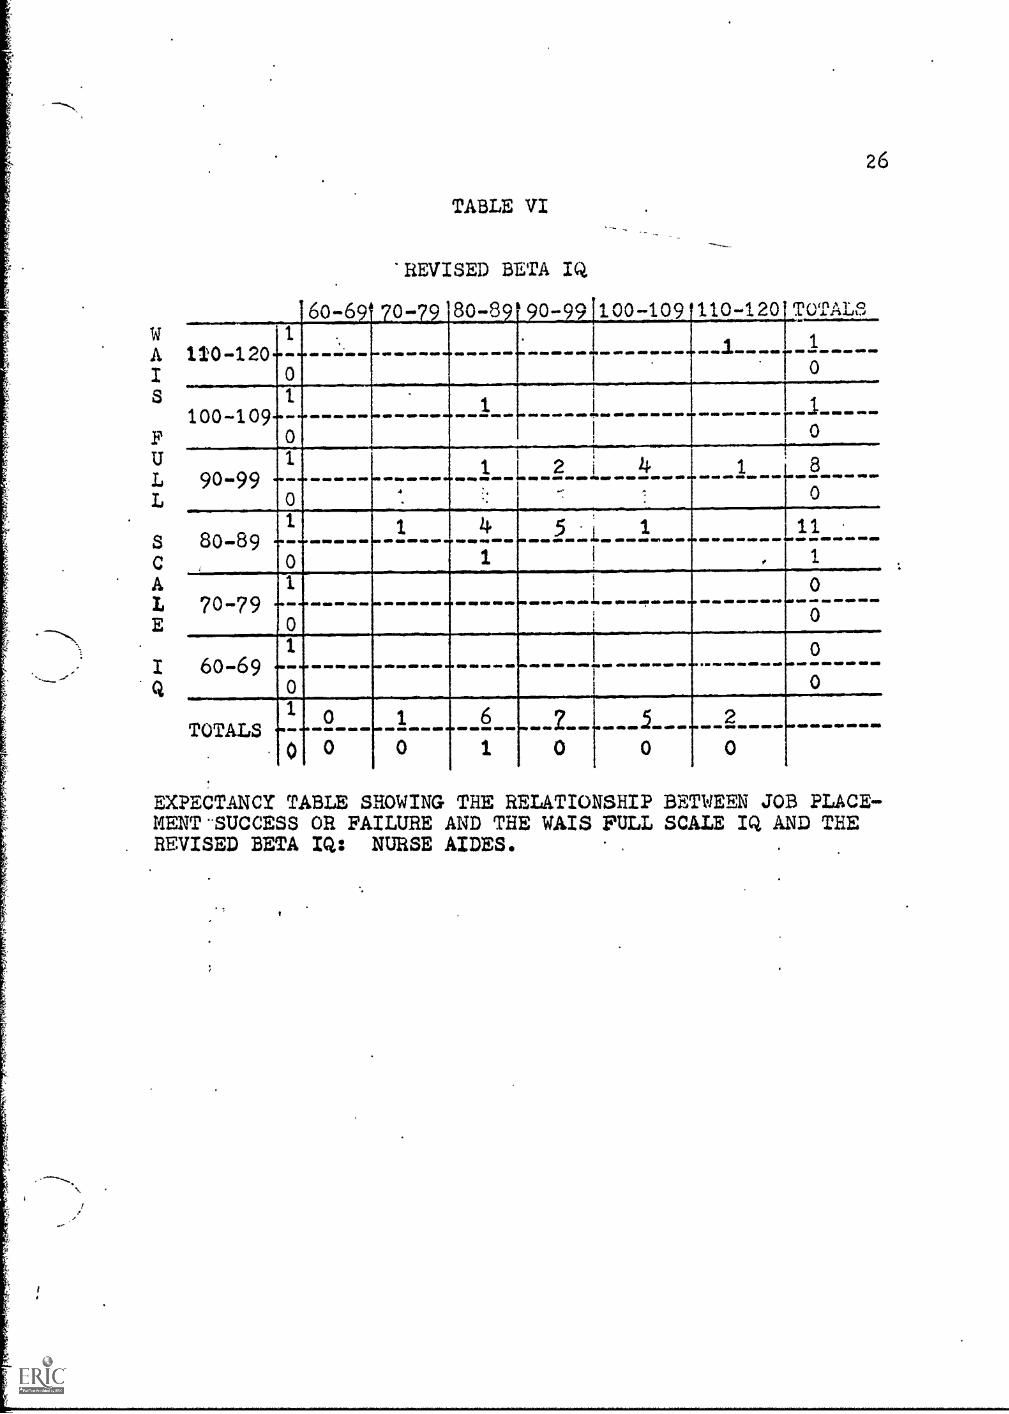
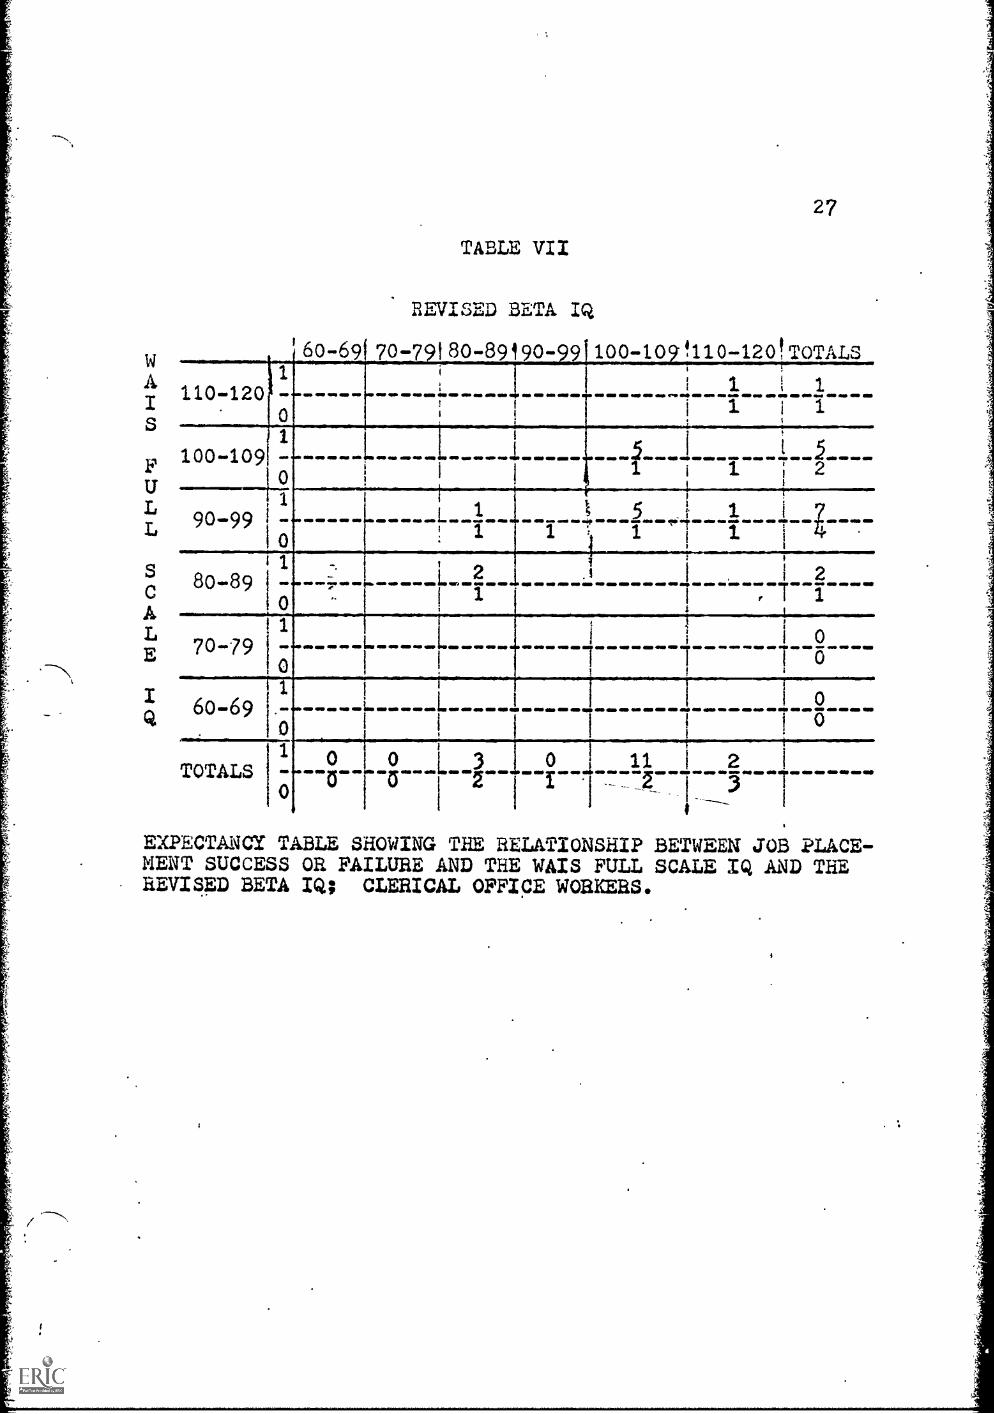
As noted on previous tables,the success/failure
ratios are evenly distributed from the lowest ranking cells
to the highest. We do note that in the clerical sample, the
100-109 IQ group on both the WAIS and Beta show the greatest
success to failure ratio. Similarly, the greatest success
to failure ratio within the Sewing class comes at the 90-99
IQ group on the Beta, and in the 80-89 IQ group on the WAIS.
Previous comparitive studies at'the Center suggest there may
be just about this much equivalent difference (i.e.: seven to
ten IQ p6ints) between the WAIS Full Scale IQ, and the Beta
IQ, with out population. The completely non-verbal Beta was
higher by about this much in the unpublished study.
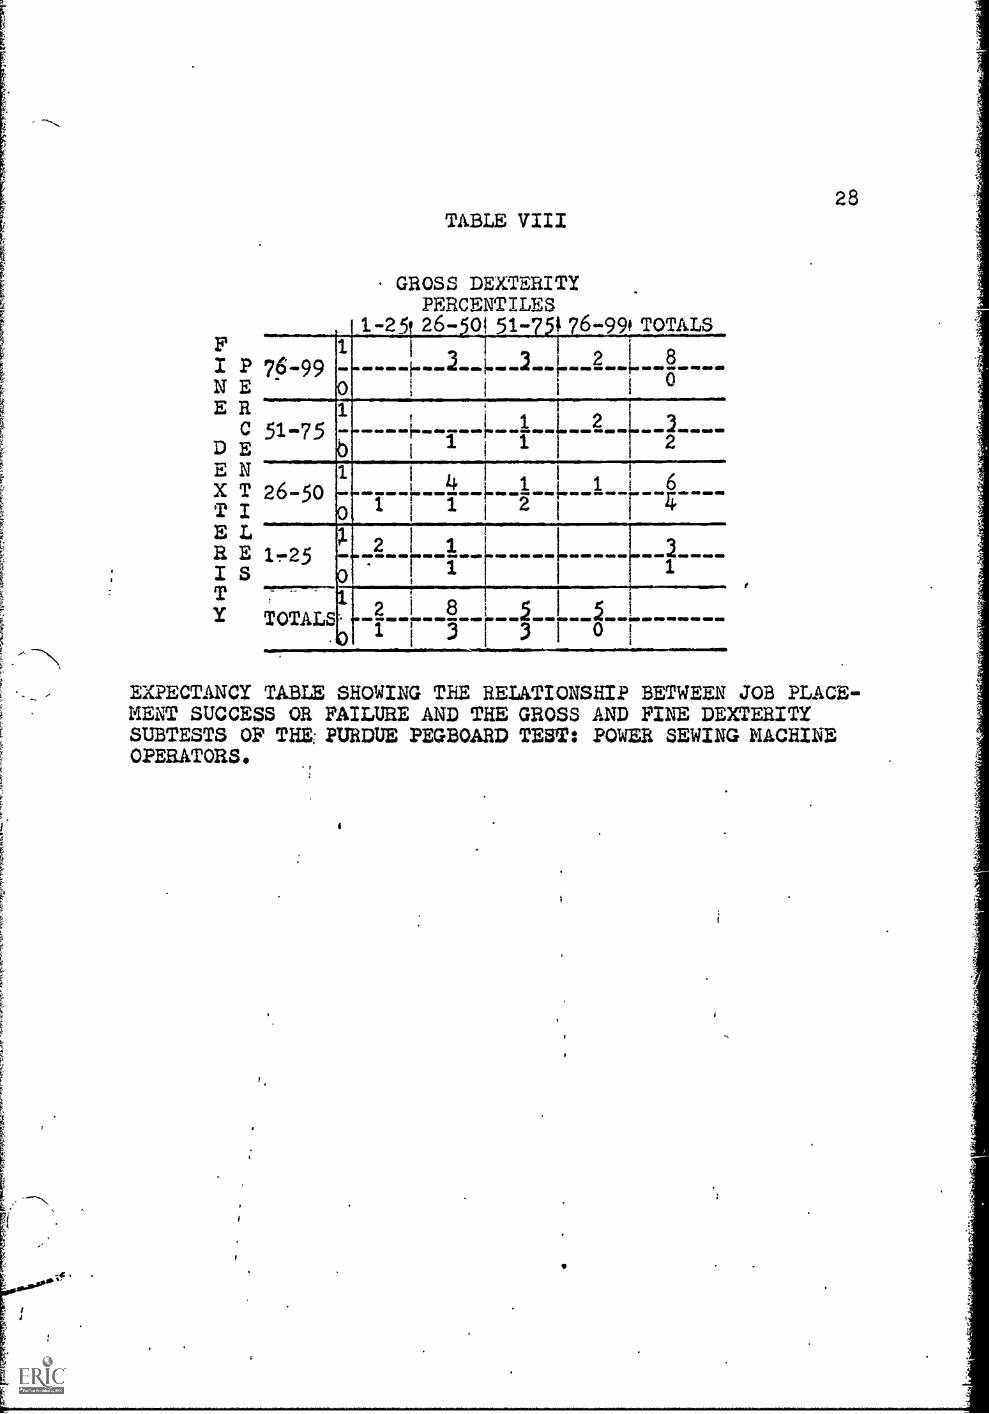
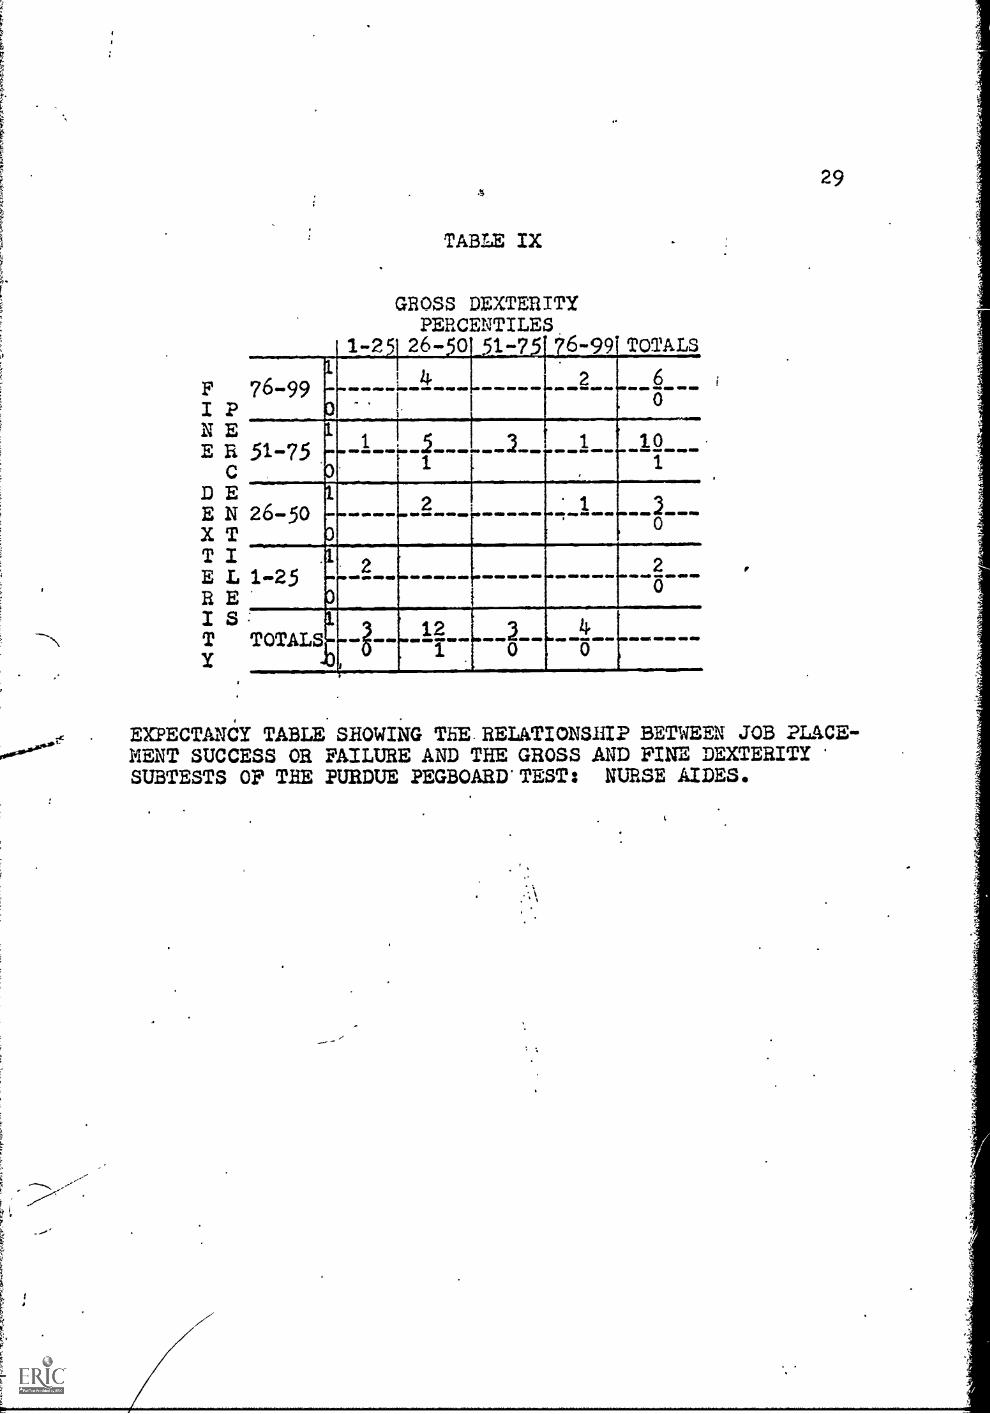
Purdue Pegboard scores were broken down into quartiles.
The gross and fine (assembly) scores were compared with each
other, and with placement success or failure in each of the
three classei studied. It would appear that from the data
shown, the higher a subject scores on the Pegboard,: the better
the odds for his vocational success. There were no placement
failures in the group which placed in the top quartile on both
subtests. The most failures appear below the median. The
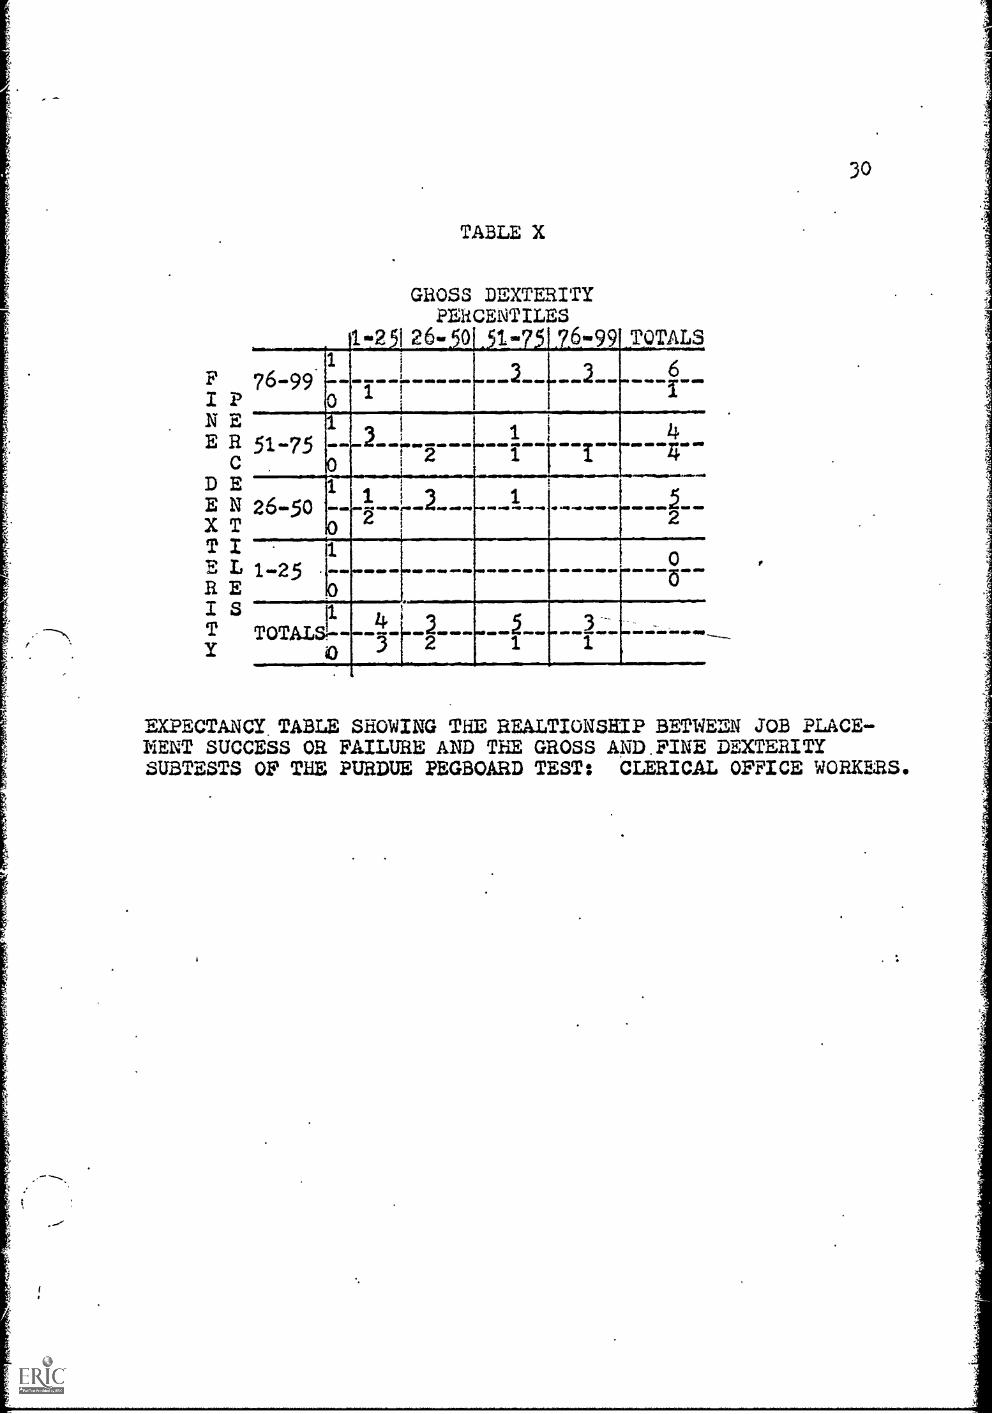
highest failure ratio occurs in the first quartile in the
sewing group. The clerk-typist class had no scores in the
first quartile on the fine dexterity test, however, the failure
ratio is fifty percent in the second quartile. In the same
20
group, the gross dexterity scores in the first quartile show
an even higher percentage of failure.
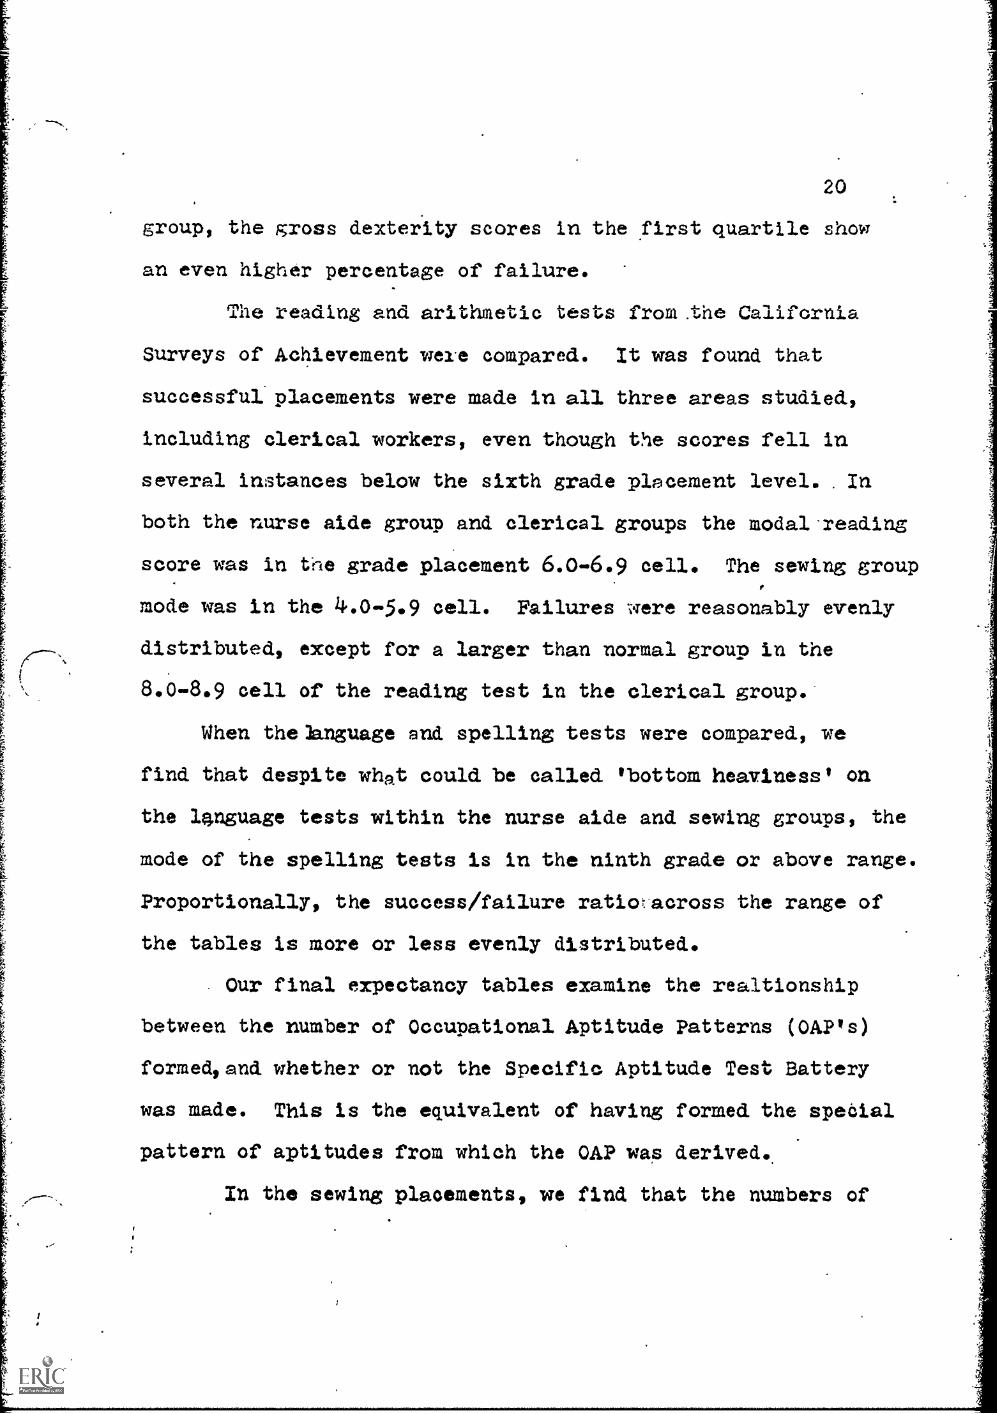
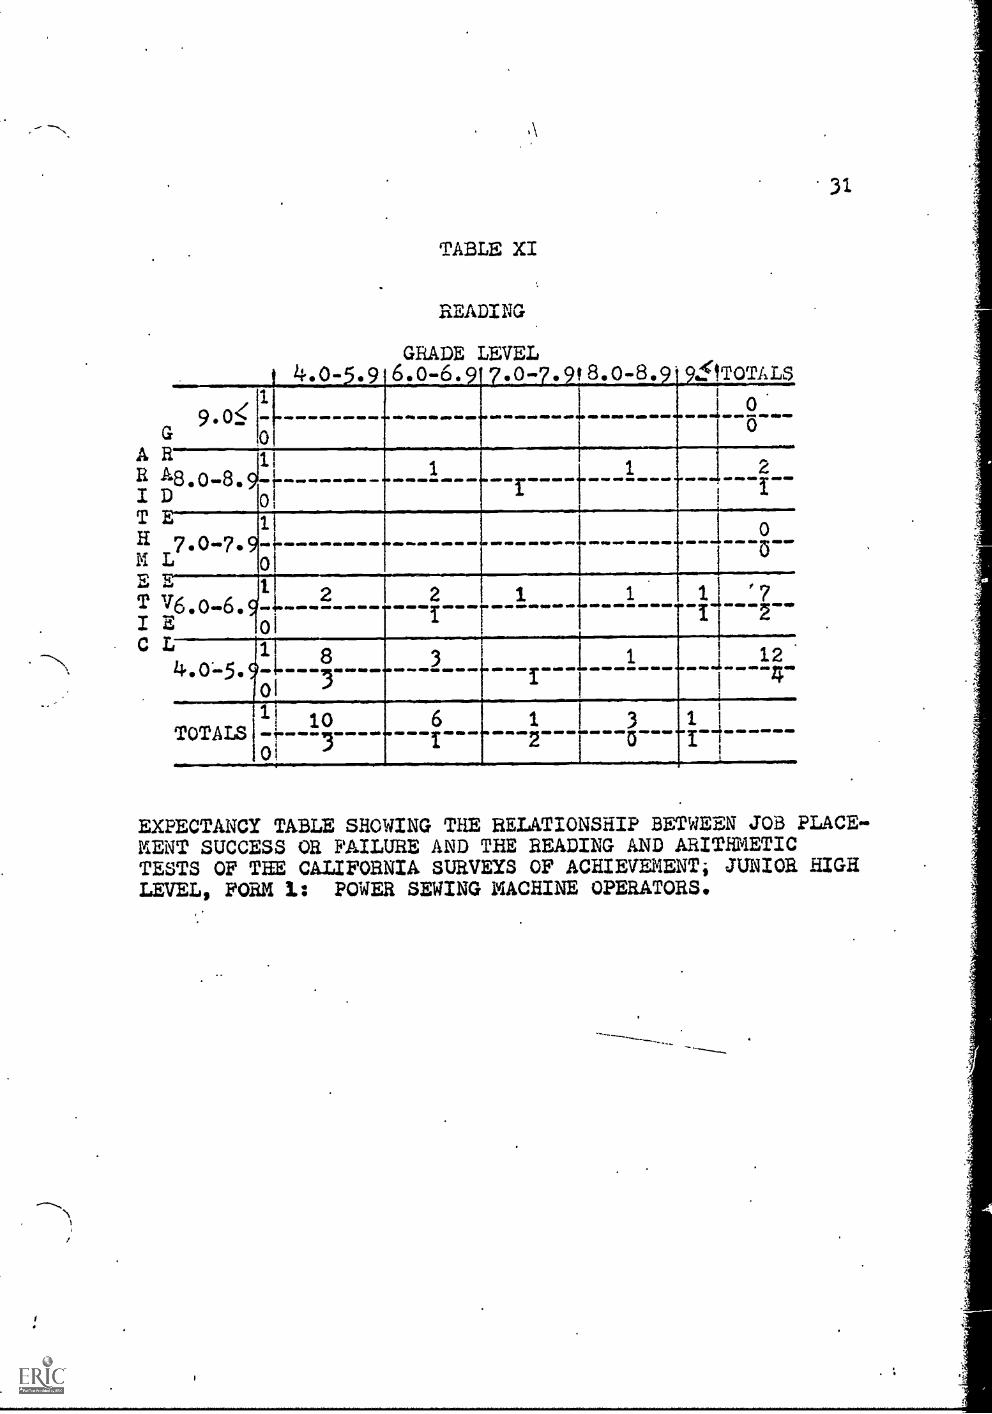
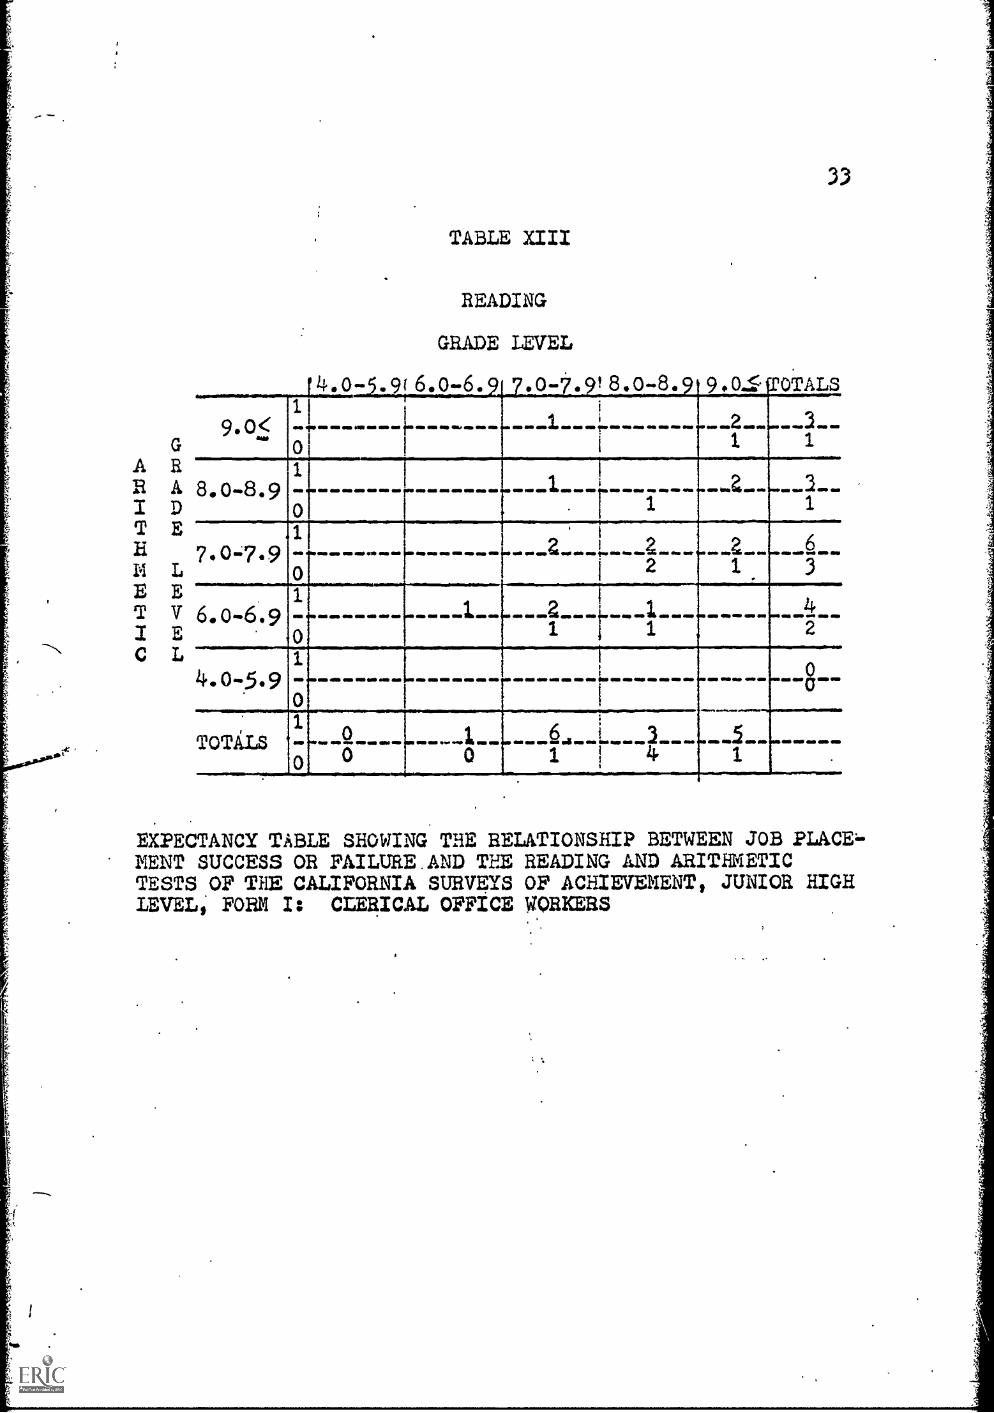
The reading and arithmetic tests from .the California
Surveys of Achievement were compared. It was found that
successful placements were made in all three areas studied,
including clerical workers, even though the scores fell in
several instances below the sixth grade pincement level. . In
both the nurse aide group and clerical groups the modal-reading
score was in the grade placement 6.0-6.9 cell. The sewing group1
mode was in the 4.0-5.9 cell. Failures were reasonably evenly
distributed, except for a larger than normal group in the
8.0-8.9 cell of the reading test in the clerical group.
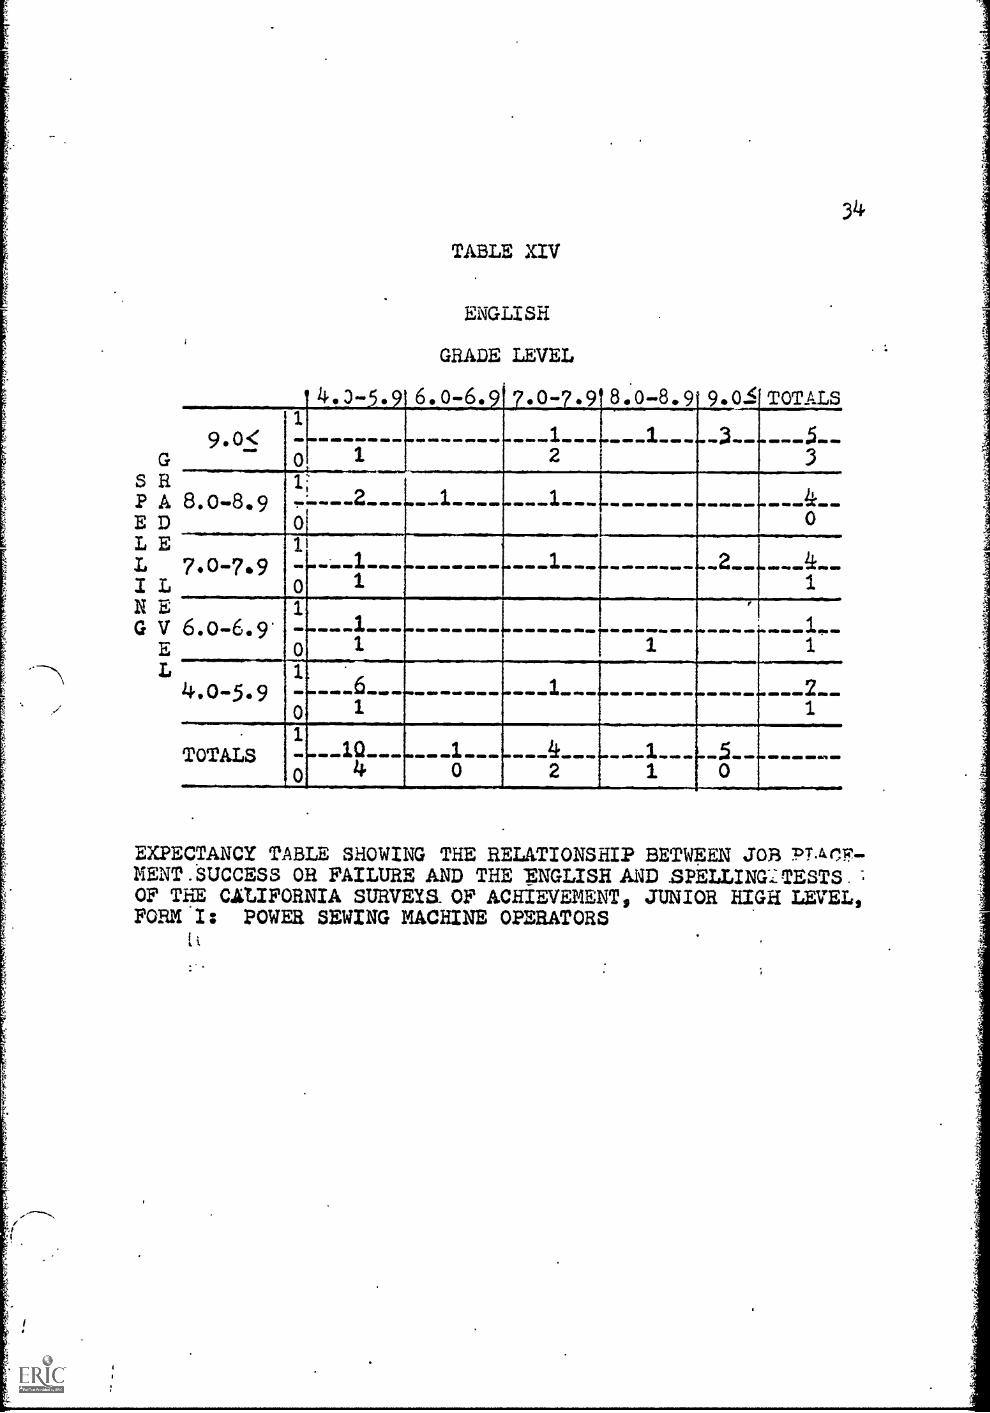
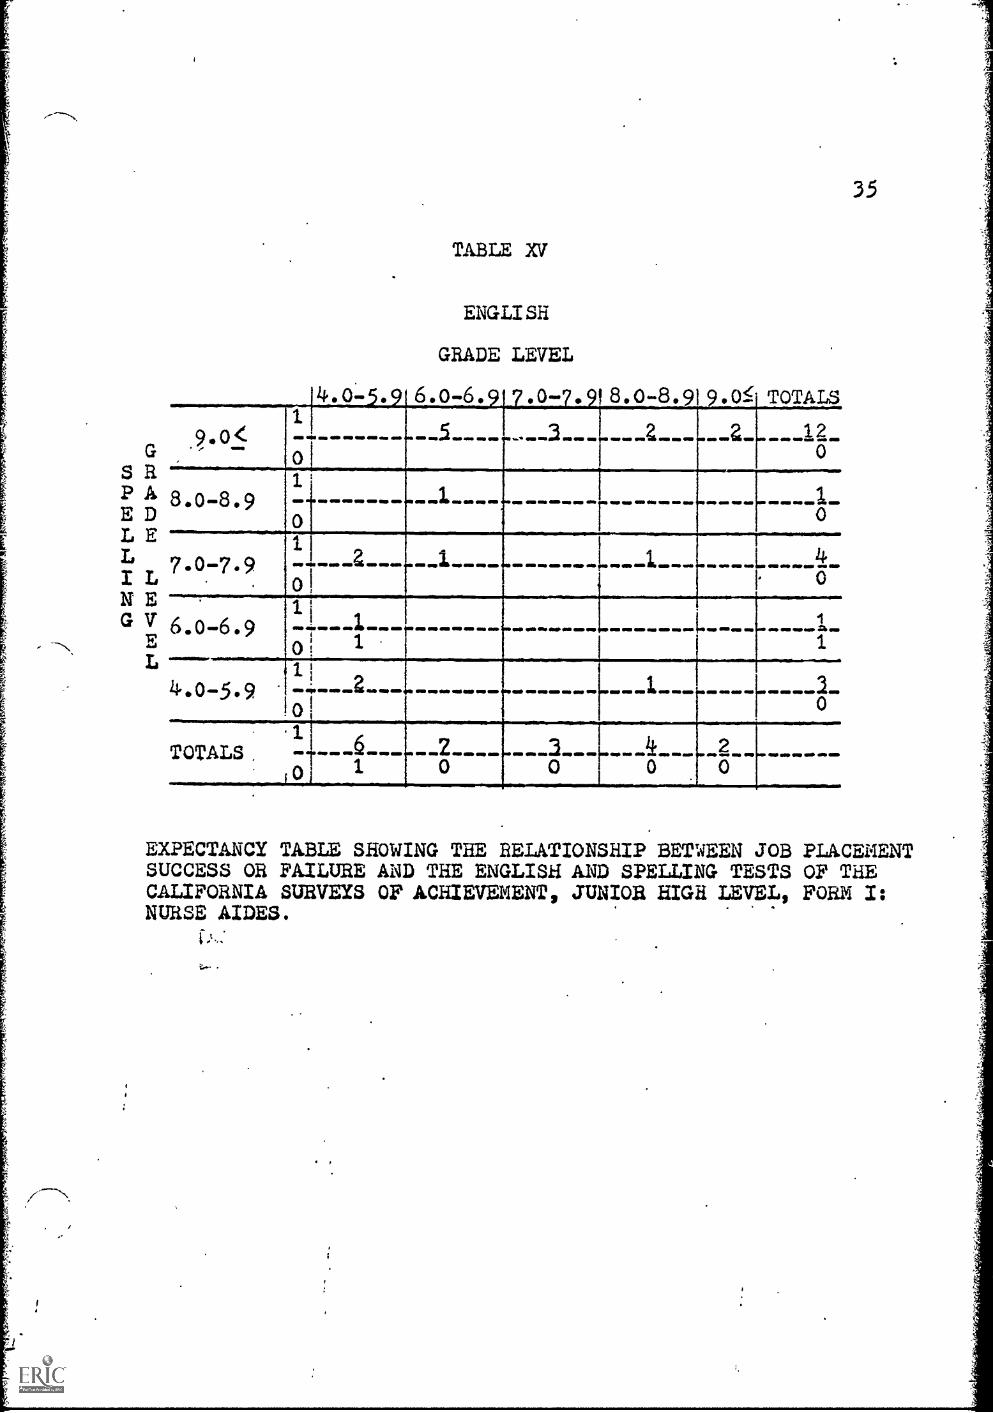
When the knguage and spelling tests were compared, we
find that despite what could be called 'bottom heaviness' on
the language tests within the nurse aide and sewing groups, the
mode of the spelling tests is in the ninth grade or above range.
Proportionally, the success/failure ratio across the range of
the tables is more or less evenly distributed.
Our final expectancy tables examine the realtionship
between the number of Occupational Aptitude Patterns (OAP's)
formedvand whether or not the Specific Aptitude Test Battery
was made. This is the equivalent of having formed the speCial
pattern of aptitudes from which the OAP was derived.
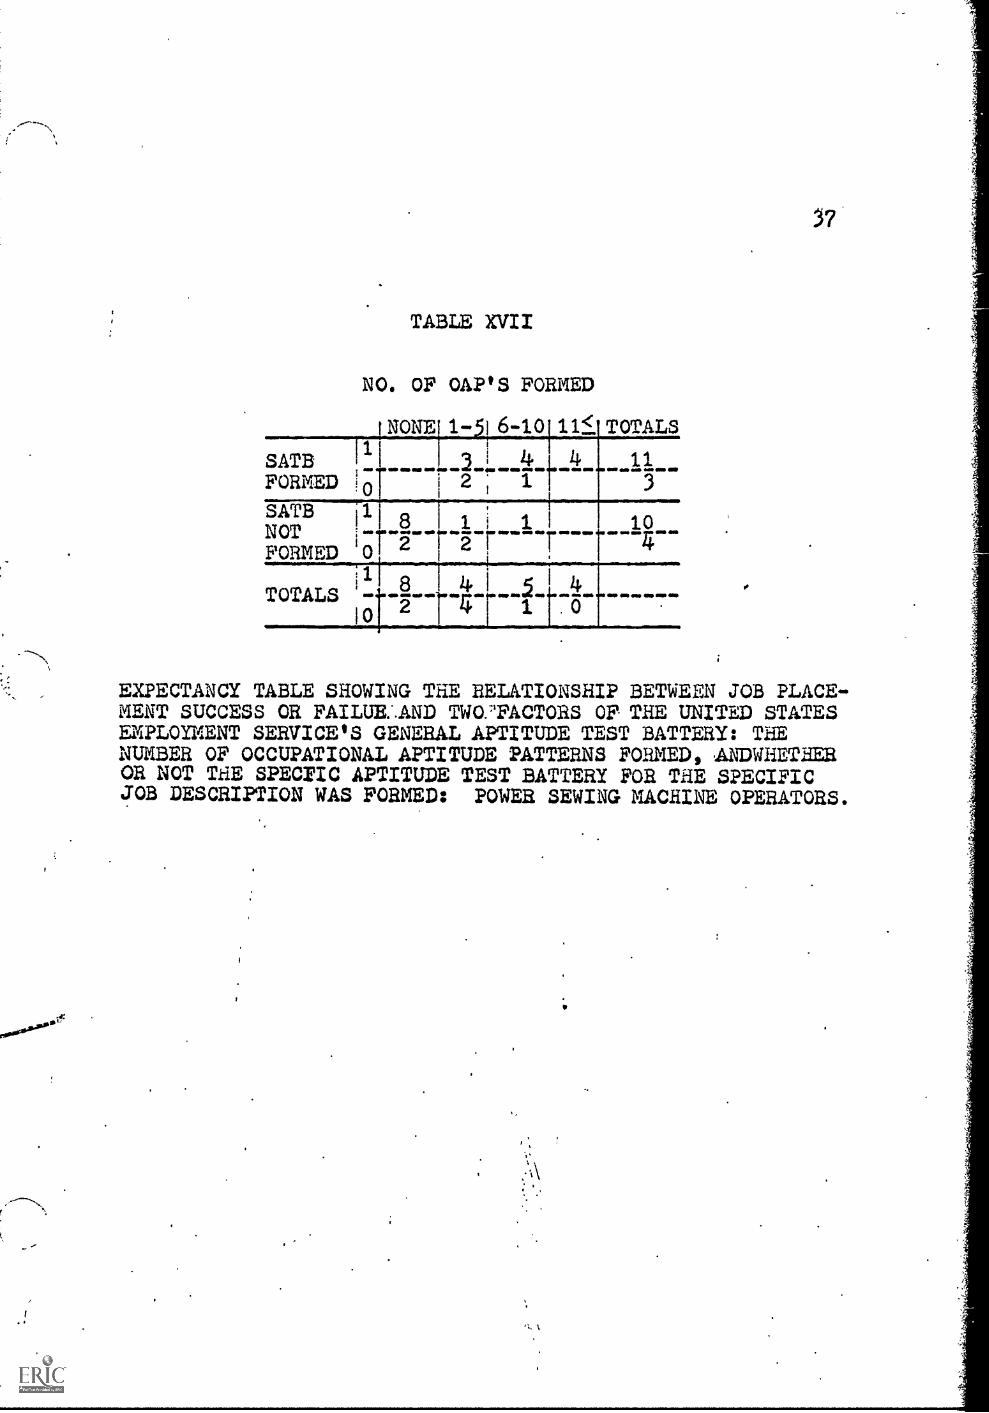
In the sewing placements, we find that the numbers of
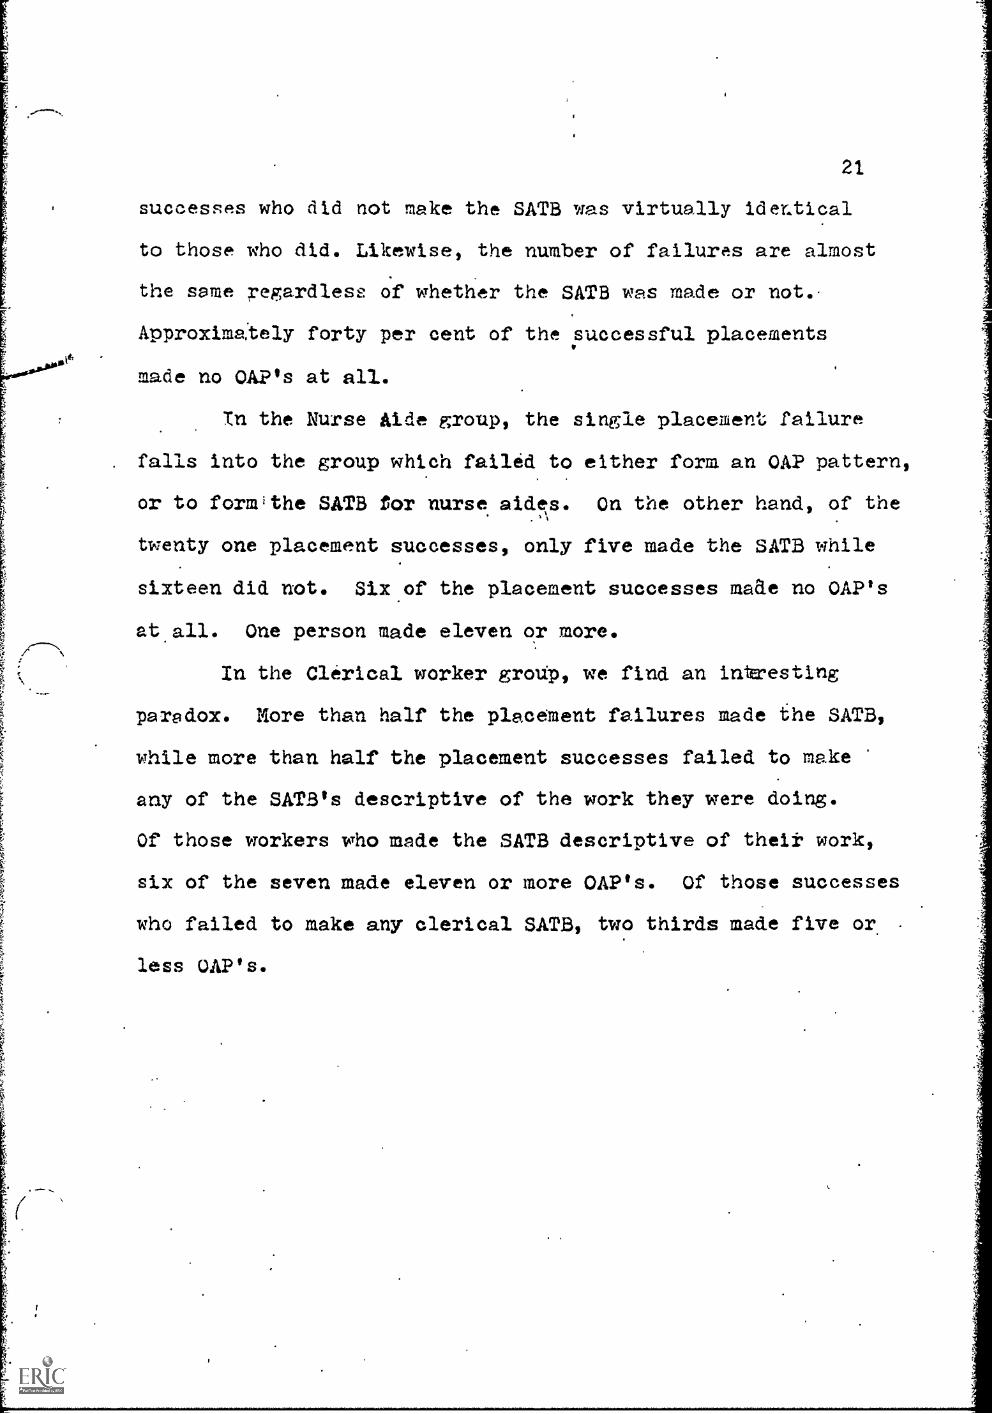
21
successes who did not make the SATB was virtually identical
to those who did. Likewise, the number of failures are almost
the same regardless of whether the SATB was made or not.
Approxima.tely forty per cent of the successful placements
made no OAP's at all.
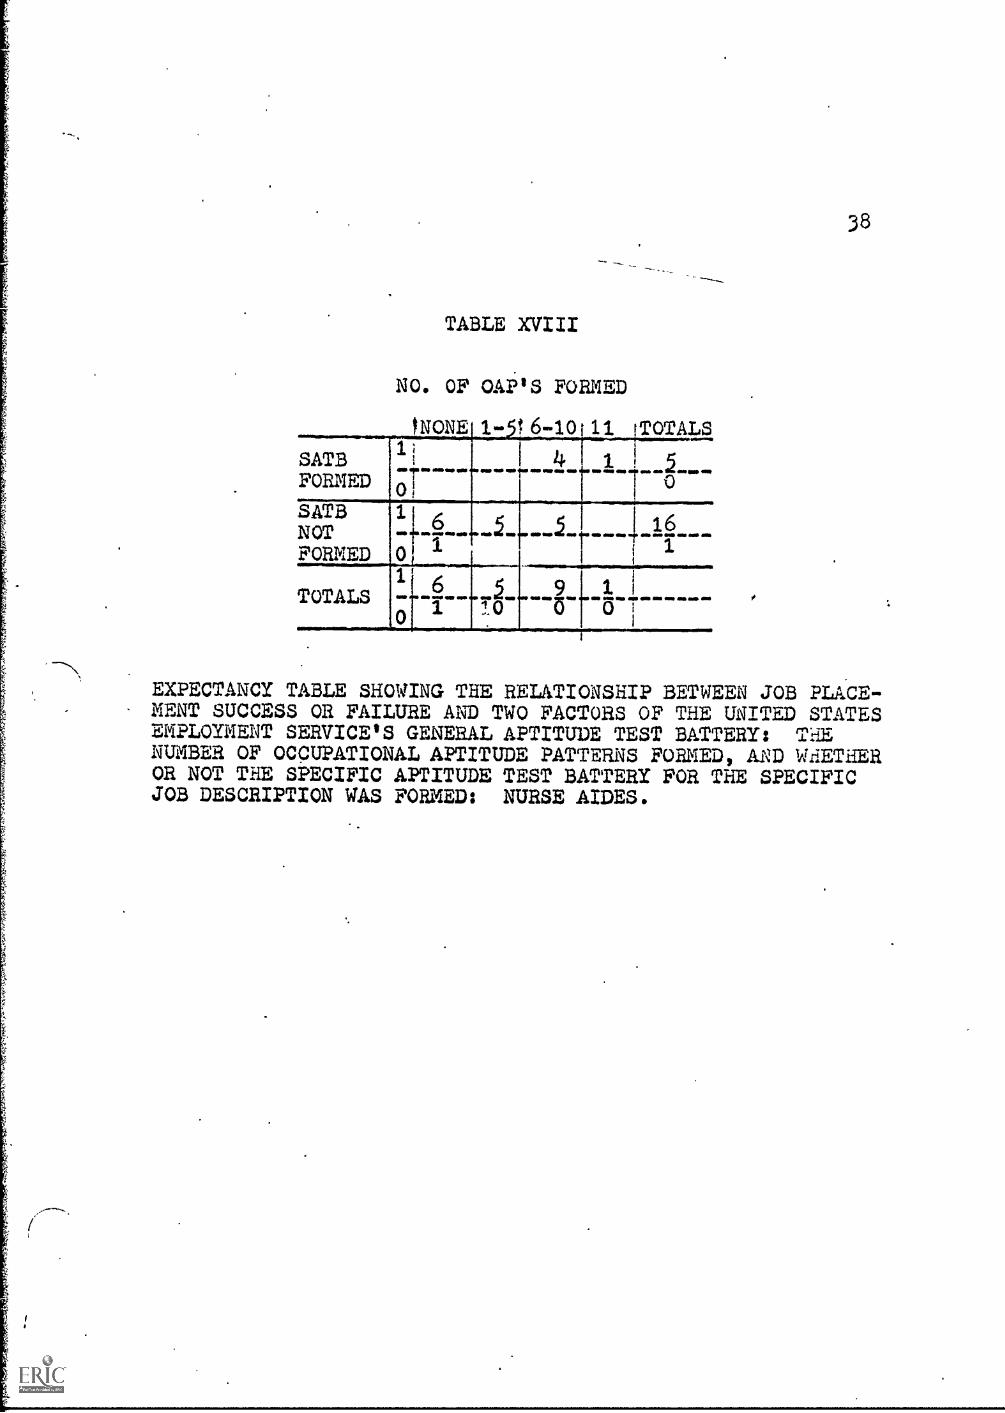
Tn the Nurse Aide group, the single placement failure
. falls into the group which failed to either form an OAP pattern,
or to formithe SATB for nurse aides. On the other hand, of the
twenty one placement successes, only five made the SATB while
sixteen did not. Six of the placement successes made no OAP's
at all. One person made eleven or more.
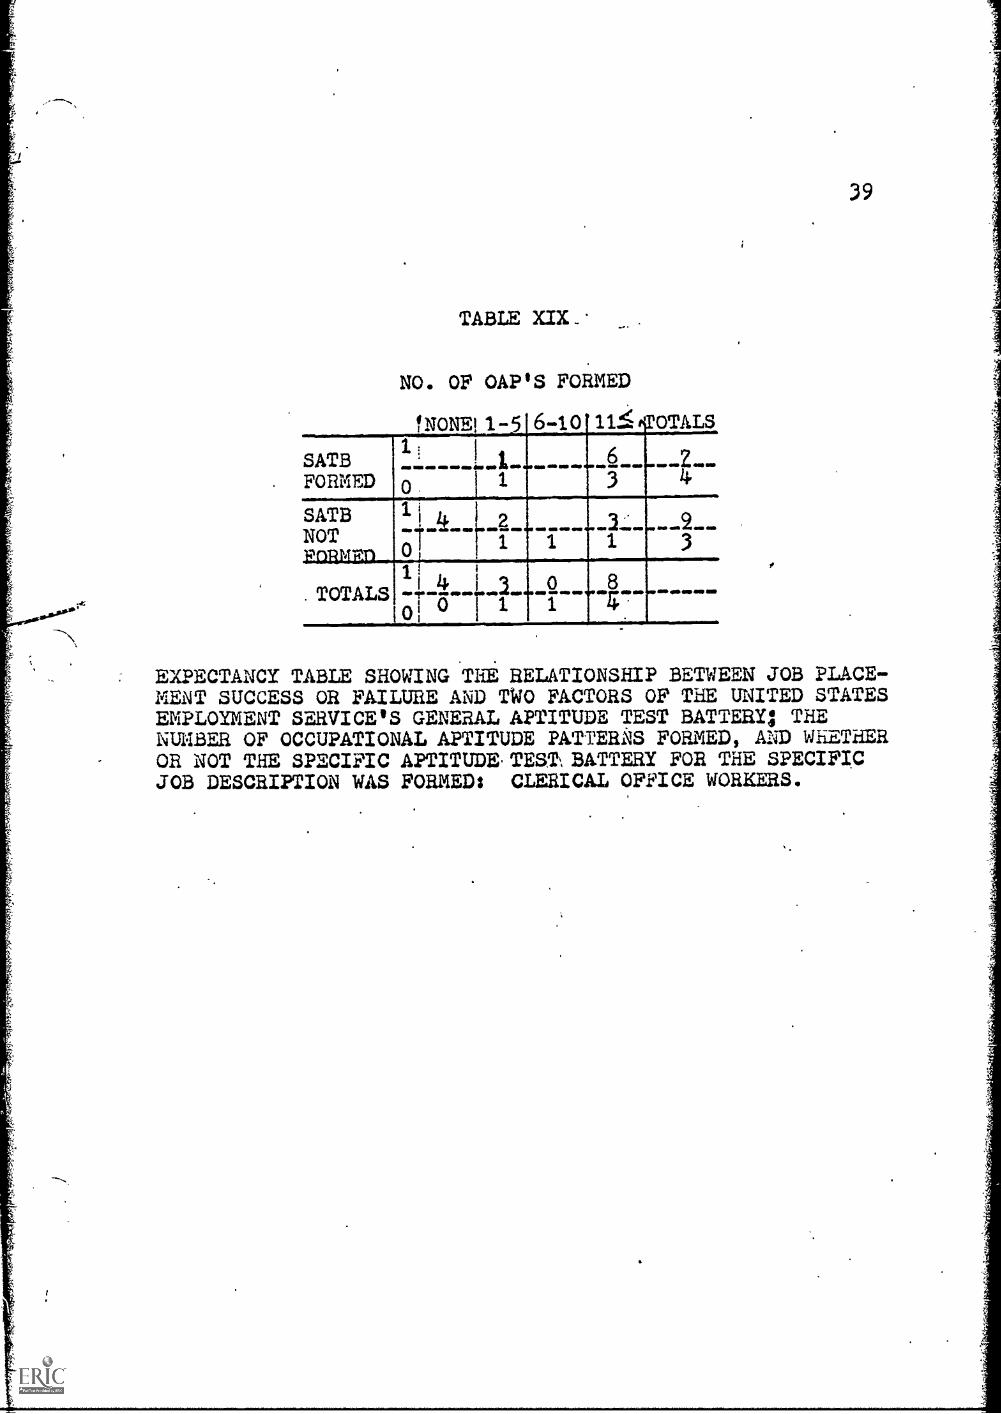
In the Clerical worker grolip, we find an ingesting
paradox. More than half the placement failures made the SATB,
while more than half the placement successes failed to make
any of the SATB's descriptive of the work they were doing.
Of those workers who made the SATB descriptive of theit work,
six of the seven made eleven or more OAP's. Of those successes
who failed to make any clerical SATB, two thirds made five or,
less OAP's.
wAIS
PE
F0
ANC
TABLE II
WAIS VERBAL IQ60 be 70-79 160-85
J90 -991 10o -109
,..
110-1,201 TOT
110-1204
0
0
100-1091
0 1 1
90-991
0 1
1 6
1
L 72
80-891
0! 1
2
1
70-791 1
0,
3
3
2 br-
3
60-69t
0
1 1
r r f2.
TOTALS- -----0
- - - - -- -- - --
1
-------1
4. --- .:, ---
0 0
.
22
LS
EXPECTANCY TABLE SHOWING THE RELATIONSHIP BETWEEN JOB PLACE-MENT'SUCCESS OR FAILURE AND THE WAIS VERBAL AND PERFORMANCEIQ' S: POWER SEWING MACHINE OPERATORS.
Note: Placement success at any given IQ level is representedby the numeral One (1) in the column at the left. Failureto remain on a job or inability to obtain a job is shown asa Zero (0) in the same column. For instance: Tliix personsscored between 90-99 on the performance portion of the WAISwho also scored between 80-89 on the verbal portion of thesame test. Of these six, five were successful placements,and one was a failure. Subsequent tables are read in thesame manner.
AI
S
PER
0
AlY
C
23
TABLE III
WAIS VERBAL IQ
1
50-69170-791 d0-89;90-991100-109
L
i
110 -1201 TOTALS
1 i 1
0110-120
100-1091
0
L 1 L 1 1.1
I-
I
30
90-991
0L 1 2
1
...
2.
,
f.0
80-890
7
1
_(
I
r10
1
70-7 92
F
, 2
0
60.69 r0
0
TOTALS.0
0
0
1
0
I 12
1 1
6
0
1 F 1
r 0 r,L
EXPECTANCY TABLE SHOWING THE RELATIONSHIP BETWEEN JOB PLACE-MENT SUCCESS OR FAILURE AND THE WAIS VERBAL AND PERFORMANCEIVS:NURSE'S AIDES,
AIS
PEHF0H
ANCE
IQ.
214.
TABLE IV
WAIS VERBAL IQ
60 -69 70-7900-82:2o-99
,r
,,
loo-log ilo-1201,11pTALs
110-120 ..,, , 2
1 2
100-1091
0
L 2 1 I
141
90.99.1..---------------- L....2 - ..
2--- j.1____-------14,..?...-..
2 4
80-890
1 2
.
4. i a0
70.791.1. - .------------------0
.. ----- .......... - .p---6
6o-691
0 0
TOTALS......w.....1
.... -.3......2.-0 ° 0 3
...2... ...1.-i--- ..:--3 0
EXPECTANCY TABLE SHOWING THE RELATIONSHIP BETWEEN JOB PLACE"MENT'SUCCESS OR FAILURE AND THE WAIS VERBAL AND PERFORMANCEIQ1S; CLERICAL OFFICE WORKERS.
wAIS
FULL
SC
ALE
25
TABLE V
REVISED BETA IQ
60-62 70-10 80- 100-109110-120ITOTALS
0
0110-120
1
01
100-109 - ----------------- ------- 0---- --
0 1 0
90-991- ----- 2 ------- 2------
0 1 1 2
180-89 2 5 4 1' 12
0 1 1 2
70-791
0 1.
5 L 12
63
1
60-69 r 6 2
00
1TOTALS ----0 - ---g--- ..-Za.----§-- r--- .. ...,
1----1--4".".
0
EXPECTANCY TABLE SHOWING THE RELATIONSHIP BETWEEN JOB PLACE-MENT SUCCESS OR FAILURE AND TH1 WAIS FULL SCALE IQ' AND THE.:.REVISED BETA Ilais-1)0WER SEWING MACHINE OPERATORS.
AIS
FULL
SCALE
IQ
26
TABLE VI
'REVISED BETA IQ
60-69 70-79 80- 89'90-99 100-109 110-120ITOTAL8
1110-120
1
0
.
I 1
r 0
100-1091
0
.
1 , 11 0
90-991
o.
1 L 2 4 1 L 8
0
80-89 i-11 4
.
,
11
1
70-790
.
0
0
60-61
90
0
0
1
TOTALS---.1r0
2-----o
1------o
6----1
-7------5- --0 o
--2 -
o- -- -------
EXPECTANCY TABLE SHOWING THE RELATIONSHIP BETWEEN JOB PLACE-MENTSUCCESS OR FAILURE AND THE WAIS FULL SCALE IQ AND THEREVISED BETA IQ: NURSE AIDES.
AIS
FULL
SC
ALE
27
TABLE VII
REVISED BETA IQ
!60-69 70 7180-89190 *9 100 106 110-120 t TOTALS1
110-1200
...I _____ -- - -- _________ 1___---=- -i----....1 1
100-1091!0
......L.............1...... .....5.......__1 i
_____L......2
1
90-990
1 t 5 1
80-891 -
,..
L 21
1
,
21
1
70-79 _______o
L_____L......... ... ____... 0...... -
60-691
0
L..
0 .L. 3-.-1 0 ..I__ 11 .....2 .
00
.. ...TOTALS 1_..........
EXPECTANCY TABLE SHOWING THE RELATIONSHIP BETWEEN JOB PLACE-MENT SUCCESS OR FAILURE AND THE WAIS FULL SCALE IQ AND THEREVISED BETA IQ; CLERICAL OFFICE WORKERS.
FP
N EE R
CD EE NX TT IE LR EI ST
TABLE VIII
GROSS DEXTERITYPERCENTILES
0 b -99' TOTALS
7.099 ........1.2.4...3.4..a..L0 ,
--8 - - -.0
51-751-___..4........1.....1.1.2.4.3....o i 1. 2
26-501,-
0.- -1 - -L-1-_-- 1--- 1-- t,,.- - - --
1.25 '....?....r...1............L....._k...2....1
1TOTALS...2.....
0 18. .5
.....5.....L.r 3 o
........
28
EXPECTANCY TABLE SHOWING THE RELATIONSHIP BETWEEN JOB PLACE-MENT SUCCESS OR FAILURE AND THE GROSS AND FINE DEXTERITYSUBTESTS OF THE; PURDUE PEGBOARD TEST: POWER SEWING MACHINEOPERATORS.
FI PN EE R
CD EE NX TT IE LR EI S
Y
TABLE IX
GROSS DEXTERITYPERCENTILES
1-2 26 -50 1 -7 6 -99' TOTALS
76 -99 ----- 4- - - - -- ----- 2.............._60
51.75 .1..1_3------t 1
3-----1...12---1
26 5$
... -------2 . ----- 1..........3__.o1JJ 1
o
2 2
0
TOTALSI
121
2
0
4 I.
0
29
. EXPECTANCY TABLE SHOWING THE RELATIONSHIP BETWEEN JOB PLACEMENT SUCCESS OR FAILURE AND THE GROSS AND FINE DEXTERITYSUBTESTS OF THE PURDUE PEGBOARD'TEST: NURSE AIDES.
FI PN EE R
CD EE NX TT IE LR EI STY
TABLE X
GROSS DEXTERITYPEaCENTILES
1 2- 26- 0 i 6'-99 TOTALS
76 -991--
o
------.1-
._ _A__ .2._ ....4..
51_75 .....2
11
---- - .. ...
26.501_,_.!-...,..2.....
,
2
,,
..1..... ----- .......L.2
1.25 .
11
------ ..... _____ ---- 0
TOTALS1---- J.. ..J---- 3- -- ----- .
30
EXPECTANCY TABLE SHOWING THE REALTIONSHIP BETWEEN JOB PLACE-EENT SUCCESS OR FAILURE AND THE GROSS AND .FINE DEXTERITYSUBTESTS OF THE PURDUE PEGBOARD TEST: CLERICAL OFFICE WORKERS.
AHITH
E
IC
TABLE XI
READING
GRADE LEVEL4 0-5 9 6 0 0-7 9/5 0-8 919:-"ITOTALS
----se -----t .
.--0G
9.0 ------ -------
0
-----
LR111
8.0-8.91r-------_-----------r--..1 ----- -----I--- --D 0
1
7.0.7.94---------------------------- ----------g--L 0E
16. ................4...1.1..2 1 1
2V6.0-
E 0L4.0...5 9a-------ri 8 3----- 1------ -------- 12
0
T0TAIB.1 10 6 1 3 1------- 0----,.------
0 ,
'31
EXPECTANCY TABLE SHOWING THE RELATIONSHIP BETWEEN JOB PLACEMENT SUCCESS OR FAILURE AND THE READING AND ARITHMETICTESTS OF THE CALIFORNIA SURVEYS OF ACHIEVEMENT; JUNIOR HIGHLEVEL, FORM 1: POWER SEWING MACHINE OPERATORS.

GA RR AI DT EHX LE ET VI EC L
TABLE XII
READING
GRADE LEVEL
4.0- 6 0 6 .0- 8 0 8 0:5-filoTALS
9.0 1
---------------------------0
....... .....--0 ---0
8.0-8.91
0 r I-r 0
0
7.0-7.91
01
2 r. 1t
2' 0
6.0-6.91..,.......1-------0
4---. --2----- ...2..... _2...-11---.6
4.0-5.91
o3 2 1 1
121
1TOTALS - --.4.......
ior 0P........1.1-... 3 L 21 3 --"C"'" 75"
L
32 1
EXPECTANCY TABLE SHOWING THE RELATIONSHIP BETWEEN JOB PLACE-MENT SUCCESS OR FAILURE AND THE READING AND ARITHMETICTESTS OF THE CALIFORNIA SURVEYS OF ACHIEVEMENT; JUNIOR HIGHLEVEL,- FORM I: NURSE AIDES
GA RR AI DT E
14 LE ET VI EC L
33
TABLE XIII
READING
GRADE LEVEL
4.0- 9(6 0 b.° .0 -7.9 b 0.41. 9.0Z:-.TOTALS
9.0<1
1.
oi..
1 , 21
31
8,0.8.9 ----------------o
.....1___ .... - _ ---
1.....a.____3_.
1
7.o-7.91
o r a 2a a
1
63
6,0.6.9 _
o
.. ----------I. _ 1..___,........21.7/2
4.05.91
0
00
TOTALS1
o0°
1lie 0
6, 31 4
r. 51 .
EXPECTANCY TABLE SHOWING THE RELATIONSHIP BETWEEN JOB PLACE:-DIENT SUCCESS OR FAILURE AND THE READING AND ARITHMETICTESTS OF THE CALIFORNIA SURVEYS OF ACHIEVEMENT, JUNIOR HIGHLEVEL, FORM I: CLERICAL OFFICE WORKERS
G
S RP AEL ELI LN EG V
EL
34.
TABLE XIV
ENGLISH
GRADE LEVEL
4 3 5.426
1
0-6.2 7.0-7.9
___,1_____2
8.0-8.9
_1___
9.0.5
3
TOTALS
3" 1
01-
1'
8.0-8.9 .....-2..-- 1--------1- -- _____.-.--------_4--01 0
7.0-7.91_,---1.--.........14..5- . ......4..
1 1
6.0-6.9. -----1---.- - ------1
I........ - ........--1.-1
4.0.5.9 .......6........... .....1......__.o 1 1
1 ..,,
TOTALS_---lw ._-_1- . - _4..........-1.-__5.----_-...4 0 2 1 0
EXPECTANCY TABLE SHOWING THE RELATIONSHIP BETWEEN JOB PTACF-MENT.SUCCESS OR FAILURE AND THE "ENGLISH AND .SPELLING:TESTS.OF TEE CALIFORNIA SURVEYS. OF ACHIEVEMENT, JUNIOR HIGH LEVEL,FORM I: POWER SEWING MACHINE OPERATORS
G
S RP AE DL ELI LN EG
EL
TABLE XV
ENGLISH
GRADE LEVEL
1-4,....6....5.......3.
7.0 t213.2:.8.9
.....a_.....
.05.-61
a. ...la.0
,
9.0 <1.
.......o
8.0-8.91
1o
7.0-7.91.....6,...........1...................1.....1............-L.... 1.1.
0
6.0.6.9 .....1.....t.
0 1...... _. ............ .............L[ ...... i
......a.
1
4.0-5.91-.---6.--1.0
... ... . ......E...1........ .....a.
1TOTALS. 4.......6.............2.---.......3..........-A---...a.
I 0 I 1 0 0 0 0..... ...
35
EXPECTANCY TABLE SHOWING THE RELATIONSHIP BETWEEN JOB PLACEMENTSUCCESS OR FAILURE AND THE ENGLISH AND SPELLING TESTS OF THECALIFORNIA SURVEYS OF ACHIEVEMENT, JUNIOR HIGH LEVEL, FORM I:NURSE AIDES.

GS RP AE DL ELI LN. EG V
EL
36
TABLE XVI
ENGLISH
GRADE LEVEL
4 0- 6 0-6 0-7 918 2:201,L222L2PILL2
.....3
2___6
9.00
. ......ks.1........1........Z........5
8.0.8.91.:...
0
......7.1------------t....1.. ...1.....,_i_.
7.0.7.91...
0
------1....------------ 1 1...----
6.0-6.91
..0
.
-- .. ---r..1 - .., ------1...,.......4......L.g....
4.0.5.9 . -r 00
TOTALS,
-g---h-....g...."---g---3
L...3...1 0
-2--,......4
EXPECTANCY TABLE SHOWING THE RELATIONSHIP BETWEEN JOB PLACE-MENT SUCCESS OR FAILURE AND THE ENGLISH AND SPELLING TESTS OFTHE CALIFORNIA SURVEYS OF ACHIEVEMENT, JUNIOR HIGH LEVEL,FORM I: CLERICAL OFFICE WORKERS.
37
TABLE XVII
NO. OF OAP'S FORMED
NONE 1 -5) 6-10 11.I'TOTALS
SATB 11 L 3 4 L 4 11FORMED 01 i 2 1 i 3
SATB 118 1 1NOT - - --- 10
TOTALS ili..g....r..4.1.4.1t1--101 '
EXPECTANCY TABLE SHOWING THE RELATIONSHIP BETWEEN JOB PLACE-MENT SUCCESS OR FAILUE..AND TWO.'1FACTORS OF THE UNITED STATESEMPLOYMENT SERVICE'S GENERAL APTITUDE TEST BATTERY: THENUMBER OF OCCUPATIONAL APTITUDE PATTERNS FORMED, ANDWHETHEROR NOT THE SPECZIC APTITUDE TEST BATTERY FOR THE SPECIFICJOB DESCRIPTION WAS FORMED: POWER SEWING MACHINE OPERATORS.
38
TABLE XVII/
NO. OF 0Al'IS FORMED
r
1
0
INUNE11-,,b-1U
........, 4.....
11
1
TOTAL5
..1...SATB
SATBNOTFORMED
1.
0
.6I..
..i....i 16. ..
TOTALS I- 4 g II. 10. '
EXPECTANCY TABLE SHOVING THE RELATIONSHIP BETWEEN JOB PLiCE-MENT SUCCESS OR FAILURE AND TWO FACTORS OF THE UNITED STATESEMPLOYMENT SERVICE'S GENERAL APTITUDE TEST BATTERY: THENUMBER OF OCCUPATIONAL APTITUDE PATTERNS FORMED, AVID WrIETHEROR NOT THE SPECIFIC APTITUDE TEST BATTERY FOR THE SPECIFICJOB DESCRIPTION WAS FORMED: NURSE AIDES.
39
TABLE XIX
NO. OF OAP'S FORMED
fNONE, 1-5 6-10 11-. OTALS
SATBFORMED 1 3
SATBNOT
11 4.
;1". "sr
.21 1
L._1
.2.3
. TOTALS1.
-k
4- 'Y 3 .Q.. 8 .....777f01 0 i 1
EXPECTANCY TABLE SHOWING THE RELATIONSHIP BETWEEN JOB PLACE-MENT SUCCESS OR FAILURE AND TWO FACTORS OF THE UNITED STATESEMPLOYMENT SERVICE'S GENERAL APTITUDE TEST BATTERY: THENUMBER OF OCCUPATIONAL APTITUDE PATTERNS FORMED, AND WHETHEROR NOT THE SPECIFIC APTITUDE. TEST, BATTERY FOR THE SPECIFICJOB DESCRIPTION WAS FORMED: CLERICAL OFFICE WORKERS.
CHAPTER IV
SUMMARY AND CONCLUSIONS
In this chapter we shr411 present a brief summary of
the study, and the raison d'etre for the study. Following
this summary we will present our conclusions and evaluation
of both the study and the content of the study.
I. SUMMARY
Like many other agencies involved in anti-poverty
activities, the. Jewish Employment and Vocational Service
developed a training program for the disadvantaged clients
who lacked the necessary skills,to obtain a job. In order
that these clients receive prevocational counseling and proper
training referral, a teating program was implemented. All
clients coming to the training center received a battery of
aptitude, achievement, and intelligence tests. At no time
in the program did J.E.V.S. attempt to correlate certain test
scores with probable training or vocational success, but
instead relied on the clinical judgement of the Client's
counselor. This study represents the first attempt to bring
together data with which to examine this relationship.
Three major training areas were examined. These areas./
.were: power sewing, nurse aide, and clerical office work.
Six tests' were tested for their ability to predict success:
the WAIS; Revised Beta; Purdue Pegbdard; California Surveys
of Reading, Arithmetic, English; and Spelling; :Was GATBr.and
f
41
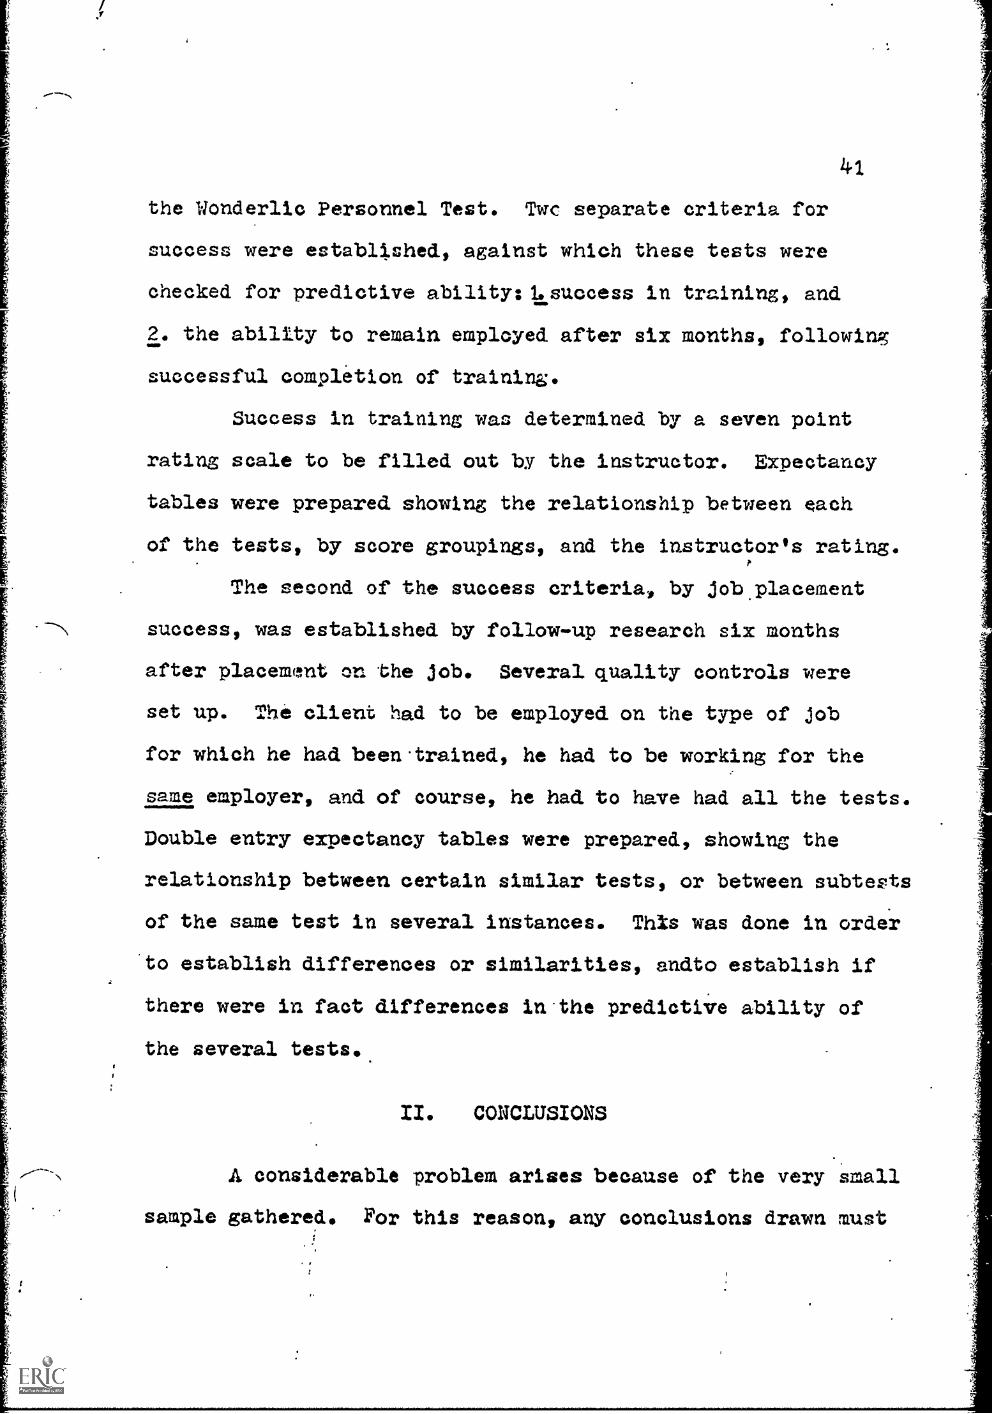
the Wonderlic Personnel Test. Twc separate criteria for
success were established, against which these tests were
checked for predictive ability: 1. success in training, and
2. the ability to remain employed after six months, following
successful completion of training.
Success in training was determined by a seven point
rating scale to be filled out by the instructor. Expectancy
tables were prepared showing the relationship between each
of the tests, by score groupings, and the instructor's rating.
The second of the success criteria, by job placement
success, was established by follow -up research six months
after placement on the job. Several quality controls were
set up. The client had to be employed on the type of job
for which he had been trained, he had to be working for the
same employer, and of course, he had to have had all the tests.
Double entry expectancy tables were prepared, showing, the
relationship between certain similar tests, or between subteots
of the same test in several instances. This was done in order
to establish differences or similarities, andto establish if
there were in fact differences inthe predictive ability of
the several tests.
II. CONCLUSIONS
A considerable problem arises because of the very small
sample gathered. For this reason, any conclusions drawn must
2
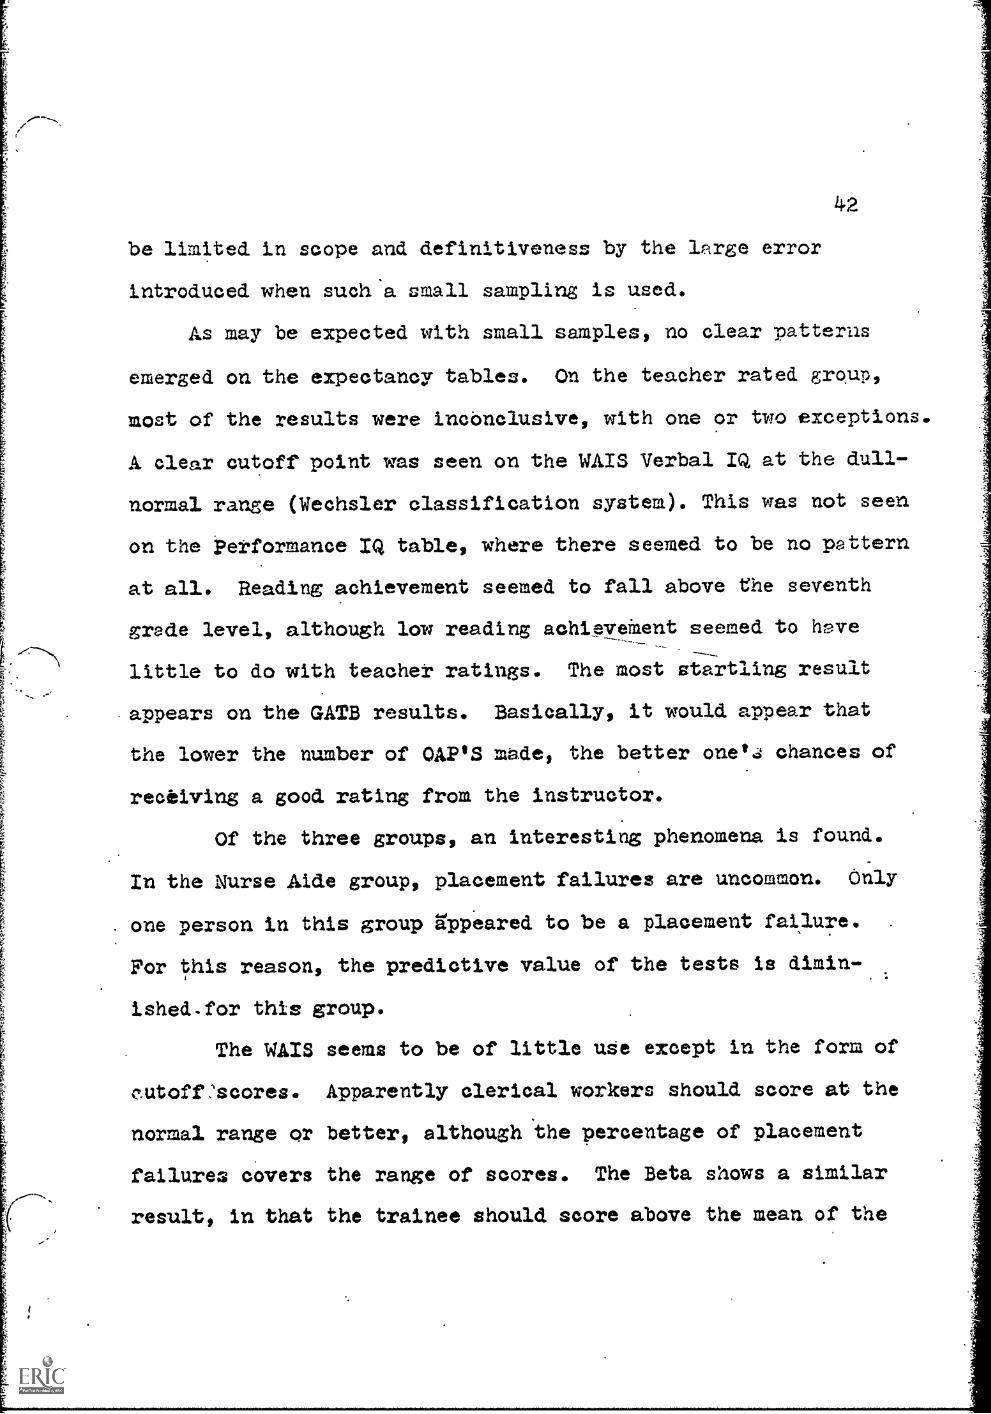
be limited in scope and definitiveness by the large error
Introduced when such'a small sampling is used.
As may be expected with small samples, no clear patterns
emerged on the expectancy tables. On the teacher rated group,
most of the results were inconclusive, with one or two exceptions.
A clear cutoff point was seen on the WAIS Verbal IQ at the dull-
normal range (Wechsler classification system). This was not seen
on the *Performance IQ table, where there seemed to be no pattern
at all. Reading achievement seemed to fall above the seventh
grade level, although low reading achi_eveMent seemed to have
little to do with teacher ratings. The most startling result
appears on the GATB results. Basically, it would appear that
the lower the number of OAP'S made, the better one'J chances of
receiving a good rating from the instructor.
Of the three groups, an interesting phenomena is found.
In the Nurse Aide group, placement failures are uncommon. Only
one person in this group gppeared to be a placement failure.
For this reason, the predictive value of the tests is dimin-
ished.for this group.
The WAIS seems to be of little use except in the form of
eutoffsiscores. Apparently clerical workers should score at the
normal range or better, although the percentage of placement
failures covers the range of scores. The Beta shows a similar
result, in that the trainee should score above the mean of the
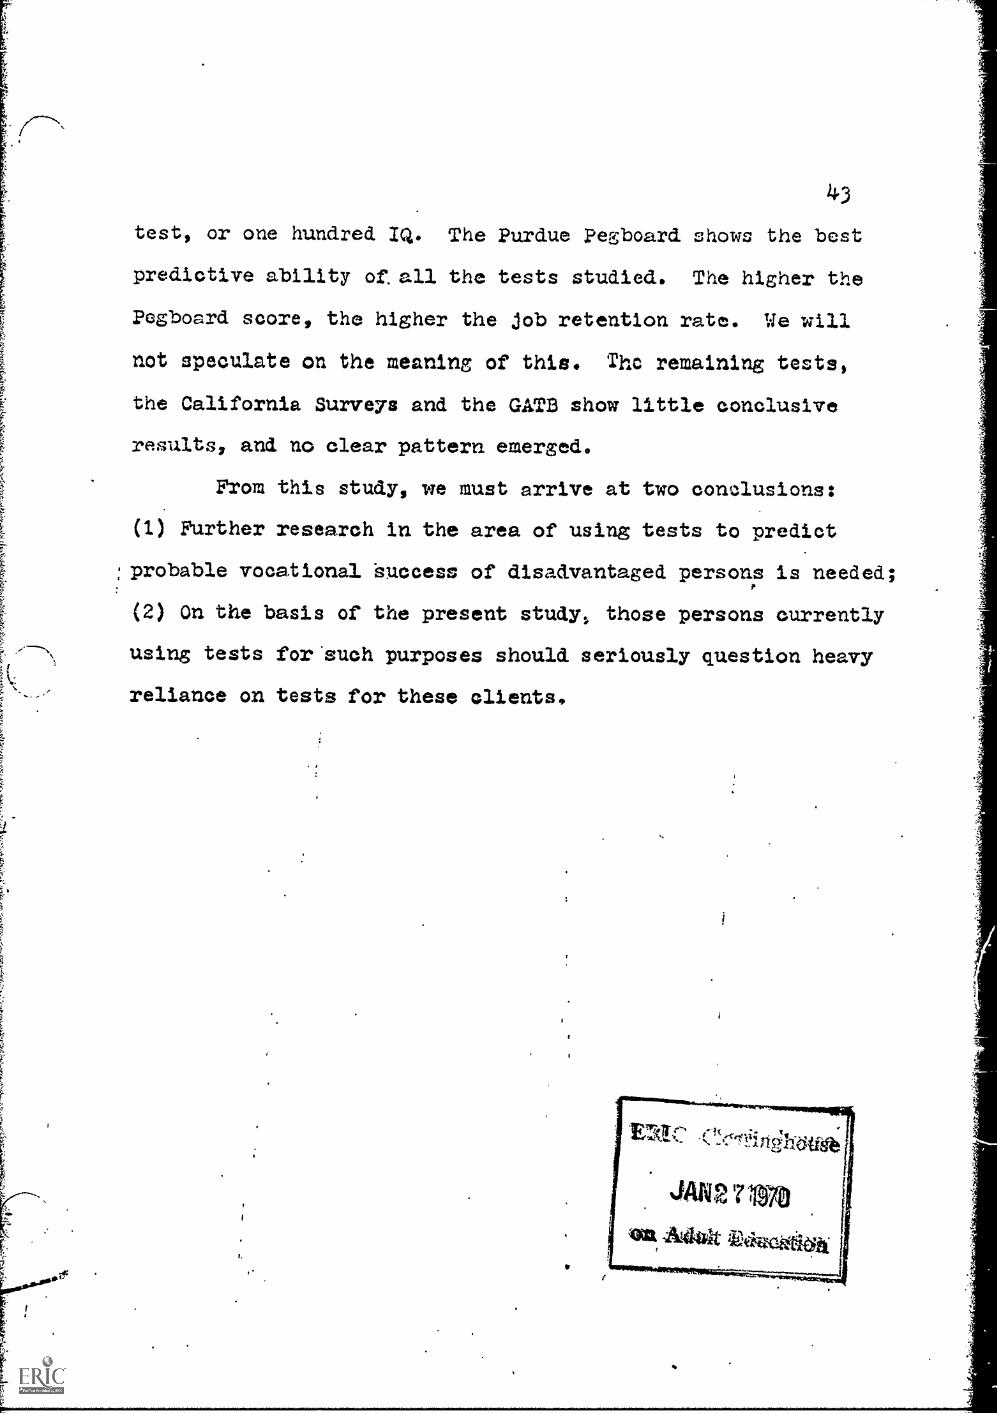
43
test, or one hundred IQ. The Purdue Pegboard shows the best
predictive ability of:all the tests studied. The higher the
Pegboard score, the higher the job retention rate. We will
not speculate on the meaning of this. The remaining tests,
the California Surveys and the GATB show little conclusive
results, and no clear pattern emerged,
From this study, we must arrive at two conclusions:
(1) Further research in the area of using tests to predict
probable vocational 'success of disadvantaged persons is needed;
(2) On the basis of the present study, those persons currently
using tests far.such purposes should seriously question heavy
reliance on tests for these clients,
BIBLIOGRAPHY
Kellogg, C. E., and N. W. Morton, Manual for the Revised.Beta Examination. The Psycho-7;57El Corporation,New Y67177775371962.
Tieg,s; Ernest WI, arld Clark! ilanual CaliforniaSurveys of AchieVemett Junto. H gh evmem-marg"ornia Test Bureau, McGr6711171,T-939.
United States Department. of Labor, Guide to the Use of theGeneral Aptitude Test Battery, Section II: Norms.Washington: Government Printing: Office, 1962.
United States Department of Labor; Guide to the Use of theGeneral kotitude Test Battery, Section. III:Development.Washington: Government Printing Officg, 1962
Wechsler, David, The Measurement and Appraisal of AdultInt.Aligence. Fourth Edition, Baltimore: The WilliamsiTETTELTERgcompany, 1958.
Wechsler, David, WAIS Manual. New York: The PsychologicalCorporation,7935.
Wesman, A. G., Expectancy Tables--A Way of Inter retiTest Validity. Test service Bulletin No. 3 , NewTOR: The Psychological Corporation, December 1949.
ERIC OP 1"inghouse
JAN30 SO
on Attila tdacation