Embed Size (px)
Citation preview
MARINE ECOLOGY PROGRESS SERIESMar Ecol Prog Ser
Vol. 458: 21–38, 2012doi: 10.3354/meps09719
Published July 3
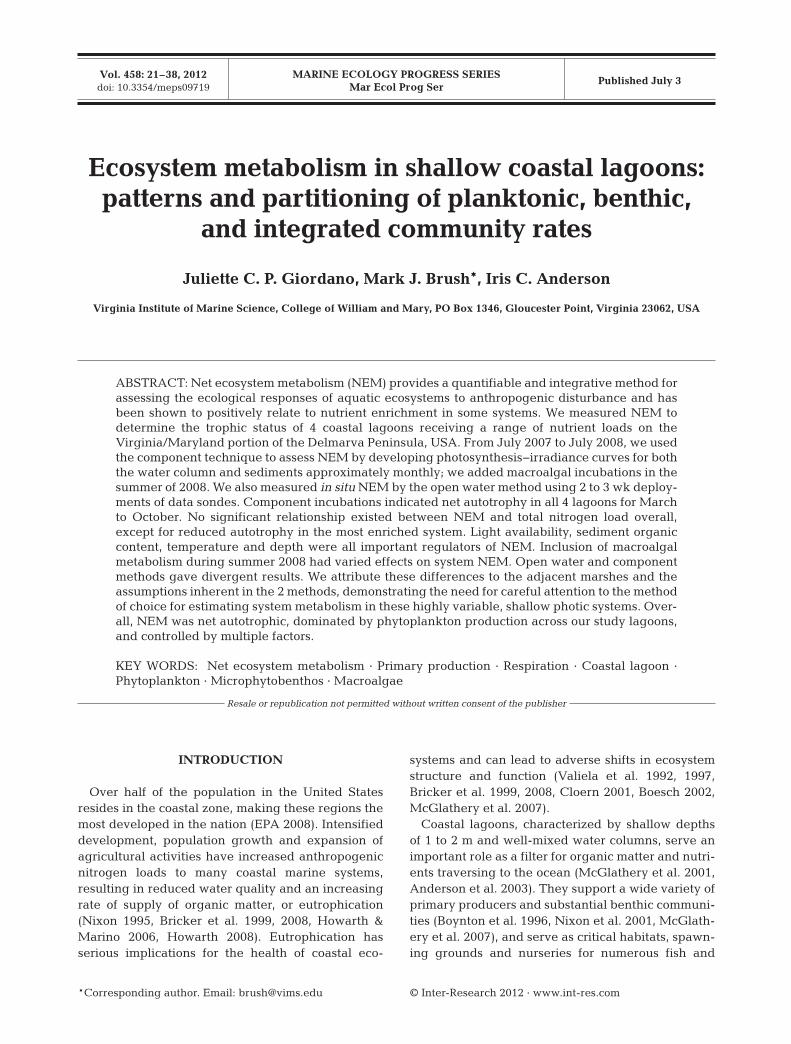
INTRODUCTION
Over half of the population in the United Statesresides in the coastal zone, making these regions themost developed in the nation (EPA 2008). Intensifieddevelopment, population growth and expansion ofagricultural activities have increased anthropogenicnitrogen loads to many coastal marine systems,resulting in reduced water quality and an increasingrate of supply of organic matter, or eutrophication(Nixon 1995, Bricker et al. 1999, 2008, Howarth &Marino 2006, Howarth 2008). Eutrophication hasserious implications for the health of coastal eco -
systems and can lead to adverse shifts in ecosystemstructure and function (Valiela et al. 1992, 1997,Bricker et al. 1999, 2008, Cloern 2001, Boesch 2002,McGlathery et al. 2007).
Coastal lagoons, characterized by shallow depthsof 1 to 2 m and well-mixed water columns, serve animportant role as a filter for organic matter and nutri-ents traversing to the ocean (McGlathery et al. 2001,Anderson et al. 2003). They support a wide variety ofprimary producers and substantial benthic communi-ties (Boynton et al. 1996, Nixon et al. 2001, McGlath-ery et al. 2007), and serve as critical habitats, spawn-ing grounds and nurseries for numerous fish and
© Inter-Research 2012 · www.int-res.com*Corresponding author. Email: [email protected]
Ecosystem metabolism in shallow coastal lagoons:patterns and partitioning of planktonic, benthic,
and integrated community rates
Juliette C. P. Giordano, Mark J. Brush*, Iris C. Anderson
Virginia Institute of Marine Science, College of William and Mary, PO Box 1346, Gloucester Point, Virginia 23062, USA
ABSTRACT: Net ecosystem metabolism (NEM) provides a quantifiable and integrative method forassessing the ecological responses of aquatic ecosystems to anthropogenic disturbance and hasbeen shown to positively relate to nutrient enrichment in some systems. We measured NEM todetermine the trophic status of 4 coastal lagoons receiving a range of nutrient loads on the Virginia/ Maryland portion of the Delmarva Peninsula, USA. From July 2007 to July 2008, we usedthe component technique to assess NEM by developing photosynthesis−irradiance curves for boththe water column and sediments approximately monthly; we added macroalgal incubations in thesummer of 2008. We also measured in situ NEM by the open water method using 2 to 3 wk deploy-ments of data sondes. Component incubations indicated net autotrophy in all 4 lagoons for Marchto October. No significant relationship existed between NEM and total nitrogen load overall,except for reduced autotrophy in the most enriched system. Light availability, sediment organiccontent, temperature and depth were all important regulators of NEM. Inclusion of macroalgalmetabolism during summer 2008 had varied effects on system NEM. Open water and componentmethods gave divergent results. We attribute these differences to the adjacent marshes and theassumptions inherent in the 2 methods, demonstrating the need for careful attention to the methodof choice for estimating system metabolism in these highly variable, shallow photic systems. Over-all, NEM was net autotrophic, dominated by phytoplankton production across our study lagoons,and controlled by multiple factors.
KEY WORDS: Net ecosystem metabolism · Primary production · Respiration · Coastal lagoon ·Phytoplankton · Microphytobenthos · Macroalgae
Resale or republication not permitted without written consent of the publisher
Mar Ecol Prog Ser 458: 21–38, 201222
shellfish species (Beck et al. 2001, 2003, Able 2005,EPA 2008). The close proximity of shallow marinesystems to land, their small volumes and relativelylong residence times, and the penetration of light tothe benthos make these systems particularly suscep-tible to nutrient enrichment (Duarte 1995, Bricker etal. 1999, McGlathery et al. 2007). Microphytobenthos(MPB), however, may help mediate the response ofshallow systems to nutrient loading (Tobias et al.2003, Anderson et al. 2010).
Although nitrogen loads to coastal lagoons are of amagnitude similar to those of deeper estuaries, re -sponses in shallow lagoons appear to be quite differ-ent, likely because of enhanced benthic− pelagic cou-pling (Nixon et al. 2001, McGlathery et al. 2007). Anilluminated benthos results in a significant contribu-tion of MPB, seagrasses and macroalgae to total sys-tem production. Under extremely high nitrogenloads, however, bloom-forming macroalgae and, ulti-mately, phytoplankton can dominate, shading outMPB, seagrasses and slow-growing macroalgae(Borum & Sand-Jensen, 1996, Valiela et al. 1997).
Interactions between autotrophic communities arecomplex and predictive patterns between nutrientloading and a single component of the system often donot hold in shallow systems as they do in deeper estu-aries (Cloern 2001, Nixon et al. 2001, Howarth &Marino 2006). An understanding of how changes innutrient regime affect shallow systems requires broadecosystem-scale evaluations incorporating differentprocesses mediating trophic response (Cloern 2001).
Net ecosystem metabolism (NEM) is an easilyquantifiable and integrative measure for assessingthe trophic status of a system, and may also be use-ful for quantifying the response to stressors includ-ing nutrient enrichment (Kemp & Boynton 1980, D’Avanzo et al. 1996, Kemp et al. 1997). Defined asthe difference between gross primary production(GPP) and community respiration (R), NEM is anindicator of how a system processes nutrients andorganic material (Smith & Hollibaugh 1997). A sys-tem with positive NEM (in oxygen units) is netautotrophic, producing more organic matter than isconsumed through net assimilation of inorganicnutrients. Conversely, a system with negative NEM(in oxygen units) is net heterotrophic with a poten-tial net export of inorganic nutrients and a netimport or storage of organic matter (Eyre & McKee2002, Hopkinson & Smith 2004). NEM measure-ments inherently incorporate complex processesinfluencing primary production and respiration andare a useful tool for assessing the trophic status andresponse of shallow ecosystems.
NEM can be driven by organic matter loading(Smith & Hollibaugh 1997), inorganic nutrient load-ing (Oviatt et al. 1986, Eyre & McKee 2002, Caffrey2004) or the ratio of inorganic to organic nutrientloads (Kemp et al. 1997). Other factors in addition tonutrient loading have also been found to influenceNEM, such as light availability, temperature, depth,surrounding habitat, concentrations of water columndissolved organic carbon (DOC) and salinity (Caffrey2003, 2004, Rochelle-Newall et al. 2007, Russell &Montagna 2007, Murrell et al. 2009).
In the present study, we aimed to elucidate the pri-mary controls on NEM in coastal lagoons along theVirginia and Maryland portion of the DelmarvaPeninsula, USA. We used metabolic measurementsas an indicator of system trophic status in 4 temperatecoastal lagoons with a range of total nitrogen (TN)loads. We measured metabolic processes from July2007 to July 2008 using oxygen-based component(e.g. Kemp et al. 1997, Smith & Hollibaugh 1997) andopen-water (e.g. Odum & Hoskins 1958) methods.The ultimate goal of this project was to determine themain drivers of NEM in these lagoons, quantify therelative contribution of pelagic and benthic produc-ers, and compare component and open-water meth-ods for assessing NEM in these highly dynamic, shal-low systems.
MATERIALS AND METHODS
Site description
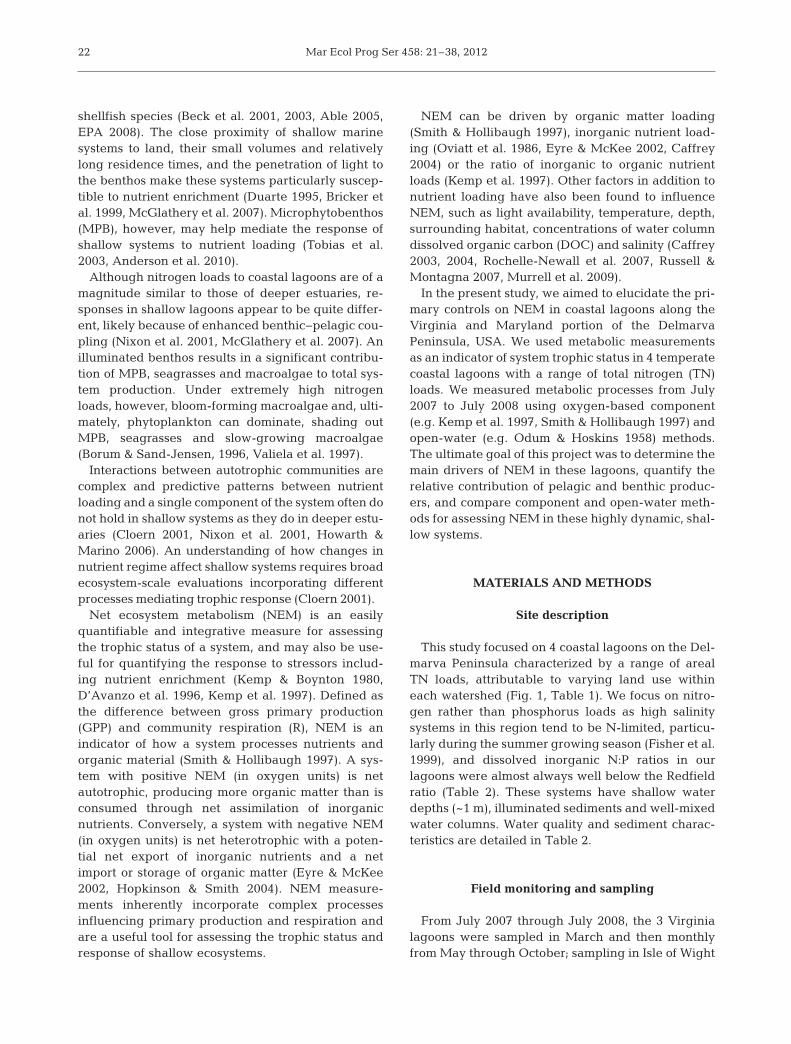
This study focused on 4 coastal lagoons on the Del-marva Peninsula characterized by a range of arealTN loads, attributable to varying land use withineach watershed (Fig. 1, Table 1). We focus on nitro-gen rather than phosphorus loads as high salinitysystems in this region tend to be N-limited, particu-larly during the summer growing season (Fisher et al.1999), and dissolved inorganic N:P ratios in ourlagoons were almost always well below the Redfieldratio (Table 2). These systems have shallow waterdepths (~1 m), illuminated sediments and well-mixedwater columns. Water quality and sediment charac-teristics are detailed in Table 2.
Field monitoring and sampling
From July 2007 through July 2008, the 3 Virginialagoons were sampled in March and then monthlyfrom May through October; sampling in Isle of Wight
Giordano et al.: Ecosystem metabolism in shallow coastal lagoons
Bay, MD, occurred monthly from July to September2007 and then bi-monthly from March to July 2008because of logistical constraints (Fig. 1). Within HogIsland, Isle of Wight and Burton’s Bays, samples weretaken at the mouth of the contributing creek, at mid-bay and near the inlet; only one mid-bay sampling
site was established in Gargathy Bay because of itssmall size. Temperature (°C), salinity and dissolvedoxygen (DO) were measured at each site using ahandheld datasonde. LiCor 2π surface and under -water quantum sensors were used to determine irra-diance at the surface, at the bottom and at 10 to 20 cmincrements through the water column depending ondepth. Irradiance data were used to determine verti-cal attenuation coefficients, kD, at each site.
At each sampling station, water column chloro-phyll a (chl a) was collected on Whatman GF/F filters,extracted using the method of Shoaf & Lium (1976),and analyzed fluorometrically before and after acidi-fication. Concentrations of dissolved inorganic nitro-gen and phosphorus and dissolved organic nitrogen(DIN, DIP and DON, respectively) were measuredafter filtration (0.45 µm Gelman Supor filters) on aLachat auto analyzer (Smith & Bogren 2001, Liao2001, Knepel & Bogren 2001) and by persulfatedigestion in sealed ampules (Knepel & Bogren 2001),respectively.
Sediment samples for benthic chl a were sectionedinto 0−3 and 3−10 mm fractions, extracted using themethod of Pinckney & Zingmark (1993),and analyzedspectrophotometrically before and after acidificationusing the equations of Lorenzen (1967). Sedimentsamples for percent organics and bulk density weretaken to a depth of 10 cm.
During the summer of 2008, macroalgae were col-lected for determination of biomass in Gargathy andBurton’s Bays to complement existing measurementsof mean monthly biomass in Hog Island and Isle ofWight Bays from May to September 2006 and 2007(Hardison et al. 2010). Macroalgae were randomlysampled in triplicate at each station using a 0.14 m2
ring and, upon return to the laboratory, were rinsed
23
Fig. 1. Study sites on the Delmarva Peninsula, USA. Sam-pling occurred at 3 sites along a creek-to-inlet transectwithin each bay, except for Gargathy Bay, which, because of
its small size, had a single mid-bay site
Lagoon Total nitrogen Watershed Marsh Lagoon Tidal Percent of watershed load area area surface area rangea Agriculture Natural Impervious
(g N m−2 yr−1) (m2) (m2) (m2) (m) vegetation
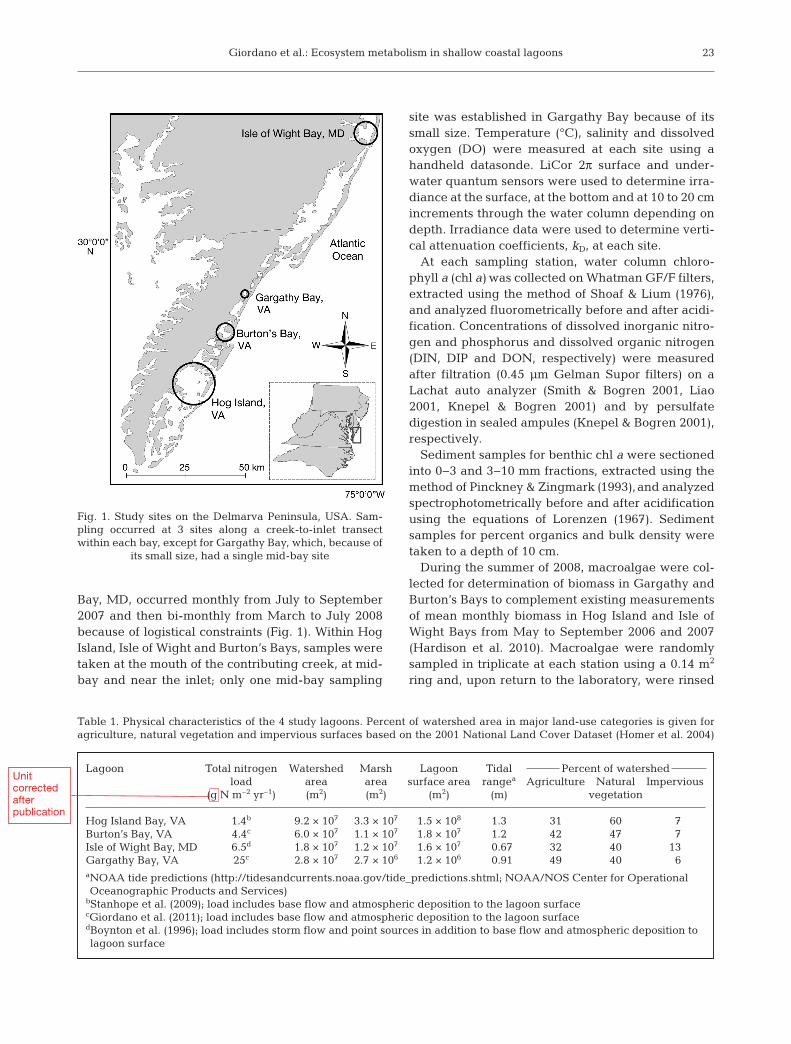
Hog Island Bay, VA 1.4b 9.2 × 10⁷ 3.3 × 10⁷ 1.5 × 10⁸ 1.3 31 60 7Burton’s Bay, VA 4.4c 6.0 × 10⁷ 1.1 × 10⁷ 1.8 × 10⁷ 1.2 42 47 7Isle of Wight Bay, MD 6.5d 1.8 × 10⁷ 1.2 × 10⁷ 1.6 × 10⁷ 0.67 32 40 13Gargathy Bay, VA 25c 2.8 × 10⁷ 2.7 × 10⁶ 1.2 × 10⁶ 0.91 49 40 6aNOAA tide predictions (http://tidesandcurrents.noaa.gov/tide_predictions.shtml; NOAA/NOS Center for OperationalOceanographic Products and Services)
bStanhope et al. (2009); load includes base flow and atmospheric deposition to the lagoon surfacecGiordano et al. (2011); load includes base flow and atmospheric deposition to the lagoon surfacedBoynton et al. (1996); load includes storm flow and point sources in addition to base flow and atmospheric deposition tolagoon surface
Table 1. Physical characteristics of the 4 study lagoons. Percent of watershed area in major land-use categories is given foragriculture, natural vegetation and impervious surfaces based on the 2001 National Land Cover Dataset (Homer et al. 2004)
Unitcorrectedafterpublication
Mar Ecol Prog Ser 458: 21–38, 201224
in distilled water, separated by genus (i.e. Gracilaria,Ulva and other) and weighed fresh. All biomass esti-mates included samples with zero biomass to accountfor the spatial patchiness of the macroalgae. Hardi-son’s measurements were reported in dry mass, andwe used an average wet:dry mass ratio (Brush 2002)to convert these measurements into wet mass forcomparison to our measurements.
System metabolic measurements
Component method
System metabolism was calculated based on DOfluxes measured during light−dark incubations ofambient water and sediments with overlying filteredwater. At each site, water samples were collected in2 l blackened Nalgene bottles and 15 cm sedimentcores (7 cm sediment depth; 3.1 cm i.d.) were col-lected and kept on ice until return to the laboratory.Cores were allowed to sit uncovered overnight in thedark in a circulating seawater bath at ambient tem-peratures. From May to July 2008, Gracilaria spp.and Ulva spp. were collected from each site (whenpresent) for determination of macroalgal metabolism.
All incubations were conducted in a flow-throughlight gradient box maintained at in situ temperatureswith photosynthetically active radiation (PAR) rang-ing from ~60 to ~2000 μE m−2 s−1. DO concentrationswere measured before and after incubations usingluminescent DO probes. On the day of collection,10 water samples per site were incubated in 60 mlbiological oxygen demand (BOD) bottles at 10 differ-ent light levels for approximately 1 h, and 3 bottlesper site were incubated in the dark for 24 h to obtaina measurable change in oxygen.
Sediment cores were incubated the day followingcollection with 10 cores at 10 different light levelsand 3 in the dark. Immediately before core incuba-tion, overlying water was siphoned out of each coreand replaced with filtered site water (0.45 µm), andcore tops were sealed with polyethylene (SaranWrap™), which has a low oxygen permeability of 5.8× 10⁻⁵ ml cm−2 h−1 (Pemberton et al. 1996). Coreswere incubated unstirred but incubations were keptshort (1 to 2 h) to minimize build-up of diffusion gra-dients. Before taking final DO measurements, theoverlying water was gently mixed to obtain a com-posite sample.
Macroalgae were acclimated in the light for~30 min to 1 h on the day of collection, after whichapproximately 100 to 150 mg (wet) of Ulva and Gra -cilaria were incubated separately in 60 ml BOD bot-tles with filtered seawater at 10 light levels and in thedark as for the water column incubations. All algalsamples were weighed post-incubation after rinsingwith distilled water to normalize rates to biomass.
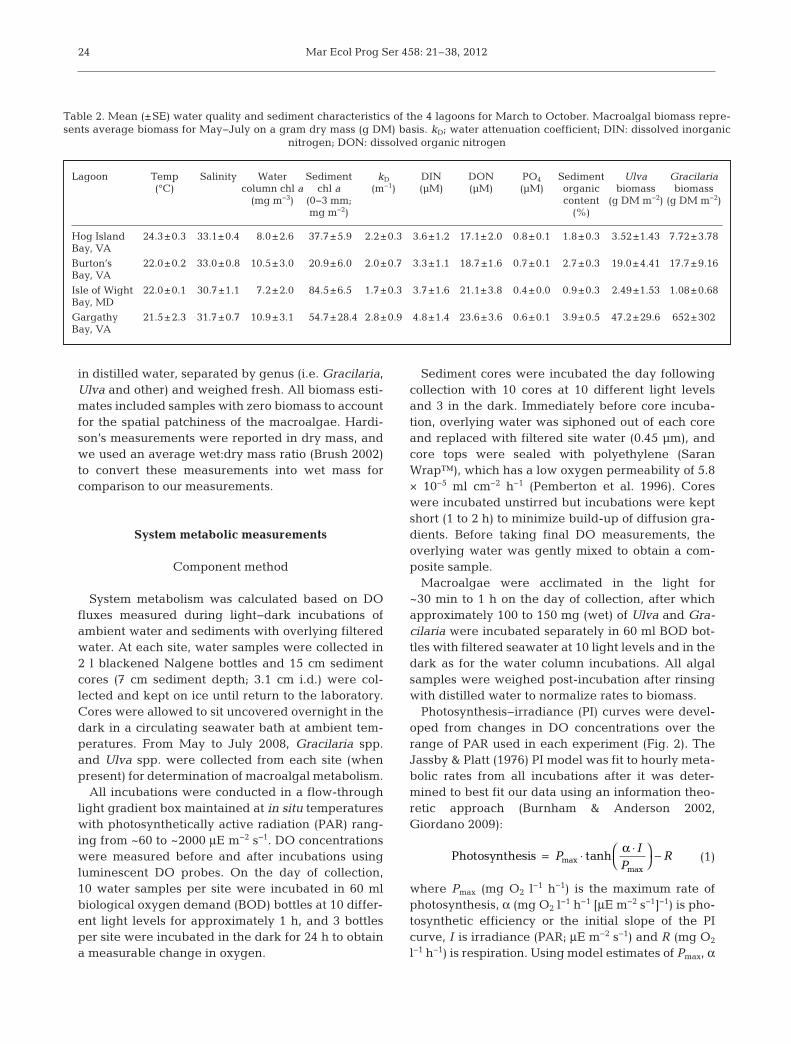
Photosynthesis−irradiance (PI) curves were devel-oped from changes in DO concentrations over therange of PAR used in each experiment (Fig. 2). TheJassby & Platt (1976) PI model was fit to hourly meta-bolic rates from all incubations after it was deter-mined to best fit our data using an information theo-retic approach (Burnham & Anderson 2002,Giordano 2009):
(1)
where Pmax (mg O2 l−1 h−1) is the maximum rate ofphotosynthesis, α (mg O2 l−1 h−1 [μE m−2 s−1]−1) is pho-tosynthetic efficiency or the initial slope of the PIcurve, I is irradiance (PAR; μE m−2 s−1) and R (mg O2
l−1 h−1) is respiration. Using model estimates of Pmax, α
Photosynthesis = ⋅ ⋅⎛⎝
⎞⎠ −P
IP
Rmaxmax
tanhα
Lagoon Temp Salinity Water Sediment kD DIN DON PO4 Sediment Ulva Gracilaria (°C) column chl a chl a (m−1) (µM) (µM) (µM) organic biomass biomass (mg m−3) (0−3 mm; content (g DM m−2) (g DM m−2) mg m−2) (%)
Hog Island 24.3±0.3 33.1±0.4 8.0±2.6 37.7±5.9 2.2±0.3 3.6±1.2 17.1±2.0 0.8±0.1 1.8±0.3 3.52±1.43 7.72±3.78Bay, VA
Burton’s 22.0±0.2 33.0±0.8 10.5±3.0 20.9±6.0 2.0±0.7 3.3±1.1 18.7±1.6 0.7±0.1 2.7±0.3 19.0±4.41 17.7±9.16Bay, VA
Isle of Wight 22.0±0.1 30.7±1.1 7.2±2.0 84.5±6.5 1.7±0.3 3.7±1.6 21.1±3.8 0.4±0.0 0.9±0.3 2.49±1.53 1.08±0.68Bay, MD
Gargathy 21.5±2.3 31.7±0.7 10.9±3.1 54.7±28.4 2.8±0.9 4.8±1.4 23.6±3.6 0.6±0.1 3.9±0.5 47.2±29.6 652±302Bay, VA
Table 2. Mean (±SE) water quality and sediment characteristics of the 4 lagoons for March to October. Macroalgal biomass repre-sents average biomass for May−July on a gram dry mass (g DM) basis. kD; water attenuation coefficient; DIN: dissolved inorganic
nitrogen; DON: dissolved organic nitrogen
Giordano et al.: Ecosystem metabolism in shallow coastal lagoons
and R (Table 3) and mean hourly PAR for each month(see below), daily rates of gross primary production(GPP), R, net community production (NCP) and NEMwere calculated for each sampling date. Water col-umn metabolism was depth integrated for a 1 mwater column (average depth of the lagoons) usingmeasured values of kD and assuming a constant res-piration rate for the 24 h period. Production and res-piration were computed in 10 cm depth intervalsusing incident PAR attenuated over depth. Sedimentmetabolism was similarly based on a water depth of1 m with constant 24 h R.
Calculations of macroalgal metabolism for summer2008 used estimated mat thicknesses from field bio-mass estimates and a relationship of mat thickness tobiomass for Gracilaria tikvahiae (Peckol & Rivers1996). Mean hourly irradiance values for each monthwere used to compute the average hourly PAR (I2)experienced within the mixed assemblage mat ofUlva and Gracilaria as:
(2)
where IM (µE m−2 s−1) is irradiance at the top of themat, kD (m−1) is attenuation by the water within themat, zmat is mat thickness, kt is attenuation per thallusof Ulva (Brush and Nixon 2003), nT is the number ofUlva thalli (Brush & Nixon 2003), kG is the attenua-tion of light through the Gracilaria mat calculated
IIk z k n kM
k z k n k B
D
= −( )⋅ + ⋅ +
− ⋅ + ⋅ + ⋅1 e D mat t T G G
mat t T
( )
( GG G⋅ B )
25
Fig. 2. Sample photosynthesis−irradiance curves for (A)water, (B) sediments and (C) macroalgae fit to the Jassby &Platt (1976) equation. NCP: net community production; WM:
wet mass
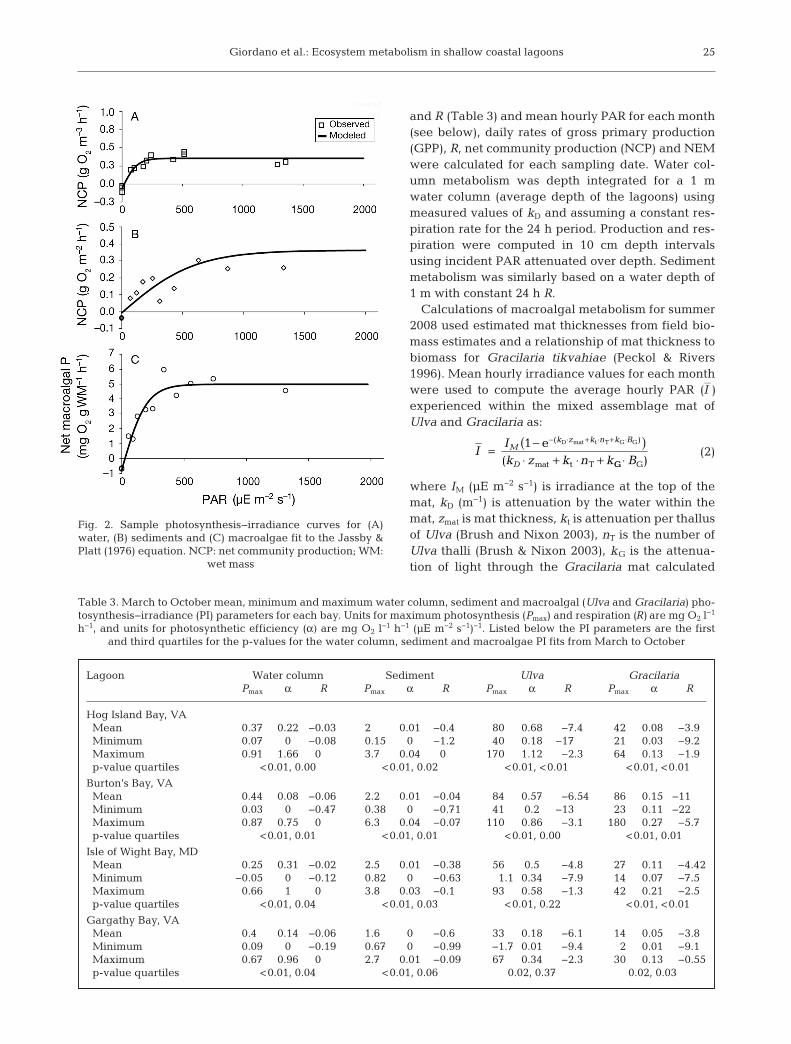
Lagoon Water column Sediment Ulva Gracilaria Pmax α R Pmax α R Pmax α R Pmax α R
Hog Island Bay, VAMean 0.37 0.22 −0.03 2 0.01 −0.4 80 0.68 −7.4 42 0.08 −3.9Minimum 0.07 0 −0.08 0.15 0 −1.2 40 0.18 −17 21 0.03 −9.2Maximum 0.91 1.66 0 3.7 0.04 0 170 1.12 −2.3 64 0.13 −1.9p-value quartiles <0.01, 0.00 <0.01, 0.02 <0.01, <0.01 <0.01, <0.01
Burton’s Bay, VAMean 0.44 0.08 −0.06 2.2 0.01 −0.04 84 0.57 −6.54 86 0.15 −11Minimum 0.03 0 −0.47 0.38 0 −0.71 41 0.2 −13 23 0.11 −22Maximum 0.87 0.75 0 6.3 0.04 −0.07 110 0.86 −3.1 180 0.27 −5.7p-value quartiles <0.01, 0.01 <0.01, 0.01 <0.01, 0.00 <0.01, 0.01
Isle of Wight Bay, MDMean 0.25 0.31 −0.02 2.5 0.01 −0.38 56 0.5 −4.8 27 0.11 −4.42Minimum −0.05– 0 −0.12 0.82 0 −0.63 1.1 0.34 −7.9 14 0.07 −7.5Maximum 0.66 1 0 3.8 0.03 −0.1 93 0.58 −1.3 42 0.21 −2.5p-value quartiles <0.01, 0.04 <0.01, 0.03 <0.01, 0.22 <0.01, <0.01
Gargathy Bay, VAMean 0.40 0.14 −0.06 1.6 0 −0.6 33 0.18 −6.1 14 0.05 −3.8Minimum 0.09 0 −0.19 0.67 0 −0.99 −1.7 0.01 −9.4 2 0.01 −9.1Maximum 0.67 0.96 0 2.7 0.01 −0.09 67 0.34 −2.3 30 0.13 −0.55p-value quartiles <0.01, 0.04 <0.01, 0.06 0.02, 0.37 0.02, 0.03
Table 3. March to October mean, minimum and maximum water column, sediment and macroalgal (Ulva and Gracilaria) pho-tosynthesis−irradiance (PI) parameters for each bay. Units for maximum photosynthesis (Pmax) and respiration (R) are mg O2 l−1
h−1, and units for photosynthetic efficiency (α) are mg O2 l−1 h−1 (µE m−2 s−1)−1. Listed below the PI parameters are the first and third quartiles for the p-values for the water column, sediment and macroalgae PI fits from March to October
Mar Ecol Prog Ser 458: 21–38, 201226
based on a relationship between percent light trans-mission and biomass of Gracilaria (Brush 2002) andBG is Gracilaria dry mass. These hourly light levels, I2,were combined with biomass-normalized macroalgalα, Pmax and R to scale up to daily mat metabolism ineach month as for the water column and sedimentincubations. Measured biomass at each site was usedto extrapolate to in situ metabolism; however, giventhe inherent patchiness of macroalgae in these sys-tems and our limited sampling for biomass, our esti-mates of macroalgal metabolism apply only at oursampling stations and not at the scale of the entirelagoon.
Finally, sediment production in May, June and July2008 was adjusted to account for macroalgal shadingof the sediment surface based on average macroalgalbiomass each month. The following equation wasused to calculate light at the sediment surface (Ised)under a 1 m water column and a given mat thickness:
(3)
where Io (µE m−2 s−1) is light at the surface, kD (m−1) isthe water column attenuation, z (m) is water depthand the other variables are as defined for Eq. (2).
Site-specific irradiance was unavailable, so hourlyPAR data from Taskinas Creek, VA, approximately100 km to the west, collected by the Chesapeake BayNational Estuarine Research Reserve of Virginia(CBNERRVA), were used. To ensure that CBN-ERRVA data applied to the Delmarva Peninsula,daily Taskinas Creek PAR values were comparedwith values collected at the University of MarylandHorn Point Laboratory located on the Delmarva(Fisher et al. 2003, T. R. Fisher & A. B. Gustafson pers.comm.). Regression analyses indicated strong rela-tionships between daily PAR at these 2 sites for 2006(r2 = 0.74, p < 0.001), 2007 (r2 = 0.82, p < 0.001) and2008 (r2 = 0.81, p < 0.001).
Open-water method
Datasondes with optical DO sensors were de ployed0.5 m below the water surface near mid-bay in Bur-ton’s (5 deployments) and Gargathy (4 deployments)Bays, recording DO, percent saturation, temperatureand salinity every 15 min during deployments of 7 to18 d. NEM was computed from hourly average DOconcentrations after correcting for air−sea exchangeusing the regression of Marino & Howarth (1993),which calculates the transfer velocity as a function ofwind speed recorded at the nearby Wallops IslandFlight Facility Airport and obtained from the NOAA
National Climatic Data Center. Hourly NEM wasintegrated over 24 h to obtain daily rates.
Statistical analyses
General linear model (GLM) ANOVA was used todetermine statistical significance among metabolicparameters across bays, sampling dates and locations(i.e. creek, mid bay and inlet). Differences weredetermined for daily GPP, R and NCP and hourly Rand Pmax for the water column and sediments, NEM,production:respiration (P:R) and benthic:pelagicmeta bolism. In addition, differences were deter-mined between rates scaled to reflect the growingseason (March−October) and summer period whenmacroalgal incubations were included (May−July).Differences were considered significant at α = 0.05. ATukey’s pair-wise comparison test was used to deter-mine differences between factors from significantANOVA tests.
Data were first tested for normality and for homo-geneity of variance. All data met the homogeneity ofvariance assumption, though not all data were nor-mally distributed; transformation of the data did notimprove the distribution. ANOVAs are robust to non-normality, however, and the assumption of homoge-nous variance is more important to reduce the poten-tial of Type I error (Quinn & Keough 2002). As anindependent check, non-parametric Kruskal-Wallistests were run on the data and produced similarresults.
RESULTS
Daily gross primary production and respiration
No statistical differences were found among sitesfor average daily water column GPP (p = 0.885),water column NCP (p = 0.075), sediment GPP (p =0.880), sediment R (p = 0.160) or sediment NCP (p =0.715), and interaction effects with site were alsonon-significant. The GLM ANOVA detected a statis-tical difference in water column R among sites (p =0.012), but this difference did not appear to influencethe overall metabolic balance of the water column asdaily net metabolism did not differ among sites.Therefore, the 3 sites within each bay were treated asreplicates and are presented as bay-wide averagesthroughout the paper.
All bays experienced higher pelagic GPP in the falland late spring/early summer, low pelagic GPP in
I I k z k n k Bsed oe D t T G G= − ⋅ + ⋅ + ⋅( )
Giordano et al.: Ecosystem metabolism in shallow coastal lagoons
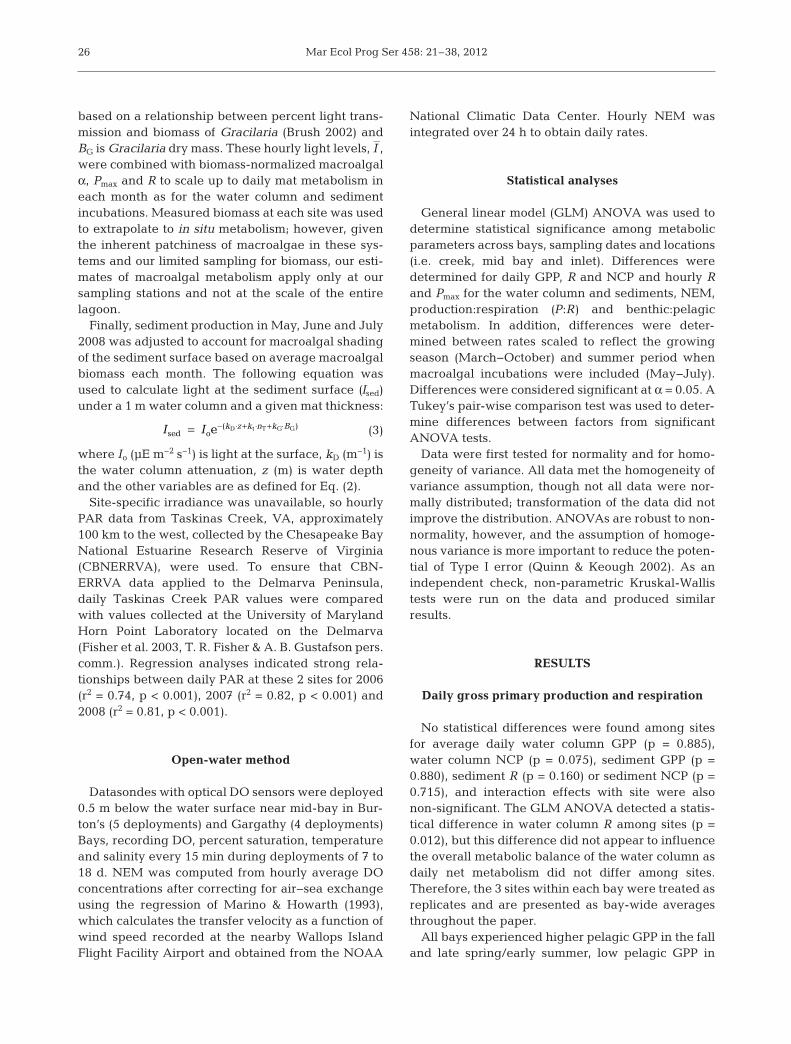
March and relatively low pelagic R throughout theyear (Fig. 3A−D). Daily pelagic metabolism oscillatedbetween net autotrophy and net heterotrophy in all 4bays, though overall the water column was predomi-nantly net autotrophic in all systems (Fig. 3A−D).
Daily sediment metabolism was more variableamong the bays. In Hog Island and Burton’s Bays, thesediments experienced balanced NCP most of thetime, with slight oscillations from net heterotrophy inthe late summer, autotrophy in the fall, heterotrophyin the spring and autotrophy in the early summer(Fig. 3E,F). Isle of Wight sediments shifted from netautotrophic to balanced over the annual cycle
(Fig. 3G), and sediment metabolism in Gargathy Bayremained net heterotrophic most of the time, withbalanced metabolism in October and March(Fig. 3H). Annually, Gargathy Bay displayed the low-est rates of sediment GPP and highest rates of sedi-ment R.
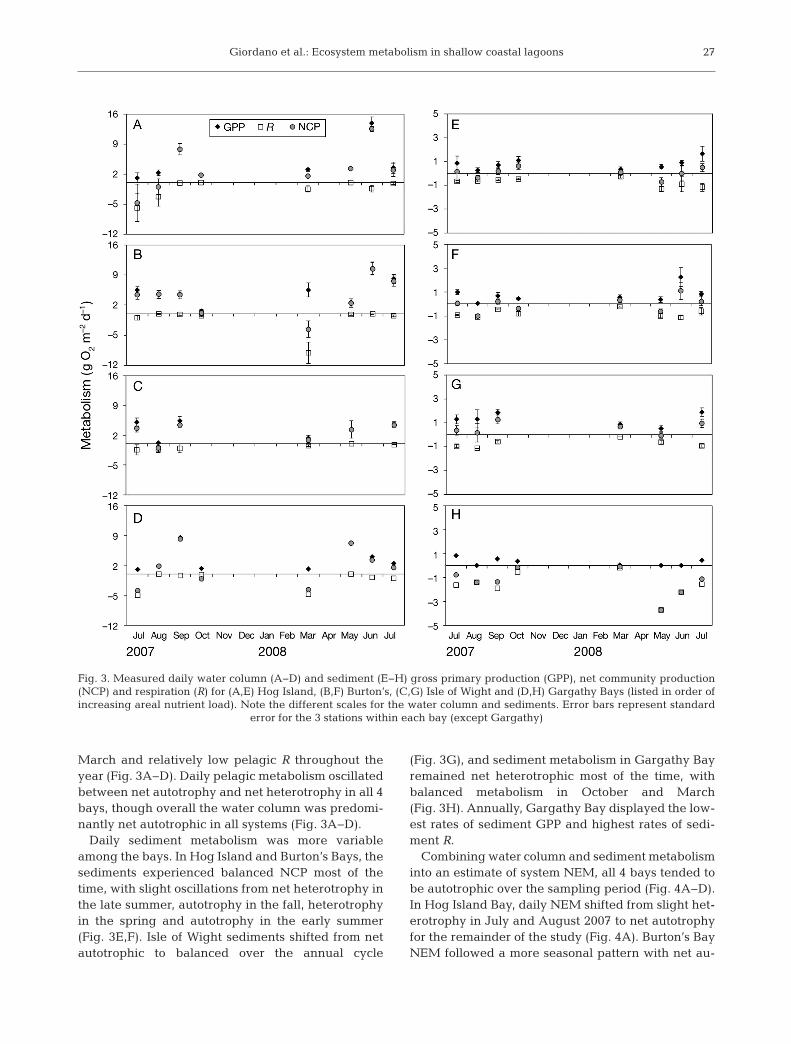
Combining water column and sediment metabolisminto an estimate of system NEM, all 4 bays tended tobe autotrophic over the sampling period (Fig. 4A−D).In Hog Island Bay, daily NEM shifted from slight het-erotrophy in July and August 2007 to net autotrophyfor the remainder of the study (Fig. 4A). Burton’s BayNEM followed a more seasonal pattern with net au-
27
Fig. 3. Measured daily water column (A−D) and sediment (E−H) gross primary production (GPP), net community production(NCP) and respiration (R) for (A,E) Hog Island, (B,F) Burton’s, (C,G) Isle of Wight and (D,H) Gargathy Bays (listed in order ofincreasing areal nutrient load). Note the different scales for the water column and sediments. Error bars represent standard
error for the 3 stations within each bay (except Gargathy)
Mar Ecol Prog Ser 458: 21–38, 201228
totrophy in summer and net heterotrophy in March(Fig. 4B). Isle of Wight Bay was net autotrophic overthe year, except for August when it was slightly netheterotrophic (Fig. 4C). Daily NEM in Gargathy Baywas net heterotrophic or near balance in March andin the warmest months, and net autotrophic at inter-mediate temperatures (Fig. 4D).
Water column GPP was significantly positively cor-related to water temperature and daily PAR and neg-atively correlated to DIN concentrations (Table 4).Water column respiration was not significantly corre-lated to any of the parameters tested, and only tem-perature was a significant driver of water columnNCP. Sediment GPP was significantly negativelyrelated to the attenuation coefficient (kD) and sedi-ment organic content, and positively related to DONconcentrations (Table 4). Sediment respiration wasnegatively correlated to sediment organic contentand temperature, and sediment NCP was negativelyrelated to kD and organic content as for sedimentGPP. System NEM was positively related to water
temperature and negatively related to sedimentorganic content (Table 4).
Integrated growing season metabolism
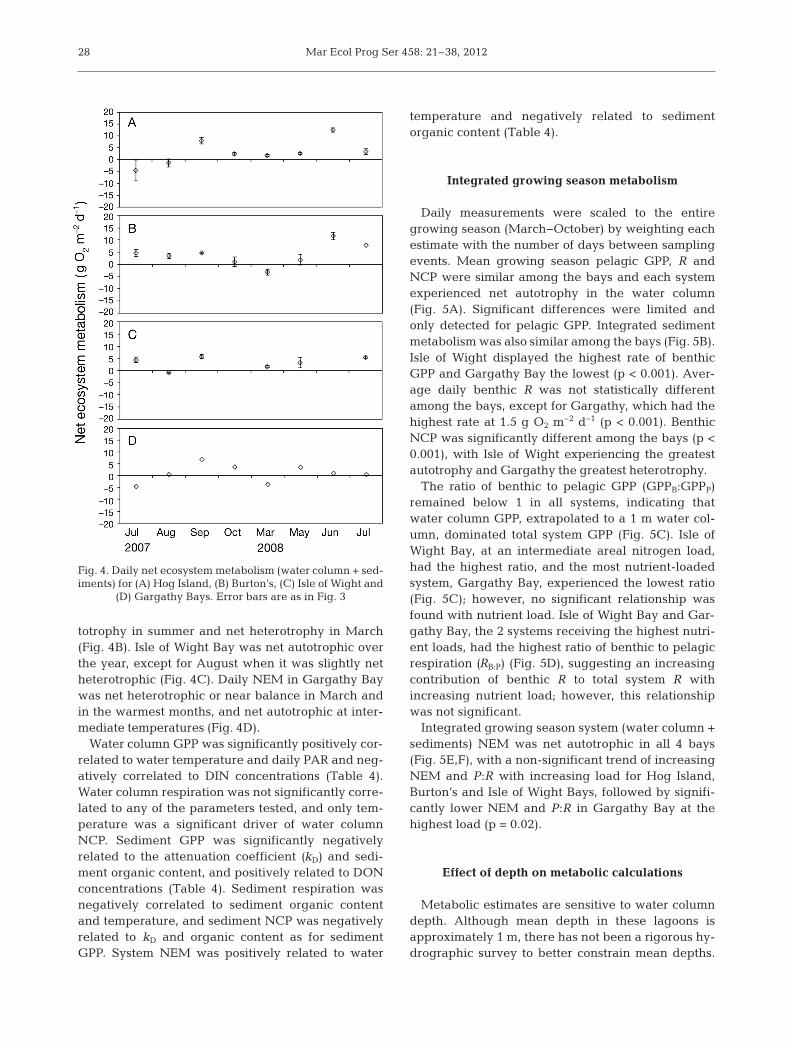
Daily measurements were scaled to the entiregrowing season (March−October) by weighting eachestimate with the number of days between samplingevents. Mean growing season pelagic GPP, R andNCP were similar among the bays and each systemexperienced net autotrophy in the water column(Fig. 5A). Significant differences were limited andonly detected for pelagic GPP. Integrated sedimentmetabolism was also similar among the bays (Fig. 5B).Isle of Wight displayed the highest rate of benthicGPP and Gargathy Bay the lowest (p < 0.001). Aver-age daily benthic R was not statistically differentamong the bays, except for Gargathy, which had thehighest rate at 1.5 g O2 m−2 d−1 (p < 0.001). BenthicNCP was significantly different among the bays (p <0.001), with Isle of Wight experiencing the greatestautotrophy and Gargathy the greatest heterotrophy.
The ratio of benthic to pelagic GPP (GPPB:GPPP)remained below 1 in all systems, indicating thatwater column GPP, extrapolated to a 1 m water col-umn, dominated total system GPP (Fig. 5C). Isle ofWight Bay, at an intermediate areal nitrogen load,had the highest ratio, and the most nutrient-loadedsystem, Gargathy Bay, experienced the lowest ratio(Fig. 5C); however, no significant relationship wasfound with nutrient load. Isle of Wight Bay and Gar-gathy Bay, the 2 systems receiving the highest nutri-ent loads, had the highest ratio of benthic to pelagicrespiration (RB:P) (Fig. 5D), suggesting an increasingcontribution of benthic R to total system R withincreasing nutrient load; however, this relationshipwas not significant.
Integrated growing season system (water column +sediments) NEM was net autotrophic in all 4 bays(Fig. 5E,F), with a non-significant trend of increasingNEM and P:R with increasing load for Hog Island,Burton’s and Isle of Wight Bays, followed by signifi-cantly lower NEM and P:R in Gargathy Bay at thehighest load (p = 0.02).
Effect of depth on metabolic calculations
Metabolic estimates are sensitive to water columndepth. Although mean depth in these lagoons isapproximately 1 m, there has not been a rigorous hy -drographic survey to better constrain mean depths.
Fig. 4. Daily net ecosystem metabolism (water column + sed-iments) for (A) Hog Island, (B) Burton’s, (C) Isle of Wight and
(D) Gargathy Bays. Error bars are as in Fig. 3
Giordano et al.: Ecosystem metabolism in shallow coastal lagoons 29
GPPWC RWC NCPWC GPPSED RSED NCPSED NEM
Temperature 0.319* 0.218 0.373* 0.217 −0.281* −0.001 0.361*0.007 0.068 0.001 0.07 0.017 0.991 0.002
CHLWC 0.217 0.03 0.189 −0.031 −0.176 −0.142 0.1230.248 0.875 0.318 0.87 0.351 0.455 0.518
CHLSED −0.145 0.088 −0.054 0.338 −0.016 0.258 −0.0050.222 0.461 0.78 0.004 0.89 0.028 0.964
Daily PAR 0.36 −0.129 0.205 −0.093 −0.042 −0.01 0.1780.002 0.273 0.08 0.431 0.72 0.4 0.13
kD −0.078 0.038 −0.038 −0.486* −0.221 −0.557* −0.1410.528 0.761 0.758 <0.001 0.073 <0.001 0.257
DIN −0.336 0.112 −0.196 −0.075 0.098 0 −0.190.003 0.34 0.094 0.523 0.408 0.997 0.106
DON 0.229 −0.074 −0.157 0.295* −0.164 0.129 0.180.069 0.559 0.216 0.018 0.195 0.311 0.154
DIP 0.186 0.076 0.19 0.052 −0.108 −0.025 0.1780.112 0.518 0.108 0.658 0.358 0.831 0.13
Sediment organic −0.163 −0.077 −0.171 −0.318* −0.307* −0.441* −0.259*content 0.166 0.514 0.144 0.006 0.008 <0.001 0.027
Table 4. Pearson correlation coefficients between metabolic and environmental parameters for the growing season(March−October). Asterisks indicate significance at the α = 0.05 level. For each parameter, the top value represents the corre-lation coefficient and the bottom value represents the p-value. The subscripts WC and SED refer to water column and sedi-ment, respectively. CHL: chlorophyll a; DIN: dissolved inorganic nitrogen; DIP: dissolved inorganic phosphorus; DON: dis-solved organic nitrogen; GPP: gross primary production; kD; water attenuation coefficient; NCP: net community production;
NEM: net ecosystem metabolism; PAR: photosynthetically active radiation; R: respiration
Fig. 5. Daily average gross primary production (GPP), respiration (R) and net community production (NCP) for (A) the watercolumn and (B) sediments; (C) GPPB:GPPP, (D) RB:RP, (E) net ecosystem metabolism (NEM) and (F) production:respiration (P:R)excluding macroalgae for the period between March through October for the 4 lagoons, presented along the x-axis in order ofincreasing areal nutrient load. Error bars are as in Fig. 3; statistically significant differences among lagoons (α = 0.05) are
denoted by different letters; bays sharing a letter are not significantly different from each other
Mar Ecol Prog Ser 458: 21–38, 2012
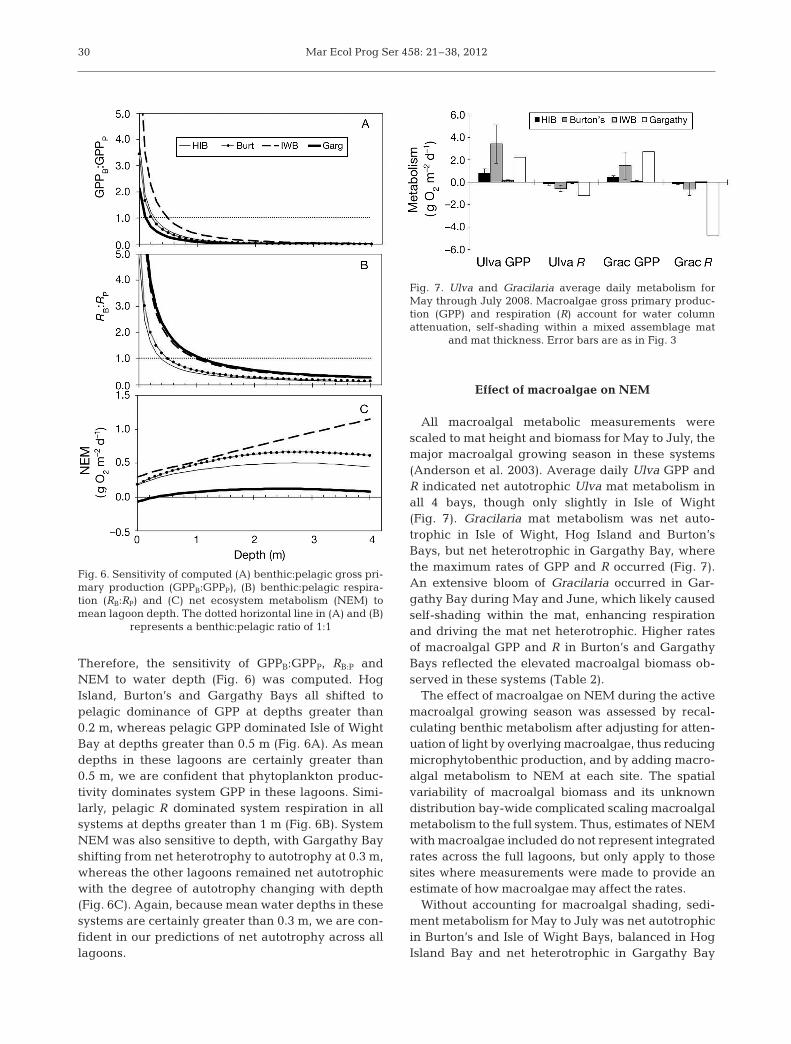
Therefore, the sensitivity of GPPB:GPPP, RB:P andNEM to water depth (Fig. 6) was computed. HogIsland, Burton’s and Gargathy Bays all shifted topelagic dominance of GPP at depths greater than0.2 m, whereas pelagic GPP dominated Isle of WightBay at depths greater than 0.5 m (Fig. 6A). As meandepths in these lagoons are certainly greater than0.5 m, we are confident that phytoplankton produc-tivity dominates system GPP in these lagoons. Simi-larly, pelagic R dominated system respiration in allsystems at depths greater than 1 m (Fig. 6B). SystemNEM was also sensitive to depth, with Gargathy Bayshifting from net heterotrophy to autotrophy at 0.3 m,whereas the other lagoons remained net autotrophicwith the degree of autotrophy changing with depth(Fig. 6C). Again, because mean water depths in thesesystems are certainly greater than 0.3 m, we are con-fident in our predictions of net autotrophy across alllagoons.
Effect of macroalgae on NEM
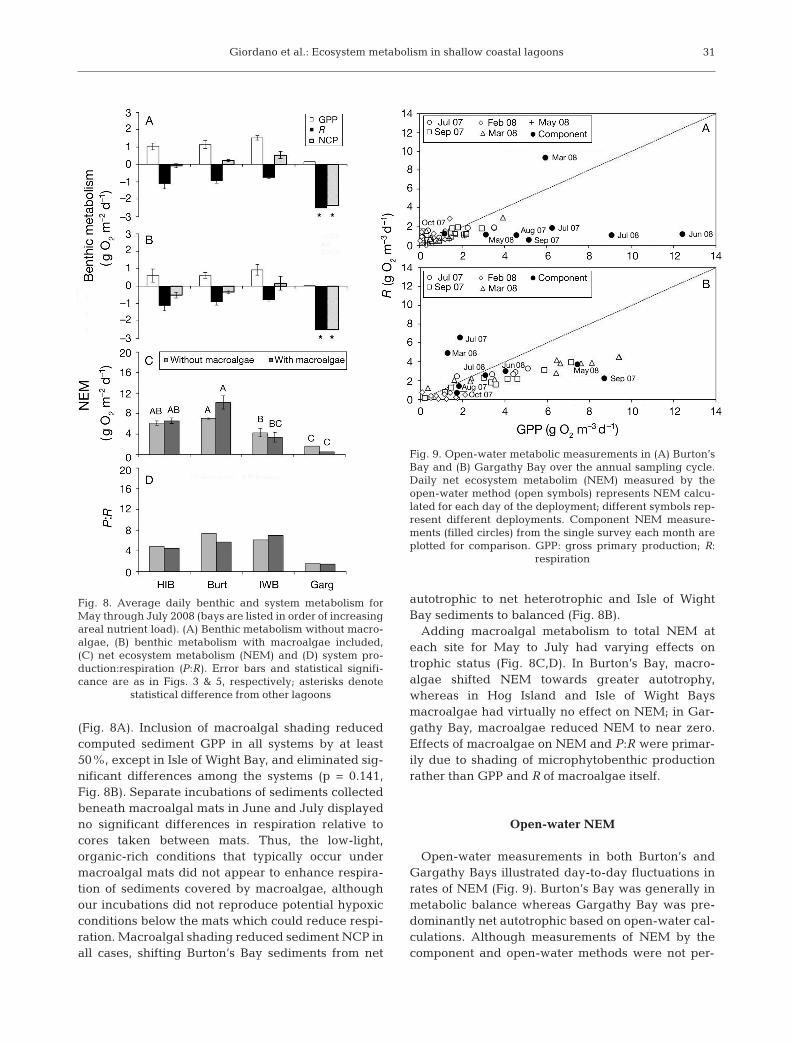
All macroalgal metabolic measurements werescaled to mat height and biomass for May to July, themajor macroalgal growing season in these systems(Anderson et al. 2003). Average daily Ulva GPP andR indicated net autotrophic Ulva mat metabolism inall 4 bays, though only slightly in Isle of Wight(Fig. 7). Gracilaria mat metabolism was net auto -trophic in Isle of Wight, Hog Island and Burton’sBays, but net heterotrophic in Gargathy Bay, wherethe maximum rates of GPP and R occurred (Fig. 7).An extensive bloom of Gracilaria occurred in Gar-gathy Bay during May and June, which likely causedself-shading within the mat, enhancing respirationand driving the mat net heterotrophic. Higher ratesof macroalgal GPP and R in Burton’s and GargathyBays reflected the elevated macroalgal biomass ob -served in these systems (Table 2).
The effect of macroalgae on NEM during the activemacroalgal growing season was assessed by recal -culating benthic metabolism after adjusting for atten-uation of light by overlying macroalgae, thus reducingmicrophytobenthic production, and by adding macro -algal metabolism to NEM at each site. The spatialvariability of macroalgal biomass and its un knowndistribution bay-wide complicated scaling macroalgalmetabolism to the full system. Thus, estimates of NEMwith macroalgae included do not represent integratedrates across the full lagoons, but only apply to thosesites where measurements were made to provide anestimate of how macroalgae may affect the rates.
Without accounting for macroalgal shading, sedi-ment metabolism for May to July was net autotrophicin Burton’s and Isle of Wight Bays, balanced in HogIsland Bay and net heterotrophic in Gargathy Bay
30
Fig. 6. Sensitivity of computed (A) benthic:pelagic gross pri-mary production (GPPB:GPPP), (B) benthic:pelagic respira-tion (RB:RP) and (C) net ecosystem metabolism (NEM) tomean lagoon depth. The dotted horizontal line in (A) and (B)
represents a benthic:pelagic ratio of 1:1
Fig. 7. Ulva and Gracilaria average daily metabolism forMay through July 2008. Macroalgae gross primary produc-tion (GPP) and respiration (R) account for water columnattenuation, self-shading within a mixed assemblage mat
and mat thickness. Error bars are as in Fig. 3
Giordano et al.: Ecosystem metabolism in shallow coastal lagoons
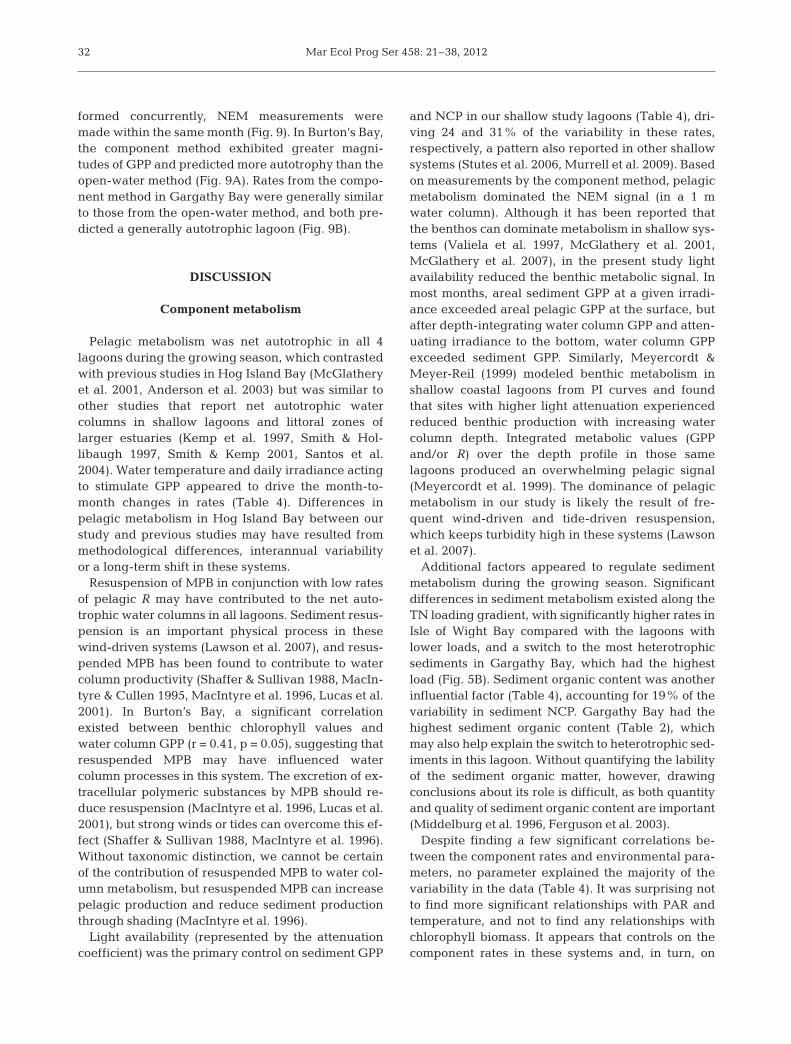
(Fig. 8A). Inclusion of macroalgal shading reducedcomputed sediment GPP in all systems by at least50%, except in Isle of Wight Bay, and eliminated sig-nificant differences among the systems (p = 0.141,Fig. 8B). Separate incubations of sediments collectedbeneath macroalgal mats in June and July displayedno significant differences in respiration relative tocores taken between mats. Thus, the low-light,organic-rich conditions that typically occur undermacroalgal mats did not appear to enhance respira-tion of sediments covered by macroalgae, althoughour incubations did not reproduce potential hypoxicconditions below the mats which could reduce respi-ration. Macroalgal shading reduced sediment NCP inall cases, shifting Burton’s Bay sediments from net
autotrophic to net heterotrophic and Isle of WightBay sediments to balanced (Fig. 8B).
Adding macroalgal metabolism to total NEM ateach site for May to July had varying effects ontrophic status (Fig. 8C,D). In Burton’s Bay, macro -algae shifted NEM towards greater autotrophy,whereas in Hog Island and Isle of Wight Baysmacroalgae had virtually no effect on NEM; in Gar-gathy Bay, macroalgae reduced NEM to near zero.Effects of macroalgae on NEM and P:R were primar-ily due to shading of microphytobenthic productionrather than GPP and R of macroalgae itself.
Open-water NEM
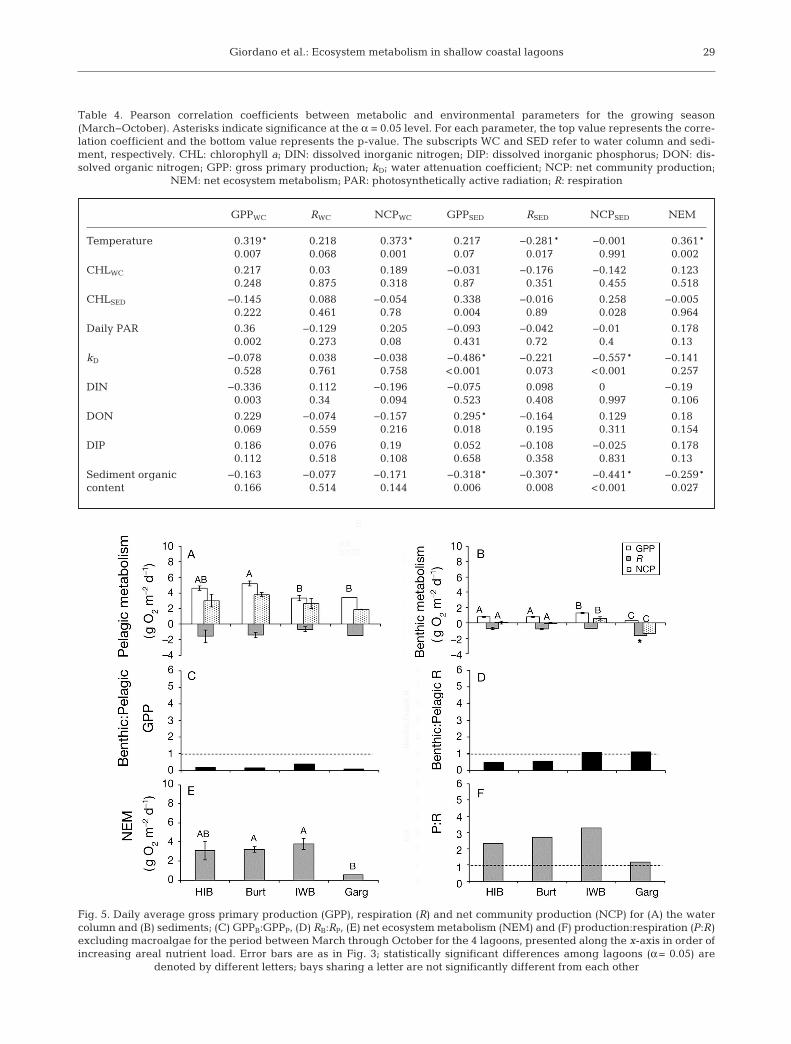
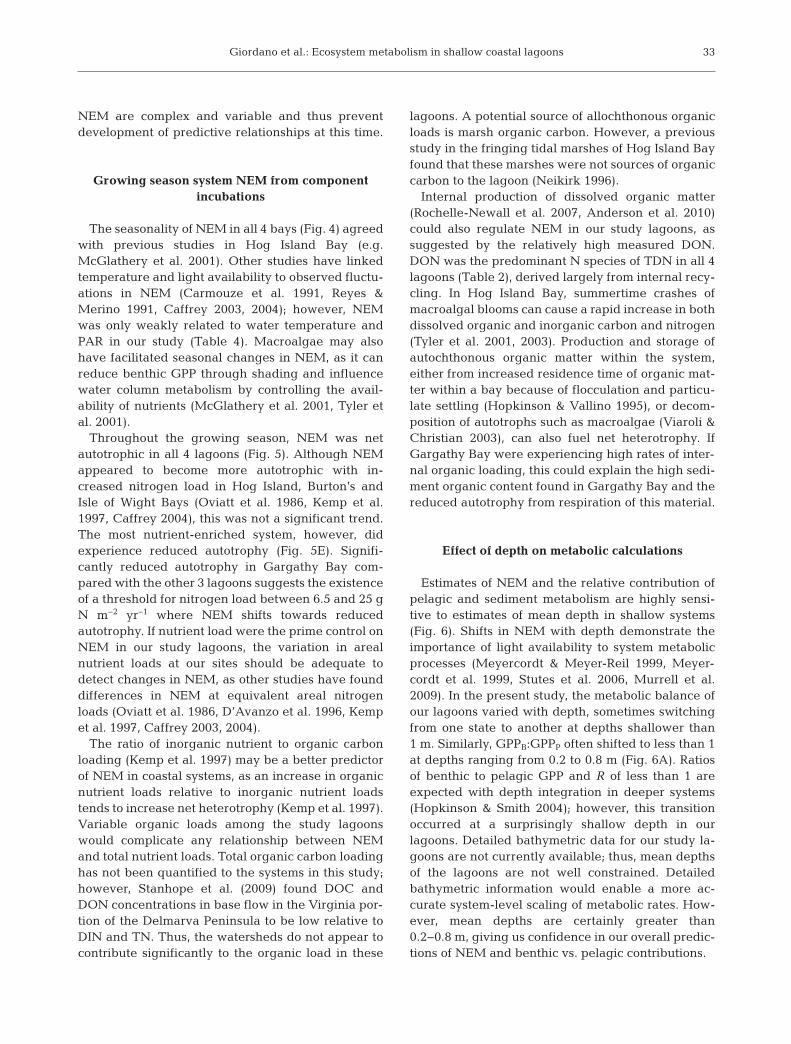
Open-water measurements in both Burton’s andGargathy Bays illustrated day-to-day fluctuations inrates of NEM (Fig. 9). Burton’s Bay was generally inmetabolic balance whereas Gargathy Bay was pre-dominantly net autotrophic based on open-water cal-culations. Although measurements of NEM by thecomponent and open-water methods were not per-
31
Fig. 8. Average daily benthic and system metabolism forMay through July 2008 (bays are listed in order of increasingareal nutrient load). (A) Benthic metabolism without macro -algae, (B) benthic metabolism with macroalgae in cluded,(C) net ecosystem metabolism (NEM) and (D) system pro-duction: respiration (P:R). Error bars and statistical signifi-cance are as in Figs. 3 & 5, respectively; asterisks denote
statistical difference from other lagoons
Fig. 9. Open-water metabolic measurements in (A) Burton’sBay and (B) Gargathy Bay over the annual sampling cycle.Daily net ecosystem metabolim (NEM) measured by theopen-water method (open symbols) represents NEM calcu-lated for each day of the deployment; different symbols rep-resent different deployments. Component NEM measure-ments (filled circles) from the single survey each month areplotted for comparison. GPP: gross primary production; R:
respiration
Mar Ecol Prog Ser 458: 21–38, 201232
formed concurrently, NEM measurements weremade within the same month (Fig. 9). In Burton’s Bay,the component method exhibited greater magni-tudes of GPP and predicted more autotrophy than theopen-water method (Fig. 9A). Rates from the compo-nent method in Gargathy Bay were generally similarto those from the open-water method, and both pre-dicted a generally autotrophic lagoon (Fig. 9B).
DISCUSSION
Component metabolism
Pelagic metabolism was net autotrophic in all 4lagoons during the growing season, which contrastedwith previous studies in Hog Island Bay (McGlatheryet al. 2001, Anderson et al. 2003) but was similar toother studies that report net autotrophic watercolumns in shallow lagoons and littoral zones oflarger estuaries (Kemp et al. 1997, Smith & Hol-libaugh 1997, Smith & Kemp 2001, Santos et al.2004). Water temperature and daily irradiance actingto stimulate GPP appeared to drive the month-to-month changes in rates (Table 4). Differences inpelagic metabolism in Hog Island Bay between ourstudy and previous studies may have resulted frommethodological differences, interannual variabilityor a long-term shift in these systems.
Resuspension of MPB in conjunction with low ratesof pelagic R may have contributed to the net auto -trophic water columns in all lagoons. Sediment resus-pension is an important physical process in thesewind-driven systems (Lawson et al. 2007), and resus-pended MPB has been found to contribute to watercolumn productivity (Shaffer & Sullivan 1988, MacIn-tyre & Cullen 1995, MacIntyre et al. 1996, Lucas et al.2001). In Burton’s Bay, a significant correlationexisted between benthic chlorophyll values andwater column GPP (r = 0.41, p = 0.05), suggesting thatresuspended MPB may have influenced watercolumn processes in this system. The excretion of ex-tracellular polymeric substances by MPB should re-duce resuspension (MacIntyre et al. 1996, Lucas et al.2001), but strong winds or tides can overcome this ef-fect (Shaffer & Sullivan 1988, MacIntyre et al. 1996).Without taxonomic distinction, we cannot be certainof the contribution of resuspended MPB to water col-umn metabolism, but resuspended MPB can increasepelagic production and reduce sediment productionthrough shading (MacIntyre et al. 1996).
Light availability (represented by the attenuationcoefficient) was the primary control on sediment GPP
and NCP in our shallow study lagoons (Table 4), dri-ving 24 and 31% of the variability in these rates,respectively, a pattern also reported in other shallowsystems (Stutes et al. 2006, Murrell et al. 2009). Basedon measurements by the component method, pelagicmetabolism dominated the NEM signal (in a 1 mwater column). Although it has been reported thatthe benthos can dominate metabolism in shallow sys-tems (Valiela et al. 1997, McGlathery et al. 2001,McGlathery et al. 2007), in the present study lightavailability reduced the benthic metabolic signal. Inmost months, areal sediment GPP at a given irradi-ance exceeded areal pelagic GPP at the surface, butafter depth-integrating water column GPP and atten-uating irradiance to the bottom, water column GPPexceeded sediment GPP. Similarly, Meyercordt &Meyer-Reil (1999) modeled benthic metabolism inshallow coastal lagoons from PI curves and foundthat sites with higher light attenuation experiencedreduced benthic production with increasing watercolumn depth. Integrated metabolic values (GPPand/or R) over the depth profile in those samelagoons produced an overwhelming pelagic signal(Meyercordt et al. 1999). The dominance of pelagicmetabolism in our study is likely the result of fre-quent wind-driven and tide-driven resuspension,which keeps turbidity high in these systems (Lawsonet al. 2007).
Additional factors appeared to regulate sedimentmetabolism during the growing season. Significantdifferences in sediment metabolism existed along theTN loading gradient, with significantly higher rates inIsle of Wight Bay compared with the lagoons withlower loads, and a switch to the most heterotrophicsediments in Gargathy Bay, which had the highestload (Fig. 5B). Sediment organic content was anotherinfluential factor (Table 4), accounting for 19% of thevariability in sediment NCP. Gargathy Bay had thehighest sediment organic content (Table 2), whichmay also help explain the switch to heterotrophic sed-iments in this lagoon. Without quantifying the labilityof the sediment organic matter, however, drawingconclusions about its role is difficult, as both quantityand quality of sediment organic content are important(Middelburg et al. 1996, Ferguson et al. 2003).
Despite finding a few significant correlations be -tween the component rates and environmental para-meters, no parameter explained the majority of thevariability in the data (Table 4). It was surprising notto find more significant relationships with PAR andtemperature, and not to find any relationships withchlorophyll biomass. It appears that controls on thecomponent rates in these systems and, in turn, on
Giordano et al.: Ecosystem metabolism in shallow coastal lagoons
NEM are complex and variable and thus preventdevelopment of predictive relationships at this time.
Growing season system NEM from componentincubations
The seasonality of NEM in all 4 bays (Fig. 4) agreedwith previous studies in Hog Island Bay (e.g.McGlathery et al. 2001). Other studies have linkedtemperature and light availability to observed fluctu-ations in NEM (Carmouze et al. 1991, Reyes &Merino 1991, Caffrey 2003, 2004); however, NEMwas only weakly related to water temperature andPAR in our study (Table 4). Macroalgae may alsohave facilitated seasonal changes in NEM, as it canreduce benthic GPP through shading and influencewater column metabolism by controlling the avail-ability of nutrients (McGlathery et al. 2001, Tyler etal. 2001).
Throughout the growing season, NEM was netautotrophic in all 4 lagoons (Fig. 5). Although NEMappeared to become more autotrophic with in -creased nitrogen load in Hog Island, Burton’s andIsle of Wight Bays (Oviatt et al. 1986, Kemp et al.1997, Caffrey 2004), this was not a significant trend.The most nutrient-enriched system, however, didexperience reduced autotrophy (Fig. 5E). Signifi-cantly reduced autotrophy in Gargathy Bay com-pared with the other 3 lagoons suggests the existenceof a threshold for nitrogen load between 6.5 and 25 gN m−2 yr−1 where NEM shifts towards reducedautotrophy. If nutrient load were the prime control onNEM in our study lagoons, the variation in arealnutrient loads at our sites should be adequate todetect changes in NEM, as other studies have founddifferences in NEM at equivalent areal nitrogenloads (Oviatt et al. 1986, D’Avanzo et al. 1996, Kempet al. 1997, Caffrey 2003, 2004).
The ratio of inorganic nutrient to organic carbonloading (Kemp et al. 1997) may be a better predictorof NEM in coastal systems, as an increase in organicnutrient loads relative to inorganic nutrient loadstends to increase net heterotrophy (Kemp et al. 1997).Variable organic loads among the study lagoonswould complicate any relationship between NEMand total nutrient loads. Total organic carbon loadinghas not been quantified to the systems in this study;however, Stanhope et al. (2009) found DOC andDON concentrations in base flow in the Virginia por-tion of the Delmarva Peninsula to be low relative toDIN and TN. Thus, the watersheds do not appear tocontribute significantly to the organic load in these
lagoons. A potential source of allochthonous organicloads is marsh organic carbon. However, a previousstudy in the fringing tidal marshes of Hog Island Bayfound that these marshes were not sources of organiccarbon to the lagoon (Neikirk 1996).
Internal production of dissolved organic matter(Rochelle-Newall et al. 2007, Anderson et al. 2010)could also regulate NEM in our study lagoons, assuggested by the relatively high measured DON.DON was the predominant N species of TDN in all 4lagoons (Table 2), derived largely from internal recy-cling. In Hog Island Bay, summertime crashes ofmacroalgal blooms can cause a rapid increase in bothdissolved organic and inorganic carbon and nitrogen(Tyler et al. 2001, 2003). Production and storage ofautochthonous organic matter within the system,either from increased residence time of organic mat-ter within a bay because of flocculation and particu-late settling (Hopkinson & Vallino 1995), or decom-position of autotrophs such as macroalgae (Viaroli &Christian 2003), can also fuel net heterotrophy. IfGargathy Bay were experiencing high rates of inter-nal organic loading, this could explain the high sedi-ment organic content found in Gargathy Bay and thereduced autotrophy from respiration of this material.
Effect of depth on metabolic calculations
Estimates of NEM and the relative contribution ofpelagic and sediment metabolism are highly sensi-tive to estimates of mean depth in shallow systems(Fig. 6). Shifts in NEM with depth demonstrate theimportance of light availability to system metabolicprocesses (Meyercordt & Meyer-Reil 1999, Meyer-cordt et al. 1999, Stutes et al. 2006, Murrell et al.2009). In the present study, the metabolic balance ofour lagoons varied with depth, sometimes switchingfrom one state to another at depths shallower than1 m. Similarly, GPPB:GPPP often shifted to less than 1at depths ranging from 0.2 to 0.8 m (Fig. 6A). Ratiosof benthic to pelagic GPP and R of less than 1 areexpected with depth integration in deeper systems(Hopkinson & Smith 2004); however, this transitionoccurred at a surprisingly shallow depth in our la goons. Detailed bathymetric data for our study la -goons are not currently available; thus, mean depthsof the lagoons are not well constrained. Detailedbathymetric information would enable a more ac -curate system-level scaling of metabolic rates. How-ever, mean depths are certainly greater than0.2−0.8 m, giving us confidence in our overall predic-tions of NEM and benthic vs. pelagic contributions.
33
Mar Ecol Prog Ser 458: 21–38, 2012
Effect of macroalgae on NEM
The occurrence of macroalgal blooms in the sum-mer reduced local benthic GPP and shifted the sedi-ments of Hog Island, Isle of Wight and Burton’s Baysfrom balanced or slightly autotrophic to net hetero-trophic (Fig. 8A,B). This shift could have resultedfrom reduced light availability to the sediments frommacroalgal shading, thereby decreasing microphyto-benthic GPP (Stutes et al. 2006), or from decomposi-tion of macroalgae and detritus in the sediments. Thesignificant relationships between light and sedimentorganic content with sediment GPP indicate thatboth factors might have been important in sedimentmetabolism (Table 3). Although no differences weredetected in respiration from sediment cores takendirectly under macroalgal mats, sampling mighthave occurred under mats that were not stationary orunder which most of the labile organic matter hadalready been decomposed. Gargathy Bay experi-enced significantly greater sediment respiration inMay during a Gracilaria bloom, which might haveresulted from increased organic matter supply fromthe overlying macroalgal mat. Greater sediment res-piration was also measured at the Hog Island creeksampling station in June during an extensive macro -algal bloom. Thus, greater respiration under macro -algal mats would further reduce sediment net meta -bo lism, resulting in more heterotrophic sediments inall bays (Trimmer et al. 2000).
Macroalgal metabolism, based on the areas wherebiomass was sampled and growth measured, hadvariable effects on system NEM and P:R. It was antic-ipated that macroalgae would increase the degree ofautotrophy in all lagoons given the high rates of pro-duction that must occur to produce the large mats insummer; however, this was not the case. In GargathyBay, the large biomass of Gracilaria was likely begin-ning to undergo decomposition because of self-shad-ing within the mat, thereby shutting down algalmetabolism (Brush & Nixon 2003) and leading tohetero trophy of the mat and system (D’Avanzo &Kremer 1994, Viaroli & Christian 2003). The elevatedwater column GPP in Gargathy Bay in May couldindicate a response to the release of nutrients into thewater column from decomposing macroalgae (Mc -Glathery et al. 1997, 2001).
Although extrapolations of macroalgal results arelimited to a local scale, inclusion of macroalgae pro-vides an improved estimate of whole-system NEMduring the summer. Within a bay, local NEM wasnot significantly different. Assuming rates of localNEM hold across the bay, significant differences
were found among the 4 lagoons (Fig. 8C). On alocal scale, summertime system NEM peaked at alow areal nutrient load and exhibited reducedautotrophy in the 2 most nutrient-enriched systems;thus this switch to reduced autotrophy occurred at alower nutrient load relative to the entire growingseason (Fig. 5E). This was likely the result ofwarmer summer water temperatures stimulatinggreater respiration.
Open-water vs. component estimates of NEM
Although open-water and component-based esti-mates of NEM tended to produce similar results, the2 methods generally predicted different magnitudesof NEM and sometimes gave opposite results (i.e. netautotrophy vs. net heterotrophy) (Fig. 9). It is not sur-prising that calculation of NEM using the componentand open-water methods differ. In a comparison ofmethods, Gazeau et al. (2005) found that open-watermeasurements generally estimated a larger degreeof heterotrophy than bottle incubations. Caffrey(2004) also found that most of the coastal systems shestudied were net heterotrophic using the open-watermethod. In our study, the different NEM estimatescalculated by the 2 methods likely resulted, in part,from differences in the hydrodynamics and physicalnature of the systems, in addition to the temporal andspatial scales upon which the methods are based(Gazeau et al. 2005).
Observed differences in NEM results may alsooriginate from assumptions inherent in both meth-ods. The open-water method assumes that: (1) bio-logical processes dominate over physical processes;(2) the water mass measured is homogeneous andpossesses a similar metabolic history over a dielperiod; (3) metabolic rates within the system arehigh; and (4) air−sea exchange estimates are accu-rate (Kemp & Boynton 1980, Caffrey 2003, 2004).Biases in the component method calculations resultfrom isolating biological components from naturalmixing (Kemp & Boynton 1980), grazing and thepropagation of error through calculations associatedwith aggregating multiple components (Smith & Hol-libaugh 1997).
Wind and tides significantly influence the physi-cally dynamic coastal lagoons in this study. Thus,the physical nature of these systems might haveviolated the assumption of minimal influence ofphysical processes on DO levels in the system. Thecorrection made for air−sea exchange is alsosubject to uncertainty. The wind data came from a
34
Giordano et al.: Ecosystem metabolism in shallow coastal lagoons
single monitoring station inland and north of thecoastal bays. It was not possible to capture theexact wind conditions at our study sites, an impor-tant factor in quantifying air−sea exchange at localscales (Kremer et al. 2003). Sensitivity analysis ofthe effects of wind speed on computed NEM indi-cated that increased or decreased wind speedschanged the magnitude of daily NEM but not thetrophic status of NEM (i.e. net autotrophic or het-erotrophic). The air−sea exchange correction variedbetween 50 and 70% of total NEM, highlightingthe importance of this correction to overall NEMcalculations. A single open-water monitoring stationmay also not accurately reflect system NEM be -cause of spatial variability, although this representsa bigger problem in larger systems (Russell & Mon-tagna 2007). The location of our sondes in deeper,channel sites may also have captured more watercolumn heterotrophy.
The extensive intertidal marshes surrounding theVA coastal bays (Table 1) could also have contributedlow DO water (Neubauer & Anderson 2003) with ahigh organic load (Caffrey 2004) to the lagoons.Component methods, however, should capture therespiration of organic matter exported from themarshes, as we incubated site water. In contrast,export of water with low DO concentrations becauseof respiration on the marsh platform may have madethe open-water data indicate more respiration thanwas actually occurring in the lagoons. An attemptwas made to correct open-water NEM for this effectusing measured rates of marsh respiration (Milleret al. 2001); doing so resulted in improved correspon-dence in Burton’s Bay but not in Gargathy Bay. Thesediffering results using the 2 methods highlight animportant area for future investigation, as manyNEM studies rely on a single method (Meyercordtet al. 1999, Caffrey 2003, 2004, Santos et al. 2004,Goebel & Kremer 2007).
CONCLUSIONS
Pelagic metabolism dominated system NEM anddrove our study lagoons to net autotrophy, whichdeparts from the conceptual model of benthic pro-ducer dominance in shallow marine ecosystems(Valiela et al. 1997, McGlathery et al. 2007). Depthand thus light availability (Meyercordt et al. 1999,Stutes et al. 2006, Murrell et al. 2009) were major fac-tors responsible for the observed predominance ofpelagic production over benthic production. Resus-pended MPB might have also been a factor driving
water column productivity (MacIntyre et al. 1996,Lucas et al. 2001). Macroalgae did not appear to havea significant effect on overall system NEM or P:R,though patchy distributions make it impossible toextrapolate these results to the system level. Somemetabolic parameters demonstrated relationshipswith TN load; however, the patterns were not alwaysclear or consistent. Relationships of metabolic para-meters to light availability, sediment organic content,temperature and depth indicate the importance ofother factors in mediating trophic response in theseshallow lagoons. Differences in NEM estimates fromcomponent and open-water methods highlight thepotential importance of fringing marshes and theassumptions and spatiotemporal scales associatedwith both methods, and underscore the need for fur-ther investigations into this discrepancy.
Acknowledgements. We thank K. J. McGlathery for herguidance regarding system and macroalgal metabolism andC. T. Friedrichs for insight into the importance of physicalproperties. We appreciate the field and laboratory help of B.Condon, B. Lawson, H. Wiseman, S. Fate and H. Walker.Partial support for this research was provided by the Vir-ginia Coast Reserve Long-Term Ecological Research Pro-gram (National Science Foundation), a VIMS Eastern ShoreLaboratory student research grant, and a Marlatt Founda-tion student research grant. This publication represents con-tribution number 3226 of the Virginia Institute of MarineScience, College of William and Mary.
LITERATURE CITED
Able KW (2005) A re-examination of fish estuarine depen-dence: evidence for connectivity between estuarine andocean habitats. Estuar Coast Shelf Sci 64: 5−17
Anderson IC, McGlathery KJ, Tyler AC (2003) Microbialmediation of ‘reactive’ nitrogen transformations in a tem-perate lagoon. Mar Ecol Prog Ser 246: 73−84
Anderson IC, Stanhope JW, Hardison AK, McGlathery KJ(2010) Sources and fates of nitrogen in Virginia coastalbays. In: Kennish MJ, Pearl HW (eds) Coastal lagoons: critical habitats of environmental change. CRC PressBoca Raton, FL, p 43–72
Beck MW, Heck KL, Able KW, Childers DL and others(2001) The identification, conservation, and manage-ment of estuarine and marine nurseries for fish andinvertebrates. Bioscience 51: 633−641
Beck MW, Heck KL, Able KW, Childers DL and others(2003) The role of nearshore ecosystems as fish and shell-fish nurseries. Issues Ecol 11: 1−12
Boesch DE (2002) Challenges and opportunities for sciencein reducing nutrient over-enrichment of coastal ecosys-tems. Estuaries 25: 886−900
Borum J, Sand-Jensen K (1996) Is total primary productionin shallow coastal marine waters stimulated by nitrogenloading? Oikos 76: 406−410
Boynton WR, Murray L, Hagy JD, Stokes C, Kemp WM(1996) A comparative analysis of eutrophication patternsin a temperate coastal lagoon. Estuaries 19: 408−412
35

Mar Ecol Prog Ser 458: 21–38, 2012
Bricker SB, Clement CG, Pirhalla DE, Orlando SP, FarrowDRG (1999) National estuarine eutrophication assess-ment: effects of nutrient enrichment in the nation’s estu-aries. NOAA, National Ocean Service, Special ProjectsOffice and the National Centers for Coastal Ocean Sci-ence, Silver Spring, MD
Bricker SB, Longstaff B, Dennison W, Jones A, Boicourt K,Wicks C, Woerner J (2008) Effects of nutrient enrichmentin the nation’s estuaries: a decade of change. HarmfulAlgae 8: 21−32
Brush M (2002) Development of a numerical model for shal-low marine ecosystems with application to GreenwichBay, Rhode Island. PhD dissertation, University of RhodeIsland, Kingston, RI
Brush MJ, Nixon SW (2003) Biomass layering and metabo-lism in mats of the macroalga Ulva lactuca L. Estuaries26: 916−926
Burnham KP, Anderson DR (2002) Model selection and multimode inference: a practical information-theoreticapproach, 2nd edn. Springer, New York, NY
Caffrey JM (2003) Production, respiration and net ecosys-tem metabolism in U.S. estuaries. Environ Monit Assess81: 207−219
Caffrey JM (2004) Factors controlling net ecosystem meta -bolism in U.S. estuaries. Estuaries 27: 90−101
Carmouze JP, Knoppers B, Vasconcelos P (1991) Metabolismof a subtropical Brazilian lagoon. Biogeochemistry 14: 129−148
Cloern JE (2001) Our evolving conceptual model of thecoastal eutrophication problem. Mar Ecol Prog Ser 210: 223−253
D’Avanzo C, Kremer JN (1994) Diel oxygen dynamics andanoxic events in an eutrophic estuary of Waquoit Bay,Massachusetts. Estuaries 17: 131−139
D’Avanzo C, Kremer JN, Wainright SC (1996) Ecosystemproduction and respiration in response to eutrophicationin shallow temperate estuaries. Mar Ecol Prog Ser 141: 263−274
Duarte CM (1995) Submerged aquatic vegetation in relationto different nutrient regimes. Ophelia 41: 87−112
EPA (2008) National coastal condition report III. EPA/842-R-08-002. United States Environmental Protection Agency,Office of Research and Development/Office of Water.Washington, DC
Eyre BD, McKee LJ (2002) Carbon, nitrogen, and phospho-rous budgets for a shallow subtropical coastal embay-ment (Moreton Bay, Australia). Limnol Oceanogr 47: 1043−1055
Ferguson AJP, Eyre BD, Gay JM (2003) Organic matter andbenthic metabolism in euphotic sediments along shallowsub-tropical estuaries, northern New South Wales, Aus-tralia. Aquat Microb Ecol 33: 137−154
Fisher TR, Gustafson AB, Sellner K, Lacouture R and others(1999) Spatial and temporal variation of resource limita-tion in Chesapeake Bay. Mar Biol 133: 763−778
Fisher TR, Gustafson AB, Radcliffe GM, Sundberg KL,Stevenson JC (2003) A long-term record of photosynthet-ically active radiation (PAR) and total solar energy at38.6°N, 78.2°W. Estuaries 26: 1450−1460
Gazeau F, Borges AV, Barrón C, Duarte CM and others(2005) Net ecosystem metabolism in a micro-tidal estu-ary (Randers Fjord, Denmark): evaluation of methods.Mar Ecol Prog Ser 301: 23−41
Giordano JCP (2009) Nutrient loading and system responsein the coastal lagoons of the Delmarva Peninsula. MSc
thesis, College of William and Mary, Virginia Institute ofMarine Science, Gloucester Point, VA
Giordano JCP, Brush M, Anderson IC (2011) Quantifyingannual nutrient loads to Virginia’s coastal lagoons: sources and water quality response. Estuaries 34: 297−309
Goebel NL, Kremer JN (2007) Temporal and spatial variabil-ity of photosynthetic parameters and community respira-tion in Long Island Sound. Mar Ecol Prog Ser 329: 23−42
Hardison AK, Canuel EA, Anderson IC, Veuger B (2010)Fate of macroalgae in benthic systems: carbon and nitro-gen cycling within the microbial community. Mar EcolProg Ser 414: 41−55
Homer C, Huang C, Yang L, Wylie B, Coan M (2004) Devel-opment of a 2001 National Landcover Database for theUnited States. Photogramm Eng Remote Sensing 70: 829−840
Hopkinson CS, Smith EM (2004) Estuarine respiration: anoverview of benthic, pelagic, and whole system respira-tion. In: Del Giorgio PA, Williams PJ le B (eds) Respira-tion in aquatic ecosystems. Oxford University Press,Oxford, p 122−146
Hopkinson CS, Vallino JJ (1995) The relationships amongman’s activities in watersheds and estuaries: a model ofrunoff effects on patterns of estuarine community metab-olism. Estuaries 18: 598−621
Howarth RW (2008) Coastal nitrogen pollution: a review ofsources and trends globally and regionally. HarmfulAlgae 8: 14−20
Howarth RW, Marino R (2006) Nitrogen as the limiting nutri-ent for eutrophication in coastal marine systems: evolv-ing views over three decades. Limnol Oceanogr 51: 364−376
Jassby AD, Platt T (1976) Mathematical formulation of therelationship between photosynthesis and light for phyto-plankton. Limnol Oceanogr 21: 540−547
Kemp WM, Boynton WR (1980) Influence of biological andphysical processes on dissolved oxygen dynamics in anestuarine system: implications for measurement of com-munity metabolism. Estuar Coast Mar Sci 11: 407−431
Kemp WM, Smith EM, Marvin-DiPasquale M, Boynton WR(1997) Organic carbon balance and net ecosystemmetabolism in Chesapeake Bay. Mar Ecol Prog Ser 150: 229−248
Knepel K, Bogren K (2001) Determination of orthophosphateby flow injection analysis. QuikChem Method 21-115-01-1-H. Lachat Instruments, Milwaukee, WI
Kremer JN, Reischauer A, D’Avanzo C (2003) Estuary-spe-cific variation in the air-water gas exchange coefficientof oxygen. Estuaries 26: 829−836
Lawson SE, Wiberg PL, McGlathery KJ, Fugate DC (2007)Wind-driven sediment suspension a shallow coastallagoon. Estuar Coasts 30: 102−112
Liao N (2001) Determination of ammonia in brackish or sea-water by flow injection analysis. QuikChem Method 21-107-06-1-B. Lachat Instruments, Milwaukee, WI
Lorenzen C (1967) Determination of chlorophyll andphaeopigments: spectrophotometric equations. LimnolOceanogr 12: 343−346
Lucas CH, Banham C, Holligan PM (2001) Benthic-pelagicexchange of microalgae at a tidal flat. 2. Taxonomicanalysis. Mar Ecol Prog Ser 212: 39−52
MacIntyre HL, Cullen JJ (1995) Fine-scale vertical resolu-tion of chlorophyll and photosynthetic parameters inshallow-water benthos. Mar Ecol Prog Ser 122: 227−237
36
Giordano et al.: Ecosystem metabolism in shallow coastal lagoons
MacIntyre HL, Geider RJ, Miller DC (1996) Microphytoben-thos: The ecological role of the ‘secret garden’ of unveg-etated, shallow-water marine habitats. I. Distribution,abundance, and primary production. Estuaries 19: 186−201
Marino R, Howarth RW (1993) Atmospheric oxygenexchange in the Hudson River: dome measurements andcomparison with other natural waters. Estuaries 16: 433−445
McGlathery KJ, Krause-Jensen D, Rysgaard S, ChristensenPB (1997) Patterns of ammonium uptake within densemats of the filamentous Chaetomorpha linum. Aquat Bot59: 99−115
McGlathery KJ, Anderson IC, Tyler AC (2001) Magnitudeand variability of benthic and pelagic metabolism in atemperate coastal lagoon. Mar Ecol Prog Ser 216: 1−15
McGlathery KJ, Sundback K, Anderson IC (2007) Eutrophi-cation in shallow coastal bays and lagoons: the role ofplants in the coastal filter. Mar Ecol Prog Ser 348: 1−18
Meyercordt J, Meyer-Reil LA (1999) Primary production ofbenthic microalgae in two shallow coastal lagoons of dif-ferent trophic status in the southern Baltic Sea. Mar EcolProg Ser 178: 179−191
Meyercordt J, Gerbersdorf S, Meyer-Reil LA (1999) Signifi-cance of pelagic and benthic primary production in twoshallow coastal lagoons of different degrees of eutrophi-cation in the southern Baltic Sea. Aquat Microb Ecol 20: 273−284
Middelburg JJ, Klaver G, Nieuwenhuize J, Wielemaker A,de Haas W, Vlug T, van der Nat JFWA (1996) Organicmatter mineralization in intertidal sediments along anestuarine gradient. Mar Ecol Prog Ser 132: 157−168
Miller WD, Neubauer SC, Anderson IC (2001) Effects of sealevel induced disturbances on high salt marsh metabo-lism. Estuaries 24(3):357–367
Murrell MC, Campbell JG, Hagy JD, Caffrey JM (2009)Effects of irradiance on benthic and water column pro-cesses in a Gulf of Mexico estuary: Pensacola Bay,Florida, USA. Estuar Coast Shelf Sci 81: 501−512
Neikirk BB (1996) Exchanges of dissolved inorganic nitro-gen and dissolved organic carbon between salt marshsediments and overlying tidal water. MSc thesis, Collegeof William and Mary, Virginia Institute of Marine Sci-ence, Gloucester Point, VA
Neubauer SC, Anderson IC (2003) Transport of dissolvedinorganic carbon from a tidal freshwater marsh to theYork River Estuary. Limnol Oceanogr 48: 299−307
Nixon SW (1995) Coastal marine eutrophication: a defini-tion, social causes, and future concerns. Ophelia 41: 199−219
Nixon S, Buckley B, Granger S, Bintz J (2001) Response ofvery shallow marine ecosystems to nutrient enrichment.Hum Ecol Risk Assess 7: 1457−1481
Odum HT, Hoskins CM (1958) Comparative studies of themetabolism of marine waters. Publ Inst Mar Sci Texas 5: 16−46
Oviatt CA, Rudnick DT, Keller AA, Sampou PA, AlmquistGT (1986) A comparison of system (O2 and CO2) and C-14 measurements of metabolism in estuarine mesocosms.Mar Ecol Prog Ser 28: 57−67
Peckol P, Rivers JS (1996) Contribution by macroalgal matsto primary production of a shallow embayment underhigh and low nitrogen loading rates. Estuar Coast ShelfSci 43: 311−325
Pemberton M, Anderson GL, Barker JH (1996) Characteri-
zation of microvascular vasoconstriction followingischemia/ reperfusion in skeletal muscle using videomi-croscopy. Microsurgery 17: 9−16
Pinckney J, Zingmark RG (1993) Biomass and production ofbenthic microalgal communities in estuarine habitats.Estuaries 16: 887−897
Quinn GP, Keough MJ (2002) Experimental design and dataanalysis for biologists. Cambridge University Press,Cambridge
Reyes E, Merino M (1991) Diel dissolved oxygen dynamicsand eutrophication in a shallow, well-mixed tropicallagoon (Cancun, Mexico). Estuaries 14: 372−381
Rochelle-Newall EJ, Winter C, Barron C, Borges AV andothers (2007) Artificial neural network analysis of factorscontrolling ecosystem metabolism in coastal systems.Ecol Appl 17: S185−S196
Russell MJ, Montagna PA (2007) Spatial and temporal vari-ability and drivers of net ecosystem metabolism in West-ern Gulf of Mexico estuaries. Estuar Coasts 30: 137−153
Santos R, Silva J, Alexandre A, Nuvarro N, Barron C, DuarteCM (2004) Ecosystem metabolism and carbon fluxes of atidally-dominated coastal lagoon. Estuaries 27: 977−985
Shaffer GP, Sullivan MJ (1988) Water column productivityattributable to displaced benthic diatoms in well-mixedshallow estuaries. J Phycol 24: 132−140
Shoaf WT, Lium BW (1976) Improved extraction of chloro-phyll a and b from algae using dimethyl sulfoxide. Lim-nol Oceanogr 21: 926−928
Smith P, Bogren K (2001) Determination of nitrate and/ornitrite in brackish or seawater by flow injection analysiscolorimetry. QuikChem Method 31-107-04-1-E. LachatInstruments, Milwaukee, WI
Smith SV, Hollibaugh JT (1997) Annual cycle and interan-nual variability of ecosystem metabolism in a temperateclimate embayment. Ecol Monogr 67: 509−533
Smith EM, Kemp WM (2001) Size structure and the produc-tion/respiration balance in a coastal plankton commu-nity. Limnol Oceanogr 46: 473−485
Stanhope JW, Anderson IC, Reay WG (2009) Base flownutrient discharges from lower Delmarva Peninsulawatersheds of Virginia, USA. J Environ Qual 38: 2070−2083
Stutes AL, Cebrian J, Corcoran AA (2006) Effects of nutrientenrichment and shading on sediment primary productionand metabolism in eutrophic estuaries. Mar Ecol ProgSer 312: 29−43
Tobias CR, Cieri M, Peterson BJ, Deegan LA, Vallino J,Hughes J (2003) Processing watershed-derived nitrogenin a well-flushed New England Estuary. LimnolOceanogr 48: 1766−1778
Trimmer M, Nedwell DB, Sivyer DB, Malcolm SJ (2000) Sea-sonal organic mineralisation and denitrification in inter-tidal sediments and their relationship to the abundanceof Enteromorpha sp. and Ulva sp. Mar Ecol Prog Ser 203: 67−80
Tyler AC, McGlathery KJ, Anderson IC (2001) Macroalgaemediation of dissolved organic nitrogen fluxes in a tem-perate coastal lagoon. Estuar Coast Shelf Sci 53: 155−168
Tyler AC, McGlathery KJ, Anderson IC (2003) Benthic algaecontrol sediment: water column fluxes of organic andinorganic nitrogen compounds in a temperate lagoon.Limnol Oceanogr 48: 2125−2137
Valiela I, Foreman K, LaMontagne M, Hersh D and others(1992) Couplings of watersheds and coastal waters: sources and consequences of nutrient enrichment in
37

Mar Ecol Prog Ser 458: 21–38, 2012
Waquoit Bay, Massachusetts. Estuaries 15: 443−457Valiela I, McClelland J, Hauxwell J, Behr PJ, Hersh D, Fore-
man K (1997) Macroalgal blooms in shallow estuaries: controls and ecophysiological and ecosystem conse-quences. Limnol Oceanogr 42: 1105−1118
Viaroli P, Christian RR (2003) Description of trophic status,hyperautotrophy and dystrophy of a coastal lagoonthrough a potential oxygen production and consumptionindex — TOSI: Trophic Oxygen Status Index. Ecol Indic3: 237−250
38
Editorial responsibility: Matthias Seaman,Oldendorf/Luhe, Germany
Submitted: July 24, 2010; Accepted: March 12, 2012Proofs received from author(s): June 23, 2012