Embed Size (px)
Citation preview
Economics of Transporting and Processing Tar Sands Crudes in Quebec
PrePared by The Goodman GrouP, LTd.
in CoLLaboraTion wiTh ÉquiTerre and GreenPeaCe Canada
January 2014
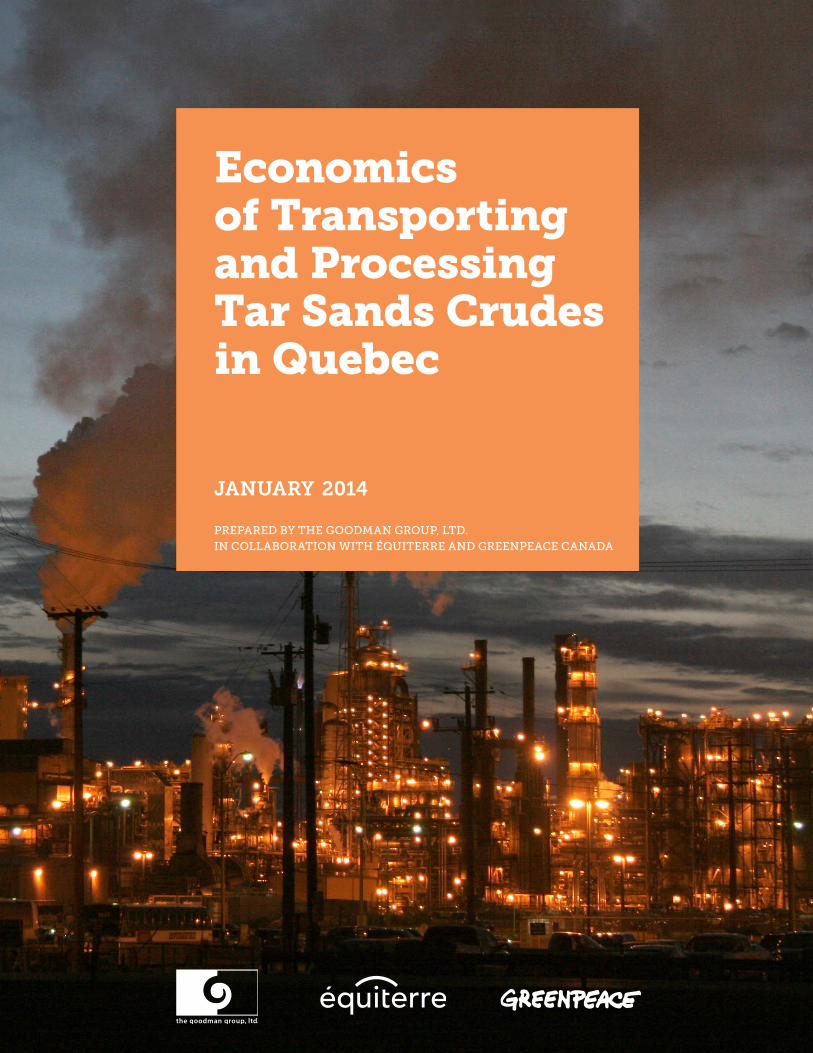
Table of Contents
1. Executive Summary . . . . . . 1
2.
a. Key Players: Tar Sands Proponents, Quebec refineries, Governments and the Public . . . . . . . . . . . . . . . . . . . . . . . . . . . . . 7
b. Main Proposed Projects to Transport Tar Sands Crude to and through Quebec . . . . . . . . . . . . . . . . . . . 8
Enbridge Line 9B Reversal and Expansion (Sarnia/Westover, ON to Montreal, 300k bpd) . . . 8
TransCanada Energy East (AB to QC/NB, now upsized to 1100k bpd) . . . . . . . . . . . . . . . . . . . 11
c. Other Options to Transport Tar Sands Crude to and through Quebec . . . . . . . . . . . . . . . . . . . . 12
Portland-Montreal Pipe Line (PMPL) . . . . . . . . . . . 12
Crude by Rail. . . . . . . . . . . . . . . . . . . . . . . . . . . . . . . . 12
Marine Transport/Tankers . . . . . . . . . . . . . . . . . . . . 13
d. available refining Capacity in Quebec for Tar Sands Crudes . . . . . . . . 13
Context . . . . . . . . . . . . . . . . . . . . . . . 5
3.Benefits from Transport and Processing of Tar Sands Crudes . . . . . . . . 16
a. Myth: Processing Tar Sands in Quebec Will result in Lower Prices at the Pump . . . . . . . . . . . . 18
b. Myth: Processing Tar Sands in Quebec Will result in Economic Development for Quebec . . . . . . . . . . . . . . . . 19
Minimal Economic Development from Processing Tar Sands Crudes in Quebec Refineries . . . . . . . . . . . . . . . . . . . . . . . . 19
Minimal Economic Development from Tar Sands Crudes and the Montreal East Petrochemical Complex . . . . . . . . . . . . . . . . . . . . . . 22
Minimal Economic Development from Pipeline Construction and Operations in Quebec . . . . . . . . . . . . . . . . . . . 22
Healthy and Sustainable Economic Development Alternatives . . . . . . . . . . . . . . . . . . . . 23
c. Myth: using Quebec as a Tar Sands Conduit Will result in Economic Development for Quebec . . . . . . . . . . . . . . . . . .25
Minimal Economic Development from Use of Quebec Ports . . . . . . . . . . . . . . . . . . . . 25
Minimal Economic Development from Pipeline Construction and Operations in Quebec . . . . . . . . . . . . . . . . . . . 25
d. Benefits Flow to Tar Sands Proponents and refineries not Quebec Consumers . . . . . . . . . . . . . . . . . 26
PaGE II
Table of Contents
4.Risks and Costs of Transport and Processing of Tar Sands Crudes . . . . 27
a. risks/Costs of Transport and Processing Tar Sands Crudes in Quebec . . . . . . . . . . . . . . . . . . . . . . . . . . . . . . . . .28
b. risk/Costs assumed by Quebec Citizens not by Tar Sands Proponents and Pipeline Companies . . . . . . . . . . . . . . . . . . .30
5.Quebec at the Crossroads for Enabling Tar Sands Expansion: A Serious Societal Choice . . . . . . . . . . . 32
6. Conclusion . . . . . . . . . . . . . . . . 35
Endnotes . . . . . . . . . . . . . . . . . . . 37
Acronyms List
bpd barrels per day
CaPP Canadian association of Petroleum Producers
GhG Greenhouse Gas
neb national energy board
PmPL Portland montreal Pipe Line
row right of way
SCo Synthetic Crude oil
TC TransCanada
TGG The Goodman Group
COvEr PaGE:
upgrader portion of the Syncrude Mildred Lake complex, alberta.© GREENPEACE / E M
PaGES II anD III:
Tar sands tailings ponds, north of Fort McMurray.© GREENPEACE / E M
PaGE III
Economics of Transporting and Processing Tar Sands Crudes in QuebecBrigid Rowan and Ian Goodman, The Goodman Group, Ltd., in Collaboration with Équiterre and Greenpeace Canada January 2014
Proofreading: Anne-Marie Legault, Marie-Ève Roy Translation: Nicolas Soumis design: Diane Héroux Cover page photo: © Greenpeace/EM
© 2014 The Goodman Group, Ltd., Équiterre and Greenpeace Canada all rights reserved. This document may be reproduced or quoted freely, in whole or in part for non commercial purposes, provided the source is mentioned.
how to cite this report: rowan, brigid and ian Goodman, The Goodman Group, Ltd., in Collaboration with Équiterre and Greenpeace Canada. economics of Transporting and Processing Tar Sands Crudes in quebec. 2014. iSbn 978-0-9881031-4-6
Équiterre Greenpeace CanadaCentre for Sustainable development 454 Laurier east 50 Ste-Catherine St. west, suite 340 montreal, quebec h2J 1e7 montreal, quebec h2X 3V4 Canada Canada Phone: 514-933-0021 Phone: 514-522-2000
you can download this document from Équiterre’s or Greenpeace Canada’s website: www.equiterre.org or www.greenpeace.org/canada/
About The Goodman Group, Ltd. The Goodman Group, Ltd. (TGG) is a consulting firm specializing in energy and regulatory economics, economic development and support to counsel.
Since 1989, TGG has consulted and conducted economic research across a broad range of issues. our north american-wide client base includes energy sector companies, regulators, government, customer groups, and environmental and indigenous groups. The common thread in TGG’s consulting practice is the application of economic principles to provide studies, policy assessments, expert evidence, intervenor and litigation support for our various clients.
recently, TGG showed the obama administration that proponents of the Keystone XL pipeline had greatly exaggerated the economic benefits of the project, including job-creation numbers. ian Goodman and brigid rowan of TGG also filed expert testimony at the neb on the economic costs and benefits of enbridge’s Line 9b reversal and Line 9 Capacity expansion Project.
Visit www.thegoodman.com for more information.
About GreenpeaceGreenpeace is an independent global campaigning organization that acts to change attitudes and behaviour, to protect and conserve the environment and to promote peace. Visit www.greenpeacecanada.org for more information.
About Équiterreequiterre helps build a social movement by encouraging individuals, organizations and governments to make ecological and equitable choices, in a spirit of solidarity. Visit www.equiterre.org/en for more information.
Make a donation…To Greenpeace: Support our work today! Greenpeace is an independent organization that does not take money from corporations or government. we rely on individual donations from people just like you to do the work we do.
Yes, I’m supporting Greenpeace!
To Équiterre: equiterre’s consulting, awareness-raising and research projects offer concrete solutions to promote human and environmental health, social justice and community development at home and abroad. we also advocate publicly on environmental and social issues, encouraging decision makers to adopt laws and practices that will contribute to a society that is sustainable and fair. are you concerned about climate change?
Join the movement: make a donation to Equiterre.
PaGE Iv
PaGE 1
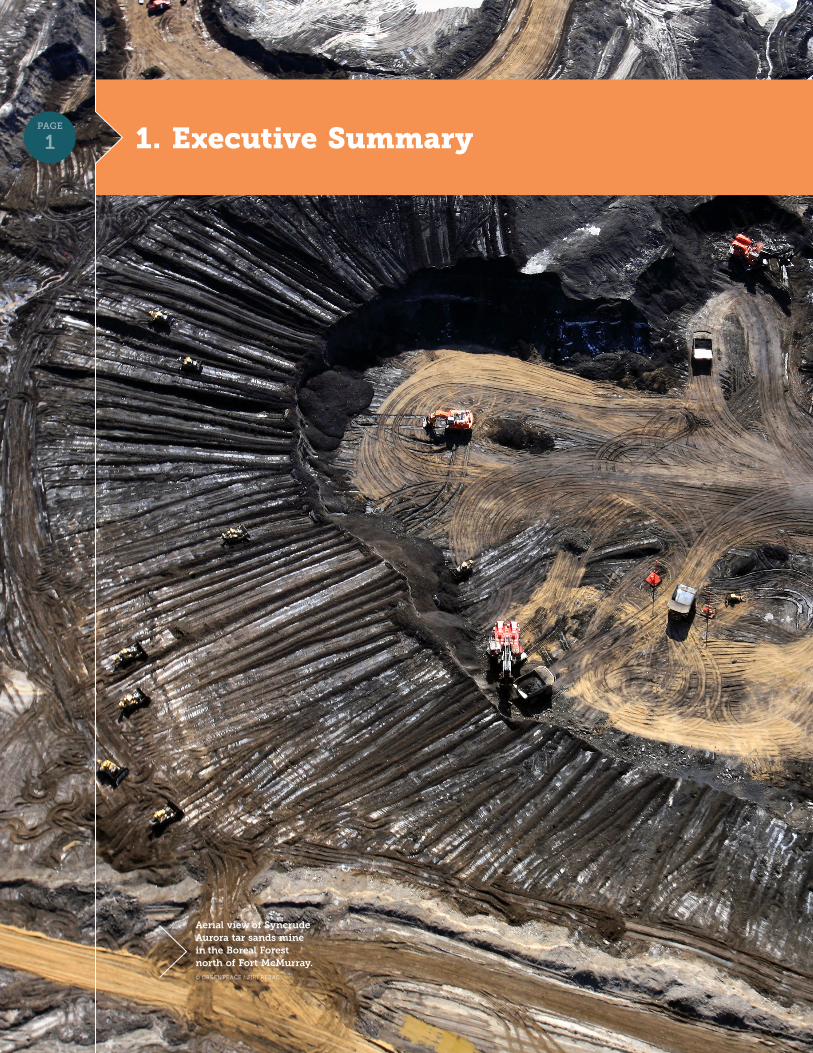
aerial view of Syncrude aurora tar sands mine in the Boreal Forest north of Fort McMurray.© GREENPEACE / JiRi REzAC
1. Executive SummaryPaGE 1
PaGE 2
1. SuMMary ECONOMiCS Of TRANSPORTiNG AND PROCESSiNG TAR SANDS CRUDES iN QUEBEC
This report examines the economics of transporting and processing
alberta tar sands crudes in quebec. in particular, we focus on
the benefits and costs to quebec of these activities, and address
the widespread uncertainty and disagreement as to how quebec could be
affected by crudes from the tar sands.
Tar sands proponents claim that quebec will benefit from transport and
processing of tar sands crudes, notably in terms of lower fuel (gasoline) prices
and economic development (jobs and other spinoffs).1 in fact, more involvement
in the tar sands would provide few (if any) benefits for quebec, but would
expose quebec to substantial risks, costs, and negative environmental impacts.
The report responds to the claims being made by tar sands proponents
and explains why quebec will not receive any significant benefits from more
involvement with tar sands crudes, but will bear almost all of the risk/cost of
spills and other environmental impacts. Conversely, tar sands proponents, will
receive almost all of the benefits and bear little, if any, environmental risk/cost.
The crude oil sector (including transport and refining/processing) is currently
a minuscule proportion of the overall quebec economy and jobs. even if all
the proposed tar-sands-related projects were approved (the reversal of Line 9b,
energy east and the Suncor coker), the crude oil sector would remain tiny.
based on data and analyses from the tar sands proponents and Statistics
Canada, this report has determined that the overall contribution of the crude
oil sector is 0.50% (or less) of the total quebec economy and 0.30% (or less) of
total quebec jobs. if all the proposed projects were approved, the contribution
related to operating activities for the entire crude oil sector would likely remain
about 0.50% (or less) of the total economy and 0.30% (or less) of total jobs.
as will be discussed in the report, with or without the Line 9b reversal and
energy east, quebec’s two refineries can remain open and will likely improve
profitability. The incremental economic development impact (in terms of
employment and other spinoff economic activity) from operations associated
with these proposed projects is insignificant.
The economic development impact associated with the capital investments
required for the new projects (i.e. employment and spinoffs related to building
the proposed pipelines, marine terminals and the Suncor coker) would have
a small short-term effect on the quebec economy. if all the proposed projects
were approved, the economic contribution to the quebec economy related
to capital investment activities would be approximately 0.20% per year for the
four or more year period of the capital investments.2 as will be explained later,
there are approximately 8 person-years of quebec employment per $1 million
invested in pipeline construction and refinery upgrade projects.
Tar sands proponents are pushing for projects with minuscule economic and
employment benefits for quebec and a big environmental and risk footprint.
by accepting to be a conduit and/or an upgrader for tar sands, quebec would be
mainly growing its environmental and risk externalities without any offsetting
PaGE 2
PaGE 3
1. SuMMary ECONOMiCS Of TRANSPORTiNG AND PROCESSiNG TAR SANDS CRUDES iN QUEBEC
economic gain. Conversely, tar sands producers which can profit from access
to eastern refinery markets, as well as ocean ports to enable overseas exports),
and refineries (which can profit from lower crude prices at least over the
short and medium term) both stand to make very important economic gains.
The benefits of these projects will thus be privatized and the risks socialized.
instead of following this high-risk, unhealthy economic development strategy,
quebec should instead continue to move towards cleaner energy by increasing
investments in renewables, energy efficiency, public transportation and
transportation electrification. not only would clean energy investments reduce
environmental and risk externalities, but they would allow quebec to reap
more significant and longer-lasting economic development benefits.3
The choices involving quebec and tar sands are very important and very
controversial. The Pq government has promised a decrease in GhG emissions
by 25% below 1990 levels by 2020, as well as a 30% oil reduction by 2020 and
60% by 2030. depending on the choices made over the next few years, quebec’s
involvement in the transport and processing of tar sands crudes could range
from zero/minimal to substantial. in the current evolving context (increasingly
challenging economics of the tar sands and uncertainty regarding other major
pipeline projects), quebec’s choices regarding tar sands have much more
potential to affect tar sands expansion than they would otherwise. if quebec
accepts the proposed projects, this choice will help to shore up the deteriorating
profitability and prospects for tar sands expansion. if quebec refuses the
proposed projects, this will accelerate the shifts away from tar sands expansion
by (a) leaving the tar sands producers pipeline-constrained; (b) discouraging
near-term project development; and (c) giving more time to emerging market
realities (and other factors) to constrain future tar sands expansion.4
in order to make prudent choices and properly protect the public interest,
it is essential to rigorously weigh the benefits against the risks/costs of the
projects and to examine who receives the benefits and who bears the risks/costs.
This report provides a guide for elements to be considered in a decision-making
process regarding quebec’s involvement in the transport and processing of
tar sands crudes. it concludes that turning quebec into a conduit and upgrader
for tar sands crudes allows profits to flow to the tar sands proponents and
refineries, while environmental and risk externalities are borne by the quebec
public. at a time when the concentration of Co2 in the atmosphere has just
passed the milestone level of 400 parts per million (ppm), quebec has the
unique opportunity to constrain the expansion of one of the dirtiest energy
projects on earth while rejecting an unhealthy high-risk economic pathway.
Section 2 describes the context, in which the projects are being proposed to
increase quebec’s involvement with tar sands crudes. This section provides an
overview and an update of (a) the key players (proponents, refineries, governments
and the public); (b) the main proposed projects to transport tar sands crudes to
and through quebec (Line 9b and energy east); and (c) available refining capacity
in quebec for these crudes (Suncor montreal and ultramar St-romuald).5
PaGE 3
PaGE 4
1. SuMMary ECONOMiCS Of TRANSPORTiNG AND PROCESSiNG TAR SANDS CRUDES iN QUEBEC
Section 3 discusses and quantifies the minuscule benefits for the quebec
economy from the transport and processing of tar sands crudes. This section
refutes the myths perpetuated by proponents and the media regarding the
supposed benefits of the proposed projects in terms of lower fuel prices in
quebec and economic development.
The significant risks and costs associated with the transport and processing
of tar sands crudes in quebec are examined in Section 4. This section also
explores how the risks and costs will be borne by the quebec public – and
not by tar sands proponents and refineries. Section 5 describes how in the
current context quebec’s choices regarding tar sands have much more potential
to affect tar sands expansion than they would otherwise. Section 6 contains
the report’s conclusions.
Three significant events have occurred during the preparation of this report,
which further strengthen our findings.
First, the catastrophe at Lac-Mégantic casts a long and tragic shadow over any
consideration of quebec’s energy choices and serves as a sobering reminder of
the dangers of transporting fossil fuel.
Second, major problems with Enbridge’s Line 9 have recently been revealed in
the neb review of the Line 9b reversal project. as will be explained, Line 9 is a
unique pipeline with extraordinary proximity to people, water and economic
activities. There is a high risk (over 90%) that Line 9 will rupture in the early years
of the reversal due the interaction of cracking and corrosion (as demonstrated by
international pipeline safety expert, richard Kuprewicz).6 under a range of
malfunction/accident conditions, the potential costs of the project (estimated by
TGG at $1 billion under a bad-case scenario and at $5-10 billion under a worst-case
scenario) could exceed (and, possibly greatly exceed) the potential benefits
(estimated by TGG at under $1 billion/year and likely under $0.5 billion/year).7
Third, TransCanada announced in August 2013 that it plans to proceed with
the Energy East pipeline. if approved, energy east will be one of the largest crude
oil pipelines in north america, moving 1.1 million barrels per day (bpd) of western
crude through quebec. with energy east, the province will shift from a bystander
to a key actor in the expansion of the tar sands. The authors of this report believe
that quebec is now at a crossroads. one potential path, the approval of energy
east and the Line 9b reversal, locks quebec into a high-risk, dirty energy future,
with insignificant economic benefits for the province. The other path, that of
cleaner energy (with increased investment in renewables, energy efficiency and
public transportation), will result in a healthier more sustainable economy. quebec’s
energy strategy should not be reduced to the grim choice of pipelines versus rail.
instead, quebec now faces a stark and important choice: a clean energy path to
a sustainable future versus a high-risk dirty energy path to an unhealthy economy.
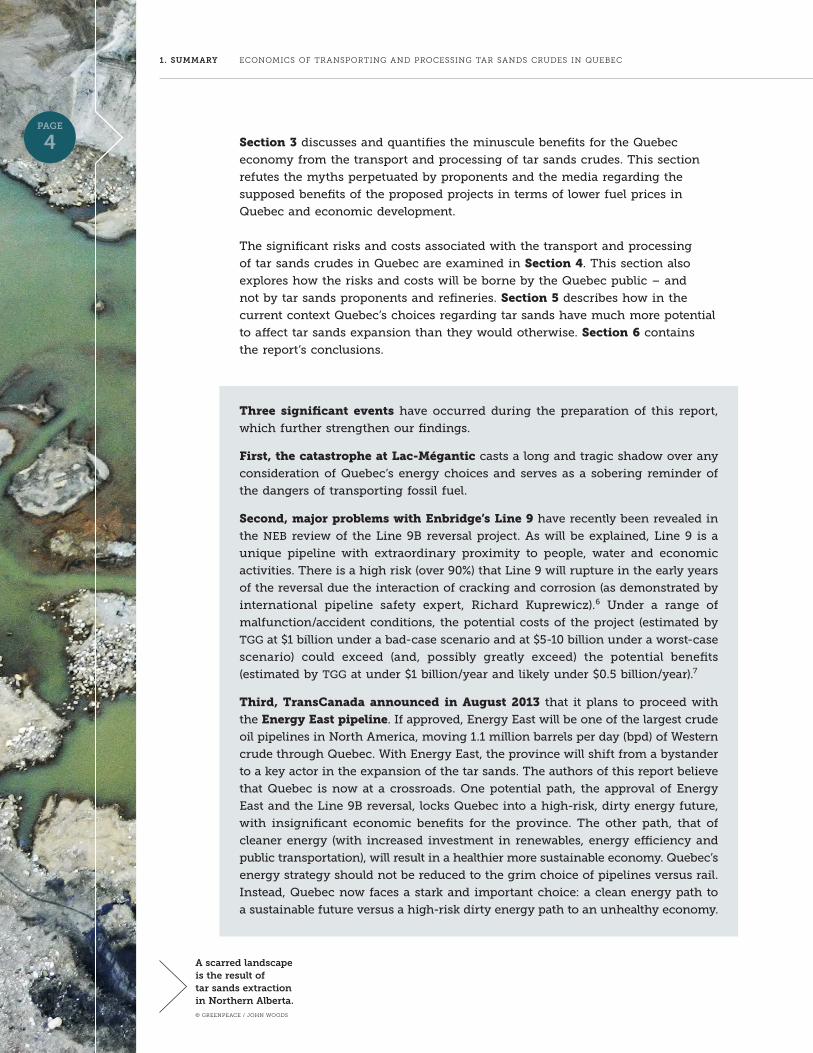
a scarred landscape is the result of tar sands extraction in northern alberta.© GREENPEACE / JOHN WOODS
PaGE 4
PaGE 5
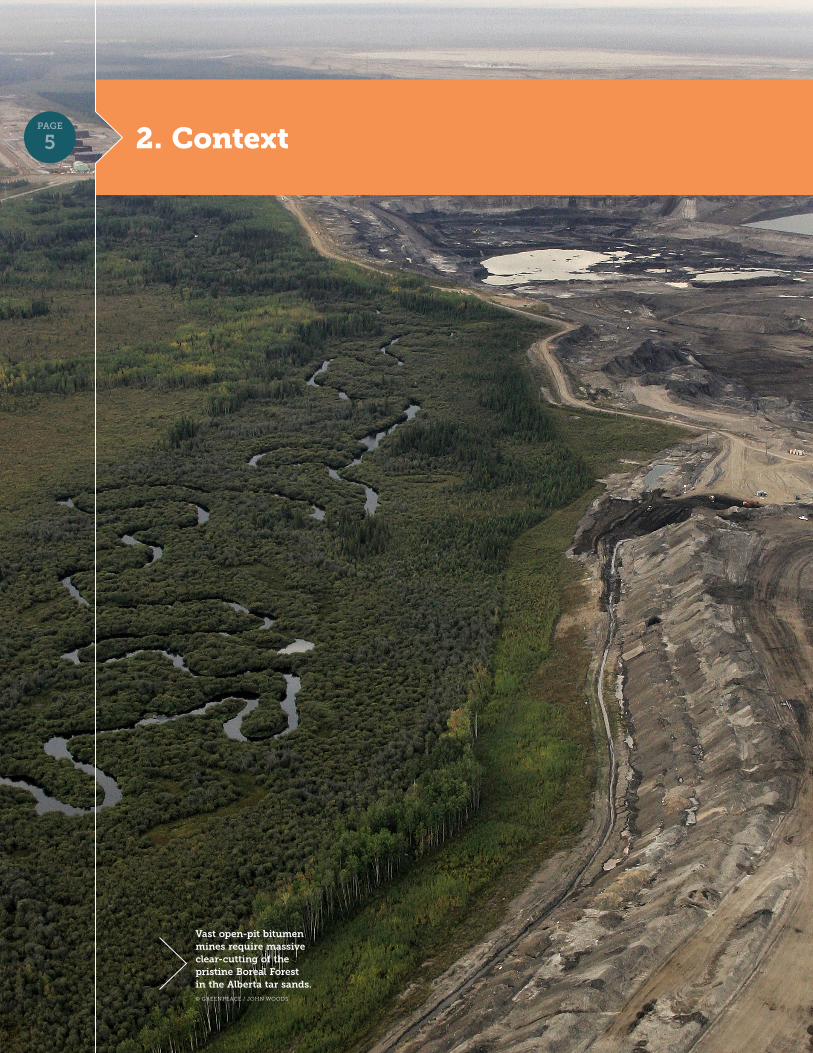
vast open-pit bitumen mines require massive clear-cutting of the pristine Boreal Forest in the alberta tar sands.© GREENPEACE / JOHN WOODS
2. ContextPaGE 5
PaGE 6
2. COnTExT ECONOMiCS Of TRANSPORTiNG AND PROCESSiNG TAR SANDS CRUDES iN QUEBEC
in order to better evaluate the benefits and costs of quebec involvement
with tar sands crudes, this section provides an overview and an update
of (a) the key players; (b) the main proposed projects to transport tar sands
crudes to and through quebec; and (c) available refining capacity in quebec for
these crudes. Tar sands crudes are not currently being transported or processed
in quebec,9 but this could soon change. Pipelines are by far the preferred option
of the industry for crude transport (especially for tar sands), because pipelines
have relatively low costs and high capacity. due to massive and unrestricted
expansion in recent years, coupled with a remote and disadvantageous location
in landlocked alberta, tar sands producers are currently pipeline-constrained
and face considerable discounts in selling their products.
TranS CanaDa EnErGy EaST
TranS MOunTaIn ExPanSIOn
nOrThErn GaTEWay
KEySTOnE xL
KEySTOnE
EnBrIDGE MaInLInE
ranGELanD & MILK rIvEr
WESTErn CanaDIan rEFInErIES
TranS MOunTaInExPrESS
aLBErTa CLIPPEr ExPanSIOn
aLBErTa CLIPPEr ExPanSIOnraIL CurrEnT CaPaCITy OnLy
Western Canadian supply + u.S. Bakken movements
9.0
8.0
7.0
6.0
5.0
4.0
3.0
2.0
1.0
02012 2014 2016 2018 2020 2022 2024 2026 2028 2030
Capacity shown can be reduced by temporary operating and physical constraints.
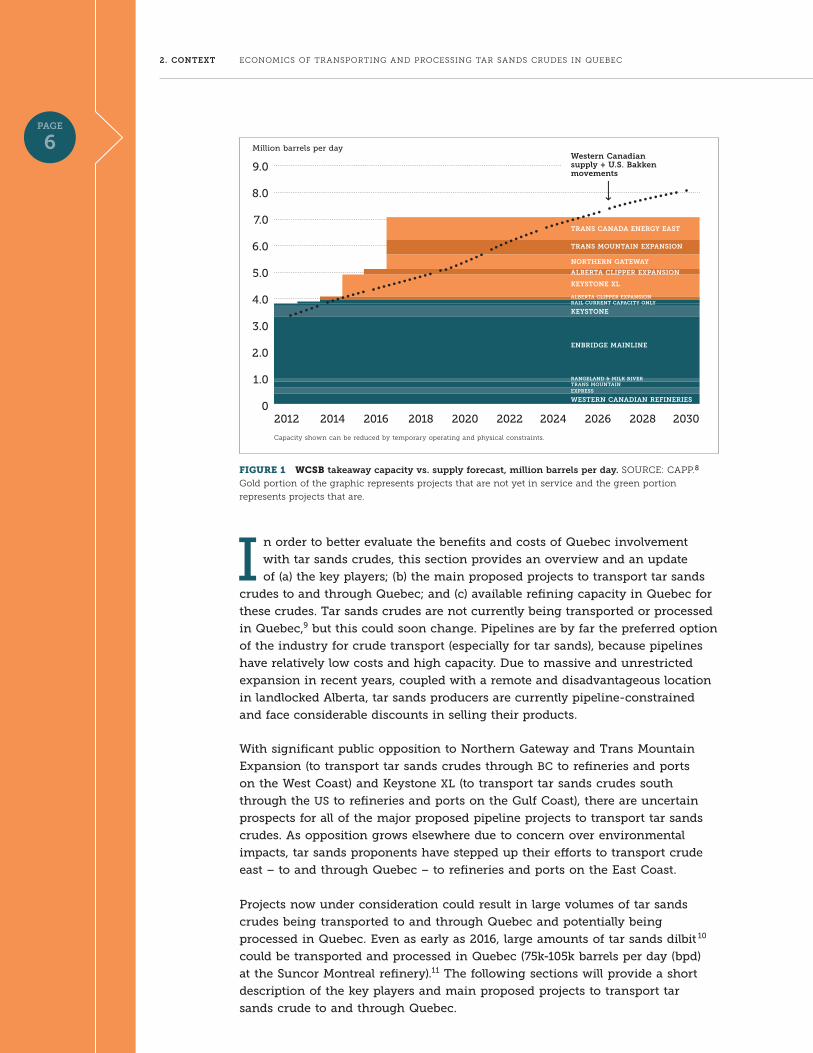
FIGURE 1 WCSB takeaway capacity vs. supply forecast, million barrels per day. SOURCE: CAPP.8
Gold portion of the graphic represents projects that are not yet in service and the green portion
represents projects that are.
with significant public opposition to northern Gateway and Trans mountain
expansion (to transport tar sands crudes through bC to refineries and ports
on the west Coast) and Keystone XL (to transport tar sands crudes south
through the uS to refineries and ports on the Gulf Coast), there are uncertain
prospects for all of the major proposed pipeline projects to transport tar sands
crudes. as opposition grows elsewhere due to concern over environmental
impacts, tar sands proponents have stepped up their efforts to transport crude
east − to and through quebec − to refineries and ports on the east Coast.
Projects now under consideration could result in large volumes of tar sands
crudes being transported to and through quebec and potentially being
processed in quebec. even as early as 2016, large amounts of tar sands dilbit 10
could be transported and processed in quebec (75k-105k barrels per day (bpd)
at the Suncor montreal refinery).11 The following sections will provide a short
description of the key players and main proposed projects to transport tar
sands crude to and through quebec.
PaGE 6 million barrels per day
PaGE 7
2. COnTExT ECONOMiCS Of TRANSPORTiNG AND PROCESSiNG TAR SANDS CRUDES iN QUEBEC
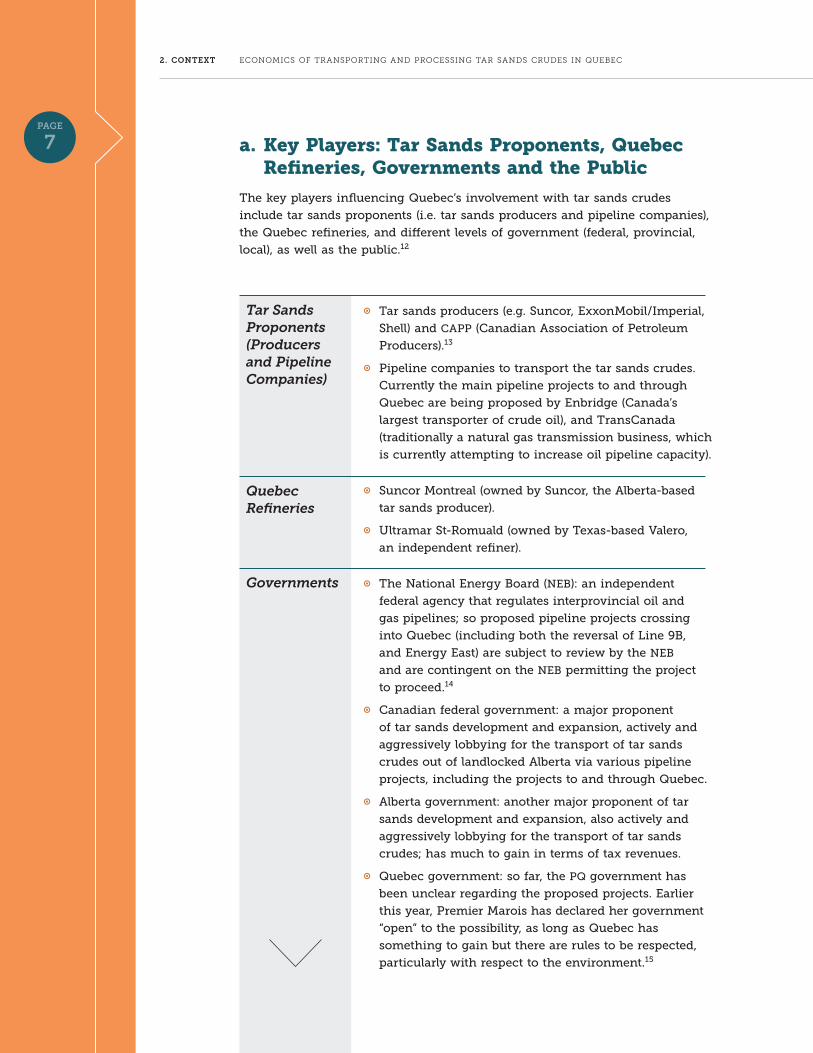
a. Key Players: Tar Sands Proponents, Quebec Refineries, Governments and the Public
The key players influencing quebec’s involvement with tar sands crudes
include tar sands proponents (i.e. tar sands producers and pipeline companies),
the quebec refineries, and different levels of government (federal, provincial,
local), as well as the public.12
Tar Sands Proponents (Producers and Pipeline Companies)
Quebec Refineries
Governments
A Tar sands producers (e.g. Suncor, exxonmobil/imperial,
Shell) and CaPP (Canadian association of Petroleum
Producers).13
A Pipeline companies to transport the tar sands crudes.
Currently the main pipeline projects to and through
quebec are being proposed by enbridge (Canada’s
largest transporter of crude oil), and TransCanada
(traditionally a natural gas transmission business, which
is currently attempting to increase oil pipeline capacity).
A Suncor montreal (owned by Suncor, the alberta-based
tar sands producer).
A ultramar St-romuald (owned by Texas-based Valero,
an independent refiner).
A The national energy board (neb): an independent
federal agency that regulates interprovincial oil and
gas pipelines; so proposed pipeline projects crossing
into quebec (including both the reversal of Line 9b,
and energy east) are subject to review by the neb
and are contingent on the neb permitting the project
to proceed.14
A Canadian federal government: a major proponent
of tar sands development and expansion, actively and
aggressively lobbying for the transport of tar sands
crudes out of landlocked alberta via various pipeline
projects, including the projects to and through quebec.
A alberta government: another major proponent of tar
sands development and expansion, also actively and
aggressively lobbying for the transport of tar sands
crudes; has much to gain in terms of tax revenues.
A quebec government: so far, the Pq government has
been unclear regarding the proposed projects. earlier
this year, Premier marois has declared her government
“open” to the possibility, as long as quebec has
something to gain but there are rules to be respected,
particularly with respect to the environment.15
PaGE 7
PaGE 8
2. COnTExT ECONOMiCS Of TRANSPORTiNG AND PROCESSiNG TAR SANDS CRUDES iN QUEBEC
A quebec local governments: many regional and
municipal governments have expressed concern
about the safety and environmental impacts related
to the transport and processing of tar sands crudes.16
A There is growing public awareness, concern and
opposition in quebec about the environmental
and safety impacts of producing, transporting and
processing tar sands crudes. So far, 20 municipalities
have written to the quebec Government calling on
them to conduct on independent environmental
impact assessment.
A as in bC (with northern Gateway) and in the uS
(with Keystone XL), citizen activism in quebec could
delay or even stop these projects.
PaGE 8 Governments
(continued)
Public
b. Main Proposed Projects to Transport Tar Sands Crude to and through Quebec
Pipelines have been proposed that could move tar sands crudes to/through
quebec:
Enbridge Line 9B Reversal and Expansion (Sarnia/Westover, ON to Montreal, 300k bpd)
A existing 762 mm/30” crude pipeline (built in the mid-1970s) would
be reversed to flow west to east and capacity increased from 240k
to 300k bpd by adding more pumping and using dra (drag reducing
agent to reduce friction).
A both quebec refineries (Suncor montreal and ultramar St-romuald)
have contracted to transport crude on Line 9.
A Line 9 could also be a conduit to export crude through quebec as
there is no requirement that these refineries have to process the crude
in quebec.
A application filed in late 2012 and now being reviewed by the neb –
approval could be as early as winter 2014 with project in-service
in summer 2014.17
A enbridge is seeking permission to move heavy crude as well as lighter
crudes. Line 9 flowing east to west has moved only lighter crudes.
A Tar sands crudes include both heavy (dilbit) and light (SCo).18
heavy crude moved in Line 9 is likely to be tar sands dilbit.
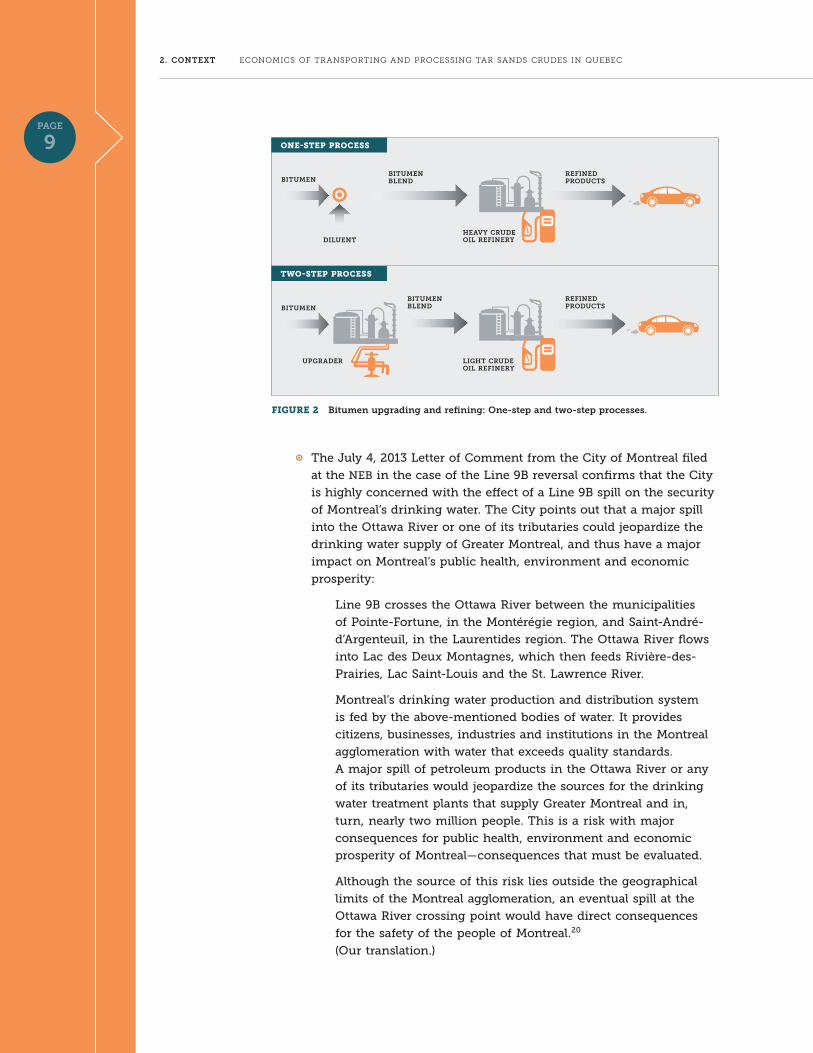
A Line 9 crosses the ottawa river near rigaud and Saint-Placide,
upstream of the intakes which provide domestic water supply to
island of montreal municipalities.19
PaGE 9
2. COnTExT ECONOMiCS Of TRANSPORTiNG AND PROCESSiNG TAR SANDS CRUDES iN QUEBEC
PaGE 9
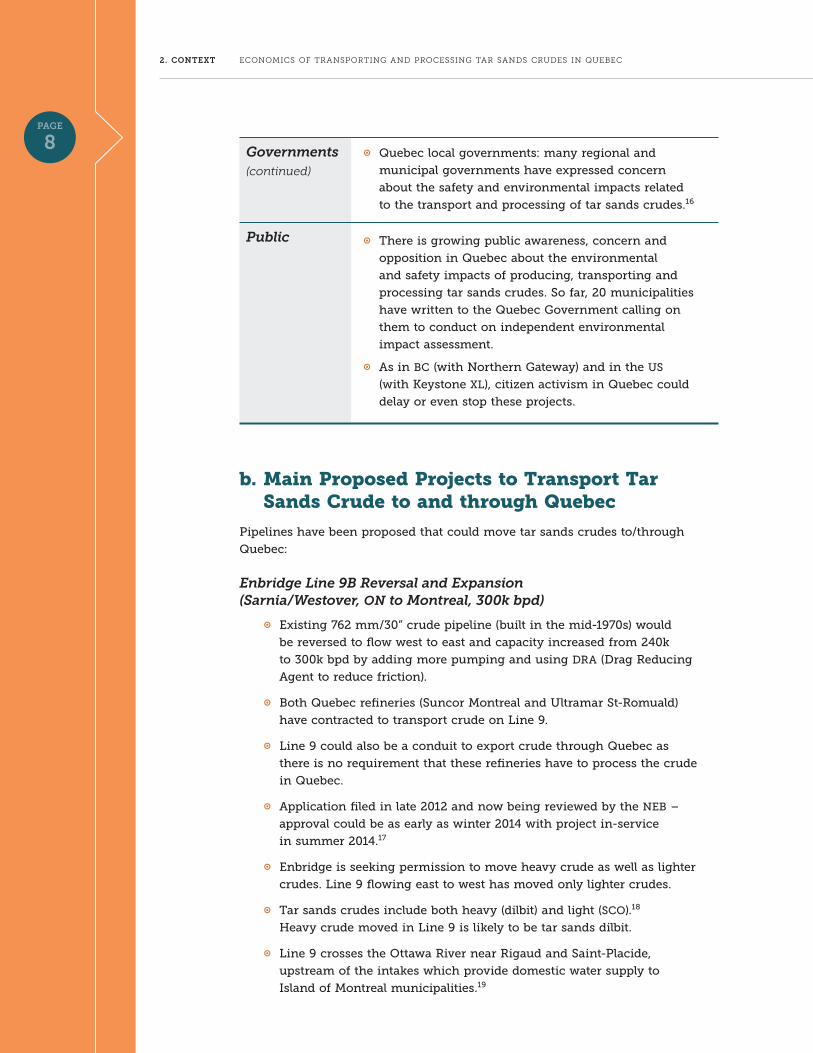
FIGURE 2 Bitumen upgrading and refining: One-step and two-step processes.
BITuMEn
DILuEnThEavy CruDE OIL rEFInEry
A
oNE-STEP PRoCESS
BITuMEnBITuMEn BLEnD
BITuMEn BLEnD
uPGraDEr LIGhT CruDE OIL rEFInEry
rEFInED PrODuCTS
rEFInED PrODuCTS
TWo-STEP PRoCESS
A The July 4, 2013 Letter of Comment from the City of montreal filed
at the neb in the case of the Line 9b reversal confirms that the City
is highly concerned with the effect of a Line 9b spill on the security
of montreal’s drinking water. The City points out that a major spill
into the ottawa river or one of its tributaries could jeopardize the
drinking water supply of Greater montreal, and thus have a major
impact on montreal’s public health, environment and economic
prosperity:
Line 9b crosses the ottawa river between the municipalities
of Pointe-Fortune, in the montérégie region, and Saint-andré-
d’argenteuil, in the Laurentides region. The ottawa river flows
into Lac des deux montagnes, which then feeds rivière-des-
Prairies, Lac Saint-Louis and the St. Lawrence river.
montreal’s drinking water production and distribution system
is fed by the above-mentioned bodies of water. it provides
citizens, businesses, industries and institutions in the montreal
agglomeration with water that exceeds quality standards.
a major spill of petroleum products in the ottawa river or any
of its tributaries would jeopardize the sources for the drinking
water treatment plants that supply Greater montreal and in,
turn, nearly two million people. This is a risk with major
consequences for public health, environment and economic
prosperity of montreal—consequences that must be evaluated.
although the source of this risk lies outside the geographical
limits of the montreal agglomeration, an eventual spill at the
ottawa river crossing point would have direct consequences
for the safety of the people of montreal.20
(our translation.)
PaGE 10
2. COnTExT ECONOMiCS Of TRANSPORTiNG AND PROCESSiNG TAR SANDS CRUDES iN QUEBEC
FIGURE 3 Line 9B reversal project. December 2012. SOURCE: Enbridge. http://www.enbridge.com/Line9BReversalProject.aspx
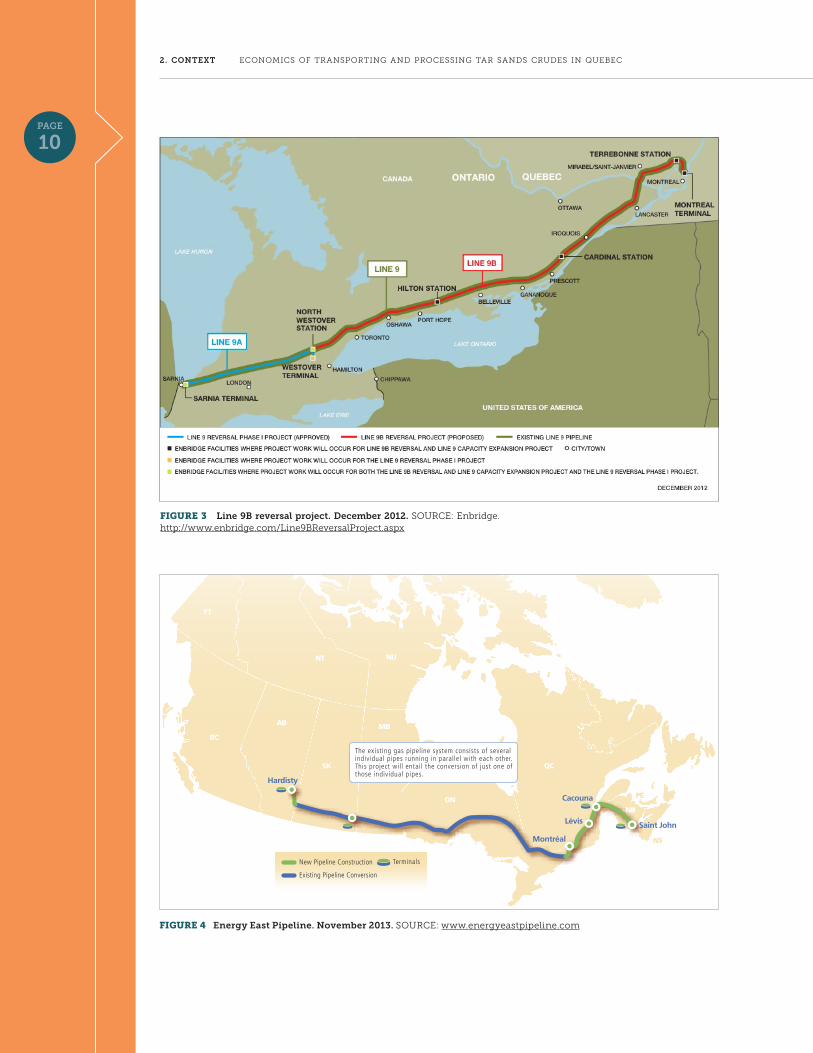
FIGURE 4 Energy East Pipeline. november 2013. SOURCE: www.energyeastpipeline.com
MBAB
BC
YT
SK
NT NU
ON
QC
PE
NB
NS
Existing Pipeline Conversion
New Pipeline Construction Terminals
Hardisty
Montréal
The existing gas pipeline system consists of several individual pipes running in parallel with each other. This project will entail the conversion of just one of those individual pipes.
Saint John
Cacouna
Lévis
PaGE 11
2. COnTExT ECONOMiCS Of TRANSPORTiNG AND PROCESSiNG TAR SANDS CRUDES iN QUEBEC
A The pipeline traverses the northern montreal metropolitan region,
and extensive suburban development (notably around mirabel and
Terrebonne), in part paralleling autoroute 640. along its eastern end,
Line 9 cuts through a mix of suburban, urban, and industrial areas in
Laval, montreal, and montreal east. The narrow pipeline right of way
is often in very close proximity to houses and other development.
A Coming into montreal, Line 9 crosses major water bodies (notably
rivière des milles Îles and rivière des Prairies). Virtually all of the
St. Lawrence in quebec is downstream of Line 9 water crossings
(around montreal and upstream at the ottawa river).21
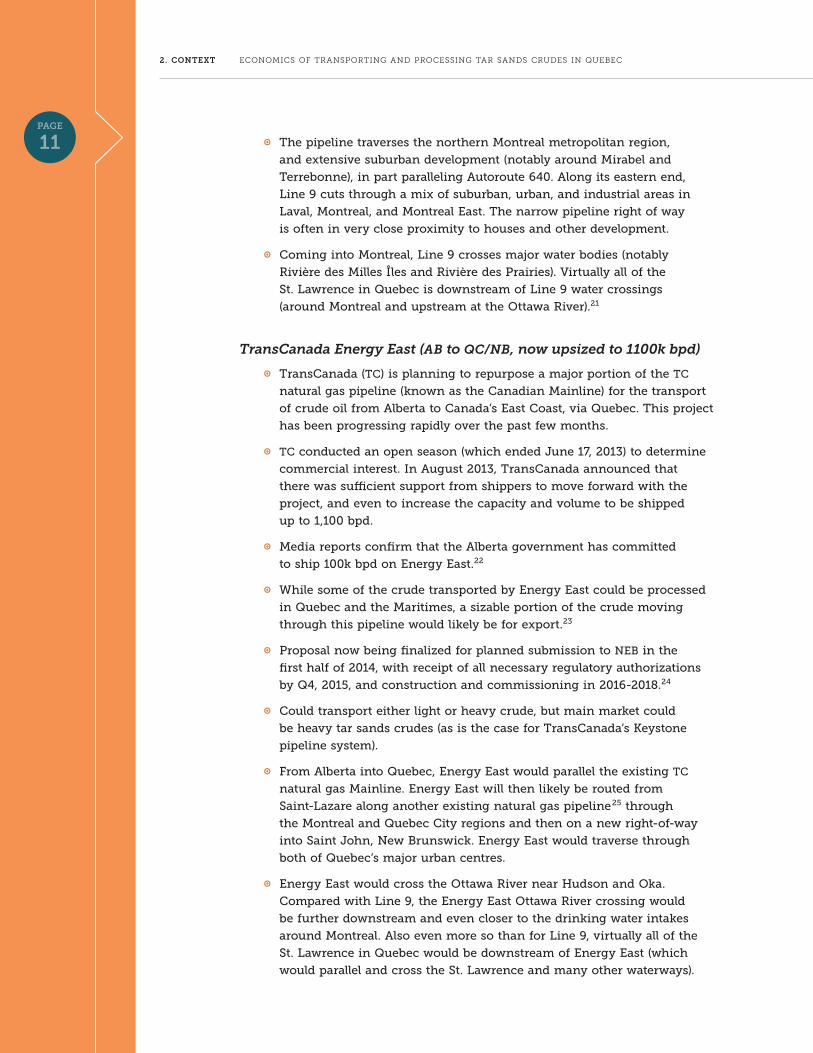
TransCanada Energy East (AB to QC/NB, now upsized to 1100k bpd)
A TransCanada (TC) is planning to repurpose a major portion of the TC
natural gas pipeline (known as the Canadian mainline) for the transport
of crude oil from alberta to Canada’s east Coast, via quebec. This project
has been progressing rapidly over the past few months.
A TC conducted an open season (which ended June 17, 2013) to determine
commercial interest. in august 2013, TransCanada announced that
there was sufficient support from shippers to move forward with the
project, and even to increase the capacity and volume to be shipped
up to 1,100 bpd.
A media reports confirm that the alberta government has committed
to ship 100k bpd on energy east.22
A while some of the crude transported by energy east could be processed
in quebec and the maritimes, a sizable portion of the crude moving
through this pipeline would likely be for export.23
A Proposal now being finalized for planned submission to neb in the
first half of 2014, with receipt of all necessary regulatory authorizations
by q4, 2015, and construction and commissioning in 2016-2018.24
A Could transport either light or heavy crude, but main market could
be heavy tar sands crudes (as is the case for TransCanada’s Keystone
pipeline system).
A From alberta into quebec, energy east would parallel the existing TC
natural gas mainline. energy east will then likely be routed from
Saint-Lazare along another existing natural gas pipeline25 through
the montreal and quebec City regions and then on a new right-of-way
into Saint John, new brunswick. energy east would traverse through
both of quebec’s major urban centres.
A energy east would cross the ottawa river near hudson and oka.
Compared with Line 9, the energy east ottawa river crossing would
be further downstream and even closer to the drinking water intakes
around montreal. also even more so than for Line 9, virtually all of the
St. Lawrence in quebec would be downstream of energy east (which
would parallel and cross the St. Lawrence and many other waterways).
PaGE 12
2. COnTExT ECONOMiCS Of TRANSPORTiNG AND PROCESSiNG TAR SANDS CRUDES iN QUEBEC
A bigger pipes can transport (and spill) much more crude than smaller
pipes. The design of energy east is now for TC to convert from gas
to crude the larger existing pipe (1067 mm/42") along 3000 km from
empress, alberta to the vicinity of iroquois in eastern ontario. energy
east will require new pipe in alberta, quebec, and new brunswick, and
this new pipe will also be very large diameter (1067 mm/42"), which is
larger than the size of Keystone XL (914 mm/36"). This design for energy
east will provide the high capacity to move crude (1100k bpd, upsized
from the 500k to 850k bpd range originally planned).
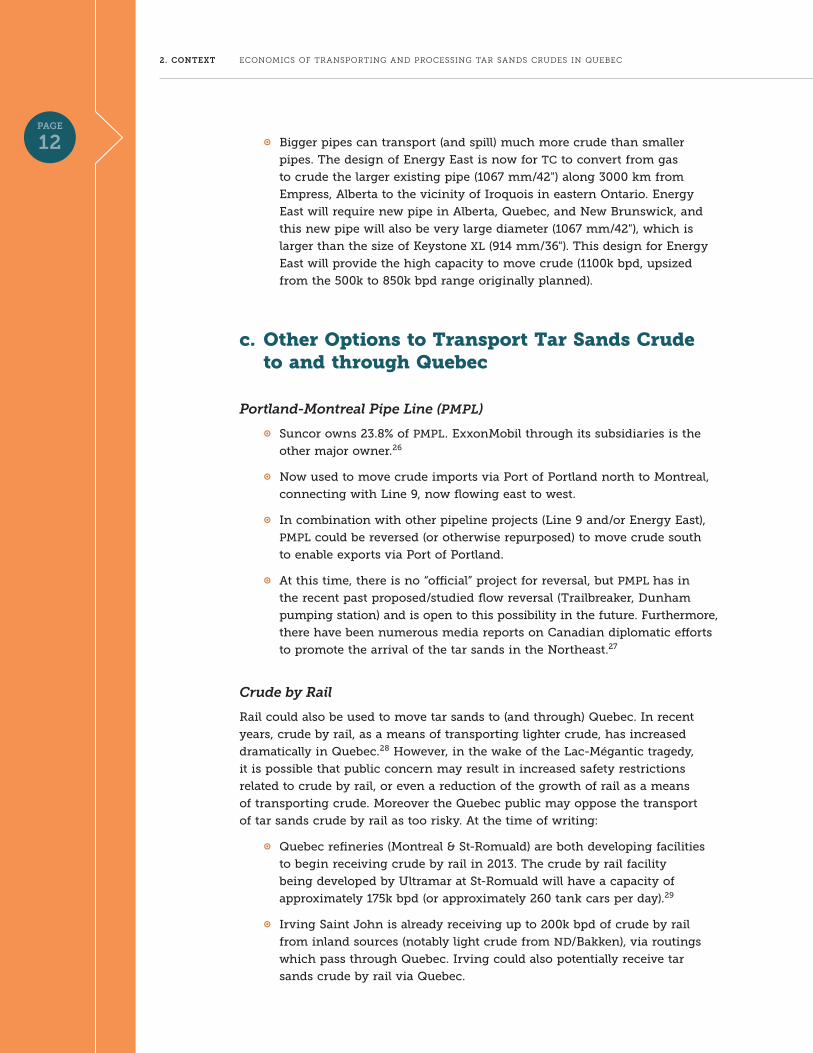
c. other options to Transport Tar Sands Crude to and through Quebec
Portland-Montreal Pipe Line (PMPL)
A Suncor owns 23.8% of PmPL. exxonmobil through its subsidiaries is the
other major owner.26
A now used to move crude imports via Port of Portland north to montreal,
connecting with Line 9, now flowing east to west.
A in combination with other pipeline projects (Line 9 and/or energy east),
PmPL could be reversed (or otherwise repurposed) to move crude south
to enable exports via Port of Portland.
A at this time, there is no “official” project for reversal, but PmPL has in
the recent past proposed/studied flow reversal (Trailbreaker, dunham
pumping station) and is open to this possibility in the future. Furthermore,
there have been numerous media reports on Canadian diplomatic efforts
to promote the arrival of the tar sands in the northeast.27
Crude by Rail
rail could also be used to move tar sands to (and through) quebec. in recent
years, crude by rail, as a means of transporting lighter crude, has increased
dramatically in quebec.28 however, in the wake of the Lac-mégantic tragedy,
it is possible that public concern may result in increased safety restrictions
related to crude by rail, or even a reduction of the growth of rail as a means
of transporting crude. moreover the quebec public may oppose the transport
of tar sands crude by rail as too risky. at the time of writing:
A quebec refineries (montreal & St-romuald) are both developing facilities
to begin receiving crude by rail in 2013. The crude by rail facility
being developed by ultramar at St-romuald will have a capacity of
approximately 175k bpd (or approximately 260 tank cars per day).29
A irving Saint John is already receiving up to 200k bpd of crude by rail
from inland sources (notably light crude from nd/bakken), via routings
which pass through quebec. irving could also potentially receive tar
sands crude by rail via quebec.
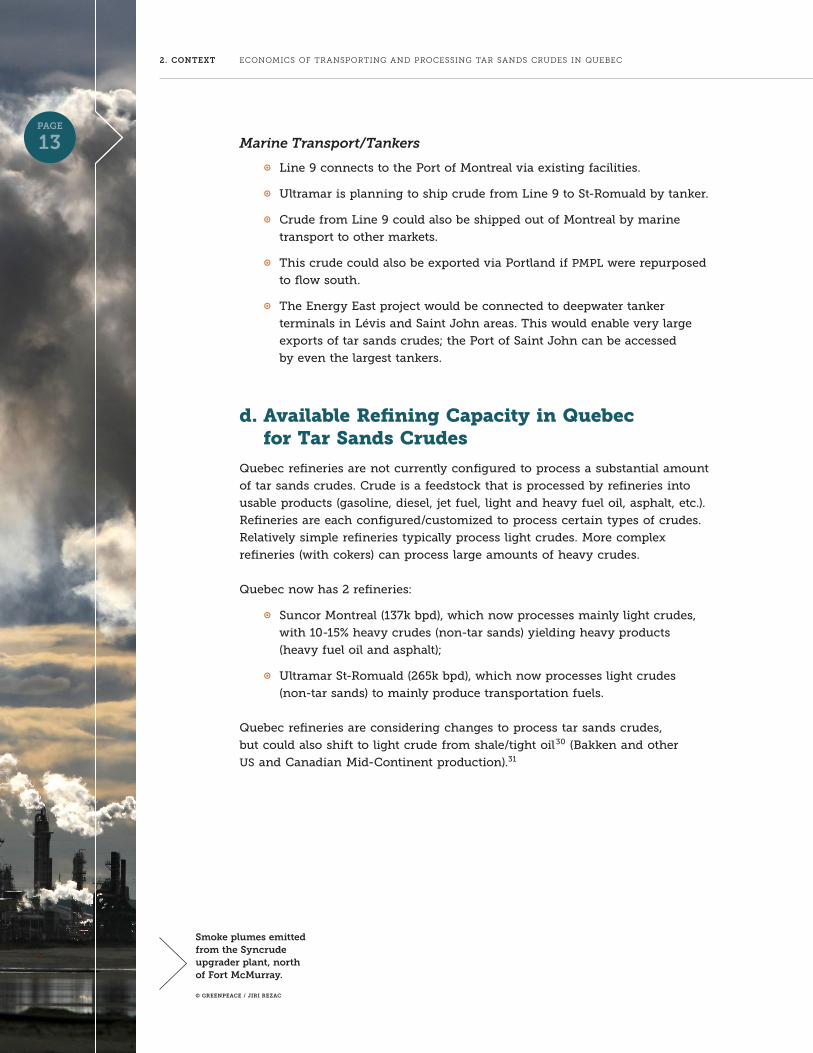
Smoke plumes emitted from the Syncrude upgrader plant, north of Fort McMurray.
© GrEEnPEaCE / JIrI rEZaC
PaGE 13
2. COnTExT ECONOMiCS Of TRANSPORTiNG AND PROCESSiNG TAR SANDS CRUDES iN QUEBEC
Marine Transport/Tankers
A Line 9 connects to the Port of montreal via existing facilities.
A ultramar is planning to ship crude from Line 9 to St-romuald by tanker.
A Crude from Line 9 could also be shipped out of montreal by marine
transport to other markets.
A This crude could also be exported via Portland if PmPL were repurposed
to flow south.
A The energy east project would be connected to deepwater tanker
terminals in Lévis and Saint John areas. This would enable very large
exports of tar sands crudes; the Port of Saint John can be accessed
by even the largest tankers.
d. Available Refining Capacity in Quebec for Tar Sands Crudes
quebec refineries are not currently configured to process a substantial amount
of tar sands crudes. Crude is a feedstock that is processed by refineries into
usable products (gasoline, diesel, jet fuel, light and heavy fuel oil, asphalt, etc.).
refineries are each configured/customized to process certain types of crudes.
relatively simple refineries typically process light crudes. more complex
refineries (with cokers) can process large amounts of heavy crudes.
quebec now has 2 refineries:
A Suncor montreal (137k bpd), which now processes mainly light crudes,
with 10-15% heavy crudes (non-tar sands) yielding heavy products
(heavy fuel oil and asphalt);
A ultramar St-romuald (265k bpd), which now processes light crudes
(non-tar sands) to mainly produce transportation fuels.
quebec refineries are considering changes to process tar sands crudes,
but could also shift to light crude from shale/tight oil30 (bakken and other
uS and Canadian mid-Continent production).31

PaGE 14
2. COnTExT ECONOMiCS Of TRANSPORTiNG AND PROCESSiNG TAR SANDS CRUDES iN QUEBEC
FIGURE 5 north american shale plays. SOURCE: US Energy information Administration.32
Suncor Montreal (137k bpd)
A alberta-based Suncor is a major tar sands producer,
so may prefer to process more tar sands crudes.
A Committed shipper on reversed Line 9 (for full crude
supply).
A Suncor is also highly supportive of energy east and
likely wants the option to supply the montreal refinery
via energy east, as well as Line 9. This would also
provide a connection with the Port of montreal (and
Port of Portland via a repurposed Portland-montreal
Pipeline (PmPL)).33
A within existing configuration could use some tar sands
crudes (20-40k bpd).34
A Considering modifications to process even more tar
sands crudes, including a potential $1 billion (plus) coker
project which would shift refinery to mainly process
heavy tar sands crudes.
A Suncor has emphasized that it could move ahead quickly
to undertake this coker project if Line 9 is reversed and
permitted to transport heavy crudes.35 The coker project
could be in operation by 2016, enabling tar sands to
provide most (and possibly all) of the montreal refinery
crude supply.36
PaGE 15
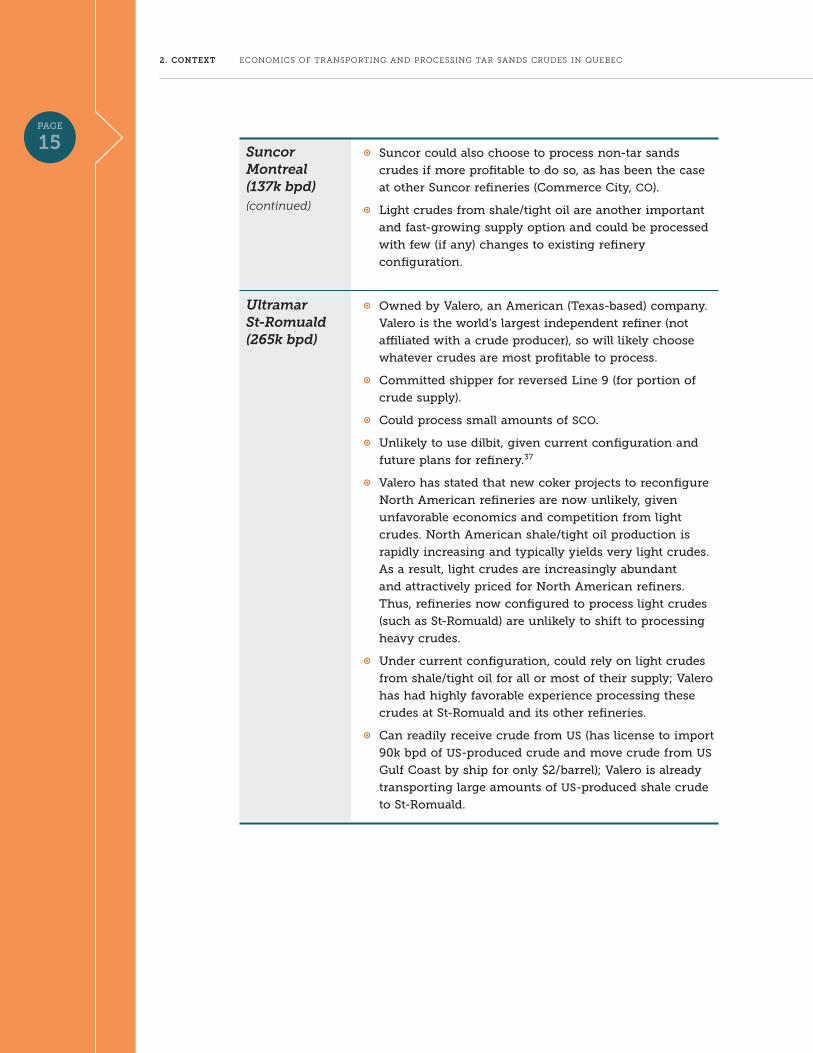
2. COnTExT ECONOMiCS Of TRANSPORTiNG AND PROCESSiNG TAR SANDS CRUDES iN QUEBEC
A Suncor could also choose to process non-tar sands
crudes if more profitable to do so, as has been the case
at other Suncor refineries (Commerce City, Co).
A Light crudes from shale/tight oil are another important
and fast-growing supply option and could be processed
with few (if any) changes to existing refinery
configuration.
A owned by Valero, an american (Texas-based) company.
Valero is the world’s largest independent refiner (not
affiliated with a crude producer), so will likely choose
whatever crudes are most profitable to process.
A Committed shipper for reversed Line 9 (for portion of
crude supply).
A Could process small amounts of SCo.
A unlikely to use dilbit, given current configuration and
future plans for refinery.37
A Valero has stated that new coker projects to reconfigure
north american refineries are now unlikely, given
unfavorable economics and competition from light
crudes. north american shale/tight oil production is
rapidly increasing and typically yields very light crudes.
as a result, light crudes are increasingly abundant
and attractively priced for north american refiners.
Thus, refineries now configured to process light crudes
(such as St-romuald) are unlikely to shift to processing
heavy crudes.
A under current configuration, could rely on light crudes
from shale/tight oil for all or most of their supply; Valero
has had highly favorable experience processing these
crudes at St-romuald and its other refineries.
A Can readily receive crude from uS (has license to import
90k bpd of uS-produced crude and move crude from uS
Gulf Coast by ship for only $2/barrel); Valero is already
transporting large amounts of uS-produced shale crude
to St-romuald.
Suncor Montreal (137k bpd) (continued)
Ultramar St-Romuald (265k bpd)
PaGE 16
Oil refinery.© iSTOCK
PaGE 16
3. Benefits from Transport and Processing of Tar Sands Crudes
PaGE 17
3. BEnEFITS ECONOMiCS Of TRANSPORTiNG AND PROCESSiNG TAR SANDS CRUDES iN QUEBEC
Tar sands proponents claim that quebec will benefit from transport and
processing of tar sands crudes, notably in terms of lower fuel (gasoline)
prices and economic development (jobs and other spinoffs).
alex Pourbaix, President, energy and oil Pipelines at TransCanada has indicated
that eastern Canada would benefit from lower prices for refined products due to
energy east:
eastern Canadians are also keenly aware of how such a plan would affect
fuel prices where they live, he added.
“right now eastern Canada has the highest refined products prices on
the continent,” he said.
he added, “it doesn’t take a great leap of logic” to conclude that filling
eastern refineries with domestic crude is better than importing pricier
oil from overseas.38
business reporters have reinforced the claims of lower gasoline prices in
quebec and eastern Canada.39
Tar sands proponents (including producers and pipeline companies) claim that
quebec and other Canadian provinces benefit from the tar sands. in particular,
CaPP actively promotes the nation-wide economic development benefits of tar
sands investments.40 alberta Premier, alison redford, is also promoting the
economic benefits to quebec (notably in terms of increase employment) of the
Line 9 reversal.41 The Canadian Federal government, and particularly Joe oliver,
minister of natural resources, continues to trumpet the economic development
benefits for quebec of both Line 9 and energy east.42
however, in reality, as the discussed below, any benefits for quebec in terms
of jobs and other economic spinoffs would be very small and/or short-term.
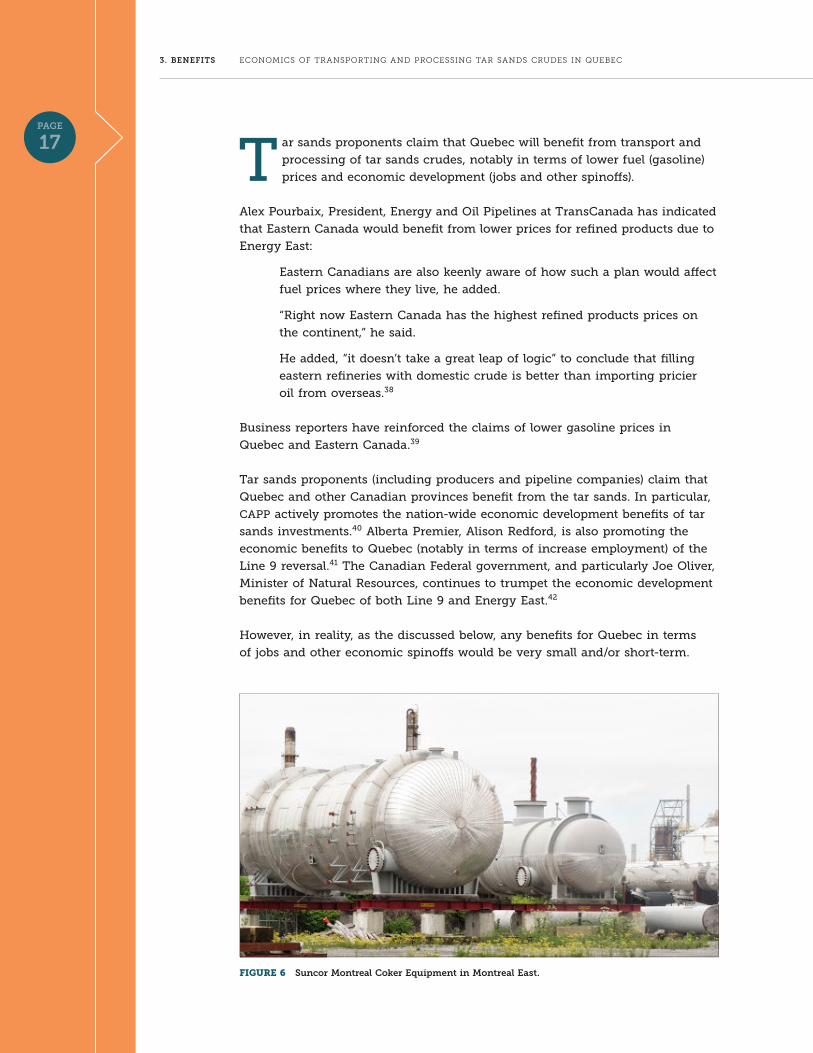
FIGURE 6 Suncor Montreal Coker Equipment in Montreal East.
PaGE 18
3. BEnEFITS ECONOMiCS Of TRANSPORTiNG AND PROCESSiNG TAR SANDS CRUDES iN QUEBEC
regarding the claims of lower fuel prices for quebec, there is a disconnect
between the pricing of refined products (e.g., at the pump) and the price of
crude. To the extent that refiners have access to tar sands (and other lower-
priced) crudes, this will likely benefit refiners (alberta-based Suncor and Texas-
based ultramar, via higher profits), rather than quebec consumers (via lower
prices at the pump).
benefits will also flow to tar sands producers in terms of increased profits
due to ability to transport crude to higher-priced markets (and to continue
expanding production with access to low-cost transport). Pipeline companies
(enbridge and TransCanada) will also profit from expanding the capacity and
utilization on existing lines at a time when their other large pipeline projects
face major uncertainty. Given that the stakes are currently very high for tar
sands proponents, particularly as the economic climate for tar sands becomes
increasingly challenging, it is not surprising that they are pushing the supposed
benefits of Line 9 and energy east to quebecers.
a. Myth: Processing Tar Sands in Quebec Will Result in Lower Prices at the Pump
refiners want access to lower cost crudes in order to be more profitable,
rather than to pass these savings on to consumers. Pricing of refined products
for specific refineries typically reflects regional/global market factors (and
particularly global crude prices), rather than the crude prices paid by the specific
refineries making the products. especially in coastal locations (such as quebec),
refiners have access to profitable export markets (e.g., uS east Coast and europe)
and can sell their products at prices reflecting global crude prices as opposed
to lower north american crude prices. Thus, to the extent that refiners have
access to tar sands crudes (or other crudes that may be cheaper than alternative
sources of supply), this situation will likely benefit refiners (via higher profits),
rather than consumers (via lower product prices).43
montreal-based energy policy expert and management science professor
Pierre-olivier Pineau agrees:
Consumers who think that oil companies will give them a break
at the gas pump have another thing coming, warns Pierre-olivier Pineau,
an energy specialist at heC montreal business School.
“The extra profit margin from cheaper Canadian crude oil will most likely
be pocketed by the refineries,” he predicted.44
This has been the case in the uS midwest. with rapidly rising crude production
from both tar sands and shale/tight oil (notably bakken), there has been a glut
of crude supply in the uS midcontinent (which is currently pipeline-constrained).
in recent years, refineries in the midwest have had access to cheaper crudes.
The result has been very high profits for refineries, but little or no impact on
the prices at the pump for consumers.45
PaGE 19
3. BEnEFITS ECONOMiCS Of TRANSPORTiNG AND PROCESSiNG TAR SANDS CRUDES iN QUEBEC
The markets for gasoline and other refined products in the midwest have so
far not reflected the deep discounts available on tar sands crudes. Similarly,
the prices of refined petroleum products in quebec are not expected to reflect
the cheaper crudes that would become available to local refineries should
pipeline projects be approved to transport tar sands (and other north american-
produced) crudes into quebec. refineries in quebec can (and already do) sell
their products into profitable export markets (including both the northeast uS
and europe, which can be accessed via low cost water transport). refineries
will not provide discounts for quebec markets when they can also sell their
refined products to profitable markets outside quebec.46
b. Myth: Processing Tar Sands in Quebec Will Result in Economic Development for Quebec
Tar sands proponents claim that processing tar sands crudes in quebec
will result in economic development for quebec. Processing tar sands crudes
in quebec would actually result in minimal (if any) economic development
for quebec, as will be shown in the subsections below discussing economic
development impacts from quebec refineries, the montreal east Petrochemical
Complex, and pipelines. instead of pursuing an unhealthy economic
development strategy based on processing tar sands crudes, quebec can
reap more significant and longer-lasting economic development benefits by
continuing to move towards cleaner energy, as shown in last subsection below.
Minimal Economic Development from Processing Tar Sands Crudes in Quebec Refineries
Processing of tar sands crudes at refineries in quebec (or elsewhere) will
have few (if any) benefits for quebec. refineries in quebec are not currently
configured to process large volumes of tar sands crudes and especially heavy
tar sands crudes. Suncor is considering projects at the montreal refinery to
process tar sands crudes. but Suncor could also shift to light crude supply from
shale/tight oil (bakken and other uS and Canadian midcontinent production).
north american refineries are benefitting from rapidly increasing light crude
production and access to profitable export markets. Valero and other refiners
are shifting rapidly to north american-produced light crudes to supply their
refineries in quebec and throughout north america.
Processing of crudes at refineries is not a labour-intensive activity. There are
only about 500 jobs at each of the two quebec refineries, or about 1000 total
for the province (including both Suncor and ultramar).47 refinery jobs are less
than 0.03% of total provincial employment (around 4 million), and a similar
proportion of the total for the montreal metropolitan area (around 2 million).
PaGE 20
3. BEnEFITS ECONOMiCS Of TRANSPORTiNG AND PROCESSiNG TAR SANDS CRUDES iN QUEBEC
Crude processing is not labour-intensive, but it does require complex capital-
intensive processes and facilities. refineries can thus have a larger impact
on total economic activity, as opposed to employment.48 Still, refineries are
only about 0.20% of total economic activity in quebec.49 as measured by GdP,
total economic activity is in the order of $300 billion for quebec.
based on the figures in the preceding two paragraphs, refineries are a minuscule
part of overall provincial (and montreal) employment and economic activity. but
the above figures capture only a portion of the refineries’ impacts on overall jobs
and economic activity. in addition to direct jobs, crude processing generates
substantial use of contractors, technical and other services, and sizable spending
for inputs. moreover, the jobs associated with refineries pay well (have high
average compensation), and many are unionized. and as noted above, crude
processing requires complex capital-intensive processes and facilities.
To better gauge the overall contribution of refineries to jobs and economic
activity, we have reviewed studies that use economic models to estimate spin-
off effects. in an effort to be conservative (i.e. to not understate the contribution
of refineries to overall jobs and economic activity), we have focused on the
same studies used by refiners and pipeline companies operating in quebec
and throughout Canada.50 in particular, these studies simulate how money
spent by the refineries will ripple through economic linkages, resulting in
additional employment and economic activity.51
not surprisingly, these studies estimate that there are sizable “multiplier”
effects for refineries. according to these studies, for each dollar of activity
directly at the refinery, there can be another two dollars of activity elsewhere
in the economy (including outside of quebec, along the supply chain, and in
consumption-related activities as workers spend their wages).52 and for each
job directly at the refinery, there can be an even larger multiplier effect in
terms of overall jobs throughout the economy.53
nonetheless, even when all these potentially overstated spinoff effects are
considered, refineries still have only a very small impact on overall employment
and economic activity throughout quebec (and in montreal). in part, this
reflects that refining is a very small activity in quebec and that there is only
a limited provincial supply chain for activities relating to crude processing.
So even if it is assumed that each of the jobs directly at quebec refineries
(about 1000 overall, or less than 0.03% of the provincial total)54 results in up
to 11 other jobs elsewhere in the quebec economy (i.e. for every direct job,
there are 11 other jobs from contractors, suppliers and spin-offs), the total
for the entire economy is still about 12,000 jobs (or less), equivalent to about
0.30% (or less) of the provincial total.55 Likewise, even if it is assumed that
the quebec refineries result in a very wide range of spin-offs, the impact
on overall economic activity (quebec GdP) is around $1.5 billion (or less),
equivalent to about 0.50% (or less) of the provincial total.56
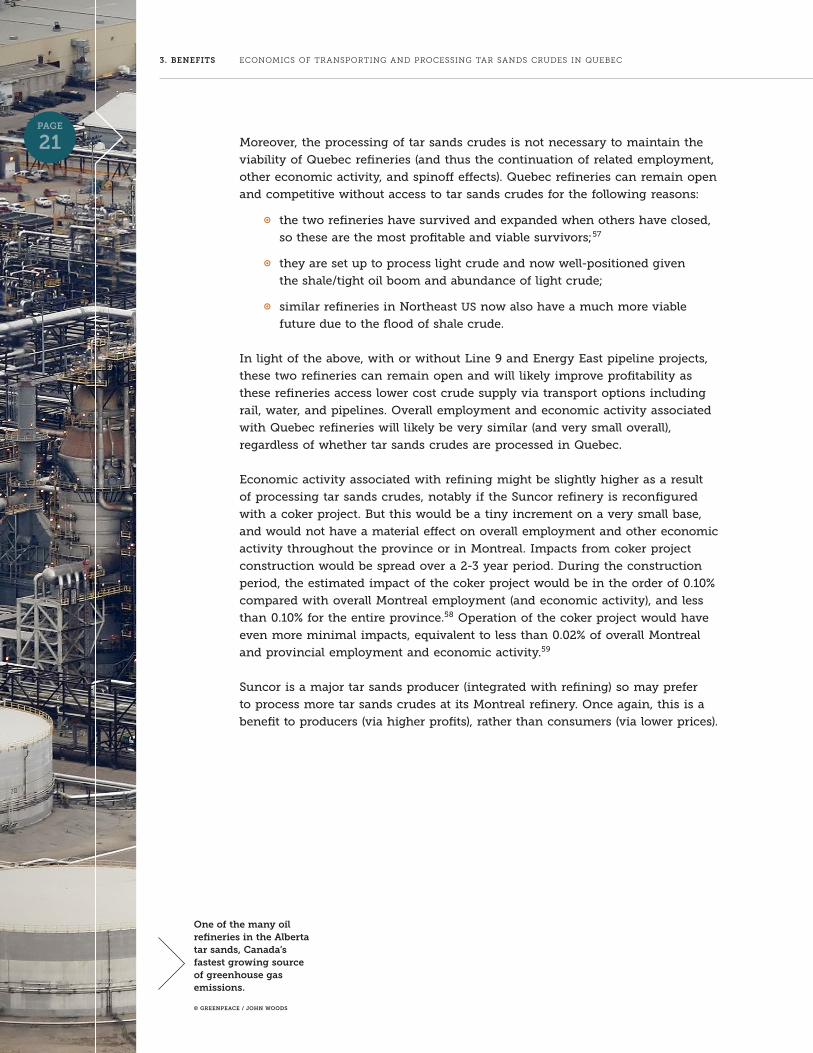
One of the many oil refineries in the alberta tar sands, Canada’s fastest growing source of greenhouse gas emissions.
© GrEEnPEaCE / JOhn WOODS
PaGE 21
3. BEnEFITS ECONOMiCS Of TRANSPORTiNG AND PROCESSiNG TAR SANDS CRUDES iN QUEBEC
moreover, the processing of tar sands crudes is not necessary to maintain the
viability of quebec refineries (and thus the continuation of related employment,
other economic activity, and spinoff effects). quebec refineries can remain open
and competitive without access to tar sands crudes for the following reasons:
A the two refineries have survived and expanded when others have closed,
so these are the most profitable and viable survivors;57
A they are set up to process light crude and now well-positioned given
the shale/tight oil boom and abundance of light crude;
A similar refineries in northeast uS now also have a much more viable
future due to the flood of shale crude.
in light of the above, with or without Line 9 and energy east pipeline projects,
these two refineries can remain open and will likely improve profitability as
these refineries access lower cost crude supply via transport options including
rail, water, and pipelines. overall employment and economic activity associated
with quebec refineries will likely be very similar (and very small overall),
regardless of whether tar sands crudes are processed in quebec.
economic activity associated with refining might be slightly higher as a result
of processing tar sands crudes, notably if the Suncor refinery is reconfigured
with a coker project. but this would be a tiny increment on a very small base,
and would not have a material effect on overall employment and other economic
activity throughout the province or in montreal. impacts from coker project
construction would be spread over a 2-3 year period. during the construction
period, the estimated impact of the coker project would be in the order of 0.10%
compared with overall montreal employment (and economic activity), and less
than 0.10% for the entire province.58 operation of the coker project would have
even more minimal impacts, equivalent to less than 0.02% of overall montreal
and provincial employment and economic activity.59
Suncor is a major tar sands producer (integrated with refining) so may prefer
to process more tar sands crudes at its montreal refinery. once again, this is a
benefit to producers (via higher profits), rather than consumers (via lower prices).
PaGE 22
3. BEnEFITS ECONOMiCS Of TRANSPORTiNG AND PROCESSiNG TAR SANDS CRUDES iN QUEBEC
Minimal Economic Development from Tar Sands Crudes and the Montreal East Petrochemical Complex
The Suncor montreal refinery is also part of the montreal east Petrochemical
Complex.60 business and union organizations have claimed that the Line 9b
reversal and expansion Project will facilitate quebec economic development
by strengthening the montreal east Petrochemical Complex, and specifically
the polyester supply chain.61
much like the processing of crudes at refineries, petrochemical processing is not
a labour-intensive activity. There are only about 350 jobs in the petrochemical
plants most closely tied to the Suncor montreal refinery.62 based on the above
figures, these petrochemical plants are a minuscule part of overall provincial
(and montreal) employment.
but in addition to these petrochemical plants directly tied to Suncor montreal,
there may be further downstream linkages with montreal petrochemical
production. in this context, it is useful to consider the scale of the entire
montreal petrochemical industry. even when viewed in its entirety, production
of chemical and plastics products is estimated to employ less than 7500 workers
in montreal; combined with production of petroleum products (refining), the
petrochemical industry is still estimated to employ less than 8700 workers
in montreal.63
Thus, montreal production of chemicals and plastics is less than 0.40% of all
employment in montreal and less than 0.20% of all employment in the entire
province. montreal production of all petrochemicals (petroleum, chemical, and
plastic products) is just slightly more than 0.40% of all employment in montreal
and slightly more than 0.20% of all employment in the entire province. So even
with the employment for the St-romuald refinery added in, employment in
the quebec petrochemical industry (refineries and potentially related chemical
and plastics processing) is still less than 0.30% of the provincial total.
moreover, as explained above, the processing of tar sands crudes is not necessary
to maintain the viability of quebec refineries (and thus the continuation of
related employment, other economic activity, and spinoff effects). overall
employment and economic activity associated with the quebec petrochemical
industry (refineries and related chemical and plastics processing) will likely be
very similar (and very small overall), regardless of whether tar sands crudes are
processed in quebec.64
Minimal Economic Development from Pipeline Construction and Operations in Quebec
The Line 9 and energy east pipeline projects would require some pipeline
construction (and other activity) within quebec. any benefits for quebec
in terms of employment and other economic spinoffs would be very small
and short term. over the four (or more) year period of the capital investment
for both projects, the incremental impact on the quebec economy will be
in the order of 0.60% (or less than 0.20% per year).65 The impact from Line 9
PaGE 23
3. BEnEFITS ECONOMiCS Of TRANSPORTiNG AND PROCESSiNG TAR SANDS CRUDES iN QUEBEC
is negligible, so almost all of the potential incremental impact would be from
energy east. Compared with Line 9, energy east is a much larger project which
includes marine terminals; energy east would be used (mainly or completely)
to transport tar sands crude through quebec to markets elsewhere.66
as discussed above, economic activity associated with refining might also
be slightly higher as a result of processing tar sands crudes, notably if the
Suncor refinery is reconfigured with a coker project. even if all the proposed
projects were approved (including Line 9, energy east, and the Suncor coker),
the incremental impact on the quebec economy will be in the order of 0.80%
(or 0.20% per year) for the construction phase.67
once the initial capital investment (i.e. construction phase) is completed and
the pipelines are in service, ongoing operations would have minuscule labour
requirements and impact (less than 0.04%/year with the Suncor coker and less
than 0.02%/year without it) on overall economy activity.68
Healthy and Sustainable Economic Development Alternatives
For decades, quebec has made a societal choice to reduce reliance on fossil
fuels (and GhG emissions). quebec should continue to move towards cleaner
energy by increasing investments in renewables, energy efficiency, and public
(and electrified) transportation. not only would clean energy investments
reduce environmental and risk externalities, but they would allow quebec
to reap more significant and longer-lasting economic development benefits.
energy policy expert, Pierre-olivier Pineau agrees:
instead of pushing for new markets in eastern Canada for alberta
oil, the government should be sending a different kind of signal to
consumers, he said, like financial incentives for carpooling and more
support for public transit.69
a number of quebec- and Canadian-specific studies have also discussed
the economic development benefits of increased investments in clean energy,
renewables, energy efficiency and public transportation in quebec and Canada.
These include “more bang for our buck: how Canada Can Create more energy
Jobs and Less Pollution” by blue Green Canada70 and Équiterre’s “Pour un
quebec libéré du pétrole en 2030” 71.
The blue Green Canada study shows the incremental jobs that could be created
if the $1.3 billion in government subsidies, currently given to the oil and gas
sector, were instead invested in renewable energy and energy efficiency.
according to the blue Green Canada study:
we explored three different scenarios for how this money could be
used to spur the transition to clean energy and found that, in each
scenario, between 18,000-20,000 jobs could be created. by comparison,
according to government estimates, 2,340-2,860 jobs can be generated
with $1.3 billion invested in oil and gas production, refining or pipelines.72
PaGE 24
3. BEnEFITS ECONOMiCS Of TRANSPORTiNG AND PROCESSiNG TAR SANDS CRUDES iN QUEBEC
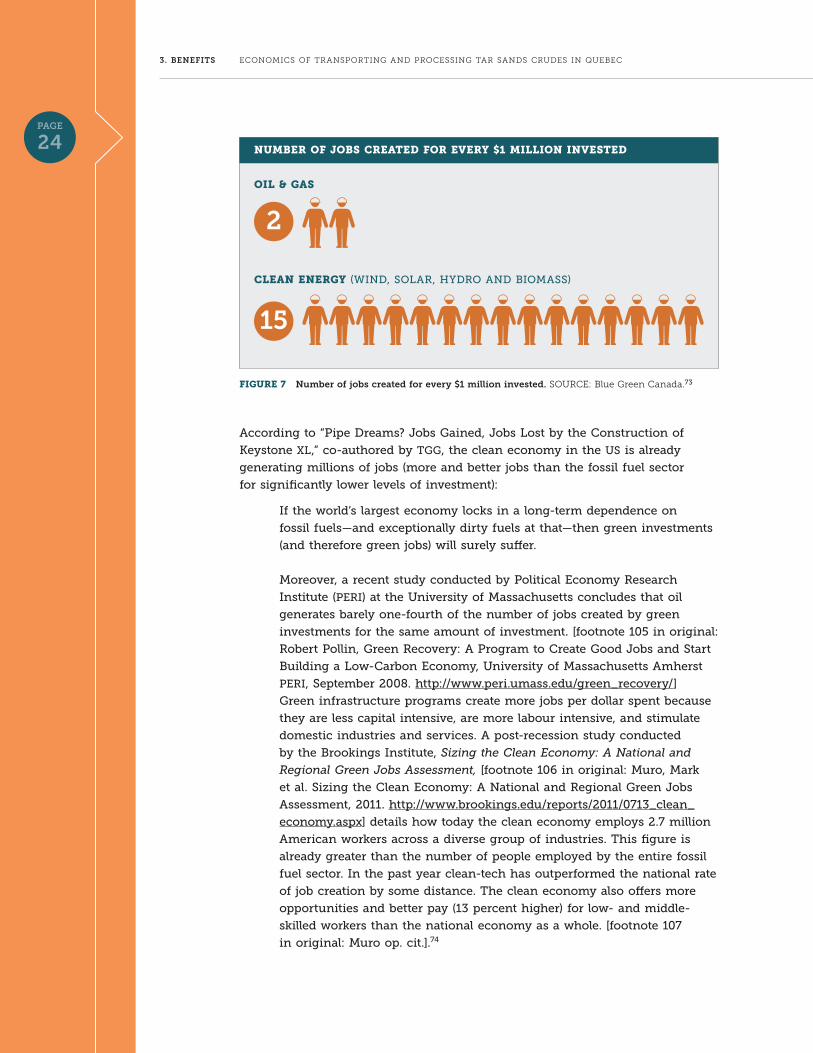
according to “Pipe dreams? Jobs Gained, Jobs Lost by the Construction of
Keystone XL,” co-authored by TGG, the clean economy in the uS is already
generating millions of jobs (more and better jobs than the fossil fuel sector
for significantly lower levels of investment):
if the world’s largest economy locks in a long-term dependence on
fossil fuels—and exceptionally dirty fuels at that—then green investments
(and therefore green jobs) will surely suffer.
moreover, a recent study conducted by Political economy research
institute (Peri) at the university of massachusetts concludes that oil
generates barely one-fourth of the number of jobs created by green
investments for the same amount of investment. [footnote 105 in original:
robert Pollin, Green recovery: a Program to Create Good Jobs and Start
building a Low-Carbon economy, university of massachusetts amherst
Peri, September 2008. http://www.peri.umass.edu/green_recovery/]
Green infrastructure programs create more jobs per dollar spent because
they are less capital intensive, are more labour intensive, and stimulate
domestic industries and services. a post-recession study conducted
by the brookings institute, Sizing the Clean Economy: A National and
Regional Green Jobs Assessment, [footnote 106 in original: muro, mark
et al. Sizing the Clean economy: a national and regional Green Jobs
assessment, 2011. http://www.brookings.edu/reports/2011/0713_clean_
economy.aspx] details how today the clean economy employs 2.7 million
american workers across a diverse group of industries. This figure is
already greater than the number of people employed by the entire fossil
fuel sector. in the past year clean-tech has outperformed the national rate
of job creation by some distance. The clean economy also offers more
opportunities and better pay (13 percent higher) for low- and middle-
skilled workers than the national economy as a whole. [footnote 107
in original: muro op. cit.].74
NUMBER oF JoBS CREATED FoR EVERY $1 MILLIoN INVESTED
oIL & GAS
2
CLEAN ENERGY (wind, SoLar, hydro and biomaSS)
15
FIGURE 7 number of jobs created for every $1 million invested. SOURCE: Blue Green Canada.73
PaGE 25
3. BEnEFITS ECONOMiCS Of TRANSPORTiNG AND PROCESSiNG TAR SANDS CRUDES iN QUEBEC
c. Myth: Using Quebec as a Tar Sands Conduit Will Result in Economic Development for Quebec
energy east would be one of the largest crude pipelines in north america
and would transport 1100k bpd through quebec. but only a small portion
(if any) of this crude would be used within quebec; the two existing refineries
in quebec can together process only about 400k bpd of crude.75 a sizable
portion of the crude to be transported in energy east would likely be for
export.76 The use of quebec as a conduit for exporting tar sands crudes will
have few (if any) economic development benefits for the province. while the
economic development benefits of processing tar sands crude in quebec are
negligible, the economic development benefits of using quebec as a conduit
for exporting tar sands crudes are even more minimal.
Minimal Economic Development from Use of Quebec Ports
exports would require use of an east Coast port and moving crude to the port
(likely via pipeline).
The Port of montreal has limited potential for crude exports. other ports further
east (St-romuald/Lévis/quebec City, Portland, and especially Saint John) provide
more potential for crude exports, since they can accommodate larger tankers
and are more proximate to the open ocean.
Potential benefits for quebec in terms of employment and other economic
spinoffs are very small (if any). Crude is a bulk commodity with minimal labor
requirements for shipping and handling.77 moreover, exports could be via ports
outside of quebec.
Minimal Economic Development from Pipeline Construction and Operations in Quebec
Some new pipeline construction and operations would be required, especially
for exports via Saint John. any benefits for quebec in terms of employment
and other economic spinoffs would be very small (and mainly short-term during
pipeline construction).78
PaGE 26
3. BEnEFITS ECONOMiCS Of TRANSPORTiNG AND PROCESSiNG TAR SANDS CRUDES iN QUEBEC
d. Benefits Flow to Tar Sands Proponents and Refineries Not Quebec Consumers
as discussed above, quebec consumers will receive little (if any) benefit at
the pump from processing tar sands crudes in quebec. moreover, the province
receives negligible short-term economic development benefits from transport
and processing of tar sands crudes.
Conversely, Suncor and Valero (the alberta- and Texas-based owners of quebec
refineries) will benefit from increased profits due to lower-priced crudes at least
over the short and medium term. moreover, tar sands producers are able to
increase profits by accessing higher priced markets. access to low-cost crude
transport via Line 9 and energy east facilitates tar sands expansion (and thus
increased GhGs) under a wide range of economic conditions, particularly in
the current situation, in which tar sands are increasingly pipeline-constrained
(to the South and west).
Furthermore, both enbridge and TC are highly motivated to extend their
pipeline network and increase profits. enbridge is facing considerable
uncertainty with respect to its northern Gateway project and is seeking to
increase its capacity to transport tar sands crude. Similarly, the future of TC’s
Keystone XL pipeline is also uncertain.79 TC is also being challenged by the
underutilization and declining profitability of its mainline for the transport
of natural gas. Particularly in light of a recent unfavourable neb decision
regarding mainline tolls for natural gas, TC is now pushing hard on energy
east as a solution to shore up profits by repurposing its gas mainline. as such,
tar sands proponents (producers and pipeline companies) and refineries are
even more highly motivated to tout the supposed benefits of these projects to
quebecers. in effect though, the vast majority of benefits will flow to tar sands
proponents (producers and pipeline companies), and to the owners of the two
refineries in quebec.
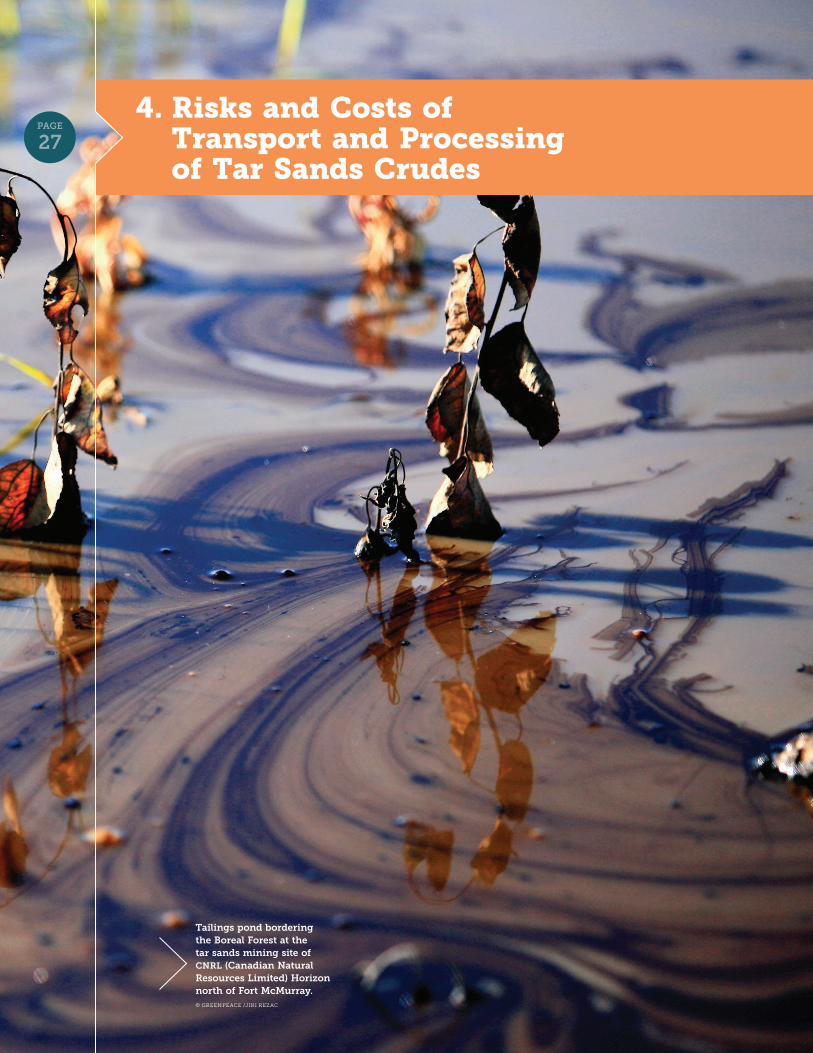
PaGE 27PaGE 27
4. Risks and Costs of Transport and Processing of Tar Sands Crudes
Tailings pond bordering the Boreal Forest at the tar sands mining site of CnrL (Canadian natural resources Limited) horizon north of Fort McMurray.© GREENPEACE /JiRi REzAC
PaGE 28
4. rISKS/COSTS ECONOMiCS Of TRANSPORTiNG AND PROCESSiNG TAR SANDS CRUDES iN QUEBEC
a. Risks/Costs of Transport and Processing Tar Sands Crudes in Quebec
Transport and processing of tar sands crudes could expose quebec to
substantial risks, costs, and environmental impacts.
when evaluating the benefits of increasing quebec’s involvement with
tar sands crudes, it is important to consider the substantial risks, costs,
and environmental impacts associated with all aspects of crude production,
transport, and processing. There are particular concerns about tar sands
crudes being transported and processed in quebec, including the following:
A heavy tar sands crudes (dilbit):
• bitumen produced by the tar sands is very heavy and viscous.
To enable transport via pipeline, bitumen is blended with diluent
(typically very light condensate).
• heavy tar sands crudes can be especially problematic under spill
conditions. The diluent evaporates rapidly, and the remaining
bitumen is then heavier than water (and thus hard to collect
and remove, especially from water bodies).80
• Tar sands expansion is mainly producing heavy crudes and is thus
mainly tied to markets for heavy crudes. quebec is not currently
a sizable market for heavy crude and therefore tar sands expansion
is mainly tied to markets outside of quebec.
A Line 9:
• Very high proximity to population centers (including both montreal
and Toronto), as well as water bodies.
• Crosses the ottawa river near rigaud and Saint-Placide, upstream
of the intakes where island of montreal municipalities get their
drinking water.
• older pipeline being reversed, expanded, and possibly moving
heavy tar sands crudes.
A energy east Proposal:
• routing in quebec will go through two major population centers
(montreal and quebec City), and has high proximity to water
bodies.
• TC is now planning to move very large volumes (1100k bpd) of
crude, which could be mainly heavy tar sands crudes.
• Crosses the ottawa river near hudson and oka (compared with
Line 9, this crossing would be further downstream and even closer
to the drinking water intakes around montreal).
• Converting older gas pipeline to transport crude, but pipe in
quebec would be new.
PaGE 29
4. rISKS/COSTS ECONOMiCS Of TRANSPORTiNG AND PROCESSiNG TAR SANDS CRUDES iN QUEBEC
• as discussed in Section 3a, quebec gasoline consumers are
not expected to benefit from cheaper crudes available to local
refineries. however, there is currently a deep concern at Gaz
métro (quebec’s largest gas distributor), that captive quebec gas
consumers (residential, commercial and industrial) will be forced
to pay considerably higher natural gas rates if energy east is
approved.81 This concern is shared by several major quebec
consumer groups including the quebec industrial Gas users
association (iGua) and option consommateurs (which represents
residential consumers, and in particular, low-income consumers).
• according to dr. mark Jaccard, a leading authority on Canadian
energy issues, energy east “will generate more public scrutiny
following the rupture of the repurposed Pegasus pipeline in
arkansas […] it must be remembered that opinion polls show that
at least 40% of Canadians oppose oil sands expansion. opposition
toward oil sands infrastructure in quebec, where new pipeline
right of ways and construction would be required, is particularly
strong.” 82 Furthermore, a recent north american poll shows that
a majority of quebecers would prefer to import oil rather than
using tar sands if it means a smaller carbon footprint.83
A domino effect, especially in the montreal east Petrochemical Complex:
• The domino effect results when an incident at one facility leads
to other incident(s) onsite or at other proximate facilities.
• The domino effect is of particular concern in montreal east. This
area has a large concentration of facilities for transport, processing,
and storage of oil, natural gas, and chemicals, as well as other
major infrastructure.84 montreal east is on the island of montreal,
combining very high proximity to population centers (locally and
throughout the metropolitan region), and to major water bodies.
• according to the quebec government (baPe) review of Pipeline
Saint-Laurent (a pipeline recently completed by ultramar to
transport petroleum products from the St-romuald refinery
to a terminal in montreal east)85:
The Commission is studying the situation in montreal east
because it has the highest population density within the
territory crossed by the developer’s suggested right-of-way.
it is also home to a high concentration of petrochemical
facilities belonging to various companies.
[…]
The health and social services agencies along with
participants in the public hearings are concerned about
the overall risk posed by the petroleum industry for people
in the eastern part of the island of montreal, who often
live just a few tens of metres away from petroleum product
storage tanks. They not only fear that a technological accident
PaGE 30
4. rISKS/COSTS ECONOMiCS Of TRANSPORTiNG AND PROCESSiNG TAR SANDS CRUDES iN QUEBEC
would cause major damage to a densely populated area,
but that there would also be a domino effect on adjacent
petrochemical facilities, which could intensify the toll of
such an accident, especially given the fact that other types
of hazardous materials (benzene, naphtha, toluene, xylenes)
would be transiting through those facilities.86
(our translation.)
• The domino effect is also a concern elsewhere in quebec.
a spill or other problems at one facility could result in problems
at adjacent facilities. routings for Line 9 and energy east are often
parallel (and are otherwise proximate) to other pipelines and major
infrastructure such as highways.
There are now major tensions and controversies regarding north american
energy projects whose benefits (and costs) may be spread (perhaps quite
unevenly) across multiple jurisdictions. Proposals to use quebec as a conduit for
tar sands exports are advancing (in part) due to resistance elsewhere, especially
regarding major pipelines such as Keystone XL and northern Gateway. Proposals
to use bC as a conduit for tar sands are encountering intense opposition,
delays, and may be blocked. The resistance to these proposals in bC is based
(in part) on concerns that these proposals could be quite damaging for the
bC environment, but would mainly benefit tar sands producers and pipeline
companies. if bC does not want to be used as a conduit for the tar sands, it is
further questionable that quebec would benefit from being used as a conduit.
b. Risk/Costs Assumed by Quebec Citizens Not by Tar Sands Proponents and Pipeline Companies
The brief overview of the risks related to the two pipeline projects demonstrates
that they are significant. and quebec citizens should be concerned. although
pipeline companies are forced to participate in spill clean-up, spill penalties
are often tiny. Typically spill risks are socialized with local inhabitants (human,
wildlife and plants) bearing large costs: the area where the spill occurs is often
never fully restored; waterways and drinking water can be polluted; humans
can lose their homes and livelihood and/or be subject to a deterioration in their
quality of life; and wildlife and plant life are killed. Tar sands heavy crude is
particularly difficult to clean up.
The uS ePa has recently expressed concerns regarding the additional impacts
of tar sands crude spills (versus conventional oil), with a particular concern
about spills on waterways. according to the ePa, in its review of the State
department’s Keystone XL draft Supplemental environmental impact Statement
(dSeiS):
Pipeline Safety
we have learned from the 2010 enbridge spill of oil sands crude in
michigan than spills of diluted bitumen (dilbit) may require different
PaGE 31
4. rISKS/COSTS ECONOMiCS Of TRANSPORTiNG AND PROCESSiNG TAR SANDS CRUDES iN QUEBEC
response actions or equipment from response actions for conventional
oil spills. These spills can also have different impacts than spills of
conventional oil. […] The enbridge spill involved a 30-inch diameter
pipeline […], and 20,000 barrels of oil sands crude were released. in
that spill, oil sands crude sank to the bottom of the Kalamazoo river,
mixing with the river bottom’s sediment and organic matter, making
the oil difficult to find and recover. after almost three years of recovery
efforts, ePa recently determined that dredging of bottom sediments will
be required to protect public health and welfare and the environment.
This determination was based in large part on demonstrations that the
oil sands crude associated with the enbridge spill will not appreciably
biodegrade. we recommend that the Final eiS more clearly acknowledge
that in the event of a spill to water, it is possible that large portions
of dilbit will sink and that submerged oil significantly changes spill
response and impacts. we also recommend that the Final eiS include
means to address the additional risks of releases that may be greater
for spills of dilbit than other crudes.87
The cost of tar sands crude spills will be higher in populated areas and/or near
waterways. Line 9 and energy east both cross major waterways in quebec close
to drinking water intakes, and are routed through densely populated areas and
in proximity to a number of water bodies. Thus, the spill costs for these
pipelines will be particularly high.
as evidenced by the 2010 spill on the Kalamazoo and hundreds of other smaller
spills since 1999, enbridge has a poor safety record in transporting heavy
crudes.88 moreover, TransCanada, which has only recently expanded into the
oil pipeline business, has had several recent ruptures and explosions on the gas
mainline. as part of energy east, the mainline would be converted to transport
large amounts of tar sands crude (with both gas and crude pipes running
adjacent).
beyond the risk of spill, these proposed projects will increase GhGs (and
thus the risk of climate change) in several ways: (a) they will facilitate the
expansion of the tar sands (as will be discussed in the next section), which
are more GhG-intense than conventional oil; (b) they will further lock Canada
and quebec into a high-carbon economy at a time when forward-looking
energy experts and climate scientists recommend reducing our reliance
on fossil fuels and making a transition to cleaner energy;89 (c) they will also
contribute to increased emissions in quebec through the refining of heavier
crudes. Currently, tar sands producers and refineries do not bear the price
of their GhG emissions. as such, these costs are also socialized and borne
by quebec citizens and all inhabitants of the planet.
This section has shown that the risks/costs of spills and GhGs are socialized
while the previous section demonstrated that the benefits of the proposed
pipeline projects are privatized: these benefits are negligible for quebec and
flow mainly to tar sands proponents (producers and pipeline companies),
and to the two refineries in quebec.
PaGE 32PaGE 32
5. Quebec at the Crossroads for Enabling Tar Sands Expansion: A Serious Societal Choice
Oil refinery.© iSTOCK
PaGE 33
5. CrOSSrOaDS ECONOMiCS Of TRANSPORTiNG AND PROCESSiNG TAR SANDS CRUDES iN QUEBEC
depending upon the choices made over the next few years, quebec’s
involvement with the transport and processing of tar sands crudes
could range from zero/minimal to substantial. The choices involving
quebec and tar sands are very important and very controversial for quebec,
for the future of the tar sands, and for the planet.
on may 7, 2013, leading Canadian energy experts and climate scientists
sent a letter to Joe oliver, the Federal natural resources minister, protesting
its support of tar sands expansion and the current pipeline projects: “The
infrastructure we build today will shape the future choices about energy. if
we invest in expanding fossil fuel production, we risk locking ourselves into
a high carbon pathway that increases greenhouse gases for years and decades
to come.”90 These experts believe that the harper government is putting
Canada on a very dangerous pathway in terms of the climate. mark Jaccard,
a leading energy economist, and one of the signatories of the letter, believes
Canada is also on a dangerous economic pathway. he has stated that “the
federal government and the oil industry are embarked on a high-risk path
that could leave billions of dollars in stranded assets, including pipelines
like TransCanada Corp.’s proposed Keystone XL.”91
with delays and uncertainty regarding the approval of Keystone XL and
northern Gateway, the proposed pipelines through quebec are becoming key
to tar sands expansion – and key to locking north america on a high-carbon
pathway that is dangerous to the planet and damaging economically. moreover,
emerging market realities are now considerably less favorable for tar sands
expansion. From the perspective of a few years ago, large future expansion in
tar sands production might have appeared to be inevitable (or at least very likely).
but, in reality, this large expansion is no longer so inevitable or even likely.
Thus, in the current evolving context (increasingly challenging economics of
the tar sands and uncertainty regarding other major pipeline projects), quebec’s
choices regarding tar sands have much more potential to affect tar sands
expansion than they would otherwise. if quebec facilitates the transport and
processing of tar sands crudes (via Line 9, energy east, and the Suncor coker
project), this choice will help to shore up the deteriorating profitability and
prospects for tar sands expansion, so that more projects go ahead despite
an otherwise increasingly challenging context.
if quebec refuses to be used as a conduit and an upgrader of the tar sands,
this will accelerate the shifts away from tar sands expansion by (a) leaving the
tar sands producers pipeline-constrained; (b) discouraging near-term project
development; and (c) giving more time to emerging market realities (and other
factors) to constrain future tar sands expansion.
Tar sands proponents understand that quebec is a key gateway for their
expansion and their future. Consequently, they have every interest in
exaggerating the negligible economic development benefits from the proposed
pipelines, and erroneously implying that quebec fuel prices would be lower.
Proponents also have every interest in downplaying the possibility of quebec
PaGE 34
5. CrOSSrOaDS ECONOMiCS Of TRANSPORTiNG AND PROCESSiNG TAR SANDS CRUDES iN QUEBEC
citizen opposition to the pipeline projects.92 however, tar sands promoters have
probably underestimated the level of quebec opposition and quebec’s historic
choices to reduce dependence on fossil fuels.93
indeed, quebec citizens are already mobilizing against the Line 9 and energy
east projects. quebec has a long history of strong citizen activism and a vibrant
protest culture, as evidenced by widespread protests and demonstrations
(250,000 people on earth day of 2012).94 in particular, quebec has a high level
of concern (and resistance) regarding fossil fuel development and reliance, as
evidenced by major citizen concern and opposition to the proposed natural gas
power plant, Le Suroît (2004), and shale gas in quebec, which led to a recent
province-wide ban on hydraulic fracturing (fracking). it is notable that the main
theme of this year’s earth day march in montreal (50,000 people on april 21,
2013)95 was the opposition of the arrival of tar sands crude in quebec via the
Line 9 and energy east pipeline projects.96
in order to make prudent choices and properly protect the public interest, it
is vital that these choices be made via a high-quality decision-making process
involving substantial public involvement and access to relevant information.
and it is essential to rigorously weigh the benefits against the risks/costs of the
project and to examine who receives the benefits and who bears the risks/costs.
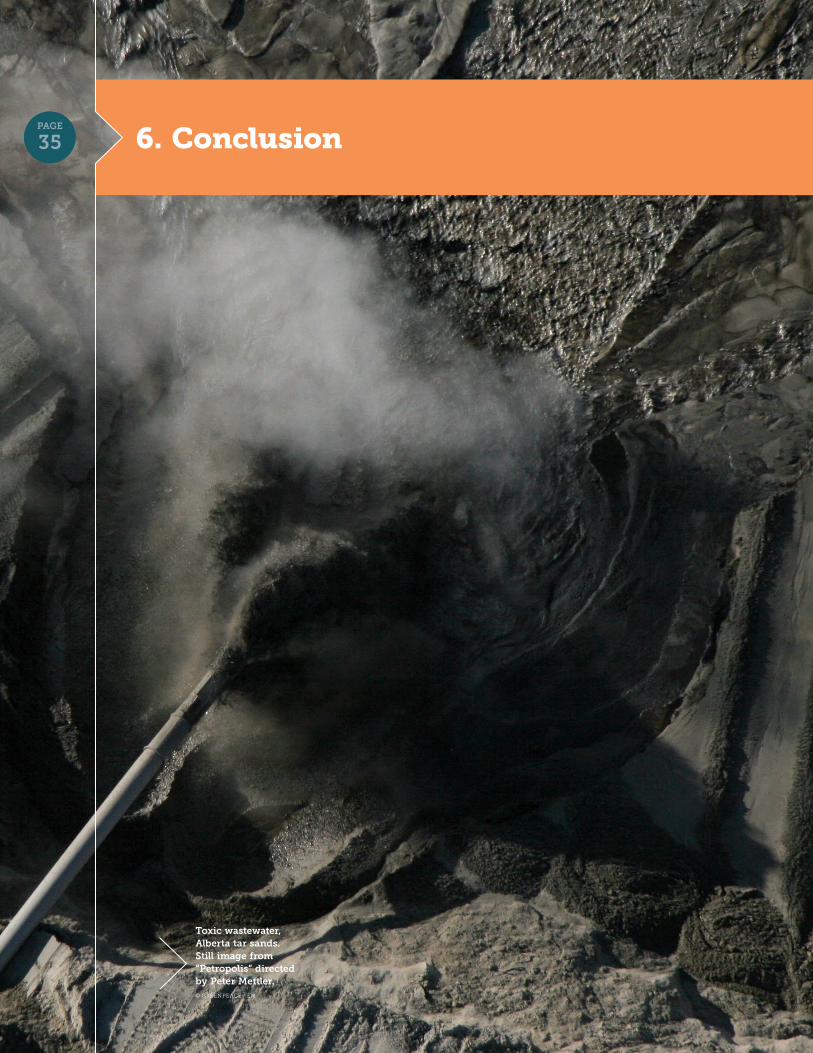
PaGE 35
Toxic wastewater, alberta tar sands. Still image from “Petropolis” directed by Peter Mettler.© GREENPEACE / EM
PaGE 35 6. Conclusion
PaGE 36
6. COnCLuSIOn ECONOMiCS Of TRANSPORTiNG AND PROCESSiNG TAR SANDS CRUDES iN QUEBEC
This report provides a guide for elements to be considered in a decision-
making process regarding quebec’s involvement in the transport and
processing of tar sands crudes. it concludes that turning quebec into a
conduit and upgrader for tar sands crudes allows profits to flow to the tar sands
proponents and refineries while environmental and risk externalities are borne
by the quebec public.
Tar sands proponents have claimed that quebec will benefit from the transport
and processing of tar sands crudes, notably in terms of economic development
(jobs and other spinoffs) and lower fuel (gasoline) prices. The analysis in this
report has refuted these claims by (a) quantifying the tiny economic and
employment benefits for quebec; and (b) explaining the disconnect between
the pricing of refined products (e.g., at the pump) and the price of crude.
quebec will not receive any significant benefits from more involvement with
tar sands crudes, but will bear almost all of the risk/cost of spills and other
environmental impacts. Conversely, tar sands proponents, will receive almost
all of the benefits and bear little, if any, environmental risk/cost.
by accepting these projects, quebec is taking a step backwards in terms of
healthy economic development. These high-impact, high-footprint projects
grow environmental and risk externalities without offsetting economic gain.
For decades, quebec has made a societal choice to reduce reliance on fossil
fuels (and GhG emissions). quebec should continue to move towards cleaner
energy by increasing investments in renewables, energy efficiency and public
transportation. not only would clean energy investments reduce environmental
and risk externalities, but they would allow quebec to reap more significant
and longer-lasting economic development benefits.
in light of this analysis of the benefits and costs of these projects, quebec
should ask itself the following question:
To benefit tar sands producers, pipeline companies and two refineries, should Quebec accept to be used as a conduit/upgrader for tar sands?
This report concludes that the answer to this question is a definite no.
The proposed projects involve running large quantities of heavy crude in close
proximity to major water ways (and drinking water sources) and through major
urban centres. moreover, in the current context, quebec’s choices regarding tar
sands have much more potential to affect tar sands expansion than they would
otherwise. Thus, not only would approval of the projects increase greenhouse
emissions from refining more heavy crude in quebec; but they have the
potential to have a much greater incremental impact on Canada’s overall GhGs
by enabling tar sands expansion. The report has shown that the benefits of these
projects are privatized, while the risks are socialized – with the environmental
externalities and GhG impacts borne by quebec citizens and by all inhabitants
of the planet. at a time when the concentration of Co2 in the atmosphere has
just passed the milestone level of 400 parts per million (ppm), quebec has the
unique opportunity to constrain the expansion of one of the dirtiest energy
projects on earth while rejecting an unhealthy high-risk economic pathway.
PaGE 37
EnDnOTES ECONOMiCS Of TRANSPORTiNG AND PROCESSiNG TAR SANDS CRUDES iN QUEBEC
1 See discussion of proponents’ claims and their sources in Section 3, Benefits from Transport and Processing of Tar Sands Crudes.
2 These calculations will be discussed in greater detail in Section 3 and specifically in endnotes 58 and 65.
3 See Section 3 for further discussion.
4 See Section 5 for further discussion.
5 The refinery location was originally within the town of St-Romuald, but this community has now merged into Lévis. The refinery is still referred to as Ultramar St-Romuald, but is also called Ultramar Lévis, as well as the Jean Gaulin refinery. This document will use the original name of Ultramar St-Romuald.
6 As concluded in Richard Kuprewicz’s expert report filed at the NEB: Kuprewicz, Richard, “Report on Pipeline Safety for Enbridge’s Line 9B Application to NEB,” August 5, 2013, Conclusion 4, p. 26. Accessed October 23, 2013. https://www.neb-one.gc.ca/ll-eng/livelink.exe?func=ll&objid=981150&objAction=Open
7 As concluded in TGG’s expert report filed at the NEB: “The Relative Economic Costs and Benefits of the Line 9B Reversal and Line 9 Capacity Expansion,” August 8, 2013, pp. 4-5. Accessed October 23, 2013.https://www.neb-one.gc.ca/ll-eng/livelink.exe?func=ll&objid=985663&objAction=Open
8 Canadian Association of Petroleum Producers (CAPP), “Crude Oil forecast, Markets & Transportation, June 2013, p. iv. Accessed October 23, 2013.http://www.capp.ca/getdoc.aspx?Docid=227308
9 Based on data available earlier in 2013.
10 Diluted bitumen. Raw bitumen (very heavy tar sands crude) is diluted for the purposes of pipeline transport. See endnote 18 for more details.
11 1 bpd = 6.29 m3/d. 1 barrel = 42 US gallons. imperial and Metric Units are both widely used in regard to the Canadian energy system, which is closely connected with the US energy system (where imperial Units are typically used). for simplicity and brevity, this report generally uses imperial Units (bpd).
12 There is significant overlap among these players, particularly among the tar sands producers, the pipeline companies and the refineries.
13 CAPP is the trade association for tar sands producers, as well as other oil and natural gas producers.
14 With the adoption of Bill C-38, the federal Cabinet now has the power to overrule decisions made by the NEB.
15 The Premier was quoted as saying: [Translation] “We are not ruling out Western oil. But there are rules to be followed— particularly with regard to the environment.” Castonguay, Alec, “Nous allons exploiter le pétrole du Québec,” L’actualité, April 1, 2013, p. 18. Accessed October 30, 2013. http://www.lactualite.com/politique/pauline-marois-nous-allons-exploiter-le-petrole-du-quebec/
16 Ontario regional and municipal governments have also expressed similar concerns and many local governments have applied for intervenor status before the NEB in the Line 9B case, which impacts Ontario, as well as Quebec.
17 On April 30, 2013, Enbridge filed this project schedule update with the NEB (A51669): “Pending the receipt of all necessary regulatory approvals, the planned construction start date for the Project is now scheduled for January 2014, with an anticipated in-service date in August 2014.”
18 The Alberta tar sands produce raw bitumen, a very heavy asphalt-like crude. To be transported by pipeline, bitumen must first be either a) mixed with a petroleum-based diluent (such as naphtha or condensate) to make it less viscous (diluted bitumen/dilbit), or b) upgraded (partially refined) into synthetic crude oil (SCO). Crudes are then processed at refineries to make finished (refined) products such as gasoline. Compared with heavy crudes, light crudes require less intensive refinery processing.
19 Beaudin, Monique, “Montreal calls for review of controversial Enbridge pipeline proposal,” Montreal Gazette, April 22, 2013. Accessed May 11, 2013. http://www.montrealgazette.com/technology/Montreal+calls+review+controversial +Enbridge+pipeline+proposal/8278859/story.html
PaGE 38
EnDnOTES ECONOMiCS Of TRANSPORTiNG AND PROCESSiNG TAR SANDS CRUDES iN QUEBEC
20 Ville de Montréal, Lettre de commentaires de la Ville de Montréal présentée à l’Office national de l’énergie dans le cadre de l’audience OH-002-2013, Projet d’inversion de la canalisation 9B et accroissement de la capacité de la canalisation 9 de la compagnie Pipeline Enbridge inc., le 4 juillet 2013, p. 10 (PDf p. 13). Accessed July 21, 2013.https://www.neb-one.gc.ca/ll-eng/livelink.exe/fetch/2000/130635/969935/A3i8z0_-_Lettre_de_commentaires_Ville_de_Montreal.pdf?nodeid=970155&vernum=0
21 See the map, containing data collected by Équiterre, which was made possible by the work of the staff and volunteers at Environmental Defence, Comité Environnement St-Césaire, NRDC and 350.org. Accessed October 30, 2013. https://maps.google.com/ps?q=docs://0B79w Vci3MuMfWGJ3Wm1KWlRSUfU
22 “Alberta commits $5-billion to TransCanada’s proposed Energy East pipeline,” financial Post, July 4, 2013. http://www.financialpost.com/m/wp/news/energy/blog.html?b=business.financialpost.com/2013/07/04/alberta-commits-5-billion-to-transcanadas-proposed-energy-east-pipeline
23 Quebec refineries currently have sufficient capacity to supply the provincial market, and (to a lesser extent) neighboring markets (Ontario and Northeast US), as well as long distance export markets (notably Europe). Maritimes refineries supply their relatively small local markets, and export most of their output (notably to the Northeast US). Thus, crude processed in the Maritimes is mainly supplying export markets for gasoline and other refined products.
24 The project is expected to be in service to Montreal and Quebec City in 2017 and to Saint John in 2018, according to the TransCanada Energy East Project website. Accessed January 9, 2014.http://www.energyeastpipeline.com/home/timeline/
25 Trans Quebec & Maritimes (TQM) Pipeline, operated by TC and jointly owned by TC and Gaz Metro. See http://www.gazoductqm.com/en/ and particularly http://www.gazoductqm.com/en/pdf/Carte.pdf, as well as http://www.bape.gouv.qc.ca/sections/rapports/publications/bape241.pdf
(figure 4, PDf p. 119), for details of TQM’s route, which is likely the same route that Energy East will follow from its entry into Quebec near Montreal (at Saint-Lazare) through to the Quebec City region.
26 According to a report by Maine Sierra Club, ExxonMobil’s subsidiary, imperial Oil and McColl frontenac, a wholly owned subsidiary of imperial Oil, own the remaining 76.2%. See http://maine.sierraclub.org/Tar%20Sands/ExxonMobilPMPL%20factsheet%20fiNAL%20 October%202012.pdf, especially graphic on p. 2 and endnote 7: “Registraire des entreprises du Québec (translated “Quebec Business Registry”), Registry filing updated April 16, 2012, available at: http://www.registreentreprises.gouv.qc.ca/en/
via search on Dossier No. 1143576941. Note that imperial Oil Limited owns 100% of McColl frontenac, another of the companies listed as owners of Montreal Pipe Line Limited. See also ExxonMobil, Annual Report (form 10-K), p. 12 (feb. 24, 2012). http://www.sec.gov/Archives/edgar/data/ 34088/000119312512078102/d257530d10k.htm.”
27 Plecash, Chris, “feds lobbying hard for oilsands at U.S. municipal, state levels, The HillTimes online,” April 14, 2013. Accessed October 30, 2013. http://www.hilltimes.com/news/news/2013/04/15/feds-lobbying-hard-for-oilsands-at--us-municipal-state-level/34346
28 Brewster, Murray and Shingler, Benjamin, “Quebec disaster: Oil shipments by rail have increased 28,000 per cent since 2009,” The Canadian Press, July 7, 2013. Accessed October 30, 2013.http://www.ctvnews.ca/canada/quebec-disaster-oil-shipments-by-rail-have-increased-28-000-per-cent-since-2009-1.1357356
29 Gauthier, Philippe, “Ultramar investit massivement dans la livraison du brut par rail à Lévis,” Montréal, Voir, July 19, 2013. Accessed October 30, 2013.http://voir.ca/philippe-gauthier/2013/07/19/ultramar-investit-massivement-dans-la-livraison-du-brut-par-rail-a-levis/
PaGE 39
EnDnOTES ECONOMiCS Of TRANSPORTiNG AND PROCESSiNG TAR SANDS CRUDES iN QUEBEC
30 Tight and/or shale oil is crude oil produced from low-permeable sandstone, carbonate and shale formations by hydraulic fracturing (fracking) and horizontal drilling (which are also used to produce shale gas). The evolution of these technologies has turned organic-rich shale formations (such as the Bakken in the Midwest and the Eagle ford in Texas) into some of the most productive fields in the world and has led to the recent very large and rapid growth in US oil and gas production. Light crude production from Canadian tight/shale oil also has a large potential and is growing.
31 in this report, Midcontinent North America designates the area of Canada and the US between the Rockies and Great Lakes/Appalachians, stretching south from the Canadian Prairies (AB/SK/MB) through the US Rocky Mountain and Midwest regions to the Gulf Coast. This area has extensive oil and gas production.
32 US Energy information Administration, May 2011. Accessed October 30, 2013. http://www.eia.gov/oil_gas/rpd/northamer_gas.jpg
33 As indicated on page 12, Suncor also owns 23.8% of PMPL.
34 The Montreal refinery might be able to process 15-20k bpd of heavy tar sands crudes, as well as a similar amount of tar sands SCO.
35 The coker project was put on hold in 2009, with substantial work already undertaken. Major equipment had already been delivered and is being stored in Montreal-East (west of Rue Cherrier). following a decision to restart the coker project, construction and commissioning would require another two to three years.
Petro-Canada, “investir au Québec pour l’avenir”. Accessed July 18, 2013.http://www.aiem.qc.ca/PC/PDf/Depliant_cokeur_fiNAL.pdf
Lewis, Jeff, “Suncor suffers first loss in more than 3 years as cheap oil hits Voyageur project,” financial Post, february 13, 2013. Accessed May 14, 2013.http://business.financialpost.com/2013/02/06/suncor-suffers-first-loss-in-more-than-3-years-as-cheap-oil-hits-voyageur-project/?__lsa=2afc-6caf
36 Once reconfigured, Montreal refinery crude supply could be up to 105k bpd of heavy tar sands crudes, with SCO providing most (or all) of the remainder.
37 in May 2013, Ultramar specified that given the current configuration of its Quebec refinery, it could not process dilbit or heavy crude - only syncrude and light crude. La Presse Canadienne, “Valero investira jusqu’à 200 millions au Quebec si Enbridge inverse son pipeline,” May 23, 2013. Accessed October 30, 2013.http://www.radio-canada.ca/regions/quebec/ 2013/05/23/014-enbridge-valero-pipeline.shtml
38 Krugel, Lauren, “TransCanada does not foresee major resistance to eastern oil pipe proposal,” Globe and Mail, November 14, 2012. Accessed May 16, 2013.http://www.theglobeandmail.com/globe-investor/transcanada-does-not-foresee-major-resistance-to-eastern-oil-pipe-proposal/article5278311/
39 Nadeau, Jean-Benoît and Duhamel, Pierre, “L’or noir en 22 questions,” L’actualité, April 1, 2013, p. 26;
McClearn, Matthew, “Energy East is good for Canada, not the oilsands,” Canadian Business, May 1, 2013. Accessed May 16, 2013.http://www.canadianbusiness.com/Companies-and-industries/good-for-canada-not-the-oil-sands/
40 Canadian Association of Petroleum Producers, “Oil Sands today, Economic Contribution.” Accessed October 30, 2013. http://www.oilsandstoday.ca/EnergyEcon Environ/Pages/EconomicContribution.aspx?gclid=CJ-9jcrHk7cCfaNhMgodCS0A9Q
41 Castonguay, Alec, “Le Québec a un avantage que nous n’avons pas,” L’actualité, April 1, 2013, p. 22.
42 Natural Resources Canada News Release, “Harper Government Supports Canadian Workers and Helps Replace Costly foreign Oil,” April 11, 2013. Accessed July 17, 2013. http://www.nrcan.gc.ca/media-room/news-release/2013/7036
“Video: Natural Resources Minister Joe Oliver,” Montreal Gazette, April 11, 2013. Accessed May 16, 2013. http://www.montrealgazette.com/news/montreal/Video+Natural+Resources+ Minister+Oliver/8231247/story.html
PaGE 40
EnDnOTES ECONOMiCS Of TRANSPORTiNG AND PROCESSiNG TAR SANDS CRUDES iN QUEBEC
“Oléoduc vers l’Est : Ottawa applaudit l’appel de soumissions de TransCanada,” Le Devoir, April 2, 2013. Accessed May 16, 2013. http://www.ledevoir.com/politique/canada/ 374691/oleoduc-vers-l-est-ottawa-applaudit- l-appel-de-soumissions-de-transcanada
43 As explained by Suncor and Valero to investors, refining is a global business; global market conditions impact refiners in every market because products are generally very storable, transportable, and fungible commodities; prices for refined products are tied to global markets based on Brent (the benchmark for global crude pricing); Quebec is part of the Atlantic Basin where refined products (including gasoline and diesel) are widely traded throughout the intercontinental market; Valero and Suncor are using lower cost crude supply to increase profits and shareholder value, and to return cash to shareholders.
Suncor 2012 Annual Report (especially pp. 7-8, 11, 20-21, 27-29, 39-42, 53, 65) and Q1 2013 investor Presentation. Accessed May 16, 2013. http://www.suncor.com/pdf/Suncor_Annual_Report_2012_en.pdf
http://www.suncor.com/pdf/Suncor_iR_Presentation_April_2013_v3.pdf
“Valero Citi Global Energy Conference Presentation,” May 14, 2013. Accessed May 16, 2013. http://phx.corporate-ir.net/External.file?item=UGfyzW50SUQ9MTg1NzM5fE NoaWxkSUQ9LTf8VHlwzT0z&t=1
The market analysis described above (and presented to investors by Suncor and Valero) is broadly consistent with other market analysis regarding refinery economics and pricing for gasoline and other refined products (including that presented by federal and provincial government agencies and energy suppliers). Accessed January 31, 2014.
Natural Resources Canada, “Crude Oil and Petroleum Products Market,” October 8, 2013.http://www.nrcan.gc.ca/energy/crude-petroleum/4541
Natural Resources Canada, “Petroleum Products and Crude Oil Prices,” January 22, 2014.http://www.nrcan.gc.ca/energy/fuel-prices/ 4593
Régie de l’énergie, “Rapport sur les différents mécanismes de contrôle des prix des produits pétroliers et sur la pertinence d’adopter de telles mesures au Québec,” July 2011.http://www.regie-energie.qc.ca/documents/autres/RapportMinistre_ControlePrixProduits Petroliers_juillet2011.pdf
http://canadianfuels.ca/userfiles/file/CPPi%20Presentation%20to%20Standing%20Committee%20June%202011%20ENG.pdf
Ervin, Michael J. “A Brief to the Standing Committee on industry, Science and Technology,” June 22, 2011.http://www.kentmarketingservices.com/dnn/LinkClick.aspx?fileticket=RNzladVtT54%3d& tabid=121
MJ Ervin Associates, “Canadian Retail Markets Study, A Review of Competitiveness in the Canadian Refined Petroleum Marketing industry,” September 15, 1997.http://www.kentmarketingservices.com/dnn/LinkClick.aspx?fileticket=1vzJ6i_fNXo%3d& tabid=107
44 Hadekel, Peter, “Peter Hadekel: Pipeline a good deal for Quebec,” Montreal Gazette, April 11, 2013. Accessed May 16, 2013.http://www.montrealgazette.com/business/Peter+ Hadekel+Moving+crude+from+west+ east+good+deal+Quebec/8230326/story.html
45 US Department of State, “Draft Supplemental Environmental impact Statement for the Keystone XL Project,” pp. 1.4-64 – 1.4-66 and Appendix C, pp. 6-13. Accessed July 17, 2013.http://keystonepipeline-xl.state.gov/documents/organization/205654.pdf
46 Compared with inland locations (such as the US Midwest), markets for gasoline and other refined products in coastal locations (such as Quebec) will tend to be even more closely connected with global markets (reflecting global crude prices). if access to cheaper crudes has not led to lower prices for consumers in the US Midwest, it is even less likely that access to tar sands (and other cheaper crudes) will result in lower prices for consumers in Quebec.
PaGE 41
EnDnOTES ECONOMiCS Of TRANSPORTiNG AND PROCESSiNG TAR SANDS CRUDES iN QUEBEC
47 Daniel Cloutier (National Representative, Communications, Energy and Paperworkers Union), House of Commons Standing Committee on Natural Resources, Evidence May 9, 2013, p. 4 (PDf p. 6). Accessed July 17, 2013.http://www.parl.gc.ca/content/hoc/Committee/ 11/RNNR/Evidence/EV6154633/RNNREV81-E.PDf
[Translation] “The Montreal refinery […] employs some 500 people, about half of whom are unionized.”
Valero Jean Gaulin Refinery Overview: “Employs approximately 500 individuals.” Accessed July 17, 2013. http://www.valero.com/OurBusiness/OurLocations/Refineries/Pages/QuebecCity.aspx
The above figures for Quebec refinery employment are broadly consistent with other data sources, including:
Statistics Canada, CANSiM Table 383-0030, jobs data for Quebec Petroleum refineries [BS32411]. Accessed July 17, 2013. http://www5.statcan.gc.ca/cansim/a26?lang= eng&retrLang=eng&id=3830030&tabMode= dataTable&srchLan=-1&p1=-1&p2=9
Natural Resources Canada News Release, “Harper Government Supports Canadian Workers and Helps Replace Costly foreign Oil,” April 11, 2013. Accessed July 17, 2013. http://www.nrcan.gc.ca/media-room/news-release/2013/7036
Petro-Canada, “investir au Québec pour l’avenir.” Accessed July 17, 2013. http://www.aiem.qc.ca/PC/PDf/Depliant_cokeur_fiNAL.pdf
48 Compared with employment, refineries will tend to have a larger impact on total economic activity, as typically measured based on value-added/GDP (gross domestic product). in practice for refineries, much of this value-added is return on capital to the investors that provide financing for the capital-intensive activities relating to crude processing. for refineries in Quebec, which are owned by companies based in Alberta and Texas, many of the investors will be located outside of Quebec.
Value-added/GDP: the difference between the value of output (sales) and the cost of intermediate inputs (goods and services purchased from other businesses). Stated another way, it represents the value that is added by the application of labour and capital in converting intermediate inputs to finished products. Value-Added is a measure of overall economic activity, which includes Earnings (compensation for Employment), interest, and profits. Value-Added at the regional, provincial, and national level is equivalent to GDP.
49 Todd Crawford, “Canada’s Petroleum Refining Sector: An important Contributor facing Global Challenges,” The Conference Board of Canada, October 2011, p. 22. Accessed July 18, 2013. http://canadianfuels.ca/userfiles/file/12-051_CanadaPetroleumRefiningSectorfiNAL.pdf
“Today, refining activity accounts for 0.2 per cent of real GDP in Quebec.”
This study was undertaken for Canadian Petroleum Products institute (CPPi), an association of companies involved in the refining, distribution and marketing of petroleum products in Canada. Conference Board of Canada, “News release: Canada’s refining sector under pressure,” October 31, 2011. Accessed October 30, 2013. http://www.canadianfuels.ca/userfiles/file/NEWS%20RELEASE%20-%20CBoC%20 report%20-%2031_10_2011(1).pdf
The above figure for Quebec refinery share of total economic activity is broadly consistent with other data sources, including:
Statistics Canada, CANSiM Table 379-0030, GDP data for Quebec Petroleum refineries [32411], Petroleum and coal product manufacturing [324], and All industries [T001] for 2007-2012. Accessed July 18, 2013.http://www5.statcan.gc.ca/cansim/a26?lang= eng&retrLang=eng&id=3790030&tabMode= dataTable&srchLan=-1&p1=-1&p2=9
50 As noted in endnote 49, the Conference Board study was undertaken for CPPi, an association of refiners and companies involved in supplying petroleum products in Canada. in turn, the Conference Board study was relied upon as an input to the study of Line 9 economic impacts prepared for Enbridge:
PaGE 42
EnDnOTES ECONOMiCS Of TRANSPORTiNG AND PROCESSiNG TAR SANDS CRUDES iN QUEBEC
Demke Management Ltd., “An Evaluation of the Economic impacts on Canada of the Enbridge Line 9B Reversal Project,” August 30, 2012, pp. 28-29 (PDf pp. 33-34). Accessed July 18, 2013. https://www.neb-one.gc.ca/ll-eng/livelink.exe?func=ll&objid=965026&objAction=Open
The economic impacts of the Montreal refinery were estimated in studies prepared for Petro-Canada (which merged with Suncor in 2009):Petro-Canada, “La raffinerie de Petro-Canada : impact économique.” Accessed July 18, 2013. http://www.aiem.qc.ca/PC/PDf/Depliant_%20 ret-economiques_cokeur_fiNAL.pdf
Petro-Canada, “investir au Québec pour l’avenir.” Accessed July 17, 2013. http://www.aiem.qc.ca/PC/PDf/Depliant_ cokeur_fiNAL.pdf
51 The studies described in endnotes 49 and 50 utilize input-Output (i-O) models. To estimate employment and other economic spin-off effects, i-O models generate regional economic impact estimates by first tracing the industries involved in a study region throughout successive rounds of supply linkages. At each step, they trace the portion of the inputs required from each industry, which are supplied locally (within the regional economy being modeled). input-Output analyses consider a wide range of job impacts and include the following categories of effects:
Direct Effects — first round impacts of a set of expenditures, i.e. those occurring before the involvement of supporting supply linkages;
Indirect Effects — impacts generated through subsequent purchases by suppliers of materials and services to sustain the original activities;
Induced Effects — impacts generated by workers spending incomes earned through direct and indirect employment activities;
Total Effects — the sum of the direct, indirect, and induced effects.
52 The Conference Board study modeled a scenario with a 10% reduction in Canadian refining capacity, or about 200k bpd. The initial reduction in refining GDP (about $270 million annually in 2002 $) was estimated to a result in decline in total Canadian GDP of about $806 million annually. So for every $1 reduction in refining GDP, total GDP was estimated to be reduced by about $3.
Todd Crawford, “Canada’s Petroleum Refining Sector: An important Contributor facing Global Challenges,” The Conference Board of Canada, October 2011. Accessed July 18, 2013.http://canadianfuels.ca/userfiles/file/12-051_CanadaPetroleumRefiningSectorfiNAL.pdf pp. 30-35, notably p. 34; Demke Management Ltd., “An Evaluation of the Economic impacts on Canada of the Enbridge Line 9B Reversal Project,” August 30, 2012. Accessed October 30, 2013.https://www.neb-one.gc.ca/ll-eng/livelink.exe?func=ll&objid=965026&objAction=Openp. 29 (PDf p. 34).
The above estimates suggest that, with a very broad range of spin-offs considered, the Quebec refining sector (with a total capacity of about 400k bpd at Suncor Montreal and Ultramar St-Romuald) contributes to about $2 billion (2012 $) in Canadian GDP.
Some of these impacts on overall economic activity will occur outside Quebec, especially since refining is a highly specialized activity relying upon a supply chain that involves other provinces (and countries). The study of Line 9 economic impacts prepared for Enbridge relied upon the Conference Board study and considered a variety of ways in which lower cost crude supply and thus enhanced profitability for Quebec refineries could result in additional economic activity within Quebec and elsewhere in Canada. Depending on the specific types of spin-offs assumed, 17-49% of the national impact on GDP was estimated to occur outside Quebec (pp. 27-31, PDf pp. 32-36).
Considered in combination, these two studies suggest that the Quebec refining sector contributes to about $2 billion in Canadian GDP, and that at least 25% of the national impact occurs outside Quebec. Thus, even with a very broad range of spin-offs considered, the annual impact on Quebec GDP is $1.5 billion (or less), or 0.50% (or less) of the total.
53 Daniel Cloutier (National Representative, Communications, Energy and Paperworkers Union), House of Commons Standing Committee on Natural Resources, Evidence May 9, 2013, p. 4 (PDf p. 6). Accessed July 17, 2013. http://www.parl.gc.ca/content/hoc/Committee/411/RNNR/Evidence/EV6154633/RNNREV81-E.PDf
PaGE 43
EnDnOTES ECONOMiCS Of TRANSPORTiNG AND PROCESSiNG TAR SANDS CRUDES iN QUEBEC
[Translation] “The Montreal refinery […] uses the services of hundreds of subcontractors to assist with maintenance, plant shutdowns and so on. The number of indirect jobs attributable to the refinery is also very high. When the Shell refinery shut down in 2010-11, it was determined that the number of indirect jobs was three or four to one. We believe that the same ratio applies in this case.”
As discussed in endnote 52, the Conference Board study modeled a scenario with a 10% reduction in Canadian refining capacity, or about 200k bpd. This reduction in refining capacity was estimated to a result in decline in total Canadian employment of about 7700 jobs annually.
Todd Crawford, “Canada’s Petroleum Refining Sector: An important Contributor facing Global Challenges, The Conference Board of Canada,” October 2011. Accessed July 18, 2013.http://canadianfuels.ca/userfiles/file/12-051_CanadaPetroleumRefiningSectorfiNAL.pdfpp. 30-35, notably p. 35;
Demke Management Ltd., “An Evaluation of the Economic impacts on Canada of the Enbridge Line 9B Reversal Project,” August 30, 2012. Accessed October 30, 2013.https://www.neb-one.gc.ca/ll-eng/livelink.exe?func=ll&objid=965026&objAction=Openp. 29 (PDf p. 34).
The above estimates suggest that, with a very broad range of spin-offs considered, the Quebec refining sector (with a total capacity of about 400k bpd at Suncor Montreal and Ultramar St-Romuald) results in about 15,400 Canadian jobs.
Some of these impacts on overall employment will occur outside Quebec, especially since refining is a highly specialized activity relying upon a supply chain that involves other provinces (and countries). The study of Line 9 economic impacts prepared for Enbridge relied upon the Conference Board study and considered a variety of ways in which lower cost crude supply and thus enhanced profitability for Quebec refineries could result in additional economic activity within Quebec and elsewhere in Canada. Depending on the specific types of spin-offs assumed, 16-46% of the national impact on jobs was estimated to occur outside Quebec. (pp. 27-31, PDf pp. 32-36).
Considered in combination, these two studies suggest that the Quebec refining sector contributes to about 15,400 Canadian jobs, and that at least 23% of the national impact occurs outside Quebec. Thus, even with a very broad range of spin-offs considered, the annual impact on Quebec employment is 12,000 (or less), or 0.30% (or less) of the total.
The above figures for Quebec refinery employment are broadly consistent with the economic impacts estimated for the Montreal refinery in a study prepared for Petro-Canada (which merged with Suncor in 2009). Petro-Canada, La raffinerie de Petro-Canada : impact économique. Accessed July 18, 2013. http://www.aiem.qc.ca/PC/PDf/Depliant_%20 ret-economiques_cokeur_fiNAL.pdf
With a broad range of spin-offs considered, the Montreal refinery was estimated to result in 4,678 Quebec jobs (3,361 in Montreal and 1,317 elsewhere in Quebec). The Montreal refinery (137k bpd) accounts for about one-third of overall Quebec refining capacity (about 400k bpd together with Ultramar St-Romuald). But while smaller in overall capacity than the St-Romuald refinery, the Montreal refinery processes a wider range of crudes, produces a wider range of products, and (as discussed in endnote 47) is reported to have a similar number of direct employees. if it is assumed that the Montreal refinery accounts for about 40% of total Quebec employment relating to refining (including a broad range of spin-offs), the employment impacts estimated by Petro-Canada for the Montreal refinery (4678 jobs) would scale up to about 11,700 jobs for the total Quebec refining sector (including Ultramar St-Romuald). This estimate is thus broadly consistent with the estimate derived above based on the Conference Board and Enbridge Line 9 studies (12,000 jobs or less for the total Quebec refining sector).
54 See endnote 47.
55 See endnote 53.
56 See endnote 52.
PaGE 44
EnDnOTES ECONOMiCS Of TRANSPORTiNG AND PROCESSiNG TAR SANDS CRUDES iN QUEBEC
57 Since the 1980s, the Quebec refining sector has undergone significant restructuring. A number of Montreal refineries have closed, but the remaining refineries (in Montreal and St-Romuald) have expanded. As confirmed by data and analysis provided by the Quebec government and the companies involved in refining, overall refining capacity and output have been relatively constant and have not declined over the long-term.
Ministère des ressources naturelles du Québec, Raffinage du pétrole. Accessed October 30, 2013. http://www.mrn.gouv.qc.ca/energie/statistiques/statistiques-production-petrole.jsp
Todd Crawford, “Canada’s Petroleum Refining Sector: An important Contributor facing Global Challenges,” The Conference Board of Canada, October 2011. Accessed July 18, 2013.http://canadianfuels.ca/userfiles/file/12-051_CanadaPetroleumRefiningSectorfiNAL.pdfpp. 22-23.
58 Prior to the Montreal refinery coker project being put on hold in 2009, its economic impacts were estimated in a study prepared for the refinery owner (Petro-Canada, which merged with Suncor in 2009).
Petro-Canada, “investir au Québec pour l’avenir.” Accessed July 18, 2013. http://www.aiem.qc.ca/PC/PDf/Depliant_cokeur_fiNAL.pdf
Construction of the coker project was estimated to result in 8568 person-years of employment in Quebec, including 5523 person-years in Montreal (one person-year = one full-time job for one person for one year). Operation of the coker project is estimated to result in 650 person-years of employment in Quebec, including 209 person-years in Montreal.
The Petro-Canada analysis of the coker project likely assumes a wide range of potential spin-offs (and thus estimates larger impacts on employment and overall economic activity). The Petro-Canada analysis does not provide much explanation, but it appears to be based on the same methodology utilized in an accompanying analysis of Montreal refinery economic impacts (including on employment), which considered a wide range of economic spin-offs.
Petro-Canada, La raffinerie de Petro-Canada : impact économique. Accessed July 18, 2013. http://www.aiem.qc.ca/PC/PDf/Depliant_%20 ret-economiques_cokeur_fiNAL.pdf
The results of the above Petro-Canada analysis of the coker project are broadly consistent with results of other analyses, including the analysis prepared by Enbridge for the Line 9 project (and related refinery upgrade projects):
Demke Management Ltd., An Evaluation of the Economic impacts on Canada of the Enbridge Line 9B Reversal Project, August 30, 2012. Accessed July 18, 2013. https://www.neb-one.gc.ca/ll-eng/livelink.exe?func=ll&objid=965026&objAction=Open
As discussed in endnote 65, the multiplier for refinery upgrade projects in Quebec is in the order of 8 person-years of Quebec employment per $1 million project costs (for a broad range of economic spin-offs including direct, indirect, and induced jobs). As discussed on page 14, the Montreal coker project is estimated to cost $1 billion plus. Assuming a spend of $1 billion plus and a multiplier in the order of 8 person-years of Quebec employment per $1 million project costs, the coker project impact in Quebec might thus be in the order of 8000 plus person-years of employment in Quebec.
59 See endnote 58.
60 See pages 29-30 and endnotes 84 and 86.
61 Association industrielle de l’Est de Montréal (AiEM) Press Release, “We say YES to the line 9 reversal project,” May 29, 2013. Accessed July 20, 2013.http://www.newswire.ca/en/story/1174043/we-say-yes-to-the-line-9-reversal-project
A large group of business and union organizations have come together today to officially launch the Coalition in support of the Line 9 reversal project, a project that will safely allow Quebec to become less dependent on oil from Africa, the Middle East and Europe while maintaining nearly 2,000 jobs in the petrochemical refining industry in Quebec.
“Quebec must take advantage of this promising project as well as help save our two remaining refineries by creating and maintaining 2,000 high-paying, direct and indirect jobs. […]”
PaGE 45
EnDnOTES ECONOMiCS Of TRANSPORTiNG AND PROCESSiNG TAR SANDS CRUDES iN QUEBEC
“The Line 9 reversal project is important for the economic development of Montreal East because it will ensure the viability of Quebec’s petrochemical industry, its polyester supply chain, and a more competitive source of supply.”
62 Daniel Cloutier (National Representative, Communications, Energy and Paperworkers Union), in response to M. Jamie Nicholls (Vaudreuil-Soulanges, NDP): House of Commons Standing Committee on Natural Resources, Evidence May 9, 2013, p. 9 (PDf p. 11). Accessed July 17, 2013. http://www.parl.gc.ca/content/hoc/Committee/ 411/RNNR/Evidence/EV6154633/RNNREV81-E.PDf
[Translation] Mr. Jamie nicholls: Do you know how many jobs are tied to the polyester chain?
Mr. Daniel Cloutier: We know up to a point.
first, the product leaves Petro-Canada and travels to Parachem’s petrochemical plant. We’re talking about a hundred or so jobs. it also goes to CEPSA. So that’s 150 jobs. Neither of those includes the subcontractors. Next, various plants take it back. There’s a small facility on the former Shell site, with a hundred jobs or so.
Afterwards, the product travels in all the other directions, and i lose track of it.
63 Ville de Montréal, Lettre de commentaires de la Ville de Montréal présentée à l’Office national de l’énergie dans le cadre de l’audience OH-002-2013, Projet d’inversion de la canalisation 9B et accroissement de la capacité de la canalisation 9 de la compagnie Pipeline Enbridge inc., le 4 juillet 2013, p. 14 (PDf p. 17). Accessed July 18, 2013.https://www.neb-one.gc.ca/ll-eng/livelink.exe/fetch/2000/130635/969935/A3i8z0_-_Lettre_de_commentaires_Ville_de_Montreal.pdf?nodeid=970155&vernum=0
[Translation] According to the intercensal estimates produced by the Comité de recherches économiques de la région de Montréal [Montreal region economic research committee], in 2011 there were some 1,238 jobs in the petroleum and coal products manufacturing sector, on the territory of the Montreal agglomeration, plus another 2,712 in the chemicals sector (excluding pharmaceutical products) and
4,728 in the plastics manufacturing sector. [footnote 9 in original: Source: Statistics Canada, Census of Canada, 2006, workplace-customized product; intercensal estimates, Consortium de la Communauté métropolitaine de Montréal (CMM).] Companies in these sectors are mostly located within the Borough of Rivière-des-Prairies–Pointe-aux-Trembles and the City of Montreal Est. for illustration purposes, polyester production on the eastern part of the island accounts for approximately 1% of the world’s total output.
64 As explained above (see page 20 and endnotes 52 through 56), even if it is assumed that the Quebec refineries result in a very wide range of spin-offs, the impact on overall Quebec employment of the refinery sector is estimated to be 0.30% (or less) of the provincial total, and 0.50% (or less) of the provincial total for all economic activity (GDP). But even if the above estimates of spin-offs do not fully account for all aspects of spin-offs relating to the Montreal petrochemical complex and it is assumed that the Quebec refineries result in a particularly wide range of spin-offs including a very wide range of activities relating to petrochemicals, the impact on overall Quebec employment and economic activity is less than 1% of the total, and likely substantially less than 1%. Put more simply, the Quebec crude oil and Montreal petrochemical sectors are a very small part of overall Quebec and Montreal employment and economic activity, such that processing of tar sands crudes will result in minimal (if any) economic development for Quebec.
65 To gauge the overall contribution of pipelines to jobs and economic activity, we have used a similar approach as we used above to gauge the overall contribution of refineries to jobs and economic activity (see endnotes 49, 50, and 51). We have reviewed studies that use economic models to estimate spin-off effects. Moreover, in an effort to be conservative (i.e. to not understate the contribution of pipelines to overall jobs and economic activity), we have focused on studies used by companies operating pipelines in Quebec and throughout Canada. Projections of jobs and other economic activity, which take into account a broad range of economic spin-offs, are commonly prepared for major pipeline projects in Canada (and less frequently in the US).
PaGE 46
EnDnOTES ECONOMiCS Of TRANSPORTiNG AND PROCESSiNG TAR SANDS CRUDES iN QUEBEC
in analyses of employment impacts, it is standard practice to provide results in terms of multipliers. in particular, a useful summary metric is jobs per dollar (person-years of employment per $1 million of project-related spending). Multipliers facilitate comparison of results within and across studies. With results expressed in terms of multipliers, projects (and other activities) with differing levels of spending can be compared to determine relative intensity of impacts.
The studies reviewed indicate that multipliers for pipeline construction and refinery upgrade projects in Quebec are in the order of 8 person-years of Quebec employment per $1 million project costs (for a broad range of economic spin-offs including direct, indirect, and induced jobs). Multipliers for pipeline operations in Quebec are in the order of 4 to 6 person-years of Quebec employment per $1 million pipeline revenues/operating costs.
in evaluating multipliers for these projects (including Line 9 and Energy East), we have mainly relied on the analyses prepared by Enbridge for the Line 9 and Northern Gateway Projects:
Demke Management Ltd., “An Evaluation of the Economic impacts on Canada of the Enbridge Line 9B Reversal Project,” August 30, 2012. Accessed July 18, 2013. https://www.neb-one.gc.ca/ll-eng/livelink.exe?func=ll&objid=965026&objAction=Open
Enbridge Northern Gateway Project, “Volume 6C: Environmental and Socio-Economic Assessment (ESA)-Human Environment,” Section 4: Socio-Economic Conditions. Accessed July 18, 2013.https://www.neb.gc.ca/ll-eng/livelink.exe/fet ch/2000/90464/90552/384192/620327/624798/ 620129/B3-16_-_Vol_6C_–_Gateway_ Application_–_Human_Environment_ESA_ (Part_1_of_3)_-_A1T0G6_.pdf?nodeid= 620083&vernum=0
The results of the above analyses of pipeline project impacts are broadly consistent with results of other analyses for major pipeline projects, including for Ultramar Pipeline Saint-Laurent (see endnote 85), Enbridge Alberta Clipper, and TransCanada Keystone XL:
Bureau d’audiences publiques sur l’environnement (BAPE), “Projet de construction de l’oléoduc Pipeline Saint-Laurent entre Lévis et Montréal-Est: Rapport d’enquête et d’audience publique. Rapport 243,” July 2007, pp. 77-78. Accessed May 16, 2013. http://www.bape.gouv.qc.ca/sections/rapports/publications/bape243.pdf
Enbridge Alberta Clipper Project, “Volume ii, Appendix iii: Economic Effects of Enbridge Pipeline inc.’s Alberta Clipper Project,” April 2007. Accessed July 18, 2013.https://www.neb-one.gc.ca/ll-eng/livelink.exe?func=ll&objid=465077&objAction=Open
US Department of State, “Draft Supplemental Environmental impact Statement for the Keystone XL Project,” pp. 4.10-1 – 4.10-42. Accessed July 17, 2013.http://keystonepipeline-xl.state.gov/documents/organization/205612.pdf
The above analyses indicated that Quebec jobs and other impacts would be very close to zero for Line 9 and very small for Energy East. for the Line 9 project, the total spend for project construction by Enbridge (including design and permitting) would be tiny (around $120 million); the share of the spend in Quebec would be even smaller (around $50 million). Construction of the Line 9 project is estimated to result in around 400 person-years of employment in Quebec (for a broad range of economic spin-offs including direct, indirect, and induced jobs). Project design, permitting, and construction would be spread over two or more years (during 2012-2014, as now assumed by Enbridge, see page 8 and endnote 17). So the impact of the Line 9 project on the Quebec economy and jobs would be about 200 jobs per year annually over a period of two or more years. The impact of pipeline operations on the Quebec economy and jobs would be about 70 jobs annually (for a broad range of economic spin-offs including direct, indirect, and induced jobs); there would be only 4 full-time equivalent workers located in Quebec directly involved in pipeline operations.
PaGE 47
EnDnOTES ECONOMiCS Of TRANSPORTiNG AND PROCESSiNG TAR SANDS CRUDES iN QUEBEC
in addition to the spend by Enbridge, both Suncor and Ultramar might undertake some capital investments in relation to the Line 9 project; however, the spend and associated jobs and economic activity are also tiny and would not have a material effect on overall employment and other economic activity throughout the province or in Montreal:
[Translation] Suncor refinery management estimates the necessary investment at some $55 million. Ultramar estimates that $110 million would be required, at their Montreal port facilities. These investments, if undertaken, would generate about 150 jobs for a period of 18 months, and additional annual revenue for the Port of Montreal. in the event that Ultramar decided to use local shipowners to transport this oil to its refinery in Lévis, around a hundred permanent jobs could be created.
Ville de Montréal, “Lettre de commentaires de la Ville de Montréal présentée à l’Office national de l’énergie dans le cadre de l’audience OH-002-2013,” Projet d’inversion de la canalisation 9B et accroissement de la capacité de la canalisation 9 de la compagnie Pipeline Enbridge inc.,le 4 juillet 2013, p. 14 (PDf p. 17).https://www.neb-one.gc.ca/ll-eng/livelink.exe/fetch/2000/130635/969935/A3i8z0_-_Lettre_de_commentaires_Ville_de_Montreal.pdf?nodeid=970155&vernum=0
for Energy East, the amounts that would be spent would be somewhat more significant than for Line 9. The total spend by TransCanada for project construction (including design and permitting) for the entire project (Alberta to New Brunswick) is estimated to be $12 billion. The Quebec segment of the project could have relatively high costs, since there would be substantial new pipeline construction in Quebec, as well as a terminal and port facilities in the Quebec City area. Spend for the Quebec segment could thus be in the order of $3 billion.
Assuming a spend of $3 billion and a multiplier for pipeline construction projects in Quebec in the order of 8 person-years of Quebec employment per $1 million project costs (for a broad range of economic spin-offs including direct, indirect, and induced jobs), the Energy East project impact in Quebec might thus be in the order of 24,000 person-years of employment in Quebec. This
estimated Energy East project impact in Quebec would be equivalent to about 0.60% of the total Quebec economy and jobs. Energy East project design, permitting and construction would be spread over a period of four or more years (during 2013-2018, as now assumed by TransCanada, see page 11 and endnote 24). So the impact of the Energy East project on the Quebec economy and jobs would be less than 0.20% annually over a period of four or more years.
The Energy East Project has some similarities to the Northern Gateway Project, which would include construction and operation of a large marine and tank terminal on the BC Coast, as well as twin large diameter pipelines across BC and a portion of Alberta. Compared with the BC segment of Northern Gateway, the Quebec segment of Energy East may be a somewhat smaller, simpler, and less expensive project, which would thus have somewhat smaller economic impacts. Moreover, when viewed in the relevant context of the broader regional, provincial/state, and national economies where they are situated, construction and operations of even major pipeline projects (including Energy East, Northern Gateway, and Keystone XL) involve relatively small expenditures and thus will not result in large economic spin-offs that are significant in the context of the broader economy.
Operation of the Northern Gateway project is estimated to result in about 560 jobs annually in BC (for a broad range of economic spin-offs including direct, indirect, and induced jobs); direct operations employment for Northern Gateway in BC is estimated at 78 workers, plus another 113 workers supplying services associated with operations of the Kitimat Terminal (including tug operators, pilots, emergency response staff and various other service providers). Operation of the Energy East project in Quebec (which may be a somewhat smaller, simpler, and less expensive project relative to the BC segment of Northern Gateway) might thus result in about 500 jobs annually in Quebec. in September 2013, TransCanada provided a more detailed economic analysis of the Energy East project by Deloitte, which estimated impacts on jobs and economic activity. TGG has reviewed this study and concluded that TransCanada’s estimates (as provided by Deloitte) are not substantially different from our estimates, and therefore do not change the main conclusions in this report.
PaGE 48
EnDnOTES ECONOMiCS Of TRANSPORTiNG AND PROCESSiNG TAR SANDS CRUDES iN QUEBEC
Deloitte, “Energy East: The economic benefits of TransCanada’s Canadian Mainline conversion project,” September, 2013. Accessed January 10, 2014.http://www.energyeastpipeline.com/wp-content/uploads/2013/09/Energy-East-Deloitte-Economic-Benefits-Report.pdf
66 See endnote 65 for analyses regarding the jobs and other impacts for the Line 9 and Energy East projects. Regarding the use of Energy East and Quebec as a conduit to supply markets elsewhere, see Section 2, page 11 and endnote 23, and Section 3c, page 25 and endnote 75.
67 See endnotes 58 and 65.
68 As shown in endnotes 58 and 65, even assuming a broad range of economic spin-offs (including direct, indirect, and induced jobs) for the Line 9, Energy East, and Suncor coker projects, the combined impact of pipeline and coker operations on the Quebec economy and jobs is estimated to be less than 1400 jobs annually, or less than 0.04% of total provincial jobs. The combined impact of pipeline operations (without the coker) would be about half, or less than than 0.02% of total provincial jobs.
69 See endnote 44.
70 Blue Green Canada, “More Bang for Our Buck: How Canada Can Create More Energy Jobs and Less Pollution,” November 2012. http://bluegreencanada.ca/sites/default/files/resources/More%20Bang%20for%20Buck%20 Nov%202012%20fiNAL%20WEB.pdf
71 Duchaine, Thomas and Hugo Séguin, “Pour un Québec libéré du pétrole en 2030,” September 25, 2009. http://www.equiterre.org/sites/fichiers/document_petroleoct13_0_0.pdf
72 See endnote 70, p. 1.
73 Blue Green Canada, “Number of jobs created for every $1 million invested,” November 2012. Accessed January 11, 2014.http://bluegreencanada.ca/jobs-per-million
74 Goodman, ian, Brigid Rowan (co-authors with L. Skinner and S. Sweeney, Cornell Global Labor institute), “Pipe Dreams? Jobs Gained, Jobs Lost by the Construction of Keystone XL,” September 28, 2011; revised January 18, 2012, pp. 33-34.http://www.thegoodman.com/pdf/TGG2012 0123_GLi_KeystoneXL_PipeDreams.pdf
75 if the Line 9 pipeline project is approved by the NEB, it might be used to supply most of the crude processed by Quebec refineries. But there is no requirement that Quebec refineries have to process all (or any) of the crude transported to Quebec on Line 9. Therefore, Line 9 could also serve as a conduit to export crude through Quebec. This could enable exports of tar sands crudes, with Quebec refineries processing other crudes (delivered by rail, ship, or pipeline).
76 See Section 2, page 11 and endnote 23.
77 As shown in endnote 65, even assuming a broad range of economic spin-offs (including direct, indirect, and induced jobs), the impact of crude oil marine and storage terminals on the Quebec economy and jobs is estimated to be in the order of hundreds of jobs annually, or less than 0.01% of total provincial jobs.
78 As shown on page 22 and in endnotes 65 and 68, even assuming a broad range of economic spin-offs (including direct, indirect, and induced jobs), the incremental impact of pipeline construction on the Quebec economy and jobs is estimated to be less than 0.20% of the total over the four or more year period of the capital investments; for ongoing pipeline operations, labour requirements are minuscule and the impacts on overall economy activity are (at most) tiny.
79 Recent reports indicate that the Obama administration decision on Keystone XL will be delayed until late 2013 or even early 2014.
Gardner, Timothy, “Exclusive: U.S. decision on Keystone XL pipeline seen dragging past summer,” Reuters, May 10, 2013. Accessed May 16, 2013. http://business.financialpost.com/2013/02/06/suncor-suffers-first-loss-in-more-than-3-years-as-cheap-oil-hits-voyageur-project/?__lsa=2afc-6caf
PaGE 49
EnDnOTES ECONOMiCS Of TRANSPORTiNG AND PROCESSiNG TAR SANDS CRUDES iN QUEBEC
furthermore, TC has indicated that delays in the US approval of Keystone XL will result in in even longer delays in the expected service date for Keystone XL (now estimated by the company to be pushed to the second half of 2015) and that Keystone XL costs are higher due to delays.
Cryderman, Kelly, “TransCanada sees Keystone XL delayed to later 2015, costs rising,” Globe and Mail, April 26, 2013. Accessed May 16, 2013.http://www.theglobeandmail.com/report-on-business/industry-news/energy-and-resources/transcanada-sees-keystone-xl-delayed-to-later-2015-costs-rising/article11567312/#dashboard/follows/
80 See discussion in the Section 4b about the additional risks of tar sands spills versus conventional crude, as well as details regarding Enbridge’s poor safety record, particularly with respect to the mishandling of the disastrous tar sands crude spill in the Kalamazoo River in Michigan (2010).
81 Lewis, Jeff, “Gas distributors sour over TransCanada’s mainline conversion plan,” Financial Post, July 18, 2013. Accessed July 22, 2013. http://business.financialpost.com/2013/07/18/gas-distributors-sour-over-transcanadas-mainline-conversion-plan/?__lsa=d1bd-26a1
According to the financial Post article, the incremental supply costs to gas consumers in Ontario and Quebec could be up to $138M per year according to one estimate. As is the practice in natural gas regulation, these incremental costs will flow through to the consumers in the form of increased rates.
82 Jaccard, Mark, “Testimony to the US Congress Subcommittee on Keystone XL,” pp. 3-4, April 10, 2013. Accessed October 31, 2013. http://docs.house.gov/meetings/if/if03/20130410/100616/HHRG-113-if03-Wstate-JaccardM-20130410.pdf
83 Bellavance, Joël-Denis, “Non au pétrole albertain, disent une majorité de Québécois,” La Presse, April, 22, 2013. Accessed October 30, 2013. http://www.lapresse.ca/environnement/ 201304/21/01-4643126-non-au-petrole-albertain-disent-une-majorite-de-quebecois.php
84 Montreal East facilities and infrastructure include the Suncor Montreal refinery; numerous hazardous materials pipelines transporting crude, refined products, natural gas, and various chemicals (Line 9, Portland-Montreal, Saint-Laurent, Trans-Northern, Trans Quebec & Maritimes, Energy East (if built with connections to Suncor and other Montreal East facilities), and other connections with terminals, processing, and storage); chemical plants (ParaChem, interquisa, Chemtrade); storage and distribution terminals (Ultramar, Canterm, Gaz Métro LSR (natural gas liquefaction, storage and regasification plant)); Port of Montreal and railroads (including oil terminals); and Autoroute 40/Métropolitaine. Association industrielle de l’est de Montréal, Membres et types d’industries. Accessed July 18, 2013.http://www.aiem.qc.ca/index.php?option= content&task=view&id=11&itemid=106
Suncor and the QC government are heavily involved in Montreal East via ownership and other relationships. ParaChem is adjacent to the Suncor refinery, interconnected via pipelines, and owned 51% by Suncor and 49% by QC government (investissement Quebec, formerly SGf (Société Générale de financement du Quebec)); Suncor supplies xylene and toluene, which is processed to produce Paraxylene (supplied to interquisa), hydrogen, heavy aromatics, and benzene (returned to Suncor); hydrocarbon storage exceeds 2 million barrels. Suncor, “Annual information form,” March 1, 2013. Accessed October 30, 2013. http://www.suncor.com/pdf/Suncor_Aif_2013_en.pdf
investissement Québec, “Parachem Chemicals,” Accessed October 30, 2013. http://www.investquebec.com/en/index.aspx? page=2915§r=13&suite=&recherche= parachem
interquisa is owned 51% by CEPSA (a Spanish-based oil and gas company) and 49% by QC government (investissement Québec , formerly SGf); Parachem supplies Paraxylene, which is processed to produce Purified Terephthalic Acid (PTA), the raw material used in making polyester. CEPSA, The Company. Accessed July 18, 2013. http://www.cepsa.com/cepsa/Who_we_are/The_Company/CEPSA_Worldwide/Canada/
PaGE 50
EnDnOTES ECONOMiCS Of TRANSPORTiNG AND PROCESSiNG TAR SANDS CRUDES iN QUEBEC
Chemtrade provides sulfur removal services for neighboring Suncor refinery via interconnecting pipelines; Suncor supplies hydrogen sulfide dissolved in an amine solution, which is processed to extract hydrogen sulfide and produce sulfur and sodium bisulfite, with amine solution returned to Suncor. Chemtrade, “Annual information form,” March 4, 2013. Accessed October 30, 2013. http://www.chemtradelogistics.com/main/wp-content/uploads/CHEUN_Annual_information_form4.pdf
Suncor is also a partial owner of the Portland-Montreal (crude) and Trans-Northern (refined products) pipelines.
85 Pipeline Saint-Laurent. Accessed October 30, 2013. http://www.pipelinesaintlaurent.ca/
86 Bureau d’audiences publiques sur l’environnement (BAPE), “Projet de construction de l’oléoduc Pipeline Saint-Laurent entre Lévis et Montréal-Est: Rapport d’enquête et d’audience publique. Rapport 243,” July 2007, p. 85. Accessed May 16, 2013. http://www.bape.gouv.qc.ca/sections/rapports/publications/bape243.pdf
87 EPA, Comments of EPA on the Department of State’s Keystone XL Draft Supplement Environmental impact Statement (DSEiS) (footnotes in original omitted), US Environmental Protection Agency, April 22, 2013. Accessed October 30, 2013.http://epa.gov/compliance/nepa/keystone-xl-project-epa-comment-letter-20130056.pdf
88 Enbridge’s poor safety record in transporting heavy crudes in a damning indictment of Enbridge’s response to the tar sands crude spill in Michigan, the US National Transportation Safety Board likened the company’s management of the disaster to the “Keystone Cops” and indicated out that Enbridge had “failed to adequately address well-known corrosion problems as back as 2005.”
“Enbridge also twice attempted to restart the flow in aging pipeline 6B after the rupture, ultimately pumping at least 840,000 gallons of diluted Alberta crude into a sensitive Michigan watershed.
A cascade of “human error” ranging from lack of communication between Enbridge and local law enforcement in Michigan to the company’s repeated misreading of vital sensor data to an inept spill response conspired for what would eventually become a billion-dollar cleanup operation, the NTSB said in a draft report adopted at the end of the three-hour hearing in Washington.”
Lu, Vanessa and Mitch Potter, “Enbridge handled oil spill like ‘Keystone Cops’: safety board,” The Star, July 10, 2012. Accessed May 20, 2013.http://www.thestar.com/business/2012/07/10/enbridge_handled_oil_spill_like_keystone_cops_safety_board.html
The total clean-up for the spill is now estimated to cost approximately $1 Billion. Enbridge’s civil penalty for the spill was only $3.7 Million. Enbridge, first Quarter interim Report to Shareholders for the three months ended March 31, 2013, p. 11. http://www.enbridge.com/investorRelations/financialinformation/~/media/www/Site%20 Documents/investor%20Relations/2013/2013_Q1_ENBfirstQuarterReport.pdf
This spill in Michigan occurred on Line 6B, which connects at Sarnia to Line 9. Enbridge has now requested permission to transport heavy crude all the way to Montreal on Line 9. Thus, heavy crude destined for Montreal would be transported through Line 6B and then Line 9.
According to forest Ethics: “Between 1999 and 2008, Enbridge has had over 610 spills that released approximately 21 million litres (132,000 barrels) of hydrocarbon, the organic compound in oil, gas or bitumen […] in 2009, Enbridge had 103 reportable spills, leaks and releases, and 91 spills in 2010.” in 2009, US affiliate Enbridge Energy Partners agreed to pay $1.1 million to settle a lawsuit brought against the company by the state of Wisconsin for 545 environmental violations. Wisconsin’s Department of Justice, Attorney General J.B. Van Hollen said “…the incidents of violation were numerous and widespread, and resulted in impacts to the streams and wetlands throughout the various watersheds.” forest Ethics, “The facts - Northern Gateway,” Accessed October 30 2013.http://forestethics.org/enbridge-the-facts
PaGE 51
EnDnOTES ECONOMiCS Of TRANSPORTiNG AND PROCESSiNG TAR SANDS CRUDES iN QUEBEC
89 See endnote 90.
90 Letter to Minister of Natural Resources, Joe Oliver, May 7, 2013. Accessed October 30, 2013.http://www.scribd.com/doc/140256709/Letter-to-Joe-Oliver
91 McCarthy, Shawn, “Canadian economist takes his anti-oil sands message to Europe,” Globe and Mail, May 9, 2013. Accessed May 17, 2013.http://www.theglobeandmail.com/report- on-business/industry-news/energy-and-resources/canadian-economist-takes-his-anti-oil-sands-message-to-europe/article11839130/
The former editor of Oilweek Magazine, Earle Gray, has recently warned of the adverse economic impacts of the tar sands expansion and pipeline investments on the rest of Canada.
Gray, Earle, “Collapse of oilsands boom will scramble Canadian economy,” The Star, March 13, 2013. Accessed May 20, 2013.http://www.thestar.com/opinion/commentary/ 2013/03/13/collapse_of_oilsands_boom_will_scramble_canadian_economy.html
92 Krugel, Lauren, “TransCanada does not foresee major resistance to eastern oil pipe proposal,” Globe and Mail, November 14, 2012. Accessed May 16, 2013.http://www.theglobeandmail.com/globe-investor/transcanada-does-not-foresee-major-resistance-to-eastern-oil-pipe-proposal/article5278311/
93 Relative to other parts of North America, Quebec relies less on fossil fuel for heating and industrial processes. The province has made a societal choice to develop its hydro-electric resources and to shift away from oil. in recent decades, fossil fuel development and processing have not been a major part of the provincial economy. As previously discussed in Section 3, the Quebec petrochemical sector has undergone significant restructuring since the 1980s. A number of Montreal refineries have closed, but the remaining refineries (in Montreal and St-Romuald) have expanded, such that overall refining capacity has remained relatively constant. Thus, as the provincial economy has grown, fossil fuels (and especially oil) have declined in their importance for the province. if Quebec were to accept being used as a conduit and an upgrader for tar sands, it would be undermining its forward-looking vision to reduce reliance on fossil fuels (and GHG emissions), and would be moving backward with no offsetting economic gain.
94 Le Devoir avec la Presse canadienne, “foule monstre à Montréal pour le Jour de la Terre,” April 22, 2012, Accessed October 30, 2013. http://www.ledevoir.com/societe/actualites-en-societe/348200/foule-monstre-a-montreal-pour-le-jour-de-la-terre
95 Montreal Gazette, “Estimated 50,000 march in Montreal to Mark Earth Day,” April 21, 2013. Accessed July 18, 2013. http://www.montrealgazette.com/news/topic.html?t=SEO+Title&q=Estimated+50,000+ march+in+Montreal+to+mark+Earth+Day
96 March for the Earth. Accessed October 30, 2103. http://marchepourlaterre.org/en/