Embed Size (px)
Citation preview
8/9/2019 Economic Update : Tracking The World Economy,The Semiconductor Cycle And The Malaysian Economy -15/04/2010
http://slidepdf.com/reader/full/economic-update-tracking-the-world-economythe-semiconductor-cycle-and-the 1/8
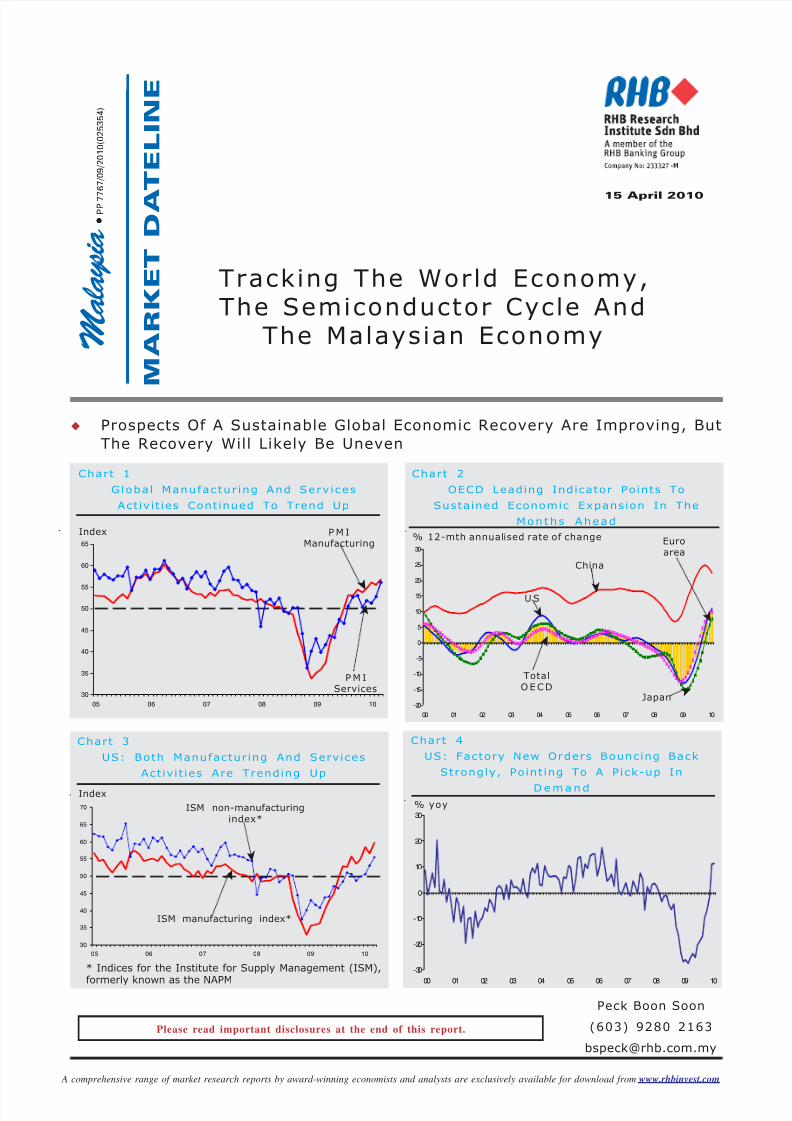
Prospects Of A Sustainable Global Economic Recovery Are Improving, But
The Recovery Will Likely Be Uneven
Tracking The World Economy,The Semiconductor Cycle And
The Malaysian Economy
Peck Boon Soon
(603) 9280 2163
Please read important disclosures at the end of this report.
Chart 3
US: Both Manufacturing And Services
Activ it ies Are Trending Up
Index
* Indices for the Institute for Supply Management (ISM),
formerly known as the NAPM
ISM manufacturing index*
30
35
40
45
50
55
60
65
70
05 06 07 08 09 10
➤
ISM non-manufacturingindex*
➤
Chart 4
US: Factory New Orders Bouncing Back
Strongly, Point ing To A Pick-up In
D e m and
% yoy
-30
-20
-10
0
10
20
30
00 01 02 03 04 05 06 07 08 09 10
-20
-15
-10
-5
0
5
10
15
20
25
30
00 01 02 03 04 05 06 07 08 09 10
Chart 2
OECD Leading Indicator Points To
Sustained Economic Expansion In The
Months Ahead
% 12-mth annualised rate of change
U S➤
China
➤
Japan ➤
Euroarea
➤
TotalOECD
➤
Chart 1
Global Manufactur ing And Serv ices
Activ it ies Continued To Trend Up
Index
30
35
40
45
50
55
60
65
05 06 07 08 09 10
P M IManufacturing
P M IServices
➤
➤
Malaysia
• • • •
PP
7767/09/2010(025354)
MARKETDATELINE
15 April 2010
A comprehensive range of market research reports by award-winning economists and analysts are exclusively available for download from www.rhbinvest.com
8/9/2019 Economic Update : Tracking The World Economy,The Semiconductor Cycle And The Malaysian Economy -15/04/2010
http://slidepdf.com/reader/full/economic-update-tracking-the-world-economythe-semiconductor-cycle-and-the 2/8
ECONOMY IN CHARTS2
A comprehensive range of market research reports by award-winning economists and analysts are exclusively available for download from www.rhbinvest.com
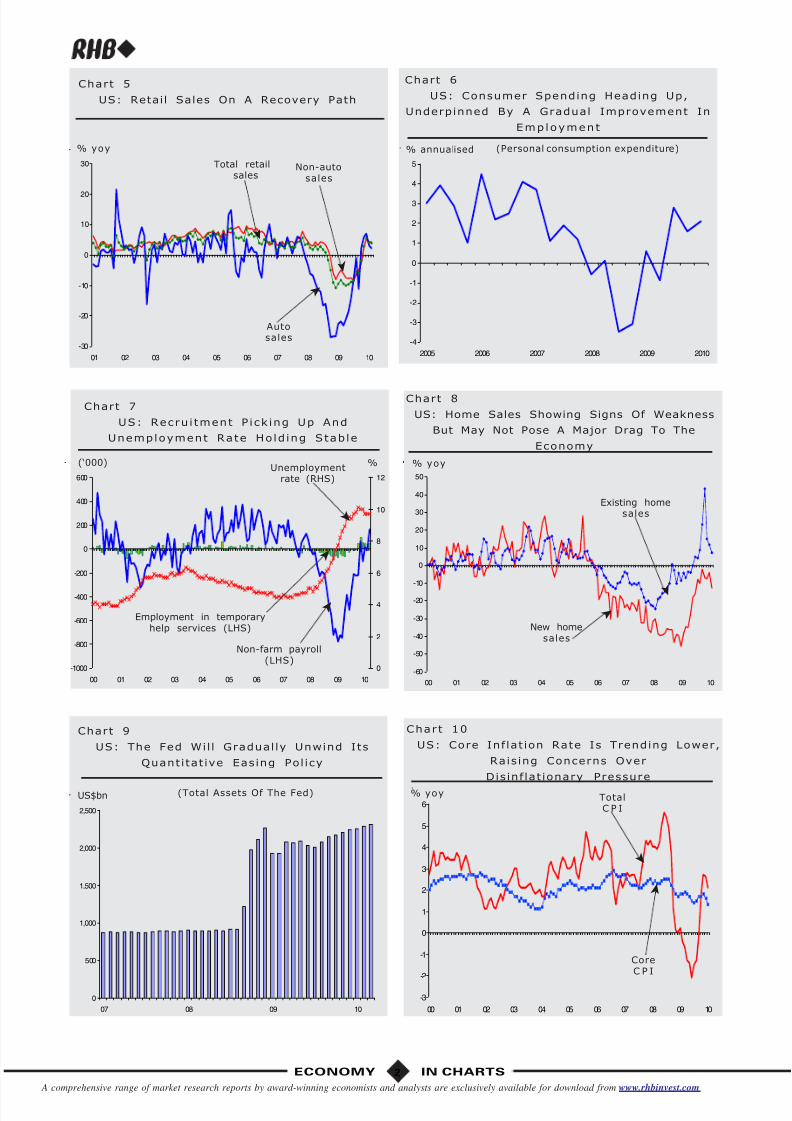
Chart 9
US: The Fed Wil l Gradually Unwind Its
Quantitat ive Easing Pol icy
US$bn (Total Assets Of The Fed)
0
500
1,000
1,500
2,000
2,500
07 08 09 10
Chart 10
US: Core Inflat ion Rate Is Trending Lower,
Raising Concerns Over
Disinf lat ionary Pressure
% yoy
-3
-2
-1
0
1
2
3
4
5
6
00 01 02 03 04 05 06 07 08 09 10
CoreC P I
➤
TotalC P I
➤
Chart 8
US: Home Sales Showing Signs Of Weakness
But May Not Pose A Major Drag To The
Economy
% yoy
-60
-50
-40
-30
-20
-10
0
10
20
30
40
50
00 01 02 03 04 05 06 07 08 09 10
New homesales
➤
Existing homesales
➤
Chart 6
US: Consumer Spending Heading Up,
Underpinned By A Gradual Improvement In
Employment
% annualised
-4
-3
-2
-1
0
1
2
3
4
5
2005 2006 2007 2008 2009 2010
(Personal consumption expenditure)
Chart 5
US: Retail Sales On A Recovery Path
% yoy
-30
-20
-10
0
10
20
30
01 02 03 04 05 06 07 08 09 10
Autosales
➤
Non-autosales
➤
Total retailsales
➤
Chart 7
US: Recrui tment P ick ing Up And
Unemployment Rate Ho lding Stable
(‘000) %
-1000
-800
-600
-400
-200
0
200
400
600
00 01 02 03 04 05 06 07 08 09 10
0
2
4
6
8
10
12
Non-farm payroll(LHS)
➤
Unemploymentrate (RHS)
➤
Employment in temporaryhelp services (LHS)
➤
8/9/2019 Economic Update : Tracking The World Economy,The Semiconductor Cycle And The Malaysian Economy -15/04/2010
http://slidepdf.com/reader/full/economic-update-tracking-the-world-economythe-semiconductor-cycle-and-the 3/8
3ECONOMY IN CHARTS
A comprehensive range of market research reports by award-winning economists and analysts are exclusively available for download from www.rhbinvest.com
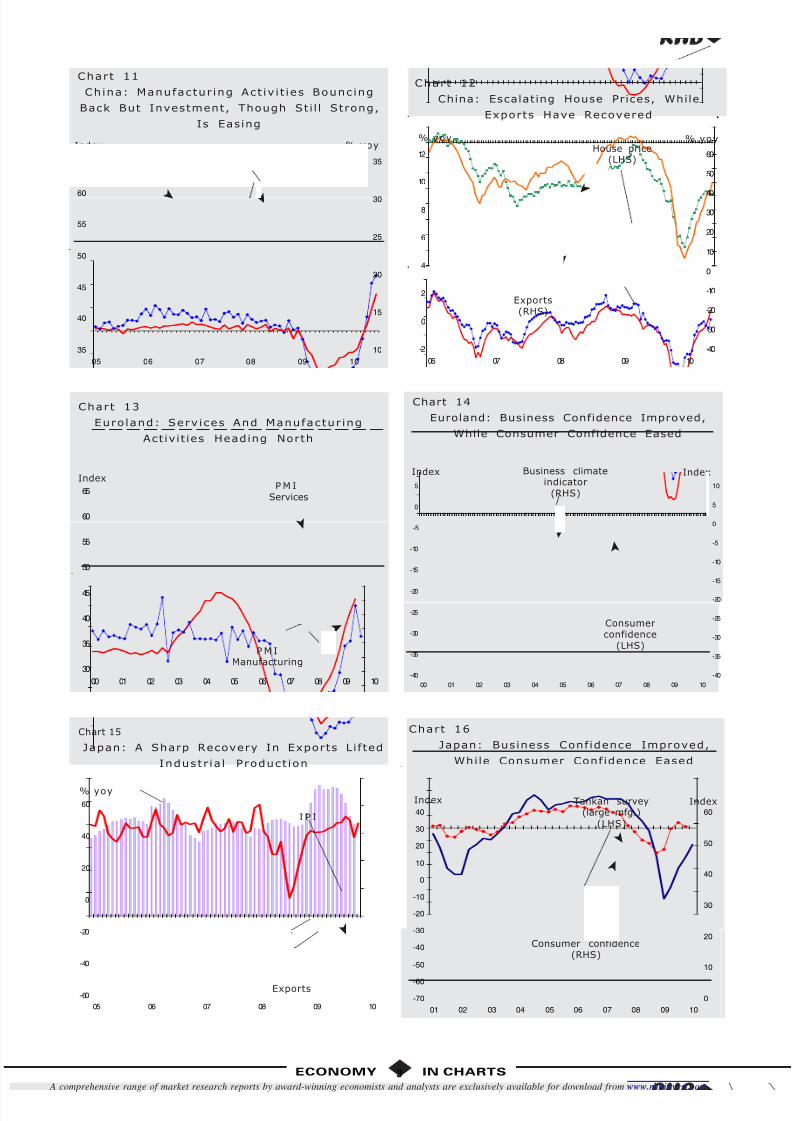
Chart 13
Euro land: Serv ices And Manufactur ing
Activ it ies Heading North
IndexP M I
Services
➤
30
35
40
45
50
55
60
65
00 01 02 03 04 05 06 07 08 09 10
P M IManufacturing
➤
Chart 12
China: Escalating House Prices, While
Exports Have Recovered
% yoy % yoy
-2
0
2
4
6
8
10
12
06 07 08 09 10
-40
-30
-20
-10
0
10
20
30
40
50
60House price
(LHS)
➤
Exports(RHS)
➤
Chart 15
Japan: A Sharp Recovery In Exports Lifted
Industr ia l Product ion
% yoy
-60
-40
-20
0
20
40
60
05 06 07 08 09 10
Exports
➤
I P I
➤
Chart 11
China: Manufactur ing Act iv i t ies Bouncing
Back But Investment, Though Sti l l Strong,
Is Easing
Index % yoyFixed
investment(RHS)
➤
35
40
45
50
55
60
65
05 06 07 08 09 10
10
15
20
25
30
35
ManufacturingP M I
(LHS)
➤
Chart 14
Euroland: Business Confidence Improved,
While Consumer Confidence Eased
Index Index
Consumerconfidence
(LHS)
➤
-40
-35
-30
-25
-20
-15
-10
-5
0
5
00 01 02 03 04 05 06 07 08 09 10
-40
-35
-30
-25
-20
-15
-10
-5
0
5
10
Business climateindicator
(RHS)
➤
Chart 16
Japan: Business Confidence Improved,
While Consumer Confidence Eased
Index Index
-70
-60
-50
-40
-30
-20
-10
0
10
20
30
40
01 02 03 04 05 06 07 08 09 10
0
10
20
30
40
50
60
Tankan survey(large mfg.)
(LHS)➤
Consumer confidence(RHS)
➤
8/9/2019 Economic Update : Tracking The World Economy,The Semiconductor Cycle And The Malaysian Economy -15/04/2010
http://slidepdf.com/reader/full/economic-update-tracking-the-world-economythe-semiconductor-cycle-and-the 4/8
ECONOMY IN CHARTS4
A comprehensive range of market research reports by award-winning economists and analysts are exclusively available for download from www.rhbinvest.com
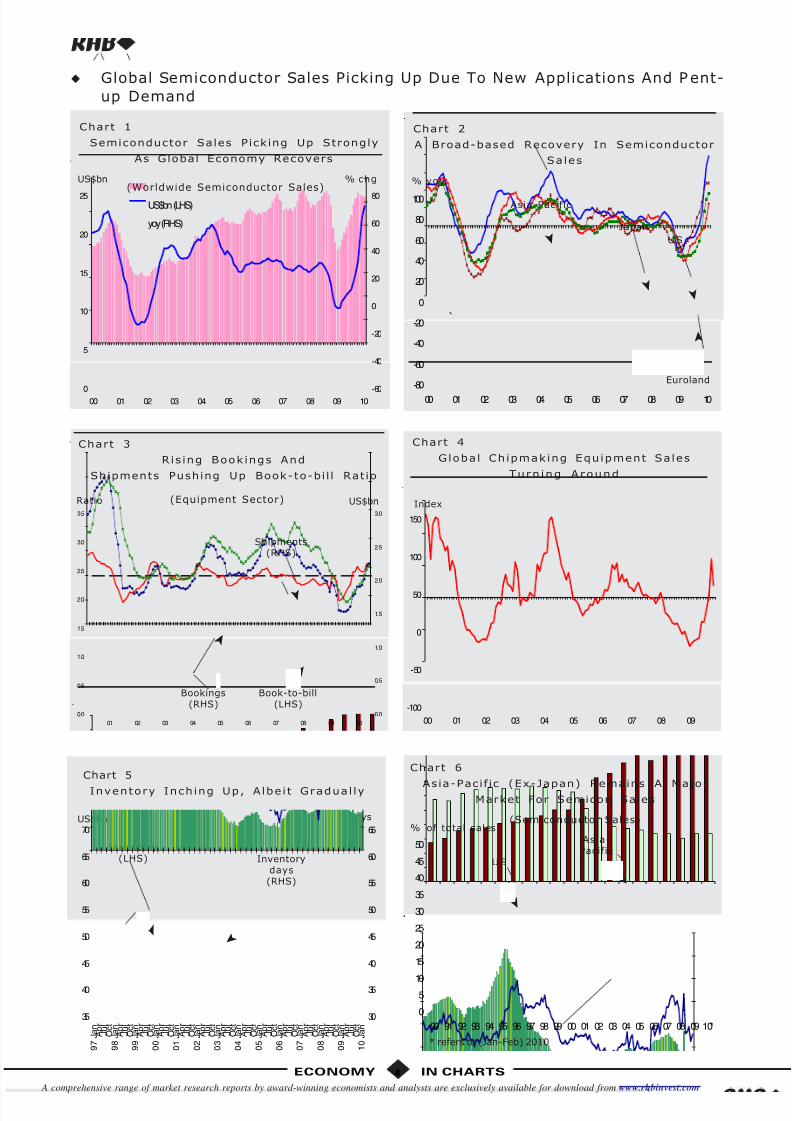
Global Semiconductor Sales Picking Up Due To New Applications And Pent-
up Demand
Chart 1
Semiconductor Sales Picking Up Strongly
As Global Economy Recovers
(Worldwide Semiconductor Sales)% chgUS$bn
0
5
10
15
20
25
00 01 02 03 04 05 06 07 08 09 10-60
-40
-20
0
20
40
60
80US$bn (LHS)
yoy (RHS)
Chart 2
A Broad-based Recovery In Semiconductor
Sales
% yoy
-80
-60
-40
-20
0
20
40
60
80
100
00 01 02 03 04 05 06 07 08 09 10
`
Asia-Pacific
➤
➤
Japan
Euroland
➤
U S
➤
Chart 5
Inventory Inching Up, Albe i t Gradual ly
US$bn Days
Inventorydays(RHS)
➤
35
40
45
50
55
60
65
70
9 7 J a n A p r
J u l
O c t
9 8 J a n A p r
J u l
O c t
9 9 J a n A p r
J u l
O c t
0 0 J a n A p r
J u l
O c t
0 1 J a n A p r
J u l
O c t
0 2 J a n A p r
J u l
O c t
0 3 J a n A p r
J u l
O c t
0 4 J a n A p r
J u l
O c t
0 5 J a n A p r
J u l
O c t
0 6 J a n A p r
J u l
O c t
0 7 J a n A p r
J u l
O c t
0 8 J a n A p r
J u l
O c t
0 9 J a n A p r
J u l
O c t
1 0 J a n
30
35
40
45
50
55
60
65
Inventory(LHS)
➤
Chart 4
Global Chipmaking Equipment Sales
Turn ing Around
Index
-100
-50
0
50
100
150
00 01 02 03 04 05 06 07 08 09
US$bn
Chart 3
Ris ing Book ings And
Shipments Pushing Up Book-to-bi l l Ratio
Ratio (Equipment Sector)
Bookings(RHS)
Book-to-bill(LHS)
Shipments(RHS)
0.0
0.5
1.0
1.5
2.0
2.5
3.0
3.5
01 02 03 04 05 06 07 08 09 10
0.0
0.5
1.0
1.5
2.0
2.5
3.0
➤
➤
➤
Chart 6
Asia-Pacif ic (Ex-Japan) Remains A MajorMarket For Semicon Sales
% of total sales(Semiconductor Sales)
0
510
15
20
25
30
35
40
45
50
90 91 92 93 94 95 96 97 98 99 00 01 02 03 04 05 06 07 08 09 10*
* refers to (Jan-Feb) 2010
Asia-Pacific
➤
US
➤
8/9/2019 Economic Update : Tracking The World Economy,The Semiconductor Cycle And The Malaysian Economy -15/04/2010
http://slidepdf.com/reader/full/economic-update-tracking-the-world-economythe-semiconductor-cycle-and-the 5/8
5ECONOMY IN CHARTS
A comprehensive range of market research reports by award-winning economists and analysts are exclusively available for download from www.rhbinvest.com
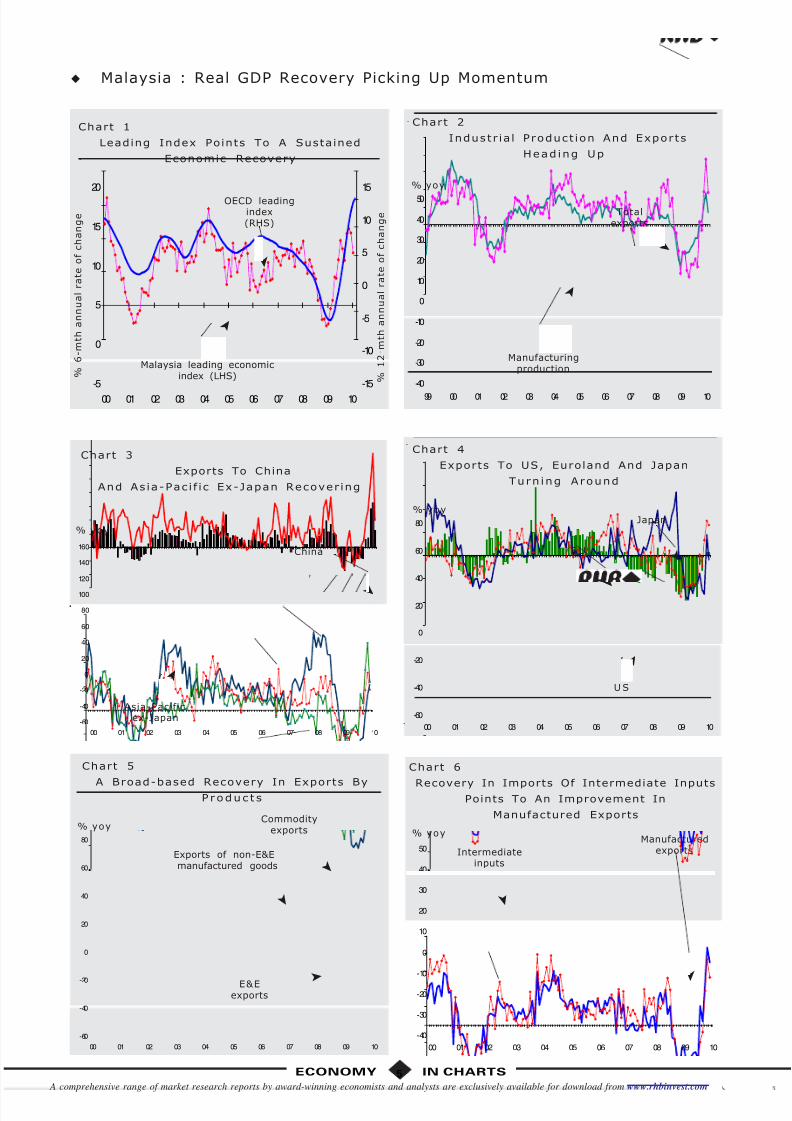
Malaysia : Real GDP Recovery Picking Up Momentum
Chart 2
Industr ia l Product ion And Exports
Head ing Up
% yoy
-40
-30
-20
-10
0
10
20
30
40
50
99 00 01 02 03 04 05 06 07 08 09 10
Totalexports
➤
Manufacturingproduction
➤
Chart 6
Recovery In Imports Of Intermediate InputsPoints To An Improvement In
Manufactured Exports
% yoy
Intermediateinputs
➤
Manufacturedexports
-40
-30
-20
-10
0
10
20
30
40
50
00 01 02 03 04 05 06 07 08 09 10
➤
Chart 3
Exports To China
And As ia-Pac i f ic Ex-Japan Recover ing
% yoy
-60
-40
-20
0
20
40
60
80
100
120
140
160
00 01 02 03 04 05 06 07 08 09 10
China
➤
Asia-Pacificex-Japan
➤
Chart 4
Exports To US, Euroland And Japan
Turn ing Around
% yoy
-60
-40
-20
0
20
40
60
80
00 01 02 03 04 05 06 07 08 09 10
U S
➤
Japan
➤ E U
➤
Chart 1
Leading Index Points To A Sustained
Economic Recovery
%
6 - m t h a n n u a l r a t e o f c h a n g e
%
1 2 - m t h a n n u a l r a t e o f c h a n g e
-5
0
5
10
15
20
00 01 02 03 04 05 06 07 08 09 10
-15
-10
-5
0
5
10
15
OECD leadingindex(RHS)
➤
Malaysia leading economicindex (LHS)
➤
Chart 5
A Broad-based Recovery In Exports ByP roduc t s
% yoy
E&Eexports
➤
Exports of non-E&Emanufactured goods
➤
Commodityexports
➤
-60
-40
-20
0
20
40
60
80
00 01 02 03 04 05 06 07 08 09 10
8/9/2019 Economic Update : Tracking The World Economy,The Semiconductor Cycle And The Malaysian Economy -15/04/2010
http://slidepdf.com/reader/full/economic-update-tracking-the-world-economythe-semiconductor-cycle-and-the 6/8
ECONOMY IN CHARTS6
A comprehensive range of market research reports by award-winning economists and analysts are exclusively available for download from www.rhbinvest.com
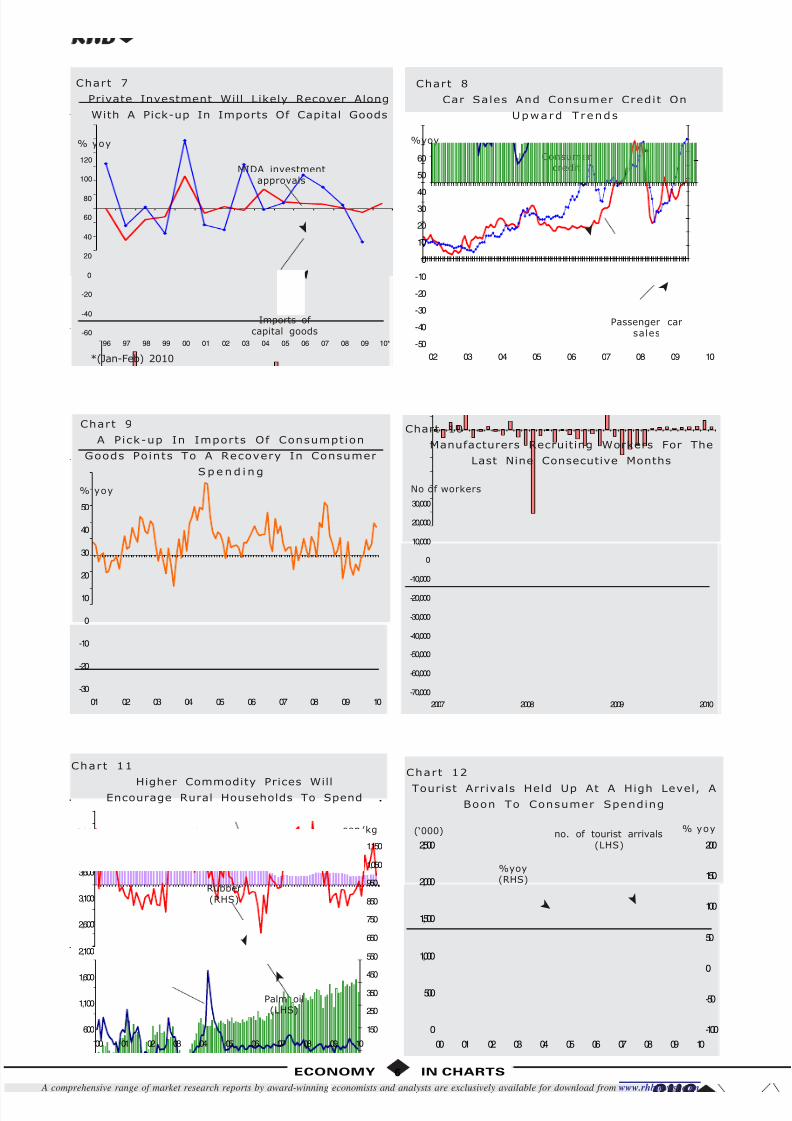
Chart 10
Manufacturers Recruiting Workers For The
Last Nine Consecutive Months
No of workers
-70,000
-60,000
-50,000
-40,000
-30,000
-20,000
-10,000
0
10,000
20,000
30,000
2007 2008 2009 2010
Chart 12
Tourist Arrivals Held Up At A High Level, A
Boon To Consumer Spending
(‘000) % yoy
➤
%yoy(RHS)
no. of tourist arrivals(LHS)
➤
0
500
1,000
1,500
2,000
2,500
00 01 02 03 04 05 06 07 08 09 10
-100
-50
0
50
100
150
200
Chart 8
Car Sales And Consumer Credit On
Upward Trends
%yoy
Consumercredit
➤
-50
-40
-30
-20
-10
0
10
20
3040
50
60
02 03 04 05 06 07 08 09 10
Passenger carsales
➤
% yoy
Chart 9
A Pick-up In Imports Of Consumption
Goods Points To A Recovery In Consumer
Spe nd i ng
-30
-20
-10
0
10
20
30
40
50
01 02 03 04 05 06 07 08 09 10
Chart 7
Private Investment Will Likely Recover Along
With A Pick-up In Imports Of Capital Goods
% yoy
*(Jan-Feb) 2010
-60
-40
-20
0
20
40
60
80
100
120
96 97 98 99 00 01 02 03 04 05 06 07 08 09 10*
MIDA investmentapprovals
➤
Imports of capital goods
➤
Chart 11
Higher Commodity Prices WillEncourage Rural Households To Spend
RM/ tonne sen/kg
Palm oil(LHS)
➤
600
1,100
1,600
2,100
2,600
3,100
3,600
4,100
00 01 02 03 04 05 06 07 08 09 10
150
250
350
450
550
650
750
850
950
1,050
1,150
Rubber(RHS)
➤
8/9/2019 Economic Update : Tracking The World Economy,The Semiconductor Cycle And The Malaysian Economy -15/04/2010
http://slidepdf.com/reader/full/economic-update-tracking-the-world-economythe-semiconductor-cycle-and-the 7/8
7ECONOMY IN CHARTS
A comprehensive range of market research reports by award-winning economists and analysts are exclusively available for download from www.rhbinvest.com
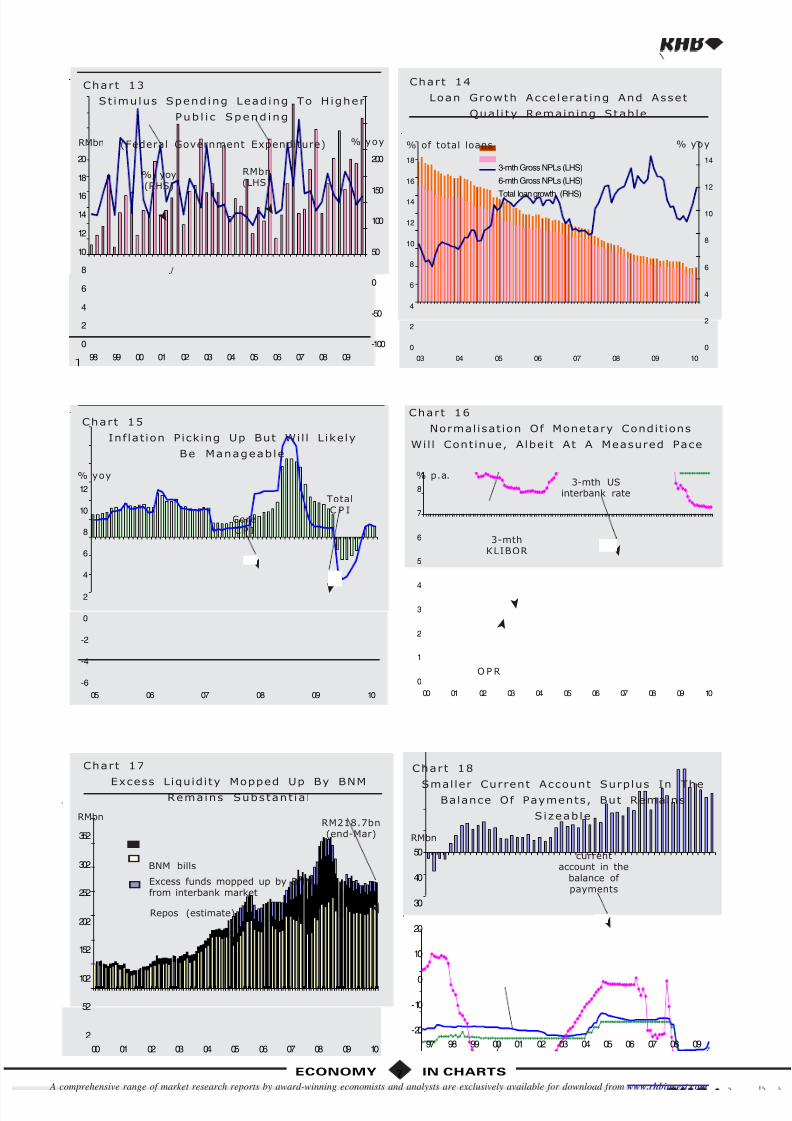
Chart 17
Excess Liquidity Mopped Up By BNMRemains Substant ia l
RMbn
BNM bills
Excess funds mopped up by BNMfrom interbank market
Repos (estimate)
2
52
102
152
202
252
302
352
00 01 02 03 04 05 06 07 08 09 10
RM218.7bn(end-Mar)
➤
Chart 18
Smaller Current Account Surplus In TheBalance Of Payments, But Remains
Sizeable
RMbn
-20
-10
0
10
20
30
40
50
97 98 99 00 01 02 03 04 05 06 07 08 09
currentaccount in the
balance of payments
➤
% yoy(RHS)
➤
Chart 13
St imulus Spending Leading To H igher
Pub l i c Spend ing
(Federal Government Expenditure) % yoyRMbn
0
2
4
6
8
10
12
14
16
18
20
98 99 00 01 02 03 04 05 06 07 08 09
-100
-50
0
50
100
150
200
./
RMbn(LHS)
➤
%, yoy(RHS)
➤
Chart 15
Inflat ion Picking Up But Wil l Likely
Be Manageable
% yoy
-6
-4
-2
0
2
4
6
8
10
12
05 06 07 08 09 10
TotalC P I
➤
CoreC P I
➤
Chart 14
Loan Growth Acce lerat ing And Asset
Qual i ty Remain ing Stable
% of total loans % yoy
0
2
4
6
8
10
12
14
16
18
03 04 05 06 07 08 09 10
0
2
4
6
8
10
12
143-mth Gross NPLs (LHS)
6-mth Gross NPLs (LHS)
Total loan growth (RHS)
Chart 16
Normalisat ion Of Monetary Condit ions
Wil l Continue, Albeit At A Measured Pace
% p.a.
3-mthKLIBOR
O P R
➤
➤
0
1
2
3
4
5
6
7
8
00 01 02 03 04 05 06 07 08 09 10
3-mth USinterbank rate
➤
8/9/2019 Economic Update : Tracking The World Economy,The Semiconductor Cycle And The Malaysian Economy -15/04/2010
http://slidepdf.com/reader/full/economic-update-tracking-the-world-economythe-semiconductor-cycle-and-the 8/8
RHB DEALING AND RESEARCH OFFICES
MALAYSIARHB Investment Bank BhdLevel 10, Tower One, RHB Centre,Jalan Tun Razak50400 Kuala LumpurP.O. Box 1269950786 Kuala Lumpur, MalaysiaTel (General) : (603) 9285 2233
Dealing OfficeTel (Dealing) : (603) 9285 2288Fax (Dealing) : (603) 9284 7467
RHB Research Institute Sdn BhdLevel 10, Tower One, RHB Centre,Jalan Tun Razak50400 Kuala LumpurP.O. Box 1269950786 Kuala Lumpur, MalaysiaTel (Research) : (603) 9280 2160Fax (Research) : (603) 9284 8693
Lim Chee SingDirector
RHBRI is a participant of the CMDF-Bursa Research Scheme and will receive compensation for the participation.Additional information on recommended securities, subject to the duties of confidentiality, will be made available
upon request.
This report may not be reproduced or redistributed, in whole or in part, without the written permission of RHBRIand RHBRI accepts no liability whatsoever for the actions of third parties in this respect.
IMPORTANT DISCLOSURES
This report has been prepared by RHB Research Institute Sdn Bhd (RHBRI) and is for private circulation only to clients of RHBRIand RHB Investment Bank Berhad (previously known as RHB Sakura Merchant Bankers Berhad). It is for distribution only undersuch circumstances as may be permitted by applicable law. The opinions and information contained herein are based on generallyavailable data believed to be reliable and are subject to change without notice, and may differ or be contrary to opinions expressedby other business units within the RHB Group as a result of using different assumptions and criteria. This report is not to beconstrued as an offer, invitation or solicitation to buy or sell the securities covered herein. RHBRI does not warrant the accuracyof anything stated herein in any manner whatsoever and no reliance upon such statement by anyone shall give rise to any claimwhatsoever against RHBRI. RHBRI and/or its associated persons may from time to time have an interest in the securities mentionedby this report.
This report does not provide individually tailored investment advice. It has been prepared without regard to the individual financialcircumstances and objectives of persons who receive it. The securities discussed in this report may not be suitable for all investors.RHBRI recommends that investors independently evaluate particular investments and strategies, and encourages investors toseek the advice of a financial adviser. The appropriateness of a particular investment or strategy will depend on an investor’sindividual circumstances and objectives. Neither RHBRI, RHB Group nor any of its affiliates, employees or agents accepts anyliability for any loss or damage arising out of the use of all or any part of this report.
RHBRI and the Connected Persons (the “RHB Group”) are engaged in securities trading, securities brokerage, banking and financingactivities as well as providing investment banking and financial advisory services. In the ordinary course of its trading, brokerage,banking and financing activities, any member of the RHB Group may at any time hold positions, and may trade or otherwise effecttransactions, for its own account or the accounts of customers, in debt or equity securities or loans of any company that maybe involved in this transaction.
“Connected Persons” means any holding company of RHBRI, the subsidiaries and subsidiary undertaking of such a holding companyand the respective directors, officers, employees and agents of each of them. Investors should assume that the “Connected Persons” are seeking or will seek investment banking or other services from the companies in which the securities have been discussed/covered by RHBRI in this report or in RHBRI’s previous reports.This report has been prepared by the research personnel of RHBRI. Facts and views presented in this report have not been reviewedby, and may not reflect information known to, professionals in other business areas of the “Connected Persons,” including investmentbanking personnel.
The research analysts, economists or research associates principally responsible for the preparation of this research report have
received compensation based upon various factors, including quality of research, investor client feedback, stock picking, competitivefactors and firm revenues.
◆ ◆ ◆ ◆ ◆ ◆ ◆ ◆ ◆ ◆ ◆ ◆ ◆ ◆ ◆ ◆ ◆ ◆ ◆ ◆ ◆ ◆ ◆ ◆ ◆ ◆ ◆ ◆ ◆ ◆ ◆ ◆ ◆ ◆ ◆ ◆ ◆ ◆ ◆ ◆ ◆ ◆ ◆ ◆ ◆ ◆ ◆ ◆ ◆ ◆ ◆ ◆ ◆ ◆ ◆ ◆ ◆ ◆ ◆ ◆ ◆ ◆ ◆ ◆ ◆ ◆ ◆ ◆ ◆ ◆ ◆ ◆ ◆ ◆ ◆ ◆ ◆