Embed Size (px)
Citation preview
malaysian EcOnOmyFirst Quarter 2011
1st kulit warna.indd 1 5/20/11 11:45:48 PM
Highlights
❐ Global economy grew at a moderate pace
❐ The Malaysian economy continued to expand
❐ Growth spearheaded by services and manufacturing sectors
❐ Growth expected to strengthen in the coming quarters of 2011
Quarterly Updateon the Malaysian Economy – 1 Quarter 2011
International Performance
Moderate global growth…
The global economy continued to grow at a moderate pace in the first quarter of 2011. Most advanced economies registered moderate growth as domestic demand remained subdued amid elevated unemployment. Global growth was also impacted by the contraction of the Japanese economy after the March 11 earthquake. Growth in many emerging and developing economies was strong, contributed largely by robust domestic demand, and favourable export performance despite growing concerns of overheating. Unrest in the Middle East and North Africa led to sharp increases in oil prices and rising inflation worldwide.
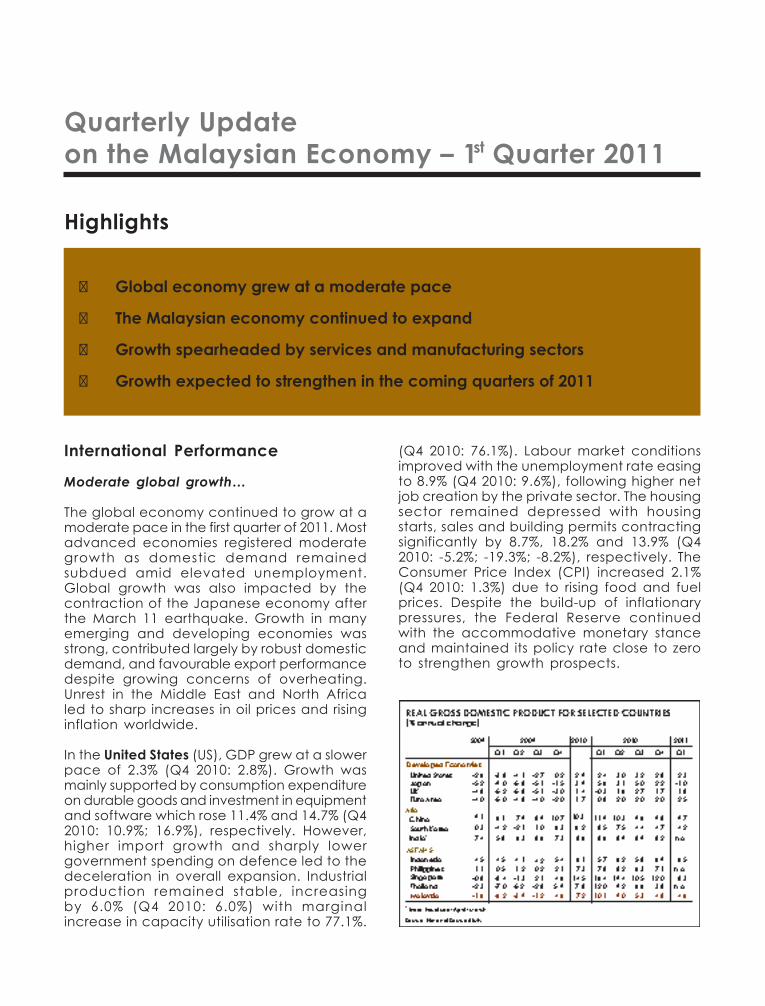
In the United States (US), GDP grew at a slower pace of 2.3% (Q4 2010: 2.8%). Growth was mainly supported by consumption expenditure on durable goods and investment in equipment and software which rose 11.4% and 14.7% (Q4 2010: 10.9%; 16.9%), respectively. However, higher import growth and sharply lower government spending on defence led to the deceleration in overall expansion. Industrial production remained stable, increasing by 6.0% (Q4 2010: 6.0%) with marginal increase in capacity utilisation rate to 77.1%.
(Q4 2010: 76.1%). Labour market conditions improved with the unemployment rate easing to 8.9% (Q4 2010: 9.6%), following higher net job creation by the private sector. The housing sector remained depressed with housing starts, sales and building permits contracting significantly by 8.7%, 18.2% and 13.9% (Q4 2010: -5.2%; -19.3%; -8.2%), respectively. The Consumer Price Index (CPI) increased 2.1% (Q4 2010: 1.3%) due to rising food and fuel prices. Despite the build-up of inflationary pressures, the Federal Reserve continued with the accommodative monetary stance and maintained its policy rate close to zero to strengthen growth prospects.
st
2
The euro area continued to record a higher growth of 2.5% (Q4 2010: 2.0%), following favourable performance in most countries, except in Greece and Portugal. Germany, the largest economy, expanded significantly by 4.8% (Q4 2010: 3.8%), the highest pace since the German reunification in 1990. Growth was led by investment and consumer spending. In France, GDP grew strongly by 2.2% (Q4 2010: 1.4%) due to significantly higher manufacturing production and investment.
China’s economy continued to sustain a strong growth of 9.7% (Q4 2010: 9.8%) contributed mainly by domestic demand and external trade. Private consumption expanded in tandem with increases in rural and urban per capita household income of 14.3% and 7.1%, respectively. This was reflected by the steady growth in retail sales of 16.3% (Q4 2010: 22.0%). Investment in real estate increased 34.1%, of which residential buildings grew by 37.4%. Merchandise exports increased 26.5% (Q4 2010: 24.9%), while imports rose 32.6% (Q4 2010: 29.5%). The CPI rose to 5.0% (Q4 2010: 4.6%) due to higher food and property prices. To mop up excess liquidity in the banking system, the People’s Bank of China revised upward its benchmark lending and one-year deposit rates by 25 basis points to 6.06% and 3.0%, respectively in February. In addition, the reserve requirement ratio for major banks was increased three times by 50 basis points each from 18.5% to 20.0%.
Japan’s GDP contracted 1.0% (Q4 2010: 2.2%), following the earthquake disaster. Private consumption which accounts for almost 60% of Japanese economy declined 1.0% (Q4 2010: 0.6%) as consumers reduced on spending after the quake. Capital investment moderated to 2.8% (Q4 2010: 5.5%) due to lacklustre business spending on anticipation of lower corporate profits. External trade remained positive despite merchandise exports moderating to 12.9% (Q4 2010: 13.3%), following the disruption to production and
supply chains. Meanwhile, imports gained 22.7% (Q4 2010: 19.4%), mainly due to the higher cost of imports, particularly petroleum products. The CPI trended down to 0% (Q4 2010: 0.1%), mainly due to falling housing prices. The Bank of Japan kept its policy interest rate unchanged between 0.0% to 0.1% to help stimulate economic growth.
Korea’s GDP grew 4.2% (Q4 2010: 4.7%) attributed to higher exports at 18.6% (Q4 2010: 15.8%), particularly semiconductors, electronic components and automobiles. Private comsumption was stable at 3.0% (Q4 2010: 2.9%) due to sustained spending on automobiles and audio-visual products. On the supply side, manufacturing output grew 9.9% (Q4 2010: 11.1%), mainly due to increases in electrical equipment, steel and motor vehicles. The wholesale and retail trade as well as financial intermediation sectors expanded, partially offsetting the decline in recreational, cultural and sporting services. The CPI rose 4.5% in line with higher food and energy costs. To ease the impact of rising inflation, the Bank of Korea increased its policy rate for three consecutive months from 2.66% to 2.92%.
Major economies in the ASEAN region registered six consecutive quarters of positive growth since the fourth quarter of 2009. Singapore’s GDP expanded 8.3% (Q4 2010: 12.0%), mainly driven by the manufacturing and services sectors which grew 13.1% and 7.3%, respectively. Growth in the manufacturing sector was attributed to the strong performance in the electronics and precision engineering clusters, while growth in the services sector was driven primarily by financial services activities. Indonesia’s GDP continued to register strong growth at 6.5% (Q4 2010: 6.9%), largely due to a surge in exports, sustained private consumption and rising investment. Bank Indonesia raised its policy rate in February from 6.50% to 6.75% to mitigate rising inflationary pressures.

3
Private consumption expenditure grew 6.7% (Q4 2010: 6.4%), backed by favourable labour market conditions and higher disposable income, following firm commodity prices and a vibrant stock market. Robust consumer spending was ref lected by the strong performance of major consumption indicators such as sales of food, credit card spending and consumption credit disbursed. These indicators recorded a double-digit growth of 19.3%, 12.5% and 12.4% (Q4 2010: 28.5%; 14.2%; 27.2%), respectively. This was also reflected by the Consumer Sentiments Index (CSI) which remained above the 100-point threshold at 108.2 points (Q4 2010: 117.2 points). Meanwhile, public consumption grew strongly by 6.1% (Q4 2010: 0.1%), led by higher expenditure on emoluments as well as supplies and services.
Malaysian Economy
Growth remained healthy…
Malaysia’s GDP grew 4.6% in the first quarter of 2011 (Q4 2010: 4.8%) led by steady performance of the services and manufacturing sectors. The services sector expanded 5.9% (Q4 2010: 6.1%), mainly supported by the wholesale and retail trade, finance and insurance as well as real estate and business services sub-sectors. The manufacturing sector registered a positive growth of 5.4% (Q4 2010: 6.2%), despite contraction in the transport equipment and other manufactures as well as electrical and electronics (E&E)sub-sectors. The construction sector expanded 3.8% (Q4 2010: 5.6%) on account of higher activity in the residential and non-residential sub-sectors. The agriculture sector registered a smaller decline of 0.3% (Q4 2010: -3.9%) largely contributed by higher production of livestock, fishing and other agriculture sub-sectors. Meanwhile, the mining sector contracted 3.0% (Q4 2010: -1.2%), affected by lower production of crude oil.
Domestic demand strengthened further…
Domestic demand remained robust, expanding by 6.6% (Q4 2010: 5.9%) during the quarter. This was attributed to buoyant consumer spending, strong private investment as well as higher public consumption.
4
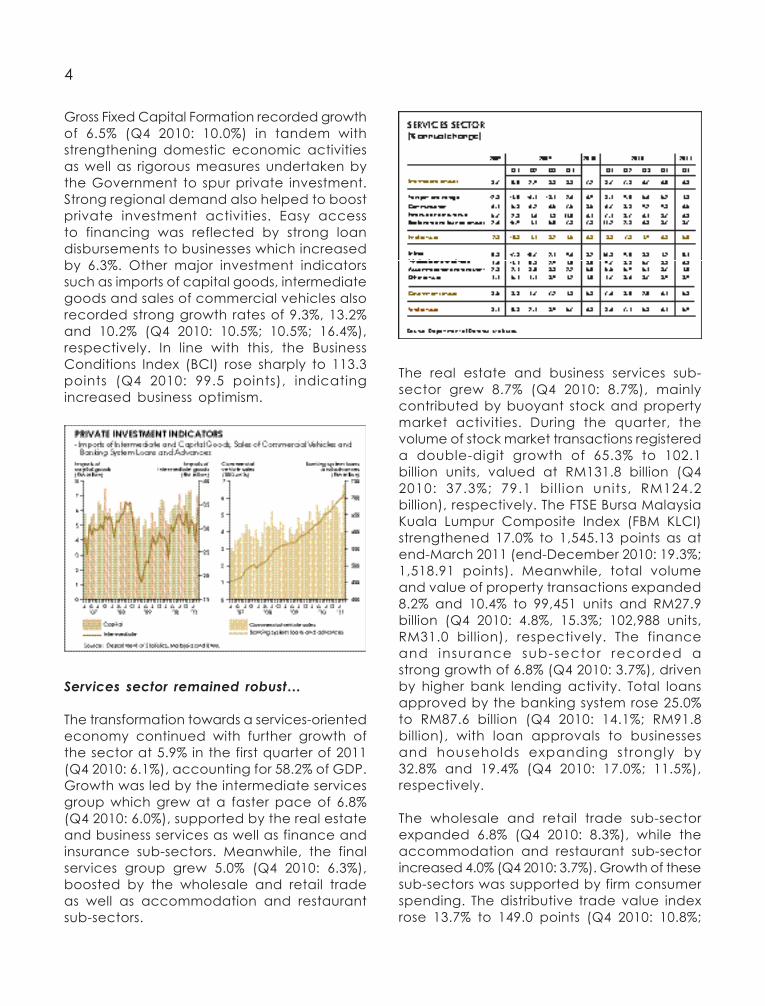
Gross Fixed Capital Formation recorded growth of 6.5% (Q4 2010: 10.0%) in tandem with strengthening domestic economic activities as well as rigorous measures undertaken by the Government to spur private investment. Strong regional demand also helped to boost private investment activities. Easy access to financing was reflected by strong loan disbursements to businesses which increased by 6.3%. Other major investment indicators such as imports of capital goods, intermediate goods and sales of commercial vehicles also recorded strong growth rates of 9.3%, 13.2% and 10.2% (Q4 2010: 10.5%; 10.5%; 16.4%), respectively. In line with this, the Business Conditions Index (BCI) rose sharply to 113.3 points (Q4 2010: 99.5 points), indicating increased business optimism.
Services sector remained robust…
The transformation towards a services-oriented economy continued with further growth of the sector at 5.9% in the first quarter of 2011 (Q4 2010: 6.1%), accounting for 58.2% of GDP. Growth was led by the intermediate services group which grew at a faster pace of 6.8% (Q4 2010: 6.0%), supported by the real estate and business services as well as finance and insurance sub-sectors. Meanwhile, the final services group grew 5.0% (Q4 2010: 6.3%), boosted by the wholesale and retail trade as well as accommodation and restaurant sub-sectors.
The real estate and business services sub-sector grew 8.7% (Q4 2010: 8.7%), mainly contributed by buoyant stock and property market activities. During the quarter, the volume of stock market transactions registered a double-digit growth of 65.3% to 102.1 billion units, valued at RM131.8 billion (Q4 2010: 37.3%; 79.1 bi l l ion units, RM124.2 billion), respectively. The FTSE Bursa Malaysia Kuala Lumpur Composite Index (FBM KLCI) strengthened 17.0% to 1,545.13 points as at end-March 2011 (end-December 2010: 19.3%; 1,518.91 points). Meanwhile, total volume and value of property transactions expanded 8.2% and 10.4% to 99,451 units and RM27.9 billion (Q4 2010: 4.8%, 15.3%; 102,988 units, RM31.0 billion), respectively. The finance and insurance sub-sector recorded a strong growth of 6.8% (Q4 2010: 3.7%), driven by higher bank lending activity. Total loans approved by the banking system rose 25.0% to RM87.6 billion (Q4 2010: 14.1%; RM91.8 billion), with loan approvals to businesses and households expanding strongly by 32.8% and 19.4% (Q4 2010: 17.0%; 11.5%), respectively.
The wholesale and retail trade sub-sector expanded 6.8% (Q4 2010: 8.3%), while the accommodation and restaurant sub-sector increased 4.0% (Q4 2010: 3.7%). Growth of these sub-sectors was supported by firm consumer spending. The distributive trade value index rose 13.7% to 149.0 points (Q4 2010: 10.8%;

5
138.1 points), with the wholesale and retail trade value index increasing 14.5% and 8.3% (Q4 2010: 12.2%; 7.9%), respectively.
The communication sub-sector rose 6.5% (Q4 2010: 9.8%), supported by higher usage of cellular, broadband and 3G services. As at end-March 2011, the cellular phone subscriber base grew 11.9% to 34.5 million with a penetration rate of 121.0% (end-December 2010: 12.3%; 33.9 million; 119.2%). Growth was mainly driven by the non-voice segment following rising demand for data services. In addition, the performance of the 3G segment, which surged 29.6% to 9.7 million subscriptions (end-December 2010: 25.2%; 9.2 million), provided the impetus for growth in the cellular segment. Meanwhile, the broadband subscriber base expanded 68.1% to 4.9 million subscriptions to record a household penetration rate of 57.6% (end-December 2010: 80.2%; 4.7 million; 55.6%). Various initiatives to enhance broadband adoption and coverage, particularly in the rural areas and among low-income households boosted demand for broadband services. The number of wireless hotspots also increased to 14,061 locations nationwide (end-December 2010: 11,291). In contrast, the number of fixed line subscribers remained at 4.4 million, registering a household penetration rate of 42.6% (end-December 2010: 4.4 million; 42.3%).
The transport and storage sub-sector grew 4.3% (Q4 2010: 5.2%), supported by sustained travel and trade-related activities. Port activity remained upbeat attributed to favourable external trade amid continued improvements in port efficiency and productivity. Container handling at seven major ports posted a double-digit growth of 12.7% to 4.7 million TEUs (Q4 2010: 8.9%; 4.6 million TEUs). Port Klang accounted for 48.3% of total container throughput and remained the largest container port in the country, while Port of Tanjung Pelepas handled 38.3%.

6
In the land transport segment, traffic volume on tolled highways rose 7.0% to 356.1 million vehicles (Q4 2010: 6.7%; 372.1 mil l ion), especially during the school holidays and festive seasons. Total ridership on urban rail services (Ampang Line, Kelana Jaya Line, KL Monorail, Express Rail Link and KTM Komuter) expanded strongly by 10.1% to 44.1 million passengers (Q4 2010: 3.7%; 43.6 million), boosted by ongoing Government initiatives to improve public transport in the Klang Valley. KTM intercity train passenger ridership increased 7.2% to 1.1 million (Q4 2010: 11.6%; 1.2 million), while revenue rose 23.1% to RM25.9 million (Q4 2010: 24.6%; RM29.1 million), largely due to higher Electric Train Service ridership. KTMB cargo tonnage increased 7.8%, following higher volume of construction-related freight, which saw revenue rising to RM30.1 million (Q4 2010: -1.9%; RM29.9 million).
Total passenger volume at al l airports registered a double-digit growth of 11.8% to 15.4 million (Q4 2010: 6.3%; 15.9 million). Likewise, total passengers on MAS and AirAsia rose 10.3% to 7.5 million (Q4 2010: 6.6%; 7.9 million). This was spurred by increased frequency, connectivity and capacity as well as continuous promotional activities. Total air cargo handled at all airports, however, grew marginal ly by 0.1% to 215.3 million tonnes (Q4 2010: 3.0%; 235.6 million tonnes). Cargo handling by MAS and AirAsia contracted 2.3% to 121.2 million tonnes (Q4 2010: 2.9%; 138.6 million tonnes), mainly due to slower exports of E&E products.
The utilities sub-sector grew marginally by 0.4% (Q4 2010: 4.2%) in line with lower demand from the manufacturing sector. Electricity sales increased 1.2% (Q4 2010: 3.8%) with maximum demand for electricity peaking at 14,989 megawatts (MW) in March 2011 (Q4 2010: 14,916 MW in October 2010). Growth of the other services sub-sector remained at
3.9% (Q4 2010: 3.9%) attributed to sustained private education and health activities. Meanwhile, the government services sub-sector grew 5.3% (Q4 2010: 6.1%).
G r o w t h l e d b y d o m e s t i c - o r i e n t e d industries…
Value-added of the manufacturing sector expanded 5.4% (Q4 2010: 6.2%) led by stronger domestic-oriented manufacturing act iv i t ies . Th i s was ref lected by the increase in manufacturing output at 5.7% (Q4 2010: 6.6%) and sales of manufacturing products which rose s ign i f icant ly by 10.6% to RM143.7 billion (Q4 2010: 7.5%; RM139.1 billion) during the period. Meanwhile, the overall capacity utilisation rate in the sector remained high at 82.9% (Q4 2010: 82.8%).
The domestic-oriented industries grew 7.3% (Q4 2010: 8.4%) with construction-related sub-sectors continuing to drive growth. Of significance, output of fabricated metal products as well as non-metallic mineral and other related products registered strong growth of 32.8% and 21.7% (Q4 2010: 24.7%; 26.1%), respectively. Output of transport equipment contracted 4.5% (Q4 2010: 20.8%), mainly due to lower production of engines, parts

7
Production of export-oriented industries grew 4.3% (Q4 2010: 5.1%), supported by strong global demand for resource-based products, such as petroleum (26.1%) and rubber (13.5%). Likewise, output of machinery and equipment increased further by 49.3% (Q4 2010: 31.3%). However, output of E&E products contracted 10.4% (Q4 2010: -2.0%) due to lower external demand for computers and computer peripherals, as a result of changes in consumer preference for media tablets and smart phones. Consequently, output of computers and computer peripherals declined 40.4% during the quarter (Q4 2010: -31.1%).
Strong performance of agriculture food produce…
The agriculture sector improved with a smaller negative growth of 0.3% (Q4 2010: -3.9%), bolstered by the strong performance o f t h e l i v e s t o c k , f i s h i n g a n d o t h e r a g r i c u l t u r e s u b - s e c t o r s . M e a n w h i l e , value-added of the oil palm sub-sector contracted 7.9% (Q4 2010: -15.4%) due to lower crude palm oi l product ion, following unfavourable weather conditions. S imi lar ly, value-added of the forestry and logging sub-sector declined further by 12.1% (Q4 2010: -4.2%), on account of lower logging activity, particularly in Sabah and Sarawak. Despite the onset of the winter ing season, value-added of the rubber sub-sector g rew 2 .2% (Q4 2010: 6.3%), backed by increased tapping activity, fol lowing f i rm rubber p r ices which averaged RM15.44 per k i l og ra m m e ( Q 4 2 0 1 0 : RM 1 2 .8 5 p e r kilogramme). Meanwhile, the livestock sub-sector rose sharply by 9.6% (Q4 2010: 5.1%), following higher output of poultry, eggs and cattle. Value-added of the fishing sub-sector strengthened further by 7.7% (Q4 2010: 3.8%) due to higher landings of marine fish. The other agriculture sub-sector grew sharply by 9.7% (Q4 2010: 4.8%), supported by increased output of paddy (14.4%), fruits (12.4%) and vegetables (9.2%).
and accessories for motor vehicles as well as slower building and repairing of marine vessels during the first quarter of 2011.

8
Weaker crude oil production…
Value-added of the mining sector contracted further by 3.0% (Q4 2010: -1.2%), following lower production of crude oil. Crude oil and condensates production shrank 6.3% (Q4 2010: -3.3%), affected by scheduled maintenance of offshore facilities. However, production of natural gas registered a marginal increase of 0.9% (Q4 2010: 2.0%), following sustained demand of liquefied natural gas (LNG) from regional importers.
7.7% (Q4 2010: 1.0%) due to higher housing starts which increased sharply by 52.2% in the first quarter of 2011. This was due to the strong demand for housing in line with improved household income, easy financing and Government initiatives to encourage home ownership. The non-residential sub-sector grew 5.5% (Q4 2010: 18.8%), supported by the continued expansion in the construction of industrial, shop and office buildings in tandem with robust domestic economic activities. Meanwhile, the civil engineering and special trade sub-sector registered a growth of 2.2% (Q4 2010: 2.4%), partly backed by the commencement of infrastructure projects under the Tenth Malaysia Plan (10MP). In addition, construction of major ongoing civil engineering projects also contributed to the growth of the sub-sector. These include the Electrified Double Track Seremban - Gemas, East - Coast Jabur – Kuala Terengganu (Phase 2) Expressway and Bakun Hydroelectric Power Project.
Strong housing starts…
Construction activities grew 3.8% (Q4 2010: 5.6%), spurred by the robust residential and non-residential sub-sectors. Growth in the residential sub-sector expanded strongly by
Prices
Rising inflationary pressures…
Headline inflation, as measured by the annual change in the CPI, edged up to 2.8% in the first quarter of 2011 (Q4 2010: 2.0%), in line with rising global food commodity and crude oil prices. This was the fifth consecutive quarterly increase and doubled the level

9
recorded in the first quarter of 2010 (1.3%). The increase in CPI was mainly contributed by the food and non-alcoholic beverages, transport as well as housing, water, electricity, gas and other fuels groups, which together contributed 2.3 percentage points.
Prices of food and non-alcoholic beverages rose 4.3% (Q4 2010: 2.9%) and contributed 1.3 percentage points to the CPI increase. Higher price increases were recorded in the food at home (4.8%) and food away from home (3.7%) categories. Significant price increases were also recorded in vegetables (12.4%); sugar, jam, honey, chocolate and confectionery (10.9%); milk and eggs (6.8%); fruits (6.7%); meat (5.4%) as well as fish and seafood (3.4%). This was attributed to stronger demand during the Chinese New Year festivities and school holidays as well as supply constraints, following unfavourable weather conditions.
the decline in prices of clothing and footwear as well as communication at 0.5% and 0.3% (Q4 2010: -0.9%, -0.1%), respectively. This was due to aggressive promotional activities and stiff competition.
Prices in the transport group rose at a faster pace of 4.4% (Q4 2010: 2.5%), contributing 0.7 percentage point to the increase in CPI. The increase reflected the adjustment in pump price of RON97 by 10 sen a litre on 4 January and 1 February 2011, respectively. Meanwhile, prices in the housing, water, electricity, gas and other fuels group rose 1.5% (Q4 2010: 1.4%) and contributed 0.3 percentage point. However, the increase in inflation continued to be partly mitigated by
[Headline inflation in April 2011 rose further by 3.2% (March 2011: 3.0%), mainly due to increases in the prices of food and non-alcoholic beverages by 4.9%. Transport prices also increased by 5.3%, following the adjustment in pump price of RON97 by 20 sen to RM2.70 a litre on 2 April 2011]
The Producer Price Index (PPI), a measure of changes in the prices of commodities charged by domestic producers and those paid by importers, rose sharply by 7.4% in the first quarter of 2011 (Q4 2010: 4.8%). The increase reflected higher prices of locally produced goods and imported components. The PPI for local production increased at a faster pace of 9.9% (Q4 2010: 6.6%) contributed by animal and vegetables oils and fats (45.1%); crude materials, inedible (39.1%) as well as mineral fuels and lubricants (8.5%). In contrast, the PPI for imports increased 1.8% (Q4 2010: 1.1%). This was on account of the slower price increases in the machinery and transport equipment group at 2.1%, following the appreciation of the ringgit against the US dollar.

10
Employment
Labour market cond i t ions remained stable…
Labour market conditions remained stable with the unemployment rate at 3.2% in the fourth quarter of 2010 (Q3 2010: 3.2%). During the quarter, total employment increased slightly to 11.38 million (Q3 2010: 11.23 million), while the total labour force grew to 11.75 million (Q3 2010: 11.61 million).
Monetary and Financial Developments
Monetary aggregates continued to grow…
In the first quarter of 2011, the monetary aggregates continued to expand. M1 or narrow money, which comprises currency in circulation and demand deposits grew 14.0% as at end-March 2011 (end-December 2010: 11.7%) while M3 or broad money increased 8.2% (end-December 2010: 7.0%). The growth in M3 was largely attributed to higher bank lending to the private sector and increased net foreign assets.
Vacancies registered with JobsMalaysia increased sharply to 568,717 in the first quarter of 2011 (Q4 2010: 393,408) in line with the continued expansion in economic activities. The services sector registered the highest vacancies at 233,385, followed by the manufacturing (172,875) and agriculture (95,802) sectors. The number of active jobseekers declined further to 358,270 as at end-March 2011 (end-December 2010: 368,094).
Meanwhile, total retrenchments increased to 2,621 workers (Q4 2010: 1,761). The bulk of retrenchments were from the manufacturing sector at 1,822 workers, accounting for 69.5% of total retrenchments (Q4 2010: 748; 42.4%), followed by the services sector (644 workers) and construction sector (116 workers).
Interest rates remained accommodative…
Amid rising global energy and commodity prices, the overnight policy rate (OPR) was held at 2.75% as at end-March 2011 to remain supportive of growth. However, on 11 March 2011, the statutory reserve requirement (SRR) was raised from 1.00% to 2.00% effective 1 April 2011 as a pre-emptive measure to manage l iquidity ar is ing from large capital inf lows. The average base lending rate (BLR) of commercial banks stood at 6.27% while the average lending rate (ALR) climbed marginally to 5.06% as at end-March 2011 (end-December 2010: 6 .27%; 5 .05%) . Meanwhi le , the sav ings depos i t rate

11
notched up 1 basis point (bp) to 1.01% (end-December 2010: 1.00%) while the 1-month to 12-month fixed deposit rates were in the range of 2.71% and 2.98%, respectively as at end-March 2011 (end-December 2010: 2.71% and 2.97%).
Financing remained robust…
Total gross private sector financing raised through the banking system and capital market expanded 6.4% to RM202.0 billion during the first quarter of 2011 (Q4 2010: 2.1%; RM221.0 billion). The strong growth in capital market financing was contributed by larger issuances of private debt securities (PDS) which recorded a significant growth of 174.8% to RM12.2 bi l l ion (Q4 2010: 5.9%, RM17.4 billion) while equity issuance amounted to only RM1.1 bi l l ion. Loan disbursements by the banking system remained strong at RM188.6 billion (Q4 2010: RM188.9 billion).
[On 5 May 2011, the OPR was raised 25 bps for the first time since July 2010 to 3.00% amid favourable domestic growth prospects while the SRR was increased further to 3.00% from 2.00%, effective 16 May 2011 to manage the risks of large liquidity build-up]
During the first quarter of 2011, bank lending activities remained robust with higher demand, especial ly from households. Total loan applications grew 26.8% (Q4 2010: 22.9%) as demand picked up in March after slowing down in February. Loan approvals and disbursements expanded at a faster pace of 25.0% and 8.2% (Q4 2010: 14.1%; 1.0%), respectively. Loans extended to the business and household sectors increased 10.9% and 13.2%, (end-December 2010: 9.4%; 13.4%), respectively. Meanwhile, total loans outstanding grew 13.2% to RM912.1 billion as at end-March 2011 (end-December 2010: 12.7%; RM883.3 billion).
12
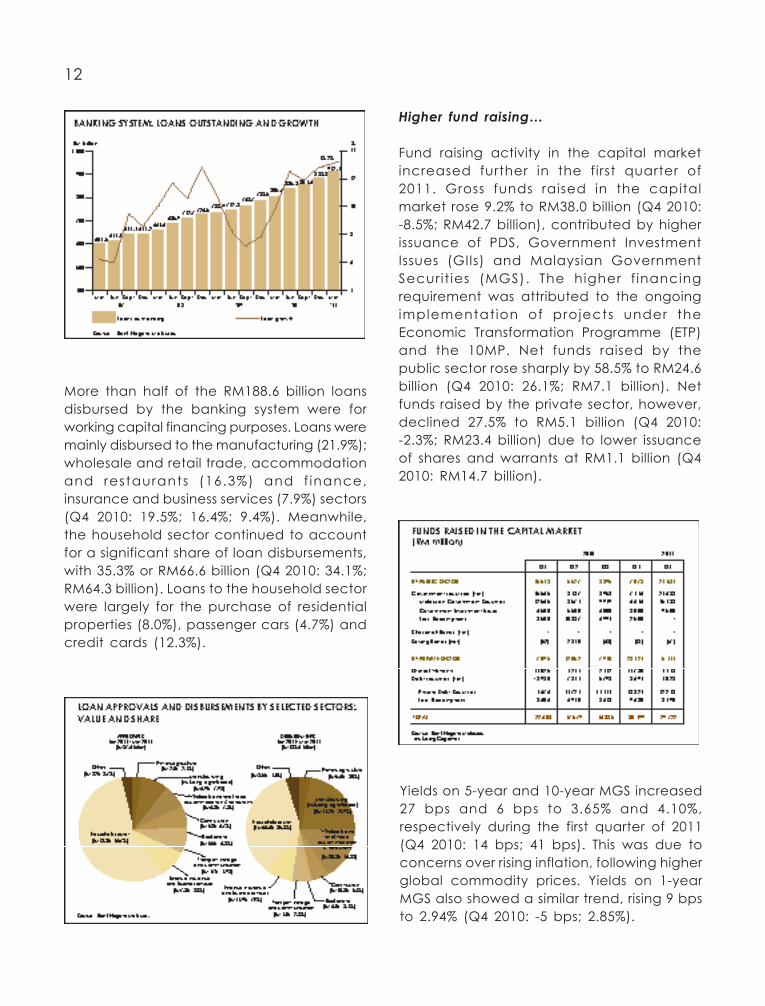
More than half of the RM188.6 billion loans disbursed by the banking system were for working capital financing purposes. Loans were mainly disbursed to the manufacturing (21.9%); wholesale and retail trade, accommodation and restaurants (16.3%) and f inance, insurance and business services (7.9%) sectors (Q4 2010: 19.5%; 16.4%; 9.4%). Meanwhile, the household sector continued to account for a significant share of loan disbursements, with 35.3% or RM66.6 billion (Q4 2010: 34.1%; RM64.3 billion). Loans to the household sector were largely for the purchase of residential properties (8.0%), passenger cars (4.7%) and credit cards (12.3%).
Higher fund raising…
Fund raising activity in the capital market increased further in the first quarter of 2011. Gross funds raised in the capital market rose 9.2% to RM38.0 billion (Q4 2010: -8.5%; RM42.7 billion), contributed by higher issuance of PDS, Government Investment Issues (GIIs) and Malaysian Government Securit ies (MGS). The higher f inancing requirement was attributed to the ongoing implementation of projects under the Economic Transformation Programme (ETP) and the 10MP. Net funds raised by the public sector rose sharply by 58.5% to RM24.6 billion (Q4 2010: 26.1%; RM7.1 billion). Net funds raised by the private sector, however, declined 27.5% to RM5.1 billion (Q4 2010: -2.3%; RM23.4 billion) due to lower issuance of shares and warrants at RM1.1 billion (Q4 2010: RM14.7 billion).
Yields on 5-year and 10-year MGS increased 27 bps and 6 bps to 3.65% and 4.10%, respectively during the first quarter of 2011 (Q4 2010: 14 bps; 41 bps). This was due to concerns over rising inflation, following higher global commodity prices. Yields on 1-year MGS also showed a similar trend, rising 9 bps to 2.94% (Q4 2010: -5 bps; 2.85%).

13
The yield movement of private bonds was more stable with yields on 5-year AAA-rated PDS increasing 4 bps (Q4 2010: 1 bps) and BBB rated bonds edging up 3 bps (Q4 2010: 0.1 bps). Overall PDS yields were in the range of 4.11% and 11.46% during the quarter (Q4 2010: 4.07% and 11.43%).
Banking system remained healthy…
The banking system remained resi l ient with ample liquidity and better quality of lending as well as higher profitability. The risk-weighted capital ratio (RWCR) registered
14.3% and the core capital ratio (CCR) 12.7% as at end-March 2011 (end-December 2010: 14.8%; 13.0%). Total deposits in the banking system rose 9.7% to RM1.17 trillion as at end-March 2011 (end-December 2010: 7.3%; RM1.14 trillion). Pre-tax profits of the banking sector for the first 3 months of 2011 increased to RM6.9 billion (Q4 2010: RM5.7 billion), supported by higher gains on t rading and invesment portfol ios. The quality of lending in the banking system improved with the ratio of net impaired loans to net total loans at 2.2% as at end-March 2011 (end-December 2010: 2.3%).
Upbeat stock market performance...
The FBM KLCI recorded an upward trend following higher capital inflows, better-than-expected corporate earnings, prospects for mergers and acquisitions as well as the strong domestic macroeconomic fundamentals. Market sentiment was also bolstered by the announcement of new investment activities under the ETP estimated at RM2.3 billion. The FBM KLCI reached a new all-time high of 1,574.49 points on 17 January 2011, and gained 17.0% year-on-year (y-o-y) to 1,545.13 points as at end-March 2011 (end-December 2010: 19.3%; 1,518.91 points).

14
Market capitalisation expanded 2.8% or RM35.7 billion to RM1,311 billion as at end-March (end-December 2010: RM1,275.3 billion). Total turnover surged 65.3% y-o-y to 102.1 billion units, valued at RM131.8 billion during the first quarter (Q4 2010: 37.3%; 79.1 billion units; RM124.2 billion).
[The FBM KLCI retreated to 1,541.27 points on 18 May 2011, fo l lowing renewed concerns over global economic prospects, rising inflation, further credit tightening in China and Europe’s debt woes]
Ringgit stronger against the greenback…
During the first quarter of 2011, the ringgit continued to strengthen against the US dollar in line with other regional currencies and recorded several new peaks against the greenback since the 1997/98 financial crisis. The ringgit reached a high of RM3.0259 per US dollar on 31 March 2011. During the quarter, the ringgit gained 1.9% against the US dollar and also appreciated 3.5% against the yen. However, the ringgit eased against the euro and the pound by 4.6% and 1.8%, respectively and traded mixed against most regional currencies.
[During the period end-March to 18 May 2011, the ringgit advanced against the US dollar and breached the RM3.00-per US dollar level. The ringgit touched a new high of RM2.9615 against the greenback on 28 April 2011. However, on 18 May, the ringgit retreated against the US dollar and other currencies in the range of 0.2% to 2.3% on investor concerns over slowing global growth and fluctuating commodity prices]
Federal Government Finance
Higher revenue collection…
Federal Government revenue posted a strong growth of 38.4% to RM39.8 billion (Q4 2010: 7.6%; RM45.8 billion) in the first quarter of 2011, following higher collection of tax and non-tax revenue.
Tax revenue, accounting for 81.6% of total revenue, rose 49.3% to RM32.4 billion (Q4 2010: 35.1%; RM31.9 billion) in tandem with robust domestic economic activities. All major components of direct and indirect taxes, with the exception of import duties, registered positive growth. Direct tax grew sharply by 65.7% to RM25.0 billion (Q4 2010:
15
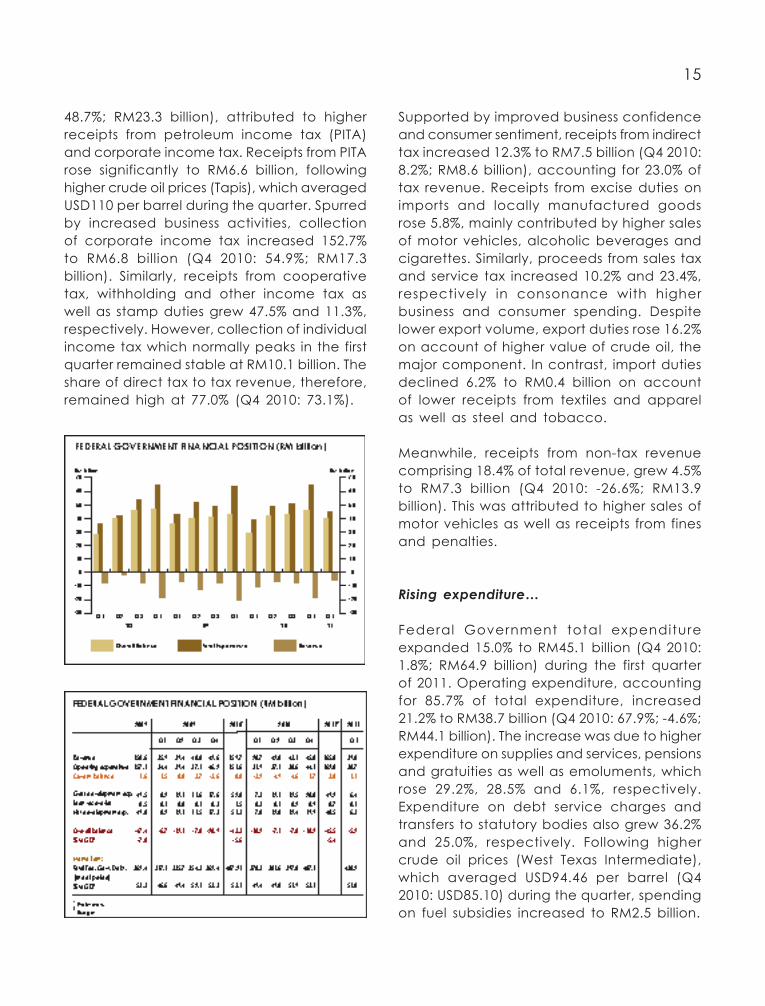
48.7%; RM23.3 billion), attributed to higher receipts from petroleum income tax (PITA) and corporate income tax. Receipts from PITA rose significantly to RM6.6 billion, following higher crude oil prices (Tapis), which averaged USD110 per barrel during the quarter. Spurred by increased business activities, collection of corporate income tax increased 152.7% to RM6.8 billion (Q4 2010: 54.9%; RM17.3 billion). Similarly, receipts from cooperative tax, withholding and other income tax as well as stamp duties grew 47.5% and 11.3%, respectively. However, collection of individual income tax which normally peaks in the first quarter remained stable at RM10.1 billion. The share of direct tax to tax revenue, therefore, remained high at 77.0% (Q4 2010: 73.1%).
Supported by improved business confidence and consumer sentiment, receipts from indirect tax increased 12.3% to RM7.5 billion (Q4 2010: 8.2%; RM8.6 billion), accounting for 23.0% of tax revenue. Receipts from excise duties on imports and locally manufactured goods rose 5.8%, mainly contributed by higher sales of motor vehicles, alcoholic beverages and cigarettes. Similarly, proceeds from sales tax and service tax increased 10.2% and 23.4%, respectively in consonance with higher business and consumer spending. Despite lower export volume, export duties rose 16.2% on account of higher value of crude oil, the major component. In contrast, import duties declined 6.2% to RM0.4 billion on account of lower receipts from textiles and apparel as well as steel and tobacco.
Meanwhile, receipts from non-tax revenue comprising 18.4% of total revenue, grew 4.5% to RM7.3 billion (Q4 2010: -26.6%; RM13.9 billion). This was attributed to higher sales of motor vehicles as well as receipts from fines and penalties.
Rising expenditure…
Federal Government total expenditure expanded 15.0% to RM45.1 billion (Q4 2010: 1.8%; RM64.9 billion) during the first quarter of 2011. Operating expenditure, accounting for 85.7% of total expenditure, increased 21.2% to RM38.7 billion (Q4 2010: 67.9%; -4.6%; RM44.1 billion). The increase was due to higher expenditure on supplies and services, pensions and gratuities as well as emoluments, which rose 29.2%, 28.5% and 6.1%, respectively. Expenditure on debt service charges and transfers to statutory bodies also grew 36.2% and 25.0%, respectively. Following higher crude oil prices (West Texas Intermediate), which averaged USD94.46 per barrel (Q4 2010: USD85.10) during the quarter, spending on fuel subsidies increased to RM2.5 billion.
16
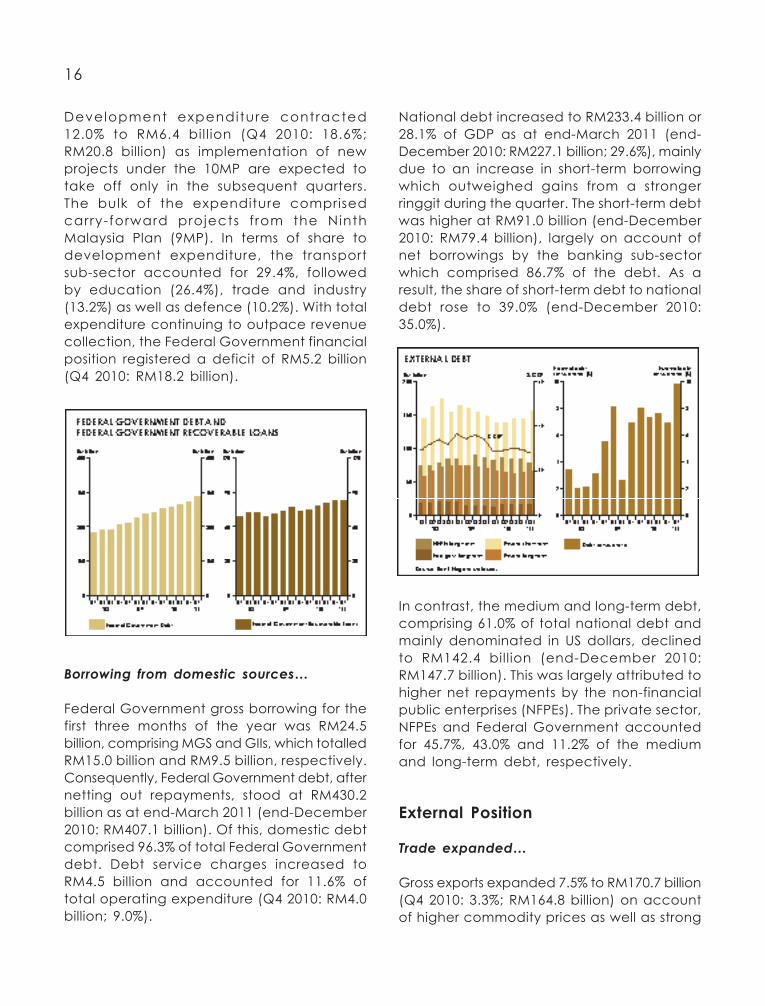
Development expenditure contracted 12.0% to RM6.4 bil l ion (Q4 2010: 18.6%; RM20.8 billion) as implementation of new projects under the 10MP are expected to take off only in the subsequent quarters. The bulk of the expenditure comprised carry-forward projects f rom the Ninth Malaysia Plan (9MP). In terms of share to development expenditure, the transport sub-sector accounted for 29.4%, followed by education (26.4%), trade and industry (13.2%) as well as defence (10.2%). With total expenditure continuing to outpace revenue collection, the Federal Government financial position registered a deficit of RM5.2 billion (Q4 2010: RM18.2 billion).
National debt increased to RM233.4 billion or 28.1% of GDP as at end-March 2011 (end-December 2010: RM227.1 billion; 29.6%), mainly due to an increase in short-term borrowing which outweighed gains from a stronger ringgit during the quarter. The short-term debt was higher at RM91.0 billion (end-December 2010: RM79.4 billion), largely on account of net borrowings by the banking sub-sector which comprised 86.7% of the debt. As a result, the share of short-term debt to national debt rose to 39.0% (end-December 2010: 35.0%).
Borrowing from domestic sources…
Federal Government gross borrowing for the first three months of the year was RM24.5 billion, comprising MGS and GIIs, which totalled RM15.0 billion and RM9.5 billion, respectively. Consequently, Federal Government debt, after netting out repayments, stood at RM430.2 billion as at end-March 2011 (end-December 2010: RM407.1 billion). Of this, domestic debt comprised 96.3% of total Federal Government debt. Debt service charges increased to RM4.5 billion and accounted for 11.6% of total operating expenditure (Q4 2010: RM4.0 billion; 9.0%).
In contrast, the medium and long-term debt, comprising 61.0% of total national debt and mainly denominated in US dollars, declined to RM142.4 billion (end-December 2010: RM147.7 billion). This was largely attributed to higher net repayments by the non-financial public enterprises (NFPEs). The private sector, NFPEs and Federal Government accounted for 45.7%, 43.0% and 11.2% of the medium and long-term debt, respectively.
External Position
Trade expanded…
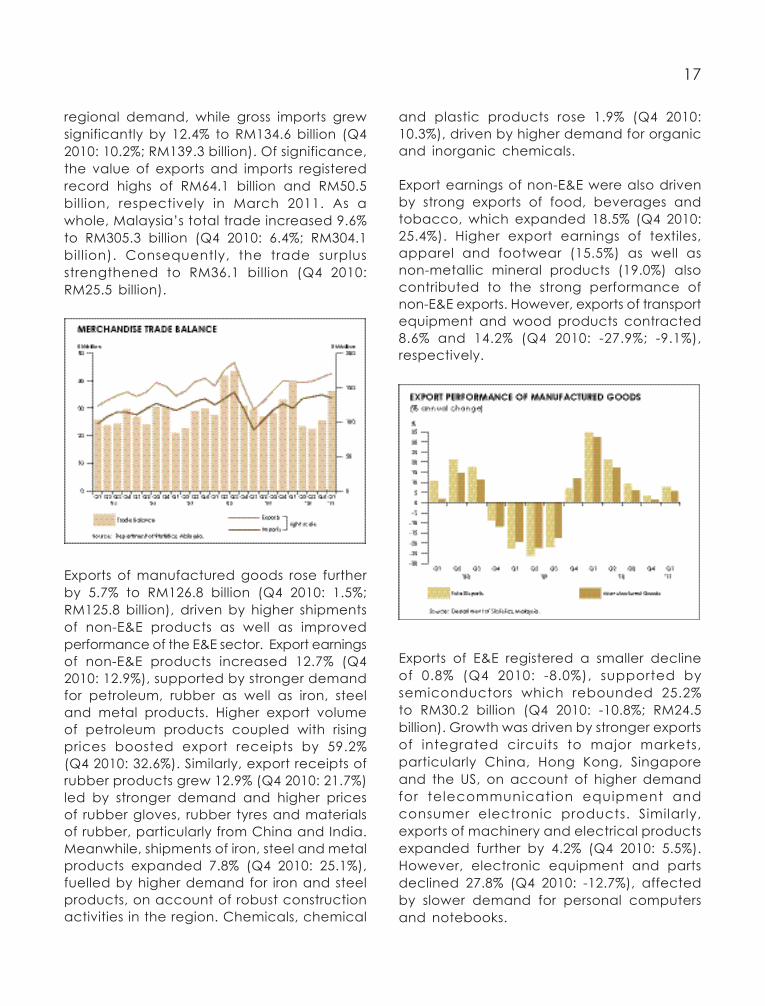
Gross exports expanded 7.5% to RM170.7 billion (Q4 2010: 3.3%; RM164.8 billion) on account of higher commodity prices as well as strong
17
and plastic products rose 1.9% (Q4 2010: 10.3%), driven by higher demand for organic and inorganic chemicals.
Export earnings of non-E&E were also driven by strong exports of food, beverages and tobacco, which expanded 18.5% (Q4 2010: 25.4%). Higher export earnings of textiles, apparel and footwear (15.5%) as well as non-metallic mineral products (19.0%) also contributed to the strong performance of non-E&E exports. However, exports of transport equipment and wood products contracted 8.6% and 14.2% (Q4 2010: -27.9%; -9.1%), respectively.
regional demand, while gross imports grew significantly by 12.4% to RM134.6 billion (Q4 2010: 10.2%; RM139.3 billion). Of significance, the value of exports and imports registered record highs of RM64.1 billion and RM50.5 billion, respectively in March 2011. As a whole, Malaysia’s total trade increased 9.6% to RM305.3 billion (Q4 2010: 6.4%; RM304.1 bill ion). Consequently, the trade surplus strengthened to RM36.1 billion (Q4 2010: RM25.5 billion).
Exports of E&E registered a smaller decline of 0.8% (Q4 2010: -8.0%), supported by semiconductors which rebounded 25.2% to RM30.2 billion (Q4 2010: -10.8%; RM24.5 billion). Growth was driven by stronger exports of integrated circuits to major markets, particularly China, Hong Kong, Singapore and the US, on account of higher demand for telecommunication equipment and consumer electronic products. Similarly, exports of machinery and electrical products expanded further by 4.2% (Q4 2010: 5.5%). However, electronic equipment and parts declined 27.8% (Q4 2010: -12.7%), affected by slower demand for personal computers and notebooks.
Exports of manufactured goods rose further by 5.7% to RM126.8 billion (Q4 2010: 1.5%; RM125.8 billion), driven by higher shipments of non-E&E products as well as improved performance of the E&E sector. Export earnings of non-E&E products increased 12.7% (Q4 2010: 12.9%), supported by stronger demand for petroleum, rubber as well as iron, steel and metal products. Higher export volume of petroleum products coupled with rising prices boosted export receipts by 59.2% (Q4 2010: 32.6%). Similarly, export receipts of rubber products grew 12.9% (Q4 2010: 21.7%) led by stronger demand and higher prices of rubber gloves, rubber tyres and materials of rubber, particularly from China and India. Meanwhile, shipments of iron, steel and metal products expanded 7.8% (Q4 2010: 25.1%), fuelled by higher demand for iron and steel products, on account of robust construction activities in the region. Chemicals, chemical

18
surged 13.2% to RM92.2 billion (Q4 2010: 10.5%; RM94.2 billion), mainly due to strong imports of industrial supplies (20.3%) in tandem with increased activities in the construction and manufacturing sectors. Following improving domestic investment activities, imports of capital goods increased 9.3% to RM17.8 billion (Q4 2010: 10.5%; RM21.6 billion). Meanwhile, imports of consumption goods expanded 5.3% to RM8.8 billion (Q4 2010: 6.9%; RM9.1 billion), spurred by higher household disposable income and a stronger ringgit.
International reserves strengthened…
The international reserves remained strong at RM344.5 billion or USD113.8 billion as at end-March 2011 (end-December 2010: RM328.6 billion; USD106.5 billion). The reserves level remained useable and unencumbered, adequate to finance 8.4 months of retained imports and is 4.3 times the short-term external debt.
[As at 13 May 2011, the international reserves strengthened further to RM401.0 billion (USD132.6 billion). This is sufficient to finance 9.4 months of retained imports and is 4.4 times the short-term external debt]
Agriculture exports increased further by 26.6% to RM19.7 billion (Q4 2010: 36.0%; RM18.5 billion), largely contributed by the higher earnings of palm oil and rubber. Palm oil exports surged 19.9% to RM13.6 billion (Q4 2010: 32.4%; RM13.2 billion) backed by a 39.2% increase in export price to average RM3,556.1 per tonne during the quarter (Q4 2010: RM2,966.0; 30.3%). However, shipments of palm oil declined 13.8% to 3.8 million tonnes (Q4 2010: 1.6%; 4.4 million tonnes) due to slower demand from major importers. Exports of rubber rose 76.0% to RM3.8 billion (Q4 2010: 69.0%; RM2.7 billion) on account of higher shipments and rising prices (RM14.75 per kg).
Export receipts of minerals rebounded 0.1% to RM19.3 billion (Q4 2010: -6.5%; RM16.1 billion), mainly supported by higher exports of natural gas. Export earnings of natural gas increased 6.9% to RM10.7 billion (Q4 2010: 12.3%; RM9.4 billion) following higher shipments as well as better prices. Meanwhile, earnings from crude petroleum declined 11.2% to RM7.9 billion (Q4 2010: -27.9%; RM6.2 billion) due to lower export volume. Shipments of crude oil shrank further, affected by lower demand from China, Thailand and Korea.
Gross imports edged higher to 12.4% (Q4 2010: 10.2%) with expansion across all major categories. Imports of intermediate goods

19
Outlook
Growth momentum to continue…
Prospects for global economic growth remain positive, in view of continued buoyant demand in emerging and developing economies and a pick-up in private sector activities in advanced countries. However, there are downside risks to the growth, especially high unemployment coupled with weak fiscal and financial positions in advanced economies; rising inflationary pressures; and large capital inflows into fast growing emerging economies. The political turmoil in the Middle East and North African region as well as the impact of the earthquake-related disasters in Japan also pose further challenges to global growth.
The Malaysian economy is expected to sustain its growth momentum in the remaining quarters of 2011. This was reflected by the
Leading Index which increased 2.1% in the first quarter of 2011. On the demand side, growth is expected to emanate from domestic consumption and investment activities. On the supply side, growth will be supported by continued expansion in the services and manufacturing sectors.


Key Datahttp://www.treasury.gov.my

23
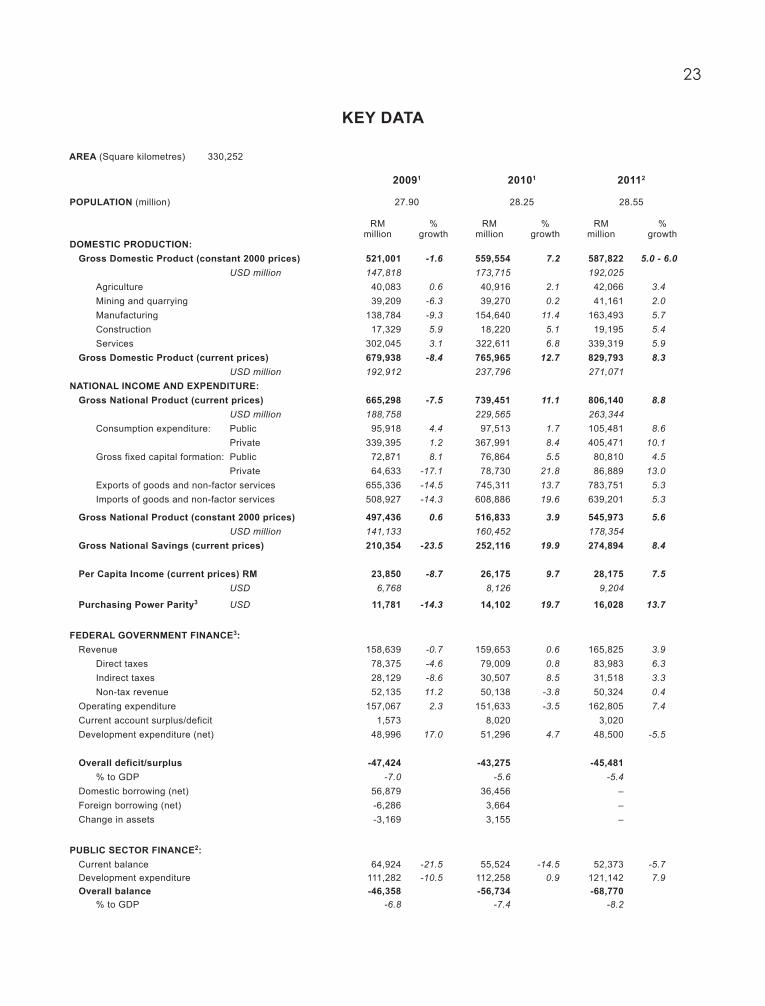
KEY DATA
AREA (Square kilometres) 330,252 20091 20101 20112
POPULATION (million) 27.90 28.25 28.55 RM % RM % RM % million growth million growth million growth DOMESTIC PRODUCTION: Gross Domestic Product (constant 2000 prices) 521,001 -1.6 559,554 7.2 587,822 5.0 - 6.0 USD million 147,818 173,715 192,025 Agriculture 40,083 0.6 40,916 2.1 42,066 3.4 Mining and quarrying 39,209 -6.3 39,270 0.2 41,161 2.0 Manufacturing 138,784 -9.3 154,640 11.4 163,493 5.7 Construction 17,329 5.9 18,220 5.1 19,195 5.4 Services 302,045 3.1 322,611 6.8 339,319 5.9 Gross Domestic Product (current prices) 679,938 -8.4 765,965 12.7 829,793 8.3 USD million 192,912 237,796 271,071 NATIONAL INCOME AND EXPENDITURE: Gross National Product (current prices) 665,298 -7.5 739,451 11.1 806,140 8.8 USD million 188,758 229,565 263,344 Consumption expenditure: Public 95,918 4.4 97,513 1.7 105,481 8.6 Private 339,395 1.2 367,991 8.4 405,471 10.1 Gross fixed capital formation: Public 72,871 8.1 76,864 5.5 80,810 4.5 Private 64,633 -17.1 78,730 21.8 86,889 13.0 Exports of goods and non-factor services 655,336 -14.5 745,311 13.7 783,751 5.3 Imports of goods and non-factor services 508,927 -14.3 608,886 19.6 639,201 5.3
Gross National Product (constant 2000 prices) 497,436 0.6 516,833 3.9 545,973 5.6 USD million 141,133 160,452 178,354 Gross National Savings (current prices) 210,354 -23.5 252,116 19.9 274,894 8.4 Per Capita Income (current prices) RM 23,850 -8.7 26,175 9.7 28,175 7.5 USD 6,768 8,126 9,204
Purchasing Power Parity3 USD 11,781 -14.3 14,102 19.7 16,028 13.7
FEDERAL GOVERNMENT FINANCE3: Revenue 158,639 -0.7 159,653 0.6 165,825 3.9 Direct taxes 78,375 -4.6 79,009 0.8 83,983 6.3 Indirect taxes 28,129 -8.6 30,507 8.5 31,518 3.3 Non-tax revenue 52,135 11.2 50,138 -3.8 50,324 0.4 Operating expenditure 157,067 2.3 151,633 -3.5 162,805 7.4 Current account surplus/deficit 1,573 8,020 3,020 Development expenditure (net) 48,996 17.0 51,296 4.7 48,500 -5.5
Overall deficit/surplus -47,424 -43,275 -45,481 % to GDP -7.0 -5.6 -5.4 Domestic borrowing (net) 56,879 36,456 – Foreign borrowing (net) -6,286 3,664 – Change in assets -3,169 3,155 –
PUBLIC SECTOR FINANCE2: Current balance 64,924 -21.5 55,524 -14.5 52,373 -5.7 Development expenditure 111,282 -10.5 112,258 0.9 121,142 7.9 Overall balance -46,358 -56,734 -68,770 % to GDP -6.8 -7.4 -8.2

24
KEY DATA 20091 20101 20112
RM % RM % RM % million growth million growth million growth National debt2 232,717 -1.5 227,107 -2.4 _ _ USD million 67,324 72,828 _ Medium and long-term debt 155,328 -0.8 147,660 -4.9 _ _ Federal Government 13,787 -32.1 16,745 21.5 _ _ NFPEs 71,600 13.4 66,589 -7.0 _ _ Private sector 69,941 -4.4 64,325 -8.0 _ _ Short-term debt 77,390 -2.9 79,447 2.7 _ _
Debt to GDP (%) 34.2 29.6 _
Debt service ratio (%) 6.9 6.9 _
RM million RM million RM million BALANCE OF PAYMENTS: Current Account 112,139 90,511 100,697 USD million 31,815 27,634 30,743 Goods 141,745 136,575 144,321 Services 4,664 863 230 Income -14,639 -25,249 -23,653 Transfers -19,631 -21,677 -20,200 Financial account -80,208 -21,918 _ Overall balance 13,831 -2,721 _
RM % % RM % % RM % % million growth share million growth share million growth share EXTERNAL TRADE: Total Exports (f.o.b.) 552,518 -16.7 639,428 15.7 170,6674 7.5 USD million 156,760 198,512 55,752 Manufactured goods 432,244 -12.6 78.1 487,974 12.9 76.3 126,796 5.7 74.3 Palm oil (crude and processed) 36,795 -21.8 6.7 45,998 25.0 7.2 13,621 19.9 8.0 Crude petroleum 25,360 -41.8 4.6 30,765 21.3 4.8 7,872 -11.2 4.6 Liquefied natural gas 31,195 -24.8 5.6 38,099 22.1 6.0 10,723 6.9 6.3
Total Imports (c.i.f.) 434,670 -16.4 529,195 21.7 134,5934 12.4 USD million 123,325 164,290 43,968 Intermediate goods 297,465 -21.5 68.4 363,153 22.1 68.6 92,247 13.2 68.5 Capital goods 65,195 -5.0 15.0 76,435 17.2 17.2 17,807 9.3 13.2 Consumption goods 31,492 -2.2 7.2 34,591 9.8 9.8 8,779 5.3 6.5
Balance of Trade 117,848 110,234 36,074
Gross international reserves 331,301 328,577 401,0415
USD million 96,695 106,498 132,622 Months of retained imports 9.8 8.5 9.45
Multiples of short term debt 4.1 4.1 4.45
Trading Partners: (% to total trade) ASEAN 25.5 26.2 26.34
European Union 11.2 10.5 10.14
USA 11.1 10.0 9.34
Japan 11.0 11.4 11.44
China 24.5 12.6 12.44
Others 16.7 29.3 30.54
Index % growth Index % growth Index % growth Consumer Price Index (2010=100) 98.3 0.6 100.0 1.7 102.24 2.8 Producer Price Index (2005=100) 111.1 -7.3 117.3 5.6 125.04 7.4 Thousands % growth Thousands % growth Thousands % growth LABOUR: Labour force8 12,061.1 0.8 12,216.8 1.3 12,506.3 2.4 Unemployment8 (% of labour force) 440.6 3.7 443.5 3.6 437.8 3.5

25
KEY DATA 2009 2010 2011 End-March End-March End-March RM % RM % RM % million growth million growth million growth MONEY AND BANKING: Money Supply (M1) 179,679.4 3.5 201,162.3 12.0 229,361.3 14.0 (M2) 921,831.5 9.3 1,002,708.2 8.8 1,088,616.4 8.6 (M3) 949,445.1 7.4 1,031,851.4 8.7 1,116,288.5 8.2
Banking system: Deposits 985,855.3 8.0 1,068,733.8 8.4 1,172,874.9 9.7 Loans 733,873.5 10.9 805,690.4 9.8 912,096.1 13.2
End-March (%) End-March (%) End-March(%) Loan-deposit ratio9 (end of period) 73.7 79.1 82.0
End-March (%) End-March (%) End-March (%) Interest rates (average rates at end of period): 3-month interbank 2.08 2.50 3.00 Commercial banks: Fixed deposits: 3-month 2.04 2.28 2.74 12-month 2.52 2.67 2.98 Savings deposit 0.95 0.86 1.01 Base lending rate (BLR) 5.53 5.76 6.27 Treasury bill (3-month) 1.94 2.14 2.83 Malaysian Government securities (1-year) 1.99 2.58 2.94 Malaysian Government securities (5-year) 3.49 3.75 3.65
End-April End-April End-AprilMovement of Ringgit (end-period)10: RM per SDR; % change 5.3354 -3.8 4.8122 10.9 4.8159 -0.1 RM per USD; % change 3.5610 -11.3 3.1905 11.6 2.9735 7.3 RM per Euro; % change 4.7404 3.8 4.2284 12.1 4.4100 -4.1 RM per 100 Yen; % change 3.6570 -17.0 3.3951 7.7 3.6462 -6.9
End-April End-April End-AprilBursa Malaysia (end-period): KLCI / FBM KLCI 990.74 1,346.38 1,534.95 Market capitalisation (RM billion) 754.20 1,079.66 1,310.79
SOCIAL INDICATORS: Life expectancy at birth1 : Male (years) 71.7 71.7 n.a. Female (years) 76.5 76.6 n.a. Infant mortality1 (per ‘000 live births) 6.5 6.3 n.a. Literacy rate1 92.7 n.a. n.a. Water coverage:total hour/units with piped water8 (%) 96.6 n.a. n.a. Electricity coverage:rural housing units8 (% of population) 92.2 n.a. n.a. Fixed line telephone subscribers11 (per 100 households) 44.0 42.3 42.66
Cellular phone subscribers11 (per 100 population) 105.4 119.2 121.06
Broadband subscribers11 (per 100 households) 31.7 55.6 57.66
Tourist arrivals (million) 23.6 24.6 1.97
1 Department of Statistics, Malaysia. 2 BNM Annual Report 2010. 3 Economic Report 2010/2011. 4 For the period of January- March 2011. 5 As at 13 May 2011. 6 As at End-March 2011. 7 For the period of January 2011. 8 Economic Planning Unit. 9 Excludes transactions by financial institutions. 10 Annual rate of appreciation (+) or depreciation (-).
11 Malaysian Communications and Multimedia Commission.


Key Economic Indicators


29In
dica
tor /
Mon
th20
1020
11
Jan
Feb
Mar
Apr
May
June
Jul
Aug
Sept
Oct
Nov
Dec
Jan
Feb
Mar
Sale
s of
new
pas
seng
er c
ars
(uni
ts)
45,9
7336
,551
50,5
3343
,661
46,2
5948
,926
48,1
4449
,642
38,7
6146
,439
39,3
7549
,330
49,5
8936
,457
56,4
83
Prod
uctio
n of
veh
icle
s (u
nits
)39
,996
38,2
4254
,949
55,3
8347
,199
49,3
4155
,875
48,2
1438
,086
38,7
6641
,065
40,1
4947
,547
42,6
2943
,300
Sale
s of
mot
orcy
cles
(uni
ts)
38,8
6031
,619
41,1
6541
,250
35,5
2735
,324
42,7
5344
,544
34,5
6945
,068
32,0
7745
,419
39,2
4935
,329
48,2
28
Prod
uctio
n of
mot
orcy
cles
(u
nits
) 36
,096
28,8
4142
,490
40,4
9839
,547
36,8
5044
,341
42,9
7334
,931
45,5
4137
,005
38,8
2840
,494
33,7
7448
,563
Impo
rts o
f con
sum
ptio
n go
ods
(RM
mill
ion)
2,83
42,
409
3,09
42,
831
2,74
93,
042
3,10
32,
807
2,63
62,
813
2,95
13,
322
3,06
12,
379
3,33
9
Burs
a M
alay
sia
(end
-per
iod)
FBM
KLC
I1,
259.
161,
270.
781,
320.
571,
346.
381,
285.
011,
314.
021,
360.
921,
422.
491,
463.
501,
505.
661,
485.
231,
518.
911,
519.
941,
491.
251,
545.
13
Mar
ket c
apita
lisat
ion
(R
M b
illion
)1,
001.
731,
015.
711,
061.
061,
079.
661,
027.
921,
044.
351,
092.
291,
122.
111,
150.
121,
204.
341,
237.
371,
275.
281,
283.
981,
256.
711,
310.
99
Pric
es -
Annu
al c
hang
e (%
)
Cons
umer
Pric
e In
dex
1.4
1.2
1.4
1.6
1.6
1.6
1.8
2.0
1.8
1.9
1.9
2.1
2.4
2.9
3.0
Prod
ucer
Pric
e In
dex
- D
omes
tic4.
25.
99.
07.
45.
95.
25.
64.
84.
94.
44.
65.
56.
97.
27.
9
Labo
ur M
arke
t
R
etre
nchm
ent (
no.)
952
204
558
1,12
029
244
746
029
899
377
543
255
41,
090
227
1,30
4
V
acan
cies
(no.
)13
9,19
611
5,37
219
5,47
418
0,35
118
3,46
717
8,17
517
1,31
215
8,79
671
,670
146,
093
112,
251
135,
064
163,
350
134,
280
270,
907
I. C
ON
SUM
PTIO
N IN
DIC
ATO
RS

30In
dica
tor /
Mon
th20
1020
11
Jan
Feb
Mar
Apr
May
June
Jul
Aug
Sept
Oct
Nov
Dec
Jan
Feb
Mar
Sale
s of
new
com
mer
cial
veh
icle
s (u
nits
) 4
,649
4
,103
5
,606
5
,151
4,
624
5,0
79
5,33
95,
566
4,68
25,
858
5,47
05,
435
5,10
73,
930
6,78
2
Impo
rts (R
M m
illio
n)Ca
pita
l goo
ds 5
,319
5
,049
5
,919
6
,138
6
,374
6
,417
7,
128
6,08
36,
362
7,04
87,
235
7,36
45,
602
5,15
97,
046
Inte
rmed
iate
goo
ds 2
7,26
0 2
3,52
1 3
0,74
4 2
9,27
7 3
0,73
4 3
2,62
832
,977
31,2
6130
,555
33,4
9428
,934
31,7
6930
,897
27,1
3634
,213
Man
ufac
turin
g pr
ojec
tsM
ITI A
ppro
vals
(RM
milli
on)
2,16
01,
906
1,5
54
1,18
44,
134
4,17
54,
270
2,64
01,
876
5,04
83,
896
14,3
354,
772
2,04
05,
357
Ne
w in
vest
men
t 3
67
1,2
99
552
53
13,
575
3,13
62,
044
867
496
4,15
71,
975
4,89
61,
353
1,59
63,
482
Re
-inve
stm
ent
1,7
93
607
1
,003
65
355
81,
039
2,22
61,
773
1,38
189
11,
921
9,43
93,
419
444
1,87
5
Base
lend
ing
rate
(%)1
5.5
1 5
.51
5.7
6 5
.76
6.0
2 6
.02
6.27
6.27
6.27
6.27
6.27
6.27
6.27
6.27
6.27
Mon
ey s
uppl
y (A
nnua
l % c
hang
e)M
1 1
0.8
15.
3 1
2.0
8.9
1
2.1
12.
6 10
.713
.911
.611
.69.
911
.717
.913
.214
.0M
3 7
.9
8.2
8
.7
8.1
9
.3
8.8
8.
18.
28.
58.
48.
27.
08.
87.
98.
2
Risk
-Wei
ghte
d Ca
pita
l Rat
io (R
WCR
), %
15.
1 1
5.1
15.
0 1
5.1
15.
1 1
5.4
15.3
15.1
14.8
14.5
14.4
14.8
14.3
14.4
14.3
Ratio
of n
et im
paire
d lo
ans
to n
et to
tal
loan
s (%
)2 2
.0
2.0
1
.9
2.2
2
.2
2.1
2.
42.
32.
42.
32.
32.
32.
32.
32.
2
Bank
ing
Syst
em :
Loan
s Ap
prov
ed b
y Pu
rpos
e an
d Se
ctor
s (R
M m
illio
n) 2
3,36
4 1
9,81
5 2
6,92
7 2
9,03
1 2
7,99
8 3
3,33
930
,701
31,4
4829
,021
30,3
7730
,183
31,1
9627
,472
21,2
1438
,962
Prim
ary
agric
ultu
re 2
36
479
8
00
446
4
93
640
92
090
445
655
369
458
360
069
377
1M
inin
g an
d qu
arry
ing
71
791
1
74
71
162
5
01
258
109
563
9817
672
5715
550
3M
anuf
actu
ring
(inclu
ding
agr
o-ba
sed)
1,1
67
836
1
,549
1
,678
1
,627
2
,959
2,09
12,
841
1,86
91,
494
1,91
82,
005
1,88
81,
836
3,18
4Se
rvice
s 4
,061
4,4
54
5,1
01
7,1
37
6,5
14
8,3
126,
528
7,74
95,
910
7,18
65,
626
8,54
54,
638
3,28
38,
843
Cons
truct
ion
1,6
02
1,1
20
1,7
94
1,6
43
1,4
92
2,2
88
2,39
12,
165
3,09
42,
287
3,35
62,
293
1,86
71,
421
2,55
2Re
al E
stat
e 1
,196
6
22
1,4
26
1,7
09
1,5
87
1,9
061,
800
1,49
81,
645
1,62
01,
866
1,63
31,
472
794
3,27
1Ho
useh
old
sect
or3
14,
406
11,
165
15,
265
16,
054
15,
388
16,
033
16,2
3016
,013
15,2
2316
,540
16,5
1315
,260
16,6
0012
,654
19,5
23O
ther
sec
tor n
.e.c
. 6
24
347
8
20
293
7
36
699
483
168
261
599
193
205
352
379
315
Loan
s Di
sbur
sed
by P
urpo
se a
nd S
ecto
rs
(RM
mill
ion)
56,
681
55,
873
61,
785
60,
964
59,
149
65,
140
59,5
5356
,654
59,8
9761
,100
64,3
8563
,405
65,9
7350
,154
72,5
05
Prim
ary
agric
ultu
re 2
,809
3
,241
3
,143
1
,565
1
,929
1
,889
1,43
81,
594
1,74
91,
740
1,72
21,
809
1,57
01,
535
2,48
4
Min
ing
and
quar
ryin
g 1
91
223
3
44
246
1
52 2
25
165
257
437
528
387
329
319
382
396
Man
ufac
turin
g (in
cludi
ng a
gro-
base
d) 1
1,10
3 1
0,14
0 1
2,14
8 1
2,83
8 1
1,22
9 1
3,55
2 12
,464
11,5
7812
,103
11,9
6912
,205
12,6
6114
,418
10,8
2016
,013
Serv
ices
16,
988
18,
154
16,
549
21,
436
19,
131
21,
844
18,4
5316
,121
18,0
4720
,206
20,9
6017
,339
18,0
4814
,140
21,4
82
Cons
truct
ion
3,0
19
2,9
23
3,2
20
3,3
79 3
,316
3
,760
3,35
53,
840
4,11
93,
515
4,00
24,
368
4,18
72,
445
3,63
5
Real
Est
ate
1,6
23
1,8
09
1,7
54
1,1
10
1,4
15
1,5
96
2,14
92,
342
2,36
21,
691
2,29
43,
540
2,36
71,
354
2,64
9
Hous
ehol
d se
ctor
3 1
9,45
6 1
7,30
4 2
0,42
4 1
9,37
8 1
9,94
5 2
0,98
0 20
,385
20,0
3619
,144
20,5
7221
,713
22,0
4123
,839
18,4
5624
,275
Oth
er s
ecto
r n.e
.c.
1,4
93
2,0
79
4,2
03
1,0
13
2,0
33
1,2
94
1,14
588
41,
936
878
1,10
31,
319
1,22
41,
024
1,57
1
Regi
stra
tion
of n
ew lo
cal c
ompa
nies
(no.
)3,
834
2,64
75,
611
3,68
93,
333
3,55
53,
520
3,42
83,
072
3,78
23,
505
4,17
23,
452
2,62
84,
481
Liqu
idat
ion
of c
ompa
nies
(no.
)1,
489
850
1,84
73,
076
2,08
22,
272
3,76
32,
619
1,17
11,
298
1,41
91,
811
1,03
71,
603
1,43
4
Prop
erty
Ove
rhan
g (e
nd p
erio
d)4
Tota
l (un
its)
28,6
8728
,043
29,5
7530
,859
31,2
66
% C
hang
e (p
rece
edin
g)-0
.23.
412
.28.
39.
0To
tal (
RM m
illion
)5,
649
5,50
46,
071
6,79
47,
145
%
Cha
nge
(pre
ceed
ing)
2.4
4.4
14.1
16.5
26.5
II. IN
VEST
MEN
T IN
DIC
ATO
RS
Not
e:
1 Com
mer
cial
ban
k ra
te.
2 B
egin
ning
fina
ncia
l yea
r 201
0, b
anki
ng in
stitu
tions
are
requ
ired
to re
port
impa
ired
loan
s in
acc
orda
nce
with
the
Gui
delin
e on
the
Cla
ssifi
catio
n an
d Im
pairm
ent P
rovi
sion
s fo
r Loa
ns/F
inan
cing
. Th
e re
porti
ng o
f non
-per
form
ing
loan
s ha
s si
nce
been
dis
cont
inue
d.
3 Hou
seho
ld s
ecto
r = to
tal l
oans
by
purp
ose
to h
ouse
hold
s.
4 Qua
rterly
dat
a.
n.
e.c
- not
els
ewhe
re c
lass
ified
.
3131In
dica
tor /
Mon
th20
1020
11Ja
nFe
bM
arAp
rM
ayJu
neJu
lAu
gSe
ptO
ctNo
vDe
cJa
nFe
bM
ar
Agric
ultu
re S
ecto
rPa
lm O
il ('0
00 to
nnes
)1,
321
1,15
71,
387
1,30
61,
385
1,42
01,
519
1,60
71,
563
1,63
71,
459
1,23
31,
058
1,09
41,
416
Price
(RM
/ to
nne)
2,51
52,
549
2,62
42,
538
2,52
92,
453
2,54
22,
718
2,71
92,
853
3,25
13,
620
3,76
93,
811
3,49
8Ru
bber
('00
0 to
nnes
)10
981
7055
6571
81
8175
9473
8510
992
65Pr
ice (s
en /
kg)
994
1,01
01,
038
1,04
692
093
3 91
595
51,
034
1,15
61,
284
1,41
61,
580
1,67
31,
429
Coco
a, e
xpor
t uni
t val
ue (R
M /
tonn
e)12
,832
12,4
9511
,979
10,9
8111
,243
10,4
8911
,324
12,4
8011
,435
9,25
210
,154
11,9
7710
,926
10,2
3211
,002
Fish
land
ing
('000
tonn
es)
104
101
120
128
124
126
129
128
129
135
110
105
103
107
121
Live
stoc
k1 :
Chi
cken
s ('0
00)
10,3
179,
542
10,7
6610
,194
9,87
6 9,
968
10,8
069,
800
10,0
5310
,344
10,4
5313
,915
9,99
68,
598
10,0
91
Cat
tle
1,48
81,
730
2,08
52,
058
2,15
82,
412
2,37
63,
164
3,32
21,
841
2,00
72,
090
1,65
51,
670
1,71
8
Goa
ts43
862
061
177
090
583
694
291
91,
282
708
1,66
11,
461
555
492
571
Cons
truct
ion
Sect
orNo
. of h
ouse
s ap
prov
ed6,
924
5,75
712
,349
9,18
311
,766
9,00
58,
258
10,9
1210
,037
9,86
513
,679
12,9
3512
,455
8,76
611
,781
New
adve
rtisin
g &
sale
s pe
rmits
(no.
)76
6194
9989
8997
8385
9610
495
107
7510
7
Tran
spor
t Sec
tor
High
way
(milli
on /
vehi
cles)
11
310
311
711
511
711
812
411
912
112
512
011
912
410
612
7Ra
il (RM
milli
on)
K
TMB
Com
mut
er re
venu
e7.
06.
06.
86.
76.
76.
66.
86.
96.
97.
26.
88.
37.
46.
26.
8
KTM
B Ca
rgo
reve
nue
9.8
9.0
10.1
9.2
9.3
9.8
10.2
9.7
9.0
10.1
9.4
10.4
9.9
9.2
11.0
K
LIA
Expr
ess
and
Tran
sit re
venu
e5.
95.
66.
66.
56.
26.
36.
66.
56.
06.
96.
26.
36.
25.
87.
0Ai
r (M
AS):
N
o.of
pas
seng
ers
('000
)1,
006
1,00
71,
102
1,05
51,
051
1,13
31,
169
1,04
81,
097
1,08
81,
103
1,25
21,
067
991
1,12
8
D
omes
tic34
438
842
639
338
243
642
434
339
136
439
246
033
331
838
5
In
tern
atio
nal
662
619
676
662
669
697
745
705
706
724
712
792
734
673
743
Carg
o (m
illion
kg)
35.0
33.8
43.0
39.5
42.5
39.6
40.6
40.0
35.6
43.1
39.5
39.8
34.6
28.7
38.8
Air (
Air A
sia):
No. o
f pas
seng
ers
('000
)1,
248
1,15
51,
282
1,21
71,
310
1,36
6 1,
375
1,25
41,
407
1,42
31,
396
1,62
21,
440
1,36
01,
519
Carg
o ('0
00 k
g)3.
73.
75.
04.
7 4.
8 4.
7 5.
65.
65.
16.
33.
96.
16.
75.
17.
3Po
rt - C
onta
iner
TEU
s (‘0
00)2
1,42
21,
274
1,45
51,
504
1,54
71,
515
1,60
81,
567
1,45
31,
555
1,51
81,
537
1,59
51,
401
1,68
2
Tour
ism
Sec
tor
Tour
ist a
rriva
ls ('0
00)
1,89
71,
832
2,02
31,
878
1,99
2 2
,246
2,
214
2,09
92,
053
2,13
82,
081
2,12
31,
919
--
Com
mun
icat
ion
Sect
or (s
ubsc
iber
s ‘0
00)3
Fixe
d Li
ne
4,32
84,
395
4,39
14,
406
4,42
6Ce
llula
r 30
,794
31,4
5632
,413
33,1
0634
,456
3G7,
459
7,86
08,
381
8,60
29,
668
Broa
dban
d (in
clude
s wi
rele
ss L
AN)
2,92
23,
232
4,28
54,
722
4,91
3
Indu
stria
l Pro
duct
ion
Inde
x- A
nnua
l cha
nge
(%)
13.2
4.4
13.7
11.4
12.4
9.1
3.4
3.9
5.7
3.0
4.8
4.5
0.5
5.2
2.4
Min
ing
Sect
orPr
oduc
tion
Inde
x - A
nnua
l cha
nge
(%)
2.5
-2
.8-1
.9-0
.30.
10.
7-5
.8-2
.61.
8-1
.3-0
.4-3
.4-6
.7-0
.7-4
.0Cr
ude
Oil &
Con
dens
ates
('00
0 ba
rrels)
20,9
7818
,332
20,0
9119
,062
20,1
6218
,729
18,5
4118
,901
19,5
6319
,493
18,8
5519
,394
19,2
5117
,472
18,8
72Cr
ude
Oil &
Con
dens
ates
('00
0 bp
d)4
677
655
648
636
651
624
598
610
653
629
628
627
621
624
612
T
apis
Blen
d (U
SD/b
arre
l)80
.777
.682
.886
.979
.178
.179
.981
.382
.389
.991
.695
.210
1.2
107.
711
8.7
D
ated
Bre
nt (U
SD/b
arre
l)76
.474
.379
.385
.076
.374
.874
.776
.777
.882
.985
.791
.896
.310
4.0
114.
4
III. P
RO
DU
CTI
ON
IND
ICAT
OR
S
Natu
ral G
as (m
msc
fd)5
6,63
75,
962
6,31
26,
297
5,80
15,
831
6,14
75,
390
6,27
16,
020
6,09
46,
014
6,40
66,
457
6,27
0Ti
n (to
nnes
)19
318
819
320
922
320
823
324
124
022
324
224
9-
--
Elec
trici
ty S
ecto
rPr
oduc
tion
Inde
x - A
nnua
l cha
nge
(%)
19.8
11.4
24.9
12.2
11.5
5.2
4.4
4.9
3.1
5.2
4.9
2.4
0.3
0.7
-0.7
Max
imum
dem
and
(MW
)14
,165
14,4
4614
,890
14,9
8315
,072
14,5
9714
,361
14,7
5814
,339
14,9
1614
,380
14,2
5114
,342
14,6
4014
,989
Sale
s (G
W h
our)
7,43
17,
331
6,96
67,
929
7,79
67,
902
7,55
87,
764
7,77
97,
136
7,91
17,
267
7,57
17,
473
6,95
0
Man
ufac
turin
g Se
ctor
Prod
uctio
n In
dex
- Ann
ual c
hang
e (%
)18
.27.
120
.516
.818
.413
.17.
46.
67.
64.
77.
08.
23.
88.
25.
3Sa
les
- Ann
ual c
hang
e (%
)29
.317
.026
.620
.120
.314
.38.
88.
96.
93.
28.
711
.97.
610
.014
.1
Note
:
1 Tot
al s
laug
hter
ed.
2 C
over
s on
ly Kl
ang,
Pen
ang,
Joh
or, K
uant
an, T
anju
ng P
elep
as, B
intu
lu a
nd K
uchi
ng (
TEUs
: Twe
nty-
foot
equ
ivale
nt u
nits
).
3 End
of p
erio
d.
4 Bar
rels
per d
ay.
5 M
illion
sta
ndar
d cu
bic
foot
per
day
.

32
Indi
cato
r / M
onth
2010
2011
Jan
Feb
Mar
Apr
May
June
Jul
Aug
Sept
Oct
Nov
Dec
Jan
Feb
Mar
RM
(mill
ion)
Gro
ss e
xpor
ts52
,447
46,8
4059
,443
52,0
2752
,297
52,8
2955
,426
52,8
5250
,474
54,9
7852
,699
57,1
6554
,039
52,6
4664
,058
Gro
ss im
ports
39,5
1635
,169
45,0
9342
,804
44,1
5346
,786
48,4
1444
,532
43,4
6748
,126
43,7
0147
,478
44,8
4739
,212
50,5
35
Trad
e ba
lanc
e 1
2,93
1 1
1,67
1 1
4,35
0 9
,223
8
,144
6
,043
7,01
28,
320
7,00
76,
852
8,99
89,
687
9,19
213
,434
13,5
23
Tota
l tra
de
91,
963
82,
009
104,
536
94,
831
96,
450
99,
616
103,
840
97,3
8493
,942
103,
104
96,4
0010
4,64
398
,886
91,8
5811
4,59
2
USD
(mill
ion)
Gro
ss e
xpor
ts15
,539
13,7
1317
,875
16,2
2716
,074
16,1
8317
,275
16,7
5816
,250
17,7
3216
,918
18,2
7317
,653
17,2
9421
,094
Gro
ss im
ports
11,7
0810
,296
13,5
6013
,351
13,5
7114
,332
15,0
8914
,120
13,9
9415
,522
14,0
2915
,176
14,6
5012
,881
16,6
41
Trad
e ba
lanc
e3,
831
3,41
74,
315
2,87
62,
503
1,85
12,
186
2,63
82,
256
2,21
02,
889
3,09
63,
003
4,41
34,
453
Tota
l tra
de
27,
247
24,
010
31,
435
29,
577
29,
645
30,
515
32,3
6430
,878
30,2
4333
,254
30,9
4733
,449
32,3
0430
,175
37,7
35
Exte
rnal
rese
rves
(e
nd o
f per
iod)
RM
bill
ion
332.
233
1.8
311.
731
3.9
312.
230
9.8
310.
631
1.3
310.
832
4.9
326.
4 32
8.6
333.
533
8.6
344.
5
US
D b
illio
n96
.996
.895
.396
.095
.594
.895
.095
.210
0.7
105.
310
5.8
106.
510
8.1
109.
811
3.8
Mon
ths
of
reta
ined
impo
rts9.
210
.08.
88.
58.
38.
17.
97.
88.
58.
88.
6 8.
58.
78.
18.
4
Mul
tiple
s of
sho
rt te
rm d
ebt
4.1
4.3
4.0
4.0
4.4
4.4
4.4
4.3
4.3
4.5
4.0
4.1
4.1
4.3
4.3
IV. E
XTER
NA
L SE
CTO
R

33