Embed Size (px)
Citation preview
Pcrtanika 8(1), 21-32 (1985)
Indicative Planning of the WestMalaysian Economy Using an
Input-Output Projection Model
ABDUL AZIZ ABDUL RAHMANEconomics Department
Faculty of Resource Economics and AgribusinessUniversiti Pertanian Malaysia,Serdang, Selangor, Malaysia.
Key words: Indicative planning; input-output projection model.
ABSTRAK
Kertas ini membincangkan satu model unjuran input-output yang telah digunakan untukperancangan penunjuk ekonomi Malaysia Barat he tahun 1985. Model ini mengunjurkan strukturekonomi termasuk output, pelaburan dan buruh dalam tahun 1985 berasaskan satu paras penggu-naan dalam negeri agregat yang kemungkinan digunakan dalam tahun matlamat. Unjuran asasmenunjukkan bahawa kadar pertumbuhan penggunaan swasta per kapita sebanyak 4 peratussetahun yang diandaikan dalam model ini tidak tercapai, terutamanya darisegi keperluan pelaburandan tenaga buruh. Terdapatnya perubahan-perubahan teknologi menghasilkan pengurangan besarke atas keperluan-keperluan pelaburan, buruh dan eksport, dengan itu meningkatkan nisbah peng-gunaan dalam Keluaran Dalam Negeri Kasar pada tahun matlamat. Kenaikan harga-harga eksportjuga mengurangkan paras pembentukan modal, eksport dan buruh yang dikehendaki untukmenampung kadar pertumbuhan penggunaan yang diunjurkan. Analisis implikasi-implikasi dasarpenggantian import menunjukkan bahawa penggantian import barang-barang perkilanganmengurangkan be ban ke atas ekonomi. Namun, penggantian import adalah menguntungkan hanyake titik apabila harga barang-barang perkilangan tempatan adalah 10 peratus lebih tinggi daripadaharga seberang laut.
ABSTRACT
This paper discusses an input-output projection model which has been used for indicative plan-ning of the West Malaysian economy into 1985. The model projects the structure of the economy in-cluding output, investment and labour in 1985 given a level of aggregate domestic consumption likelyto be utilised in the target year. The basic projection indicates that the growth rate in per capitaprivate consumption of 4 per cent per annum assumed in the model appears infeasible, particularly interms of investment and labour requirements. The advent of technological changes, however, resultsin substantial reduction in investment, labour and export requirements, thus increasing the propor-tion of consumption in Gross Domestic Product in the target year. An increase in export prices alsoreduces the level of capital formation, exports and labour required to sustain the projected growthrate in consumption. The analysis of implications of an import replacement policy shows that importsubstitution of manufactured goods reduces the strain on the economy. However, import-substitutionis beneficial only up to a point where the price of domestically-produced manufactures is 10 per centhigher than the overseas prices.
ABDUL AZIZ ABDUL RAHMAN
INTRODUCTION
The application of input-output projectionmodels for indicative planning of the nationaleconomy has been widely described and suchmodels are used extensively in the UnitedKingdom, the United States and France. Theoutstanding feature of input-output projectionmodels is that they account for structural inter-dependence between the sectors of the economy,and show in detail how variations in one or moresectors, or changes in economic variables, willaffect the overall economy.
This paper describes an input-output pro-jection model which has been used to project theshape of the West Malaysian economy in 1985.The model is designed to provide an analyticaltool for indicating the impact of perspectiveeconomic policies on growth and a frameworkfor national projections which would includesufficient disaggregation in the principal sectorsof the economy.
The projections of the structure of theeconomy in 1985 set out below do not purport tobe anything other than the end result of adopt-ing a specific model and a specific set of assump-tions. Nonetheless, given the acceptability of themodel and the assumptions, the results providesome indication of what the economy could looklike in 1985. For each set of assumptions themodel will provide a national outcome. In turn,this outcome can be scrutinised from the pointof view of consistency and feasibility.
Several modifications to the model arerequired before meaningful longer term fore-casts can be derived. The assumption that theinput-output and capital-output coefficientsremain unchanged in many of the projections istoo rigid, but it may be relaxed if sufficientinformation is available. Changes in the physicalinput mix to be expected in the future shouldalso be incorporated in the model. However, the
prediction of future changes in physical inputs isdifficult and may only be achieved via an inten-sive analysis of the future technological changeand price relationships.
PROJECTION METHOD AND MODEL
The Economic Planning Unit of the PrimeMinister's Department has prepared, for theOutline Perspective Plan of the New EconomicPolicy (Third Malaysia Plan, Chapter IV), pro-jections of the growth and structural changes forthe economy for the period 1970-1990. Inaddition, it has developed projections of themain macro variables based on a model incor-porating relationships between these broadaggregates. One major outcome of these under-takings was a projection of growth in consump-tion per capita of 4 percent per annum between1970 and 1990. Also, public consumption wasprojected to grow by 9 percent per annum overthe same period.
The projection model described belowaims at providing a picture of the West Malay-sian economy in the target year which wouldresult from some sustained target growth rate forconsumption and government expenditure l. It isprogrammed to provide estimates of eachsector's output, exports, imports, investment andlabour required to satisfy the target growth rate,given the set of current and capital input-outputcoefficients and import-output coefficients. Thesector outputs required also satisfy the conditionsthat sufficient capital of the right type and originis produced to sustain the required sectoralgrowth rates, and there are sufficient exportsforthcoming to finance the imports requiredgiven the permissible level of overseas borrowing.
Basic Data and Relationships
i. The basis for the projection analysis is a39-sector set of current and capital inter-sector tables and coefficients for 1970z.
To an extent, this study attempts to further explore some of the issues which have been investigated in the Outline PerspectivePlan.
T'he compilation of the respective intersector tables, undertaken as part of this projection study, was based on the 1970 input-output tables for Peninsular Malaysia published by the Department of Statistics (1975a).
22 PERTANIKA VOL. 8 NO. 1, 1985
INDICATIVE PLANNING USING AN INPUT-OUTPUT PROJECTION MODEL
ii. In using the model for projections thecurrent input-output coefficients are basedon those for 1970. However, for some of theprojections, these coefficients have beenvaried.
iii. The set of incremental sectoral capital-output coefficients are as for 19703.
iv. The import-output coefficients are basical-ly those ruling in 1970. In the examina-tion of the implications of import-substi-tution, the import-output coefficient ofeach sector has been reduced, a corres-ponding upward adjustment being madeto the coefficients representing purchasesfrom the domestic manufacturing sectors.
The estimates of output per worker in 1985are as projected by the Outline PerspectivePlan.
The patterns of sectoral contributions toconsumption and exports in 1985 are asspecified by the Economic- Planning Unit.
The macro aggregates including re-ex-ports, purchases by residents abroad anddomestic purchases by non-residents forcomputing the Gross Domestic Productcomponents in 1985 are as projected by theEconomic Planning Unit.
viii. All projections are in 1970 prices butallowance is made for assumed changes inthe terms of trade.
The Working of the Model
i. The target level of total private consump-tion for 1985 (in 1970 prices), disaggregat-ed into sector constituents, was inserted inthe model.
ii. The projected 1985-level of governmentcurrent expenditure (at 1970 prices),broken up into sector components, was alsoincluded.
v.
VI.
vu.
iii. Given the target levels of private consump-tion and government expenditure for 1985,the model was then solved to give, for eachsector, new equilibrium levels of totaloutput, exports, imports, sales and directimports of capital goods, investment andlabour force.
The solution is secured subject to the con-ditions that:
a. Total exports equal total imports.
b. The level of gross investment, and its allo-cation between sectors, is adequate tomaintain the target growth rate in con-sumption.
c. All intersector demands for goods andservices are satisfied.
Basic Projection
Table 1 below gives the picture of the WestMalaysia economy in 1985 which emerges fromthe model incorporating the assumptions asdiscussed above.
The ratios of consumption, capital forma-tion, exports and imports to GDP4, and labourforce to population (participation rate), viewedin the light of historical experience, are probablythe most useful simple indicators of the feasibi-lity of this representative projection. For the1960-1975 period, consumption and capitalformation averaged 79.41 percent and 14.39percent respectively of GDP. Also, over the sameperiod, per capita consumption grew at 2 per-cent per annum. For 1985, the proportion ofconsumption and capital formation in GDP are72.73 percent and 23.95 percent respectively.Therefore, if the consumption ratio alone wereto be the guide, the past experience would indi-cate that the basic projection appears infeasible.It is apparent that the faster rate of growthenvisaged for 1970- 1985 requires a larger
The estimation of these coefficients was also carried out as part of the projection study.
The corresponding ratios relating to the 1960 - 1970 period are computed based on data given in the National Accounts ofPeninsular Malaysia 1960 - 1971 (Department of Statistics 1975b); those for subsequent years are estimated using various datagiven in Khor (1983).
PERTANIKA VOL. 8 NO. 1, 1985 23
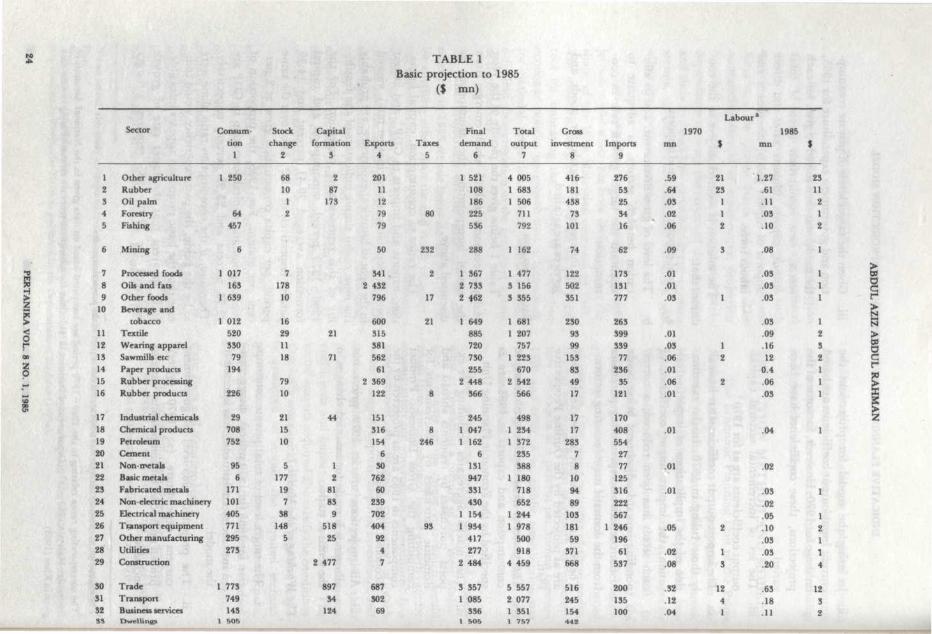
TABLE 1Basic projection to 1985
($ mn)
I
!2
3
4
5
6
78
9
10
11
12
13
14
15
16
17
18
19
20
21
2223
24
2526272829
303132S 3
Sector
Other agricultureRubberOil palmForestryFishing
Mining
Processed foodsOils and fatsOther foodsBeverage and
tobaccoTextileWearing apparelSawmills etcPaper productsRubber processingRubber products
Industrial chemicalsChemical productsPetroleumCementNon-metalsBasic metalsFabricated metalsNon electric machineryElectrical machineryTransport equipmentOther manufacturingUtilitiesConstruction
TradeTransportBusiness servicesDwellings
Consum-tion
1
1 250
64
457
6
1 017163
1 639
1 012520
330
79
194
226
29
708752
956
171101
405771295273
1 773749143
1 505
Stockchange
2
68
101
2
7178
10
16
29
11
18
79
10
21
15
10
5
177197
38
148
5
Capitalformation
3
2
87173
21
71
44
12
81
83
9
51825
2 477
897
34
124
Exports4
201
11
12
79
79
50
341
2 432796
600
315
381
562
61
2 369122
151
316
154
6
30762
60239702404
92
4
7
687302
69
Taxes5
80
232
2
17
21
8
8
246
93
Finaldemand
6
1 521108
186
225
536
288
1 3672 7332 462
1 649885720730255
2 448366
245
1 0471 162
6
131
947
331
430
1 1541 934
417
277
2 484
3 3571 085
3361 505
Totaloutput
7
4 0051 6831 506
711
792
1 162
1 4773 1563 355
1 6811 207
7571 223
670
2 542566
498
1 2341 372
235
388
1 180718
652
1 2441 978
500
918
4 459
5 5572 0771 351\ 757
Grossinvestment
8
416
181
438
73
101
74
122
502
351
230
93
99153
83
49
17
17
17
283
78
10
94
89
103
181
59
371
668
516
2451544 4 2
Imports9
27653
25
34
16
62
173
131
777
263399339
77236
35
121
170
408
554
27
77125316
222
567
1 246196
61
537
200
135100
1970mn
.59
.64
.03
.02
.06
.09
.01
.01
.03
.01
.03
.06
.01
.06
.01
.01
.01
.01
.05
.02
.08
.32
.12
.04
Labour
$
21
231
1
2
3
1
1
2
2
2
13
12
41
a
1985mn
1.27.61.11.03
.10
.08
.03
.03
.03
.03
.09
.16
12
0.4
.06
.03
.04
.02
.03
.02
.05
.10
.03
.03
.20
.63
.18
.11
$
23
11
212
1
1
11
1
2
321
1
1
1
1
1
21
14
1232
BGP
NN>s5P
!>
O
TABLE 1 - (Cont.)Basic projection to 1985
(f «nn)
343536373839
EducationHealthPersonal servicesPublic administrationCommunity servicesOther services
Labour (mn)ImportsCommodity taxes
TOTAL (1970 prices)
Consum-tion
1
46128809
1 2571 5323 313
693155
22 666
Stockchange
2
30725
1 215
Capitalformation
3
2 677191
7 517
Exports4
1
167
12 563
Taxes5
Finaldemand
6
46128S10
1 2571 5323 313
Totaloutput
7
46163968
1 3021 5513 391
Grossinvestment
8
2986
117306105628
7 517
Imports9
232
167264
50247
8 720
mn
.02
.03
.14
.08
.14
.05
2.78
Labour*1970
$
115352
97
mn
.05
.06
.28
.08
.21
.49
5.43
1985$
115139
102
^Employment figures for 1970 are from Labour and Household Survey 1970 (Department of Statistics, 1974).
ABDUL AZIZ ABDUL RAHMAN
diversion of total output to fixed capital forma-tion, and the proportion of GDP devoted to con-sumption is thus reduced.
Nonetheless, economic planners lookingforward to 1985 may well be advised to opt for agrowth rate which involves lowering the share ofGDP devoted to consumption. A sufficiently fastgrowth of GDP renders an increase in consump-tion feasible at the same time as the share ofGDP being devoted to fixed capital formation isincreasing. As has been noted by Lewis (1955),economic growth requires incentives, and thesewill not be seen to be present unless consumptionis permitted to rise. Concomitantly, the fasterthe rate of GDP growth, the more rapidly theratio of consumption to GDP may be reduced.Thus, if the rate of consumption per capita wereto rise above the 2 percent achieved in the past,it appears that this could be accompanied by anacceptance within the economy of a reduction inthe proportionate share of GDP attributed toprivate consumption expenditure. If this premiseis accepted, then, the 4 percent per capita con-sumption growth envisaged by the Outline Pers-pective Plan seems to be feasible.
The proportions of exports and imports toGDP given by the basic projection do not differsignificantly from those recorded for 1960 —1975 5, and are therefore feasible. From the view-point of labour force requirements, the basicprojection does not seem to be feasible. Theparticipation rate in 1985 is estimated to be40.25 percent compared with 33.22 percent in1970 and 34.55 percent in 1975. Also, the Out-line Perspective Plan's forecast of the participa-tion rate in 1985 is 36.10 percent. However,although the participation rate projected for1985 falls beyond the range of that observed inthe past, it may still be achieved. In recent yearsthere have been substantial increases in labourforce participation for women, and with the raterising steadily there is no reason to suppose thatby 1985 the increased involvement of womenwould have been taken as far as it could go. Thebasic projection involves a comparatively fast
rate of per capita consumption growth and thehigh labour requirements generated by suchgrowth would produce a wide range of employ-ment opportunities.
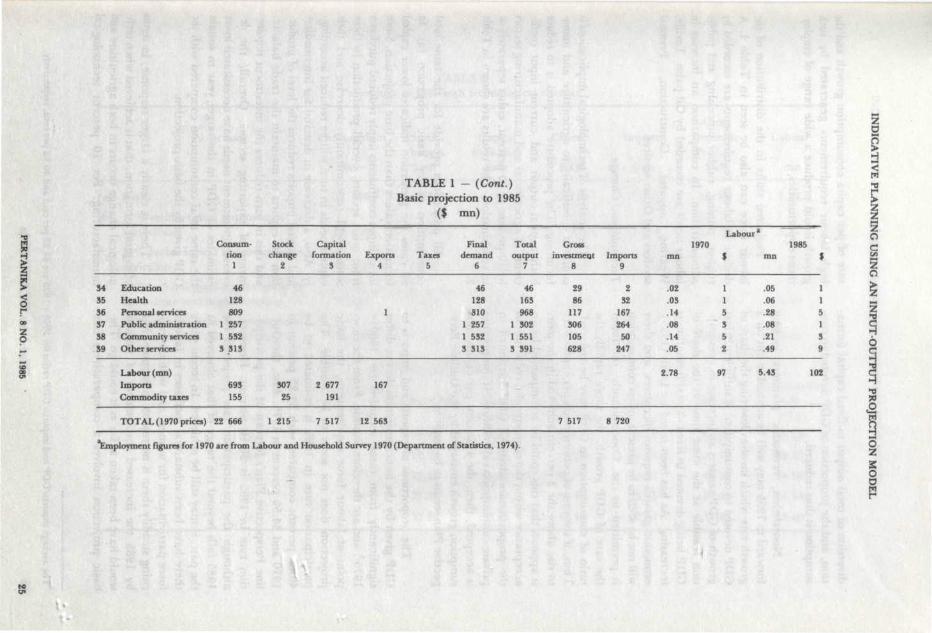
Projected shifts in the distribution of thelabour force can also be seen in Table 1. Adecline in labour requirements are recorded byrubber, mining, rubber processing and publicadministration. In comparison an increase inlabour needs are recorded by Oil palm, Textile,Wearing apparel, Construction, Personalservices and Other services.
Technological Change
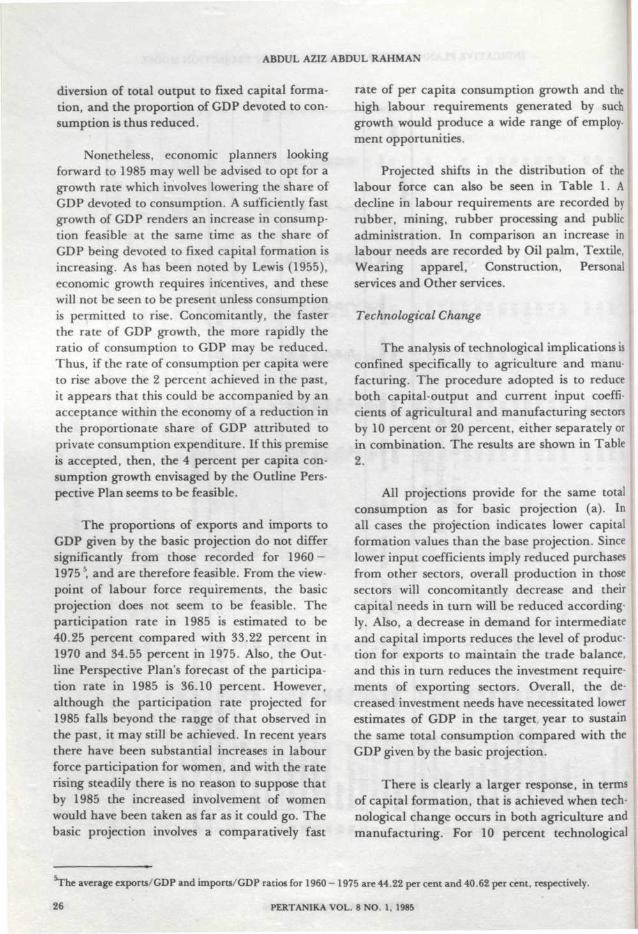
The analysis of technological implications isconfined specifically to agriculture and manu-facturing. The procedure adopted is to reduceboth capital-output and current input coeffi-cients of agricultural and manufacturing sectorsby 10 percent or 20 percent, either separately orin combination. The results are shown in Table2.
All projections provide for the same totalconsumption as for basic projection (a). Inall cases the projection indicates lower capitalformation values than the base projection. Sincelower input coefficients imply reduced purchasesfrom other sectors, overall production in thosesectors will concomitantly decrease and theircapital needs in turn will be reduced according-ly. Also, a decrease in demand for intermediateand capital imports reduces the level of produc-tion for exports to maintain the trade balance,and this in turn reduces the investment require-ments of exporting sectors. Overall, the de-creased investment needs have necessitated lowerestimates of GDP in the target year to sustainthe same total consumption compared with theGDP given by the basic projection.
There is clearly a larger response, in termsof capital formation, that is achieved when tech-nological change occurs in both agriculture andmanufacturing. For 10 percent technological
^ h e average exports/GDP and imports/GDP ratios for 1960- 1975 are 44.22 per cent and 40.62 percent, respectively.
26 PERTANIKA VOL. 8 NO. 1, 1985
TABLE 2Projections to 1985 with technological changes
a
Projections
(a) Basic
(b) 10% technological improvement inagriculture
(c) 20% technological improvement inagriculture
(d) 10% technological improvement inagriculture and manufacturing
(e) 20% technological improvement inagriculture and manufacturing
(a)
(b)
(c)
(d)
(e)
Consumption
Jmn
22 666
22 666
22 666
22 666
22 666
Stockchanges
$mn
1 215
1 204
1 194
1 136
1 072
PERCENTAGE
Consumption
72.73
72.76
73.28
75.30
77,94
Capitalformation
Jmn
7 517
7 298
7 088
6 315
5 359
SHARE OF
Stockchanges
3.87
3.87
3.86
3.77
3.69
Exports
Jmn
12 730
12 581
12 436
11 728
10 909
GDP
Capitalformation
23.95
23.43
22.92
20.98
18.43
Imports
$mn
12 747
12 598
12 453
11 745
10 926
Exports
40.57
40.39
40.21
38.96
37.51
GrossDomesticProduct
Jmn
31 381
31 151
30 931
30 100
29 080
Imports
40.62
40.44
40.26
39.01
37.57
Labour
mn
5.43
5.37
5.30
4.66
4.56
Participationrate
(%)
40.25
39.81
39.29
34.54
33.80
H
>z2oS%
.3
O
IP
ABDUL AZIZ ABDUL RAHMAN
change in agriculture, as in projection (b), theinvestment needs are reduced by 2.9 percentwhen compared with the base projection (a). Incomparison, a similar technological improve-ment in both agriculture and manufacturing asshown by projection (d) reduces investmentrequirements by 16.0 percent.
In West Malaysia, progress towards im-proving input use and labour productivity isoccuring all the time. The agriculture sector hasbeen, and is still, undergoing significantmodernisation. Similarly, the manufacturingsector is experiencing rapid technical develop-ment. To an extent that the continuation of suchprogress is almost certain, the basic projection(a) somewhat overstates the investment require-ments in the target year.
Terms of Trade
Assumptions made about the terms of tradeare likely to affect significantly the result of anyprojection, thus it appears desirable to gain someindication of the effects of alternative assump-tions on the levels of overseas prices for WestMalaysian exports and imports.
The results relating to projections in whichthe terms of trade assumptions are 10 percentand 20 percent rise in either export or importprices are presented in Table 3.
If during the projection period export priceswere to increase while import prices remainedunaltered, any given level of consumption maybe supported by a smaller volume of exports,and it is from this viewpoint that the impact ofhigher export prices are analysed. In basic pro-jection (c), exports are roughly equal to imports.The increase in export prices in projections (a)and (b) allows the volume of exports to bereduced while preserving the same consumptionlevel. This is because the lower volume of requir-ed exports results in lower capital formationrequirements, which in turn lowers the volumeof imports necessary to support investment.
In addition, in both projections (a) and (b)the decline in exports is greater than the fall in
imports. In projection (a) exports decrease by 23percent compared with the base projectionwhereas imports fall by only 9 percent. Thus, theoverall effect of the rise in the terms of trade is toreduce the strain to which the economy issubjected in reaching a given level of consump-tion in the target year.
A fall in the terms of trade would affect theeconomy as much as an increase, but in theopposite direction. Thus, a 10 percent rise inimport prices as in projection (d) raises therequired margin of exports over imports to$1,299 mn whereas a 20 percent increase inimport prices as in projection (e) raises themargin to $2,790 mn.
The results also indicate that as importprices rise, the attainment of a given level ofconsumption will require a substantially greatervolume of imports. For instance, when importprices rise by 10 percent, as in projection (d), thetarget year imports (in 1970 prices), rise by $769mn compared with the import requirements of$12,747 mn given by the basic projection (a).This is equivalent to an increase of 6 percent inthe volume of imports. In comparison, with a 20percent increase in import prices as given inprojection (e) the volume of imports is 14 percenthigher than the basic projection. Thisphenomenon, which is brought about by thehigher current and capital import requirementsof increased export production coupled withgreater required margin in constant prices ofexports over imports, puts a severe strain on theeconomy in a situation of rising import prices.
The effects of changes in external pricesmay also be observed in the changes which occurin the proportionate share of GDP representedby the unchanged level of consumption. In basicprojection (c) consumption accounts for 72.73percent of GDP, but when exports prices rise by20 percent, the consumption/GDP ratio rises to79.76 percent. On the other hand, a 10 percentincrease in import prices reduces the consump-tion proportion to 67.75 percent while a 20 per-cent rise in import prices pushes the consump-tion share down to 63.31 percent of GDP.
28 PERTANIKA VOL. 8 NO. 1, 1985
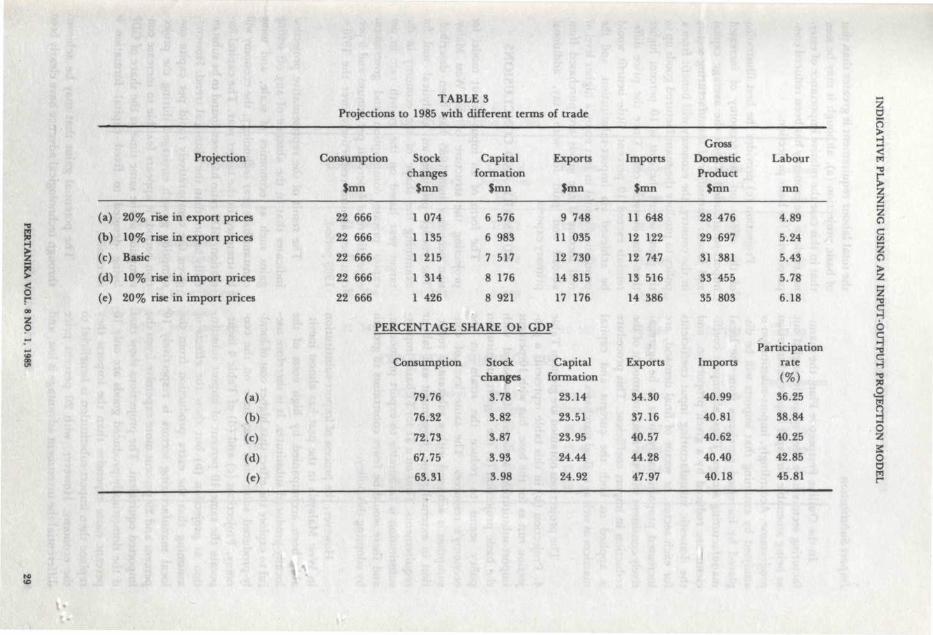
TABLE 3Projections to 1985 with different terms of trade
Projection
H
(a) 20% rise in export prices
(b) 10% rise in export prices
(c) Basic
(d) 10% rise in import prices
(e) 20% rise in import prices
(a)
(b)
(c)
(d)
(e)
Consumption
$mn
22 666
22 666
22 666
22 666
22 666
Stockchanges
$mn
1 074
1 135
1 215
1 314
1 426
Capitalformation
$mn
6 576
6 983
7 517
8 176
8 921
PERCENTAGE SHARE Ot
Consumption
79.76
76.32
72.73
67.75
63.31
Stockchanges
3.78
3.82
3.87
3.93
3.98
Exports
$mn
9 748
11 035
12 730
14 815
17 176
GDP
Capitalformation
23.14
23.51
23.95
24.44
24.92
Imports
(mn
11 648
12 122
12 747
13 516
14 386
Exports
34.30
37.16
40.57
44.28
47.97
GrossDomesticProduct
$mn
28 476
29 697
31 381
33 455
35 803
Imports
40.99
40.81
40.62
40.40
40.18
Labour
mn
4.89
5.24
5.43
5.78
6.18
Participationrate<%)
36.25
38.84
40.25
42.85
45.81
1w
sIsI
Io
O
I
ABDUL AZIZ ABDUL RAHMAN
Import Substitution
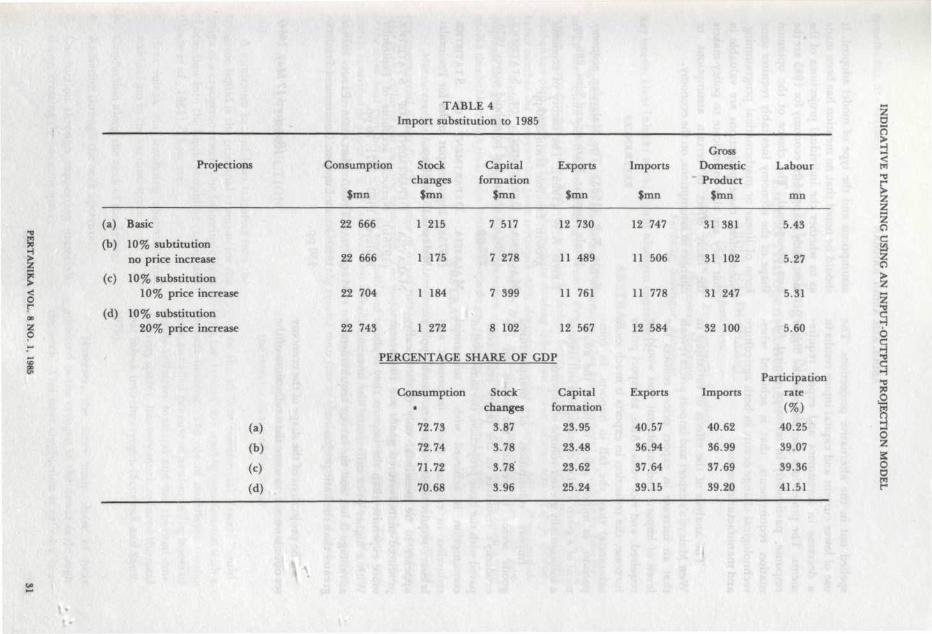
In the Outline Perspective Plan, the manu-facturing sectors have been specially singled outas being amenable for rapid import-substitutionprogramme. Accordingly, import-substitution isanalysed by assuming that imports will be dis-placed by increased purchases from the localmanufacturing sectors. Thus, all import coeffi-cients are reduced by a given proportion, andthe domestic manufacturing input coefficientsfor each sector, or vector of final demand, areincreased proportionately so as to be aggrega-tively consistent with the absolute amount of thereduction in import coefficient. This procedureis applied to both the current and capitalmatrices as well as to final purchases.
The projections obtained are given in Table4. Projection (b) in this table represents a pro-jection run as for the base, but with 10 percentimport-substitution assumed. Compared withthe basic projection (a) the import-substitutionpolicy seems to reduce the strain on theeconomy's resources. The same level of con-sumption is achieved with a substantial reduc-tion in external trade, investment and labourrequirements. Thus on a $1 for $1 basis, import-substitution is favourable to export promotion,and there would be fewer constraints to growthby adopting this policy.
However, the process of import-substitutionin West Malaysia in the past has almost inevit-ably been accompanied by high costs of thelocally-produced substitutes. It is therefore use-ful to explore the effect that higher cost of local-ly-produced substitutes may have on the eco-nomy. Projections (c) and (d) of Table 4 incor-porate the same 10 percent of import substitu-tion as projection (b) but show the effects ofassuming that the extra production from thelocal manufacturing sectors is respectively 10percent and 20 percent more expensive from theimported equivalent. The projections show thatif the domestically-produced goods are only 10percent more expensive than the imports theyreplace then import-substitution is beneficial tothe economy. However, with 20 percent pricedifferential the investment advantage is lost, and
the total labour requirement is greater than thatof basic projection (a), although it may be seenthat in this case the relative importance of exter-nal trade in the economy has been reduced com-pared with the basic projection.
Projection (c) provides the best illustrationof the effects on the economy of increasedimport-substitution. Given the average capitaland labour intensities of manufacturing sectorsin the country, the economy will benefit from apolicy to produce the manufactured goods up tothe point where the cost is 10 percent higherthan the overseas cost. Once the price diffe-rentials exceed 10 percent, little benefit wouldbe achieved via import-substitution, and thepopulation would in fact enjoy a higher level ofreal income if the goods are purchased fromabroad and paid for with, say, additionalprimary exports.
SUMMARY AND CONCLUSIONS
The form of an input-output model forprojecting the structure of the West Malay-sian economy into 1985 has been described.The model provides an analytical tool forexamining the shape of the economy in thetarget year based on the growth rate in percapita private consumption and governmentexpenditure of 4 percent per annum and 9 per-cent per annum respectively over the 1970-1985 period.
The result of the representative projectionindicates that iq the absence of any off-settinggains such as economies of scale, and usingconstant base year technology, the economy willbe stretched in the target year. The capital for-mation/GDP ratio has been found to be substan-tially higher than the historical trend. However,given the comparatively rapid per capita con-sumption growth envisaged during the projec-tion period, it appears feasible to increase con-sumption at the same time as the share of GDPbeing devoted to fixed capital formation isincreased.
The potential gains that may be achievedthrough technological advance have clearly been
30 PERTANIKA VOL. 8 NO. 1, 1985
o
o
Projections
(a) Basic
(b) 10% subtitutionno price increase
(c) 10% substitution10% price increase
(d) 10% substitution20% price increase
(a)
(b)
(c)
(d)
TABLE 4Import substitution to 1985
Consumption
$mn
Stockchanges
fmn
Capitalformation
$mn
Exports Imports
fmn
GrossDomesticProduct
$mn
22 666
22 666
22 704
1 215
1 175
1 184
7 517
7 278
7 399
12 730
11 489
11 761
22 743 1 272 8 102 12 567
PERCENTAGE SHARE OF GDP
Consumptiong
72.73
72.74
71.72
70.68
Stockchanges
3.87
3.78
3.78
3.96
Capitalformation
23.95
23.48
23.62
25.24
12 747
11 506
11 778
12 584
Exports
40.57
36.94
37.64
39.15
31 381
31 102
31 247
32 100
Labour
5.43
5.27
5.31
5.60
ParticipationImports rate
40.62
36.99
37.69
39.20
40.25
39.07
39.36
41.51
an
ai
6
O
OD
ABDUL AZIZ ABDUL RAHMAN
spelled out in the alternative projections. Theuse of lower current and capital inputs results ina decrease in investment and export require-ments. The projections also indicate the biggerresponse, particularly in terms of capital for-mation requirements, that is achieved whenTechnological change occurs in both agricultureand manufacturing sectors.
The analysis of the effects of variations inWest Malaysia's export and import prices revealsthat an increase in export prices reduces thelevels of imports and investment that would berequired, and vice versa. Also, as export pricesincrease, the reduction in exports is much moresubstantial than the fall in imports. In com-parison, as import prices increase, the attain-ment of a given level of consumption will requirea substantially greater volume of imports.
Import substitution of manufacturedgoods seems to reduce the strain on theeconomy's resources in the target year; com-pared with the basic projection, the same level ofconsumption is achieved with a substantialreduction in external trade, investment andlabour requirements. However, such policyappears to be beneficial only if the locally-produced manufactured goods are 10 percentmore expensive than the imports they replace.With a higher price differential the investmentadvantage is lost and the labour requirement isgreater than the basic projection.
The projections of the shape of the economyset out above are no more than reflections of the
assumptions and the type of model adopted. Itshould be noted that no mention has been madeas to whether the individual projections of themost likely shape of the economy for 1985 are thebest or optimal. The choice of the optimumshape of the economy inevitably requires someform of linear or mathematical programming.Nonetheless, these projections are valuable inthat they are able to indicate to policy-makersthe likely effect of certain assumptions, orchanges in assumptions, on the economy.
REFERENCES
KHOR, K.P. (1983): The Malaysian economy.Kuala Lumpur. Marican and Sons. 286. pp.
LEWIS, A.W. (1955): The theory of economicgrowth. London: Irwin. 240 pp.
M ALAYSIA. D EPARTMENT OF S TATISTICS.(1984): Labour and household survey 1970.292 pp.
M ALAYSIA. D EPARTMENT OF S TATISTICS.(1975a): Input-output tables for PeninsularMalaysia 1970. 30 pp.
M ALAYSIA. DEPARTMENT OF S TATISTICS.(1975b): National accounts of PeninsularMalaysia 1960-1971. 76 pp.
MALAYSIA. THIRD MALAYSIA PLAN 1976-
1980: Kuala Lumpur. Government Printers,430 pp.
(Received 17 May, 1984)
32 PERTANIKA VOL. 8 NO. 1, T9S5