Embed Size (px)
Citation preview
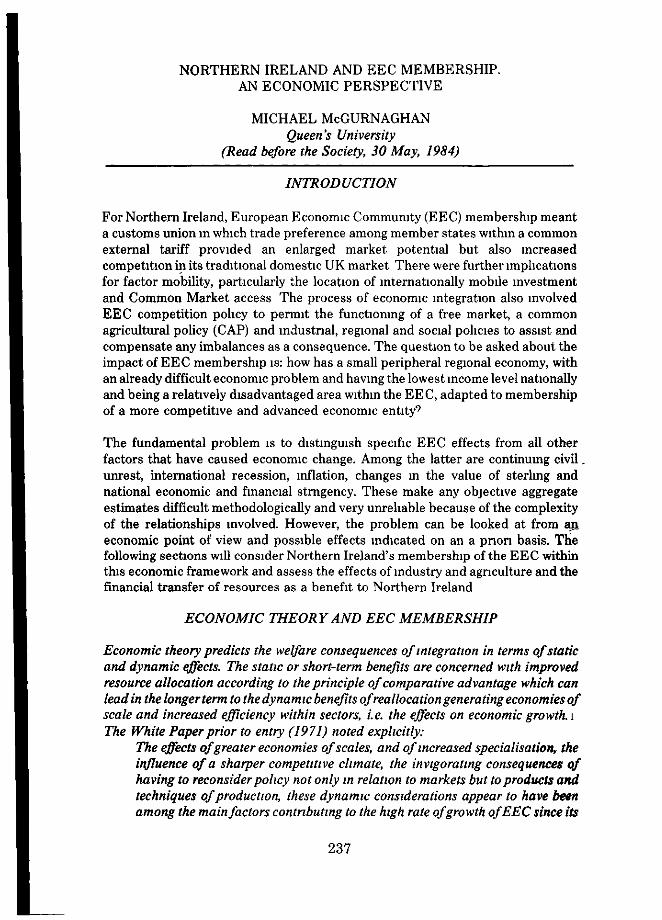
NORTHERN IRELAND AND EEC MEMBERSHIP.AN ECONOMIC PERSPECTIVE
MICHAEL McGURNAGHANQueen's University
(Read before the Society, 30 May, 1984)
INTRODUCTION
For Northern Ireland, European Economic Community (EEC) membership meanta customs union in which trade preference among member states within a commonexternal tariff provided an enlarged market potential but also increasedcompetition in its traditional domestic UK market There were further implicationsfor factor mobility, particularly the location of internationally mobile investmentand Common Market access The process of economic integration also involvedEEC competition policy to permit the functioning of a free market, a commonagricultural policy (CAP) and industrial, regional and social policies to assist andcompensate any imbalances as a consequence. The question to be asked about theimpact of EEC membership is: how has a small peripheral regional economy, withan already difficult economic problem and having the lowest income level nationallyand being a relatively disadvantaged area within the EEC, adapted to membershipof a more competitive and advanced economic entity9
The fundamental problem is to distinguish specific EEC effects from all otherfactors that have caused economic change. Among the latter are continuing civil.unrest, international recession, inflation, changes in the value of sterling andnational economic and financial strngency. These make any objective aggregateestimates difficult methodologically and very unreliable because of the complexityof the relationships involved. However, the problem can be looked at from aneconomic point of view and possible effects indicated on an a priori basis. Thefollowing sections will consider Northern Ireland's membership of the EEC withinthis economic framework and assess the effects of industry and agriculture and thefinancial transfer of resources as a benefit to Northern Ireland
ECONOMIC THEORY AND EEC MEMBERSHIP
Economic theory predicts the welfare consequences of integration in terms of staticand dynamic effects. The static or short-term benefits are concerned with improvedresource allocation according to the principle of comparative advantage which canleadin thelongerterm to the dynamic benefits of reallocation generating economies ofscale and increased efficiency within sectors, i.e. the effects on economic growth. 1The White Paper prior to entry (1971) noted explicitly:
The effects of greater economies of scales, and of increased specialisation, theinfluence of a sharper competitive climate, the invigorating consequences ofhaving to reconsider policy not only in relation to markets but to products andtechniques of production, these dynamic considerations appear to have beenamong the main factors contributing to the high rate of growth of EEC since its
237

inception. They could also be important influences on industry in Northern
Ireland. 2
In other words, to the extent that higher productivity and changes in industrialstructure may occur as a result of increased competition and an enlarged market (the"cold shower* effect) giving rise to a more rapid rate of innovation, then a sustainedincrease in the rate of growth can be expected.
Theoretically, integration is supposed to bring convergence of member states'economies. But it has been conceded that it will, in most cases, increase regionalimbalance with negative effects on employment and income levels.3 Hence the need
for regional ana allied policies, although it must be recognised that regionaluncompetiveness may be a result of other factors such as relatively high wage levels,the absence of a bouyant market, demand shifts or national policies.
The economic benefits and costs of joining a customs* union are seen in the distinctionbetween trade creation and trade diversion. Trade creation involves a shift to freertrade by replacing domestic products with cheaper imports from another member;trade diversion is the cost of switching imports from the cheapest (world) sourcesupply to a higher cost member. Apart from agriculture, the tariff effects are not veryrelevant to Northern Ireland. Trade is tied closely to the United Kingdom marketwhere the majority of the province's manufacturing products are sold.\Despite datadeficiencies, it may be assumed that trade between Northern Ireland and GreatBritain has been generally unaffected by EEC membership.
The CAP has trade diversion costs due to the differential between food importers toproducers. While the redistributive effects of CAP are a United Kingdom budgetaryissue, the economic (other than budgetary) effects will be considered with financialtransfers later. Thus the static-type tariff effects can be largely ignored. More directlyhave been the implications for employment, structural change and economic growth.
INDUSTRY; EMPLOYMENT, PRODUCTIVITY AND GROWTH
EEC membership has coincided with a period of severe industrial decline in theregional economy. Unemployment which was 36,841 in January 1973 ataccessionisnow 120,597 (May, 1984), or 21.6 per cent of the workforce. While it is not valid toattribute these parallel events to any significant extent to EEC membership thereare certain aspects where the EEC dimension has been relevant to employment.
A constant theme of regional industrial development strategy has been theattraction of inward foreign investment to reduce unemployment. Against abackground of contraction in manufacturing employment, the contribution ofexternally-owned companies has been a consistent share of about 30 per cent ofmanufacturing employment, providing 27 per cent of total investment in productionindustries in 1980 (Table 1). There was concern that there would have been a loss ofpotential capital inflows to locations in other areas of the EEC. In the event, surveyevidence on corporate strategies would suggest that Northern Ireland's position in
238
relation to investment incentives both nationally and within the rules of EEC hasbeen competitive.5 Job promotions from overseas more likely have been affected bypolitical uncertainty and recession than EEC membership.
More visible have been the operation of two contrasting sets of EEC policies. On thenegative side, a combination of competition policy restraining the use of state aidsand industrial policy has affected employment in the man-made fibres, textiles andshipbuilding industries. While the EEC has recognised and generally accepted thespecial regional aid incentives to attract industry to the province, regulations forrationalisation and production capacity reduction in response to changing patternsof competition on world markets and national protectionist pressures have meantredundancies. However, a sympathetic interpretation of the rules on sectoral aids,e.g. shipbuilding, has mitigated the full effects of external competitiveness (at timesunfair) locally. Indeed, given the generous state aids throughout the 1970s and1980s it could be argued that EEC competition and industrial policy has not hadany real effect.
The main mechanism for supporting employment has been the European RegionalDevelopment Fund (ERDF) designed to the objective of economic convergence. In *a recent analysis of the impact of the ERDF on investment and jobs over the period1975-1982, it was estimated that the number of jobs created/maintained inNorthern Ireland with state and ERDF aid was consistent with 2,000-3,000 jobs perannum.6 In assessing the performance of ERDF alone the results were lessoptimistic. The ERDF element in job creation/maintenance was assessed to besmall and only then assuming the operation of the principle of additionally of EECfunds. Realistically, to the extent that job losses have continued it must beconcluded that EEC (and national) measures have been inadequate with nosignificant impact on employment. More revealing was the conclusion: "the impacton manufacturing has not been to stimulate new, expanding, future growthindustries (in employment terms)".
Economic theory sees growth of output relative to productivity growth as crucial foremployment growth. The White Paper (1971) had hoped that the competitivenessfor the local economy and hence economic advance would be determined within theEEC by exploiting the technology of new production processes and new or moresophisticated (higher technology) prodcts. The former improves productivity, thelatter is reflected in sectoral switches in production and combined they producestructural change and are the principal source of long-term growth. Start-upbarriers to exploiting economies of scale exist for the smaller indigenous companieswhich larger mostly overseas companies with their linkages and stronger financialbacking could overcome. However, the Northern Ireland Economic Council foundthat there had been little expenditure on research and development located inNorthern Ireland, although it may have been undertaken elsewhere, i Theproductivity performance since 1973 has been disappointing.
239

Table 1. Employment in NI Manufacturing Industry by source of location
Jobs promoted in 6 ^ ^companies new to NI . •
EMPLOYMENT infirms from outside NI1 20,764 (11 5) 51,345 (28 9) 53,542 (32 3) 41,744 (29 4) 35.777 (30 2) n a
EMPLOYMENT inindigenous firms1 106,518 (88 5) 126,136 (71 1) 112,282 (67 7) 100,206 (70 6) 82,673 (69 8) n.a
Total manufacturingemployment 181,282 (100 0) 177,481 (100 0) 165,734 (100 0) 141,950 (100 0) 118,450 (100 0) 106,500
NI total employees , 'm employment in 449,285 ,486,229 481,111 519,100 485,900 473,500all industries , .
1. since 1947
Capital expenditure by foreign firms as a percentage ofNI GDFCF inProduction Industries (Classes 11-49, SIC (80))
Prom US
Prom EC
Other
Total
1960
5 4
0 4
0 5
. 6 3
19 70
8 8
16 4
0 2
25 4
1973
• 14 4
8 1
0.6
23 1
1974
5 8
0 8
13 9
1975
7 0
0 2
13 7
1976
3 5
0.9
9 4
1977
8 6
3 2
0 7
12 5
1 1978
9 2
4 5
0 6
14 3
1979
13.3
4 5
' 0 7
18 5
1980
18 2
7 1
1 9i
27 2
Source DED (NI), IDB for NI
Table 2: Average Annual Growth Rates of Output, Employment and ProductivityNORTHERN REPUBLIC OFIRELAND IRELAND
1965-73 1973-83 1965-73 1973-83
All SectorsOutputEmploymentProductivity
Industrial Sector 1OutputEmploymentProductivity
Agricultural SectorOutputEmploymentProductivity
4 60.14.5
3 5-0 64 1
1 9-2 847
0 4-0.20 6
-3.9-4.607
-2 2-0 9-1 \\
4.3-0.14.4
5.81 147
2 0-3 35 3
2.10.71.4
4.10.33.8
2 0-3 25 2
1 The annual growth rates foi NI lefei to the Manufacturing sector
240
Surce: DFP (NI); Northern Ireland Annual Abstract of Statistics; DMS gazette.National Income and Expenditure, CSO, Dublin; Economic Review and Outlook,Department of Finance, Dublin.
Although the productivity performance has detiorated since 1973 (Table 2), thetrends must be evaluated circumspectly as productivity declines have occurred inmost countries of the EEC including the United Kingdom largely as a result of a fall
in world demand (trade)s Therefore, there is no reason to believe that EECmembership has been responsible for this outcome It may be noted, however thatwhereas Northern Ireland and the Republic of Ireland had a fairly similar pattern ofperformance 1965-1973, the productivity and growth rates in industry andagriculture respectively have diverged since 1973
More critical is evidence of a more technologically orientated change in industrialstructure. A proposed test of the capacity to adapt and innovate, is trends in the ratio ofNACE 3 to NACE 4 industries (EEC classification, equivalent to SIC (80) Divisions 3and 4). This regional manufacturing index was used in a recent analysis of locationalinfluences on EEC regional development.9 The study takes NACE 3 industries asincorporating the majority of the EEC's newer, more technologically-advanced andresearch-intensive industries. (In the UK they accounted for about 80 per cent of allpublic and private expenditure on, and employment in, research and development onnew products and technology.) Division 4 industries are taken as combining the olderless advanced, skilled or semi-skilled labour intensive sectors. It should be pointed out,however, that the composition of these respective groupings may not be an idealindicator of the propensity to innovate Nevertheless, the test does allow an ECCcomparison. The results for employment are shown in Table 3 (a). A high ratio relative tothe EE C average value indicates a bias towards the advanced, a low ratio a bias towardsthe less advanced industries. For the Northern periphery which includes NorthernIreland the relative dependence has diminished. (Northern Region, Scotland and theRepublic of Ireland achieved some reorientation possibility as a result of governmentpolicies.) In the case of Northern Ireland, taking SIC (80) Division 3/Division 4employment totals, there is a consistent but proportionately greater dependence on thelatter industries (Table 3(b)). When investment is considered which is a more reliableindicator of how quickly the relative industries are adopting new technology, there was asignificant decline in the ratio between 1975 and 1980.
The disparities in regional manufacturing structures would tend to support thepredictions of the filter-down hypothesis applied to the EEC 10. In a period ofintense international competitiveness and technological change, industries whichare most vulnerable to competition from non-EEC producers are located in theperipheral regions. Ceteris paribus, this process can only aggravate futureprospects for Northern Ireland. On the basis of the above analysis, therefore, thereis no apparent evidence of the expected dynamic effects being realised in theprovince. This is not to say that economic performance might have been anydifferent in the event of non-EEC membership; at least, it has helped to identifywhat needs to be done.
241

Table 3: Regional Trends in Manufacturing Structure
(a) EC: NACE 3/4 ratios (employment)
Mean
1973 1979Central Regions (35) 1.131 1.264Intermediate Regions (39) 1.040 1.192Peripheral Regions (29) 0.599 0.567of which Northern Regionsi (6) 0.859 0.967
Total EEC Regions (103) 0.947 1.041
1. Northern Ireland, Scotland, Wales, Northern Region, Republic of Ireland, partsof Denmark.Source: Centrality, Peripherality and EEC Regional Development (Keeble, Owensand Thompson, 1981).
(b) NI SIC (80) DIVISION 3/4 ratios2
Employ-mentInvest-ment
1970
0 49i
0.41
1973
0.50
0.38
1974
0.52
0.43
1975
0.61
0.59
1976
0.52
0.44
1977
0.52
0.42
1978
0.50
0.34
1979
0.49
0.28
1980
0.52
0.22
1981
0.57
n/a
1982
0.54
n/a
1983
0.53
n/a
1984
0.51
n/a
2. SIC (80) DIVISION 3 - metal goods, mechanical, electrical, and instrumentengineering, aerospace.SIC (80) DIVISION 4 - textiles, clothing, footwear, food, drink, and tobacco,furniture, paper and printing, other.3. AdjustedSource: DFP (NI), DED (NI).
REGIONAL INCOME
In the absence of any observed benefits, the ERDF was designed to contribute to areduction in economic disparities by transferring resources from the richer to thepoorer areas within the EEC. As Table 4 shows, there has been no compensatingimprovement in regional income distribution. Indeed, the divergence of theprovince's standard of living from the EEC average has widened since 1973. Thepreferred indicator of gross value added at market prices per capita in purchasingpower standards measures the generation of income and thus allows comparisons ofrelative growth trends in the respective regions. While recognising the limitations ofsimple partial correlation analysis, Northern Ireland's performance vis-a-vis the
242

Table 4 Gross Value Added at Market Prices per Head (in Purchasing Power Standards) (EUROPE 10-100), 1970-1980
CO
EUR 10
W Germany
France
Italy
Netherlands
Belguim
Luxembourg
Denmark
Greece
United Kingdom
N Ireland
Republic of Ireland
1970
100
116
101
91
102*
102
140
107
46
100*
-
58
1971
100
116
102
90
102*
101
129
'105
48
100*
80*
58
1972
100
115
104
89
101*
103
131
107
51
98*
76*
59
1973
100
115
104
89
101*
103
142
106
52
99*
79*
58
1974
100
114
105
91
103*
305
152
106
50
96*
69*
60
1975
100
114
107
88
102
105
123
105
53
99
73
62
1976
100
115
106
88
102
104
123
106
53
98
71
59
1977
100
116
107
87
/ 106
102
116
105
52
97
68
60
*1978
100
116
107
87
105
102
118
102
53
97
70
61
1979
100
117
107
88
104
102
120
101
53
95
6S
60
1980
100
118
107
91
103
104
118
100
53
92
61
60
Note 1 The difference between gross domestic product and gross value added at market pricescovers taxes linked to imports and VAT on products Data for Denmark and Greece atfactor cost.
Note 2 An asterisk signifies a Eurostat estimation. A slash signifies a break in the series.
Source Courtesy of the Statistical Office of the European Communities

Table 5 Gross Value Added at Market Prices Per Head (In Purchasing Power Standards (EUR 10 = 100), 1970-1980
Partial Correlation Matrix
Northern
Yui kshire &Huraberside
HastMidlands
£i st Anglia
South East
South West
WestMidlands
North West
Wales
Scotland
NorthernIreland
UnitedKingdom
Republic ofIreland
(N)
(YH)
(EM)
(EA)
(SE)
(SW)
(WM)
(NW)
(W)
(S)
(NI)
(UK)
(R of I)
N
1.0
0.705
-0.071
0.209
-0.121
0.628
0.195
0.226
0.549
0.720
-0.076
0.244
0.512
YH
1.0
0.563
0.571
0.522
0.881
0.761
0.668
0.558
0.900
0.489
0.753
0.210
EM
1.0
0.646
0.970
0.376
0.894
0.897
0.271
0.545
0.952
0.892
-0.422
EA
1.0
0.567
0.436
0.629
0.757
0.200
0.651
0.684
0.704
-0.460
SE
1.0
0.340
0.873
0.841
0.367
0.541
0.967
0.911
-0.461
SW
1.0
0.695
0.406
0.405
0.744
0.289
0.513
0.244
WM
1.0
0.860
0.357
0.693
0.847
0.873
-0.244
NW
1.0
0.321
0.686
0.890
0.894
-0.349
1
0
0
0
-0
W
.0
.783
.367
.600
.013
1
0
0
0
S
.0
.582
.817
.000
NI UK R of I
1.0
0.921 1.0
-0.524 -0.293 1.0
Source: Same as Table 4

rest of the United Kingdom and the Republic of Ireland can be seen in Table 5. Boththe United Kingdom and South East are declining relative to the EEC average andNorthern Ireland is following this trend. The Development Regions not declining tothe same extent as Northern Ireland are Northern especially, and to a much lessdegree South West, Wales and Scotland. North West has declined in similar fashionto Northern Ireland although not quite severely. Compared to Northern Ireland, theRepublic of Ireland is a (slowly) growing region but still much below the EECaverage. Part of the explanation for the Republic of Ireland's performance may be asa result of the relative internationally high percentage share of exports of hightechnology products in its total exports of manufactured goods, influenced by hightechnological investment from abroad n
In conclusion, there are serious implications for the evaluation of national and EECregional policies. If Northern Ireland is to maintain and increase output and growthwithin the EEC, even if there is not a proportionately greater number of new jobs,and converge to the comparative prosperity of the central regions, there must be amore radical shift in the focus of traditional regional policies.
COMMON AGRICULTURAL POLICY
The main benefit of CAP in Northern Ireland was perceived to be guaranteed higherprices for commodities such as dairy produce and fat cattle which had thecomparative advantage of a predominantly grass-based natural resourceendowment. Small farm size structure and climatic environment disadvantaged anysignificant cereal production and meant that intensive livestock industries weredependent on imported inputs at present higher EEC prices. (Cereal prices inNorthern Ireland, as a deficit area, tend to be higher than in Great Britain.)Consequently, there has been increasing specialisation in grass-based livestockproduction with the beef and milk sectors in particular increasing their share of farmoutput from 41.5 per cent to just over 60 per cent in 1984 while intensive livestockproduction has declined proportionately (Table 6). Productivity in the agriculturalsector has declined overall since 1973, but revenue and structural aids have meantincreased efficiency in certain sectors, e.g. dairying.
Net farm incomes benefited generally up to 1979 (Table 7), although negativeMCAs as a result of a lagged UK adjustment of '£ green' rate to market exchangerates moderated price increases. Since 1979 net farm incomes, both nominal and inreal terms, have declined sharply despite a '£ green' devaluation in conjunction withsterling appreciation, providing positive MCAs giving higher output prices.
Currently, the agricultural industry in Norhtern Ireland is facing uncertainty. Withgrowing EEC overproduction of dairy products and increasing budgetary costs ofsurplus disposal, Northern Ireland (producing only one per cent of total EEC milkoutput) has been affected with increasing severity by the subsequent mechanisms ofrestraint. Since 1981, a producers' co-responsibility levy has imposed a tax on totalmilk production and, from 1984, a supplementary co-responsibility or super-levywill impose a quota with a levy on production in excess of the basic quantity
245
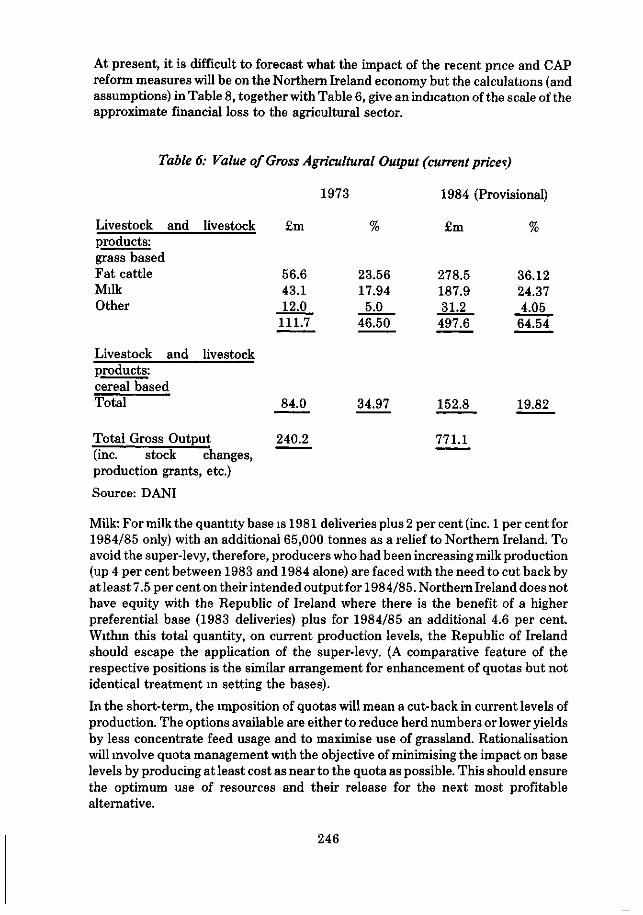
At present, it is difficult to forecast what the impact of the recent price and CAPreform measures will be on the Northern Ireland economy but the calculations (andassumptions) in Table 8, together with Table 6, give an indication of the scale of theapproximate financial loss to the agricultural sector.
Table 6: Value of Gross Agricultural Output (current price?)
1973 1984 (Provisional)
Livestock and livestock £m % £m %products:grass basedFat cattleMilkOther
Livestock and livestock
56.643.112.0
111.7
23.5617.94
5.046.50
278.5187.931.2
497.6
36.1224.374.0564.54
products:cereal basedTotal 84.0 34.97 152.8 19.82
Total Gross Output 240.2 771.1(inc. stock changes,production grants, etc.)
Source: DANI
Milk: For milk the quantity base is 1981 deliveries plus 2 per cent (inc. 1 per cent for1984/85 only) with an additional 65,000 tonnes as a relief to Northern Ireland. Toavoid the super-levy, therefore, producers who had been increasing milk production(up 4 per cent between 1983 and 1984 alone) are faced with the need to cut back byat least 7.5 per cent on their intended output for 1984/85. Northern Ireland does nothave equity with the Republic of Ireland where there is the benefit of a higherpreferential base (1983 deliveries) plus for 1984/85 an additional 4.6 per cent.Withm this total quantity, on current production levels, the Republic of Irelandshould escape the application of the super-levy. (A comparative feature of therespective positions is the similar arrangement for enhancement of quotas but notidentical treatment in setting the bases).
In the short-term, the imposition of quotas will mean a cut-back in current levels ofproduction. The options available are either to reduce herd numbers or lower yieldsby less concentrate feed usage and to maximise use of grassland. Rationalisationwill involve quota management with the objective of minimising the impact on baselevels by producing at least cost as near to the quota as possible. This should ensurethe optimum use of resources and their release for the next most profitablealternative.
246

to
Table 7: Indices of Net Farm Income 1973/74 to 1982/83Type of farmingOld Classi f icat ionTOG &Ad*s and over
Type of Farrrlng1973/74 1974/75 1975/76 1976/77 J977/70 We* Classi f icat ion
4 - 39.9 ESU»s <2)1977/78 1978^/9 I979/B0 1980/81 1981/62 I9S2/B3
AT CURRENT PRICES 1977/78 » 100
Dairying
Dairying with Pigs APou1tpvCatt le ana Sheep
Cat t lo , She«p and Pigs
Nixed
Pigs and Poultry
A l l Types
3923306361
40
41
3 1
23
21
46
45
31
34
79
62
87
147
132
69
91
95
71
117
140
* 162
77
110
100
100
100
100
100
100
100
Specialist Dairying
Mainly Dt l ry i ng
LFA Beef Catt le and Sheep
Non-LFA Beef Catt le and Sheep
Non-LFA Cropping, Catt le I Sheep(4)
Mixed Livestock
P Igs and PoultryCropping
A l l Types
100
100
100
100
100
«00
100100
100
we112
149
155
15/
116
109208
132
52
23
34
-39
30
9
5577
35
70
21
29
19
68
16
685
41
131
62
106
104
279
38
14240
102
198
71
94
114
335
45
13146
129
ADJUSTED TO REAL TERMS 1977/78 • 100 (3)
Dairying
"TaVfry1*" P'9S lCatt le and Sheep
Cat t le , Sheep and Pigs
Mixed
Pigs and Poultry
A l l Types
754457
124118
76
80
51
38
34
76
74
50
55
104
82
115
196
175
92
120
109
81
134
161
186
88
127
100
100
100
100
100
100
100
Special ist Dairying
Mainly Dairying
LFA Beef Cat t le anc Sheep
Non-LFA Beef Catt le and Sheep
Non-LFA Cropping, Catt le I Sheep(4)
Mixed
Pigs and Poultry
Cropping
A l l Types
100
100
100
100
100
100
100
100
too
1 18 .
104
1 38
143
145
107
100
192
122
42
19
27
-31
24
7
44
62
28
48
14
20
13
47
11
47
3
28
81
38
65
64
172
23
87
24
63
fi I 3
40
54
65
192
26
75
26
74
NOTES: <1) Net Farm income Is ca lcu la ted ( I ) excluding Broedlng Livestock Apprec ia t ion and ( I I ) a f t e r depreciat ion based on h i s t o r i c cost undar the o l dtypology used up to 1977/78, but based on replacement cost under t he new typology used frcm 1977/78.
(2) 4 - 15.9 ESU for LFA and Non-LFA Beef Ca t t l e and Sheep farm types.(3) Def la ted using the Reta i l P r i ce Index.(4) Since 1981/82 Index may be unreliable
Source DANI

As Table 7 shows, dairy farmers have maintained net farm incomes in real termscompared with other sectors in agriculture. However, the combined effects ofincreasing costs, declining milk prices and quotas on production, must result in adecrease in income. One current estimate has put the decline in dairy farm incomes,relative to 1983/84, at 41 per cent unless remedial measures are taken to reducecosts or expand other enterprises. 12. In the longer-term, therefore, the problem willbe to maintain profitability under a quota regime when there is a lack of alternativeenterprises to grass-based production (unlike continental farmers).
Table 8:1984/85 EEC agricultural price and CAP reform measuresMilk
Super-levy (based on fore-cast 1984/85 productionlevels had there been noquota)
Reduction in calf premium
Increase in co-responsibiltylevyAlternation in interventionprices
Net Loss(£m) 111.10
2.40
2.30
1.25
Beef Net Loss(£m) 2
Clawback of maximum 9:17VariablePremium on exportsoutside UK (16.25p/kg)
Reduction of 20% in UK 5.2!varibale premium limitLoss of positive UK mca's(previously 7.3p/kg)- On EC trade (ex UK), est. 3.9546% of total exports-On third co. trade, est. 15%of total exports
TOTAL
Reduction in calf premium
Increase in interventionprices
17.05 TOTAL
2.0020.94
1. allowing for savings in variable costs from cut-back in output.2. assuming average carcase weight - 300 kg, total number of animals certified forvariable premium - 470,000, exports outside UK - 40%
Source: Ulster Farmers' tJnion, Livestock Marketing Commission for NI.
Beef: the decisions of the 1984/85 price fixing and other CAP measures affect thebeef sector in a number of ways. First, the loss of income to producers mainly as aresult of the clawback on exports of beef and cattle on which the variable premiumhas been paid. In addition, because there is a highej proportion of Northern Ireland
248

clean cattle disposals exported out of the United Kingdom compared with GreatBritain (40 per cent: 10 per cent in 1983), the clawback could have the effect ofweighing the variable premium in favour of GB producers by reducing its maximumvalue in Northern Ireland. This would be contrary to past practice, where the beefsector's remoteness from the markets had been recognised pre-1973 throughheadage payments and, until 1981, by a special NI calculation under the variablepremium scheme.
Second, the abolition of MCAs and, to a lesser extent, clawback, could give apricing disadvantage to Northern Ireland meat plants compared to the Republic ofIreland by allowing the latter to quote higher prices. (In the period 1975-79,following the devaluation of 'IR£ green', the MCA advantage to the Republic ofIreland resulted in cattle smuggled from north to south.
The introduction of a Meat Industry Employment Scheme (MIES) enabled themeat processing industry to retain cattle and pigs for killing in Northern Ireland.Remtroduction of MIES is one means of remedying the situation Alternatively, thedisadvantage could be eliminated, to a large extent, if variable premium ceased to bepaid on UK meat imports from the Republic of Ireland, illogical in the circumstancesof clawback.
Third, there will be a weakening of the beef market with downward pressure onprices and producers' returns due to increasing supplies; the clawback discouragingexports, the removal of MCAs encouraging cheaper imports and extra culling ofcows due to the milk measures. Market support could be provided through moreeffective intervention facilities. ^
In its totality, the present measures mustxeduce farm incomes at a time when highunemployment and a decline in economic growth have limited the opportunities foralternative employment. Within the framework set by the CAP as it has related toNorthern Ireland over recent years there would appear to have been aninconsistency: the contradiction between a structural policy pursiung increasedproductivity, a pricing policy designed to reduce the resulting increased productionand a social policy aimed at providing "equivalent" farm incomes. While acceptingthe economic rationale of matching production and consumption, the presentemphasis on the instrument of budgetary control as tha mechanism forcontrolling surpluses will have a regressive effect on agricultural incomes and hencea multiplier effect throughout the whole regime economy.
FINANCIAL TRANSFERSIn principle, the effects of EEC membership (other than the qualitative effects) willbe indicated in the balance of payments flows into and out of Northern Ireland.These flows can be divided into financial flows and trade (goods and services) flows.The financial flows will be private capital inflows and outflows such as gains/lossesof potential outside investment (assumed to be unaffected due to EECmembership) and public (EEC) flows. As far as trade flows are concerned, thetraditional distinction is between trade creation and trade diversion. Apart from
249
agriculture, the trade effects can be ignored. (Section 2 above relates: in practice,major diversionary factors such as changes in relative exchange and inflation ratesmake it very difficult to isolate specific EEC membership effects.) The impact ofCAP on the balance of payments will be discussed later.
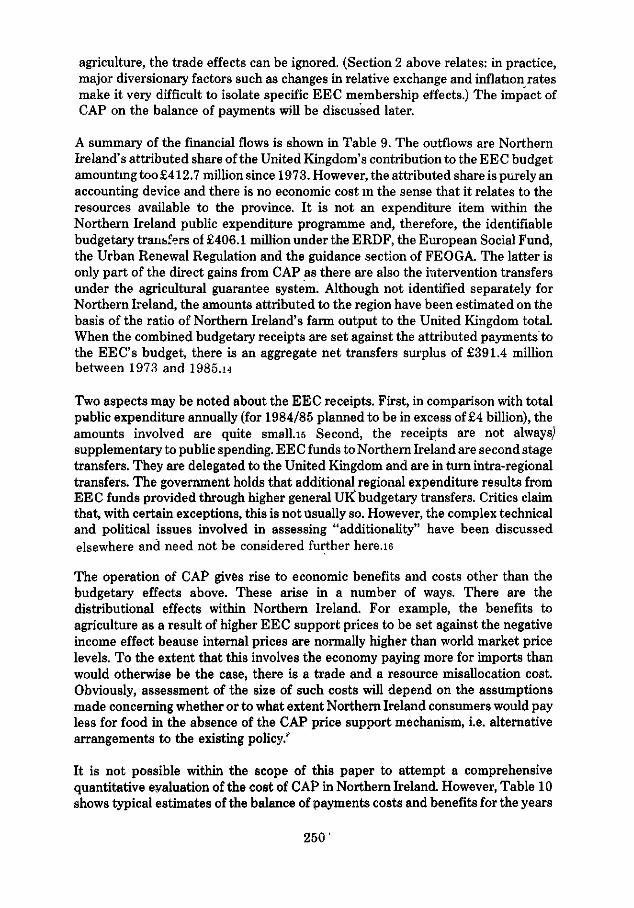
A summary of the financial flows is shown in Table 9. The outflows are NorthernIreland's attributed share of the United Kingdom's contribution to the EEC budgetamounting too £412.7 million since 1973. However, the attributed share is purely anaccounting device and there is no economic cost in the sense that it relates to theresources available to the province. It is not an expenditure item within theNorthern Ireland public expenditure programme and, therefore, the identifiablebudgetary transfers of £406.1 million under the ERDF, the European Social Fund,the Urban Renewal Regulation and the guidance section of FEOGA. The latter isonly part of the direct gains from CAP as there are also the intervention transfersunder the agricultural guarantee system. Although not identified separately forNorthern Ireland, the amounts attributed to the region have been estimated on thebasis of the ratio of Northern Ireland's farm output to the United Kingdom total.When the combined budgetary receipts are set against the attributed payments tothe EEC's budget, there is an aggregate net transfers surplus of £391.4 millionbetween 1973 and 1985.14
Two aspects may be noted about the EEC receipts. First, in comparison with totalpublic expenditure annually (for 1984/85 planned to be in excess of £4 billion), theamounts involved are quite small.is Second, the receipts are not alwaysjsupplementary to public spending. EEC funds to Northern Ireland are second stagetransfers. They are delegated to the United Kingdom and are in turn intra-regionaltransfers. The government holds that additional regional expenditure results fromEEC funds provided through higher general UK budgetary transfers. Critics claimthat, with certain exceptions, this is not Usually so. However, the complex technicaland political issues involved in assessing "additionally" have been discussedelsewhere and need not be considered further here.i6
The operation of CAP givfcs rise to economic benefits and costs other than thebudgetary effects above. These arise in a number of ways. There are thedistributional effects within Northern Ireland. For example, the benefits toagriculture as a result of higher EEC support prices to be set against the negativeincome effect beause internal prices are normally higher than world market pricelevels. To the extent that this involves the economy paying more for imports thanwould otherwise be the case, there is a trade and a resource misallocation cost.Obviously, assessment of the size of such costs will depend on the assumptionsmade concerning whether or to what extent Northern Ireland consumers would payless for food in the absence of the CAP price support mechanism, i.e. alternativearrangements to the existing policy/
It is not possible within the scope of this paper to attempt a comprehensivequantitative evaluation of the cost of CAP in Northern Ireland. However, Table 10shows typical estimates of the balance of payments costs and benefits for the years
250 (

Tdble 9: N I Attributed Contributions to and Receipts from EC Budget (£m)
Identifiable Receipts
to
1973/74
1974/75
1975/76
1976/77
1977/78
1978/79
1979/80
1980/81
1981/82
1982/83
1983/84
1984/85
Total
UKGross
Contribution
200
197
370
544
941
1323
1665
1900
2330
2820
3097
3353
18740
(1)NI
AttributedShare
1.0
5.6
7.9
12.7
16.0
23.9
28.1
28.2
50.3
65.2
83.3
90.5
412.7
NI as% of UK
-
(2.8)
(2.1)
(2.3)
(1.7)
(1.8)
(1.7)
(1.5)
(2.2)
(2.3)
(2.7)
(2.7)
(2.2)
(2)ERDF
-
-
2.8
7.2
6.3
4.0
16.0
21.0
16.4
18.0
13.5
16.5
121.7
(3)ESF
-
3.4
0.0
6.4
7.5
15.0
15.0
23.0
25.0
35.2
38.0
38.0
206.5
(4)FEOGAGuidance
-
0.3
0.2
0.3
1.3
2.5
3.2
3.3
4.7
6.8
11.3
14.9
48.8
(5)UrbanRenewalRegulation
14.9
14.2
29.1
(6)Total
(2+3+4+5)
-
3.0
13,9
15 J
21,5
34.2
47^3
46.1
60.0
77.7
83.6
406.1
As % of .Public
Expenditure(NI)3
-
(0.2)
(0.1)
(0.6)
(0.8)
(1.0)
(1.4)
(1.6)
(1.4)
(1.7)
(2.1)
(2.I)2
(7)FEOGA
Guarantee(Estimate)
5.1
11.9
18.7
10.3
15.8
20.6
22.1
37.0
37.1
63.4
77.3
78.7
398.0
(8)Total(6+7)
5.1
15.6
21.7
24.2
30.9
42.1
56.3
84.3
83.2
123.4
155.0
162.3
804.1
NetGain(8-1)
4.1
10.0
13.8
11.5
14.9
18.2
28.2
56.1
32.9
58.2
71.7
71.8
391.4
To February 1985 As % planned expenditure 1974/75 - 76/77, real prices; 1977/78 - 84/85, current prices.
Source. Cmnd C7O3, Cmnd 7436, Cmnd 7439; Cmnd 9143, Cmnd 9428; Northern Ireland Assembly Report on Additionality (NIA 46);J V Simpson (eel) (1984), DFP (NI).

1978 and 1979 IT The two elements making up the totals are associated with thetwo special features of CAP viz its common fmancing (net budgetary transfers toFEOGA) and EEC preference (food trade transfers). Hypothetically, assuming thefinancial cost of CAP is shared by Northern Ireland on the basis of its attributed-share to the EEC budget and adding on that proportion of attributed share notfinancing FEOGA (to avoid double counting), total outflows for 1978 and 1979could be indicated as circa £20.44 million and £25.78 million respectively (Table11). When these costs (excluding FEOGA transfers as before), the overall balance ofpayments would indicate a marginal net cost of EE C membership of £1.44 million in1978 and a net EEC benefit of £5.22 million in 1980. Of course, it cannotbe claimedthat such effects have actually been the out-turns. Nevertheless, on the basis of thispreliminary analysis it may be assumed that net financial transfers to NorthernIreland as a result ot EEC membership have not been of major importance.
Table 10: Estimated Balance of Payments Costs and Benefits arising from CAP
UnitedKingdomRep. of IrelandW GermanyFrance
TransfersthroughFEOGA .
budget i
673-343122-41
1978
Est.tradetransfers
110-184434-575
Est.totalcost ofCAP
783-527556-616
TransfersthroughFEOGAbudget
882-339465-255
1979
Est.tradetransfers
225-275125-600
Est.totalcost ofCAP
1,110-610590 .-850
Source: MAFF, 1981
Table 11:
1978 (£m) 1979 (£m)
CAPAttributed share (exFEOGA)lessERDF & ESF
(1.8% x 783) - 14.09(26.6% x 23.9) - 6.35
19
(1.7% x 1,110) - 18.87(24.6% x 28 1) - 6.91
31;
NET BENEFIT (-)/COSTW -hi 44 5.22
Source: Same as Tables 9 and 10.
252

CONCLUSION
To be supported on economic grounds, there must be evidence of significant neteconomic benefits attributable to Northern Ireland's membership of the EEC.Although the benefits which the EEC offered - economic growth stimulated by alarger integrated market and free trade, economic co-ordination and a com-prehensive regional and social policy - were always perceived to be of a longer termnature, it may be concluded that there is little if any discernible evidence of areinvigoration of industrial performance. Northern Ireland's industry was in declinepre-1973 and the trend has not been reversed. Since 1973, manufacturing outputhas declined on average by 3.9 per cent per annum and agricultural output by 2.2 per̂cent per annum while unemployment has increased and the disparity between theE.E.C. and Northern Ireland standards of living has worsened. The presentstructure of CAP is seen as a budgetary liability nationally and requiring radicalreform.
Twelve years of EEC membership should not be judged solely on the basis ofeconomic recession internationally. At accession it was acknowledged that fulldevelopment would take many years. Since then, unanticipated circumstances havealtered the time horizon and maturity of a number of policies has been delayed. Itmay be argued that Northern Ireland joined a less than perfect market Therefore,too much may have been expected from EEC membership which can onlycomplement national responsibility for a regional econmic system in which there isan increasing dependence on higher levels of public funding. Nevertheless, by thecriteria of its own objectives, Northern Ireland is an important test case of theEEC's ability to assist m the equalisation of employment opportunities and theredistribution of resources to its least advantaged areas. This has not beendemonstrated to date. Perhaps the impact of EEC membership must be evaluatedultimately in the context of non-economic considerations.
FOOTNOTES
1. See P. Robson, (1980), The Economics of International Integration, GeorgeAllen and Unwin, for a general theoretical survey.
2. Northern Ireland and the European Communities, (1971), Cmd 563, HMSOBelfast, November.
3. See, for example, T. Buck and J. Harper, (1978), Regional income Inequalityin the EEC, tijdschnft voor Economie en Management, Vol., 23, No. 3
4. Trade statistics do not provide a full record of the final destination of allNorthern Ireland exports which may be inputs to GB industries but in turnexported to other EEC countries.
5. See, for example, Plant Location International, (1978)6. R Harris, (1984) "Regional Policy in Northern Ireland" in J V. Simpson (ed)
European Community Policy in Northern Ireland, Queen's University,Belfast.
7. NIEC, Belfast (1981), Research, Development and Innovation in NorthernIreland, Report No. 25, Northern Ireland Economic Development Office,September.
253

8. Handbook of International Economic Statistics.9. D. Keeble, P.L. Owens and C Thompson, (1981), Centrahty, Peripherality
andEEC Regional Development, Commission of EEC and Uk Department ofIndustry, September 1981.
10. Keeble, Owens, Thompson (1981), op cit11. Commission of the EEC, (1983), European Economy, No. 16, July.12. F.J. Gordon, A G.S Crawford, (1984), "Milk Production, Agricultural
Research Institute of Northern Ireland", Occasional Paper No. 11, May.13. Government response to Northern Ireland Assembly Report, Additionally of
Receipts from European Funds, NIA 46.14. Receipts under the UK Supplementary Measures (SMUK) have no direct
impact on financing locally. In total about £60 million has been committed fora three year period under the Urban Renewal Regulation.
15. Cmnd 9143, The government's expenditure plans, 1984/85 to 1986/87.16. NIA 46 op cit, October 198317. The method used in the calculations is described in J. Rollo and K. Warwick,
The CAP and Resource Flows among EEC Member States, GovernmentEconomic Service Working Paper No. 27, MAFF November 1979.
DISCUSSION
Sean Cromien: I would like to congratulate the three speakers on their excellentpapers.
I think it is fair to say that Ireland's membership of the European Community hasnot fully lived up to its early promise. There have been both tangible and intangiblebenefits but there have also been costs and disappointments. Irish agriculture hasmade considerable gams, especially in the years between 1973 and 1978. Theindustrial sector, however, has had a mixed record. The "cold shower effect"mentioned by Michael McGurnaghan has been devastating rather than bracing inmany areas of indigenous industry. On the other hand, the economy has benefitedfrom an inflow of foreign firms which would not otherwise have taken place. Externaltrade has been remarkably diversified Irish exports to the UK were only 37 per centof the total in 1983, compared with 61 per cent in 1973, a welcome developmentsince it is best for an exporting economy not to have all its eggs in the one basket.For the first time, Ireland has had the opportunity to become involved m the policy-making process in the international economic field, an important consideration for acountry as dependent as Ireland is on external trade. Many Irish people, too, have, Ithink, benefited individually from the closer contact with European culture whichmembership has brought. It has given us an opportunity to see things from less of aninsular perspective than m the past.
On the broader aspects of European union, however, there have beendisappointments. Brendan McNamara quotes the objective in the preamble to theTreaty of Rome of ensuring the harmonious development of the economies of theMember States "by reducing the differences existing between the various regions
254

and the backwardness of the less favoured regions". Progress towards this objectivehas been very slow. There is a danger that in a region as large as the Community thecommon market will at the end of the day have most benefited those countries andindustrial areas at its core, while those at the periphery will not have done anythinglike as well. The only way to remedy this imbalance is through a vigorous regionalpolicy. This has been missing m the Community. The resources available from theRegional Fund still represent less than 0.1 per cent of Community GNP. With theenlargement of the Community to include Spam and Portugal, there is need for asubstantial increase in the resources of this Fund Alan Matthews makes somesobering points about the prospects of this happening.
Decision-making at Community level is difficult. This is understandable because ofthe need to reconcile national interests. There is, however, a general feeling that toomuch use is being made of the unanimity rule and also that too many items, oftentechnical in nature, are referred upwards to the European Council. Sufficientrecognition is not given either to the interaction of national economic policies. Thereis need for more conscious co-cperation and perhaps for new mechanisms to make iteffective. /
Alan Matthews in the conclusion to his paper refers to an ambiguity in Irishattitudes in that there is support for substantial Community transfers to thiscountry but attitudes to other aspects of integration are much more conditional. I donot go fully along with him in this. I think that Ireland has been communautaire in itsapproach to the EEC. We have, for instance, joined the EMS while the UK hasremained out of it. We have been in favour of closer economic and monetary unionprovided that this is accompanied by a vigorous social, regional and industrialpolicy.
In relation to Brendan McNamara's points regarding loans from the EIB, I think wecan say that these loans have been helpful to Ireland but the rates at which they havebeen made available are not much different from what we would have obtainedotherwise by direct borrowing. What was particularly attractive to us was theinterest subsidy in 1979-1983. In respect of EMS participation, obviously if there isto be constraint on foreign borrowing a loan from the EIB at virtually commercialrotery interest cannot be looked on as a supplement to foreign borrowing It can onlybe looked on as a substitute for it In any case, there have been significant reasonsfor the slow growth of the PCP in recent years As the paper rightly recognises, therecession has led to a reduction of demand for industrial aid and there has been atapenng-off in electricity and telecommunications programmes
255