Embed Size (px)
Citation preview
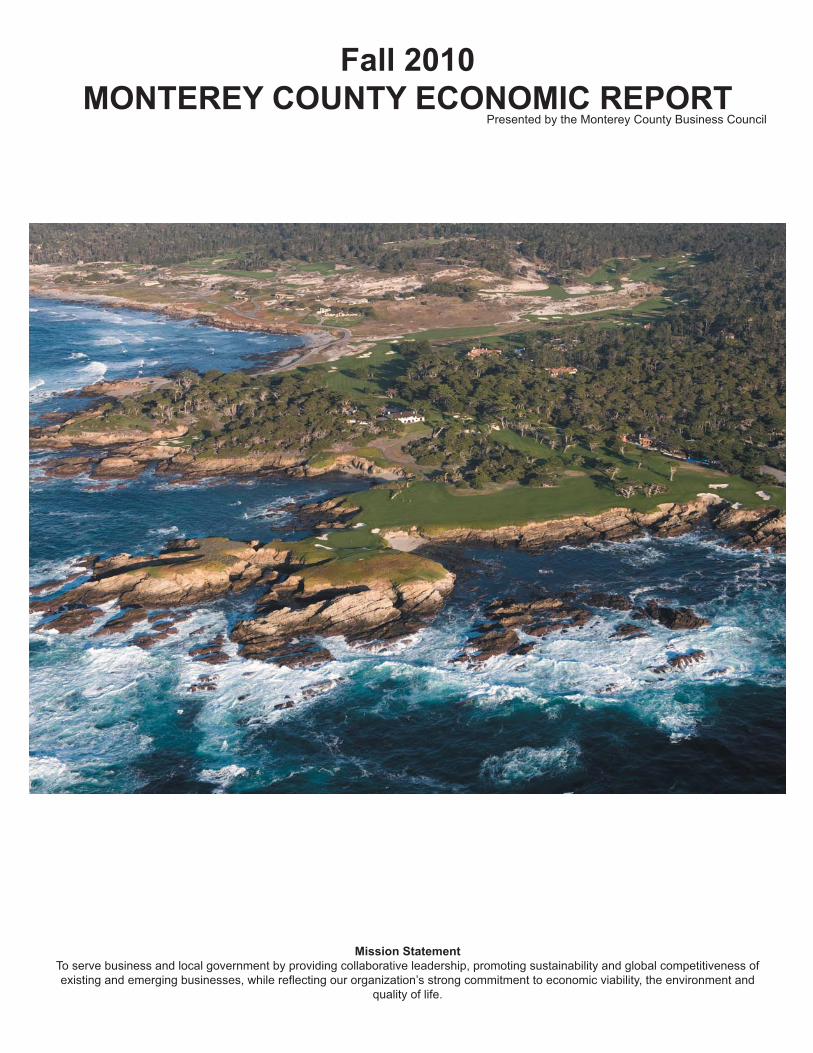
Fall 2010MONTEREY COUNTY ECONOMIC REPORT
Presented by the Monterey County Business Council
Mission StatementTo serve business and local government by providing collaborative leadership, promoting sustainability and global competitiveness of existing and emerging businesses, while reflecting our organization’s strong commitment to economic viability, the environment and
quality of life.
2
The past six months have seen a whirlwind of economic activity here in the Monterey Bay region, specifically in Monterey County. We have seen the launch of the Economic Development Administration/community funded Institute for Innovation and Economic Development at Cal State University, Monterey Bay. On October 4th, 2010, approximately 350 people attended a day long symposium on Sustainable Hospitality. The morning saw presentations from various speakers, representing the UK, Austrailia and Oregon, discussing possible standards for events and ways to achieve sustainable levels for events and venues. The afternoon was filled with local experts who are already engaged in sustainable practices. Our area has an amazing story to tell, from The Offset Project and their work with events, the Pebble Beach Company and their many faceted approach to the topic, The Portola Hotel and Spa and its pending LEED certification and the Captain’s Inn at Moss Landing with its transformation to a green business. Go to the Institute’s web site and see all of the presentations. MCBC will be working with the MCCVB and others to “tell the story” so that visitors and locals know this is the place to come when planning a trip or event.
MCBC has been engaged in helping business stay in business throughout the county and we successfully completed the first six months, working on a grant from the Monterey County Workforce Investment Board. We, in partnership with the WIB and Office of Employment Training were able to make a compelling set of reasons for Monterey Gourmet Foods to remain in our area. They have purchased a building in Gilroy and all of their existing 200+workforce have been offered jobs in the 27 mile move. According to a report prepared for CALED and MCBC, the economic impact of the company is approximately $361million annually, including payroll, purchase of supplies, food product, etc. These numbers are based on current staffing size and no growth. We wish them years of prosperity and growth, as it can only have a positive impact on the economics of our region. Several companies have benefited from our outreach and with that of the SBDC’s. Every job saved is a major achievement in this economy.
MCBC has been a partner in a four county launch of regional innovative clusters, has been a partner or supporter of 8 regional grants and has co-sponsored the regional economic summit with AMBAG, bringing a broader perspective to the business sector of our area. We continue to bring in more partners with StepUp2Green, having won the Harvard School of Business “Innovation Award” for 2010. The interest has grown for the regional Central Coast Career Readiness Certificate, with close to 700 issued and educational partners in two counties. We anticipate this program moving at a quicker pace now that business has begun hiring again.
As this is written, we anticipate the 4th annual Higher Education Leadership Summit, an event that specifically allows the community to see the impact these partners have on the economies of our region. Through the leadership of Abe Lincoln, a cluster initiative has taken off and the Amgen Tour will once again return to Seaside. Adding to events that have international coverage, this helps to show the world our multi-faceted, broad based appeal. We welcome anyone interested to join us at a cluster meeting. They are free (no membership required) and have lively presentations and discussions monthly.
In September, we honored the 2010 Best Places to Work in Monterey County. We will look forward to your participation in 2011 and hope you can join this prestigious group of employers.
We have much to celebrate and much to continue to work on. Our infrastructure throughout the county is aging and without proper wastewater, sewage, roads, water, etc. we will constantly be placing bandaids on patches as we attempt to bring new business and jobs into the area and keep the ones we have. Join us in working on ensuring that MONTEREY COUNTY is OPEN FOR BUSINESS!
President’s Message
3
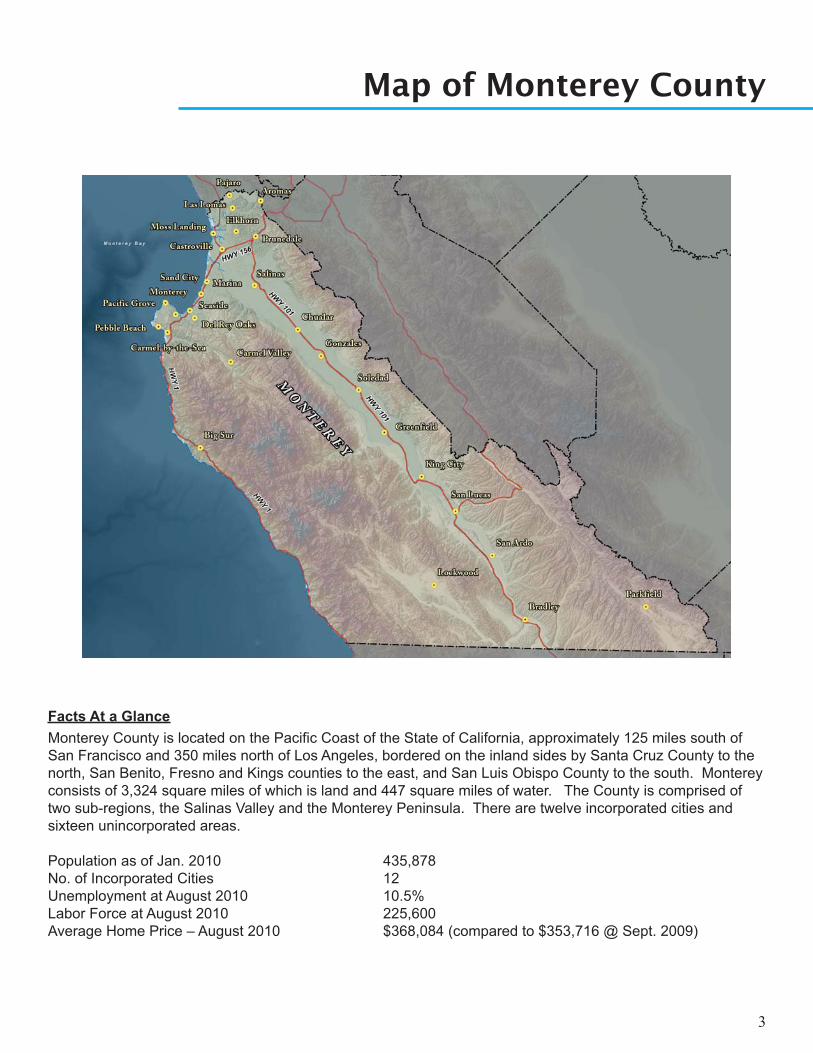
Facts At a GlanceMonterey County is located on the Pacific Coast of the State of California, approximately 125 miles south of San Francisco and 350 miles north of Los Angeles, bordered on the inland sides by Santa Cruz County to the north, San Benito, Fresno and Kings counties to the east, and San Luis Obispo County to the south. Monterey consists of 3,324 square miles of which is land and 447 square miles of water. The County is comprised of two sub-regions, the Salinas Valley and the Monterey Peninsula. There are twelve incorporated cities and sixteen unincorporated areas.
Population as of Jan. 2010 435,878 No. of Incorporated Cities 12 Unemployment at August 2010 10.5%Labor Force at August 2010 225,600Average Home Price – August 2010 $368,084 (compared to $353,716 @ Sept. 2009)
Map of Monterey County
4
Population As of July 1, 2009, the population was 433,887, with a projected population of 476,642 by 2010. Monterey County’s population is bisected with a large percentage of children under 18 years of age and a nearly equal percentage between 25 to 44 years, but few in the 18-24 year old range. The ethnic breakdown is 51 percent Hispanic; 36 percent white; 6 percent American Indian/Alaska Native; 3% African American and the remaining 4% other races.
Labor Force The civilian labor force at August 2010 was 225,600, compared to 224,400 at August 2009. The civilian unemployment total was 23,600.
Unemployment RateThe August 2010 unemployment rate was 10.5 percent, compared to the state at 12.4 percent and the nation at 9.5 percent.
Median Household IncomeThe 2009 area median income is $67,300, compared to San Benito of $80,400 and Santa Cruz at $83,800. Families comprise 62 to 80 percent of the households and the average household size is 2.9 persons.
AgricultureAgriculture is the No. 1 industry at $4.0 billion in 2009. Vegetable crops are the largest category with a value of $2,631,763,000. Wine grapes reflected a value of $238,082,000. There are twenty-seven crops that exceed a value of ten million. As of August 2010, there were 52,400 farm jobs.
TourismHospitality is No. 2 industry at approximately $2.0 billon in 2008. At August 2010, there were 20,900 hospitality jobs. At July 2010, the hotel occupancy rate was at 75.9%. There are approximately 11,626 available rooms in the County.
Real EstateThe median price for a single-family home in July 2010 for the Monterey region was $344,740. The median for California for the same month was $314,850.
Higher EducationMonterey Bay region is home to more than twenty higher education and research institutions, including three community colleges, two state universities, an international institute, a college of law, two specialized military institutions and several research organizations. Education contributes over $2.0B to the economy through operating budgets, research budgets and payroll.
EducationIn 2008-09 there were 70,523 pupils enrolled in K-12. Of the total student enrollment, approximately 70 percent are Hispanic.
Monterey County at a Glance
5
Economic OutlookThe recession likely ended in the middle of 2009 after hitting its depths during the first half of the year. The national economy has shown signs of improvement. After plunging from July 2008 to March 2009, factory orders grew by 12 percent between March 2009 and February 2010.
California’s economic outlook ranks 46th (1 = best 50 = worst) among the states, according to the new study from the American Legislative Exchange Council, a nonpartisan limited government advocacy group of state legislators. California ranked 38th in economic performance. The states with the bleakest forecasts are: New York at 50th; Vermont at 49th; New Jersey at 48th; Illinois at 47th and California at 46th. The states with the rosiest forecasts are Utah at 1st; Colorado at 2nd; Arizona at 3rd; South Dakota at 4th and Florida at 5th. Research shows that states with responsible spending and competitive tax rates enjoy the best economic outlook. Every time a state increases the cost of doing business their state brand immediately loses value.
Even though 2010 began with a return to sustained job growth, employment remains the biggest source of concern as it will take a long time to regain the nearly eight million jobs lost during the recession. After falling steadily between December 2007 and October 2009, industry employment increased in five of the six months ending in April 2010.
California’s unemployment rate partially bucked the national trend by climbing through the early months of 2010. The national rate leveled off at 10 percent in November and December 2009 and slipped slightly during the first quarter of 2010. The state’s rate, in contrast, was still trending up through March 2010, reaching 12.6 percent. Since the recession began in December 2007, the ranks of California’s unemployed had grown by 1.3 million.
Vehicle sales have stabilized and are beginning a modest but irregular rebound. During the six months ending with April 2010, motor vehicle sales averaged over 11 million units — somewhat better than their 2009 average, but still well below their 2008 level of 13 million units.
Retail sales surged in the first quarter of 2010, posting their strongest growth since the end of 2007. Consumers spent strongly at the beginning of the New Year despite high unemployment, sluggish income growth, and relatively tight credit.
Residential construction dropped during the first quarter of 2010, which by itself subtracted 0.29 percentage point from the rate of GDP growth. Nonresidential construction remains on a declining trend because of rising vacancy rates, falling rents, and tight credit conditions, which reduced GDP growth by 0.44 percentage point in the fourth quarter of 2009.
Made in California exports plummeted in the second half of 2008 before bottoming out in the first quarter of 2009. For the year as a whole, California exports fell 17 percent in 2009. High-tech exports fell by nearly 16 percent. With global economic conditions easing up, California exports increased 19.4 percent year over year in the first quarter of 2010.
ForecastThe longest and deepest recession in the post-Depression era is most likely over. Both the state and national economies appear poised to make modest comebacks. The recovery will probably be moderate and prolonged by historical standards. This means that the outlook for the near future is positive but sober. The national economy is forecast to return to modest growth rates in 2010 and beyond. The outlook for the California economy largely mirrors the national outlook, but with slightly less growth.
In August 2010 the Consumer Confidence rose to 53.5 percent from 51.0 in July. The increase comes after two straight months of decline. An index of 90 percent or more indicates a healthy economy. That level has not been seen since the recession began in December 2007.
Economic Outlook
6
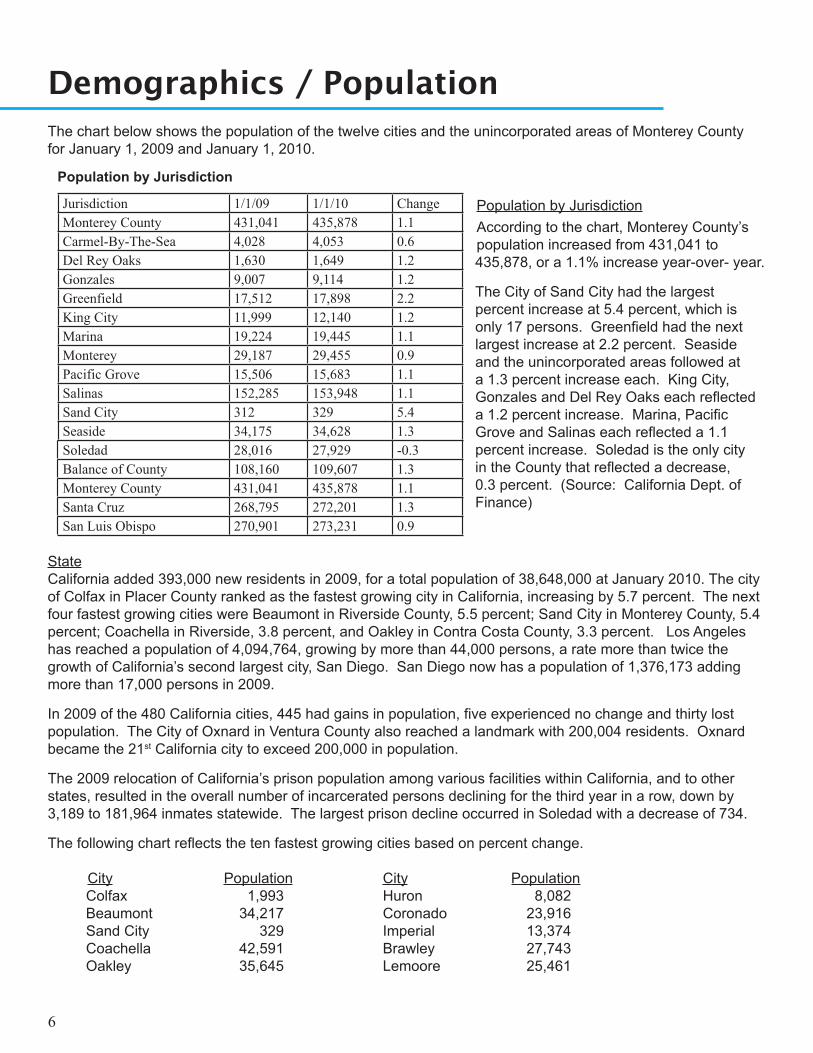
Demographics / PopulationThe chart below shows the population of the twelve cities and the unincorporated areas of Monterey County for January 1, 2009 and January 1, 2010.
Population by JurisdictionAccording to the chart, Monterey County’s population increased from 431,041 to 435,878, or a 1.1% increase year-over- year.
The City of Sand City had the largest percent increase at 5.4 percent, which is only 17 persons. Greenfield had the next largest increase at 2.2 percent. Seaside and the unincorporated areas followed at a 1.3 percent increase each. King City, Gonzales and Del Rey Oaks each reflected a 1.2 percent increase. Marina, Pacific Grove and Salinas each reflected a 1.1 percent increase. Soledad is the only city in the County that reflected a decrease, 0.3 percent. (Source: California Dept. of Finance)
StateCalifornia added 393,000 new residents in 2009, for a total population of 38,648,000 at January 2010. The city of Colfax in Placer County ranked as the fastest growing city in California, increasing by 5.7 percent. The next four fastest growing cities were Beaumont in Riverside County, 5.5 percent; Sand City in Monterey County, 5.4 percent; Coachella in Riverside, 3.8 percent, and Oakley in Contra Costa County, 3.3 percent. Los Angeles has reached a population of 4,094,764, growing by more than 44,000 persons, a rate more than twice the growth of California’s second largest city, San Diego. San Diego now has a population of 1,376,173 adding more than 17,000 persons in 2009.
In 2009 of the 480 California cities, 445 had gains in population, five experienced no change and thirty lost population. The City of Oxnard in Ventura County also reached a landmark with 200,004 residents. Oxnard became the 21st California city to exceed 200,000 in population.
The 2009 relocation of California’s prison population among various facilities within California, and to other states, resulted in the overall number of incarcerated persons declining for the third year in a row, down by 3,189 to 181,964 inmates statewide. The largest prison decline occurred in Soledad with a decrease of 734.
The following chart reflects the ten fastest growing cities based on percent change.
City Population City PopulationColfax 1,993 Huron 8,082 Beaumont 34,217 Coronado 23,916Sand City 329 Imperial 13,374Coachella 42,591 Brawley 27,743Oakley 35,645 Lemoore 25,461
Jurisdiction 1/1/09 1/1/10 ChangeMonterey County 431,041 435,878 1.1Carmel-By-The-Sea 4,028 4,053 0.6Del Rey Oaks 1,630 1,649 1.2Gonzales 9,007 9,114 1.2Greenfield 17,512 17,898 2.2King City 11,999 12,140 1.2Marina 19,224 19,445 1.1Monterey 29,187 29,455 0.9Pacific Grove 15,506 15,683 1.1Salinas 152,285 153,948 1.1Sand City 312 329 5.4Seaside 34,175 34,628 1.3Soledad 28,016 27,929 -0.3Balance of County 108,160 109,607 1.3Monterey County 431,041 435,878 1.1Santa Cruz 268,795 272,201 1.3San Luis Obispo 270,901 273,231 0.9
Population by Jurisdiction
7
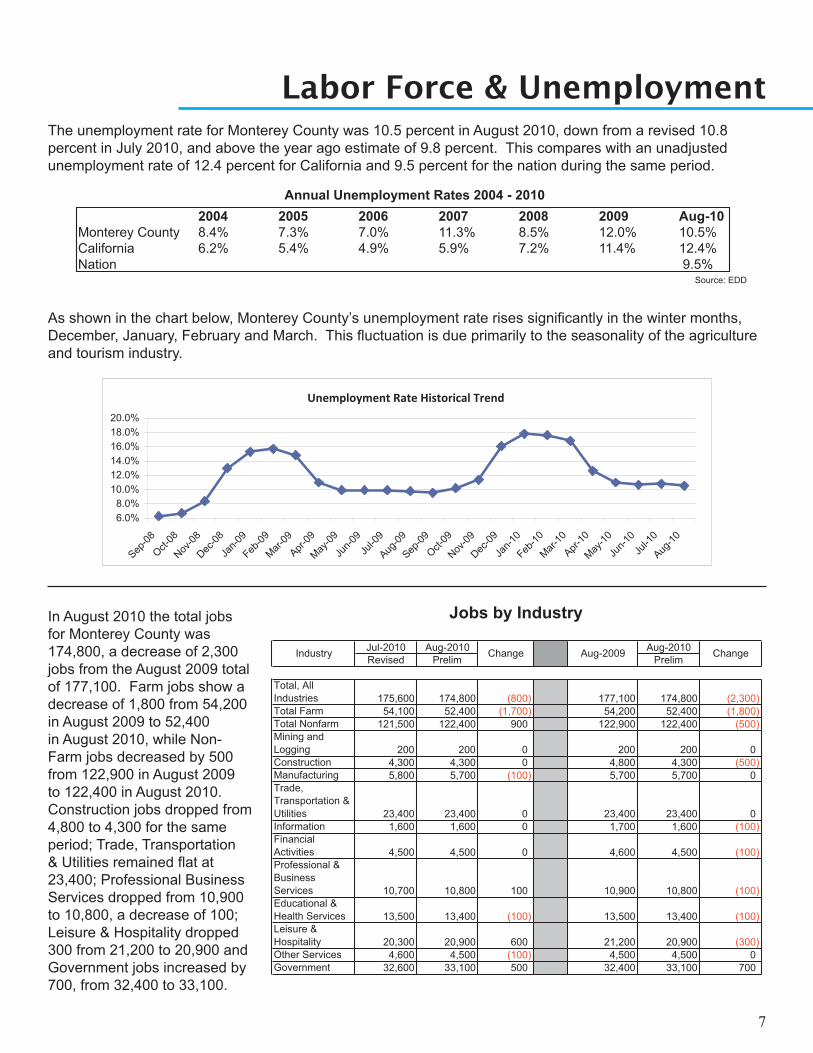
Labor Force & UnemploymentThe unemployment rate for Monterey County was 10.5 percent in August 2010, down from a revised 10.8 percent in July 2010, and above the year ago estimate of 9.8 percent. This compares with an unadjusted unemployment rate of 12.4 percent for California and 9.5 percent for the nation during the same period.
As shown in the chart below, Monterey County’s unemployment rate rises significantly in the winter months, December, January, February and March. This fluctuation is due primarily to the seasonality of the agriculture and tourism industry.
In August 2010 the total jobs for Monterey County was 174,800, a decrease of 2,300 jobs from the August 2009 total of 177,100. Farm jobs show a decrease of 1,800 from 54,200 in August 2009 to 52,400 in August 2010, while Non-Farm jobs decreased by 500 from 122,900 in August 2009 to 122,400 in August 2010. Construction jobs dropped from 4,800 to 4,300 for the same period; Trade, Transportation & Utilities remained flat at 23,400; Professional Business Services dropped from 10,900 to 10,800, a decrease of 100; Leisure & Hospitality dropped 300 from 21,200 to 20,900 and Government jobs increased by 700, from 32,400 to 33,100.
2004 2005 2006 2007 2008 2009 Aug-10Monterey County 8.4% 7.3% 7.0% 11.3% 8.5% 12.0% 10.5%California 6.2% 5.4% 4.9% 5.9% 7.2% 11.4% 12.4%Nation 9.5%
Annual Unemployment Rates 2004 - 2010
Source: EDD
Unemployment Rate Historical Trend
6.0%8.0%
10.0%12.0%14.0%16.0%18.0%20.0%
Sep-08
Oct-08
Nov-08
Dec-08
Jan-0
9
Feb-09
Mar-09
Apr-09
May-09
Jun-0
9Ju
l-09
Aug-09
Sep-09
Oct-09
Nov-09
Dec-09
Jan-1
0
Feb-10
Mar-10
Apr-10
May-10
Jun-1
0Ju
l-10
Aug-10
Jul-2010 Aug-2010 Aug-2010Revised Prelim Prelim
Total, All Industries 175,600 174,800 (800) 177,100 174,800 (2,300)Total Farm 54,100 52,400 (1,700) 54,200 52,400 (1,800)Total Nonfarm 121,500 122,400 900 122,900 122,400 (500)Mining and Logging 200 200 0 200 200 0Construction 4,300 4,300 0 4,800 4,300 (500)Manufacturing 5,800 5,700 (100) 5,700 5,700 0Trade,Transportation & Utilities 23,400 23,400 0 23,400 23,400 0Information 1,600 1,600 0 1,700 1,600 (100)FinancialActivities 4,500 4,500 0 4,600 4,500 (100)Professional & BusinessServices 10,700 10,800 100 10,900 10,800 (100)Educational & Health Services 13,500 13,400 (100) 13,500 13,400 (100)Leisure & Hospitality 20,300 20,900 600 21,200 20,900 (300)Other Services 4,600 4,500 (100) 4,500 4,500 0Government 32,600 33,100 500 32,400 33,100 700
Industry Change Aug-2009 Change
Jobs by Industry
8
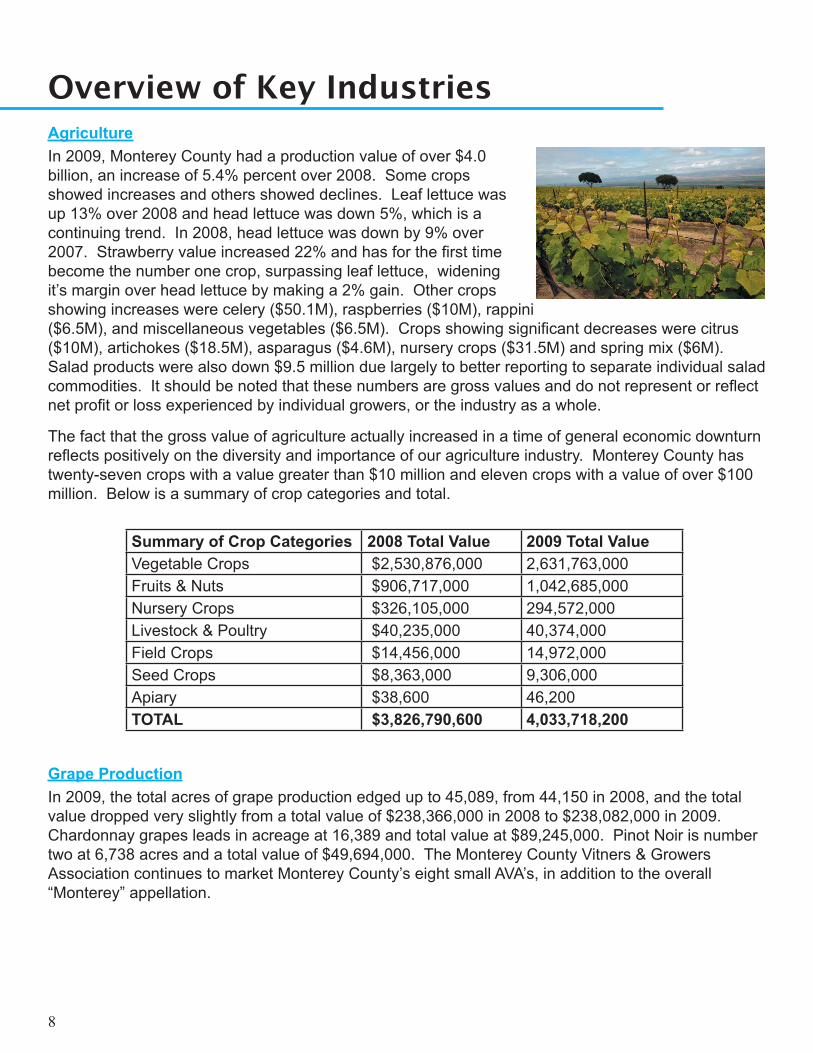
Overview of Key IndustriesAgricultureIn 2009, Monterey County had a production value of over $4.0 billion, an increase of 5.4% percent over 2008. Some crops showed increases and others showed declines. Leaf lettuce was up 13% over 2008 and head lettuce was down 5%, which is a continuing trend. In 2008, head lettuce was down by 9% over 2007. Strawberry value increased 22% and has for the first time become the number one crop, surpassing leaf lettuce, widening it’s margin over head lettuce by making a 2% gain. Other crops showing increases were celery ($50.1M), raspberries ($10M), rappini ($6.5M), and miscellaneous vegetables ($6.5M). Crops showing significant decreases were citrus ($10M), artichokes ($18.5M), asparagus ($4.6M), nursery crops ($31.5M) and spring mix ($6M). Salad products were also down $9.5 million due largely to better reporting to separate individual salad commodities. It should be noted that these numbers are gross values and do not represent or reflect net profit or loss experienced by individual growers, or the industry as a whole.
The fact that the gross value of agriculture actually increased in a time of general economic downturn reflects positively on the diversity and importance of our agriculture industry. Monterey County has twenty-seven crops with a value greater than $10 million and eleven crops with a value of over $100 million. Below is a summary of crop categories and total.
Grape ProductionIn 2009, the total acres of grape production edged up to 45,089, from 44,150 in 2008, and the total value dropped very slightly from a total value of $238,366,000 in 2008 to $238,082,000 in 2009. Chardonnay grapes leads in acreage at 16,389 and total value at $89,245,000. Pinot Noir is number two at 6,738 acres and a total value of $49,694,000. The Monterey County Vitners & Growers Association continues to market Monterey County’s eight small AVA’s, in addition to the overall “Monterey” appellation.
Summary of Crop Categories 2008 Total Value 2009 Total ValueVegetable Crops $2,530,876,000 2,631,763,000Fruits & Nuts $906,717,000 1,042,685,000Nursery Crops $326,105,000 294,572,000Livestock & Poultry $40,235,000 40,374,000Field Crops $14,456,000 14,972,000Seed Crops $8,363,000 9,306,000Apiary $38,600 46,200TOTAL $3,826,790,600 4,033,718,200
9
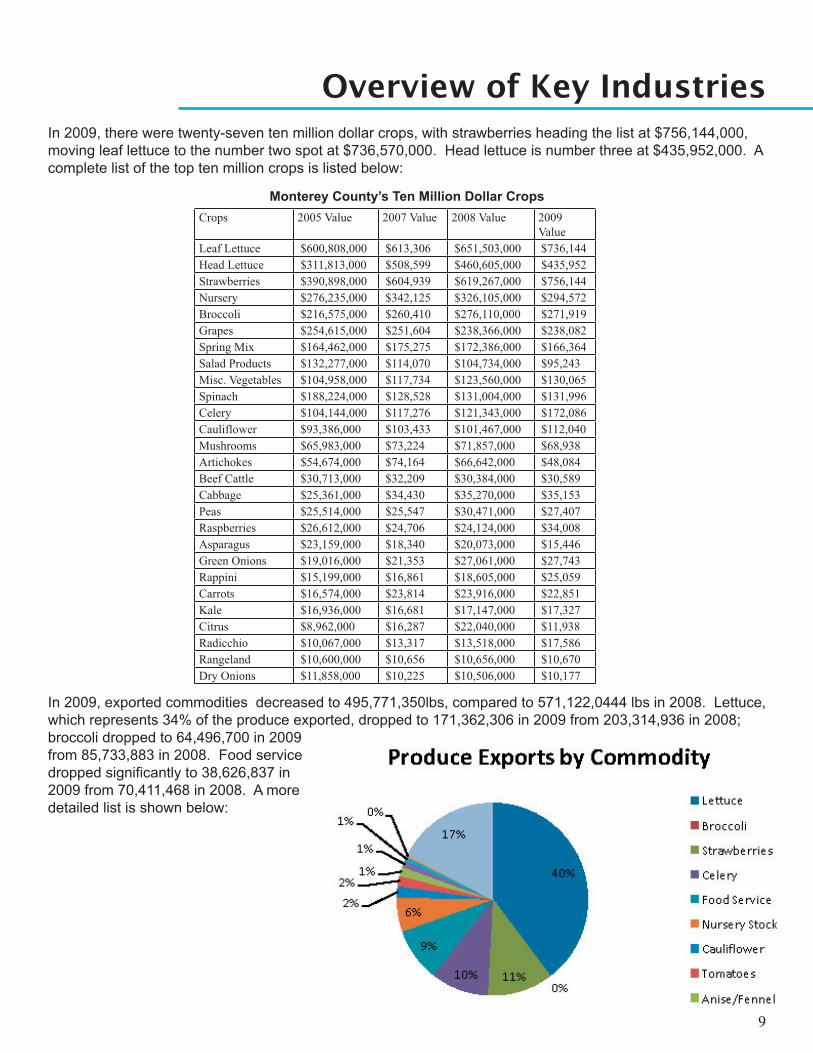
Overview of Key IndustriesIn 2009, there were twenty-seven ten million dollar crops, with strawberries heading the list at $756,144,000, moving leaf lettuce to the number two spot at $736,570,000. Head lettuce is number three at $435,952,000. A complete list of the top ten million crops is listed below:
Monterey County’s Ten Million Dollar Crops
In 2009, exported commodities decreased to 495,771,350lbs, compared to 571,122,0444 lbs in 2008. Lettuce, which represents 34% of the produce exported, dropped to 171,362,306 in 2009 from 203,314,936 in 2008; broccoli dropped to 64,496,700 in 2009 from 85,733,883 in 2008. Food service dropped significantly to 38,626,837 in 2009 from 70,411,468 in 2008. A more detailed list is shown below:
Crops 2005 Value 2007 Value 2008 Value 2009 Value
Leaf Lettuce $600,808,000 $613,306 $651,503,000 $736,144 Head Lettuce $311,813,000 $508,599 $460,605,000 $435,952 Strawberries $390,898,000 $604,939 $619,267,000 $756,144 Nursery $276,235,000 $342,125 $326,105,000 $294,572 Broccoli $216,575,000 $260,410 $276,110,000 $271,919 Grapes $254,615,000 $251,604 $238,366,000 $238,082 Spring Mix $164,462,000 $175,275 $172,386,000 $166,364 Salad Products $132,277,000 $114,070 $104,734,000 $95,243 Misc. Vegetables $104,958,000 $117,734 $123,560,000 $130,065 Spinach $188,224,000 $128,528 $131,004,000 $131,996 Celery $104,144,000 $117,276 $121,343,000 $172,086 Cauliflower $93,386,000 $103,433 $101,467,000 $112,040 Mushrooms $65,983,000 $73,224 $71,857,000 $68,938 Artichokes $54,674,000 $74,164 $66,642,000 $48,084 Beef Cattle $30,713,000 $32,209 $30,384,000 $30,589 Cabbage $25,361,000 $34,430 $35,270,000 $35,153 Peas $25,514,000 $25,547 $30,471,000 $27,407 Raspberries $26,612,000 $24,706 $24,124,000 $34,008 Asparagus $23,159,000 $18,340 $20,073,000 $15,446 Green Onions $19,016,000 $21,353 $27,061,000 $27,743 Rappini $15,199,000 $16,861 $18,605,000 $25,059 Carrots $16,574,000 $23,814 $23,916,000 $22,851 Kale $16,936,000 $16,681 $17,147,000 $17,327 Citrus $8,962,000 $16,287 $22,040,000 $11,938 Radicchio $10,067,000 $13,317 $13,518,000 $17,586 Rangeland $10,600,000 $10,656 $10,656,000 $10,670 Dry Onions $11,858,000 $10,225 $10,506,000 $10,177
10
Overview of Key Industries (continued)
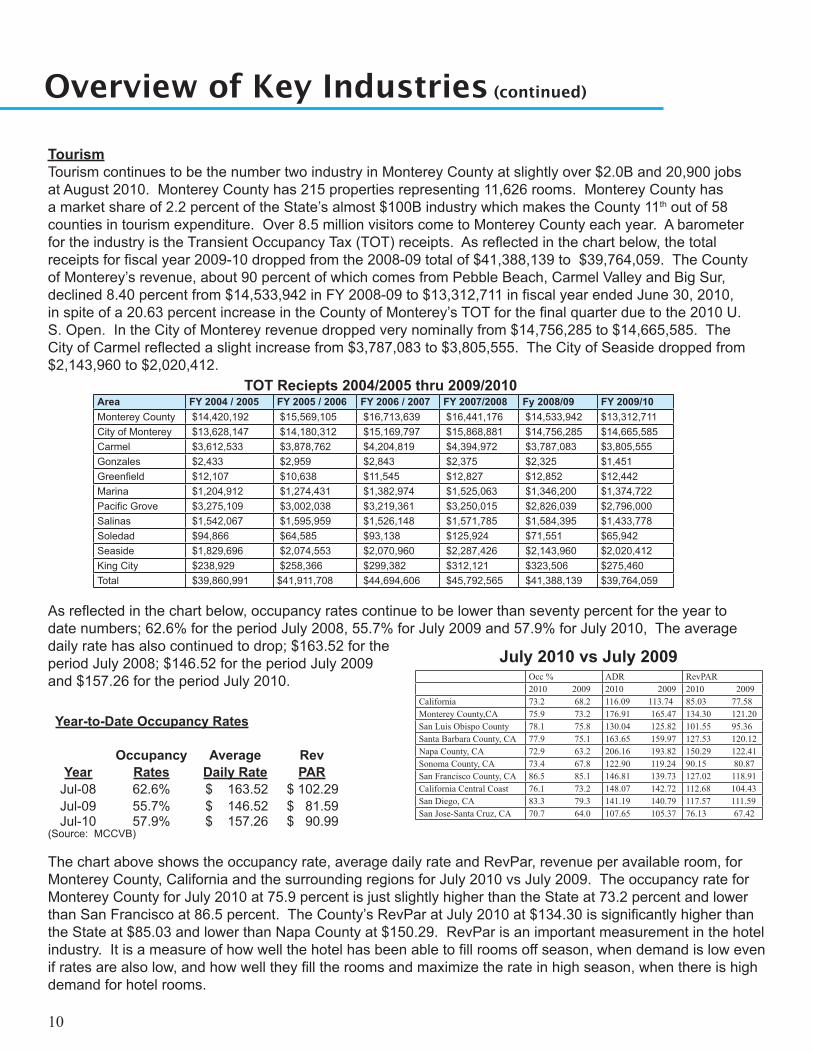
TourismTourism continues to be the number two industry in Monterey County at slightly over $2.0B and 20,900 jobs at August 2010. Monterey County has 215 properties representing 11,626 rooms. Monterey County has a market share of 2.2 percent of the State’s almost $100B industry which makes the County 11th out of 58 counties in tourism expenditure. Over 8.5 million visitors come to Monterey County each year. A barometer for the industry is the Transient Occupancy Tax (TOT) receipts. As reflected in the chart below, the total receipts for fiscal year 2009-10 dropped from the 2008-09 total of $41,388,139 to $39,764,059. The County of Monterey’s revenue, about 90 percent of which comes from Pebble Beach, Carmel Valley and Big Sur, declined 8.40 percent from $14,533,942 in FY 2008-09 to $13,312,711 in fiscal year ended June 30, 2010, in spite of a 20.63 percent increase in the County of Monterey’s TOT for the final quarter due to the 2010 U. S. Open. In the City of Monterey revenue dropped very nominally from $14,756,285 to $14,665,585. The City of Carmel reflected a slight increase from $3,787,083 to $3,805,555. The City of Seaside dropped from $2,143,960 to $2,020,412.
As reflected in the chart below, occupancy rates continue to be lower than seventy percent for the year to date numbers; 62.6% for the period July 2008, 55.7% for July 2009 and 57.9% for July 2010, The average daily rate has also continued to drop; $163.52 for the period July 2008; $146.52 for the period July 2009 and $157.26 for the period July 2010.
Year-to-Date Occupancy Rates
Occupancy Average RevYear Rates Daily Rate PAR
Jul-08 62.6% $ 163.52 $ 102.29 Jul-09 55.7% $ 146.52 $ 81.59 Jul-10 57.9% $ 157.26 $ 90.99
(Source: MCCVB)
The chart above shows the occupancy rate, average daily rate and RevPar, revenue per available room, for Monterey County, California and the surrounding regions for July 2010 vs July 2009. The occupancy rate for Monterey County for July 2010 at 75.9 percent is just slightly higher than the State at 73.2 percent and lower than San Francisco at 86.5 percent. The County’s RevPar at July 2010 at $134.30 is significantly higher than the State at $85.03 and lower than Napa County at $150.29. RevPar is an important measurement in the hotel industry. It is a measure of how well the hotel has been able to fill rooms off season, when demand is low even if rates are also low, and how well they fill the rooms and maximize the rate in high season, when there is high demand for hotel rooms.
Area FY 2004 / 2005 FY 2005 / 2006 FY 2006 / 2007 FY 2007/2008 Fy 2008/09 FY 2009/10Monterey County $14,420,192 $15,569,105 $16,713,639 $16,441,176 $14,533,942 $13,312,711City of Monterey $13,628,147 $14,180,312 $15,169,797 $15,868,881 $14,756,285 $14,665,585Carmel $3,612,533 $3,878,762 $4,204,819 $4,394,972 $3,787,083 $3,805,555Gonzales $2,433 $2,959 $2,843 $2,375 $2,325 $1,451Greenfield $12,107 $10,638 $11,545 $12,827 $12,852 $12,442Marina $1,204,912 $1,274,431 $1,382,974 $1,525,063 $1,346,200 $1,374,722Pacific Grove $3,275,109 $3,002,038 $3,219,361 $3,250,015 $2,826,039 $2,796,000Salinas $1,542,067 $1,595,959 $1,526,148 $1,571,785 $1,584,395 $1,433,778Soledad $94,866 $64,585 $93,138 $125,924 $71,551 $65,942Seaside $1,829,696 $2,074,553 $2,070,960 $2,287,426 $2,143,960 $2,020,412King City $238,929 $258,366 $299,382 $312,121 $323,506 $275,460Total $39,860,991 $41,911,708 $44,694,606 $45,792,565 $41,388,139 $39,764,059
TOT Reciepts 2004/2005 thru 2009/2010
Occ % ADR RevPAR2010 2009 2010 2009 2010 2009
California 73.2 68.2 116.09 113.74 85.03 77.58Monterey County,CA 75.9 73.2 176.91 165.47 134.30 121.20San Luis Obispo County 78.1 75.8 130.04 125.82 101.55 95.36Santa Barbara County, CA 77.9 75.1 163.65 159.97 127.53 120.12Napa County, CA 72.9 63.2 206.16 193.82 150.29 122.41Sonoma County, CA 73.4 67.8 122.90 119.24 90.15 80.87San Francisco County, CA 86.5 85.1 146.81 139.73 127.02 118.91California Central Coast 76.1 73.2 148.07 142.72 112.68 104.43San Diego, CA 83.3 79.3 141.19 140.79 117.57 111.59San Jose-Santa Cruz, CA 70.7 64.0 107.65 105.37 76.13 67.42
July 2010 vs July 2009
11
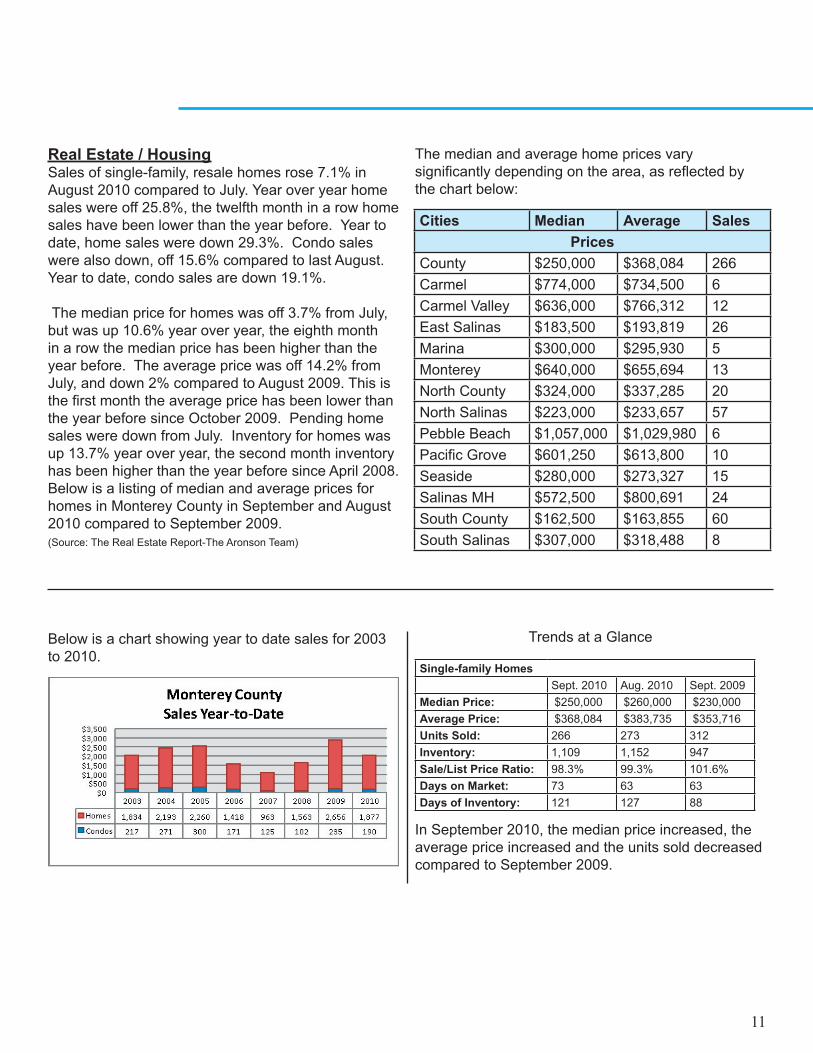
Below is a chart showing year to date sales for 2003 to 2010.
Real Estate / HousingSales of single-family, resale homes rose 7.1% in August 2010 compared to July. Year over year home sales were off 25.8%, the twelfth month in a row home sales have been lower than the year before. Year to date, home sales were down 29.3%. Condo sales were also down, off 15.6% compared to last August. Year to date, condo sales are down 19.1%.
The median price for homes was off 3.7% from July, but was up 10.6% year over year, the eighth month in a row the median price has been higher than the year before. The average price was off 14.2% from July, and down 2% compared to August 2009. This is the first month the average price has been lower than the year before since October 2009. Pending home sales were down from July. Inventory for homes was up 13.7% year over year, the second month inventory has been higher than the year before since April 2008. Below is a listing of median and average prices for homes in Monterey County in September and August 2010 compared to September 2009. (Source: The Real Estate Report-The Aronson Team)
Cities Median Average SalesPrices
County $250,000 $368,084 266Carmel $774,000 $734,500 6Carmel Valley $636,000 $766,312 12East Salinas $183,500 $193,819 26Marina $300,000 $295,930 5Monterey $640,000 $655,694 13North County $324,000 $337,285 20North Salinas $223,000 $233,657 57Pebble Beach $1,057,000 $1,029,980 6Pacific Grove $601,250 $613,800 10Seaside $280,000 $273,327 15Salinas MH $572,500 $800,691 24South County $162,500 $163,855 60South Salinas $307,000 $318,488 8
The median and average home prices vary significantly depending on the area, as reflected by the chart below:
Single-family HomesSept. 2010 Aug. 2010 Sept. 2009
Median Price: $250,000 $260,000 $230,000 Average Price: $368,084 $383,735 $353,716 Units Sold: 266 273 312Inventory: 1,109 1,152 947Sale/List Price Ratio: 98.3% 99.3% 101.6%Days on Market: 73 63 63Days of Inventory: 121 127 88
Trends at a Glance
In September 2010, the median price increased, the average price increased and the units sold decreased compared to September 2009.
12
Overview of Key Industries (continued)
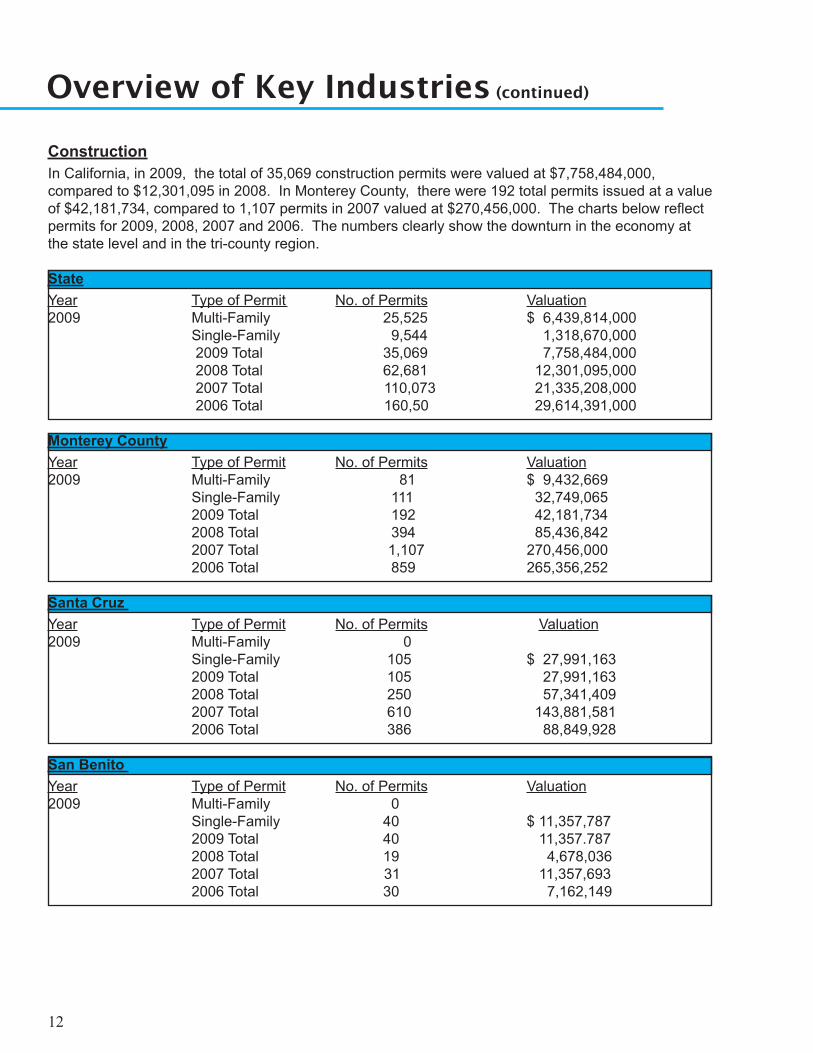
ConstructionIn California, in 2009, the total of 35,069 construction permits were valued at $7,758,484,000, compared to $12,301,095 in 2008. In Monterey County, there were 192 total permits issued at a value of $42,181,734, compared to 1,107 permits in 2007 valued at $270,456,000. The charts below reflect permits for 2009, 2008, 2007 and 2006. The numbers clearly show the downturn in the economy at the state level and in the tri-county region.
StateYear Type of Permit No. of Permits Valuation2009 Multi-Family 25,525 $ 6,439,814,000 Single-Family 9,544 1,318,670,000 2009 Total 35,069 7,758,484,000 2008 Total 62,681 12,301,095,000 2007 Total 110,073 21,335,208,000 2006 Total 160,50 29,614,391,000
Monterey CountyYear Type of Permit No. of Permits Valuation2009 Multi-Family 81 $ 9,432,669 Single-Family 111 32,749,065 2009 Total 192 42,181,734 2008 Total 394 85,436,842 2007 Total 1,107 270,456,000 2006 Total 859 265,356,252
Santa Cruz Year Type of Permit No. of Permits Valuation2009 Multi-Family 0 Single-Family 105 $ 27,991,163 2009 Total 105 27,991,163 2008 Total 250 57,341,409 2007 Total 610 143,881,581 2006 Total 386 88,849,928
San Benito Year Type of Permit No. of Permits Valuation2009 Multi-Family 0 Single-Family 40 $ 11,357,787 2009 Total 40 11,357.787 2008 Total 19 4,678,036 2007 Total 31 11,357,693 2006 Total 30 7,162,149
13
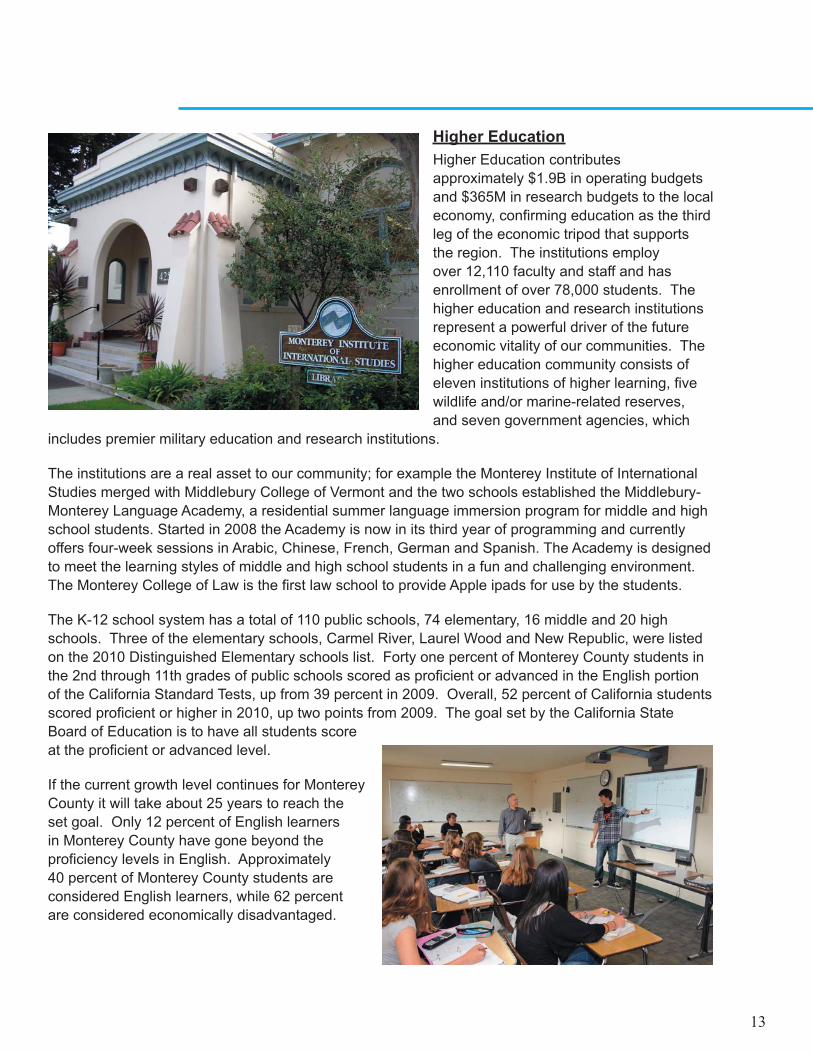
Higher EducationHigher Education contributes approximately $1.9B in operating budgets and $365M in research budgets to the local economy, confirming education as the third leg of the economic tripod that supports the region. The institutions employ over 12,110 faculty and staff and has enrollment of over 78,000 students. The higher education and research institutions represent a powerful driver of the future economic vitality of our communities. The higher education community consists of eleven institutions of higher learning, five wildlife and/or marine-related reserves, and seven government agencies, which
includes premier military education and research institutions.
The institutions are a real asset to our community; for example the Monterey Institute of International Studies merged with Middlebury College of Vermont and the two schools established the Middlebury-Monterey Language Academy, a residential summer language immersion program for middle and high school students. Started in 2008 the Academy is now in its third year of programming and currently offers four-week sessions in Arabic, Chinese, French, German and Spanish. The Academy is designed to meet the learning styles of middle and high school students in a fun and challenging environment. The Monterey College of Law is the first law school to provide Apple ipads for use by the students.
The K-12 school system has a total of 110 public schools, 74 elementary, 16 middle and 20 high schools. Three of the elementary schools, Carmel River, Laurel Wood and New Republic, were listed on the 2010 Distinguished Elementary schools list. Forty one percent of Monterey County students in the 2nd through 11th grades of public schools scored as proficient or advanced in the English portion of the California Standard Tests, up from 39 percent in 2009. Overall, 52 percent of California students scored proficient or higher in 2010, up two points from 2009. The goal set by the California State Board of Education is to have all students score at the proficient or advanced level.
If the current growth level continues for Monterey County it will take about 25 years to reach the set goal. Only 12 percent of English learners in Monterey County have gone beyond the proficiency levels in English. Approximately 40 percent of Monterey County students are considered English learners, while 62 percent are considered economically disadvantaged.
14
Sales Tax
The Bureau of Labor Statistics shows an average household income of $63,563 in 2008. The Bureau also shows that the lowest earning group of households had an average of $10,264 while the highest earning group had an average income of $158,652, resulting in the highest earning income group of households having incomes that averaged over 15 times higher than the lowest earning group.
U. S. households on average spend 30.7 percent of their incomes on goods that are taxable in California. The percentages of incomes spent on California taxable items range from a high of 82.1 percent for the lowest income quintile to a low of 22.6 percent for the highest income quintile. California taxable sales have declined every quarter since the recession started in December 2007, 19.0 percent in the second quarter 2009 which was one of the worst periods of the recession. Prior to the current recession the steepest drop in taxable sales was the first quarter of 1958, when taxable sales dropped 7.3 percent. No major region escaped the recession of 2009 with taxable sales declining 15.8 percent for the Northern Sacramento Valley to 22.6 percent for the Sacramento metropolitan area. The state as a whole dropped 20.8 percent, more than they have in any other recession since the Board of Equalization has kept records. (Source: State Board of Equalization)
Sales tax receipts from the unincorporated area January through March was 6.1%higher than the same quarter one year ago. Higher fuel prices and correction of a previous allocation error that had reduced tax receipts from farm and construction equipment accounted for most of the increase. Other factors included a boost in sales of agricultural chemicals and the prior additions of a restaurant with a full liquor license and a few retail shops. The gains were partially offset by a decline in receipts from resort hotels, construction supplies, and supplies serving the petroleum industry.
Adjusted for aberrations, taxable sales for all of Monterey County, including the cities, increased by 4.1 percent over the comparable time period, while the Central Coast region as a whole was up 3.3%. (Source: Monterey County Sales Tax Update Jan.-Mar 2010)
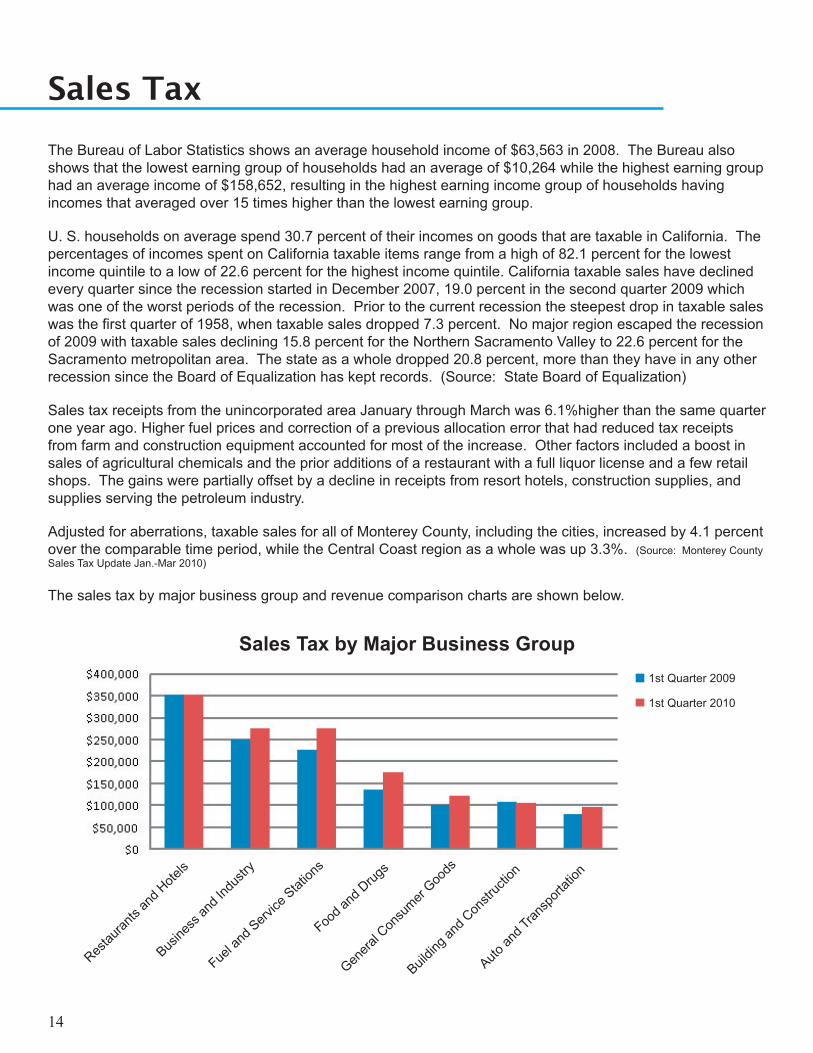
The sales tax by major business group and revenue comparison charts are shown below.
Restau
rants
and H
otels
Busine
ss an
d Ind
ustry
Fuel a
nd Serv
ice Stat
ions
Food a
nd D
rugs
Genera
l Con
sumer
Goods
Buildin
g and
Con
struc
tion
Auto an
d Tran
sport
ation
1st Quarter 2009
1st Quarter 2010
Sales Tax by Major Business Group
The Monterey County Business Council, a County-wide business leadership organization, is a membership only 501 ©(6)comprised of a diverse group of members representing all industries and geographic areas of Monterey County who are interested in shaping the future of Monterey County and have a vested interest in the economic vitality of our community.
The Council was established in 1995 to serve business and local government by providing collaborative leadership, promoting sustainability and global competitiveness of existing and emerging businesses, while reflecting the organization’s strong commitment to economic vitality, the environment and quality of life.
The Council is the County of Monterey’s private partner and facilitates the Monterey County Competitive Cluster Project on behalf of the County.
The members of the MCBC are executives and community leaders of the County’s public and private organizations. Through financial support and direct participation in the mission, programs and initiatives of the MCBC, the members are committed to playing a significant role in shaping the region’s economic future.
The MCBC operates several subsidiary enterprises; Step Up 2Green (SU2G) which was established in 2008 and launched in 2009 to encourage residents to freshen up their residences with green products and techniques; the Monterey Bay Region Career Readiness Certificate Program which assesses the skills level of employees and partners with training providers to upgrade the skills of existing and future employees.
2010 Goals• Work in conjunction with stakeholders to improve the skills level of Monterey County’s Workforce
• Improve the competitiveness of local industries and businesses through continued facilitation of the Monterey County Competitive Clusters Project
• Work with policymakers and other economic development organizations to improve the business climate in Monterey County
• Keep members abreast of key issues facing Monterey County businesses and local government
• Work with service providers to enhance and improve access to the current business assistance programs
• Continue to seek alternative funding sources to support operations & special programs
For a more complete list of activities or information on membership, please call 831-883-9443 or e-mail [email protected]
Executive Committee
PresidentMary Ann Leffel
Vice PresidentClaude Hoover
Veritas Associates
TreasurerWendy Sarsfield
PG & E
SecretaryDavid Gill
Growers Express
Robert BianchiBianchi, Kasavan & Pope
Linda CoyneMCBERI
Hakan ErdincRabobank
Myron “Doc” EtienneNoland, Hamerly Etienne & Hoss
Tom GreerMonterey Peninsula Airport District
Hunter HarvathMonterey-Salinas Transit
Richard RudisillRCA Enterprises
Bettye SaxonAT&T
Patrick WardBestor Engineers
Staff:
Mary ClaypoolExecutive Director
Bob RiceDirector of Education/Communications
Chris SentieriDirector of Competitive Clusters
Samantha JohnsonProgram Manager
Wynette JonesAdministrative Assistant
Design - Brandi BriscoeText - Mary Claypool
Photos - DMT Imaging