Embed Size (px)
Citation preview
1
Economic Potential of the “Power-to-Heat” Technology in the 50Hertz Control Area
Mario Götz#1, Diana Böttger
#2, Hendrik Kondziella
#3, Thomas Bruckner
#4
Abstract
Electricity generation through renewable energy sources (RES) in Germany has risen signifi-
cantly in the last years. Specifically, the control area of “50Hertz Transmission GmbH” is con-
fronted by a situation of high installed wind power capacities and simultaneously by a compa-
rably low electricity demand. With already oversized conventional generation capacities with
a high share of cogeneration plants, transfer capacities to neighboring control areas are even
today often congested. Therefore, the introduction of new electricity consumers like the Pow-
er-to-Heat technology (P2H) may be useful in integrating increasing excessive amounts of
RES and in supplementing system service provision. Furthermore, the tightening conflict
between cogeneration and fluctuating RES could be defused through this technology. Com-
pared to the often discussed Power-to-Gas technology, P2H is already available at compa-
rably low costs.
This paper evaluates through an energy economic model the economic potential of the appli-
cation of P2H in combination with heat storages in district heating grids as an additional flex-
ibility option for combined heat and power plants. The model maximizes the possible profits
of a district heating system consisting of cogeneration units, heating plants and heat storages
combined with P2H applications on the day-ahead spot and balancing power market for a
given heat demand on an hourly basis. Moreover, a case study analyzes several existing
district heating grids in the 50Hertz control area for the years 2014 and 2020.
#
University of Leipzig, Institute for Infrastructure and Resource Management, Grimmaische Straße 12, 04109 Leipzig, Germany
1
Office no.: +49-(0)341 - 97 33 525, [email protected] 2
Office no.: +49-(0)341 - 97 33 518, [email protected] 3
Office no.: +49-(0)341 - 97 33 523, [email protected] 4
Office no.: +49-(0)341 - 97 33 517, [email protected]

Economic Potential of the “Power-to-Heat” Technology in the 50Hertz control area Mario Götz, Diana Böttger, Hendrik Kondziella, Thomas Bruckner
2
As the P2H technology is well-suited for the provision of balancing power, P2H-plants can
pay back investment costs in less than one year by just providing negative secondary re-
serve. The energy price for P2H‐plants is mainly determined by state and other charges for
the electricity consumption. Therefore, the cost efficient usage of P2H for heat provision via
the spot market needs negative spot market prices in a considerable size. Only with a total
exemption of the additional costs P2H‐plants would be used for heat production.
Key words:
Power-to-Heat, combined heat and power, heat storage, renewable energy, control power.
Economic Potential of the “Power-to-Heat” Technology in the 50Hertz control area Mario Götz, Diana Böttger, Hendrik Kondziella, Thomas Bruckner
3
1 Introduction
The expansion of generation capacities from renewable energy sources (RES) has made
significant progress since the implementation of a Feed-In-Tariff (FIT) regulation in Germany
in 2000. Foremost, the variable RES (vRES) have developed notably, though with a high
regional differentiation. Whereas Photovoltaic (PV) is mainly installed in the southern parts of
Germany – the area with high electricity consumption and low conventional generation ca-
pacity – wind energy has been developed mostly in the northern and eastern parts of Ger-
many where comparably higher load factors for wind turbines can be achieved. (DLR et al.,
2012)
The net electricity consumption especially in the control area of the transmission system op-
erator (TSO) “50Hertz Transmission GmbH” (50Hertz) is comparably low while large base
load capacities such as lignite-fired power plants have a high share in electricity production.
(50Hertz, 2012a)
Furthermore, combined heat and power (CHP) associated with large district heating grids
plays a major role in the control area of 50Hertz (AGFW 2011). On the other hand the trans-
mission capacities of the interconnectors to neighboring control areas in Germany, Poland,
Denmark and the Czech Republic are progressively not sufficient (foremost at times with
high wind generation and a low load in the control area) to integrate all amounts of renewa-
ble generation. The incidence of single interconnection lines having been re-dispatched or
that renewable generation has to be shut down is increasing. The situation becomes highly
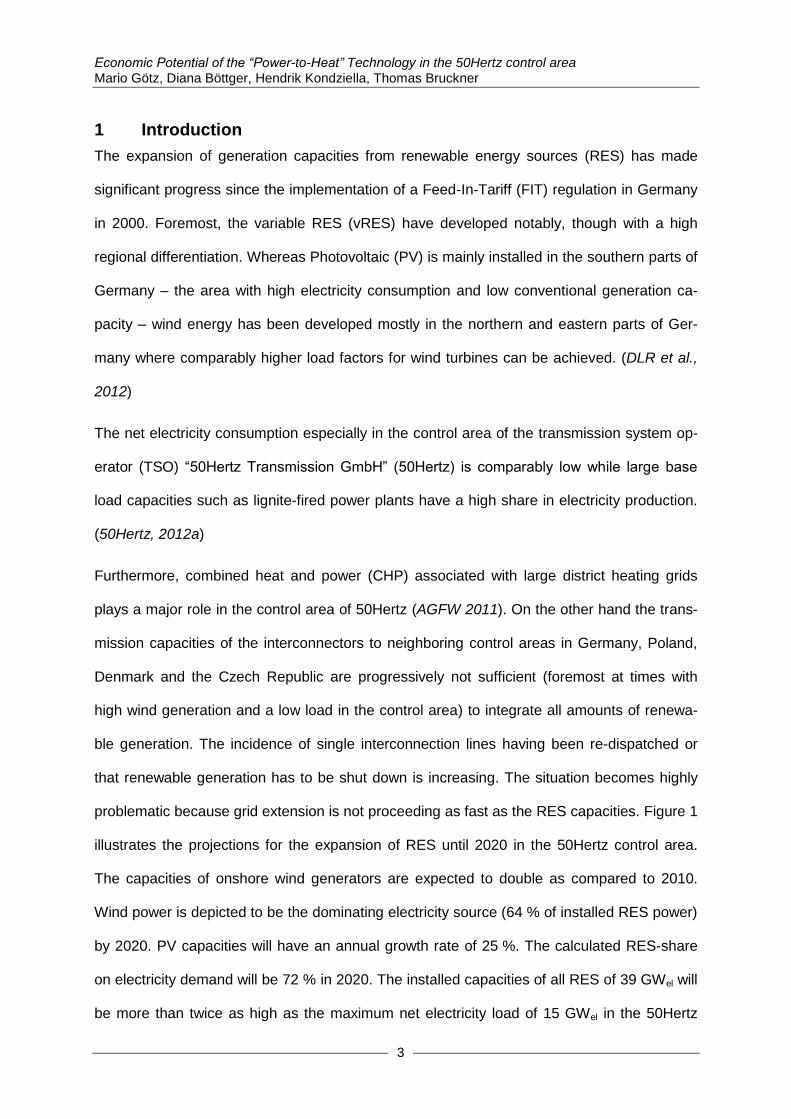
problematic because grid extension is not proceeding as fast as the RES capacities. Figure 1
illustrates the projections for the expansion of RES until 2020 in the 50Hertz control area.
The capacities of onshore wind generators are expected to double as compared to 2010.
Wind power is depicted to be the dominating electricity source (64 % of installed RES power)
by 2020. PV capacities will have an annual growth rate of 25 %. The calculated RES-share
on electricity demand will be 72 % in 2020. The installed capacities of all RES of 39 GWel will
be more than twice as high as the maximum net electricity load of 15 GWel in the 50Hertz
Economic Potential of the “Power-to-Heat” Technology in the 50Hertz control area Mario Götz, Diana Böttger, Hendrik Kondziella, Thomas Bruckner
4
control area. Under certain conditions, the total demand in the control area will be covered by
wind and PV systems – even today.
Figure 1: Projections of RES generation capacities until 2020 (Source: 50Hertz, 2012b)
In addition to measures to grid expansion and retrofitting, future flexibilities within the system
can be identified and used. One possibility pertains to the use of excessive electricity from
RES to generate heat in district heating systems. In this paper the economic potential of the
Power-to-Heat technology in large district heating systems is assessed by using an econom-
ic model for CHP/district heating systems. The analysis of the technology encompasses vari-
ous scenarios.
2 Methodology
The assessment of the theoretical potential of P2H in the control area of 50Hertz requires the
analysis of the data of the local district heating systems as well as the development of syn-
thetic heat demand curves. They base on historical district heating demand curves of the
district heating systems of the cities of Würzburg (2001), Berlin (2007) and Leipzig (2010).
Via the correlation between outside temperature, date and historical heat demand, synthetic
heat profiles on the basis of local outside temperatures at the relevant district heating grids
can be constructed.
11
18
25 1.2
6
11
1.3
2
3
0.3
0.3
0.3
0
5
10
15
20
25
30
35
40
45
2010 2014 2020
Inst
alle
d c
apac
ity
[GW
]
Other
Biomass
PV
Wind
max. net load
Economic Potential of the “Power-to-Heat” Technology in the 50Hertz control area Mario Götz, Diana Böttger, Hendrik Kondziella, Thomas Bruckner
5
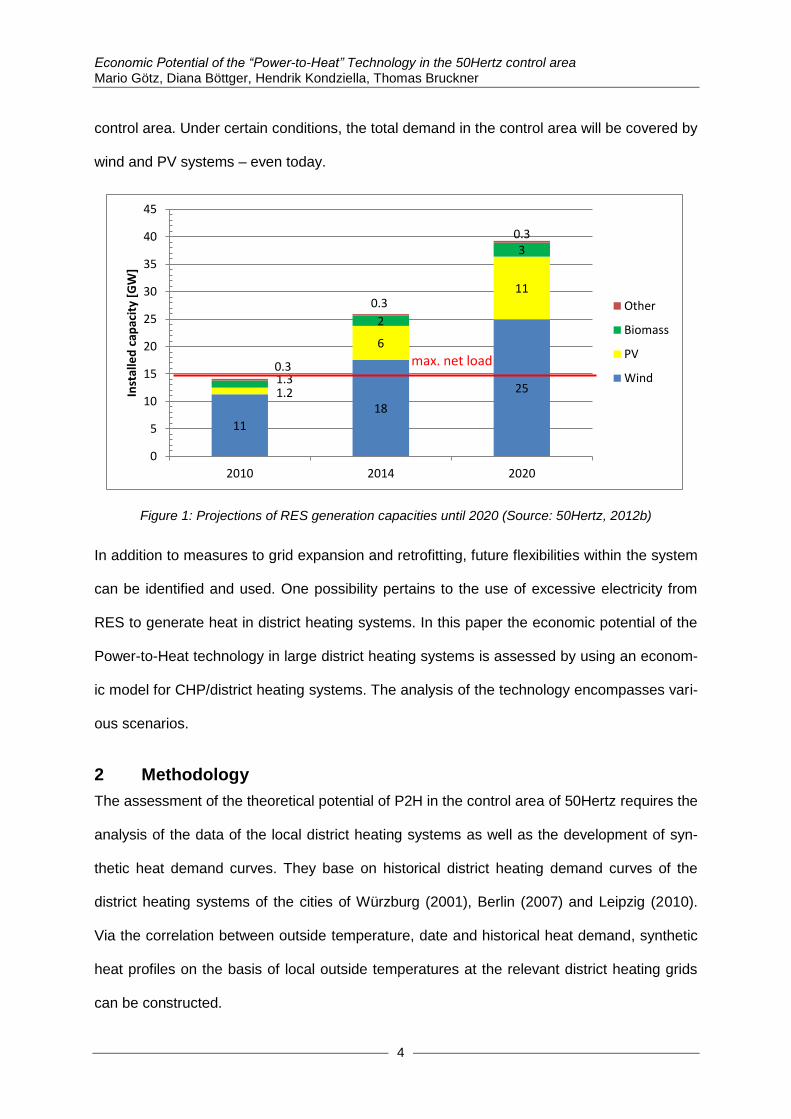
Figure 2 manifests the calculation of the technical potential on the supply and demand side
for the years 2014 and 2020. This is conducted by considering technical restrictions and the
feed-in of RES.
The European power plant dispatch model MICOES-Europe5 produces hourly price forward
curves (HPFC) for the years 2014 and 2020 using assumptions on the development of the
economic and technical parameters taken from the Network Development Plan (Netzentwick-
lungsplan 2012; ÜNB (2012)) and DLR et al. (2012). The assumptions concerning fuel prices
and net electricity consumption are summarized in Table 1. Together with historical control
power prices from 2010 the HPFC serves as input parameter for the model “P2H”. With the
model “P2H” six large district heating systems, including CHP-plants, boilers, heat storages
and P2H-systems, can be analyzed.
Figure 2: Methodology of assessing the economic potential of P2H
5
A short description of the model MICOES-Europe can be found in the appendix.
Economic Potential of the “Power-to-Heat” Technology in the 50Hertz control area Mario Götz, Diana Böttger, Hendrik Kondziella, Thomas Bruckner
6
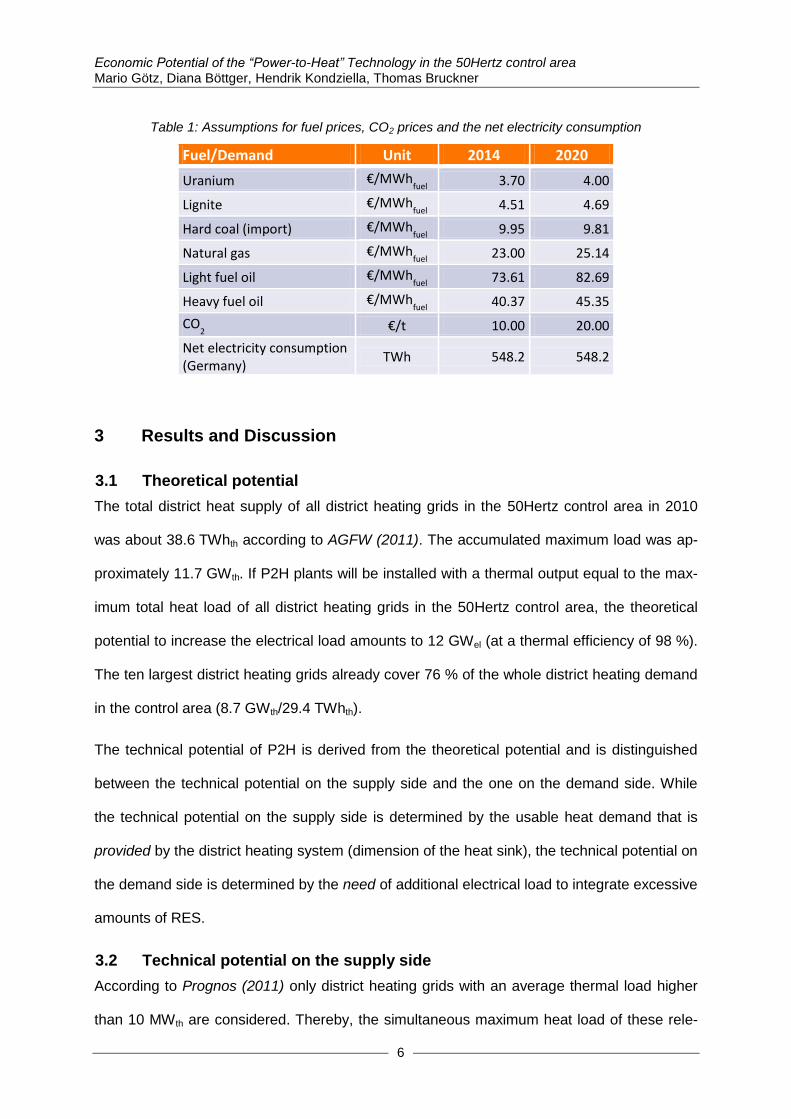
Table 1: Assumptions for fuel prices, CO2 prices and the net electricity consumption
Fuel/Demand Unit 2014 2020 Uranium €/MWh
fuel 3.70 4.00
Lignite €/MWhfuel
4.51 4.69 Hard coal (import) €/MWh
fuel 9.95 9.81
Natural gas €/MWhfuel
23.00 25.14 Light fuel oil €/MWh
fuel 73.61 82.69
Heavy fuel oil €/MWhfuel
40.37 45.35 CO
2 €/t 10.00 20.00
Net electricity consumption (Germany) TWh 548.2 548.2
3 Results and Discussion
3.1 Theoretical potential
The total district heat supply of all district heating grids in the 50Hertz control area in 2010
was about 38.6 TWhth according to AGFW (2011). The accumulated maximum load was ap-
proximately 11.7 GWth. If P2H plants will be installed with a thermal output equal to the max-
imum total heat load of all district heating grids in the 50Hertz control area, the theoretical
potential to increase the electrical load amounts to 12 GWel (at a thermal efficiency of 98 %).
The ten largest district heating grids already cover 76 % of the whole district heating demand
in the control area (8.7 GWth/29.4 TWhth).
The technical potential of P2H is derived from the theoretical potential and is distinguished
between the technical potential on the supply side and the one on the demand side. While
the technical potential on the supply side is determined by the usable heat demand that is
provided by the district heating system (dimension of the heat sink), the technical potential on
the demand side is determined by the need of additional electrical load to integrate excessive
amounts of RES.
3.2 Technical potential on the supply side
According to Prognos (2011) only district heating grids with an average thermal load higher
than 10 MWth are considered. Thereby, the simultaneous maximum heat load of these rele-
Economic Potential of the “Power-to-Heat” Technology in the 50Hertz control area Mario Götz, Diana Böttger, Hendrik Kondziella, Thomas Bruckner
7
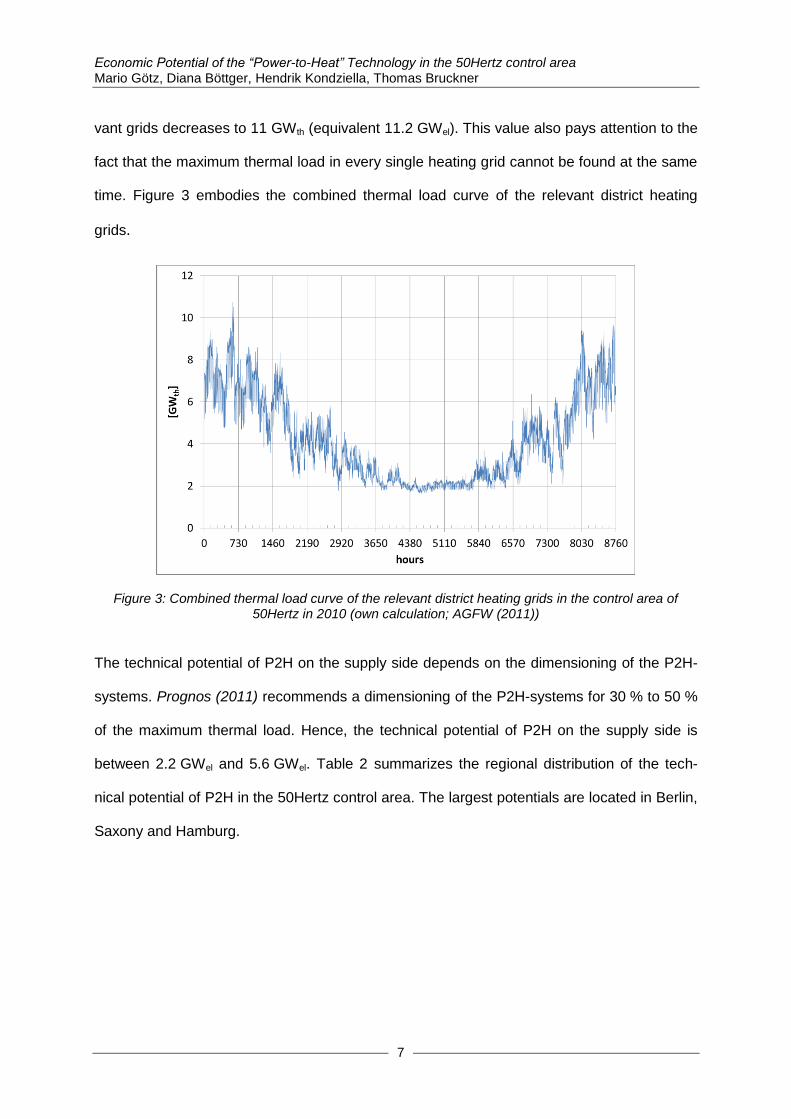
vant grids decreases to 11 GWth (equivalent 11.2 GWel). This value also pays attention to the
fact that the maximum thermal load in every single heating grid cannot be found at the same
time. Figure 3 embodies the combined thermal load curve of the relevant district heating
grids.
Figure 3: Combined thermal load curve of the relevant district heating grids in the control area of 50Hertz in 2010 (own calculation; AGFW (2011))
The technical potential of P2H on the supply side depends on the dimensioning of the P2H-
systems. Prognos (2011) recommends a dimensioning of the P2H-systems for 30 % to 50 %
of the maximum thermal load. Hence, the technical potential of P2H on the supply side is
between 2.2 GWel and 5.6 GWel. Table 2 summarizes the regional distribution of the tech-
nical potential of P2H in the 50Hertz control area. The largest potentials are located in Berlin,
Saxony and Hamburg.
Economic Potential of the “Power-to-Heat” Technology in the 50Hertz control area Mario Götz, Diana Böttger, Hendrik Kondziella, Thomas Bruckner
8
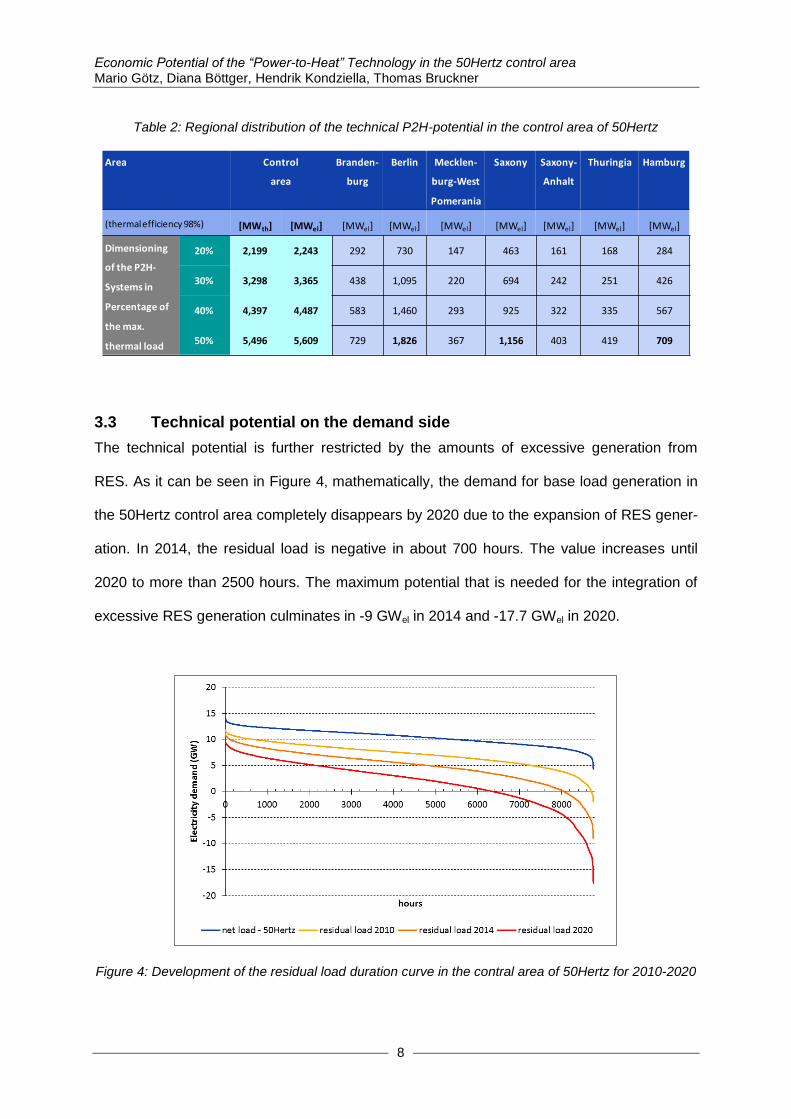
Table 2: Regional distribution of the technical P2H-potential in the control area of 50Hertz
3.3 Technical potential on the demand side
The technical potential is further restricted by the amounts of excessive generation from
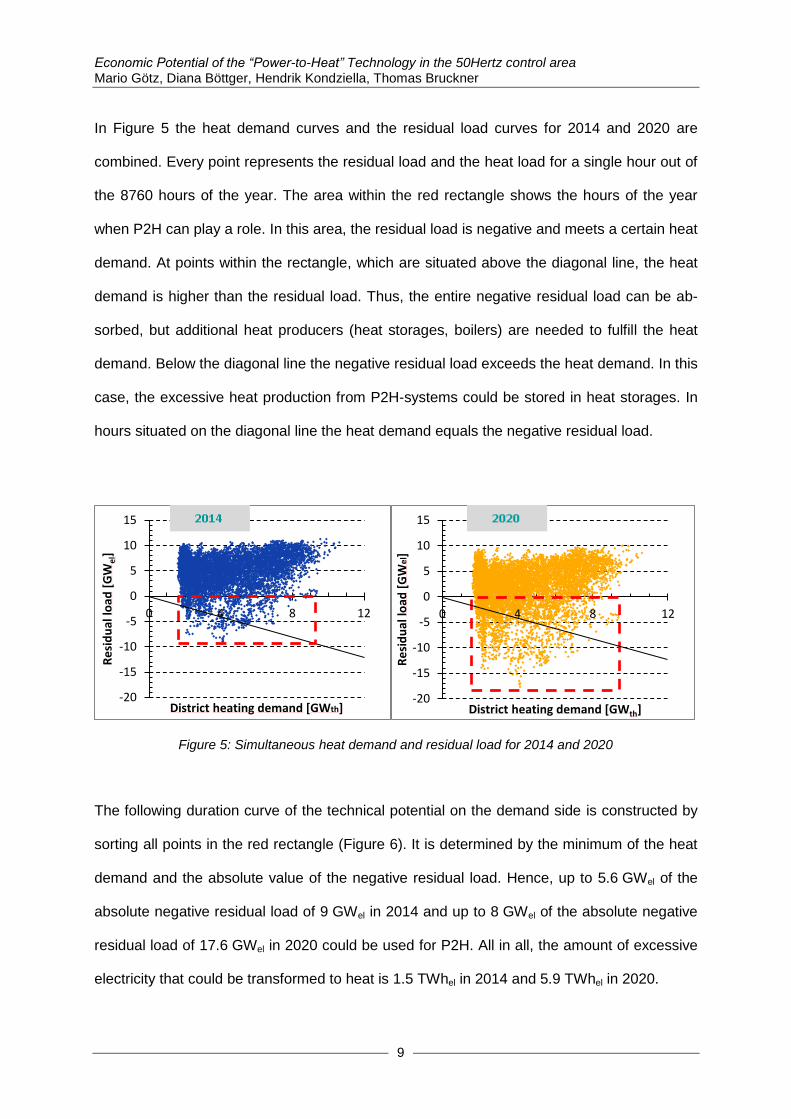
RES. As it can be seen in Figure 4, mathematically, the demand for base load generation in
the 50Hertz control area completely disappears by 2020 due to the expansion of RES gener-
ation. In 2014, the residual load is negative in about 700 hours. The value increases until
2020 to more than 2500 hours. The maximum potential that is needed for the integration of
excessive RES generation culminates in -9 GWel in 2014 and -17.7 GWel in 2020.
Figure 4: Development of the residual load duration curve in the contral area of 50Hertz for 2010-2020
Area Control
area
Branden-
burg
Berlin Mecklen-
burg-West
Pomerania
Saxony Saxony-
Anhalt
Thuringia Hamburg
(thermal efficiency 98%) [MWth] [MWel] [MWel] [MWel] [MWel] [MWel] [MWel] [MWel] [MWel]
Dimensioning
of the P2H-
Systems in
Percentage of
the max.
thermal load
20% 2,199 2,243 292 730 147 463 161 168 284
30% 3,298 3,365 438 1,095 220 694 242 251 426
40% 4,397 4,487 583 1,460 293 925 322 335 567
50% 5,496 5,609 729 1,826 367 1,156 403 419 709
Economic Potential of the “Power-to-Heat” Technology in the 50Hertz control area Mario Götz, Diana Böttger, Hendrik Kondziella, Thomas Bruckner
9
In Figure 5 the heat demand curves and the residual load curves for 2014 and 2020 are
combined. Every point represents the residual load and the heat load for a single hour out of
the 8760 hours of the year. The area within the red rectangle shows the hours of the year
when P2H can play a role. In this area, the residual load is negative and meets a certain heat
demand. At points within the rectangle, which are situated above the diagonal line, the heat
demand is higher than the residual load. Thus, the entire negative residual load can be ab-
sorbed, but additional heat producers (heat storages, boilers) are needed to fulfill the heat
demand. Below the diagonal line the negative residual load exceeds the heat demand. In this
case, the excessive heat production from P2H-systems could be stored in heat storages. In
hours situated on the diagonal line the heat demand equals the negative residual load.
Figure 5: Simultaneous heat demand and residual load for 2014 and 2020
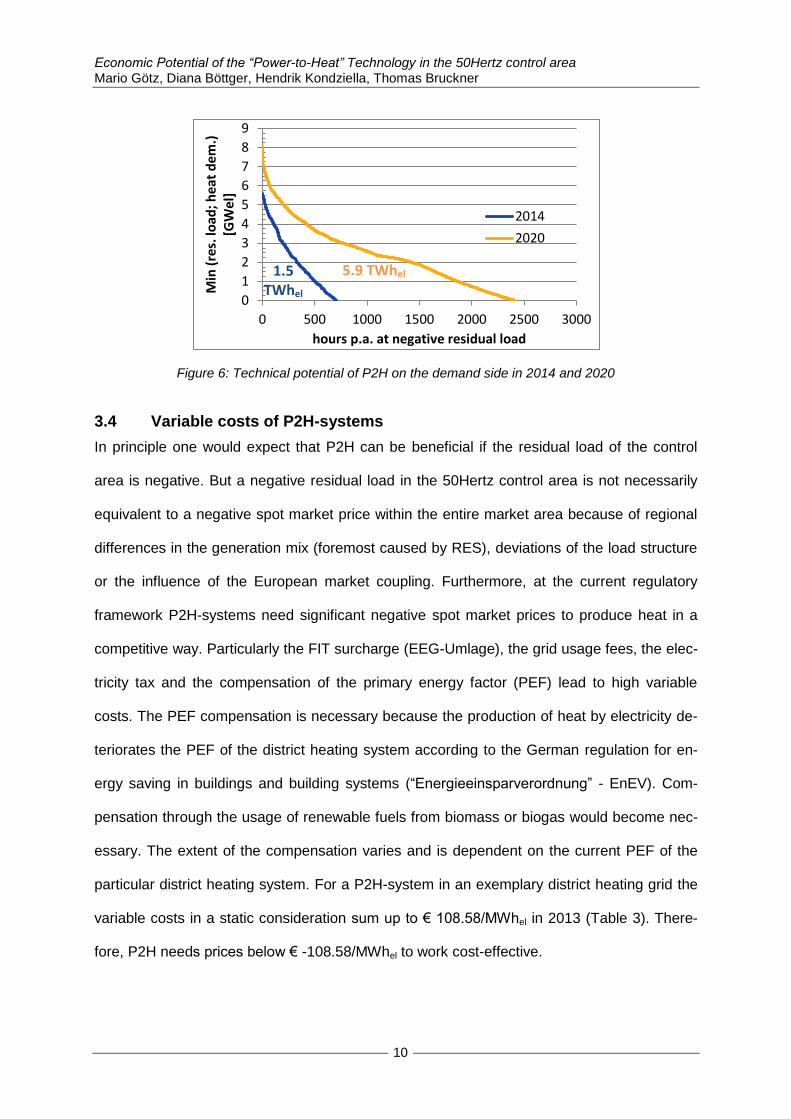
The following duration curve of the technical potential on the demand side is constructed by
sorting all points in the red rectangle (Figure 6). It is determined by the minimum of the heat
demand and the absolute value of the negative residual load. Hence, up to 5.6 GWel of the
absolute negative residual load of 9 GWel in 2014 and up to 8 GWel of the absolute negative
residual load of 17.6 GWel in 2020 could be used for P2H. All in all, the amount of excessive
electricity that could be transformed to heat is 1.5 TWhel in 2014 and 5.9 TWhel in 2020.
-20
-15
-10
-5
0
5
10
15
0 4 8 12
Re
sid
ual
load
[G
Wel
]
District heating demand [GWth] -20
-15
-10
-5
0
5
10
15
0 4 8 12
Re
sid
ual
load
[G
Wel
]
District heating demand [GWth]
Economic Potential of the “Power-to-Heat” Technology in the 50Hertz control area Mario Götz, Diana Böttger, Hendrik Kondziella, Thomas Bruckner
10
Figure 6: Technical potential of P2H on the demand side in 2014 and 2020
3.4 Variable costs of P2H-systems
In principle one would expect that P2H can be beneficial if the residual load of the control
area is negative. But a negative residual load in the 50Hertz control area is not necessarily
equivalent to a negative spot market price within the entire market area because of regional
differences in the generation mix (foremost caused by RES), deviations of the load structure
or the influence of the European market coupling. Furthermore, at the current regulatory
framework P2H-systems need significant negative spot market prices to produce heat in a
competitive way. Particularly the FIT surcharge (EEG-Umlage), the grid usage fees, the elec-
tricity tax and the compensation of the primary energy factor (PEF) lead to high variable
costs. The PEF compensation is necessary because the production of heat by electricity de-
teriorates the PEF of the district heating system according to the German regulation for en-
ergy saving in buildings and building systems (“Energieeinsparverordnung” - EnEV). Com-
pensation through the usage of renewable fuels from biomass or biogas would become nec-
essary. The extent of the compensation varies and is dependent on the current PEF of the
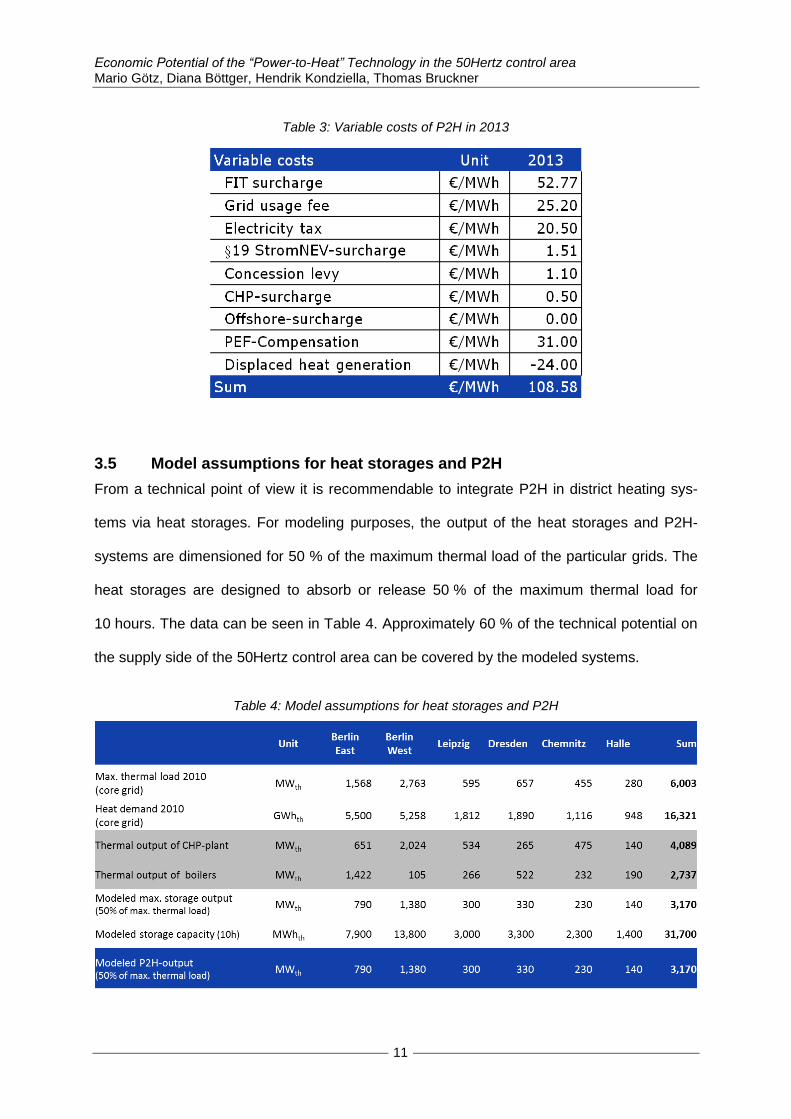
particular district heating system. For a P2H-system in an exemplary district heating grid the
variable costs in a static consideration sum up to € 108.58/MWhel in 2013 (Table 3). There-
fore, P2H needs prices below € -108.58/MWhel to work cost-effective.
0
1
2
3
4
5
6
7
8
9
0 500 1000 1500 2000 2500 3000
Min
(re
s. lo
ad; h
eat
dem
.)
[GW
el]
hours p.a. at negative residual load
2014
2020
1.5 TWhel
5.9 TWhel
Economic Potential of the “Power-to-Heat” Technology in the 50Hertz control area Mario Götz, Diana Böttger, Hendrik Kondziella, Thomas Bruckner
11
Table 3: Variable costs of P2H in 2013
3.5 Model assumptions for heat storages and P2H
From a technical point of view it is recommendable to integrate P2H in district heating sys-
tems via heat storages. For modeling purposes, the output of the heat storages and P2H-
systems are dimensioned for 50 % of the maximum thermal load of the particular grids. The
heat storages are designed to absorb or release 50 % of the maximum thermal load for
10 hours. The data can be seen in Table 4. Approximately 60 % of the technical potential on
the supply side of the 50Hertz control area can be covered by the modeled systems.
Table 4: Model assumptions for heat storages and P2H
Economic Potential of the “Power-to-Heat” Technology in the 50Hertz control area Mario Götz, Diana Böttger, Hendrik Kondziella, Thomas Bruckner
12
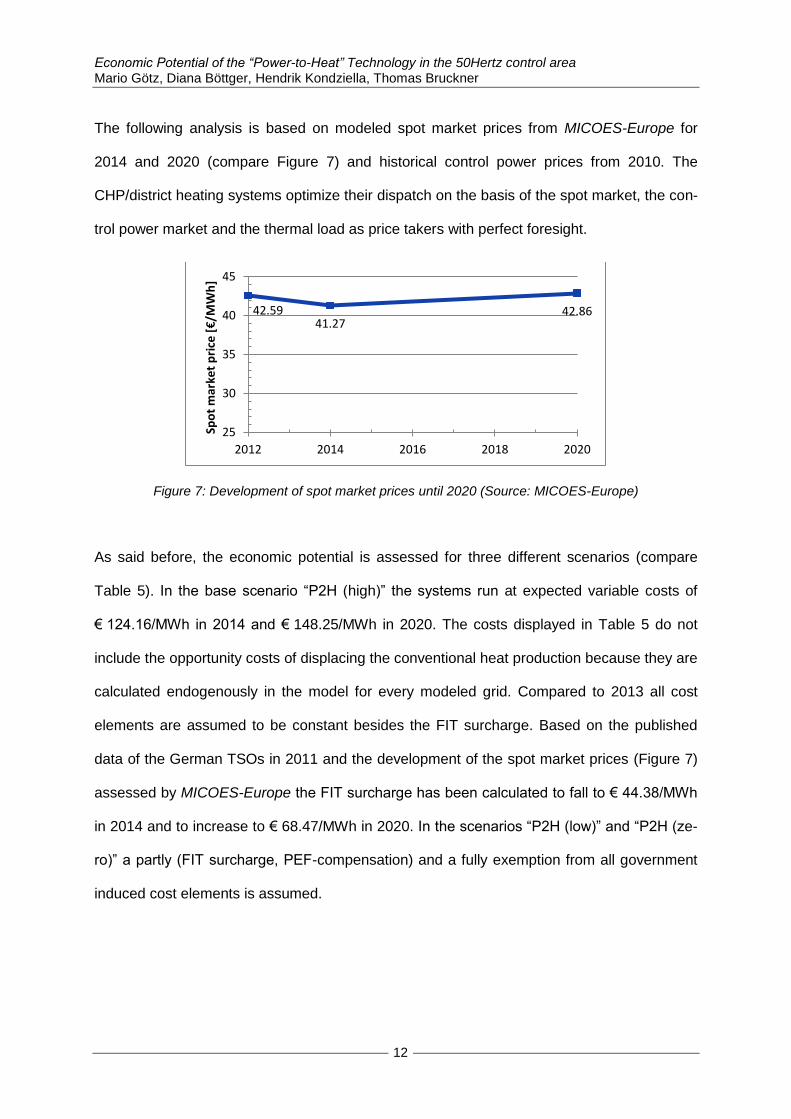
The following analysis is based on modeled spot market prices from MICOES-Europe for
2014 and 2020 (compare Figure 7) and historical control power prices from 2010. The
CHP/district heating systems optimize their dispatch on the basis of the spot market, the con-
trol power market and the thermal load as price takers with perfect foresight.
Figure 7: Development of spot market prices until 2020 (Source: MICOES-Europe)
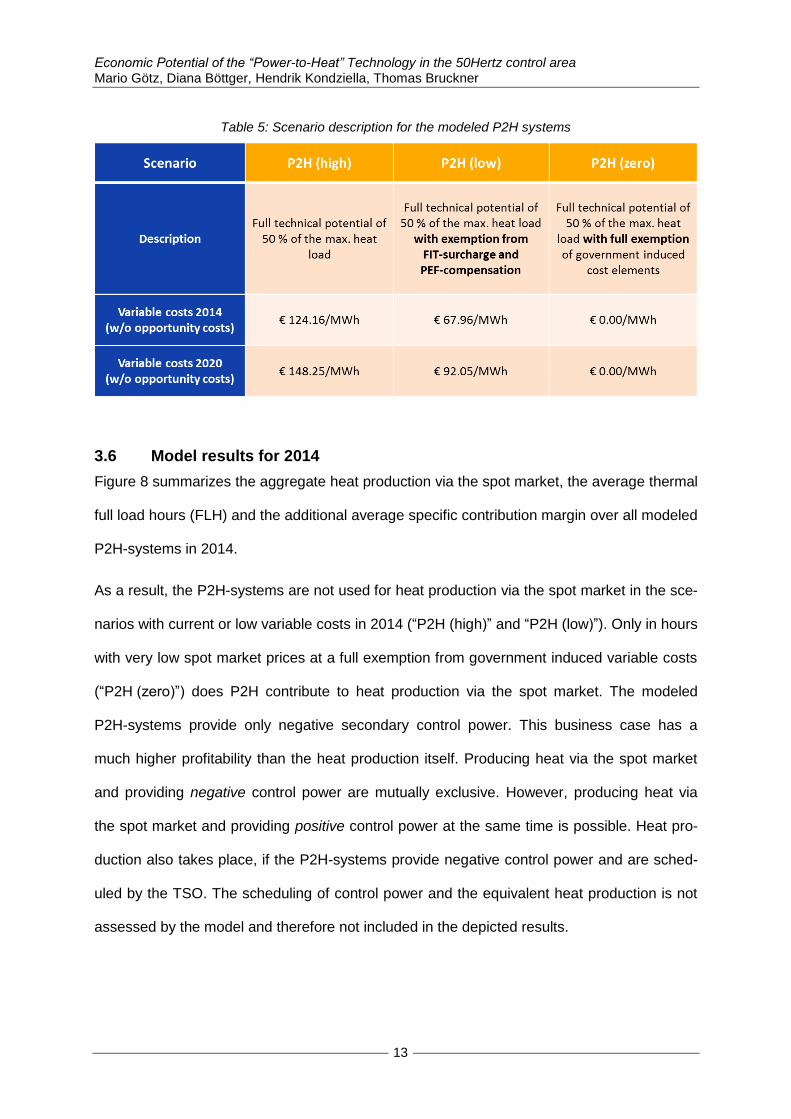
As said before, the economic potential is assessed for three different scenarios (compare
Table 5). In the base scenario “P2H (high)” the systems run at expected variable costs of
€ 124.16/MWh in 2014 and € 148.25/MWh in 2020. The costs displayed in Table 5 do not
include the opportunity costs of displacing the conventional heat production because they are
calculated endogenously in the model for every modeled grid. Compared to 2013 all cost
elements are assumed to be constant besides the FIT surcharge. Based on the published
data of the German TSOs in 2011 and the development of the spot market prices (Figure 7)
assessed by MICOES-Europe the FIT surcharge has been calculated to fall to € 44.38/MWh
in 2014 and to increase to € 68.47/MWh in 2020. In the scenarios “P2H (low)” and “P2H (ze-
ro)” a partly (FIT surcharge, PEF-compensation) and a fully exemption from all government
induced cost elements is assumed.
42.59 41.27
42.86
25
30
35
40
45
2012 2014 2016 2018 2020
Spo
t m
arke
t p
rice
[€
/MW
h]
Economic Potential of the “Power-to-Heat” Technology in the 50Hertz control area Mario Götz, Diana Böttger, Hendrik Kondziella, Thomas Bruckner
13
Table 5: Scenario description for the modeled P2H systems
3.6 Model results for 2014
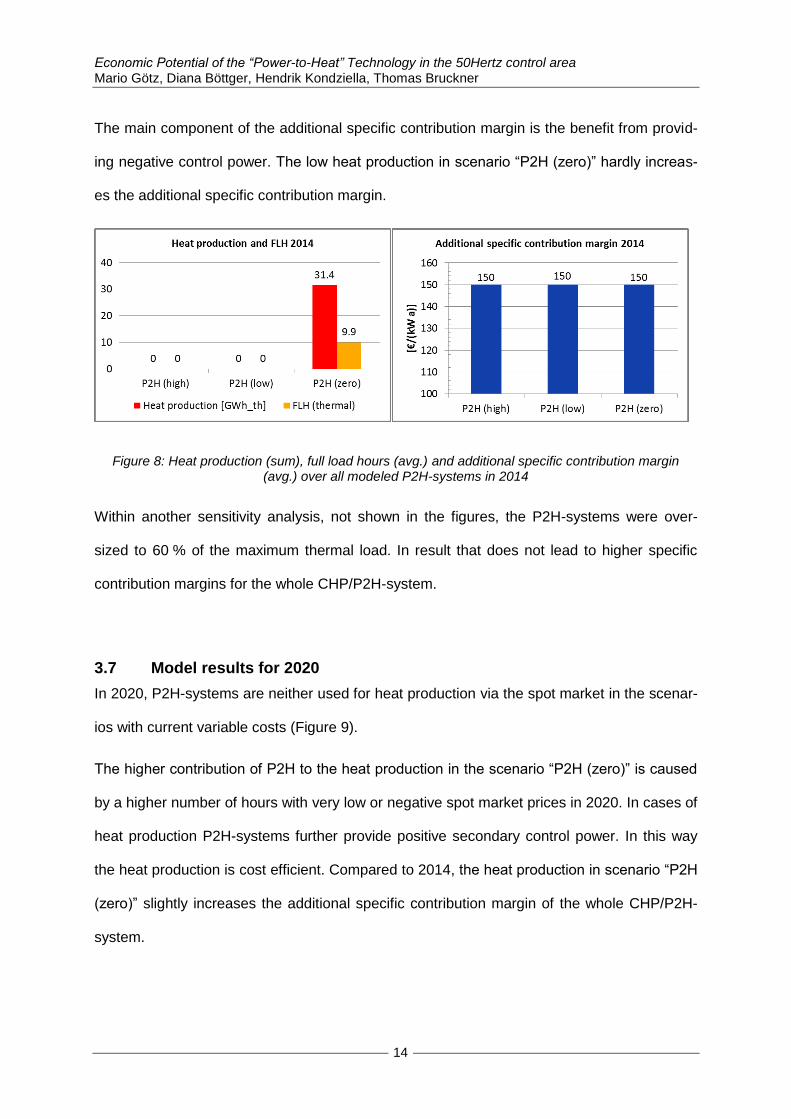
Figure 8 summarizes the aggregate heat production via the spot market, the average thermal
full load hours (FLH) and the additional average specific contribution margin over all modeled
P2H-systems in 2014.
As a result, the P2H-systems are not used for heat production via the spot market in the sce-
narios with current or low variable costs in 2014 (“P2H (high)” and “P2H (low)”). Only in hours
with very low spot market prices at a full exemption from government induced variable costs
(“P2H (zero)”) does P2H contribute to heat production via the spot market. The modeled
P2H-systems provide only negative secondary control power. This business case has a
much higher profitability than the heat production itself. Producing heat via the spot market
and providing negative control power are mutually exclusive. However, producing heat via
the spot market and providing positive control power at the same time is possible. Heat pro-
duction also takes place, if the P2H-systems provide negative control power and are sched-
uled by the TSO. The scheduling of control power and the equivalent heat production is not
assessed by the model and therefore not included in the depicted results.
Economic Potential of the “Power-to-Heat” Technology in the 50Hertz control area Mario Götz, Diana Böttger, Hendrik Kondziella, Thomas Bruckner
14
The main component of the additional specific contribution margin is the benefit from provid-
ing negative control power. The low heat production in scenario “P2H (zero)” hardly increas-
es the additional specific contribution margin.
Figure 8: Heat production (sum), full load hours (avg.) and additional specific contribution margin (avg.) over all modeled P2H-systems in 2014
Within another sensitivity analysis, not shown in the figures, the P2H-systems were over-
sized to 60 % of the maximum thermal load. In result that does not lead to higher specific
contribution margins for the whole CHP/P2H-system.
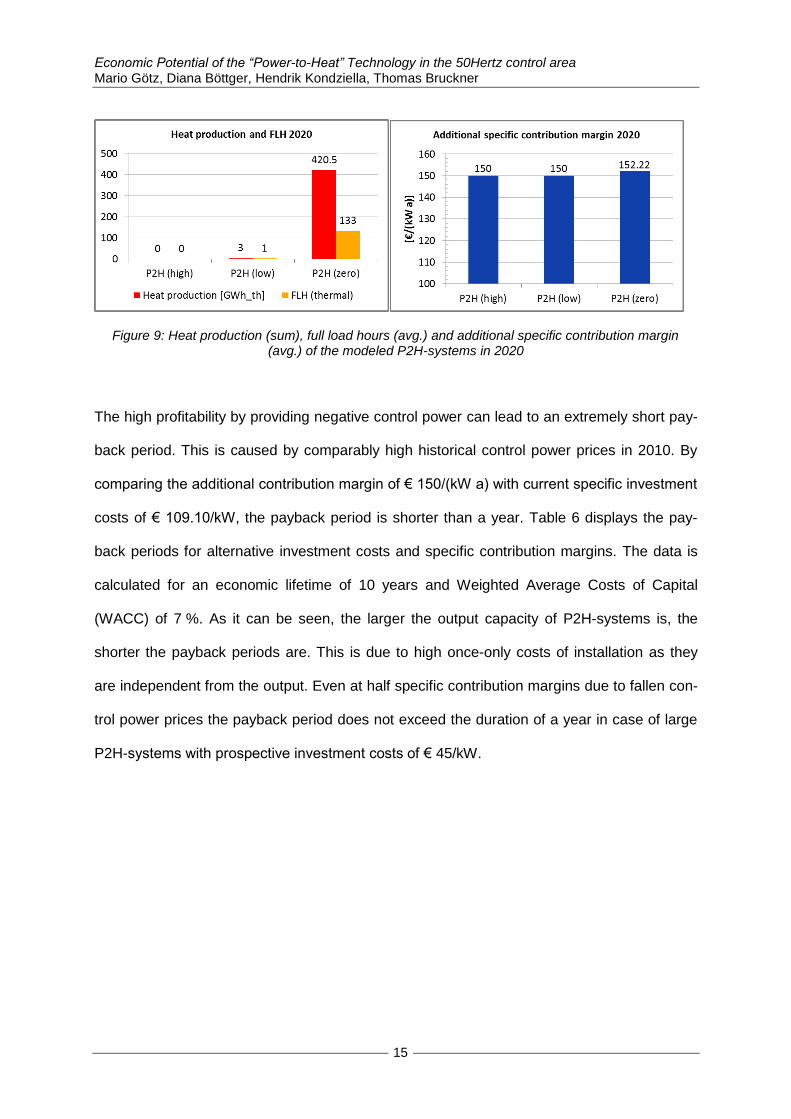
3.7 Model results for 2020
In 2020, P2H-systems are neither used for heat production via the spot market in the scenar-
ios with current variable costs (Figure 9).
The higher contribution of P2H to the heat production in the scenario “P2H (zero)” is caused
by a higher number of hours with very low or negative spot market prices in 2020. In cases of
heat production P2H-systems further provide positive secondary control power. In this way
the heat production is cost efficient. Compared to 2014, the heat production in scenario “P2H
(zero)” slightly increases the additional specific contribution margin of the whole CHP/P2H-
system.
Economic Potential of the “Power-to-Heat” Technology in the 50Hertz control area Mario Götz, Diana Böttger, Hendrik Kondziella, Thomas Bruckner
15
Figure 9: Heat production (sum), full load hours (avg.) and additional specific contribution margin (avg.) of the modeled P2H-systems in 2020
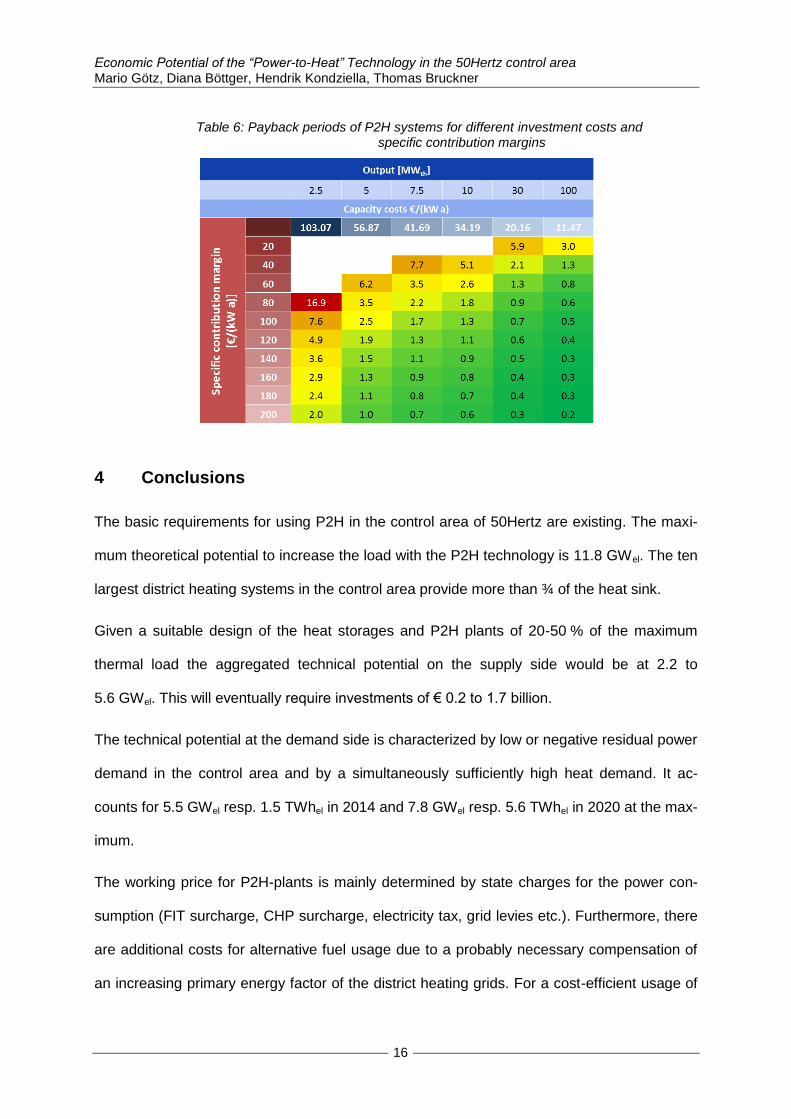
The high profitability by providing negative control power can lead to an extremely short pay-
back period. This is caused by comparably high historical control power prices in 2010. By
comparing the additional contribution margin of € 150/(kW a) with current specific investment
costs of € 109.10/kW, the payback period is shorter than a year. Table 6 displays the pay-
back periods for alternative investment costs and specific contribution margins. The data is
calculated for an economic lifetime of 10 years and Weighted Average Costs of Capital
(WACC) of 7 %. As it can be seen, the larger the output capacity of P2H-systems is, the
shorter the payback periods are. This is due to high once-only costs of installation as they
are independent from the output. Even at half specific contribution margins due to fallen con-
trol power prices the payback period does not exceed the duration of a year in case of large
P2H-systems with prospective investment costs of € 45/kW.
Economic Potential of the “Power-to-Heat” Technology in the 50Hertz control area Mario Götz, Diana Böttger, Hendrik Kondziella, Thomas Bruckner
16
Table 6: Payback periods of P2H systems for different investment costs and specific contribution margins
4 Conclusions
The basic requirements for using P2H in the control area of 50Hertz are existing. The maxi-
mum theoretical potential to increase the load with the P2H technology is 11.8 GWel. The ten
largest district heating systems in the control area provide more than ¾ of the heat sink.
Given a suitable design of the heat storages and P2H plants of 20-50 % of the maximum
thermal load the aggregated technical potential on the supply side would be at 2.2 to
5.6 GWel. This will eventually require investments of € 0.2 to 1.7 billion.
The technical potential at the demand side is characterized by low or negative residual power
demand in the control area and by a simultaneously sufficiently high heat demand. It ac-
counts for 5.5 GWel resp. 1.5 TWhel in 2014 and 7.8 GWel resp. 5.6 TWhel in 2020 at the max-
imum.
The working price for P2H-plants is mainly determined by state charges for the power con-
sumption (FIT surcharge, CHP surcharge, electricity tax, grid levies etc.). Furthermore, there
are additional costs for alternative fuel usage due to a probably necessary compensation of
an increasing primary energy factor of the district heating grids. For a cost-efficient usage of
Economic Potential of the “Power-to-Heat” Technology in the 50Hertz control area Mario Götz, Diana Böttger, Hendrik Kondziella, Thomas Bruckner
17
P2H-plants wholesale power prices below € -98.60/MWh in 2014 and below € -120.31/MWh
in 2020 are necessary.
The negative wholesale power prices in the base scenario are not sufficient for the usage of
the P2H-plants for heat production via the spot market in 2014 at current variable costs.
Nevertheless, the P2H-plants are able to generate high returns with the provision of negative
secondary control power (additional specific contribution margin of about € 150/(kW a)).
Possible exemptions from the network usage fees and the compensation of the primary en-
ergy factor are not sufficient to use the P2H systems for heat production via the spot market.
Only with a total exemption of the additional costs (grid usage fees, electricity tax, FIT sur-
charge, the compensation of the primary energy factor etc.) would P2H-plants be used for
heat production. Nevertheless, a wide exemption from state charges should be discussed
and considered due to the superior importance of P2H for the entire system.
5 References
50Hertz (2012a): Load in the control area. Publication on the homepage of the grid operator,
retrieved from: http://www.50hertz.com/de/2017.htm (27 September 2012).
50Hertz (2012b): Expected development of the installed capacities of renewable energies.
Personal message (27 September 2012).
AGFW (2011): AGFW-Hauptbericht 2010. Extended version for AGFW-members, authorities
and research institutes. AGFW – Der Energieeffizienzverband für Wärme, Kälte und KWK
e.V., Frankfurt a. M.
DLR, IWES, IfnE (2012): Long term scenarios and strategies for the extension of renewable
energies in Germany under consideration of the development in Europe and global – Final
report.
Prognos (2011): Contributions of heat storages for the integration of renewable energies.
Study on behalf of AGFW, Berlin.
Economic Potential of the “Power-to-Heat” Technology in the 50Hertz control area Mario Götz, Diana Böttger, Hendrik Kondziella, Thomas Bruckner
18
Theofilidi (2008): Development of a mixed integer optimization model for unit commitment
and its application to the German electricity market, Master thesis, TU Berlin.
ÜNB (2012): Grid development plan power 2012. 2. Revised draft of the transmission system
operators, retrieved from: http://www.netzentwicklungsplan.de/content/
netzentwicklungsplan-2012-2-entwurf (15 August 2012).
6 Appendix
Description of the power market model “MICOES-Europe“
The power market model “MICOES” which is used at the Chair for Energy Management and
Sustainability at the University of Leipzig is based on a Master´s Thesis supervised by Prof.
Bruckner at the TU Berlin (Theofilidi, 2008) from 2008. Since then it was further improved at
the University of Leipzig. In 2012, it was expanded from a national model for Germany to a
model which covers most European countries.
The electricity market model used for the investigation is a fundamental model of the Euro-
pean power plant fleet, which uses a mixed-integer optimization to calculate estimates for the
day-ahead spot market prices for each modeled country. For every hour of the analyzed
years the model identifies those power plants that cover the electricity demand and the de-
mand for balancing power at minimum cost.
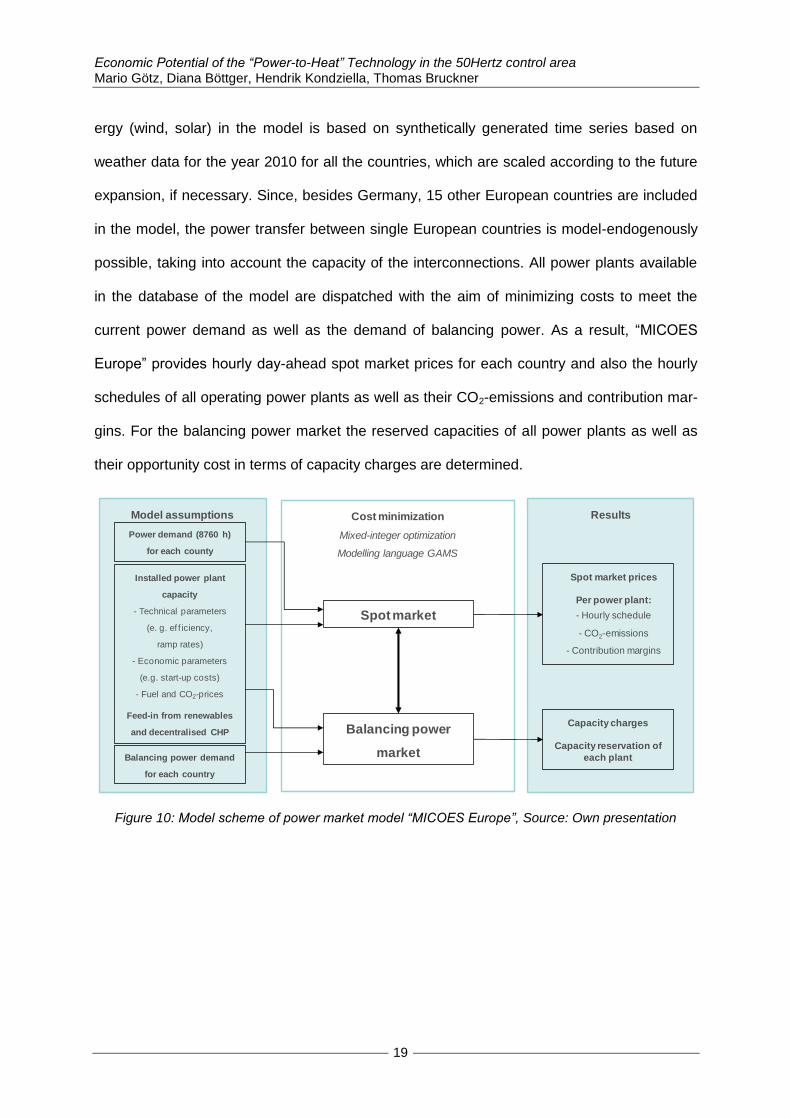
Figure 10 illustrates the used power market model schematically. As input data for the model
the hourly electricity demand of each modeled country and the demand for balancing power
as well as a database with the European power plants is used. This database contains in
particular the efficiency, maximum power and minimum load, as well as maximum power rate
of change (“ramp rates”) and minimal operation and downtime for conventional power plants.
Furthermore, it integrates the start-up costs (taking into account the time a plant was offline)
as well as the cost of fuel beyond additional variable costs. In addition, the database contains
the installed capacity of renewable energies. The power supply of fluctuating renewable en-
Economic Potential of the “Power-to-Heat” Technology in the 50Hertz control area Mario Götz, Diana Böttger, Hendrik Kondziella, Thomas Bruckner
19
ergy (wind, solar) in the model is based on synthetically generated time series based on
weather data for the year 2010 for all the countries, which are scaled according to the future
expansion, if necessary. Since, besides Germany, 15 other European countries are included
in the model, the power transfer between single European countries is model-endogenously
possible, taking into account the capacity of the interconnections. All power plants available
in the database of the model are dispatched with the aim of minimizing costs to meet the
current power demand as well as the demand of balancing power. As a result, “MICOES
Europe” provides hourly day-ahead spot market prices for each country and also the hourly
schedules of all operating power plants as well as their CO2-emissions and contribution mar-
gins. For the balancing power market the reserved capacities of all power plants as well as
their opportunity cost in terms of capacity charges are determined.
Figure 10: Model scheme of power market model “MICOES Europe”, Source: Own presentation
ResultsCost minimization
Mixed-integer optimization
Modelling language GAMS
Model assumptions
Installed power plant
capacity
- Technical parameters
(e. g. ef f iciency,
ramp rates)
- Economic parameters
(e.g. start-up costs)
- Fuel and CO2-prices
Feed-in from renewables
and decentralised CHP
Power demand (8760 h)
for each county
Spot market prices
Per power plant:
- Hourly schedule
- CO2-emissions
- Contribution margins
Capacity charges
Capacity reservation of
each plant
Spot market
Balancing power
marketBalancing power demand
for each country