Embed Size (px)
Citation preview
1Technical Features
NOVember 2013 waTer
ABSTRACTEnergy is the second largest cost to a water utility, behind manpower, and it is forecast to significantly increase. Not only does the urban water cycle need energy to operate, it also contains both thermal and chemical energy.
Researchers have identified that the urban water cycle in Amsterdam has enough potential energy to offset all of the greenhouse gas emissions presently emitted to operate it. One method used to recover this potential available energy is to extract heat from sewers.
The first examples appeared in Europe over 30 years ago, and there are now over 500 wastewater heat pumps in use worldwide. Our challenge was to determine if heat extraction from sewers was both technically and commercially viable in Melbourne. It was found that while it would be technically feasible in Melbourne, it was, however, not presently commercially viable for the site tested. To make such a project commercially viable future natural gas price increases in the order of 260%, or market demand to offset electrical heating instead of gas, are needed.
INTRODUCTIONA study of Melbourne forecasts that the energy required to provide water services into the future could increase by between 50% and 300% by 2045, depending on the form of urban development, residential water use and type of water supply adopted (Kenway et al., 2008). Not only will energy demand increase, energy market modelling undertaken for the water industry out to 2032 concluded that electricity prices for industrial customers in Melbourne could increase in the order of 1.5 to 2 times in the same period (SKM MMA, 2012).
Not only does water need energy to be delivered, it also contains both thermal and chemical energy. Analysing
the potential available energy in the water cycle of Amsterdam, van der Hoek (2012) identified that Amsterdam could achieve greenhouse gas neutrality for its operation if all of this potential energy could be recovered.
One method already adopted internationally is to recover heat energy from sewers. The theoretical potential heat recovery from a sewer is about 12kW per litre per second of wastewater flow rate, assuming a 3°C temperature drop in the energy recovery heat exchanger.
The first installations were built more than 30 years ago; the first example is at the Touring Club Switzerland in Emmen near Luzern, where a wastewater heat pump has been extracting energy from wastewater to heat the office buildings since 1979 (WWT, 2011).
Today there are over 500 wastewater heat pumps operating worldwide, with heating capacities ranging between 10kW and 20MW (Schmid, 2008). CRM (2005) considers that a heat pump needs to have a heating capacity of at least 130kW for a sewer heat recovery project to be efficient and cost-effective. Smaller systems are possible; however, the unit costs of the system would be greater.
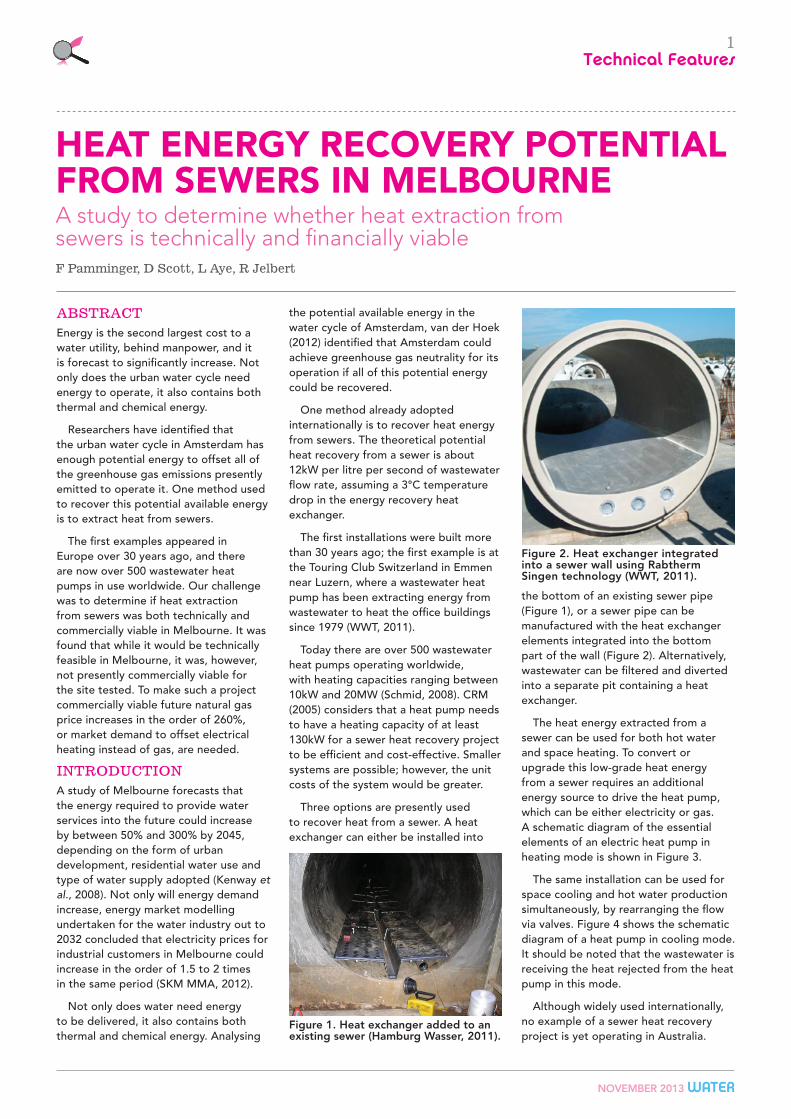
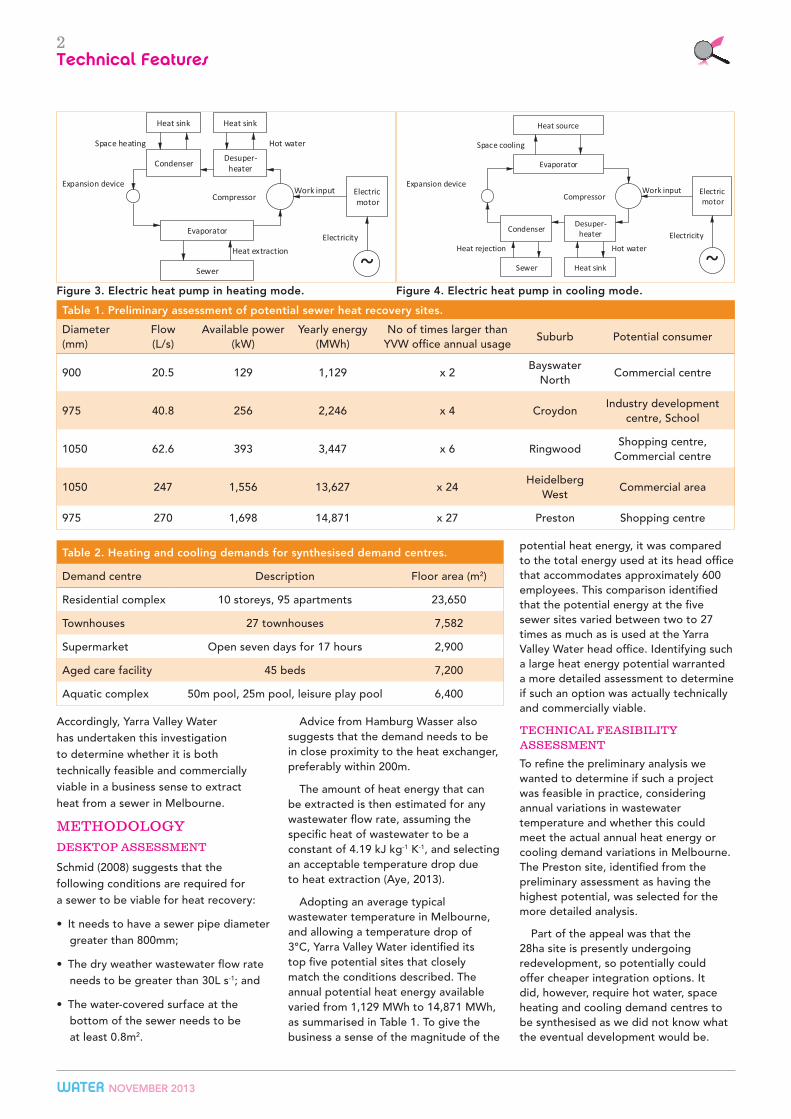
Three options are presently used to recover heat from a sewer. A heat exchanger can either be installed into
the bottom of an existing sewer pipe (Figure 1), or a sewer pipe can be manufactured with the heat exchanger elements integrated into the bottom part of the wall (Figure 2). Alternatively, wastewater can be filtered and diverted into a separate pit containing a heat exchanger.
The heat energy extracted from a sewer can be used for both hot water and space heating. To convert or upgrade this low-grade heat energy from a sewer requires an additional energy source to drive the heat pump, which can be either electricity or gas. A schematic diagram of the essential elements of an electric heat pump in heating mode is shown in Figure 3.
The same installation can be used for space cooling and hot water production simultaneously, by rearranging the flow via valves. Figure 4 shows the schematic diagram of a heat pump in cooling mode. It should be noted that the wastewater is receiving the heat rejected from the heat pump in this mode.
Although widely used internationally, no example of a sewer heat recovery project is yet operating in Australia.
HEAT ENERGY RECOVERY POTENTIAL FROM SEWERS IN MELBOURNEA study to determine whether heat extraction from sewers is technically and financially viableF Pamminger, D Scott, L Aye, R Jelbert
Figure 1. Heat exchanger added to an existing sewer (Hamburg Wasser, 2011).
Figure 2. Heat exchanger integrated into a sewer wall using rabtherm Singen technology (WWT, 2011).
2Technical Features
waTer NOVember 2013
Accordingly, Yarra Valley Water has undertaken this investigation to determine whether it is both technically feasible and commercially viable in a business sense to extract heat from a sewer in Melbourne.
METHODOLOGY
DESkTOP ASSESSMENT
Schmid (2008) suggests that the following conditions are required for a sewer to be viable for heat recovery:
• It needs to have a sewer pipe diameter greater than 800mm;
• The dry weather wastewater flow rate needs to be greater than 30L s-1; and
• The water-covered surface at the bottom of the sewer needs to be at least 0.8m2.
Advice from Hamburg Wasser also suggests that the demand needs to be in close proximity to the heat exchanger, preferably within 200m.
The amount of heat energy that can be extracted is then estimated for any wastewater flow rate, assuming the specific heat of wastewater to be a constant of 4.19 kJ kg-1 K-1, and selecting an acceptable temperature drop due to heat extraction (Aye, 2013).
Adopting an average typical wastewater temperature in Melbourne, and allowing a temperature drop of 3°C, Yarra Valley Water identified its top five potential sites that closely match the conditions described. The annual potential heat energy available varied from 1,129 MWh to 14,871 MWh, as summarised in Table 1. To give the business a sense of the magnitude of the
potential heat energy, it was compared to the total energy used at its head office that accommodates approximately 600 employees. This comparison identified that the potential energy at the five sewer sites varied between two to 27 times as much as is used at the Yarra Valley Water head office. Identifying such a large heat energy potential warranted a more detailed assessment to determine if such an option was actually technically and commercially viable.
TECHNICAL FEASIBILITY ASSESSMENT
To refine the preliminary analysis we wanted to determine if such a project was feasible in practice, considering annual variations in wastewater temperature and whether this could meet the actual annual heat energy or cooling demand variations in Melbourne. The Preston site, identified from the preliminary assessment as having the highest potential, was selected for the more detailed analysis.
Part of the appeal was that the 28ha site is presently undergoing redevelopment, so potentially could offer cheaper integration options. It did, however, require hot water, space heating and cooling demand centres to be synthesised as we did not know what the eventual development would be.
Figure 3. electric heat pump in heating mode. Figure 4. electric heat pump in cooling mode.
Table 1. Preliminary assessment of potential sewer heat recovery sites.
Diameter (mm)
Flow (L/s)
Available power (kW)
Yearly energy (MWh)
No of times larger than YVW office annual usage
Suburb Potential consumer
900 20.5 129 1,129 x 2Bayswater
NorthCommercial centre
975 40.8 256 2,246 x 4 CroydonIndustry development
centre, School
1050 62.6 393 3,447 x 6 RingwoodShopping centre,
Commercial centre
1050 247 1,556 13,627 x 24Heidelberg
WestCommercial area
975 270 1,698 14,871 x 27 Preston Shopping centre
Table 2. Heating and cooling demands for synthesised demand centres.
Demand centre Description Floor area (m2)
Residential complex 10 storeys, 95 apartments 23,650
Townhouses 27 townhouses 7,582
Supermarket Open seven days for 17 hours 2,900
Aged care facility 45 beds 7,200
Aquatic complex 50m pool, 25m pool, leisure play pool 6,400

3Technical Features
NOVember 2013 waTer
We used this opportunity to synthesise
a development comprising five different
building types (demand centres), each
chosen to test different potential demand
profiles. These included a 10-storey
residential complex, a cluster of 27
townhouses, a supermarket, an aged care
facility and an aquatic centre. The design
details of each of these are summarised
in Table 2 and are shown in Figure 5 to
highlight the physical proximity to the
existing sewer.
Sewer temperature variations at
the site were monitored and displayed
consistent variability throughout the
monitoring period with temperatures
varying between 13.1°C and 21.1°C,
as shown in Figure 6. This does reflect
theory, which indicates that seasonal
soil temperature fluctuations decrease
with depth, stabilising at about 6m for
clay type of ground (Williams and Gold,
1976). The sewer depth at this location
is approximately 6m.
The technical feasibility study examined both the theoretical potential useful heat that can be obtained by recovering heat from the sewer, and the theoretical potential useful cooling that can be obtained by rejecting the heat to the sewer. Demand included the provision of hot water, space heating and space cooling. Alternative technology options available were considered, together with the method of heat distribution and impacts of heat extraction from the sewer.
Climate data collated for a typical meteorological year for Melbourne (Morrison and Litvak, 1999) and the estimated annual heating demands were used to estimate the annual hourly demand profile. The heating load capacity demand profile for a typical week in July was adopted, while the heating season was selected to be between mid-May and mid-September. The maximum peak heating demand is estimated to be 0.85MW. The maximum peak cooling demand is estimated to be 1.3MW. The assumed cooling season was adopted to run between December and February. The cooling load capacity demand profile for a typical week in December was adopted.
Transient system simulation modelling was then undertaken to quantify the potential heating and cooling that the chosen sewer could deliver. TEMPEST V1.01 (Durrenmatt and Wanner, 2008) and TRNSYS 17 software (Klein et al., 2012) were used. A typical water-to-water heat pump with a nominal heating capacity of 2.3MW was selected for the analysis to determine the maximum possible environmental impacts, and the simulations run for a seven-day period for each season.
COMMERCIAL vIABILITY ASSESSMENT
Costs were sourced for both capital expenditure and anticipated annual operations and maintenance costs. Capital costs included sewer heat exchangers, sewer installation, pipework, heat pump, circulation pumps, hot water heat exchangers, external heat pump plant room enclosure, and controls and monitoring. Operating costs were made up from electricity consumptions of the heat pump and circulation pumps, and system maintenance. Translating this notional development into an actual project would be anticipated to increase costs because factors such as road closures, disruption to existing services, engineering and design services, and
Figure 6. Variation in sewer temperature.
Figure 5. Synthesised potential demand centres.

4Technical Features
waTer NOVember 2013
authority cost have not been included. A Net Present Value (NPV) assessment was undertaken of all costs, together with potential revenue streams.
RESULTS AND DISCUSSIONTECHNICAL FEASIBILITY
The annual total heat demand (i.e. combined hot water and space heating demand) of the synthesised development is estimated to be 3,063 MWh, and the annual total cooling demand is estimated to be 768 MWh. The aquatic centre has the largest heat demand (64%), while the aged care facility has the largest cooling demand (37%). The distribution of load among different demand centres is shown in Table 3.
The technical study identified that it was feasible to use the sewer as a heat source or heat sink. If a gas engine-driven heat pump was selected, which is more efficient at recovering heat energy than an electric heat pump, the potential annual total heat supplied could be up to 34,020MWh, of which 20,150MWh is recovered from the sewer (this compares favourably with the quick desktop analysis that estimated a heat energy potential of 14,871MWh).
The potential annual total cooling supplied was 15,460 MWh. The average heating capacities are 2.9MW and 3.9MW for an electric heat pump and gas engine driven heat pump respectively. The average cooling capacity is 1.8MW. Considering that the hot water and space heating demand, together with the space cooling demand of the synthesised development, are 3,063 MWh and 768 MWh respectively, and the peak demand capacities are 0.85MW for heating and 1.3MW for cooling, full heating and cooling of the development at the site could easily be achieved.
The length of heat exchanger required has been estimated using data from CRM (2008) and sourced from a product manufacturer (Rabtherm, 2012). Rabtherm has a product that can be used for either heat recovery or heat rejection. A schematic diagram for a heating application is shown in Figure 7. The heat exchanger transfers heat from the wastewater and then supplies this to a heat pump for upgrading. The required heat exchanger length can be estimated using the average heat transfer capacities listed in Table 4.
A 975mm sewer could expect a minimum heat transfer capacity of
5.8kW of heating per m length of sewer using this technology. The length of heat exchanger required if an electric heat pump is used with a 1MW heating capacity, with a 722kW heat extraction rate, is 125m. If a natural gas engine driven heat pump is used, the heat exchanger length can be reduced to 92m.
IMPACT ON SEwERAGE SYSTEM
Using a sewer for either heat extraction for heating or heat rejection to provide cooling will change the temperature of the wastewater in the sewer. Viability needs to be suitably designed so that there is no adverse impact on operating the sewer, and the downstream treatment plant. Schmid (2008) quotes the Association of Swiss Wastewater and Water protection experts recommending that the temperature of wastewater should not be reduced below 10°C at the point where wastewater enters the sewage treatment plant.
In this case study the sewer is many kilometres from the sewage treatment plant, with many downstream inputs, hence there will be negligible impact on the sewage treatment plant. Locally, however, the temperature will drop to a minimum of 8.4° C at 2,000m downstream of the extraction point when 2.3MW of heat is extracted. It is well above the freezing point of sewage (approximately –2.5°C), therefore there will not be a risk of freezing the wastewater. When the wastewater is used for cooling, the temperature of wastewater is estimated to increase to about 26°C if the average heat rejection rate is 2.3MW.
Table 3. Heating and cooling demands for synthesised demand centres.
Demand centreHot water
(MWh)Space heating
(MWh)Heat demand
(MWh)Space cooling
(MWh)
Multi-storey residential24 x 1 bedrooms57 x 2 bedrooms14 x 3 bedrooms
37.6129.444.2
84.9233.465.1
122.5362.8109.3
43.4119.433.3
27 Townhouses 114.8 250.6 365.5 128.3
Supermarket 6.4 36.7 43.1 115.2
Aged care facility 84.2 21.0 105.2 285.9
Aquatic complex 1,893.3 61.7 1,955.0 42.3
Total 2,309.9 753.4 3,063.3 767.9
Figure 7. In-situ heat exchanger (rabtherm, 2012).
Table 4. Average heat transfer capacity of heat exchanger for heating.
Sewer diameter (mm)
Area of heat exchanger
(m2/m)1
Heat transfer capacity (kW/m2)2
500 0.75 4.0
750 1.15 4.6
900 1.30 5.2
1050 1.60 6.4
1275 2.10 8.4
Notes: CRM (2008) Assumed average specific heat extraction rate = 4 kW/m2; Rabtherm (2012)

5Technical Features
NOVember 2013 waTer
COMMERCIAL vIABILITY
The total construction and installation cost for the proposed system (1MW with an electric heat pump) was estimated to be AU$1,710,100 and the annual operating cost was AU$154,454.
Details of capital and operating costs are listed in Table 5 and Table 6.
Comparing this against the alternative heating option that uses natural gas, which is sold at 3.14 c/kWh, it is not presently economically feasible to operate a sewer heat recovery system of this size at this location. Natural gas prices would need to increase to 8.2 c/kWh before it was economically viable. Alternatively, an option that may prove to be more economically viable would be a large heating or cooling demand centre that uses electricity rather than gas, as the cost of electricity is presently approximately five times that of gas for the same energy content.
A number of alternative options were investigated to determine if these would change the commercial business viability. These included reducing the sewer construction cost and including the value of the non-tangible benefits of such a project. An argument could be made to reduce the sewer construction cost if the heat recovery system were installed when a new sewer was laid, because it would not be an incremental cost. The non-tangible benefits were estimated to provide an additional
income of 2% of the project value for the first three years of operation and 1% of the project value for the two years after that. Both options were helpful in bringing the project closer to commercial viability, but neither was able to make the project commercially viable at this location.
COMPARISON wITH EUROPEAN CONDITIONS
Sewer heat exchanger systems are successfully installed in many countries including Switzerland, Germany and Austria. We were, therefore, interested in quantifying the climatic differences between northern Europe and Melbourne to assess if this could be a large contributor to making such projects viable there and not here. It is presumed by the large number of systems already installed that they are economically feasible at these other locations.
The ambient air temperature difference between Stuttgart, Germany and Melbourne has been used for this analysis. Temperature data of Stuttgart has been shifted six months and overlaid against Melbourne temperatures to allow a direct visual comparison. This is shown in Figure 8. The temperature differences have also been analysed to determine the proportion of time that the temperature in each city is less than 15°C, and less than 10°C. A summary is shown in Table 7.
The countries where the sewer heat exchange systems operate successfully have a significantly colder climate than Melbourne. Not only is their seasonal heating period longer, but the temperature extremes are significantly lower than we experience in Melbourne. Therefore, they require more heating for a higher proportion of the year and greater quantities of peak heating demand. As a result, the heat exchange system is utilised for a longer period of the year and so improves the payback period of the initial investment.
Another factor favouring the adoption of sewer heat recovery projects in Germany is the higher energy costs. Domestic electricity prices in Germany are double Melbourne prices, and
Table 5. Capital costs.
Equipment Estimated cost
Sewer heat exchangers
$136,100
Sewer installation $356,000
Pipework $462,000
Heat pump $500,000
Circulation pumps $16,000
Hot water heat exchangers
$50,000
External heat pump plant room enclosure
$180,000
Controls and monitoring
$10,000
Total $1,710,100
Table 6. Operating costs.
Equipment Estimated cost
Heat pump $135,660
Circulation pumps $7,274
Maintenance $11,520
Total $154,454
Table 7. Temperature differences between melbourne and Germany.
TemperatureMelbourne,
AustraliaStuttgart, Germany
Temperature ≤ 15°C 54% of year 76% of year
Temperature ≤ 10°C 28% of year 67% of year
Table 8. Heat energy source comparison (melbourne).
Electricity Gas
Prices (AU c/kWh), domestic supply, Germany (Source: Eurostat, 2012) 38.27 9.27
Prices (AU c/kWh), domestic supply, Melbourne 15.50 3.14
GHG Intensity (kg CO2-e/kWh), Victoria (Source: DCCEE, 2012) 1.35 0.22
Figure 8. Temperature difference between melbourne and Stuttgart. Temperature data of Stuttgart has been shifted six months to allow the comparison.

6Technical Features
waTer NOVember 2013
reticulated natural gas is approximately three times higher than in Melbourne (Table 8). These higher energy prices are relatively recent. Electricity prices increased three-fold between 2000 and 2011 (Jardin, 2012). Germany now also has Europe’s highest energy costs. In 2013, energy cost in Germany was also six times more expensive than in the United States (Wikipedia, 2013).
CRITICAL vARIABLES FOR A FAvOURABLE SEwER HEAT RECOvERY PROJECT
In Melbourne, the most economical heating energy is natural gas. This would clearly be the primary energy source to use at sites with a large heating requirement. Natural gas also has a significantly lower greenhouse gas intensity (Table 8).
With the large difference between natural gas and electricity, had this project considered replacing an electrical demand, it would make such a project commercially viable. Therein also presents a future parameter that could make a sewer heat recovery of cooling project viable. Cooling is of particular interest, as cooling in Melbourne is normally provided from chillers driven by an electrical energy source. While potentially ideal, if a site could be found where electricity was to be replaced, an option analysis should also consider using natural gas to power a co-generation or tri-generation plant. However, this does suggest that perhaps in locations where gas is not so readily available, such technology may have a feasible application.
CONCLUSIONSWith increasing energy prices, the concept of recovering heat energy from a sewer is conceptually appealing. The method is widely used internationally but not yet in Australia. Various demand centres including an aquatic centre, supermarket, aged care facility, and high-density residential development were considered. The transient system modelling identified that recovering heat energy from sewers, or using this to provide cooling, is technically feasible. However, at this particular site in Melbourne it was not yet financially viable. This technology may prove more applicable in the following circumstances:
• In areas where there is a higher heating demand;
• Where electricity is used for heating rather than natural gas;
• At a site that has a large cooling demand that is presently powered from electricity; or
• If natural gas prices were to rise to approximately 8.2 c/kWh, from the existing 3.14 c/kWh.
THE AUTHORS
Francis Pamminger (email: [email protected]) is the Manager of Research & Innovation at Yarra Valley Water in Melbourne.
David Scott (email: [email protected]) is a Planning Engineer in the Sustainable Development Group at Yarra Valley Water.
Dr Lu Aye (email: [email protected]) is an Associate Professor and the leader of the Renewable Energy and Energy Efficiency Group, Department of Infrastructure Engineering, at the University of Melbourne.
richard Jelbert (email: [email protected]) is a Senior Sustainability Consultant at Norman Disney & Young, Sustainability Group, Melbourne.
REFERENCESAye L (2013): Heat Recovery from Sewers.
Encyclopaedia of Engineering and
Technology. Taylor & Francis.
CRM (see – Compass Resource Management Ltd) (2005): Sustainable Energy Technology and Resource Assessment for Greater Vancouver, Final Report, pp. x+80.
CRM (see – Compass Resource Management Ltd) (2008): District Energy Consultation Paper, Prepared for: The District of Squamish, pp 1–52.
DCCEE (see – Department of Climate Change and Energy Efficiency) (2012): Australian National Greenhouse Accounts: National Greenhouse Accounts Factors. July 2012. ISBN: 978-1-922003-56-0.
Dürrenmatt DJ & Wanner O (2008): Simulation of the Wastewater Temperature in Sewers with TEMPEST. Water Science & Technology, 57, 11, pp 1809–1815.
Hamburg Wasser (2011): Heat Recovery from Sewage Pilot Project Hamburg, Germany. Presentation delivered to Yarra Valley Water in March 2011 by Lueder Garleff.
Jardin N (2012): Public Presentation at the International Water Association World Congress at Busan, Korea; Ruhrverband, Germany.
Kenway SJ, Turner GM, Cook S & Bayness T (2008): Water-Energy Futures for Melbourne: The Effect of Water Strategies, Water Use and Urban Form. Water for a Healthy Country Flagship Report, CSIRO. October 2008.
Klein SA, Beckman WA, Mitchell JW, Duffie JA, Duffie NA, Freeman TL, Mitchell JC, Braun JE, Evans BL, Kummer JP, Urban RE, Fiksel A, Thornton JW, Blair, NJ, Williams PM, Bradley DE, McDowell TP, Kummert M & Arias DA (2012): TRNSYS 17: A TRaNsient SYstem Simulation Program, Solar Energy Laboratory, University of Wisconsin-Madison.
Morrison G & Litvak A (1999): Condensed Solar Radiation Database for Australia. University of New South Wales, Sydney.
Rabtherm (2012): Sourced from www.rabtherm. Accessed in June 2012.
Schmid F (2008): Sewage Water: Interesting Heat Source from Heat Pumps and Chillers. 9th International IEA Heat Pump Conference, Switzerland. Paper No. 5.22, pp 1–12.
SKM MMA (2012): Energy Price Forecasts 2013 to 2032. Report for the WSAA. 13 November 2012.
Van der Hoek JP (2012): Climate Change Mitigation by Recovery of Energy From the Water Cycle: A New Challenge for Water Management. Water Science & Technology, 65, 1, pp 135–141. IWA Publishing, 2012.
Wikipedia (2013): http://en.wikipedia.org/wiki/Energy_in_Germany. Accessed on 2 July 2013.
Williams GP & Gold LW (1976): Ground Temperatures. Canadian Building Digests, Division of Building Research, National Research Council Canada, UDC 551.525, CBD180-180-4.
WWT (2011): Taking the Heat Out. Water & Wastewater Treatment Magazine. 20 June 2011. (www.edie.net/library/view_article.asp?id=5842&title=Taking+the+heat+out&source=5), Accessed on 19 July 2013.