Embed Size (px)
Citation preview
1
Economic outlook: Indonesia in 2017
Jakarta
10 November 2016
Adrian Panggabean
Chief Economist
Treasury and Capital Market
PT Bank CIMB Niaga Tbk
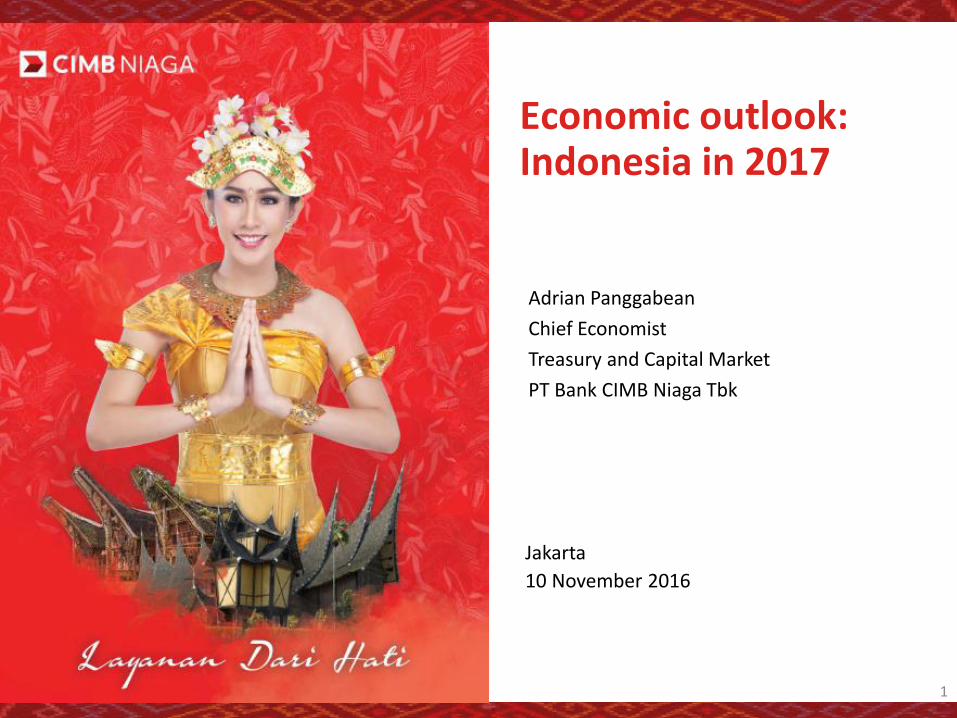
The global context CIMB Group’s global view for 2017: what does it mean for Indonesia?
No Country Growth (%) Inflation (%) Policy rate (%) Exchange Rate
1 US 2.2 1.5 1.25
USD1.05/EUR1.0 Strengthen
2 Eurozone 1.6 1.1 0
3 Japan 0.8 1.1 -0.2 to 0.1 JPY115/USD1.0 Weaken
4 China 6.4 1.6 3.5 RMB6.9/USD1.0 Weaken
• A strong USD benefits Eurozone and Japanese products, who in turn will compete with emerging markets
• A strong USD will hurt emerging market currencies • China weakness (along with its interest to remain competitive) may lead to relative weakness of
RMB that will add pressure to emerging market currencies • China weakness will limit global demand, putting lid on commodity price appreciation
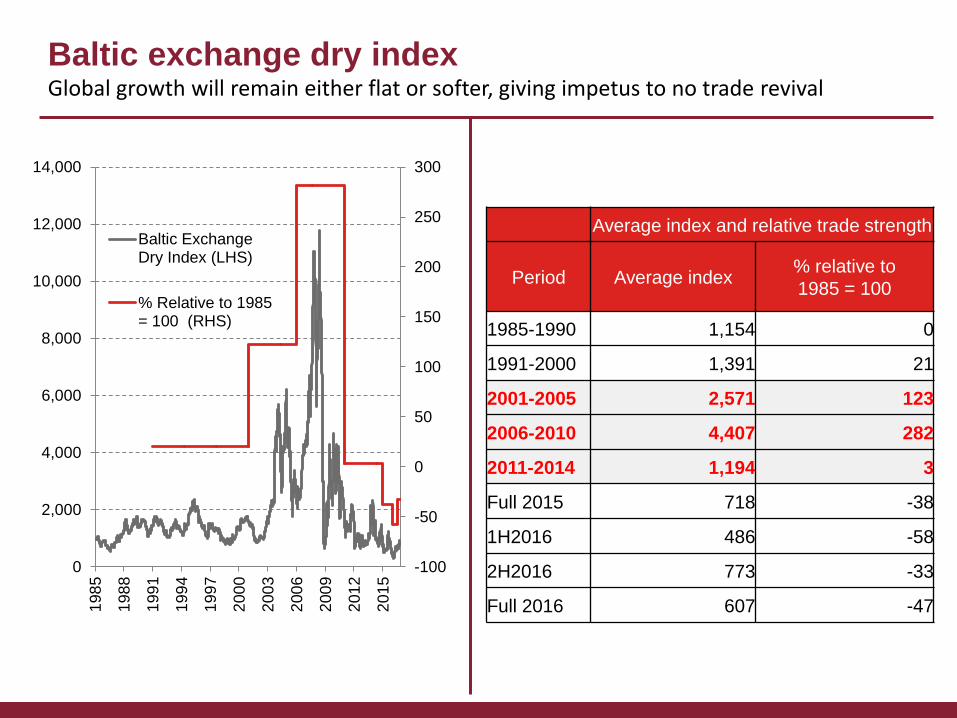
Baltic exchange dry index Global growth will remain either flat or softer, giving impetus to no trade revival
Average index and relative trade strength
Period Average index % relative to
1985 = 100
1985-1990 1,154 0
1991-2000 1,391 21
2001-2005 2,571 123
2006-2010 4,407 282
2011-2014 1,194 3
Full 2015 718 -38
1H2016 486 -58
2H2016 773 -33
Full 2016 607 -47
-100
-50
0
50
100
150
200
250
300
0
2,000
4,000
6,000
8,000
10,000
12,000
14,000
198
5
198
8
199
1
199
4
199
7
200
0
200
3
200
6
200
9
201
2
201
5
Baltic ExchangeDry Index (LHS)
% Relative to 1985= 100 (RHS)
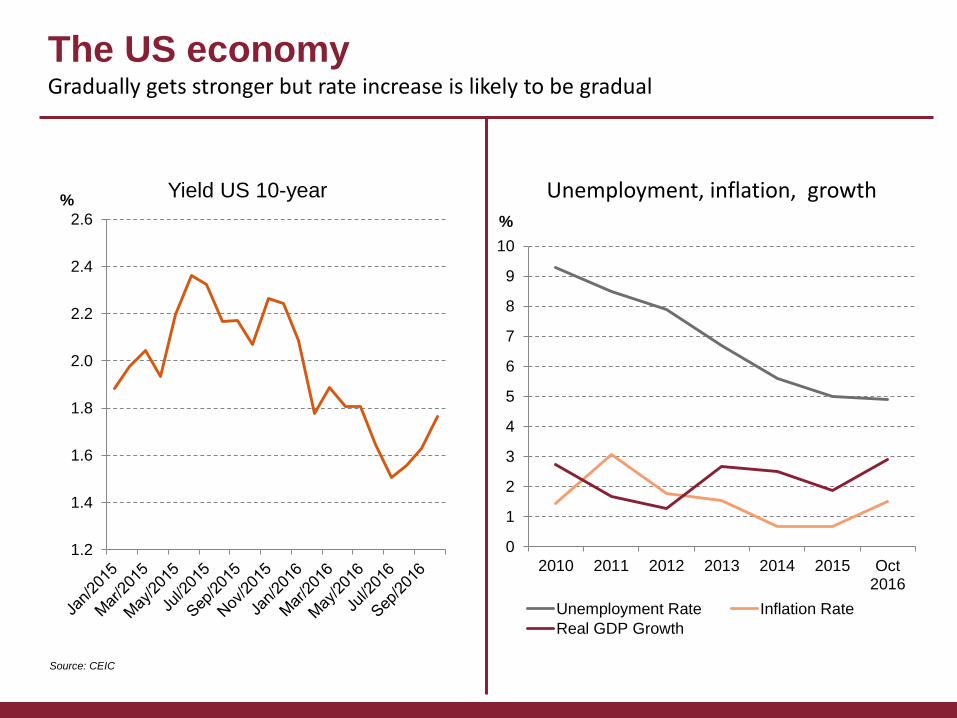
The US economy
Gradually gets stronger but rate increase is likely to be gradual
Source: CEIC
Unemployment, inflation, growth
1.2
1.4
1.6
1.8
2.0
2.2
2.4
2.6
% Yield US 10-year
0
1
2
3
4
5
6
7
8
9
10
2010 2011 2012 2013 2014 2015 Oct2016
%
Unemployment Rate Inflation Rate
Real GDP Growth
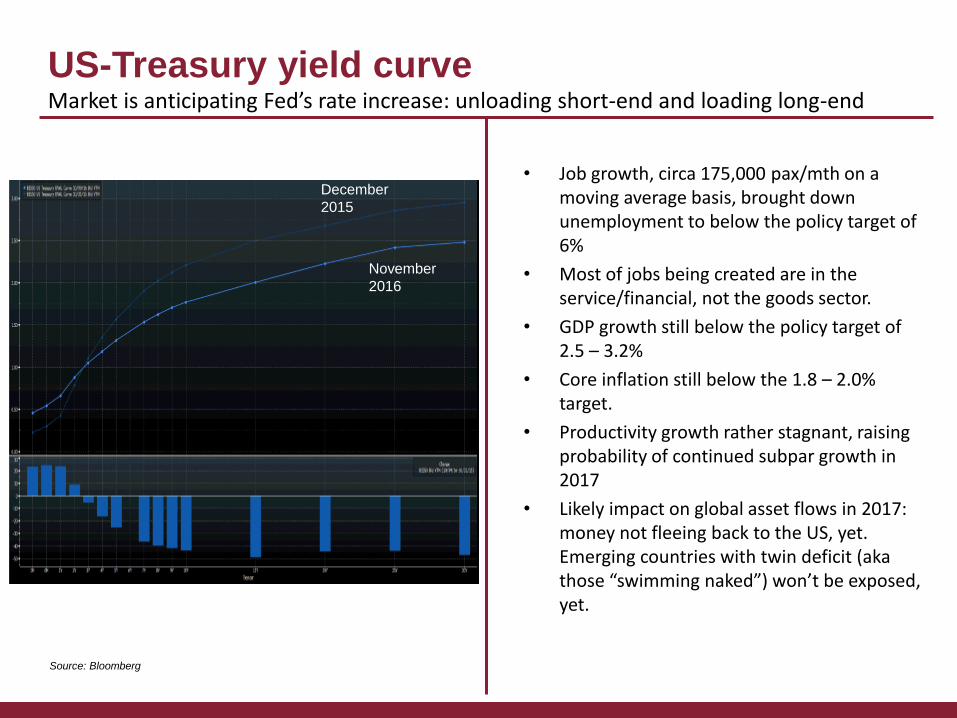
US-Treasury yield curve Market is anticipating Fed’s rate increase: unloading short-end and loading long-end
t
Source: Bloomberg
December
2015
November
2016
• Job growth, circa 175,000 pax/mth on a moving average basis, brought down unemployment to below the policy target of 6%
• Most of jobs being created are in the service/financial, not the goods sector.
• GDP growth still below the policy target of 2.5 – 3.2%
• Core inflation still below the 1.8 – 2.0% target.
• Productivity growth rather stagnant, raising probability of continued subpar growth in 2017
• Likely impact on global asset flows in 2017: money not fleeing back to the US, yet. Emerging countries with twin deficit (aka those “swimming naked”) won’t be exposed, yet.
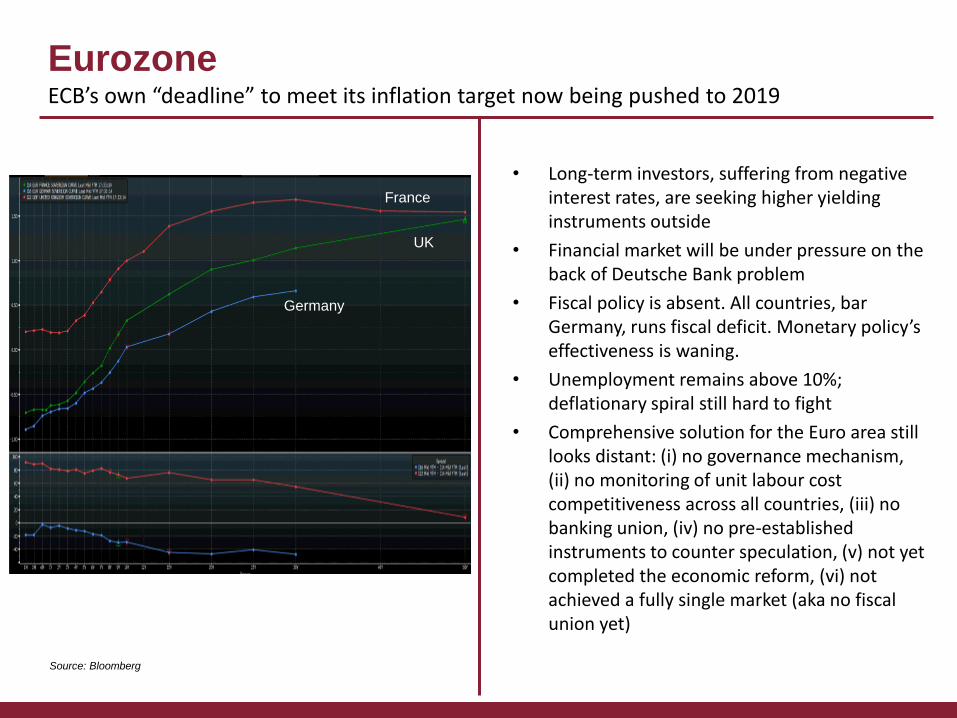
Eurozone ECB’s own “deadline” to meet its inflation target now being pushed to 2019
Source: Bloomberg
UK
France
Germany
• Long-term investors, suffering from negative interest rates, are seeking higher yielding instruments outside
• Financial market will be under pressure on the back of Deutsche Bank problem
• Fiscal policy is absent. All countries, bar Germany, runs fiscal deficit. Monetary policy’s effectiveness is waning.
• Unemployment remains above 10%; deflationary spiral still hard to fight
• Comprehensive solution for the Euro area still looks distant: (i) no governance mechanism, (ii) no monitoring of unit labour cost competitiveness across all countries, (iii) no banking union, (iv) no pre-established instruments to counter speculation, (v) not yet completed the economic reform, (vi) not achieved a fully single market (aka no fiscal union yet)
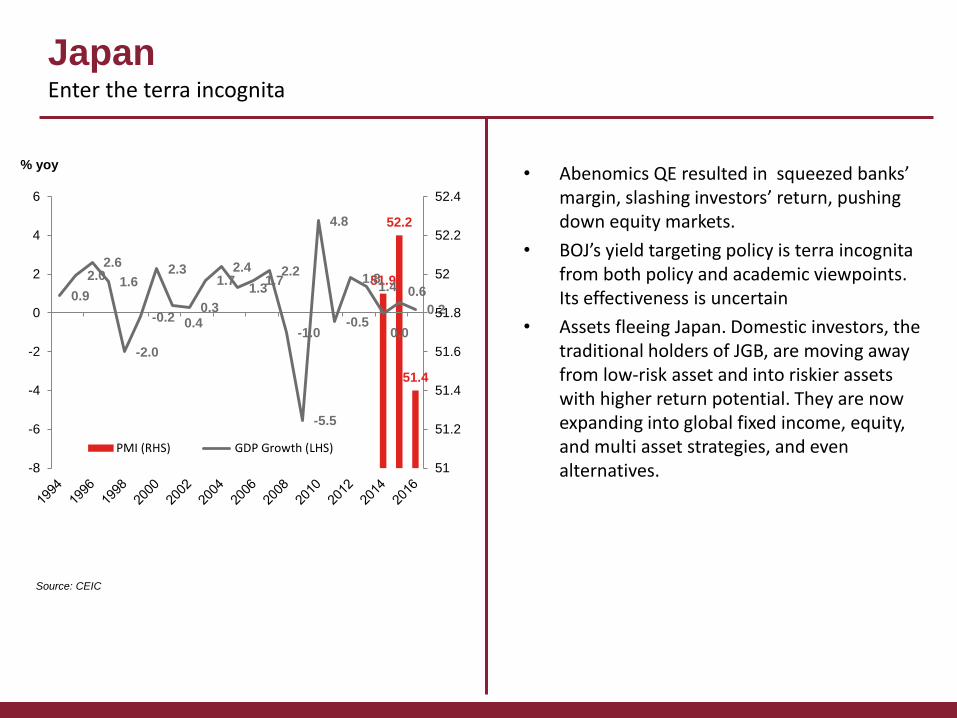
Japan Enter the terra incognita
Source: CEIC
• Abenomics QE resulted in squeezed banks’ margin, slashing investors’ return, pushing down equity markets.
• BOJ’s yield targeting policy is terra incognita from both policy and academic viewpoints. Its effectiveness is uncertain
• Assets fleeing Japan. Domestic investors, the traditional holders of JGB, are moving away from low-risk asset and into riskier assets with higher return potential. They are now expanding into global fixed income, equity, and multi asset strategies, and even alternatives.
% yoy
51.9
52.2
51.4
0.9
2.0 2.6
1.6
-2.0
-0.2
2.3
0.4 0.3
1.7 2.4
1.3 1.7
2.2
-1.0
-5.5
4.8
-0.5
1.8 1.4
0.0
0.6
0.2
51
51.2
51.4
51.6
51.8
52
52.2
52.4
-8
-6
-4
-2
0
2
4
6
PMI (RHS) GDP Growth (LHS)
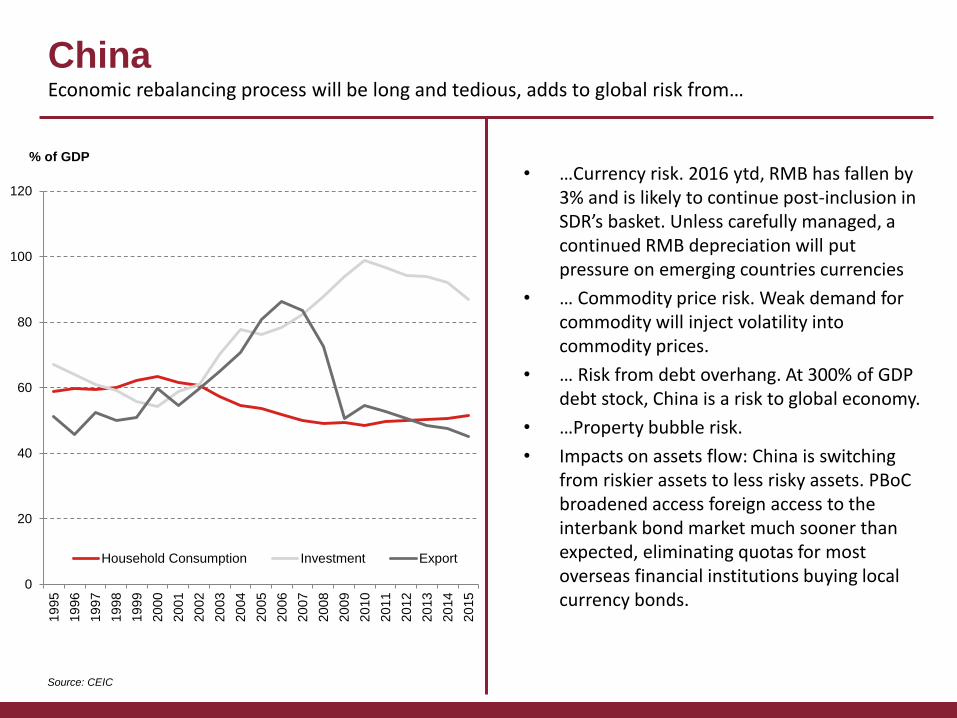
China Economic rebalancing process will be long and tedious, adds to global risk from…
Source: CEIC
• …Currency risk. 2016 ytd, RMB has fallen by 3% and is likely to continue post-inclusion in SDR’s basket. Unless carefully managed, a continued RMB depreciation will put pressure on emerging countries currencies
• … Commodity price risk. Weak demand for commodity will inject volatility into commodity prices.
• … Risk from debt overhang. At 300% of GDP debt stock, China is a risk to global economy.
• …Property bubble risk.
• Impacts on assets flow: China is switching from riskier assets to less risky assets. PBoC broadened access foreign access to the interbank bond market much sooner than expected, eliminating quotas for most overseas financial institutions buying local currency bonds.
0
20
40
60
80
100
120
19
95
19
96
19
97
19
98
19
99
20
00
20
01
20
02
20
03
20
04
20
05
20
06
20
07
20
08
20
09
20
10
20
11
20
12
20
13
20
14
20
15
Household Consumption Investment Export
% of GDP
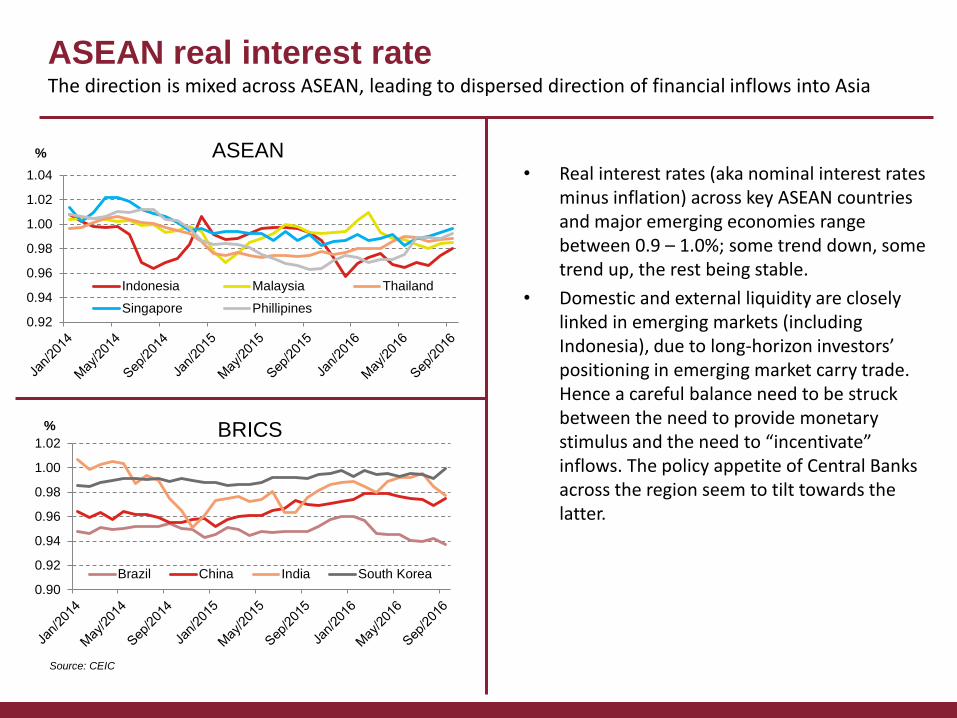
ASEAN real interest rate The direction is mixed across ASEAN, leading to dispersed direction of financial inflows into Asia
Source: CEIC
• Real interest rates (aka nominal interest rates minus inflation) across key ASEAN countries and major emerging economies range between 0.9 – 1.0%; some trend down, some trend up, the rest being stable.
• Domestic and external liquidity are closely linked in emerging markets (including Indonesia), due to long-horizon investors’ positioning in emerging market carry trade. Hence a careful balance need to be struck between the need to provide monetary stimulus and the need to “incentivate” inflows. The policy appetite of Central Banks across the region seem to tilt towards the latter.
0.92
0.94
0.96
0.98
1.00
1.02
1.04
% ASEAN
Indonesia Malaysia Thailand
Singapore Phillipines
0.90
0.92
0.94
0.96
0.98
1.00
1.02
% BRICS
Brazil China India South Korea
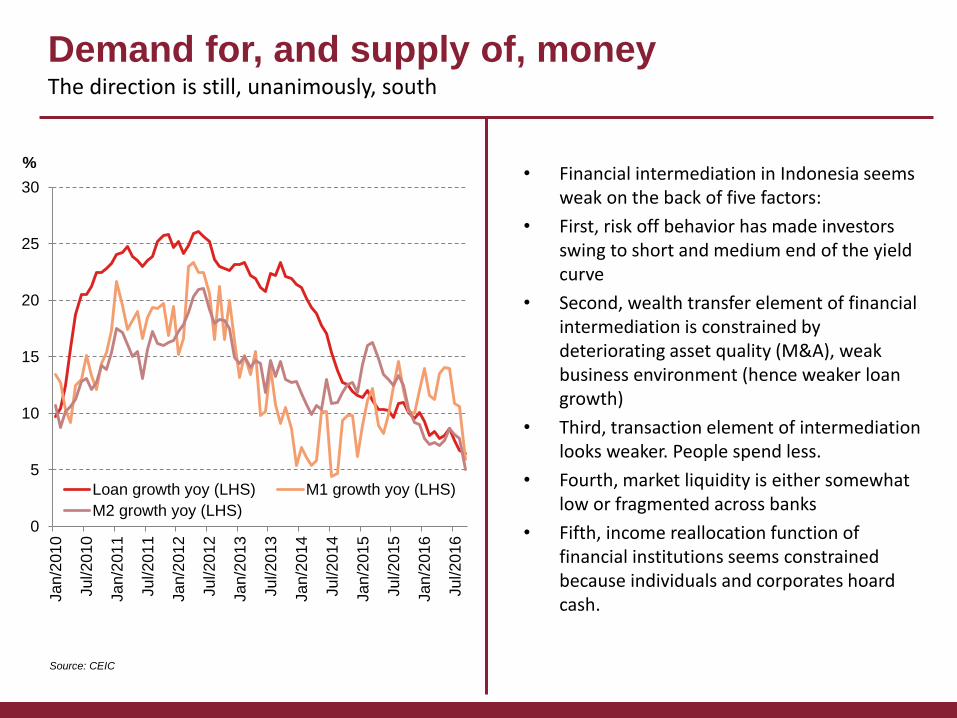
Demand for, and supply of, money The direction is still, unanimously, south
Source: CEIC
• Financial intermediation in Indonesia seems weak on the back of five factors:
• First, risk off behavior has made investors swing to short and medium end of the yield curve
• Second, wealth transfer element of financial intermediation is constrained by deteriorating asset quality (M&A), weak business environment (hence weaker loan growth)
• Third, transaction element of intermediation looks weaker. People spend less.
• Fourth, market liquidity is either somewhat low or fragmented across banks
• Fifth, income reallocation function of financial institutions seems constrained because individuals and corporates hoard cash.
0
5
10
15
20
25
30
Ja
n/2
01
0
Ju
l/20
10
Ja
n/2
01
1
Ju
l/20
11
Ja
n/2
01
2
Ju
l/20
12
Ja
n/2
01
3
Ju
l/20
13
Ja
n/2
01
4
Ju
l/20
14
Ja
n/2
01
5
Ju
l/20
15
Ja
n/2
01
6
Ju
l/20
16
%
Loan growth yoy (LHS) M1 growth yoy (LHS)
M2 growth yoy (LHS)
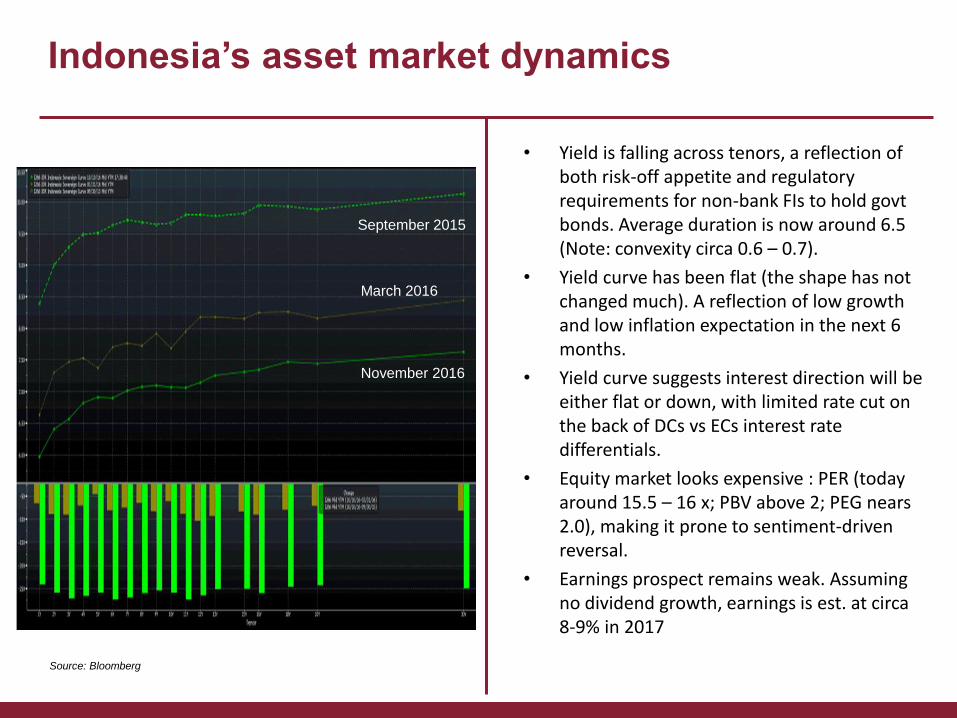
Indonesia’s asset market dynamics
Source: Bloomberg
• Yield is falling across tenors, a reflection of both risk-off appetite and regulatory requirements for non-bank FIs to hold govt bonds. Average duration is now around 6.5 (Note: convexity circa 0.6 – 0.7).
• Yield curve has been flat (the shape has not changed much). A reflection of low growth and low inflation expectation in the next 6 months.
• Yield curve suggests interest direction will be either flat or down, with limited rate cut on the back of DCs vs ECs interest rate differentials.
• Equity market looks expensive : PER (today around 15.5 – 16 x; PBV above 2; PEG nears 2.0), making it prone to sentiment-driven reversal.
• Earnings prospect remains weak. Assuming no dividend growth, earnings is est. at circa 8-9% in 2017
September 2015
March 2016
November 2016
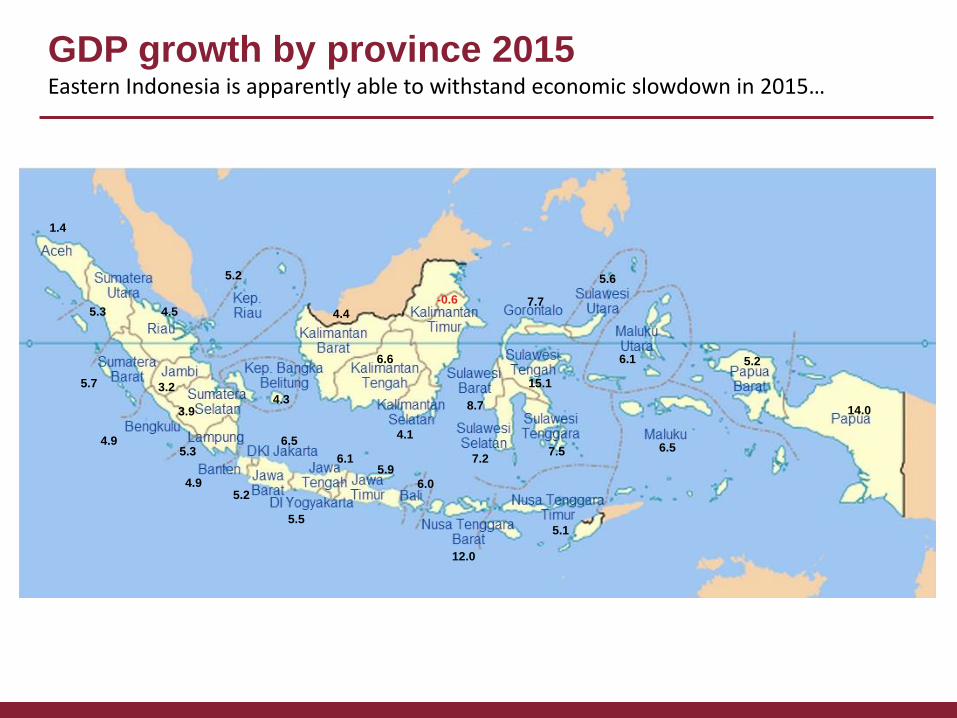
GDP growth by province 2015 Eastern Indonesia is apparently able to withstand economic slowdown in 2015…
1.4
5.3
5.7
4.5
5.2
3.2
3.9
4.9
4.9
4.3
5.3 6.5
5.2
5.5
6.1 5.9
6.0
12.0
5.1
4.4
-0.6
6.6
4.1
8.7
7.2 7.5
15.1
7.7
5.6
6.1
6.5
5.2
14.0
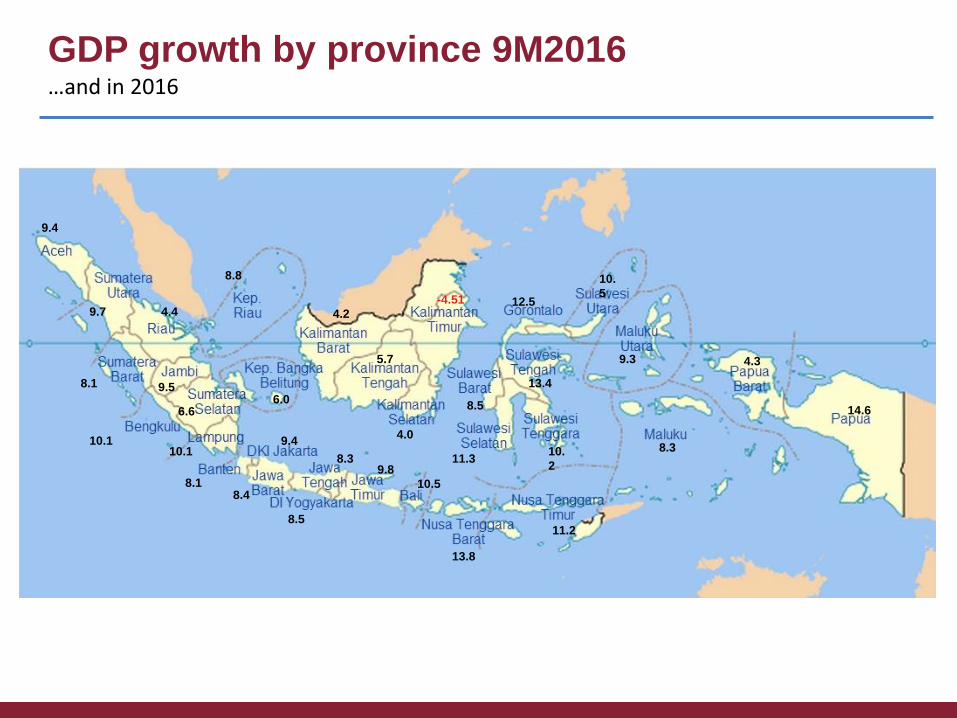
GDP growth by province 9M2016 …and in 2016
9.4
9.7
8.1
4.4
8.8
9.5
6.6
10.1
8.1
6.0
10.1 9.4
8.4
8.5
8.3 9.8
10.5
13.8
11.2
4.2
-4.51
5.7
4.0
8.5
11.3 10.
2
13.4
12.5
10.
5
9.3
8.3
4.3
14.6
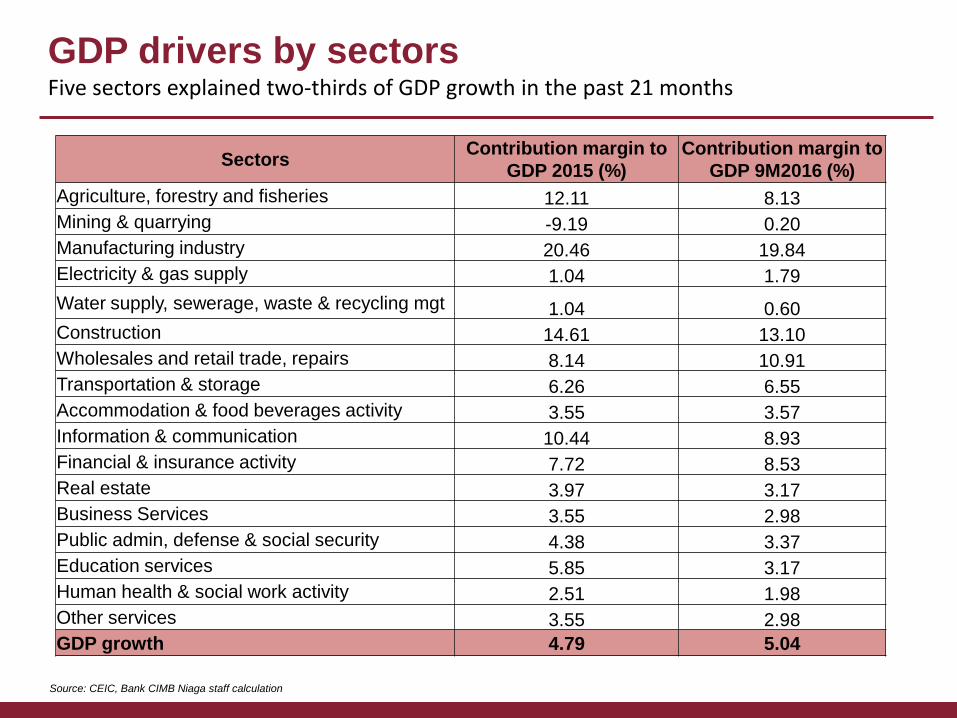
GDP drivers by sectors
Five sectors explained two-thirds of GDP growth in the past 21 months
Source: CEIC, Bank CIMB Niaga staff calculation
Sectors Contribution margin to
GDP 2015 (%)
Contribution margin to
GDP 9M2016 (%)
Agriculture, forestry and fisheries 12.11 8.13
Mining & quarrying -9.19 0.20
Manufacturing industry 20.46 19.84
Electricity & gas supply 1.04 1.79
Water supply, sewerage, waste & recycling mgt 1.04 0.60
Construction 14.61 13.10
Wholesales and retail trade, repairs 8.14 10.91
Transportation & storage 6.26 6.55
Accommodation & food beverages activity 3.55 3.57
Information & communication 10.44 8.93
Financial & insurance activity 7.72 8.53
Real estate 3.97 3.17
Business Services 3.55 2.98
Public admin, defense & social security 4.38 3.37
Education services 5.85 3.17
Human health & social work activity 2.51 1.98
Other services 3.55 2.98
GDP growth 4.79 5.04
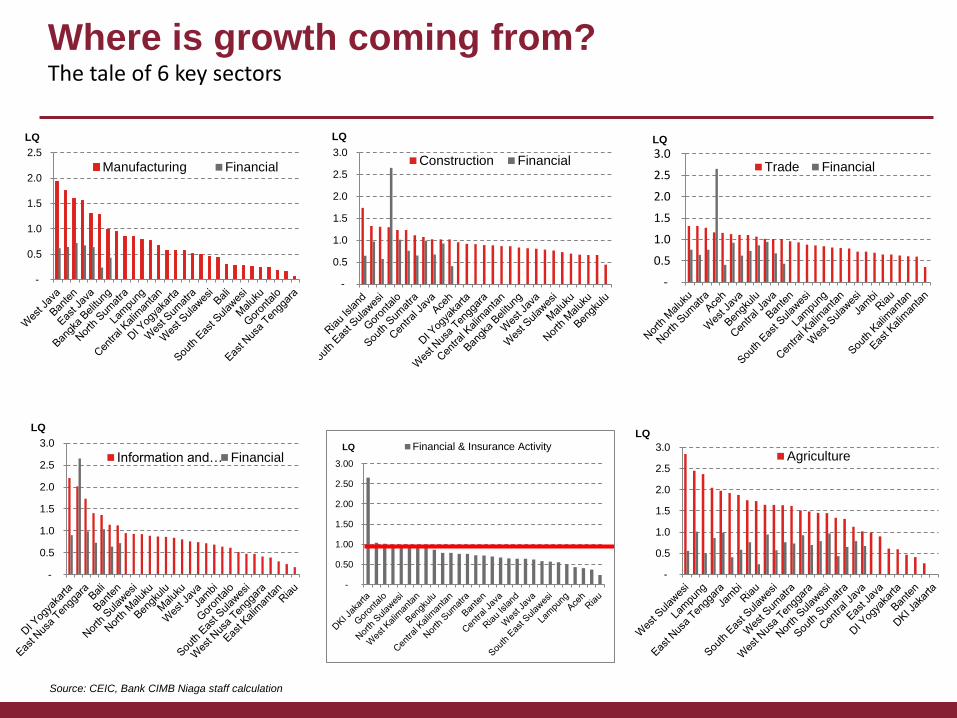
Where is growth coming from? The tale of 6 key sectors
Source: CEIC, Bank CIMB Niaga staff calculation
-
0.50
1.00
1.50
2.00
2.50
3.00
Financial & Insurance ActivityLQ
-
0.5
1.0
1.5
2.0
2.5
LQ
Manufacturing Financial
-
0.5
1.0
1.5
2.0
2.5
3.0
LQ
Construction Financial
-
0.5
1.0
1.5
2.0
2.5
3.0LQ
Trade Financial
-
0.5
1.0
1.5
2.0
2.5
3.0
LQ
Information and… Financial
-
0.5
1.0
1.5
2.0
2.5
3.0
LQ
Agriculture
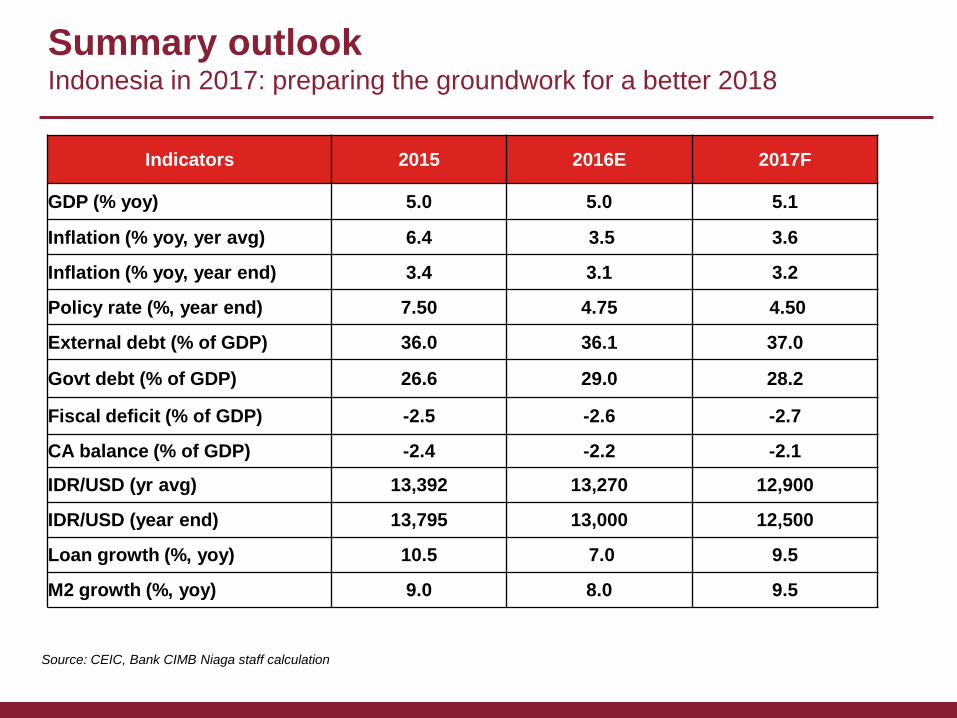
Summary outlook Indonesia in 2017: preparing the groundwork for a better 2018
Indicators 2015 2016E 2017F
GDP (% yoy) 5.0 5.0 5.1
Inflation (% yoy, yer avg) 6.4 3.5 3.6
Inflation (% yoy, year end) 3.4 3.1 3.2
Policy rate (%, year end) 7.50 4.75 4.50
External debt (% of GDP) 36.0 36.1 37.0
Govt debt (% of GDP) 26.6 29.0 28.2
Fiscal deficit (% of GDP) -2.5 -2.6 -2.7
CA balance (% of GDP) -2.4 -2.2 -2.1
IDR/USD (yr avg) 13,392 13,270 12,900
IDR/USD (year end) 13,795 13,000 12,500
Loan growth (%, yoy) 10.5 7.0 9.5
M2 growth (%, yoy) 9.0 8.0 9.5
Source: CEIC, Bank CIMB Niaga staff calculation