Embed Size (px)
Citation preview
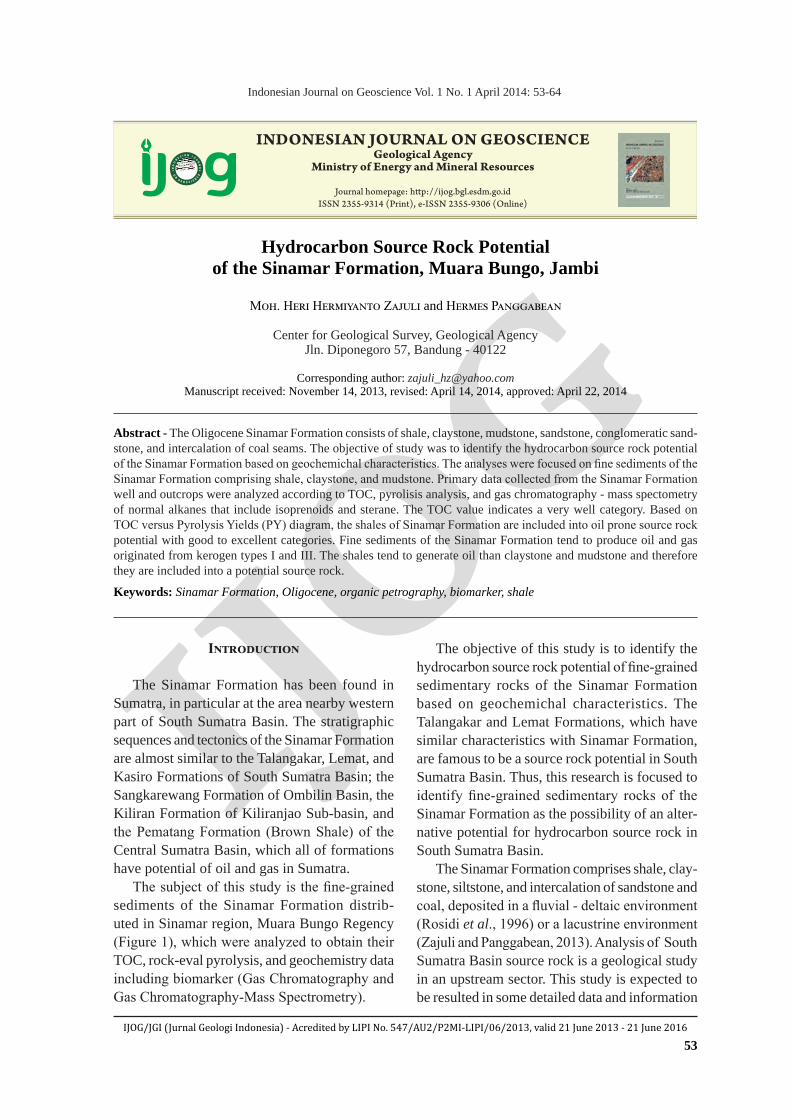
IJOG
53IJOG/JGI (Jurnal Geologi Indonesia) - Acredited by LIPI No. 547/AU2/P2MI-LIPI/06/2013, valid 21 June 2013 - 21 June 2016
Indonesian Journal on Geoscience Vol. 1 No. 1 April 2014: 53-64
Hydrocarbon Source Rock Potential of the Sinamar Formation, Muara Bungo, Jambi
Moh. Heri Hermiyanto Zajuli and Hermes Panggabean
Center for Geological Survey, Geological AgencyJln. Diponegoro 57, Bandung - 40122
Corresponding author: [email protected] received: November 14, 2013, revised: April 14, 2014, approved: April 22, 2014
Abstract - The Oligocene Sinamar Formation consists of shale, claystone, mudstone, sandstone, conglomeratic sand-stone, and intercalation of coal seams. The objective of study was to identify the hydrocarbon source rock potential of the Sinamar Formation based on geochemichal characteristics. The analyses were focused on fine sediments of the Sinamar Formation comprising shale, claystone, and mudstone. Primary data collected from the Sinamar Formation well and outcrops were analyzed according to TOC, pyrolisis analysis, and gas chromatography - mass spectometry of normal alkanes that include isoprenoids and sterane. The TOC value indicates a very well category. Based on TOC versus Pyrolysis Yields (PY) diagram, the shales of Sinamar Formation are included into oil prone source rock potential with good to excellent categories. Fine sediments of the Sinamar Formation tend to produce oil and gas originated from kerogen types I and III. The shales tend to generate oil than claystone and mudstone and therefore they are included into a potential source rock.
Keywords: Sinamar Formation, Oligocene, organic petrography, biomarker, shale
Introduction
The Sinamar Formation has been found in Sumatra, in particular at the area nearby western part of South Sumatra Basin. The stratigraphic sequences and tectonics of the Sinamar Formation are almost similar to the Talangakar, Lemat, and Kasiro Formations of South Sumatra Basin; the Sangkarewang Formation of Ombilin Basin, the Kiliran Formation of Kiliranjao Sub-basin, and the Pematang Formation (Brown Shale) of the Central Sumatra Basin, which all of formations have potential of oil and gas in Sumatra.
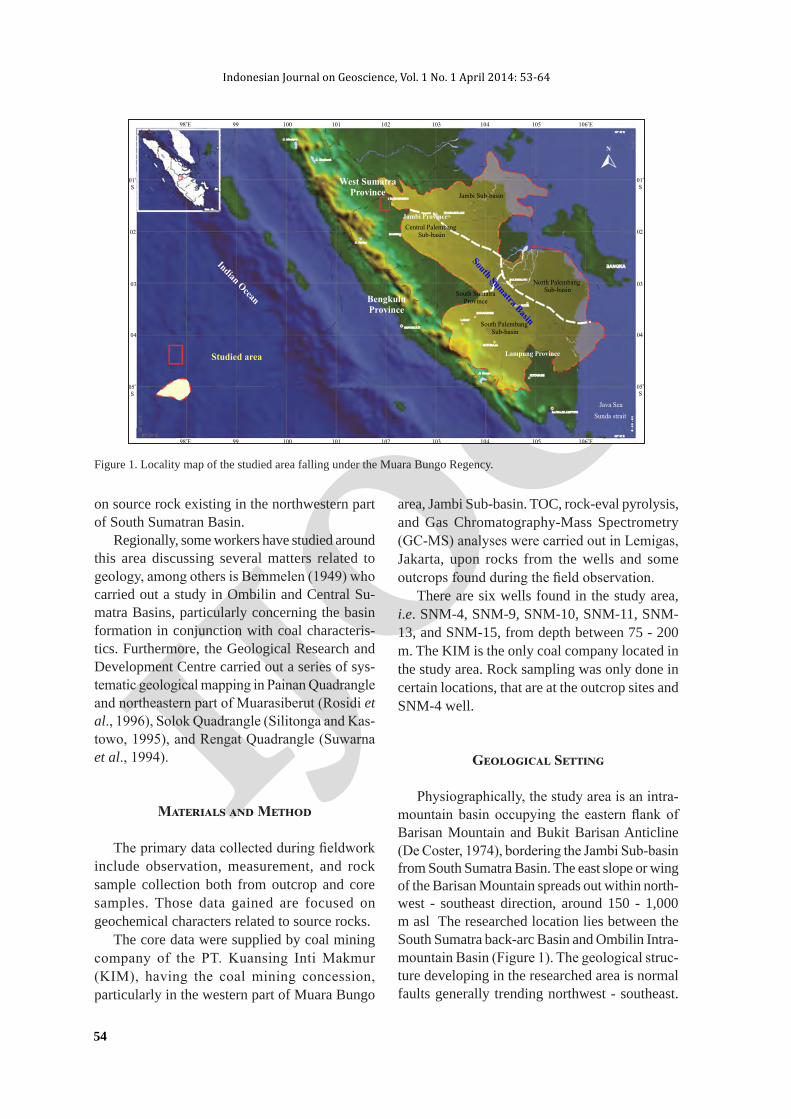
The subject of this study is the fine-grained sediments of the Sinamar Formation distrib-uted in Sinamar region, Muara Bungo Regency (Figure 1), which were analyzed to obtain their TOC, rock-eval pyrolysis, and geochemistry data including biomarker (Gas Chromatography and Gas Chromatography-Mass Spectrometry).
The objective of this study is to identify the hydrocarbon source rock potential of fine-grained sedimentary rocks of the Sinamar Formation based on geochemichal characteristics. The Talangakar and Lemat Formations, which have similar characteristics with Sinamar Formation, are famous to be a source rock potential in South Sumatra Basin. Thus, this research is focused to identify fine-grained sedimentary rocks of the Sinamar Formation as the possibility of an alter-native potential for hydrocarbon source rock in South Sumatra Basin.
The Sinamar Formation comprises shale, clay-stone, siltstone, and intercalation of sandstone and coal, deposited in a fluvial - deltaic environment (Rosidi et al., 1996) or a lacustrine environment (Zajuli and Panggabean, 2013). Analysis of South Sumatra Basin source rock is a geological study in an upstream sector. This study is expected to be resulted in some detailed data and information
INDONESIAN JOURNAL ON GEOSCIENCEGeological Agency
Ministry of Energy and Mineral Resources
Journal homepage: h�p://ijog.bgl.esdm.go.idISSN 2355-9314 (Print), e-ISSN 2355-9306 (Online)
IJOG
Indonesian Journal on Geoscience, Vol. 1 No. 1 April 2014: 53-64
54
on source rock existing in the northwestern part of South Sumatran Basin.
Regionally, some workers have studied around this area discussing several matters related to geology, among others is Bemmelen (1949) who carried out a study in Ombilin and Central Su-matra Basins, particularly concerning the basin formation in conjunction with coal characteris-tics. Furthermore, the Geological Research and Development Centre carried out a series of sys-tematic geological mapping in Painan Quadrangle and northeastern part of Muarasiberut (Rosidi et al., 1996), Solok Quadrangle (Silitonga and Kas-towo, 1995), and Rengat Quadrangle (Suwarna et al., 1994).
Materials and Method
The primary data collected during fieldwork include observation, measurement, and rock sample collection both from outcrop and core samples. Those data gained are focused on geochemical characters related to source rocks.
The core data were supplied by coal mining company of the PT. Kuansing Inti Makmur (KIM), having the coal mining concession, particularly in the western part of Muara Bungo
area, Jambi Sub-basin. TOC, rock-eval pyrolysis, and Gas Chromatography-Mass Spectrometry (GC-MS) analyses were carried out in Lemigas, Jakarta, upon rocks from the wells and some outcrops found during the field observation.
There are six wells found in the study area, i.e. SNM-4, SNM-9, SNM-10, SNM-11, SNM-13, and SNM-15, from depth between 75 - 200 m. The KIM is the only coal company located in the study area. Rock sampling was only done in certain locations, that are at the outcrop sites and SNM-4 well.
Geological Setting
Physiographically, the study area is an intra-mountain basin occupying the eastern flank of Barisan Mountain and Bukit Barisan Anticline (De Coster, 1974), bordering the Jambi Sub-basin from South Sumatra Basin. The east slope or wing of the Barisan Mountain spreads out within north-west - southeast direction, around 150 - 1,000 m asl The researched location lies between the South Sumatra back-arc Basin and Ombilin Intra-mountain Basin (Figure 1). The geological struc-ture developing in the researched area is normal faults generally trending northwest - southeast.
Studied area
Indian Ocean Bengkulu
Province
West SumatraProvince Jambi Sub-basin
N
Central Palembang Sub-basin
o98 E
o98 E
99
99
o01S
o01S
02 02
03 03
04 04
o05S
o05S
100
100
101
101
102
102
103
103
104
104
105
105
o106 E
o106 E
North Palembang Sub-basin
South Palembang Sub-basin
Lampung Province
Java Sea
Sunda strait
South Sumatra Province
Jambi Province
South Sumatra Basin
Figure 1. Locality map of the studied area falling under the Muara Bungo Regency.

IJOG
Hydrocarbon Source Rock Potential of the Sinamar Formation, Muara Bungo, Jambi (M.H.H. Zajuli and H. Panggabean)
55
Figure 2. Geological map of the researched area (modified from Rosidi et al., 1996).
This structure only influences the northwestern part of the formation in the researched area. However, in certain places, northeasterly bed dippings of around 20o can be recognized. In the east, ENE-WSW and NW-SE normal faults are also found, cutting some formations, among others Sinamar and Rantauikil Formations. Pu-lunggono et al. (1992) stated that the normal or horizontal fault directions is E-W up till NE-SW. This fault is estimated to have occured after the anticline-syncline had already been folded, the fault cuts anticline-syncline axis (Pulunggono et al., 1992). The researched location is part of the geological map of Painan and the northeastern part of Muarasiberut Quadrangles (Rosidi et al., 1996) occupying probably the tip or edge of the northwestern part of Jambi Sub-basin of South Sumatra Basin (Figure 1).
Stratigraphically, the researched area included in the geological map of Painan Quadrangle (Fig-ure 2) consists of Jurrassic up to Quaternary rocks. The basement of this basin is Jurassic granitic rock, unconformably overlain by the sediments of Oli-gocene Sinamar Formation. In turn, this formation is conformably overlain by the Miocene Rantaui-kil Formation. Then upwards, the sediments of Plio-Pleistocene Kasai Formation unconformably deposited on those both formations.
The Sinamar Formation is composed of con-glomerate and quartzose sandstone occupying
the lowest part, then they are overlain by 2 - 5 m layering blackish grey claystone intercalated with 20 cm of coal. Upwards, the Sinamar Formation is characterized by the presence of claystone and sandstone gravels (Hermiyanto, 2010). Further above, there are more shale layers with 30 cm up to 7 m of coal intercalations (Figure 3). The age of Sinamar Formation is Oligocene with Ammonia beccarii and coral contents. The calculated thick-ness of this formation is 750 m (Rosidi et al., 1996).
The Miocene Rantauikil Formation is domi-nated by claystone, tuffaceous sandstone, clayey sandstone, marl, and thin lenses of claystone. Fur-thermore, the Kasai Formation of Plio-Plistocene age is composed of pumiceous tuff and tuffaceous sandstone. The youngest unit is alluvial sedimenst consisting of pebbles, gravels, sands, and muds. The sedimentation is still going on up till now as the result of a river erosion activity.
Data Analysis
Organic MaterialThe organic material of Sinamar fine sedi-
mentary rocks is interpreted based on TOC data carried out upon fifteen rock samples. These data show that the organic material of some Sinamar fine sediments can be divided into three groups based on their existing lithological type. The
-1 2
0' S
101 40' E 101 50' E
Explanation :
0 2 4 km
N
AlluviumQal
Qyu
Qtk
Tmr
Tos
Jgr
Batuan Gunungapi yang tak terpisahkan
Kasai Formation
Rantauikil Formation
Sinamar Formation
Granite
Cross sectionCross sectionA A'
Investigation areas08 MH 13 =
SNM-4 = Investigation and samplingareas

IJOG
Indonesian Journal on Geoscience, Vol. 1 No. 1 April 2014: 53-64
56
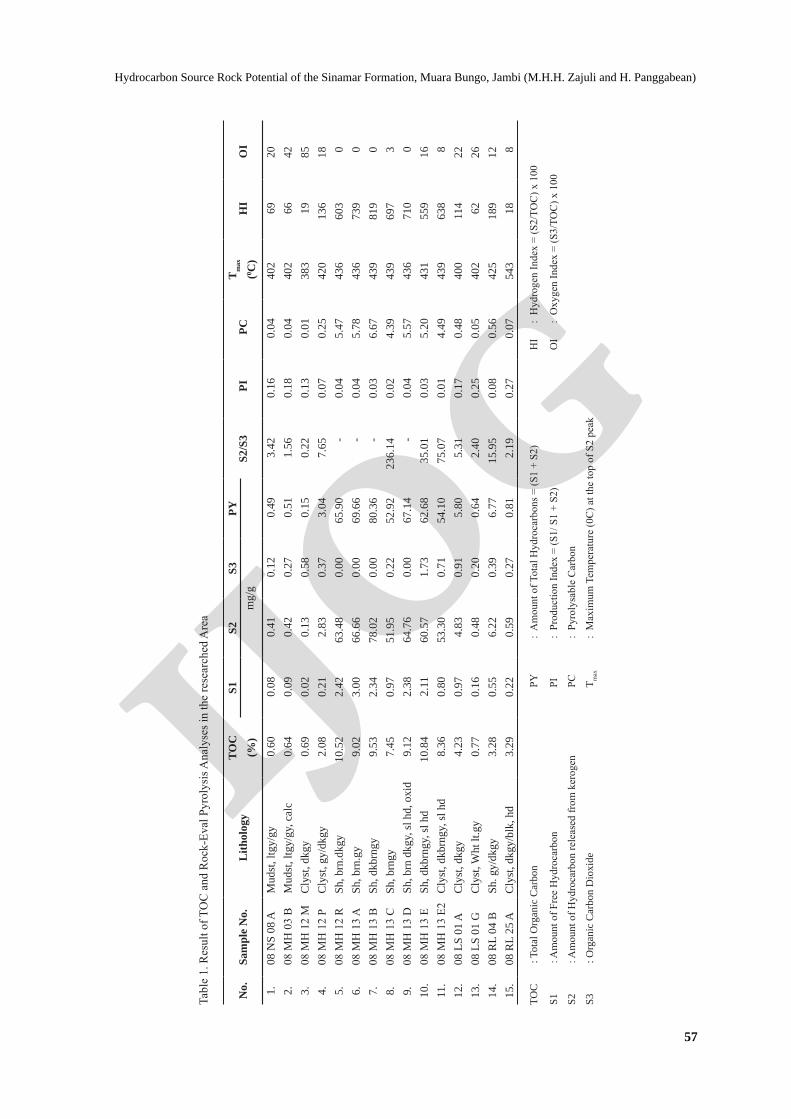
shales have 2.8 - 10.84 % TOC value indicat-ing that their ability to be oil-prone is in a good category, claystone has 0.69% - 8.36 % TOC value with a limited up to good category, while mudstone with 0.60% and 0.64% is included into a category with a very limited source rock-prone (Table 1). The existing organic material in the sedimentary rocks shows that shales have the best ability as source rocks.
Organic Material TypeThe types of organic material in the researched
area are intrepreted on the basis of hydrogen index (HI) and oxygen index (OI) values resulted from Rock-Eval analysis. The type of organic material is a reflection of the sedimentary rock compos-ing macerals. The sediments influence the type of organic material suitable with the presence of some key maceral types. A Hydrogen Index
AG
E SAMPLECODE
SYMBOL
Mdst Sand Gravel
Clay
Shale, brownish black, hard, clay grain size, well-bedded,flake structure, total thickness 32 m lower part contains freshwater fish fossils length of 20 cm and 15 cm wide.
08 MH 13A
08 MH 13B
08 MH 13C
08 MH 13D
08 MH 13E
08 MH 13G08 MH 13H
08 MH 13I
08 MH 13J
08 MH 13K
08 MH 13L
08 MH 13M08 MH 13N
OL
IGO
CE
NE
SIN
AM
AR
FO
RM
AT
ION
0
5
10
15
20
25
30
35
40
o oN 295 E/12
o oN 295 E/12
Trunk, black, forming a tree structure, 22 m long diameter of 90 cm.
Silt F M C Cgl
GRAIN SIZE
SE
DIM
EN
TA
RY
ST
RU
CT
UR
E
DE
PO
SIT
ION
AL
EN
VIR
ON
ME
NT
AL
LU
VIU
MS
HA
LL
OW
LA
CU
ST
RIN
ED
EE
P L
AC
US
TR
INE
TE
RR
ES
TR
IAL
ES
TU
AR
INE
OR
SH
AL
LO
W L
AC
US
TR
INE
DESCRIPTION
ST
RIK
E,
DIP
AN
DT
HIC
KN
ES
S
FO
RM
AT
ION
Meter
Banded coal, black, layering structure, microfracture contains resin, hard, 2.5 m thick. Dull banded coal, black, layering structure, microfracture contains resin, hard, thickness of 4.5 m.
Pale brown quartz sandstone, medium-to coarse-grained, hard, medium sorted, open, subangular to sub rounded, bedding structure; comprising silica mineral, quartz, feldspar, silica cementation,thickness of 2 m.
Claystone, dark grey, clay grain size, bedding structure, consits ofsilica mineral, thickness of 0.5 m.
Figure 3. Columnar stratigraphic section of Sinamar Formation cropping out in Sinamar Village (Zajuli and Panggabean, 2013). Coordi-nate: 01o22’08.1”S and 107”40’16.9” E, Sample 08. MH 13.
IJOG
Hydrocarbon Source Rock Potential of the Sinamar Formation, Muara Bungo, Jambi (M.H.H. Zajuli and H. Panggabean)
57
No.
Sam
ple
No.
Lith
olog
yTO
C
(%)
S1S2
S3PY
S2
/S3
PI
PC
Tm
ax
(0 C)
HI
OI
mg/
g
1.08
NS
08 A
Mud
st, l
tgy/
gy0.
600.
080.
410.
120.
493.
420.
160.
0440
269
202.
08 M
H 0
3 B
Mud
st, l
tgy/
gy, c
alc
0.64
0.09
0.42
0.27
0.51
1.56
0.18
0.04
402
6642
3.08
MH
12
MC
lyst
, dkg
y0.
690.
020.
130.
580.
150.
220.
130.
0138
319
854.
08 M
H 1
2 P
Cly
st, g
y/dk
gy2.
080.
212.
830.
373.
047.
650.
070.
2542
013
618
5.08
MH
12
RSh
, brn
.dkg
y10
.52
2.42
63.4
80.
0065
.90
-0.
045.
4743
660
30
6.08
MH
13
ASh
, brn
.gy
9.02
3.00
66.6
60.
0069
.66
-0.
045.
7843
673
90
7.08
MH
13
BSh
, dkb
rngy
9.53
2.34
78.0
20.
0080
.36
-0.
036.
6743
981
90
8.08
MH
13
CSh
, brn
gy7.
450.
9751
.95
0.22
52.9
223
6.14
0.02
4.39
439
697
39.
08 M
H 1
3 D
Sh, b
rn d
kgy,
sl h
d, o
xid
9.12
2.38
64.7
60.
0067
.14
-0.
045.
5743
671
00
10.
08 M
H 1
3 E
Sh, d
kbrn
gy, s
l hd
10.8
42.
1160
.57
1.73
62.6
835
.01
0.03
5.20
431
559
1611
.08
MH
13
E2C
lyst
, dkb
rngy
, sl h
d8.
360.
8053
.30
0.71
54.1
075
.07
0.01
4.49
439
638
812
.08
LS
01 A
Cly
st, d
kgy
4.23
0.97
4.83
0.91
5.80
5.31
0.17
0.48
400
114
2213
.08
LS
01 G
Cly
st, W
ht lt
.gy
0.77
0.16
0.48
0.20
0.64
2.40
0.25
0.05
402
6226
14.
08 R
L 04
BSh
. gy/
dkgy
3.28
0.55
6.22
0.39
6.77
15.9
50.
080.
5642
518
912
15.
08 R
L 25
AC
lyst
, dkg
y/bl
k, h
d3.
290.
220.
590.
270.
812.
190.
270.
0754
318
8
Tabl
e 1.
Res
ult o
f TO
C a
nd R
ock-
Eval
Pyr
olys
is A
naly
ses i
n th
e re
sear
ched
Are
a
TOC
: Tot
al O
rgan
ic C
arbo
nPY
: A
mou
nt o
f Tot
al H
ydro
carb
ons =
(S1
+ S2
)H
I:
Hyd
roge
n In
dex
= (S
2/TO
C) x
100
S1: A
mou
nt o
f Fre
e H
ydro
carb
onPI
: Pr
oduc
tion
Inde
x =
(S1/
S1
+ S2
)O
I:
Oxy
gen
Inde
x =
(S3/
TOC
) x 1
00
S2: A
mou
nt o
f Hyd
roca
rbon
rele
ased
from
ker
ogen
PC:
Pyro
lysa
ble
Car
bon
S3: O
rgan
ic C
arbo
n D
ioxi
deT m
ax:
Max
imum
Tem
pera
ture
(0C
) at t
he to
p of
S2
peak

IJOG
Indonesian Journal on Geoscience, Vol. 1 No. 1 April 2014: 53-64
58
1000
800
600
Hyd
roge
n I
nd
ex (
S2/
TO
C)
Oxygen Index (S3/TOC)
Gas prone
Oil/gas prone
Oil/
gas
pron
e
Kerogen type II
Ker
ogen
type
II
Kerogen type III
400
200
50 100 150 200
Shale
Claytone
Mudstone
Figure 4. Van Krevelen Plot of the fine sediment of the Sinamar Formation showing kerogen types and oil-gas prone level.
versus Oxygen Index diagram is used to describe the trend of kerogen and hydrocarbon type that are going to be produced. Based on the diagram, it is known that the Sinamar fine sediments tend to produce oil and gas of kerogen Types I and III (Figure 4).
Kerogen Type I tends to produce oil, while kerogen Type III only produces gas and a little oil. The Hydrogen Index (HI) value determines the amounts of oil or gas. The higher the HI value, the more oil can be produced. The pyrolysis result of Sinamar fine sediments shows that the TOC value is between 0.60 and 10.84%, Tmax dominantly from 383 - 402 oC, Potential Yield (PY) is between 0.15 and 80.36 mgHC/g rock, and Hydrogen Index (HI) between 18 and 819 mg. The organic materials of the fine sediments of Sinamar Formation have a trend to be less good up to very good category to be source rocks. The very good category is shown by shale, while poor up to moderate category is shown by claystone and mudstone samples. The Sinamar shales tend to be included into oil prone, while claystone and mudstone are included into gas prone (Figure 5).
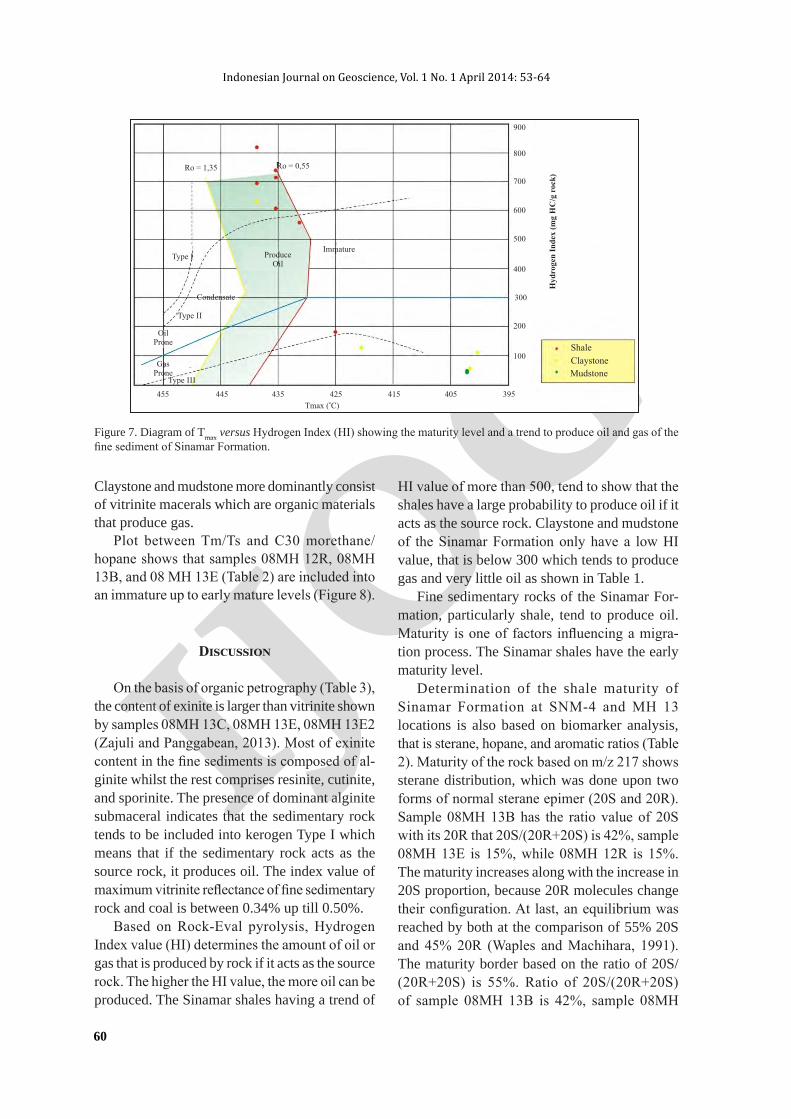
MaturityThe maturity of fine sediments as source rocks
in the researched area is interpreted based on Tmax value obtained from Rock-Eval result, vitrinite reflectance value, and biomarker analysis. Tmax diagram was used in describing the maturity level of the source rocks upon Hydrogen Index (HI) resulted from Rock-Eval pyrolysis.
Based on Tmax versus Hydrogen Index dia-gram, the Sinamar fine sediment rocks are in-cluded into an immature level up to early mature. Source rocks can be said to be mature if the Tmax value is > 435 oC (Waples, 1985). The immature level is shown within claystone and mudstone, while only one shale sample has an early mature level (Figures 6 and 7).
The shales of Sinamar Formation tends to produce oil compared to claystone and mudstone producing gas (Figures 5 and 7). The trend is a reflection of the organic material composition existing in the rock. The organic matter present in the shales are dominantly composed of alginite submaceral (Botryococcus) which produces oil as mentioned in Zajuli and Panggabean (2013).

IJOG
Hydrocarbon Source Rock Potential of the Sinamar Formation, Muara Bungo, Jambi (M.H.H. Zajuli and H. Panggabean)
59
Shale
5 1 2 10 100
1000
50
20
10
5
2
1
0.5
0
Claytone
Mudstone
(mg H
C/g
rock
)
Total Organic Carbon (TOC) (wt. %)
Tota
l G
en
erati
on
Pote
nti
al
(PY
)/S
1+
S2
500
200POOR
EXCELLENT
OIL PRONE
GAS PRONE
FAIR
FA
IR
GOOD
GO
OD
POOR
100
Figure 5. TOC versus Total Generation Potential (Py) diagram, showing hydrocarbon potential level of Sinamar fine sedi-ments in the studied area.
Shale
375
300
600
Hyd
roge
n I
nd
ex (
mg
HC
/g r
ock
)
900 Iso - reflectance
Type I
Type II
Type III
1.35
405 435 465 495 525 555 585
oT ( C)max
IMMATURE MATURE POST-MATURE
Claytone
Mudstone
Figure 6. Hydrogen Index (HI) versus Tmax diagram, showing thermal maturity and kerogen types of Sinamar fine sedi-ments in the studied area.
IJOG
Indonesian Journal on Geoscience, Vol. 1 No. 1 April 2014: 53-64
60
Ro = 1,35 Ro = 0,55
Type I
Type II
455 445 435 425o
Tmax ( C)
Hyd
roge
n I
nd
ex (
mg
HC
/g r
ock
)
415 405 395
100Shale
Claystone
Mudstone
200
300
400
500
600
700
800
900
Type III
Condensate
ProduceOil
OilProne
GasProne
Immature
Figure 7. Diagram of Tmax versus Hydrogen Index (HI) showing the maturity level and a trend to produce oil and gas of the fine sediment of Sinamar Formation.
Claystone and mudstone more dominantly consist of vitrinite macerals which are organic materials that produce gas.
Plot between Tm/Ts and C30 morethane/hopane shows that samples 08MH 12R, 08MH 13B, and 08 MH 13E (Table 2) are included into an immature up to early mature levels (Figure 8).
Discussion
On the basis of organic petrography (Table 3), the content of exinite is larger than vitrinite shown by samples 08MH 13C, 08MH 13E, 08MH 13E2 (Zajuli and Panggabean, 2013). Most of exinite content in the fine sediments is composed of al-ginite whilst the rest comprises resinite, cutinite, and sporinite. The presence of dominant alginite submaceral indicates that the sedimentary rock tends to be included into kerogen Type I which means that if the sedimentary rock acts as the source rock, it produces oil. The index value of maximum vitrinite reflectance of fine sedimentary rock and coal is between 0.34% up till 0.50%.
Based on Rock-Eval pyrolysis, Hydrogen Index value (HI) determines the amount of oil or gas that is produced by rock if it acts as the source rock. The higher the HI value, the more oil can be produced. The Sinamar shales having a trend of
HI value of more than 500, tend to show that the shales have a large probability to produce oil if it acts as the source rock. Claystone and mudstone of the Sinamar Formation only have a low HI value, that is below 300 which tends to produce gas and very little oil as shown in Table 1.
Fine sedimentary rocks of the Sinamar For-mation, particularly shale, tend to produce oil. Maturity is one of factors influencing a migra-tion process. The Sinamar shales have the early maturity level.
Determination of the shale maturity of Sinamar Formation at SNM-4 and MH 13 locations is also based on biomarker analysis, that is sterane, hopane, and aromatic ratios (Table 2). Maturity of the rock based on m/z 217 shows sterane distribution, which was done upon two forms of normal sterane epimer (20S and 20R). Sample 08MH 13B has the ratio value of 20S with its 20R that 20S/(20R+20S) is 42%, sample 08MH 13E is 15%, while 08MH 12R is 15%. The maturity increases along with the increase in 20S proportion, because 20R molecules change their configuration. At last, an equilibrium was reached by both at the comparison of 55% 20S and 45% 20R (Waples and Machihara, 1991). The maturity border based on the ratio of 20S/(20R+20S) is 55%. Ratio of 20S/(20R+20S) of sample 08MH 13B is 42%, sample 08MH

IJOG
Hydrocarbon Source Rock Potential of the Sinamar Formation, Muara Bungo, Jambi (M.H.H. Zajuli and H. Panggabean)
61
GC and GC-MS AnalysisSample Code
SNM-4/08 MH 12R (shale)
08 MH 13B(shale)
08 MH 13E(shale)
Ratio of n-alkane Pristane/phytane 6.43 3.57 1.80Pristane/nC17 1.70 1.53 5.13Phytane /nC18 0.43 0.22 3.20Carbon Preference Index (CPI) 1
1.72 1.13 1.43
Carbon Preference Index (CPI) 2
1.97 0.73 0.45
Ratio of Triterpane C30 Moretane/C30 Hopane
1.25 0.25 0.40
22S/(22S+22R)C31 0.14 0.56 0.24Tm 4379548 253963 4924907Ts 441344 40160 2119932C29/C30 Hopane 0.66 1 2.86
Ratio of sterane 20S/(20S+20R)C29 0.15 0.42 0.15C27 sterane 4 35 53C28 sterane 22 23 18C29 sterane 74 42 29C29 αααR 333706 23868 665958C29 αααS 1893929 32393 3706247C29 αββR 601917 26325 1963239C29 αββS 372882 14754 572087
Ratio of Aromatic DNR-1 5.44 1.06 5.62TNR-1 1.11 1.61 0.74MPI-1 0.31 0.54 0.43MPI-2 0.45 0.64 0.49Rc1 0.58 0.72 0.66Rc2 2.12 1.98 2.04Ro1 0.73 0.85 0,73Ro2 0.98 0.89 0.74F1 0.40 0.46 0.40F2 0.29 0.27 0.23
Total Hopane / Sterane 6.7 13.6 16.67
Tabel 2. Result of Gas Chromatography and Mass Spectrometry on Shale Rocks of the Sinamar Formation

IJOG
Indonesian Journal on Geoscience, Vol. 1 No. 1 April 2014: 53-64
62
terrestrial plant influence
0.05
0.10
0.20
0.30
0.50
1.00
1.50
20.00 10.00 5.00 2.00 1.00 0.50 0.20 0.10
Tm/Ts
peakmature
late mature
earlymature
Code 12R
Code 13B
Code 13E
C3
0 m
ore
tan
e/h
op
an
e
immature
Figure 8. Cross plot of maturity with triterpane parameter shows that the three rock samples are included into immature category till reaching early mature.
Location Sample Code Lithology TOC (%)Sinamar-4 Well MH 12 M claystone 0,69
MH 12 P claystone 2,69MH 12 R shale 2,08
MH 13 MH 13 A shale 9,02MH 13 B shale 9,53MH 13 C shale 7,45MH 13 D shale 9,12MH 13 E shale 10,84MH 13 E2 shale 8,36
LS 01 LS 01 A claystone 4,23LS 01 G claystone 0,77
RL 04 RL 04 B serpih 3,28RL 25 RL 25 A claystone 3,29MH 03 MH 03 B mudstone 0,64NS 08 NS 08 A mudstone 0,60
Table 3. Total Organic Content of each Location in the Sinamar Formation
13E is 15%, and sample 08MH 12R is 15%. Convertion upon vitrinite reflectance value for sample 08MH 13B is 0.8% which indicates that the maturity has reached the oil window stage. Meanwhile, the other two samples were still at the range of vitrinite reflectance of 0.5% which were included into an immature stage.
Based on mass chromatogram m/z 191 of sample 08MH 13B, 08MH 13E, and 08MH 12R, the maturity can be determined by using ratio C31 22S/22R, C30 morethane/hopane, and Tm/Ts. The proportion change of epimer C-22 from C31 up to C35 increases along with the maturity. On the equilibrium point,
IJOG
Hydrocarbon Source Rock Potential of the Sinamar Formation, Muara Bungo, Jambi (M.H.H. Zajuli and H. Panggabean)
63
the proporsion 225 is 55-60%, while 22R is 40 - 45% (Waples and Machihara, 1991). The proporsion between 22S and 22R of sample 08MH 13B is 56% and 44%, sample 08MH 13E is 24%, and 76%, sample 08MH 12R is 14% and 86%. Therefore, it can be concluded that from the calculation of C31 at the chromatogram, figure mass m/z 191 of sample 08MH 13B has reached equilibrium point or maximum border of maturity that can be measured by triterpane biomarker, while sample 08MH 13E and 08MH 12R have not reached the equilibrium point. If biomarker maturity is converted into vitrinite reflectance (% Ro), the maturity of sample 08MH 13B is 0.6%. It has just reached the diagenesis stage, that has not reached the oil window stage. While the two other rock samples have vitrinite reflectance value of less than 0.5%.
Maturity parameter with ratio C30 mor-ethane/hopane based on morethane is more unstable compared to 17α(H)-hopane, so the concentration decreases by the increase of maturity. Most of morethane disappears in the early mature stage (R0 < 0.6%), so the use of that ratio is very limited. Waples and Machihara (1991) stated that morethane/hopane is said to be mature if the ratio value is less than 0.15%, but less mature if the value is more than 0.15%. The ratio value can only be used as a qualitative indicator of immaturity, if morethane/hopane ratio is above 0.15% and the sample maturity level is less than 0.6% Ro. Sample 08MH 13B and 08MH 13E have morethane/hopane ratio of 0.25 and 0.40, while sample 08MH 12R is 1.25. These three rock samples have the maturity level Ro of < 0.6%.
The increase in maturity causes Tm to disappear, while the concentration of Ts rela-tively increases. Tm/Ts ratio which begins to decrease at the end of the maturity (Waples and Machihara, 1991) is the contrary to morethane/hopane ratio and ratio 22S/(22R+22R). Tm/Ts ratio becoming inaccurate due to facies is pos-sibly caused by the origin of organic material type (Waples and Machihara, 1991). Therefore, it is used as the nonqualitative indicator for relative maturity must be interseries of rock or
oil sample in the same facies. Based on Waples classification (Waples, 1985), the Sinamar shales are categorized as potential source rocks.
Conclusion
Based on the analyses and discussion on the previous parts, it can be concluded that:1. Fine sedimentary rocks of the Sinamar
Formation having the probability to act as source rocks are shale, claystone, and mud-stone. The shale has the largest probability to act as a source rock.
2. Shales of the Sinamar Formation have organic material content which is very sufficient to act as the source rock, and are categorized as potential source rocks.
3. Shale kerogen type is categorized as kero-gen I type tending to produce oil.
4. Shale maturity is categorized as early ma-ture.
Acknowledgements
The authors express gratitude to the whole parties for the cooperation in writing this paper, especiallly to Prof. Dr. Ir. Eddy A. Subroto and PT. Kuansing Inti Makmur (KIM). Sincere thanks are also addressed to the Head of Centre for Geological Survey, Geological Agency for permitting to publish this paper.
References
Bemmelen, van R.W., 1949. The Geology of Indonesia. Vol. I A, The Hague. Netherlands, pp.
De Coster, G.L., 1974. The Geology of the Cen-tral and South Sumatera Basins. Proceedings of Indonesian Petroleum Assosiation 3th An-nual Convention, p.77-110.
Hermiyanto, M.H., 2010. Karakteristik Batuan Sedimen Halus Formasi Sinamar Untuk Mengetahui Potensinya Sebagai Batuan Induk Di Daerah Muara Bungo, Jambi.
IJOG
Indonesian Journal on Geoscience, Vol. 1 No. 1 April 2014: 53-64
64
Thesis, Unpublished, Institut of Teknologi Bandung, 49pp.
Pulunggono, A. Agus Haryo, S., and Kosuma, C.G., 1992. Pre-Tertiary and Tertiary Fault System As a Framework of the South Suma-tra Basin: A strudy of SAR MAPS, Proceed-ings of Indonesian Petroleum Association, 21st Annual Convention, Jakarta, p.339-360.
Rosidi, H.M.D., S. Tjokrosapoetro, B. Pen-dowo, S. Gafoer, and Suharsono, 1996. Peta Geologi Lembar Painan dan Bagian Timur Laut Lembar Muarasiberut, Sumatra, skala 1:250.000. Pusat Penelitian dan Pengemban-gan Geologi, Bandung.
Silitonga, P.H. and Kastowo, 1995. Peta Geologi Lembar Solok skala 1:250.000. Pusat Peneli-tian dan Pengembangan Geologi, Bandung.
Suwarna, N., Budhitrisna, T., Santosa, S., and Mangga S.A., 1994. Peta Geologi Lembar
Rengat skala 1:250.000. Pusat Penelitian dan Pengembangan Geologi, Bandung.
Waples, D.W., 1985. Geochemistry in Petroleum Exploration. International Human Resources Development Corporation, Boston.
Waples, D.W. and Machihara, T., 1991. Bio-markers for geologists - a practical guide to the application of steranes and triterpanes in petroleum geology, American Association of Petroleum Geologists Methods in Explora-tion Series 9. The American Association of Petroleum Geologists, Tulsa, Oklahoma, USA.
Zajuli, M.H.H. and Panggabean, H., 2013. Depositional Environment of Fine-Grained Sedimentary Rocks of the Sinamar Forma-tion, Muara Bungo, Jambi. Indonesian Jour-nal of Geology, 8 (1), p.25-38.