Embed Size (px)
Citation preview
Economic Forecast
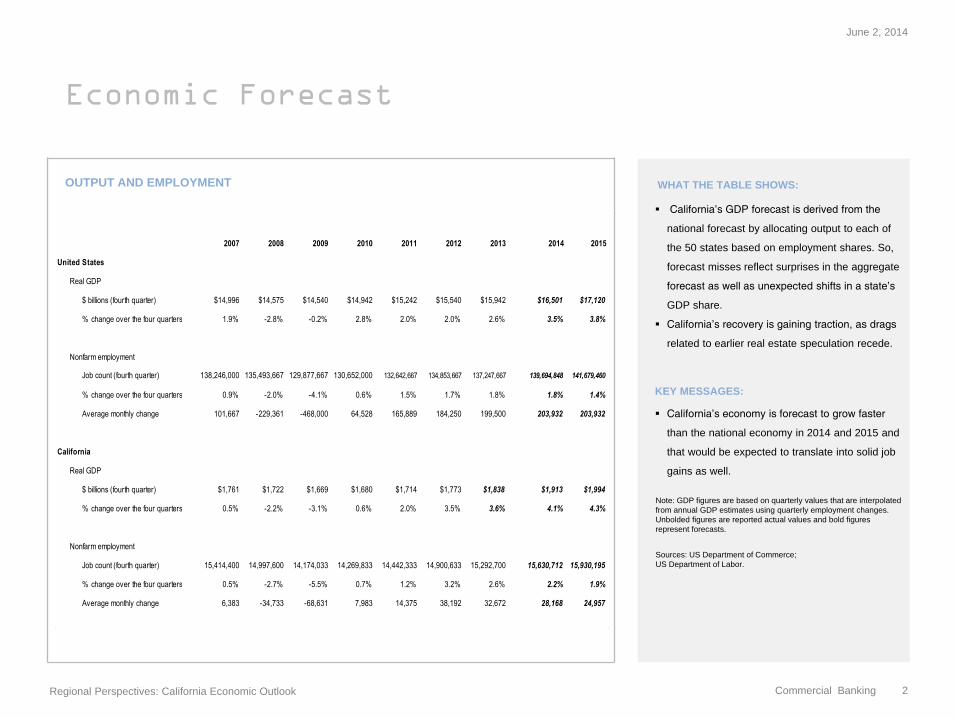
OUTPUT AND EMPLOYMENT WHAT THE TABLE SHOWS:
California’s GDP forecast is derived from the
national forecast by allocating output to each of
the 50 states based on employment shares. So,
forecast misses reflect surprises in the aggregate
forecast as well as unexpected shifts in a state’s
GDP share.
California’s recovery is gaining traction, as drags
related to earlier real estate speculation recede.
KEY MESSAGES:
California’s economy is forecast to grow faster
than the national economy in 2014 and 2015 and
that would be expected to translate into solid job
gains as well.
Note: GDP figures are based on quarterly values that are interpolated
from annual GDP estimates using quarterly employment changes.
Unbolded figures are reported actual values and bold figures
represent forecasts.
Sources: US Department of Commerce;
US Department of Labor.
June 2, 2014
Regional Perspectives: California Economic Outlook
Commercial Banking 2
2007 2008 2009 2010 2011 2012 2013 2014 2015
United States
Real GDP
$ billions (fourth quarter) $14,996 $14,575 $14,540 $14,942 $15,242 $15,540 $15,942 $16,501 $17,120
% change over the four quarters 1.9% -2.8% -0.2% 2.8% 2.0% 2.0% 2.6% 3.5% 3.8%
Nonfarm employment
Job count (fourth quarter) 138,246,000 135,493,667 129,877,667 130,652,000 132,642,667 134,853,667 137,247,667 139,694,848 141,679,460
% change over the four quarters 0.9% -2.0% -4.1% 0.6% 1.5% 1.7% 1.8% 1.8% 1.4%
Average monthly change 101,667 -229,361 -468,000 64,528 165,889 184,250 199,500 203,932 203,932
California
Real GDP
$ billions (fourth quarter) $1,761 $1,722 $1,669 $1,680 $1,714 $1,773 $1,838 $1,913 $1,994
% change over the four quarters 0.5% -2.2% -3.1% 0.6% 2.0% 3.5% 3.6% 4.1% 4.3%
Nonfarm employment
Job count (fourth quarter) 15,414,400 14,997,600 14,174,033 14,269,833 14,442,333 14,900,633 15,292,700 15,630,712 15,930,195
% change over the four quarters 0.5% -2.7% -5.5% 0.7% 1.2% 3.2% 2.6% 2.2% 1.9%
Average monthly change 6,383 -34,733 -68,631 7,983 14,375 38,192 32,672 28,168 24,957
The Economy’s Structure
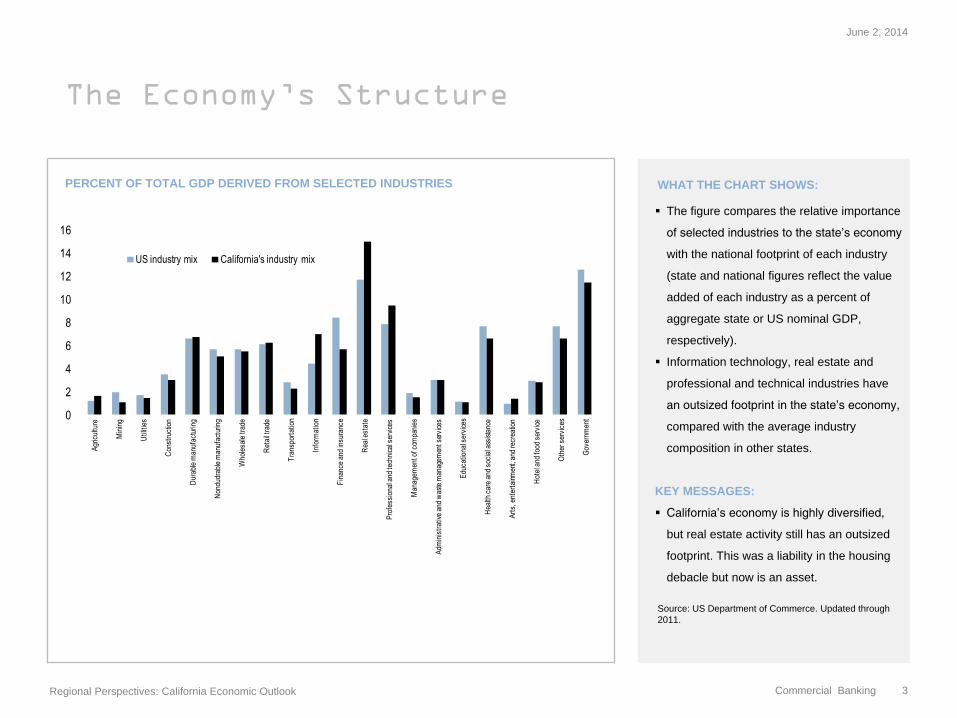
PERCENT OF TOTAL GDP DERIVED FROM SELECTED INDUSTRIES WHAT THE CHART SHOWS:
The figure compares the relative importance
of selected industries to the state’s economy
with the national footprint of each industry
(state and national figures reflect the value
added of each industry as a percent of
aggregate state or US nominal GDP,
respectively).
Information technology, real estate and
professional and technical industries have
an outsized footprint in the state’s economy,
compared with the average industry
composition in other states.
KEY MESSAGES:
California’s economy is highly diversified,
but real estate activity still has an outsized
footprint. This was a liability in the housing
debacle but now is an asset.
Source: US Department of Commerce. Updated through
2011.
June 2, 2014
Regional Perspectives: California Economic Outlook
Commercial Banking 3
0
2
4
6
8
10
12
14
16
Agr
icul
ture
Min
ing
Util
ities
Con
stru
ctio
n
Dur
able
man
ufac
turin
g
Non
dudr
able
man
ufac
turin
g
Who
lesa
le tr
ade
Ret
ail t
rade
Tra
nspo
rtat
ion
Info
rmat
ion
Fin
ance
and
insu
ranc
e
Rea
l est
ate
Pro
fess
iona
l and
tech
nica
l ser
vice
s
Man
agem
ent o
f com
pani
es
Adm
inis
trat
ive
and
was
te m
anag
emen
t ser
vice
s
Edu
catio
nal s
ervi
ces
Hea
lth c
are
and
soci
al a
ssis
tanc
e
Art
s, e
nter
tain
men
t, an
d re
crea
tion
Hot
el a
nd fo
od s
ervi
ce
Oth
er s
ervi
ces
Gov
ernm
ent
US industry mix California's industry mix
Relative House Prices
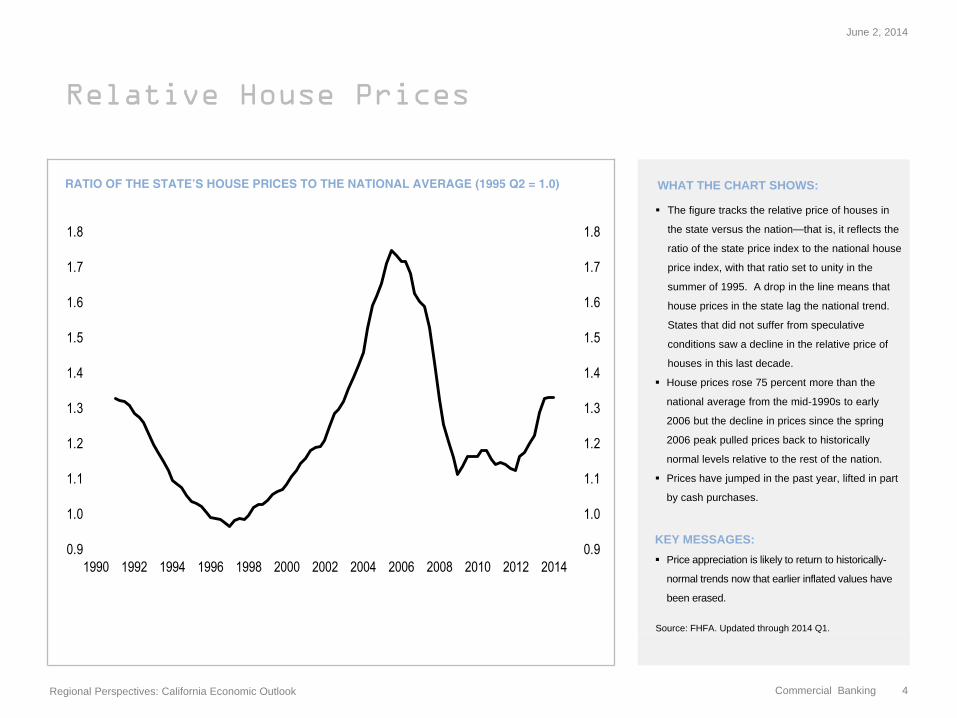
RATIO OF THE STATE’S HOUSE PRICES TO THE NATIONAL AVERAGE (1995 Q2 = 1.0) WHAT THE CHART SHOWS:
The figure tracks the relative price of houses in
the state versus the nation—that is, it reflects the
ratio of the state price index to the national house
price index, with that ratio set to unity in the
summer of 1995. A drop in the line means that
house prices in the state lag the national trend.
States that did not suffer from speculative
conditions saw a decline in the relative price of
houses in this last decade.
House prices rose 75 percent more than the
national average from the mid-1990s to early
2006 but the decline in prices since the spring
2006 peak pulled prices back to historically
normal levels relative to the rest of the nation.
Prices have jumped in the past year, lifted in part
by cash purchases.
KEY MESSAGES:
Price appreciation is likely to return to historically-
normal trends now that earlier inflated values have
been erased.
Source: FHFA. Updated through 2014 Q1.
June 2, 2014
Regional Perspectives: California Economic Outlook
Commercial Banking 4
0.9
1.0
1.1
1.2
1.3
1.4
1.5
1.6
1.7
1.8
0.9
1.0
1.1
1.2
1.3
1.4
1.5
1.6
1.7
1.8
1990 1992 1994 1996 1998 2000 2002 2004 2006 2008 2010 2012 2014
Real Estate Markets
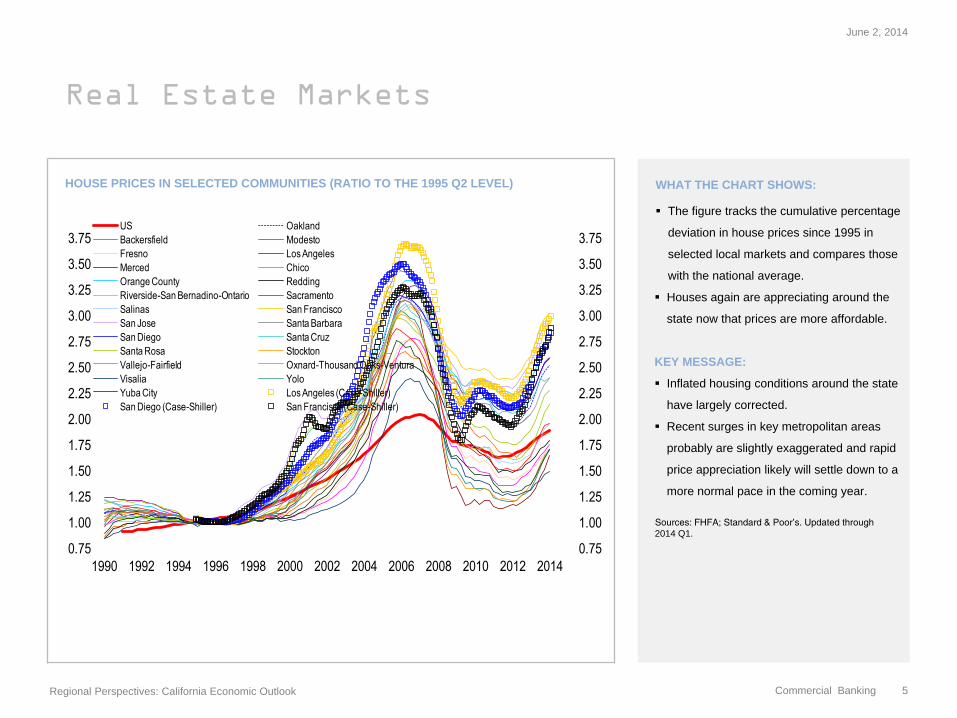
HOUSE PRICES IN SELECTED COMMUNITIES (RATIO TO THE 1995 Q2 LEVEL) WHAT THE CHART SHOWS:
The figure tracks the cumulative percentage
deviation in house prices since 1995 in
selected local markets and compares those
with the national average.
Houses again are appreciating around the
state now that prices are more affordable.
KEY MESSAGE:
Inflated housing conditions around the state
have largely corrected.
Recent surges in key metropolitan areas
probably are slightly exaggerated and rapid
price appreciation likely will settle down to a
more normal pace in the coming year.
Sources: FHFA; Standard & Poor’s. Updated through
2014 Q1.
June 2, 2014
Regional Perspectives: California Economic Outlook
Commercial Banking 5
0.75
1.00
1.25
1.50
1.75
2.00
2.25
2.50
2.75
3.00
3.25
3.50
3.75
0.75
1.00
1.25
1.50
1.75
2.00
2.25
2.50
2.75
3.00
3.25
3.50
3.75
1990 1992 1994 1996 1998 2000 2002 2004 2006 2008 2010 2012 2014
US Oakland
Backersfield Modesto
Fresno Los Angeles
Merced Chico
Orange County Redding
Riverside-San Bernadino-Ontario Sacramento
Salinas San Francisco
San Jose Santa Barbara
San Diego Santa Cruz
Santa Rosa Stockton
Vallejo-Fairfield Oxnard-Thousand Oaks-Ventura
Visalia Yolo
Yuba City Los Angeles (Case-Shiller)
San Diego (Case-Shiller) San Francisco (Case-Shiller)
Real Estate Markets
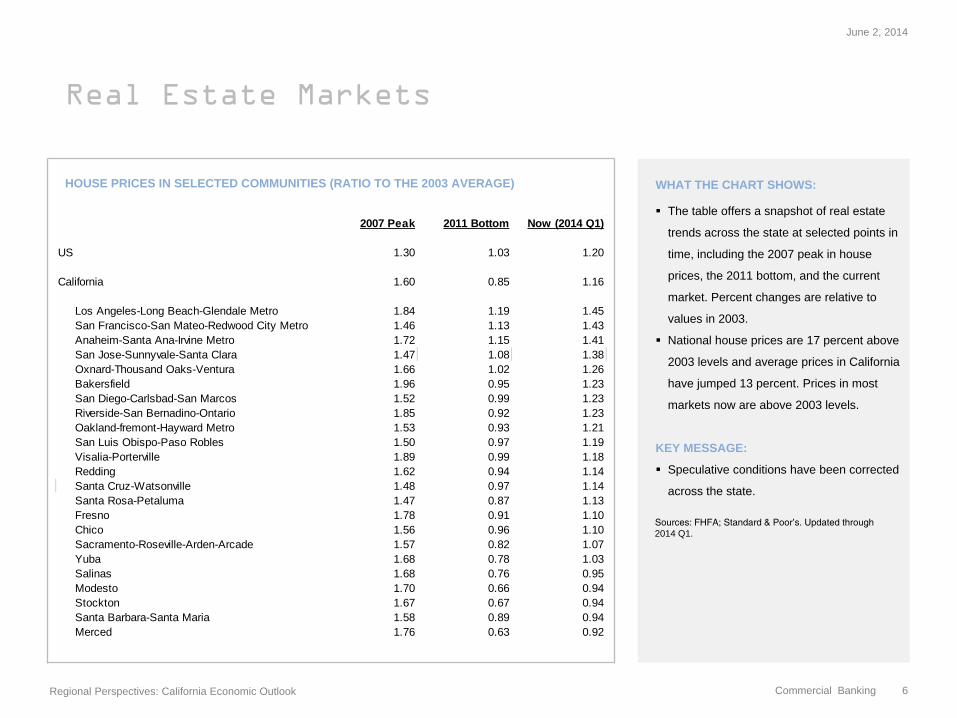
HOUSE PRICES IN SELECTED COMMUNITIES (RATIO TO THE 2003 AVERAGE) WHAT THE CHART SHOWS:
The table offers a snapshot of real estate
trends across the state at selected points in
time, including the 2007 peak in house
prices, the 2011 bottom, and the current
market. Percent changes are relative to
values in 2003.
National house prices are 17 percent above
2003 levels and average prices in California
have jumped 13 percent. Prices in most
markets now are above 2003 levels.
KEY MESSAGE:
Speculative conditions have been corrected
across the state.
Sources: FHFA; Standard & Poor’s. Updated through
2014 Q1.
June 2, 2014
Regional Perspectives: California Economic Outlook
Commercial Banking 6
2007 Peak 2011 Bottom Now (2014 Q1)
US 1.30 1.03 1.20
California 1.60 0.85 1.16
Los Angeles-Long Beach-Glendale Metro 1.84 1.19 1.45
San Francisco-San Mateo-Redwood City Metro 1.46 1.13 1.43
Anaheim-Santa Ana-Irvine Metro 1.72 1.15 1.41
San Jose-Sunnyvale-Santa Clara 1.47 1.08 1.38
Oxnard-Thousand Oaks-Ventura 1.66 1.02 1.26
Bakersfield 1.96 0.95 1.23
San Diego-Carlsbad-San Marcos 1.52 0.99 1.23
Riverside-San Bernadino-Ontario 1.85 0.92 1.23
Oakland-fremont-Hayward Metro 1.53 0.93 1.21
San Luis Obispo-Paso Robles 1.50 0.97 1.19
Visalia-Porterville 1.89 0.99 1.18
Redding 1.62 0.94 1.14
Santa Cruz-Watsonville 1.48 0.97 1.14
Santa Rosa-Petaluma 1.47 0.87 1.13
Fresno 1.78 0.91 1.10
Chico 1.56 0.96 1.10
Sacramento-Roseville-Arden-Arcade 1.57 0.82 1.07
Yuba 1.68 0.78 1.03
Salinas 1.68 0.76 0.95
Modesto 1.70 0.66 0.94
Stockton 1.67 0.67 0.94
Santa Barbara-Santa Maria 1.58 0.89 0.94
Merced 1.76 0.63 0.92
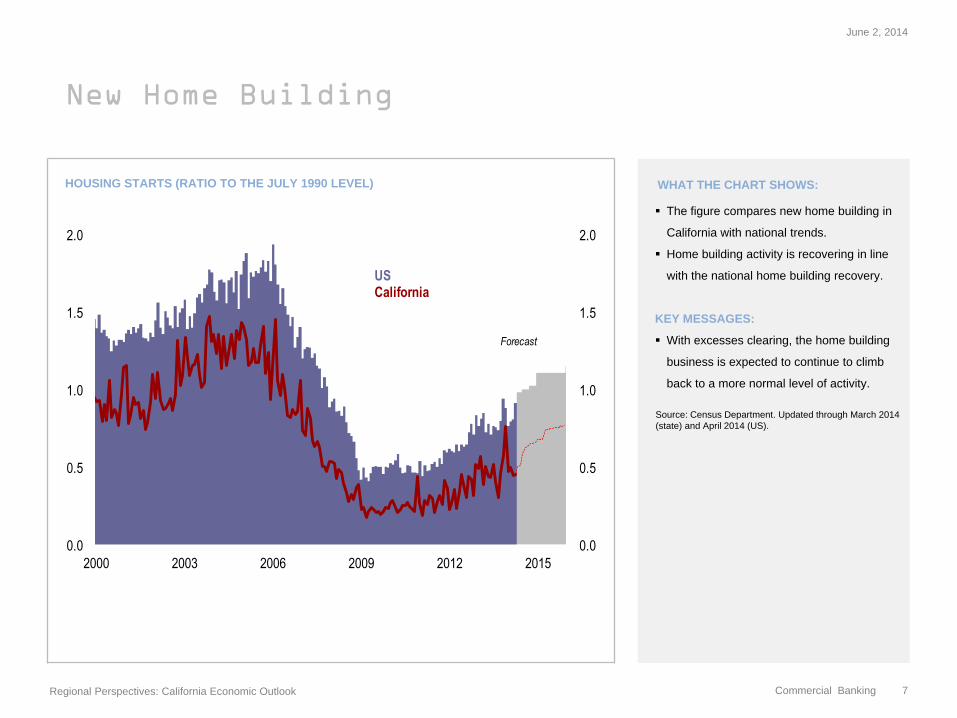
New Home Building
HOUSING STARTS (RATIO TO THE JULY 1990 LEVEL) WHAT THE CHART SHOWS:
The figure compares new home building in
California with national trends.
Home building activity is recovering in line
with the national home building recovery.
KEY MESSAGES:
With excesses clearing, the home building
business is expected to continue to climb
back to a more normal level of activity.
Source: Census Department. Updated through March 2014
(state) and April 2014 (US).
June 2, 2014
Regional Perspectives: California Economic Outlook
Commercial Banking 7
0.0
0.5
1.0
1.5
2.0
0.0
0.5
1.0
1.5
2.0
2000 2003 2006 2009 2012 2015
USCalifornia
Forecast
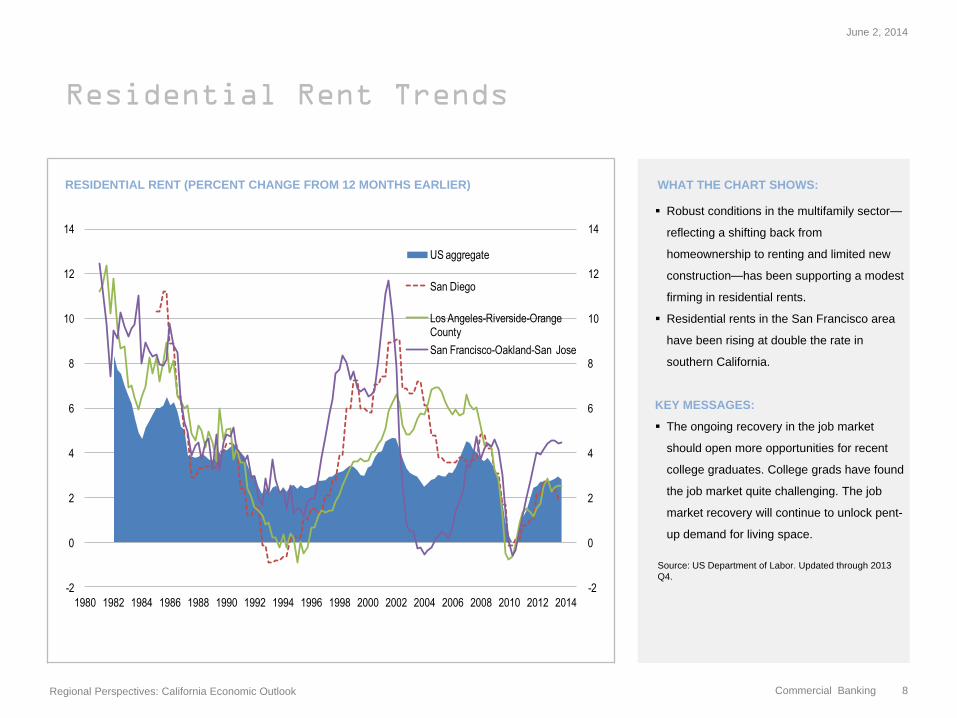
Residential Rent Trends
RESIDENTIAL RENT (PERCENT CHANGE FROM 12 MONTHS EARLIER) WHAT THE CHART SHOWS:
Robust conditions in the multifamily sector—
reflecting a shifting back from
homeownership to renting and limited new
construction—has been supporting a modest
firming in residential rents.
Residential rents in the San Francisco area
have been rising at double the rate in
southern California.
KEY MESSAGES:
The ongoing recovery in the job market
should open more opportunities for recent
college graduates. College grads have found
the job market quite challenging. The job
market recovery will continue to unlock pent-
up demand for living space.
Source: US Department of Labor. Updated through 2013
Q4.
June 2, 2014
Regional Perspectives: California Economic Outlook
Commercial Banking 8
-2
0
2
4
6
8
10
12
14
-2
0
2
4
6
8
10
12
14
1980 1982 1984 1986 1988 1990 1992 1994 1996 1998 2000 2002 2004 2006 2008 2010 2012 2014
US aggregate
San Diego
Los Angeles-Riverside-Orange County
San Francisco-Oakland-San Jose
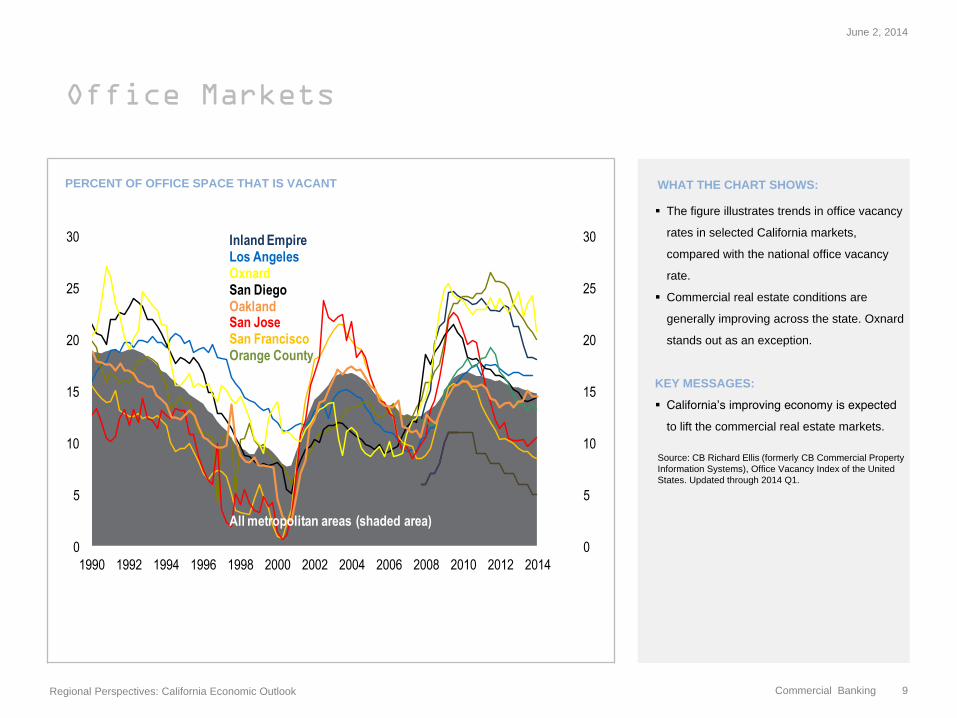
Office Markets
PERCENT OF OFFICE SPACE THAT IS VACANT WHAT THE CHART SHOWS:
The figure illustrates trends in office vacancy
rates in selected California markets,
compared with the national office vacancy
rate.
Commercial real estate conditions are
generally improving across the state. Oxnard
stands out as an exception.
KEY MESSAGES:
California’s improving economy is expected
to lift the commercial real estate markets.
Source: CB Richard Ellis (formerly CB Commercial Property
Information Systems), Office Vacancy Index of the United
States. Updated through 2014 Q1.
June 2, 2014
Regional Perspectives: California Economic Outlook
Commercial Banking 9
0
5
10
15
20
25
30
0
5
10
15
20
25
30
1990 1992 1994 1996 1998 2000 2002 2004 2006 2008 2010 2012 2014
Inland EmpireLos AngelesOxnardSan DiegoOaklandSan JoseSan FranciscoOrange County
All metropolitan areas (shaded area)
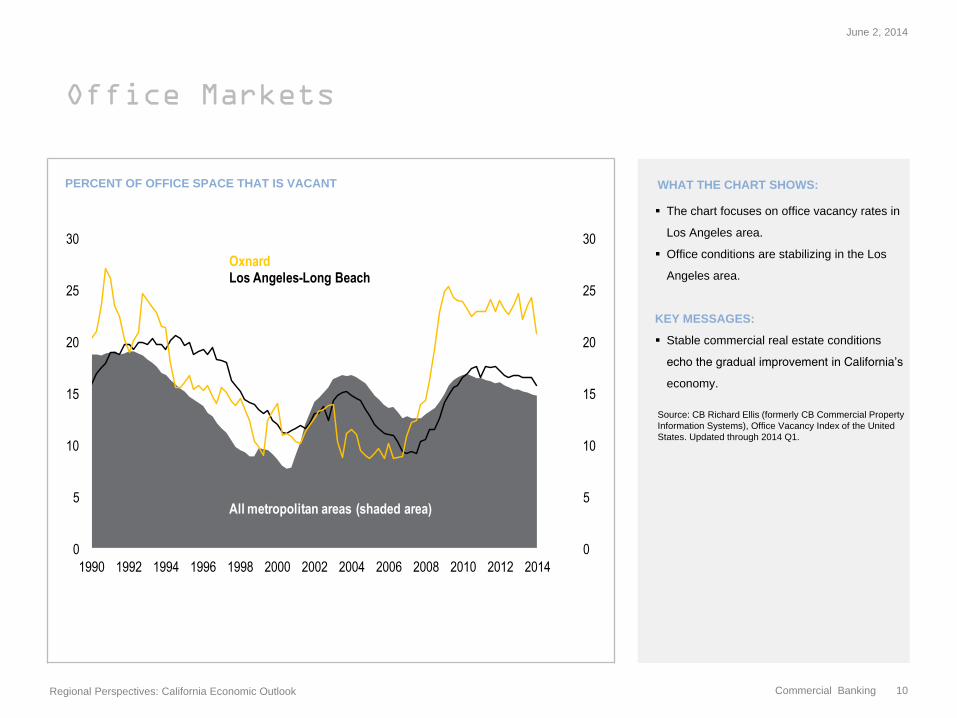
Office Markets
PERCENT OF OFFICE SPACE THAT IS VACANT WHAT THE CHART SHOWS:
The chart focuses on office vacancy rates in
Los Angeles area.
Office conditions are stabilizing in the Los
Angeles area.
KEY MESSAGES:
Stable commercial real estate conditions
echo the gradual improvement in California’s
economy.
Source: CB Richard Ellis (formerly CB Commercial Property
Information Systems), Office Vacancy Index of the United
States. Updated through 2014 Q1.
June 2, 2014
Regional Perspectives: California Economic Outlook
Commercial Banking 10
0
5
10
15
20
25
30
0
5
10
15
20
25
30
1990 1992 1994 1996 1998 2000 2002 2004 2006 2008 2010 2012 2014
OxnardLos Angeles-Long Beach
All metropolitan areas (shaded area)
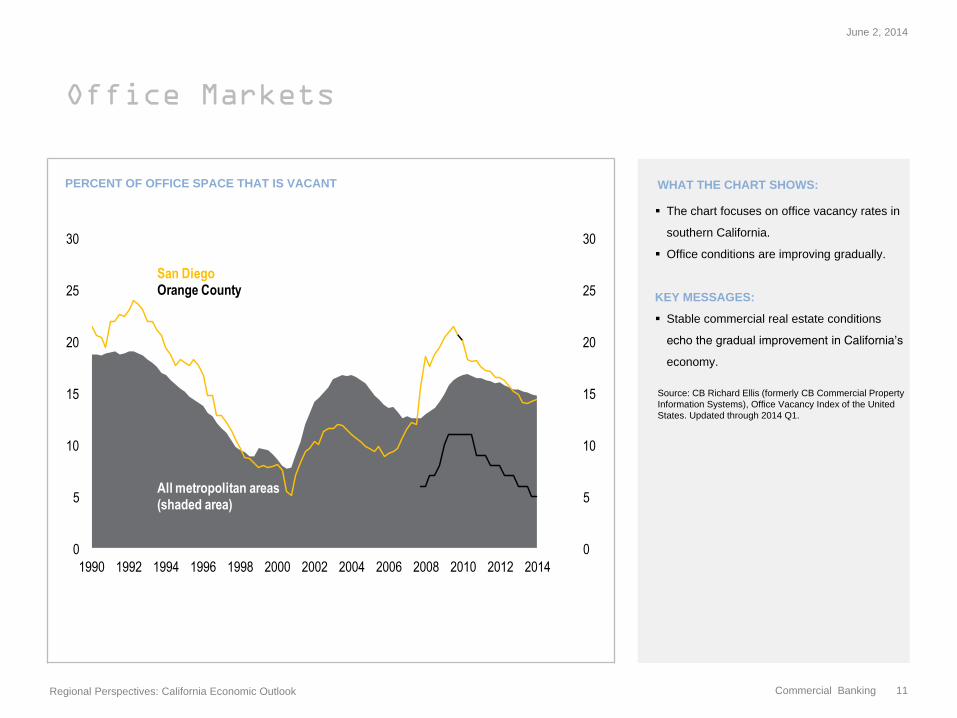
Office Markets
PERCENT OF OFFICE SPACE THAT IS VACANT WHAT THE CHART SHOWS:
The chart focuses on office vacancy rates in
southern California.
Office conditions are improving gradually.
KEY MESSAGES:
Stable commercial real estate conditions
echo the gradual improvement in California’s
economy.
Source: CB Richard Ellis (formerly CB Commercial Property
Information Systems), Office Vacancy Index of the United
States. Updated through 2014 Q1.
June 2, 2014
Regional Perspectives: California Economic Outlook
Commercial Banking 11
0
5
10
15
20
25
30
0
5
10
15
20
25
30
1990 1992 1994 1996 1998 2000 2002 2004 2006 2008 2010 2012 2014
San DiegoOrange County
All metropolitan areas (shaded area)
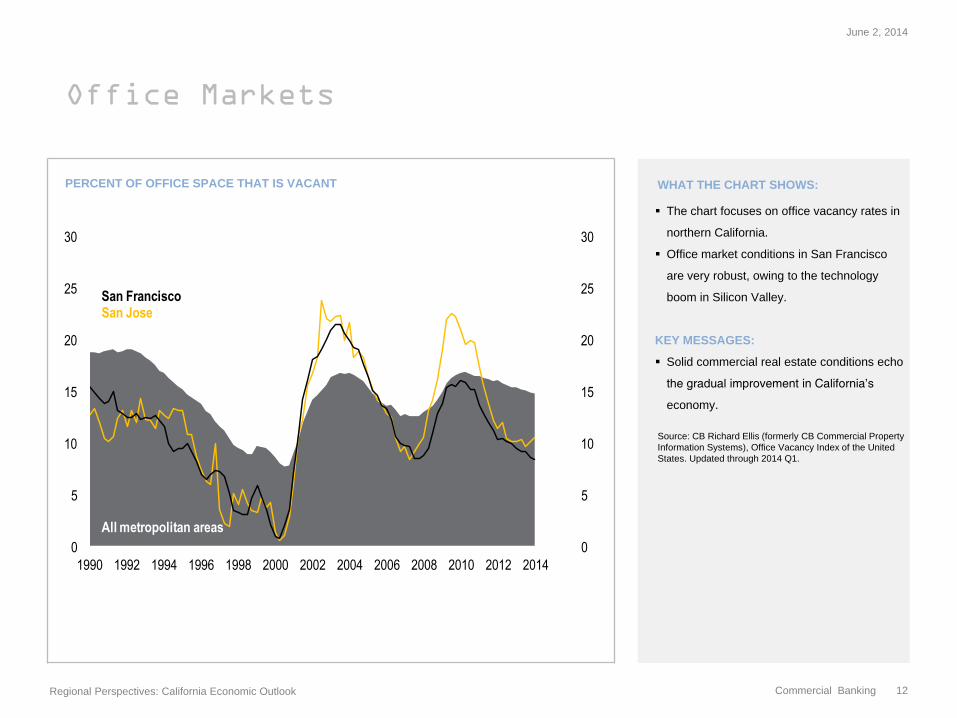
Office Markets
PERCENT OF OFFICE SPACE THAT IS VACANT WHAT THE CHART SHOWS:
The chart focuses on office vacancy rates in
northern California.
Office market conditions in San Francisco
are very robust, owing to the technology
boom in Silicon Valley.
KEY MESSAGES:
Solid commercial real estate conditions echo
the gradual improvement in California’s
economy.
Source: CB Richard Ellis (formerly CB Commercial Property
Information Systems), Office Vacancy Index of the United
States. Updated through 2014 Q1.
June 2, 2014
Regional Perspectives: California Economic Outlook
Commercial Banking 12
0
5
10
15
20
25
30
0
5
10
15
20
25
30
1990 1992 1994 1996 1998 2000 2002 2004 2006 2008 2010 2012 2014
San FranciscoSan Jose
All metropolitan areas
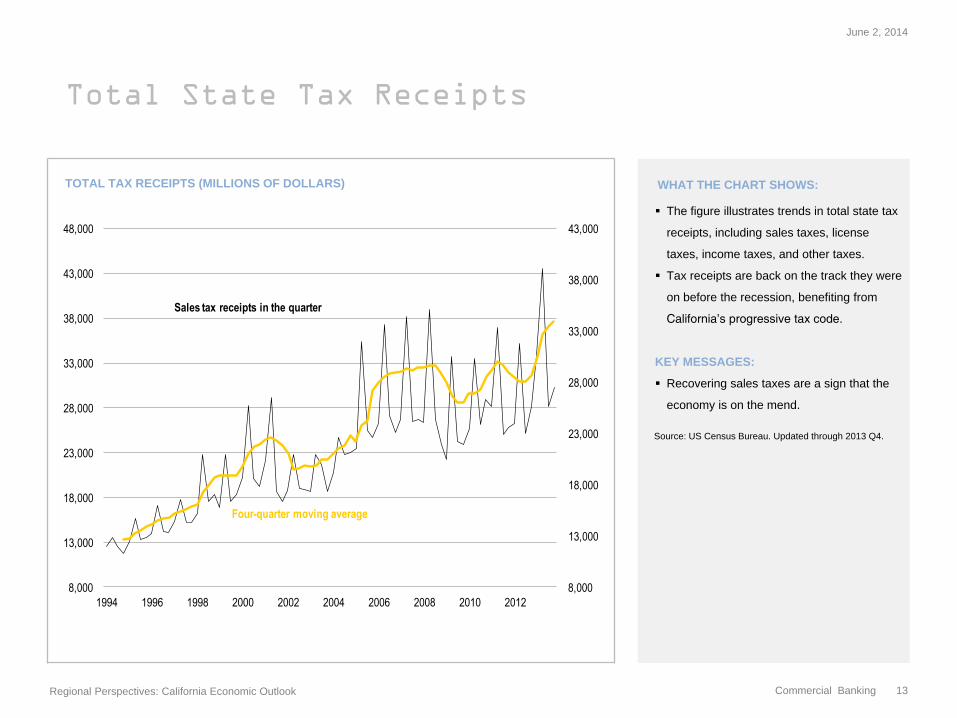
Total State Tax Receipts
TOTAL TAX RECEIPTS (MILLIONS OF DOLLARS) WHAT THE CHART SHOWS:
The figure illustrates trends in total state tax
receipts, including sales taxes, license
taxes, income taxes, and other taxes.
Tax receipts are back on the track they were
on before the recession, benefiting from
California’s progressive tax code.
KEY MESSAGES:
Recovering sales taxes are a sign that the
economy is on the mend.
Source: US Census Bureau. Updated through 2013 Q4.
June 2, 2014
Regional Perspectives: California Economic Outlook
Commercial Banking 13
8,000
13,000
18,000
23,000
28,000
33,000
38,000
43,000
8,000
13,000
18,000
23,000
28,000
33,000
38,000
43,000
48,000
1994 1996 1998 2000 2002 2004 2006 2008 2010 2012
Sales tax receipts in the quarter
Four-quarter moving average
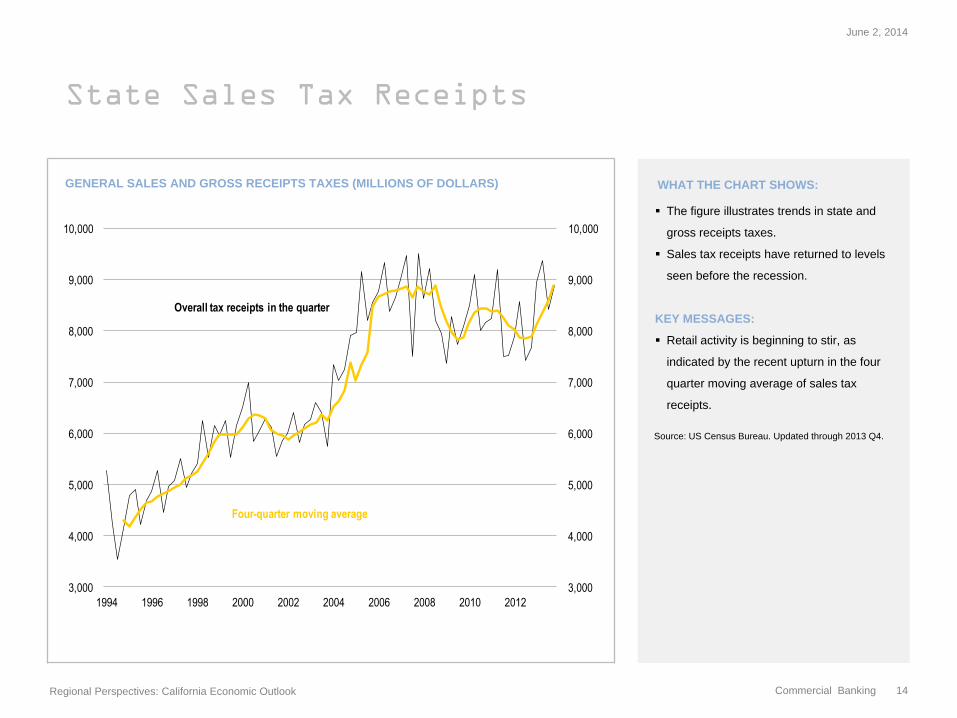
State Sales Tax Receipts
GENERAL SALES AND GROSS RECEIPTS TAXES (MILLIONS OF DOLLARS) WHAT THE CHART SHOWS:
The figure illustrates trends in state and
gross receipts taxes.
Sales tax receipts have returned to levels
seen before the recession.
KEY MESSAGES:
Retail activity is beginning to stir, as
indicated by the recent upturn in the four
quarter moving average of sales tax
receipts.
Source: US Census Bureau. Updated through 2013 Q4.
June 2, 2014
Regional Perspectives: California Economic Outlook
Commercial Banking 14
3,000
4,000
5,000
6,000
7,000
8,000
9,000
10,000
3,000
4,000
5,000
6,000
7,000
8,000
9,000
10,000
1994 1996 1998 2000 2002 2004 2006 2008 2010 2012
Overall tax receipts in the quarter
Four-quarter moving average
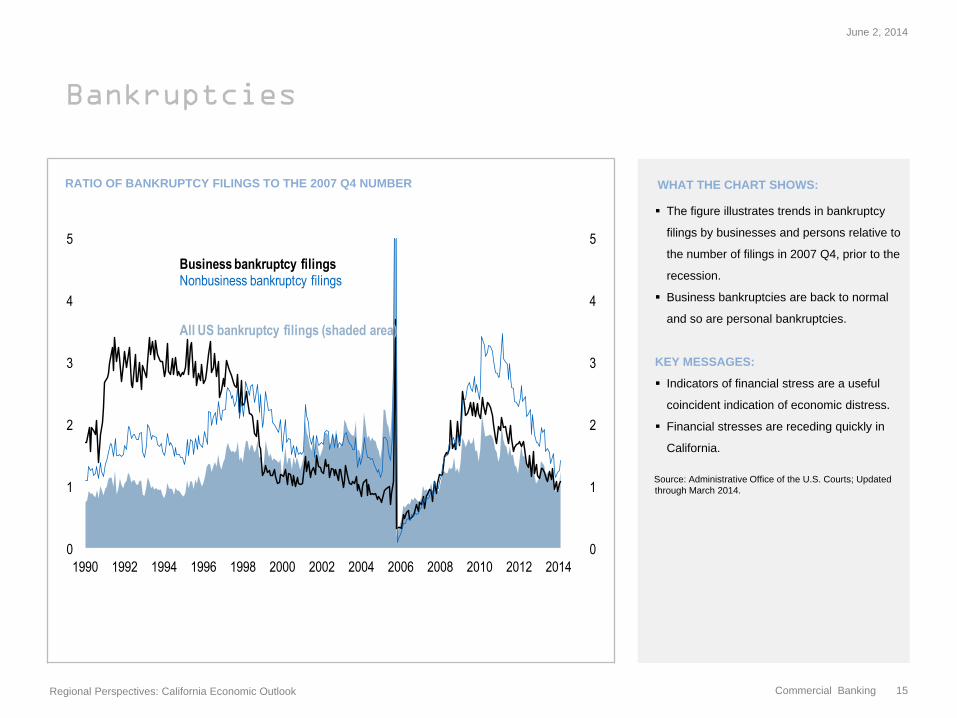
Bankruptcies
RATIO OF BANKRUPTCY FILINGS TO THE 2007 Q4 NUMBER WHAT THE CHART SHOWS:
The figure illustrates trends in bankruptcy
filings by businesses and persons relative to
the number of filings in 2007 Q4, prior to the
recession.
Business bankruptcies are back to normal
and so are personal bankruptcies.
KEY MESSAGES:
Indicators of financial stress are a useful
coincident indication of economic distress.
Financial stresses are receding quickly in
California.
Source: Administrative Office of the U.S. Courts; Updated
through March 2014.
June 2, 2014
Regional Perspectives: California Economic Outlook
Commercial Banking 15
0
1
2
3
4
5
0
1
2
3
4
5
1990 1992 1994 1996 1998 2000 2002 2004 2006 2008 2010 2012 2014
Business bankruptcy filingsNonbusiness bankruptcy filings
All US bankruptcy filings (shaded area)
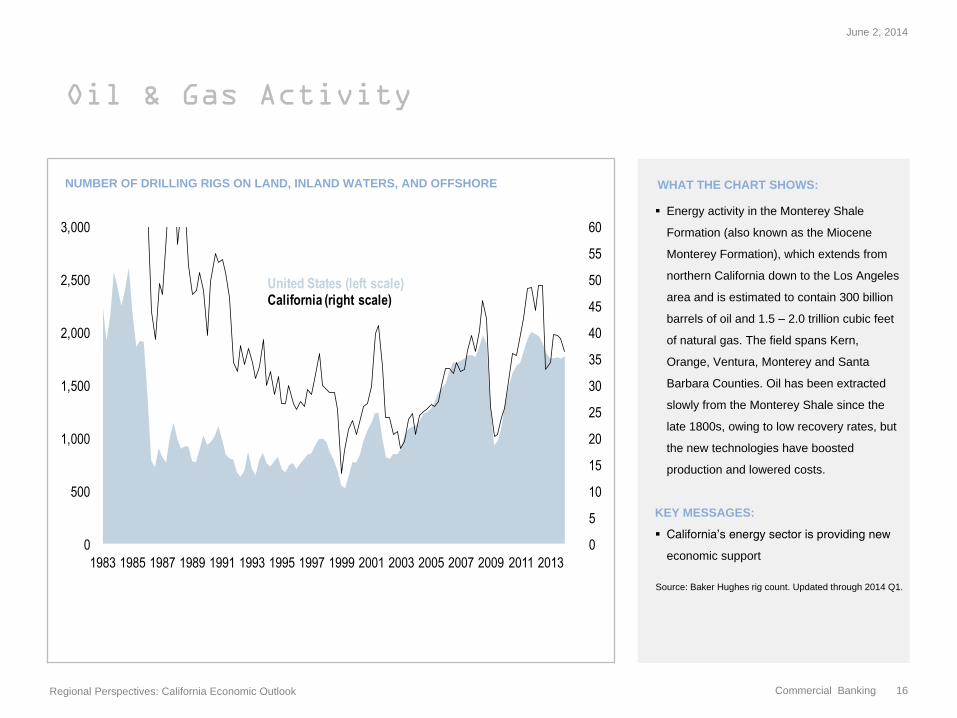
Oil & Gas Activity
NUMBER OF DRILLING RIGS ON LAND, INLAND WATERS, AND OFFSHORE WHAT THE CHART SHOWS:
Energy activity in the Monterey Shale
Formation (also known as the Miocene
Monterey Formation), which extends from
northern California down to the Los Angeles
area and is estimated to contain 300 billion
barrels of oil and 1.5 – 2.0 trillion cubic feet
of natural gas. The field spans Kern,
Orange, Ventura, Monterey and Santa
Barbara Counties. Oil has been extracted
slowly from the Monterey Shale since the
late 1800s, owing to low recovery rates, but
the new technologies have boosted
production and lowered costs.
KEY MESSAGES:
California’s energy sector is providing new
economic support
Source: Baker Hughes rig count. Updated through 2014 Q1.
June 2, 2014
Regional Perspectives: California Economic Outlook
Commercial Banking 16
0
5
10
15
20
25
30
35
40
45
50
55
60
0
500
1,000
1,500
2,000
2,500
3,000
1983 1985 1987 1989 1991 1993 1995 1997 1999 2001 2003 2005 2007 2009 2011 2013
United States (left scale)California (right scale)
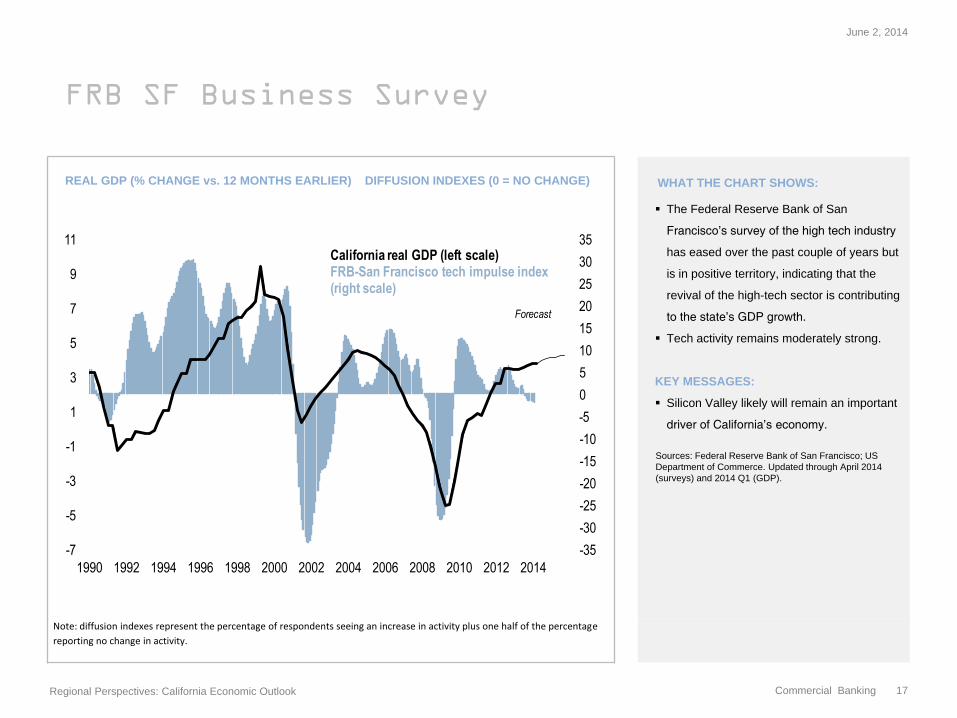
FRB SF Business Survey
REAL GDP (% CHANGE vs. 12 MONTHS EARLIER) DIFFUSION INDEXES (0 = NO CHANGE) WHAT THE CHART SHOWS:
The Federal Reserve Bank of San
Francisco’s survey of the high tech industry
has eased over the past couple of years but
is in positive territory, indicating that the
revival of the high-tech sector is contributing
to the state’s GDP growth.
Tech activity remains moderately strong.
KEY MESSAGES:
Silicon Valley likely will remain an important
driver of California’s economy.
Sources: Federal Reserve Bank of San Francisco; US
Department of Commerce. Updated through April 2014
(surveys) and 2014 Q1 (GDP).
Note: diffusion indexes represent the percentage of respondents seeing an increase in activity plus one half of the percentage
reporting no change in activity.
June 2, 2014
Regional Perspectives: California Economic Outlook
Commercial Banking 17
-35
-30
-25
-20
-15
-10
-5
0
5
10
15
20
25
30
35
-7
-5
-3
-1
1
3
5
7
9
11
1990 1992 1994 1996 1998 2000 2002 2004 2006 2008 2010 2012 2014
California real GDP (left scale)FRB-San Francisco tech impulse index (right scale)
Forecast
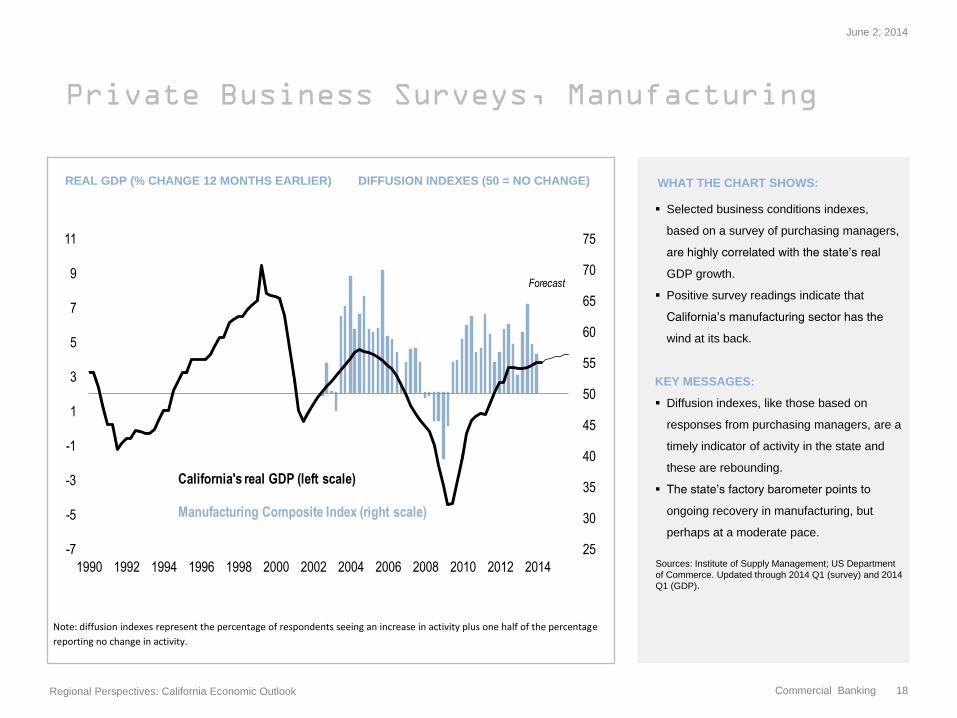
Private Business Surveys, Manufacturing
REAL GDP (% CHANGE 12 MONTHS EARLIER) DIFFUSION INDEXES (50 = NO CHANGE) WHAT THE CHART SHOWS:
Selected business conditions indexes,
based on a survey of purchasing managers,
are highly correlated with the state’s real
GDP growth.
Positive survey readings indicate that
California’s manufacturing sector has the
wind at its back.
KEY MESSAGES:
Diffusion indexes, like those based on
responses from purchasing managers, are a
timely indicator of activity in the state and
these are rebounding.
The state’s factory barometer points to
ongoing recovery in manufacturing, but
perhaps at a moderate pace.
Sources: Institute of Supply Management; US Department
of Commerce. Updated through 2014 Q1 (survey) and 2014
Q1 (GDP).
Note: diffusion indexes represent the percentage of respondents seeing an increase in activity plus one half of the percentage
reporting no change in activity.
June 2, 2014
Regional Perspectives: California Economic Outlook
Commercial Banking 18
25
30
35
40
45
50
55
60
65
70
75
-7
-5
-3
-1
1
3
5
7
9
11
1990 1992 1994 1996 1998 2000 2002 2004 2006 2008 2010 2012 2014
California's real GDP (left scale)
Manufacturing Composite Index (right scale)
Forecast
Private Business Surveys, High Tech
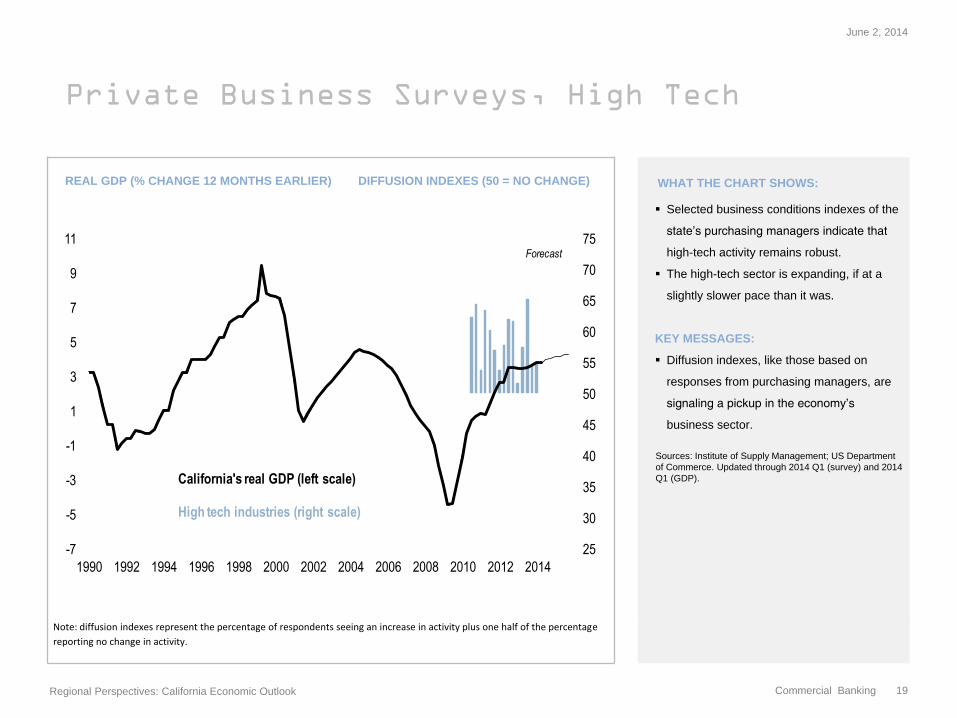
REAL GDP (% CHANGE 12 MONTHS EARLIER) DIFFUSION INDEXES (50 = NO CHANGE) WHAT THE CHART SHOWS:
Selected business conditions indexes of the
state’s purchasing managers indicate that
high-tech activity remains robust.
The high-tech sector is expanding, if at a
slightly slower pace than it was.
KEY MESSAGES:
Diffusion indexes, like those based on
responses from purchasing managers, are
signaling a pickup in the economy’s
business sector.
Sources: Institute of Supply Management; US Department
of Commerce. Updated through 2014 Q1 (survey) and 2014
Q1 (GDP).
Note: diffusion indexes represent the percentage of respondents seeing an increase in activity plus one half of the percentage
reporting no change in activity.
June 2, 2014
Regional Perspectives: California Economic Outlook
Commercial Banking 19
25
30
35
40
45
50
55
60
65
70
75
-7
-5
-3
-1
1
3
5
7
9
11
1990 1992 1994 1996 1998 2000 2002 2004 2006 2008 2010 2012 2014
California's real GDP (left scale)
High tech industries (right scale)
Forecast
Private Business Surveys, Orange County
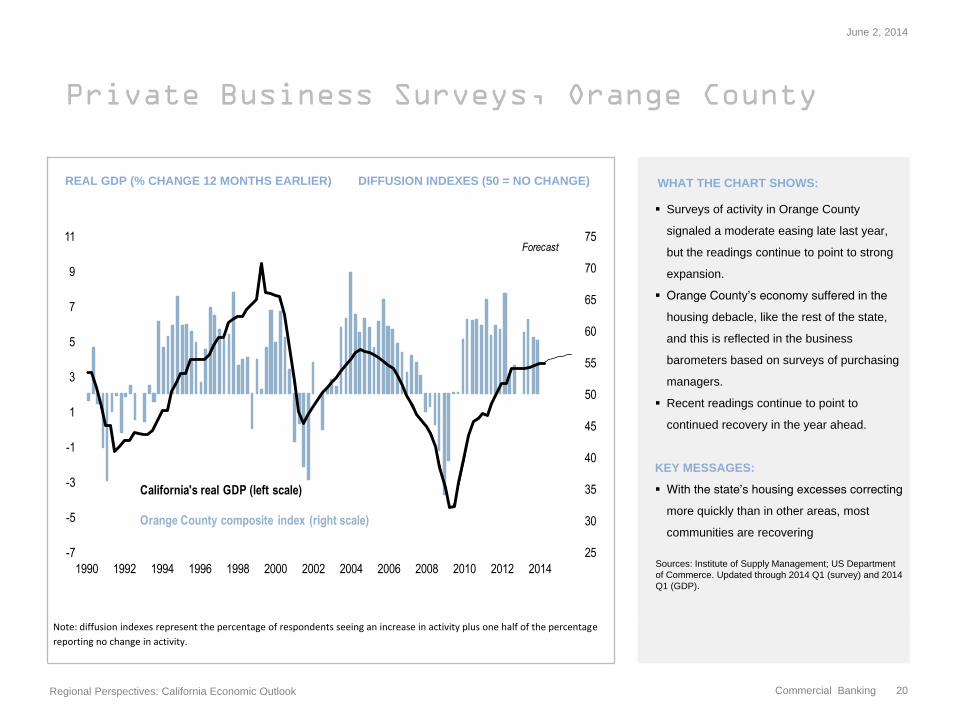
REAL GDP (% CHANGE 12 MONTHS EARLIER) DIFFUSION INDEXES (50 = NO CHANGE) WHAT THE CHART SHOWS:
Surveys of activity in Orange County
signaled a moderate easing late last year,
but the readings continue to point to strong
expansion.
Orange County’s economy suffered in the
housing debacle, like the rest of the state,
and this is reflected in the business
barometers based on surveys of purchasing
managers.
Recent readings continue to point to
continued recovery in the year ahead.
KEY MESSAGES:
With the state’s housing excesses correcting
more quickly than in other areas, most
communities are recovering
Sources: Institute of Supply Management; US Department
of Commerce. Updated through 2014 Q1 (survey) and 2014
Q1 (GDP).
Note: diffusion indexes represent the percentage of respondents seeing an increase in activity plus one half of the percentage
reporting no change in activity.
June 2, 2014
Regional Perspectives: California Economic Outlook
Commercial Banking 20
25
30
35
40
45
50
55
60
65
70
75
-7
-5
-3
-1
1
3
5
7
9
11
1990 1992 1994 1996 1998 2000 2002 2004 2006 2008 2010 2012 2014
California's real GDP (left scale)
Orange County composite index (right scale)
Forecast
Initial Jobless Claims
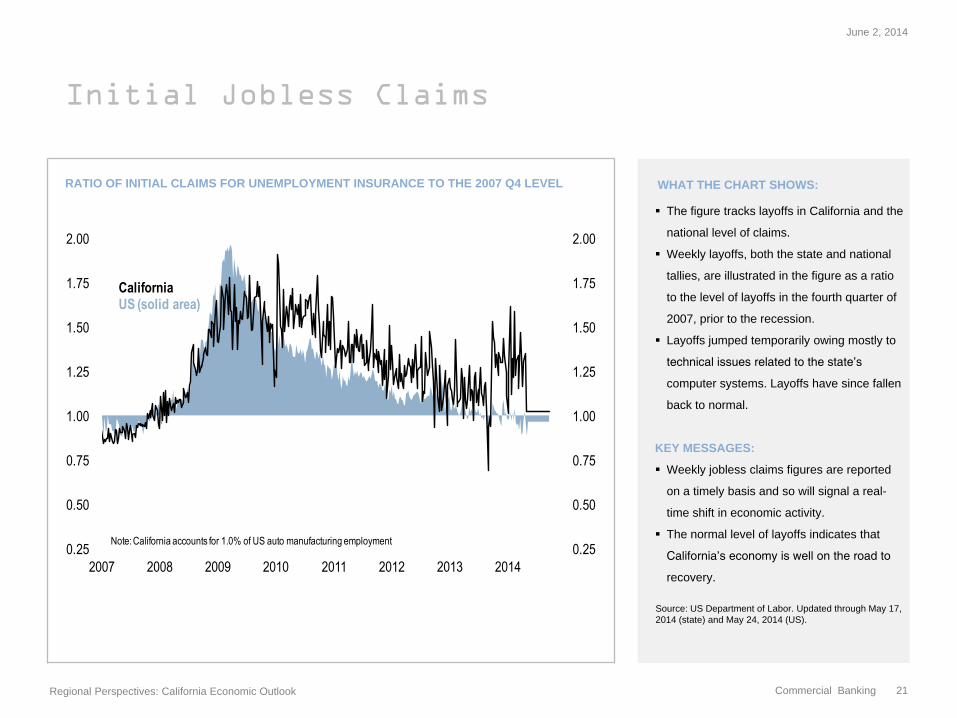
RATIO OF INITIAL CLAIMS FOR UNEMPLOYMENT INSURANCE TO THE 2007 Q4 LEVEL WHAT THE CHART SHOWS:
The figure tracks layoffs in California and the
national level of claims.
Weekly layoffs, both the state and national
tallies, are illustrated in the figure as a ratio
to the level of layoffs in the fourth quarter of
2007, prior to the recession.
Layoffs jumped temporarily owing mostly to
technical issues related to the state’s
computer systems. Layoffs have since fallen
back to normal.
KEY MESSAGES:
Weekly jobless claims figures are reported
on a timely basis and so will signal a real-
time shift in economic activity.
The normal level of layoffs indicates that
California’s economy is well on the road to
recovery.
Source: US Department of Labor. Updated through May 17,
2014 (state) and May 24, 2014 (US).
June 2, 2014
Regional Perspectives: California Economic Outlook
Commercial Banking 21
0.25
0.50
0.75
1.00
1.25
1.50
1.75
2.00
0.25
0.50
0.75
1.00
1.25
1.50
1.75
2.00
2007 2008 2009 2010 2011 2012 2013 2014
CaliforniaUS (solid area)
Note: California accounts for 1.0% of US auto manufacturing employment
Economic Growth
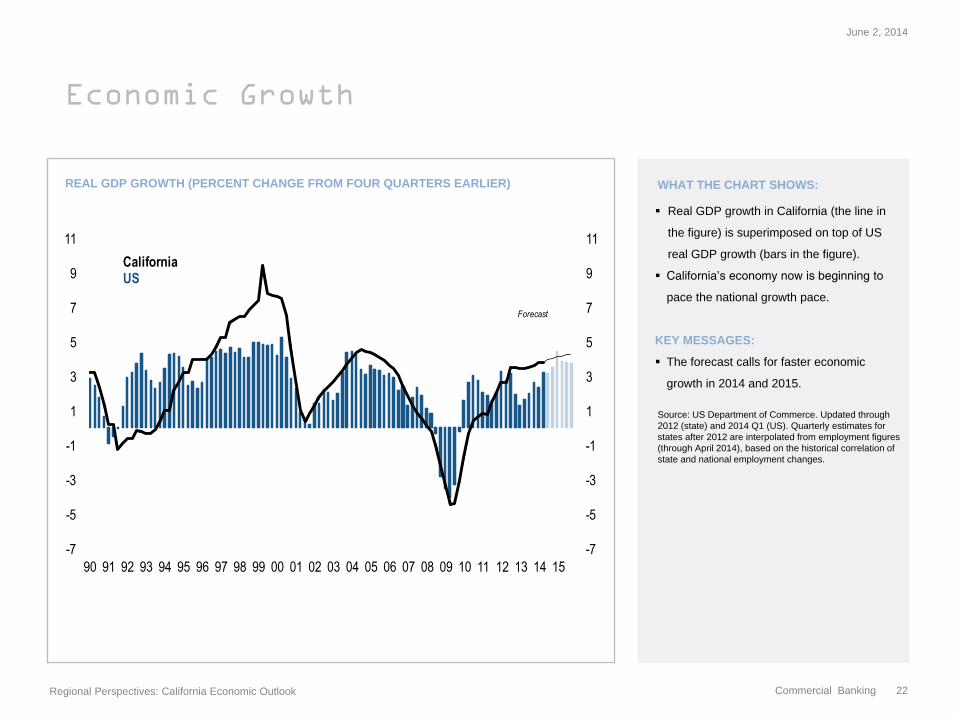
REAL GDP GROWTH (PERCENT CHANGE FROM FOUR QUARTERS EARLIER) WHAT THE CHART SHOWS:
Real GDP growth in California (the line in
the figure) is superimposed on top of US
real GDP growth (bars in the figure).
California’s economy now is beginning to
pace the national growth pace.
KEY MESSAGES:
The forecast calls for faster economic
growth in 2014 and 2015.
Source: US Department of Commerce. Updated through
2012 (state) and 2014 Q1 (US). Quarterly estimates for
states after 2012 are interpolated from employment figures
(through April 2014), based on the historical correlation of
state and national employment changes.
June 2, 2014
Regional Perspectives: California Economic Outlook
Commercial Banking 22
-7
-5
-3
-1
1
3
5
7
9
11
-7
-5
-3
-1
1
3
5
7
9
11
90 91 92 93 94 95 96 97 98 99 00 01 02 03 04 05 06 07 08 09 10 11 12 13 14 15
CaliforniaUS
Forecast
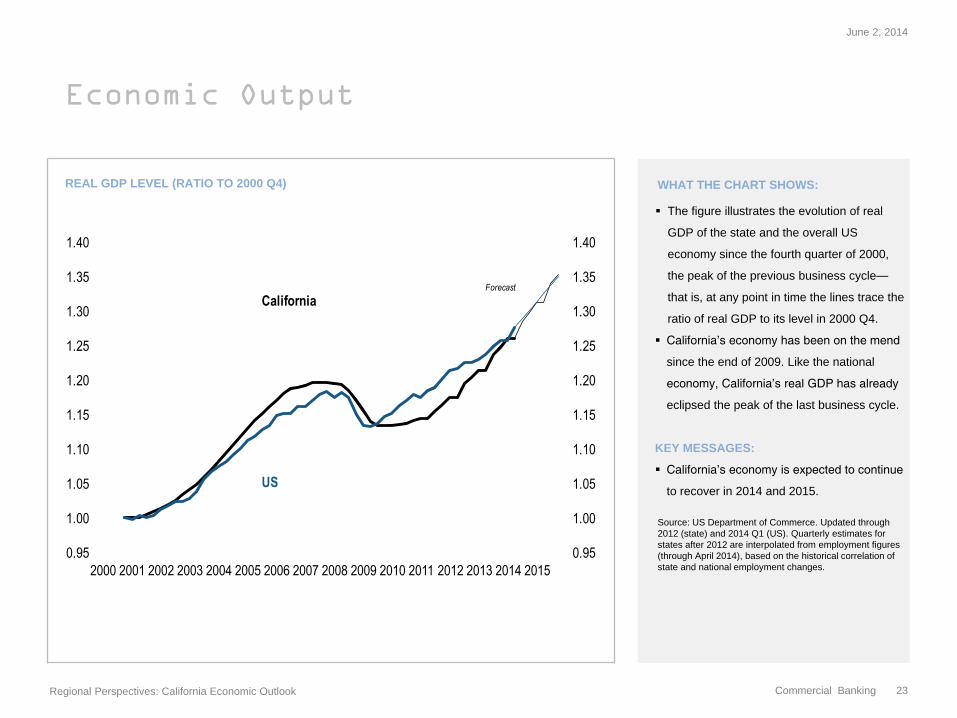
Economic Output
REAL GDP LEVEL (RATIO TO 2000 Q4) WHAT THE CHART SHOWS:
The figure illustrates the evolution of real
GDP of the state and the overall US
economy since the fourth quarter of 2000,
the peak of the previous business cycle—
that is, at any point in time the lines trace the
ratio of real GDP to its level in 2000 Q4.
California’s economy has been on the mend
since the end of 2009. Like the national
economy, California’s real GDP has already
eclipsed the peak of the last business cycle.
KEY MESSAGES:
California’s economy is expected to continue
to recover in 2014 and 2015.
Source: US Department of Commerce. Updated through
2012 (state) and 2014 Q1 (US). Quarterly estimates for
states after 2012 are interpolated from employment figures
(through April 2014), based on the historical correlation of
state and national employment changes.
June 2, 2014
Regional Perspectives: California Economic Outlook
Commercial Banking 23
0.95
1.00
1.05
1.10
1.15
1.20
1.25
1.30
1.35
1.40
0.95
1.00
1.05
1.10
1.15
1.20
1.25
1.30
1.35
1.40
2000 2001 2002 2003 2004 2005 2006 2007 2008 2009 2010 2011 2012 2013 2014 2015
California
US
Forecast
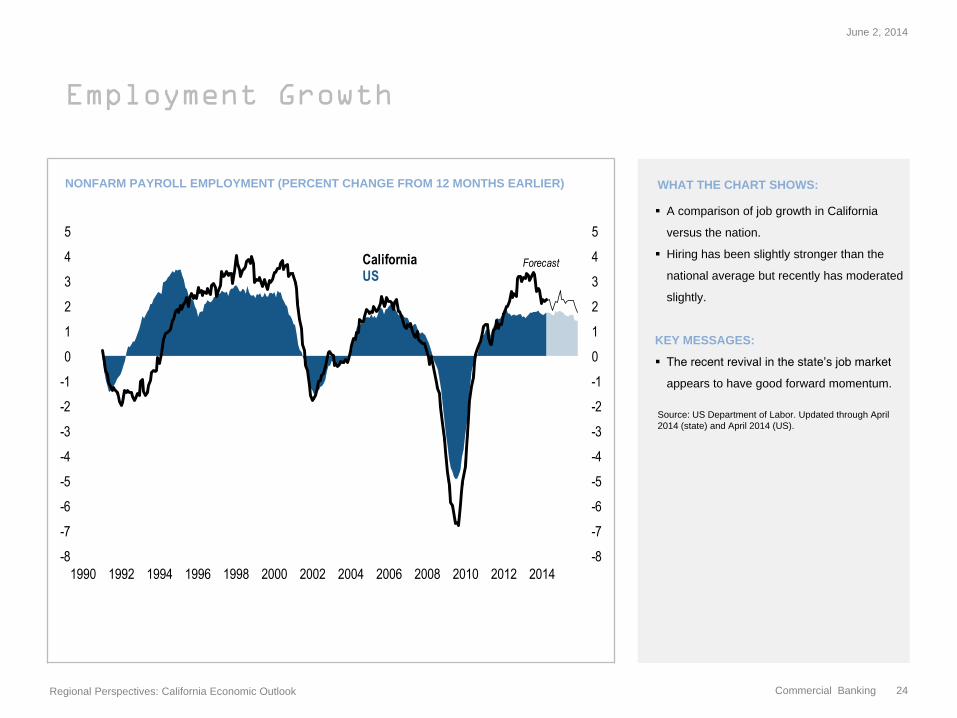
Employment Growth
NONFARM PAYROLL EMPLOYMENT (PERCENT CHANGE FROM 12 MONTHS EARLIER) WHAT THE CHART SHOWS:
A comparison of job growth in California
versus the nation.
Hiring has been slightly stronger than the
national average but recently has moderated
slightly.
KEY MESSAGES:
The recent revival in the state’s job market
appears to have good forward momentum.
Source: US Department of Labor. Updated through April
2014 (state) and April 2014 (US).
June 2, 2014
Regional Perspectives: California Economic Outlook
Commercial Banking 24
-8
-7
-6
-5
-4
-3
-2
-1
0
1
2
3
4
5
-8
-7
-6
-5
-4
-3
-2
-1
0
1
2
3
4
5
1990 1992 1994 1996 1998 2000 2002 2004 2006 2008 2010 2012 2014
CaliforniaUS
Forecast
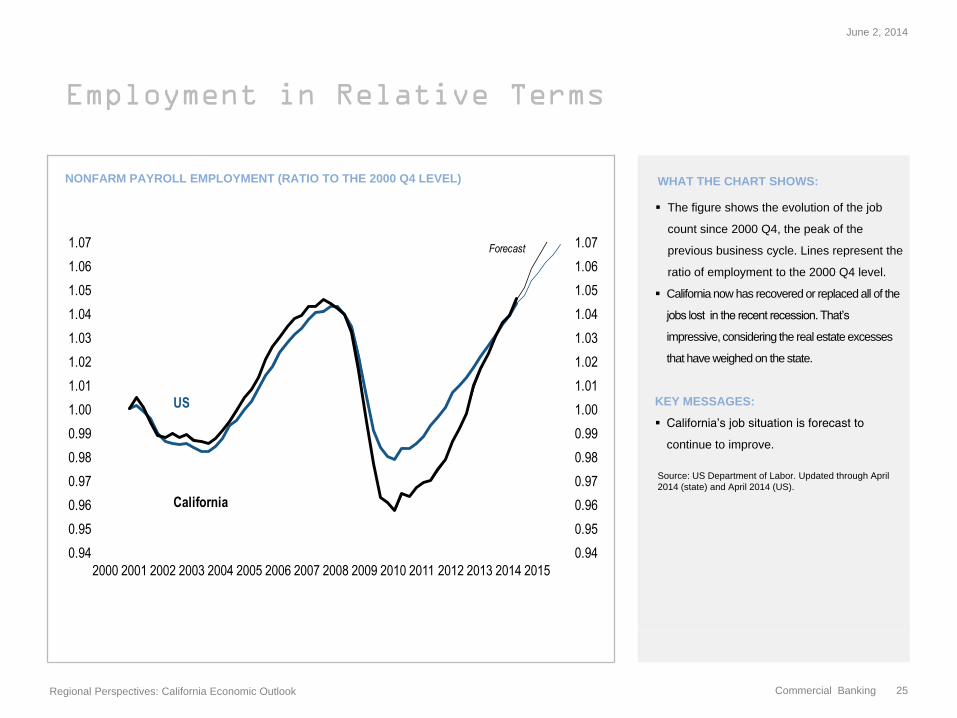
Employment in Relative Terms
NONFARM PAYROLL EMPLOYMENT (RATIO TO THE 2000 Q4 LEVEL) WHAT THE CHART SHOWS:
The figure shows the evolution of the job
count since 2000 Q4, the peak of the
previous business cycle. Lines represent the
ratio of employment to the 2000 Q4 level.
California now has recovered or replaced all of the
jobs lost in the recent recession. That’s
impressive, considering the real estate excesses
that have weighed on the state.
KEY MESSAGES:
California’s job situation is forecast to
continue to improve.
Source: US Department of Labor. Updated through April
2014 (state) and April 2014 (US).
June 2, 2014
Regional Perspectives: California Economic Outlook
Commercial Banking 25
0.94
0.95
0.96
0.97
0.98
0.99
1.00
1.01
1.02
1.03
1.04
1.05
1.06
1.07
0.94
0.95
0.96
0.97
0.98
0.99
1.00
1.01
1.02
1.03
1.04
1.05
1.06
1.07
2000 2001 2002 2003 2004 2005 2006 2007 2008 2009 2010 2011 2012 2013 2014 2015
US
California
Forecast
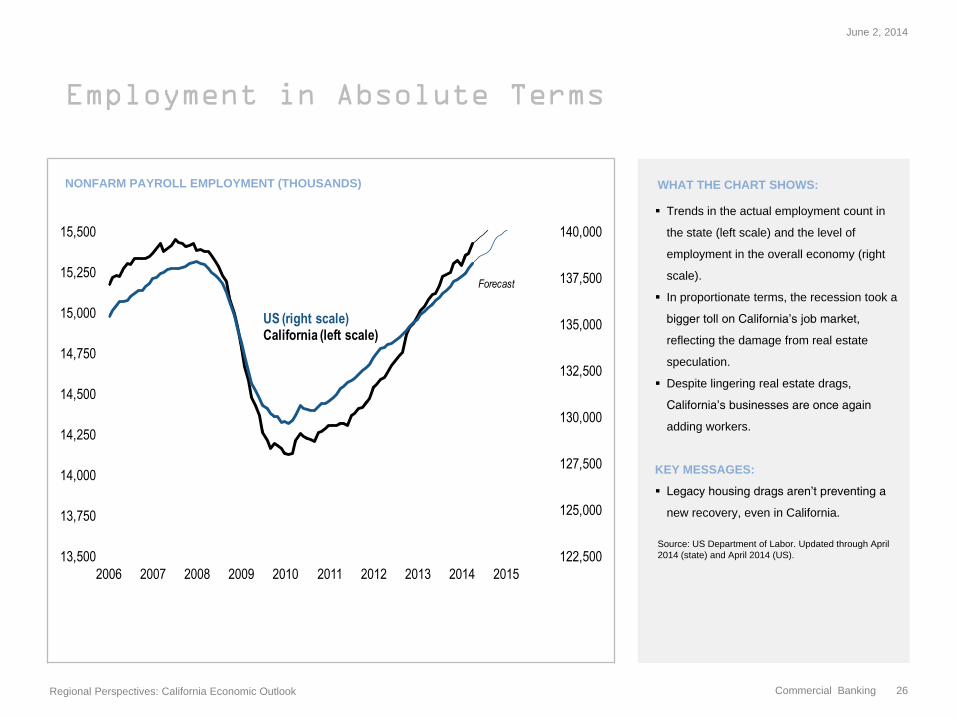
Employment in Absolute Terms
NONFARM PAYROLL EMPLOYMENT (THOUSANDS) WHAT THE CHART SHOWS:
Trends in the actual employment count in
the state (left scale) and the level of
employment in the overall economy (right
scale).
In proportionate terms, the recession took a
bigger toll on California’s job market,
reflecting the damage from real estate
speculation.
Despite lingering real estate drags,
California’s businesses are once again
adding workers.
KEY MESSAGES:
Legacy housing drags aren’t preventing a
new recovery, even in California.
Source: US Department of Labor. Updated through April
2014 (state) and April 2014 (US).
June 2, 2014
Regional Perspectives: California Economic Outlook
Commercial Banking 26
122,500
125,000
127,500
130,000
132,500
135,000
137,500
140,000
13,500
13,750
14,000
14,250
14,500
14,750
15,000
15,250
15,500
2006 2007 2008 2009 2010 2011 2012 2013 2014 2015
US (right scale)California (left scale)
Forecast
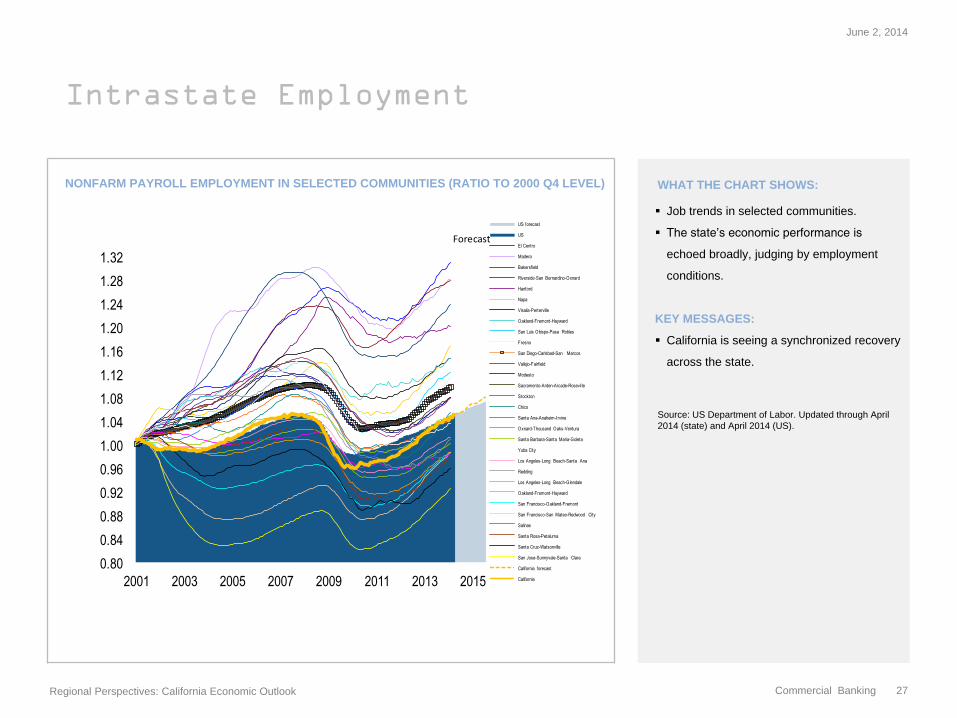
Intrastate Employment
NONFARM PAYROLL EMPLOYMENT IN SELECTED COMMUNITIES (RATIO TO 2000 Q4 LEVEL) WHAT THE CHART SHOWS:
Job trends in selected communities.
The state’s economic performance is
echoed broadly, judging by employment
conditions.
KEY MESSAGES:
California is seeing a synchronized recovery
across the state.
Source: US Department of Labor. Updated through April
2014 (state) and April 2014 (US).
June 2, 2014
Regional Perspectives: California Economic Outlook
Commercial Banking 27
0.80
0.85
0.90
0.95
1.00
1.05
1.10
1.15
1.20
1.25
1.30
0.80
0.84
0.88
0.92
0.96
1.00
1.04
1.08
1.12
1.16
1.20
1.24
1.28
1.32
2001 2003 2005 2007 2009 2011 2013 2015
US forecast
US
El Centro
Madera
Bakersfield
Riverside-San Bernardino-Oxnard
Hanford
Napa
Visalia-Perterville
Oakland-Fremont-Hayward
San Luis Obispo-Pasa Robles
Fresno
San Diego-Carlsbad-San Marcos
Vallejo-Fairfield
Modesto
Sacramento-Arden-Arcade-Rosevil le
Stockton
Chico
Santa Ana-Anaheim-Irvine
Oxnard-Thousand Oaks-Ventura
Santa Barbara-Santa Maria-Goleta
Yuba City
Los Angeles-Long Beach-Santa Ana
Redding
Los Angeles-Long Beach-Glendale
Oakland-Fremont-Hayward
San Francisco-Oakland-Fremont
San Francisco-San Mateo-Redwood City
Salinas
Santa Rosa-Petaluma
Santa Cruz-Watsonville
San Jose-Sunnyvale-Santa Clara
California forecast
California
Forecast
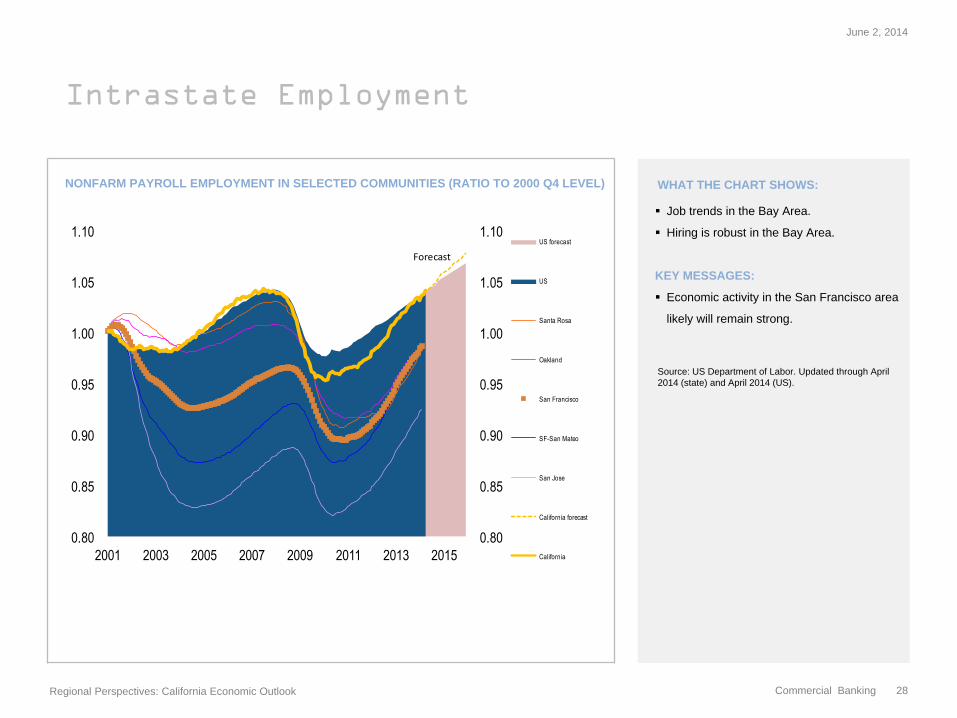
Intrastate Employment
NONFARM PAYROLL EMPLOYMENT IN SELECTED COMMUNITIES (RATIO TO 2000 Q4 LEVEL) WHAT THE CHART SHOWS:
Job trends in the Bay Area.
Hiring is robust in the Bay Area.
KEY MESSAGES:
Economic activity in the San Francisco area
likely will remain strong.
Source: US Department of Labor. Updated through April
2014 (state) and April 2014 (US).
June 2, 2014
Regional Perspectives: California Economic Outlook
Commercial Banking 28
0.80
0.85
0.90
0.95
1.00
1.05
1.10
0.80
0.85
0.90
0.95
1.00
1.05
1.10
2001 2003 2005 2007 2009 2011 2013 2015
US forecast
US
Santa Rosa
Oakland
San Francisco
SF-San Mateo
San Jose
California forecast
California
Forecast
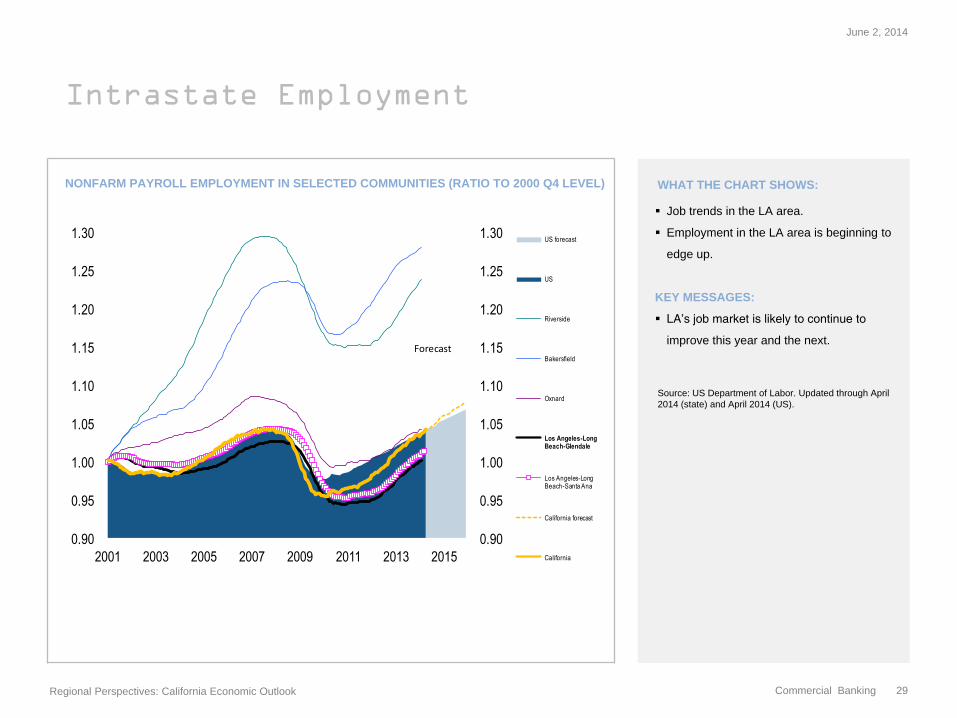
Intrastate Employment
NONFARM PAYROLL EMPLOYMENT IN SELECTED COMMUNITIES (RATIO TO 2000 Q4 LEVEL) WHAT THE CHART SHOWS:
Job trends in the LA area.
Employment in the LA area is beginning to
edge up.
KEY MESSAGES:
LA’s job market is likely to continue to
improve this year and the next.
Source: US Department of Labor. Updated through April
2014 (state) and April 2014 (US).
June 2, 2014
Regional Perspectives: California Economic Outlook
Commercial Banking 29
0.90
0.95
1.00
1.05
1.10
1.15
1.20
1.25
1.30
0.90
0.95
1.00
1.05
1.10
1.15
1.20
1.25
1.30
2001 2003 2005 2007 2009 2011 2013 2015
US forecast
US
Riverside
Bakersfield
Oxnard
Los Angeles-Long Beach-Glendale
Los Angeles-Long Beach-Santa Ana
California forecast
California
Forecast
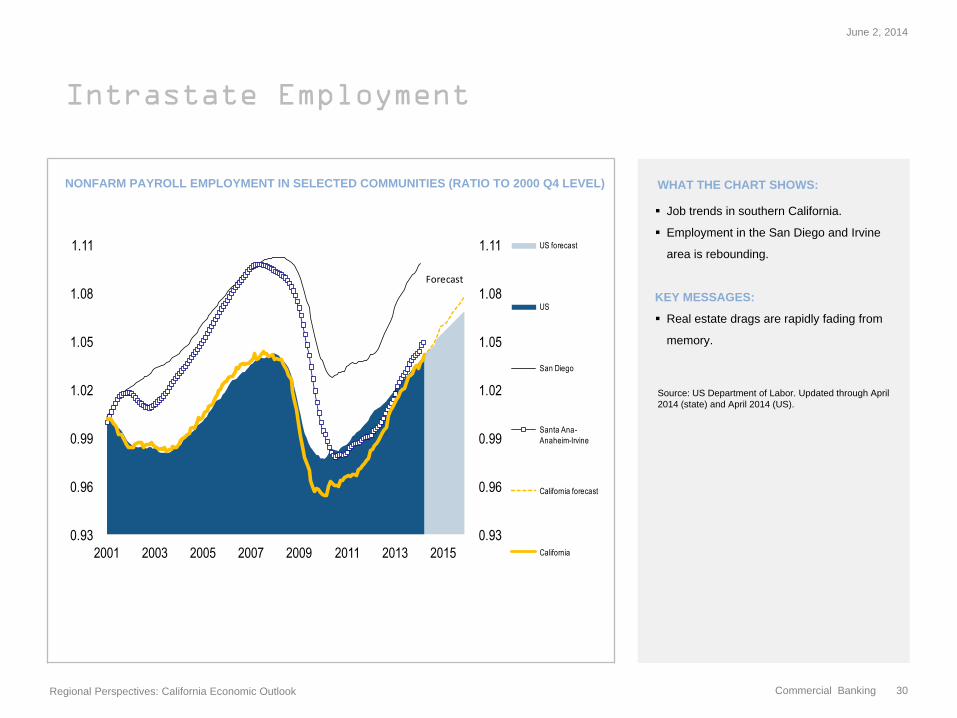
Intrastate Employment
NONFARM PAYROLL EMPLOYMENT IN SELECTED COMMUNITIES (RATIO TO 2000 Q4 LEVEL) WHAT THE CHART SHOWS:
Job trends in southern California.
Employment in the San Diego and Irvine
area is rebounding.
KEY MESSAGES:
Real estate drags are rapidly fading from
memory.
Source: US Department of Labor. Updated through April
2014 (state) and April 2014 (US).
June 2, 2014
Regional Perspectives: California Economic Outlook
Commercial Banking 30
0.93
0.96
0.99
1.02
1.05
1.08
1.11
0.93
0.96
0.99
1.02
1.05
1.08
1.11
2001 2003 2005 2007 2009 2011 2013 2015
US forecast
US
San Diego
Santa Ana-
Anaheim-Irvine
California forecast
California
Forecast
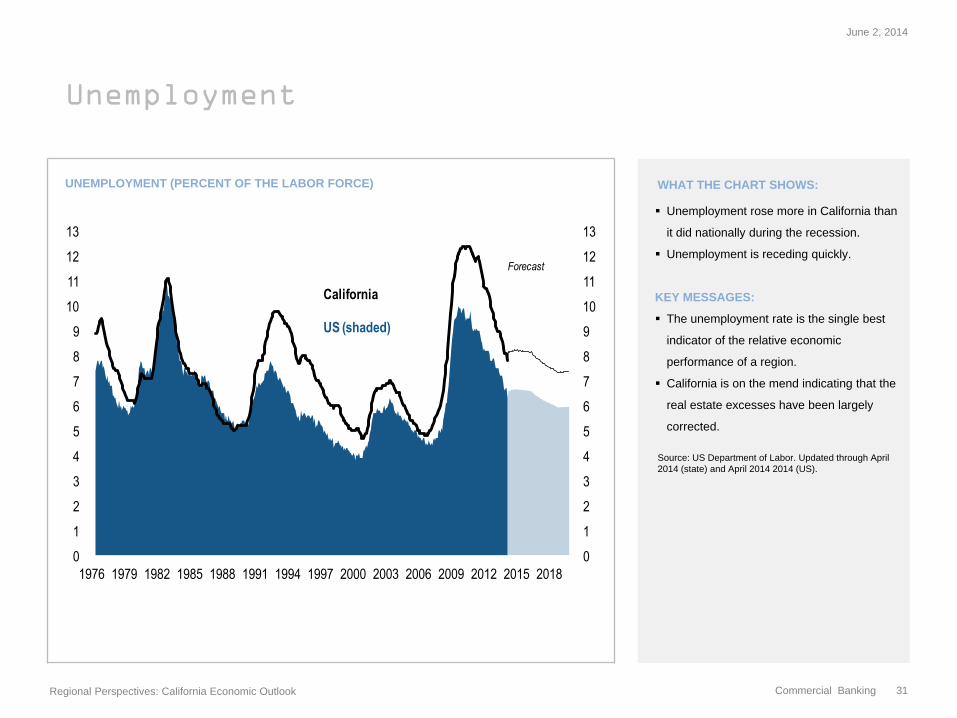
Unemployment
UNEMPLOYMENT (PERCENT OF THE LABOR FORCE) WHAT THE CHART SHOWS:
Unemployment rose more in California than
it did nationally during the recession.
Unemployment is receding quickly.
KEY MESSAGES:
The unemployment rate is the single best
indicator of the relative economic
performance of a region.
California is on the mend indicating that the
real estate excesses have been largely
corrected.
Source: US Department of Labor. Updated through April
2014 (state) and April 2014 2014 (US).
June 2, 2014
Regional Perspectives: California Economic Outlook
Commercial Banking 31
0
1
2
3
4
5
6
7
8
9
10
11
12
13
0
1
2
3
4
5
6
7
8
9
10
11
12
13
1976 1979 1982 1985 1988 1991 1994 1997 2000 2003 2006 2009 2012 2015 2018
California
US (shaded)
Forecast
CONTACT:
James E. Glassman
Telephone: (212) 270-0778
© 2014 JPMorgan Chase & Co. All rights reserved. Chase, JPMorgan and JPMorgan Chase are marketing names for certain businesses of JPMorgan Chase & Co. and its subsidiaries worldwide
(collectively, “JPMC”). The material contained herein is intended as a general market commentary. To the extent indices have been used in this commentary, please note that it is not possible to
invest directly in an index. Opinions expressed herein are those of James Glassman and may differ from those of other J.P. Morgan employees and affiliates. This information in no way constitutes
J.P. Morgan research and should not be treated as such. Further, the views expressed herein may differ from that contained in J.P. Morgan research reports. The above
summary/prices/quotes/statistics have been obtained from sources deemed to be reliable, but we do not guarantee their accuracy or completeness.