Embed Size (px)
Citation preview

8/14/2019 Economic Forecast 2009
http://slidepdf.com/reader/full/economic-forecast-2009 1/172
Europea n Commission
Direc torate -General for Ec ono mic and Financ ia l Affa irs
Economic Forecast
Spring 2009
EUROPEAN ECONOMY 3/ 2009

8/14/2019 Economic Forecast 2009
http://slidepdf.com/reader/full/economic-forecast-2009 2/172
8/14/2019 Economic Forecast 2009
http://slidepdf.com/reader/full/economic-forecast-2009 3/172
CONTENTS
iii
Overview 1
Chapte r 1: Ec onom ic developments at the ag grega ted level 7
1. The glob a l rec ession: How ba d , how long? 9
2. Financ ial markets sta b ilised but sizeab le vulne rab ilities rema in 17
3. EU fac es a deep and wide sprea d rec ession 23
4. Unem ployme nt increa ses sha rply 33
5. Disinfla tion continues ahea d 36
6. Defic its and deb t to rise strong ly 40
7. Co nside rab le unc erta inty rema ins 46
Cha pter 2: Memb er Sta tes 49
1. Belgium: Doub le-d igit unem ployme nt and triple-digit public deb t
in sight 50
2. Bulga ria : Vanishing bud getary surplus, exte rna l defic it rema ins
large 52
3. The Czec h Rep ub lic : Output falls sha rply d riven by c ollap se in
external de ma nd 54
4. Denma rk: Strong inc rea se in unem p loym ent from rec ord low s 56
5. Germa ny: Export de pend enc y driving slump and conditioning
recovery 58
6. Estonia: Ad justing to fac e g loom ier yea rs 61
7. Ireland : Strong budge ta ry dete rioration hamp ers ad justme nt 63
8. Gree c e: Persistent and large struc tural imba lanc es ta ke the ir to ll 65
9. Spa in: Imb a lanc es ham per rec ove ry 67
10. Franc e: Rela tively resilient priva te c onsumption, rap idly
de teriorating public financ es 70
11. Ita ly: Ma nufac turing hit ha rd by c ollapse in glob a l dem and 73
12. Cyp rus: Pub lic financ es deteriora ting, large external defic it 76
13. Latvia: Domestic de ma nd and trad e imp lod e 78
14. Lithuania: Deepening recession leads to wider fisc a l defic its 80
15. Luxembourg: This time , not spa red by the genera l ha rdship 82
16. Hung ary: Dom estic financ ial c risis magnifies rec ession 84
17. Ma lta: Tourism bad ly hit but investment ho lds up 86
18. The Nethe rland s: Suffering from fa ll in wo rld trad e 8819. Austria : Private c onsumption and fisc a l sup port cushion the
downturn 91
20. Poland : Mild rec ession knoc king a t the doo r 93
21. Portuga l: Protrac ted dow nturn 96
22. Rom ania: Grow th c ont rac ts sha rp ly 98
23. Slovenia: Sha rp fa lls in exports and investm ent point to
c om pe titivene ss c ha lleng es 100
24. Slova kia : Glob a l dow nturn we ighs on exports 102
25. Finland : Exports bea r the b runt of the dow nturn 104
26. Swe den: Unemp loyme nt rising, pub lic financ es deteriora ting 106
27. The United Kingdom : Dee p rec ession po ses severe cha lleng e to
public financ es 108
8/14/2019 Economic Forecast 2009
http://slidepdf.com/reader/full/economic-forecast-2009 4/172
iv
Cha pter 3: Ca ndida te Countries 111
1. Croa tia: A de c lining eco nomy crea tes imp ortant fisc al
challenges 112
2. The forme r Yugo slav Rep ub lic of Mac ed onia: Joining the gene ra ltrend ... a lbeit with a delay 114
3. Turkey: Ma nufa c turing fa ltering as exports dec line 116
Chapter 4: Other non-EU Co untries 119
1. The United Sta tes of Americ a : Priva te fruga lity and pub lic
largesse 120
2. Jap an: Prolong ed recession desp ite ma ssive fisc a l pac kag es 122
3. China : Still resilient and c ont ributing mo st to world growth 124
4. EFTA: The seven good yea rs a re over 126
5. Russian Federat ion: The first rec ession in a dec ade 128
Sta tistic a l Annex 131
LIST OF TABLES
1. Ma in fea tures of the spring 2009 forec ast - EU 3
2. Ma in fea tures of the spring 2009 forec ast - euro area 4
1.1.1. Inte rnat iona l env ironme nt 11
1.3.1. Co mposition of g row th in 2008 - EU 24
1.3.2. Co mposition of g row th - EU 241.3.3. Comp osition of grow th - euro a rea 25
1.3.4. Dec om position of the GDP g row th forecast 27
1.4.1. Labour ma rket out look - euro a rea and EU 33
1.5.1. Inflation out look - euro area and EU 36
1.6.1. General go vernment budge ta ry position - euro area and EU 40
1.6.2. Euro a rea - Deb t dyna mic s 42
2.1.1. Ma in fea tures of c ount ry forec ast - BELGIUM 51
2.2.1. Ma in fea tures of c ount ry fo rec ast - BULGARIA 53
2.3.1. Ma in fea tures of c ountry fo rec ast - THE CZECH REPUBLIC 55
2.4.1. Ma in fea tures of c ountry forec ast - DENMARK 57
2.5.1. Ma in fea tures of c ountry forec ast - GERMANY 60
2.6.1. Ma in fea tures of c ount ry forec ast - ESTONIA 62
2.7.1. Ma in fea tures of c ount ry forec ast - IRELAND 64
2.8.1. Ma in fea tures of c ount ry forec ast - GREECE 66
2.9.1. Ma in fea tures of c ount ry forec ast - SPAIN 69
2.10.1. Ma in fea tures of c ount ry forec ast - FRANCE 72
2.11.1. Ma in fea tures of c ount ry forec ast - ITALY 75
2.12.1. Ma in fea tures of c ount ry forec ast - CYPRUS 77
2.13.1. Ma in fea tures of c ount ry forec ast - LATVIA 79
2.14.1. Ma in fea tures of c ount ry forec ast - LITHUANIA 81
2.15.1. Ma in fea tures of c ount ry forec ast - LUXEMBOURG 83
2.16.1. Ma in fea tures of c ount ry forec ast - HUNGARY 85
2.17.1. Ma in fea tures of c ountry forec ast - MALTA 87
2.18.1. Ma in fea tures of c ountry fo rec ast - THE NETHERLANDS 90
2.19.1. Ma in fea tures of c ountry forec ast - AUSTRIA 92
2.20.1. Ma in fea tures of c ountry forec ast - POLAND 95
8/14/2019 Economic Forecast 2009
http://slidepdf.com/reader/full/economic-forecast-2009 5/172
v
2.21.1. Ma in fea tures of c ount ry forec ast - PORTUGAL 97
2.22.1. Ma in fea tures of c ountry forec ast - ROMANIA 99
2.23.1. Ma in fea tures of c ount ry fo rec ast - SLOVENIA 101
2.24.1. Ma in fea tures of c ount ry fo rec ast - SLOVAKIA 103
2.25.1. Ma in fea tures of c ount ry forec ast - FINLAND 105
2.26.1. Ma in fea tures of c ount ry forec ast - SWEDEN 107
2.27.1. Ma in fea tures of c ountry fo rec ast - THE UNITED KINGDOM 110
3.1.1. Ma in fea tures of c ountry forec ast - CROATIA 113
3.2.1. Ma in fea tures of c ountry fo rec ast - THE FORMER YUGOSLAV
REPUBLIC OF MACEDONIA 115
3.3.1. Ma in fea tures of c ount ry forec ast - TURKEY 117
4.1.1. Ma in fe a tures of c ountry fo rec ast - THE UNITED STATES 121
4.2.1. Ma in fea tures of c ountry forec ast - JAPAN 123
4.3.1. Ma in fea tures of c ountry forec ast - CHINA 125
4.4.1. Main fea tures of c ount ry forec ast - EFTA 127
4.5.1. Ma in fea tures of c ount ry forec ast - RUSSIA 129
LIST OF GRAPHS
1.1.1. Outp ut growth in non-EU ec onomies, % c h. in PPP 9
1.1.2. Imp orts of goo ds by region 10
1.1.3. Nom inal Effec tive Excha nge Rate % c h. from 01/ 01/2008 to
31/03/2009 10
1.1.4. Short-te rm indica to rs of wo rld trad e, yoy% 3mm a. 13
1.1.5. Co ntributions to non-EU GDP g rowth 14
1.2.1. 3-Mo nth interest rate sp rea ds - Ove rnight inte rest rate swa ps
(OIS) over Euribor/Libor interba nk rate s 171.2.2. Loa n growth, euro a rea 19
1.2.3. Five-yea r c orpo ra te bo nd spea ds, euro a rea 19
1.2.4. Ten-yea r gove rnment bond yields 20
1.3.1. GDP ac ross rec essions, euro a rea 23
1.3.2. Dete riora tion of c onfidenc e, selec td EU c ountries 26
1.4.1. Growth of GDP and em p loyment, euro a rea 33
1.4.2. Emp loyment and em p loyment expec ta tions, EU 34
1.4.3. Unem ployed persons and unem ployment rate, euro a rea 35
1.4.4. Ac tua l and structural unem p loyment rate, euro a rea 35
1.5.1. Hea d line and underlying inflat ion, euro a rea 36
1.5.2. Prod uc er p rice infla tion, euro a rea 37
1.5.3. Inflation expec ta tions, euro a rea 37
1.5.4. Hea d line and c ore infla tion forec ast, euro a rea 38
1.5.5. Dispersion of euro-a rea MS inflat ion rates 38
1.6.1. Tota l revenue and expend iture (Four-qua rte r mo ving
average), EU 41
1.7.1. Euro area GDP forec asts - Unc erta inty linked to the ba lanc e
of risks 47
2.1.1. Belg ium - Pub lic financ e trend s 50
2.2.1. Bulga ria - Co ntributions to GDP g rowth 52
2.3.1. The Czech Rep ub lic - Go vernment financ es 54
2.4.1. Denma rk - GDP deve lopm ent c om pared with euro a rea 56
2.5.1. Ge rmany - Exports and rea l GDP growth 58
2.5.2. Ge rma ny - Emp loyment and unem ployment 58
2.6.1. Estonia - External ba lanc e, GDP and infla tion 61
8/14/2019 Economic Forecast 2009
http://slidepdf.com/reader/full/economic-forecast-2009 6/172
vi
2.7.1. Ireland - GDP grow th, unem p loyment rate and ge neral
government ba lanc e 63
2.8.1. Greec e -Net lending or net borrow ing of the ec ono my 65
2.9.1. Spa in - Co ntributions to growth 67
2.9.2. Spa in - General gove rnme nt acc ounts 67
2.10.1. Franc e - GDP growth and c ontributions 70
2.10.2. Franc e - General go vernment gross deb t and deficit 70
2.11.1. Ita ly - Co ntributions to qua rterly GDP growth 73
2.11.2. Ita ly - Ge nera l gove rnment defic it 73
2.12.1. Cyp rus - Pub lic financ es 76
2.13.1. La tvia - Output gap , infla tion, unit lab our c ost 78
2.14.1. Lithuania - External ba lanc e, GDP and infla tion 80
2.15.1. Luxemb ourg - Rea l GDP and dom estic em ployme nt 82
2.16.1. Hung ary - GDP growth and its c ontributions 84
2.17.1. Ma lta - Ge neral go vernment financ es 86
2.18.1. The Netherland s - Government balanc e and deb t 88
2.18.2. The Netherland s - Unemp loyme nt & va c anc y rates 88
2.19.1. Austria - Ec onom ic sent iment indica to r and investment 91
2.20.1. Poland - GDP g row th and its c ont ributo rs 93
2.20.2. Poland -Genera l governme nt financ es 93
2.21.1. Portug a l - Net external deb t, GDP and GNI 96
2.22.1. Rom ania - GDP, go verment deficit and c urrent ac c ount 98
2.23.1. Slove nia - GDP and exp orts grow th, vo lume s 100
2.24.1. Slovakia - GDP growth, unemp loyme nt rate and infla tion 102
2.25.1. Finland - Emp loym ent sta b ilising in 2010 even with wide ning
output ga p 104
2.26.1. Swe de n - Outp ut ga p and c ontributions to GDP grow th 106
2.27.1. UK - Grow th, infla tion and unemployme nt 108
2.27.2. UK - Ge neral gove rnment financ es 1083.1.1. Croa tia - GDP growth and investment 112
3.2.1. The forme r Yug oslav Rep ub lic of Ma c ed on ia - Pub lic
finances 114
3.3.1. Turkey - GDP grow th and investm ent 116
4.1.1. US - Priva te saving and pub lic def icits 120
4.2.1. Japan - Ma nufac turing p rod uc tion and invento ries 122
4.3.1. Ch ina - Proc essing trade 124
4.4.1. EFTA - GDP growth 126
4.5.1. Russia - GDP g row th 128
LIST OF BOXES
1.1.1. The c risis has c aught up with em erg ing ma rket and
de veloping ec onom ies 16
1.2.1. Som e tec hnica lities beh ind the forec ast 21
1.3.1. External trad e shock a t the hea rt of the steep fa ll in ac tivity 30
1.3.2. Pote ntial grow th and outp ut ga p estimates 31
1.6.1. GDP impac t of d isc retiona ry fisc a l me asures 44
8/14/2019 Economic Forecast 2009
http://slidepdf.com/reader/full/economic-forecast-2009 7/172
OVERVIEW
1
The global economy is in the midst of its deepest and most widespreadrecession in the post-war era. The EU economy is not spared. The marked
intensification of the financial crisis last autumn prompted a global economic
downturn which, in turn, further weakened the financial sector. While the
ambitious policy actions taken by governments and central banks since last
autumn have prevented a systemic financial meltdown and have also
succeeded in bringing about a certain degree of stabilisation, financial
markets and institutions remain under stress.
The economic situation continues to be exceptionally uncertain. Investor
confidence within the banking sector remains fragile, notwithstanding the
improvement noted in some market segments. This forecast assumes that the
measures already in place to support the banking sector will begin to have astronger impact in the coming quarters, thereby also facilitating the
transmission of the supportive monetary policy stance to the real economy.
An improved performance of banks by the end of this year should provide the
basis for a pick-up in bank lending.
As the financial crisis intensified, global trade and industrial production
virtually collapsed in the final quarter of 2008. Soft and hard indicators
suggest that the sharp contraction in real GDP continued in the first quarter of
this year. Looking ahead, still tight financial conditions and weak confidence
are set to continue to weigh on economic activity, but they are likely to be
gradually offset by the impact of strongly expansionary macroeconomic
policies.
World GDP is expected to contract by some 1½% in 2009, with the downturn
being especially pronounced in advanced economies. GDP is projected to fall
by about 3% in the US and by a stark 5¼% in Japan in 2009. Moreover, the
economic downturn has increasingly spilled over to emerging and developing
economies. Although China seems to be in a relatively good position to
counter the global recession in view of the arsenal of policy instruments still
available, growth is expected to slow sharply this year (to some 6%).
Following the impact of the significant policy stimulus worldwide and
gradually resuming trade flows, global growth is expected to recover to close
to 2% in 2010.
Against this backdrop, GDP is forecast to contract by 4% in both the EU and
the euro area in 2009, implying a further downward revision of some 2
percentage points (pps.) compared with the interim forecast of January 2009.
The downturn is projected to be broadbased, with almost all Member States
expected to post negative growth rates this year. For both areas, GDP should
stabilise in 2010 with a subdued recovery gradually taking hold on the back
of improving financial conditions, stronger external demand, and supportive
macroeconomic policies. Inflation is expected to continue to fall rapidly this
year, entering negative territory for a few months in the middle of the year,
while unemployment soars and budget deficit and debt rise sharply.
Although the economic downswing has become more broadbased in recent
quarters, differences across EU countries persist. Strongly export-oriented
economies have been particularly affected by the collapse in globalmanufacturing. Some countries remain subject to a deeper and more
protracted downturn due to their direct exposure to the financial crisis or a
The g loba l eco nomy isin de ep rec ession...
...with financ ial sec tor
risks still elevated
Rec ession ha s hit
worldwide...
...with global GDP set
to fall by 1½% in 2009...
...and by 4% in the EU,
hurting labour markets
and p ublic financ es
alike
The d ow nturn has
bec ome broadba sed
ac ross EU co unt ries...
8/14/2019 Economic Forecast 2009
http://slidepdf.com/reader/full/economic-forecast-2009 8/172
Econo mic Forec ast, Spring 2009
2
substantial housing-market correction. Some countries also face a
deterioration in external financing conditions following the build-up of
imbalances and vulnerabilities, which fuel financial markets' concern.
Among the five largest EU economies, real GDP is expected to contract thisyear by about 5½% in Germany, some 4-4½% in Italy and the United
Kingdom and by about 3% in France and Spain. Activity is expected to
broadly stabilise in all of the larger economies in 2010, except Spain where a
further contraction of close to 1% is predicted. Moreover, population growth
continues to play a positive role in the case of Spain, where GDP per capita
growth, at -4½%, is in line with the euro-area average this year and is
expected at close to -2% in 2010.
The downturn is also expected to be widespread across demand components,
with the exception of government consumption and public investment as
these are supported by budgetary stimulus proposed in the European
Economic Recovery Plan. Exports and investment are set to contract particularly sharply this year (by 12¾% and 10½%, respectively). Export
developments mirror the breakdown of world trade (see also Box 1.3.1),
while the marked downturn in investment reflects bleak investor confidence
and demand expectations, a sharp decline in capacity utilisation and still tight
financing conditions. Moreover, while an involuntary accumulation of stocks
contributed positively to GDP growth towards the end of last year, a
correction is now expected, which could have a significant adverse impact on
activity in the near term (which, on the other hand, also implies a positive
risk for the following quarters). Private consumption is also set to decline as
the labour-market situation deteriorates, although the negative impact on real
disposable income growth is partly offset by the rapid fall in the rate of
inflation.
Budgetary support should, however, increasingly sustain economic activity
this year (see section 1.6). The overall budgetary support, in terms of the
estimated change in the general government deficit (that also includes the
impact of automatic stabilisers), amounts to about 5 pps. in 2009-2010.
Regarding discretionary fiscal measures, some of them aim to stimulate
consumption or support income growth. Increased government consumption
and public investment should also strengthen economic activity. It is
estimated that overall, GDP would have been up to 1 pp. lower this year and
by about ⅔ pp. in 2010 in the absence of the stimulus provided by the
different discretionary budgetary measures announced in the EU, amounting
to a total of 1.8% of GDP in the EU in 2009-2010. The impact may vary
across Member States, however, depending on the nature of the measurestaken and the economic circumstances (see Box 1.6.1 for a discussion of the
impact of discretionary fiscal policies).
Labour markets cannot escape the downturn either. Reflecting the usual lag
between changes in employment and output, employment is expected to
contract by 2½% in both the EU and the euro area this year and a further
1½% in 2010. Employment could thus fall by some 8½ million in the EU
over the forecast period, in sharp contrast with the net job creation of about
9½ million during 2006-2008.
As a result, the unemployment rate is projected to increase to close to 11% in
the EU by 2010 (11½% in the euro area), 1½ pps. higher than in the January
outlook. While the deterioration is broadbased across countries, the most pronounced increases in unemployment are expected in countries facing
...and ac ross de ma nd
components...
...while b udg eta ry
stimulus provide s som e
support
Emp loyment set to fall
sharply...
8/14/2019 Economic Forecast 2009
http://slidepdf.com/reader/full/economic-forecast-2009 9/172
Overview
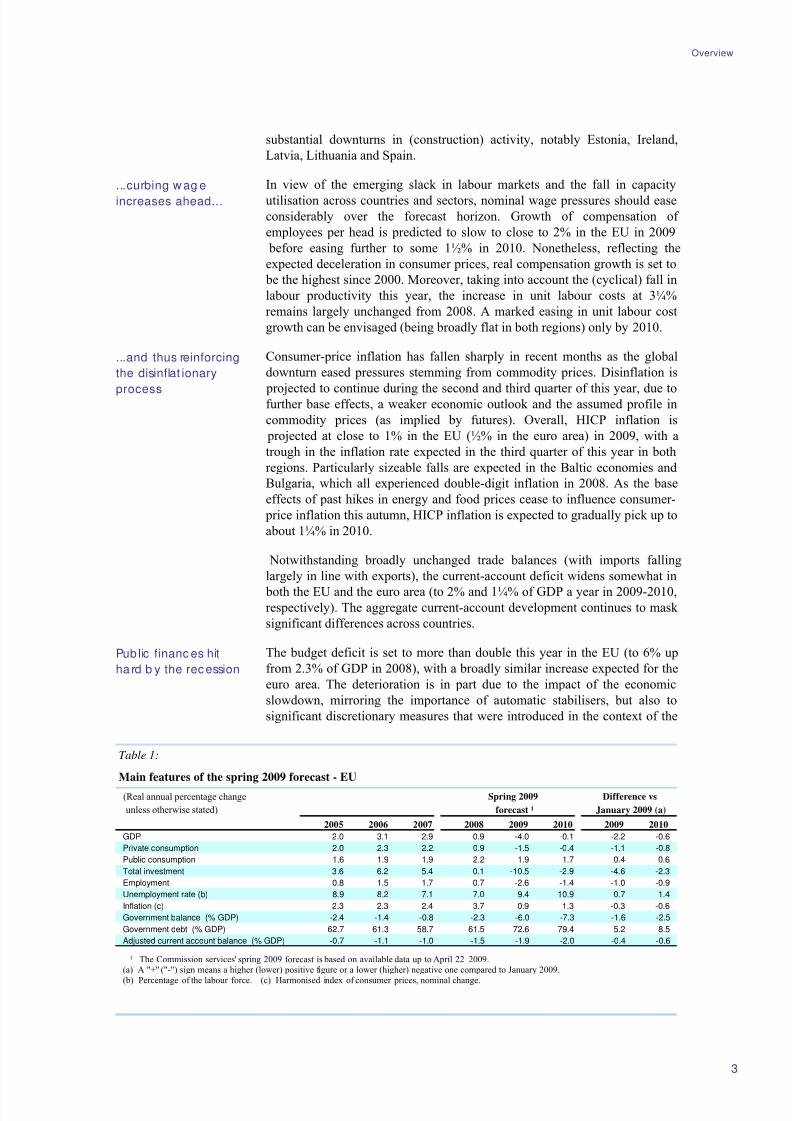
Table 1:
Main features of the spring 2009 forecast - EU
(Real annual percentage change Spring 2009 Difference vs
unless otherwise stated) forecast ¹ January 2009 (a)
2005 2006 2007 2008 2009 2010 2009 2010
GDP 2.0 3.1 2.9 0.9 -4.0 -0.1 -2.2 -0.6
Private consumption 2.0 2.3 2.2 0.9 -1.5 -0.4 -1.1 -0.8
Public consumption 1.6 1.9 1.9 2.2 1.9 1.7 0.4 0.6
Total investment 3.6 6.2 5.4 0.1 -10.5 -2.9 -4.6 -2.3
Employment 0.8 1.5 1.7 0.7 -2.6 -1.4 -1.0 -0.9
Unemployment rate (b) 8.9 8.2 7.1 7.0 9.4 10.9 0.7 1.4
Inflation (c) 2.3 2.3 2.4 3.7 0.9 1.3 -0.3 -0.6
Government balance (% GDP) -2.4 -1.4 -0.8 -2.3 -6.0 -7.3 -1.6 -2.5
Government debt (% GDP) 62.7 61.3 58.7 61.5 72.6 79.4 5.2 8.5
Adjusted current account balance (% GDP) -0.7 -1.1 -1.0 -1.5 -1.9 -2.0 -0.4 -0.6
¹ The Commission services' spring 2009 forecast is based on available data up to April 22 2009.(a) A "+" ("-") sign means a higher (lower) positive figure or a lower (higher) negative one compared to January 2009.
(b) Percentage of the labour force. (c) Harmonised index of consumer prices, nominal change.
3
substantial downturns in (construction) activity, notably Estonia, Ireland,
Latvia, Lithuania and Spain.
In view of the emerging slack in labour markets and the fall in capacity
utilisation across countries and sectors, nominal wage pressures should easeconsiderably over the forecast horizon. Growth of compensation of
employees per head is predicted to slow to close to 2% in the EU in 2009
before easing further to some 1½% in 2010. Nonetheless, reflecting the
expected deceleration in consumer prices, real compensation growth is set to
be the highest since 2000. Moreover, taking into account the (cyclical) fall in
labour productivity this year, the increase in unit labour costs at 3¼%
remains largely unchanged from 2008. A marked easing in unit labour cost
growth can be envisaged (being broadly flat in both regions) only by 2010.
Consumer-price inflation has fallen sharply in recent months as the global
downturn eased pressures stemming from commodity prices. Disinflation is
projected to continue during the second and third quarter of this year, due tofurther base effects, a weaker economic outlook and the assumed profile in
commodity prices (as implied by futures). Overall, HICP inflation is
projected at close to 1% in the EU (½% in the euro area) in 2009, with a
trough in the inflation rate expected in the third quarter of this year in both
regions. Particularly sizeable falls are expected in the Baltic economies and
Bulgaria, which all experienced double-digit inflation in 2008. As the base
effects of past hikes in energy and food prices cease to influence consumer-
price inflation this autumn, HICP inflation is expected to gradually pick up to
about 1¼% in 2010.
Notwithstanding broadly unchanged trade balances (with imports falling
largely in line with exports), the current-account deficit widens somewhat in
both the EU and the euro area (to 2% and 1¼% of GDP a year in 2009-2010,respectively). The aggregate current-account development continues to mask
significant differences across countries.
The budget deficit is set to more than double this year in the EU (to 6% up
from 2.3% of GDP in 2008), with a broadly similar increase expected for the
euro area. The deterioration is in part due to the impact of the economic
slowdown, mirroring the importance of automatic stabilisers, but also to
significant discretionary measures that were introduced in the context of the
...curbing w ag e
increases ahead...
...and thus reinforcing
the disinflat ionary
process
Pub lic financ es hit
ha rd b y the rec ession
8/14/2019 Economic Forecast 2009
http://slidepdf.com/reader/full/economic-forecast-2009 10/172
Econo mic Forec ast, Spring 2009
Table 2:
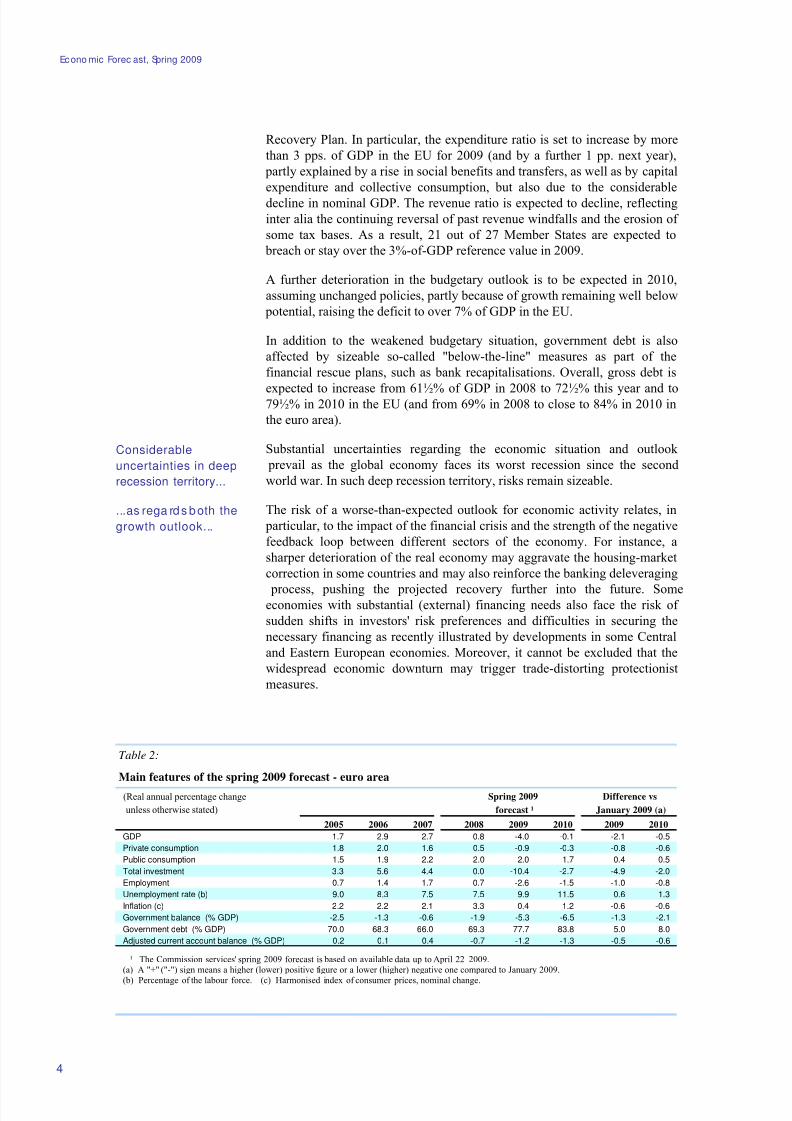
Main features of the spring 2009 forecast - euro area
(Real annual percentage change Spring 2009 Difference vs
unless otherwise stated) forecast ¹ January 2009 (a)
2005 2006 2007 2008 2009 2010 2009 2010
GDP 1.7 2.9 2.7 0.8 -4.0 -0.1 -2.1 -0.5
Private consumption 1.8 2.0 1.6 0.5 -0.9 -0.3 -0.8 -0.6
Public consumption 1.5 1.9 2.2 2.0 2.0 1.7 0.4 0.5
Total investment 3.3 5.6 4.4 0.0 -10.4 -2.7 -4.9 -2.0
Employment 0.7 1.4 1.7 0.7 -2.6 -1.5 -1.0 -0.8
Unemployment rate (b) 9.0 8.3 7.5 7.5 9.9 11.5 0.6 1.3
Inflation (c) 2.2 2.2 2.1 3.3 0.4 1.2 -0.6 -0.6
Government balance (% GDP) -2.5 -1.3 -0.6 -1.9 -5.3 -6.5 -1.3 -2.1
Government debt (% GDP) 70.0 68.3 66.0 69.3 77.7 83.8 5.0 8.0
Adjusted current account balance (% GDP) 0.2 0.1 0.4 -0.7 -1.2 -1.3 -0.5 -0.6
¹ The Commission services' spring 2009 forecast is based on available data up to April 22 2009.(a) A "+" ("-") sign means a higher (lower) positive figure or a lower (higher) negative one compared to January 2009.
(b) Percentage of the labour force. (c) Harmonised index of consumer prices, nominal change.
4
Recovery Plan. In particular, the expenditure ratio is set to increase by more
than 3 pps. of GDP in the EU for 2009 (and by a further 1 pp. next year),
partly explained by a rise in social benefits and transfers, as well as by capital
expenditure and collective consumption, but also due to the considerable
decline in nominal GDP. The revenue ratio is expected to decline, reflecting
inter alia the continuing reversal of past revenue windfalls and the erosion of
some tax bases. As a result, 21 out of 27 Member States are expected to
breach or stay over the 3%-of-GDP reference value in 2009.
A further deterioration in the budgetary outlook is to be expected in 2010,
assuming unchanged policies, partly because of growth remaining well below
potential, raising the deficit to over 7% of GDP in the EU.
In addition to the weakened budgetary situation, government debt is also
affected by sizeable so-called "below-the-line" measures as part of the
financial rescue plans, such as bank recapitalisations. Overall, gross debt is
expected to increase from 61½% of GDP in 2008 to 72½% this year and to79½% in 2010 in the EU (and from 69% in 2008 to close to 84% in 2010 in
the euro area).
Substantial uncertainties regarding the economic situation and outlook
prevail as the global economy faces its worst recession since the second
world war. In such deep recession territory, risks remain sizeable.
The risk of a worse-than-expected outlook for economic activity relates, in
particular, to the impact of the financial crisis and the strength of the negative
feedback loop between different sectors of the economy. For instance, a
sharper deterioration of the real economy may aggravate the housing-market
correction in some countries and may also reinforce the banking deleveraging
process, pushing the projected recovery further into the future. Someeconomies with substantial (external) financing needs also face the risk of
sudden shifts in investors' risk preferences and difficulties in securing the
necessary financing as recently illustrated by developments in some Central
and Eastern European economies. Moreover, it cannot be excluded that the
widespread economic downturn may trigger trade-distorting protectionist
measures.
Considerable
uncertainties in deep
recession territory...
...as rega rds both the
growth outlook...
8/14/2019 Economic Forecast 2009
http://slidepdf.com/reader/full/economic-forecast-2009 11/172
Overview
5
On the other hand, turning points are notoriously difficult to detect. While
soft data generally remain at historical lows, a certain stabilisation has
recently been noted, with indicators in some sectors pointing to a timid
recovery. With unprecedented falls in trade and production during recent
quarters, the low point may be within reach. The full and swift
implementation of the numerous measures proposed to restore stability in
financial markets and support the economy could also prove effective more
quickly than currently anticipated, restoring investor and consumer
confidence more rapidly. In either of these situations, the recovery could
come earlier and/or be more pronounced than projected.
Turning to inflation, risks partly relate to future commodity price trends,
where weaker demand poses a downside risk, while the possibility of further
supply restrictions points in the opposite direction. The disinflationary impact
of a severe recession on wage and price setting may also prove more
pronounced. However, the risk of a deflationary scenario at the EU or euro-
area level, i.e. a persistent and self-reinforcing decline in a broad set of prices, appears limited at the current juncture. Inflation expectations remain
anchored at levels consistent with price stability; wage growth is expected to
remain positive, while both fiscal and monetary policies have turned
expansionary.
Regarding the balance of risks, in an environment characterised by
exceptional uncertainty, risks to the growth outlook remain somewhat tilted
to the downside for 2009, but appear more balanced for 2010. Risks to the
projection for inflation are broadly balanced for this year but skewed to the
downside for 2010.
...and the d isinfla tion
projection

8/14/2019 Economic Forecast 2009
http://slidepdf.com/reader/full/economic-forecast-2009 12/172

8/14/2019 Economic Forecast 2009
http://slidepdf.com/reader/full/economic-forecast-2009 13/172
Chapter 1Ec onomic develop ments a t the aggrega tedlevel

8/14/2019 Economic Forecast 2009
http://slidepdf.com/reader/full/economic-forecast-2009 14/172
8/14/2019 Economic Forecast 2009
http://slidepdf.com/reader/full/economic-forecast-2009 15/172
1. THE GLOBAL RECESSION: HOW BAD, HOW LONG?
9
While the epicentre of the crisis, which originated
in the US subprime markets in 2007, is located in
the advanced economies, shockwaves have by now
reached all regions of the world. The economic
downturn is synchronous, and the magnitude larger
than earlier expected in most economies. Given the
weakness of both trade and growth at the turn of
2009, prospects for world growth in annual terms
have become negative this year, and the range of
uncertainty around the growth outlook in 2010 is
widening. In 2009, with the exception of China
and India, output is expected to contract in the
main economies around the world. Given the
nature of the current crisis, which is global and
originated in the financial and banking system, the
recovery will likely be drawn-out and world
growth will be sub-par in 2010.
This forecast puts world growth at -1½% in 2009
and just below 2% in 2010. This has major
consequences for jobs, as unemployment rates are
forecast to settle above 10% in both the US and the
EU in 2010. In China, job losses already amount to
at least 20 million. One of the most dramatic
developments in this forecast is the fall in worldtrade, which is expected to contract by 11% in
2009, and to grow at around just ¾% in 2010. At
the same time, global inflationary pressures have
eased rapidly in recent months, as shown in the
decline in global input prices. This decline in all
main regions is due to lower commodity prices
than last year, the slump in demand and weaker
labour market conditions. Risks to the global
growth and inflation outlook appear relatively
balanced.
The world ec onom y is exp erienc ing its mo stsevere recession since World War II
Activity worldwide is contracting sharply.
Industrial production fell in most countries at the
end of 2008 and the most recent data, including in
the US, indicate that the speed of the downturn has
not yet decelerated. US GDP contracted by 1.6%
q-o-q in 2008Q4, driven by private consumption
and investment, and 2009Q1 is likely to see a
contraction of a similar magnitude. Japanese GDP
contracted in 2008Q4 for the third quarter in a row,
by 3.2% q-o-q, driven by negative business
investment and a markedly negative contributionfrom net exports. In the EU, the fourth quarter of
2008 posted a decline of 1.5% q-o-q. The decline
in activity generally reflects a sharp collapse in
external demand, the impact of large housing
market corrections in some countries (e.g. the US,
as well as some EU Member States), and more
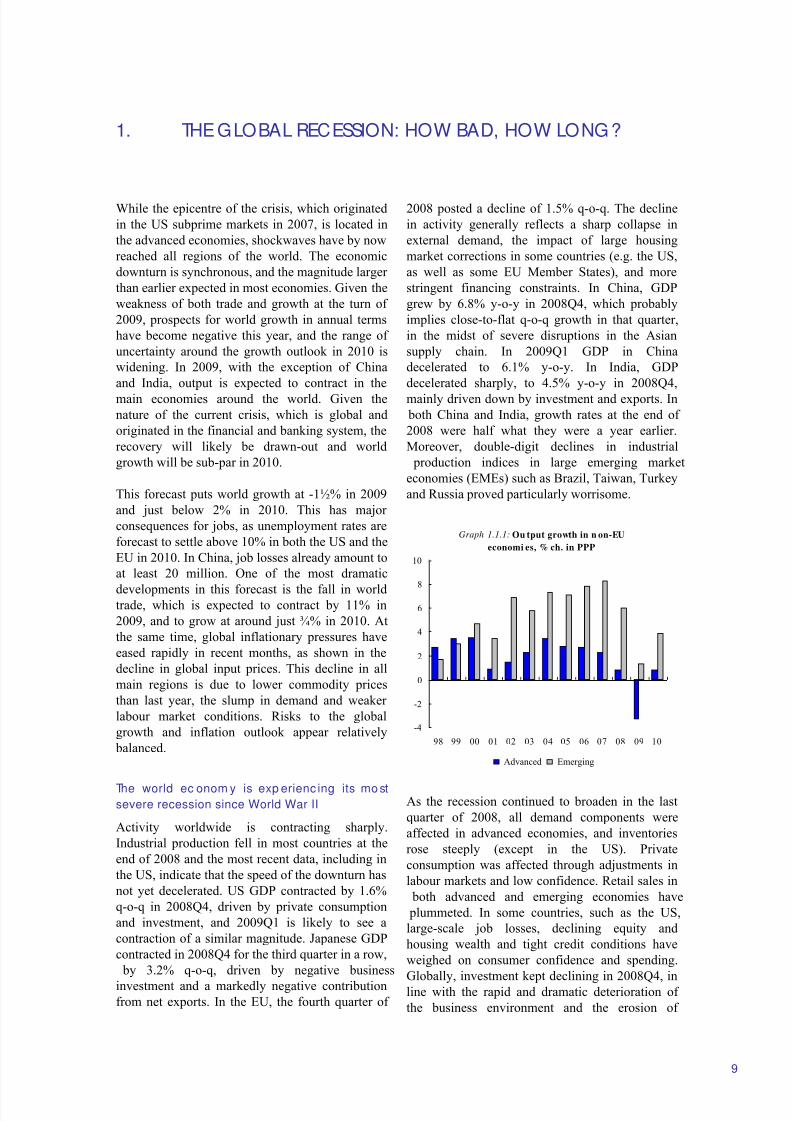
stringent financing constraints. In China, GDP
grew by 6.8% y-o-y in 2008Q4, which probably
implies close-to-flat q-o-q growth in that quarter,
in the midst of severe disruptions in the Asian
supply chain. In 2009Q1 GDP in China
decelerated to 6.1% y-o-y. In India, GDP
decelerated sharply, to 4.5% y-o-y in 2008Q4,
mainly driven down by investment and exports. In
both China and India, growth rates at the end of
2008 were half what they were a year earlier.
Moreover, double-digit declines in industrial
production indices in large emerging market
economies (EMEs) such as Brazil, Taiwan, Turkey
and Russia proved particularly worrisome.
Graph 1.1.1: Ou tput growth in n on-EU
economi es, % ch. in PPP
-4
-2
0
2
4
6
8
10
98 99 00 01 02 03 04 05 06 07 08 09 10
Advanced Emerging
As the recession continued to broaden in the last
quarter of 2008, all demand components were
affected in advanced economies, and inventories
rose steeply (except in the US). Private
consumption was affected through adjustments in
labour markets and low confidence. Retail sales in
both advanced and emerging economies have
plummeted. In some countries, such as the US,
large-scale job losses, declining equity and
housing wealth and tight credit conditions have
weighed on consumer confidence and spending.
Globally, investment kept declining in 2008Q4, inline with the rapid and dramatic deterioration of
the business environment and the erosion of
8/14/2019 Economic Forecast 2009
http://slidepdf.com/reader/full/economic-forecast-2009 16/172
Econo mic Forec ast, Spring 2009
10
corporate profits. Industrial production collapsed,
while inventories surged. The build-up in
inventories in some advanced economies (e.g.
Japan and the euro area) appears to have been
large in the last quarter of 2008 (whereas this was
not the case in the US). In Japan, stock building
was the only component contributing positively to
growth in 2008Q4. De-stocking has not yet started
globally, which will put a further drag on global
growth going forward.
The global collapse in industrial production
coincided with a sharp decline in international
trade flows, which are the main channel through
which the recession in advanced economies is
affecting emerging market and developing
economies, together with the reversal of financialflows. World trade fell at an annualised rate of
24% in the last quarter of 2008 and probably a
similar rate in the first quarter of 2009, rates not
experienced since World War II. For export-
dependent economies, notably in emerging Asia,
such developments are particularly dramatic, with
most of these small open economies experiencing
double-digit contractions in exports. The
internationalisation of production over the last two
decades has amplified the effect of falling demand
in export markets. Limited access to trade finance
and trade insurance, in particular for developingeconomies and small enterprises, has fuelled the
precipitous decline in trade. Anecdotal evidence
and surveys by the main international institutions
indicate that indicators for trade finance fell in
2008. In earlier recession episodes trade appears to
have contracted for several quarters in a row,
suggesting that the current weakness in trade could
go on for some time.
Graph 1.1.2: Imports of goods by reg ion
-15
-10
-5
0
5
10
15
20
25
93 94 95 96 97 98 99 00 01 02 03 04 05 06 07 08 09
Advanced economies Emerging marke ts
3mma yoy%
On top of this contraction in trade, the reversal of
capital inflows aggravated the slowdown in
emerging market economies. Risk aversion
intensified in the fourth quarter of 2008 and capital
fled emerging markets, due to rapid deleveraging
and investors reducing exposure in 'riskier'
environments. This caused emerging market bond
spreads to soar, thereby limiting the capacity of
governments in these countries to issue debt. The
reversal of capital flows has also put currencies
under pressure, triggering substantial depreciations
since the second half of 2008 in Asia (e.g. Korea,
Indonesia), Russia, Latin America (e.g. Mexico,
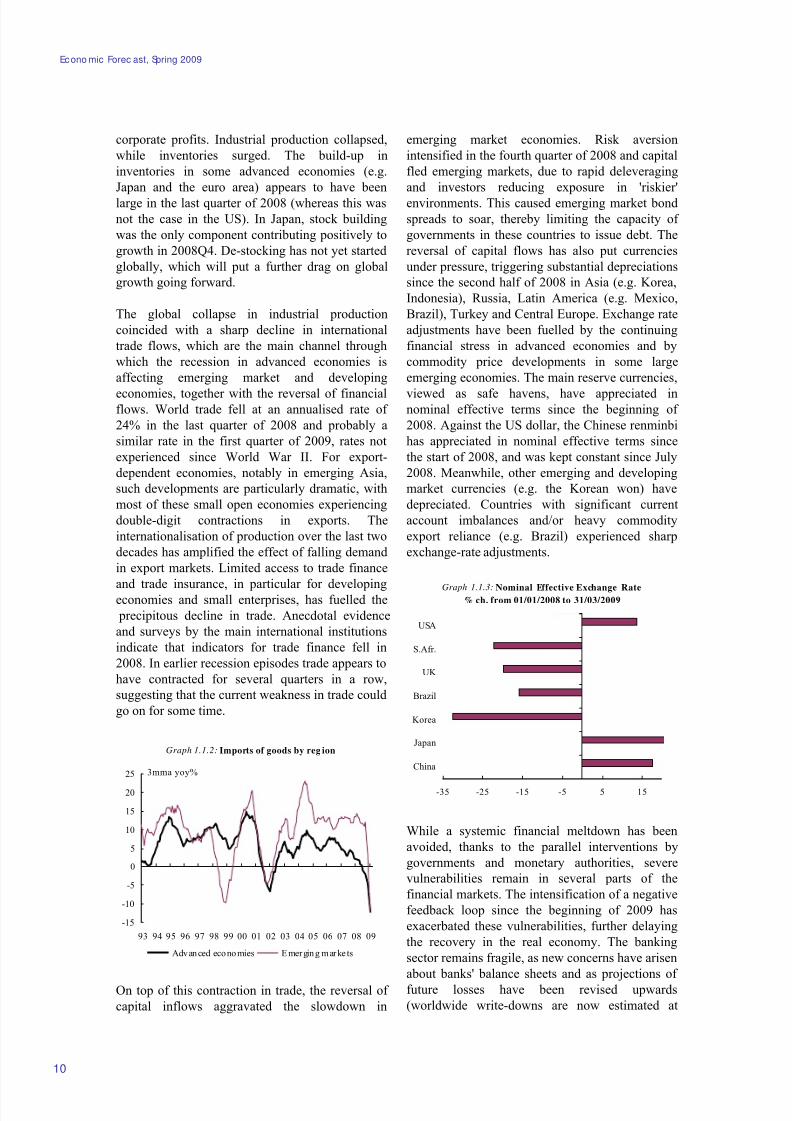
Brazil), Turkey and Central Europe. Exchange rate
adjustments have been fuelled by the continuing
financial stress in advanced economies and by
commodity price developments in some large
emerging economies. The main reserve currencies,
viewed as safe havens, have appreciated innominal effective terms since the beginning of
2008. Against the US dollar, the Chinese renminbi
has appreciated in nominal effective terms since
the start of 2008, and was kept constant since July
2008. Meanwhile, other emerging and developing
market currencies (e.g. the Korean won) have
depreciated. Countries with significant current
account imbalances and/or heavy commodity
export reliance (e.g. Brazil) experienced sharp
exchange-rate adjustments.
Graph 1.1.3: Nominal Effective Exchange Rate% ch. from 01/01/2008 to 31/03/2009
-35 -25 -15 -5 5 15
China
Japan
Korea
Brazil
UK
S.Afr.
USA
While a systemic financial meltdown has been
avoided, thanks to the parallel interventions by
governments and monetary authorities, severe
vulnerabilities remain in several parts of the
financial markets. The intensification of a negative
feedback loop since the beginning of 2009 has
exacerbated these vulnerabilities, further delaying
the recovery in the real economy. The banking
sector remains fragile, as new concerns have arisen
about banks' balance sheets and as projections of
future losses have been revised upwards
(worldwide write-downs are now estimated at
8/14/2019 Economic Forecast 2009
http://slidepdf.com/reader/full/economic-forecast-2009 17/172
Eco nomic de velopments at the ag gregate d level
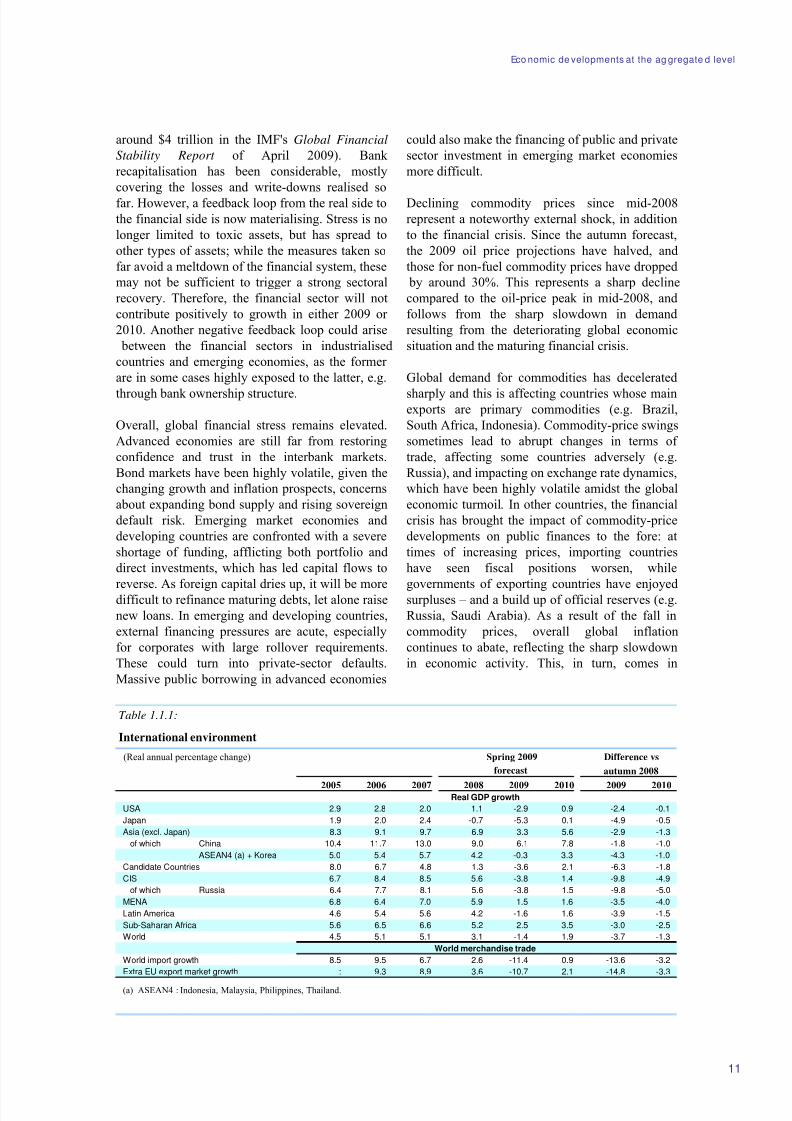
Table 1.1.1:
International environment
(Real annual percentage change) Spring 2009 Difference vs
forecast autumn 2008
2005 2006 2007 2008 2009 2010 2009 2010Real GDP growth
USA 2.9 2.8 2.0 1.1 -2.9 0.9 -2.4 -0.1
Japan 1.9 2.0 2.4 -0.7 -5.3 0.1 -4.9 -0.5
Asia (excl. Japan) 8.3 9.1 9.7 6.9 3.3 5.6 -2.9 -1.3
of which China 10.4 11.7 13.0 9.0 6.1 7.8 -1.8 -1.0
ASEAN4 (a) + Korea 5.0 5.4 5.7 4.2 -0.3 3.3 -4.3 -1.0
Candidate Countries 8.0 6.7 4.8 1.3 -3.6 2.1 -6.3 -1.8
CIS 6.7 8.4 8.5 5.6 -3.8 1.4 -9.8 -4.9
of which Russia 6.4 7.7 8.1 5.6 -3.8 1.5 -9.8 -5.0
MENA 6.8 6.4 7.0 5.9 1.5 1.6 -3.5 -4.0
Latin America 4.6 5.4 5.6 4.2 -1.6 1.6 -3.9 -1.5
Sub-Saharan Africa 5.6 6.5 6.6 5.2 2.5 3.5 -3.0 -2.5
World 4.5 5.1 5.1 3.1 -1.4 1.9 -3.7 -1.3
World merchandise trade
World import growth 8.5 9.5 6.7 2.6 -11.4 0.9 -13.6 -3.2
Extra EU export market growth : 9.3 8.9 3.6 -10.7 2.1 -14.8 -3.3
(a) ASEAN4 : Indonesia, Malaysia, Philippines, Thailand.
11
around $4 trillion in the IMF's Global Financial
Stability Report of April 2009). Bank
recapitalisation has been considerable, mostly
covering the losses and write-downs realised so
far. However, a feedback loop from the real side to
the financial side is now materialising. Stress is no
longer limited to toxic assets, but has spread to
other types of assets; while the measures taken so
far avoid a meltdown of the financial system, these
may not be sufficient to trigger a strong sectoral
recovery. Therefore, the financial sector will not
contribute positively to growth in either 2009 or
2010. Another negative feedback loop could arise
between the financial sectors in industrialised
countries and emerging economies, as the former
are in some cases highly exposed to the latter, e.g.
through bank ownership structure.
Overall, global financial stress remains elevated.
Advanced economies are still far from restoring
confidence and trust in the interbank markets.
Bond markets have been highly volatile, given the
changing growth and inflation prospects, concerns
about expanding bond supply and rising sovereign
default risk. Emerging market economies and
developing countries are confronted with a severe
shortage of funding, afflicting both portfolio and
direct investments, which has led capital flows to
reverse. As foreign capital dries up, it will be moredifficult to refinance maturing debts, let alone raise
new loans. In emerging and developing countries,
external financing pressures are acute, especially
for corporates with large rollover requirements.
These could turn into private-sector defaults.
Massive public borrowing in advanced economies
could also make the financing of public and private
sector investment in emerging market economies
more difficult.
Declining commodity prices since mid-2008
represent a noteworthy external shock, in addition
to the financial crisis. Since the autumn forecast,
the 2009 oil price projections have halved, and
those for non-fuel commodity prices have dropped
by around 30%. This represents a sharp decline
compared to the oil-price peak in mid-2008, and
follows from the sharp slowdown in demand
resulting from the deteriorating global economic
situation and the maturing financial crisis.
Global demand for commodities has decelerated
sharply and this is affecting countries whose mainexports are primary commodities (e.g. Brazil,
South Africa, Indonesia). Commodity-price swings
sometimes lead to abrupt changes in terms of
trade, affecting some countries adversely (e.g.
Russia), and impacting on exchange rate dynamics,
which have been highly volatile amidst the global
economic turmoil. In other countries, the financial
crisis has brought the impact of commodity-price
developments on public finances to the fore: at
times of increasing prices, importing countries
have seen fiscal positions worsen, while
governments of exporting countries have enjoyedsurpluses – and a build up of official reserves (e.g.
Russia, Saudi Arabia). As a result of the fall in
commodity prices, overall global inflation
continues to abate, reflecting the sharp slowdown
in economic activity. This, in turn, comes in
8/14/2019 Economic Forecast 2009
http://slidepdf.com/reader/full/economic-forecast-2009 18/172
Econo mic Forec ast, Spring 2009
12
support of consumption via higher real disposable
income.
Ambitious policy responses
As a reaction to such shocks to the world
economy, policy responses have picked up
momentum. The focus is on crisis management
and ensuring that the economic downturn does not
deepen further. Financial rescue packages were
implemented early on, the aim being to rapidly fix
the dysfunctions in the financial system. On top of
these, following calls for macro-economic policy
action at EU and international level, the policy
response to the financial turmoil and economic
downturn has taken the form of fiscal measures on
the one hand, and substantial monetary easing onthe other. Fiscal stimulus measures are being
implemented in both advanced and emerging
economies. These measures tend to be relatively
similar across countries, usually including actions
to stimulate demand, investment in infrastructure
and temporary investment subsidies, measures
aimed at keeping people in the labour market, and
policies aimed at boosting innovation. Overall, the
fiscal packages are expected to start bearing fruit
from the mid-2009.
On top of unprecedented monetary policy easing,including in the form of exchange rate adjustment
in the case of many emerging market economies,
the monetary arm of the response has now entered
unconventional territory. Given the deteriorating
economic situation, a multitude of policy measures
have been enacted to avoid further deepening of
the crisis and a prolonged downturn. Monetary
authorities all over the world are providing ample
liquidity and making use of a wide range of
instruments at their disposal. The Federal Reserve
has launched a programme to restart trade in
securitised assets, by providing low-cost funding
to investors (e.g. hedge funds) who purchase asset- backed securities. Most importantly, the Federal
Reserve will now purchase longer-term US
Treasury securities. This step is widely seen as a
partial monetisation of government deficits, posing
the question of the timing of the "exit strategy". In
addition to policy rate cuts, the Bank of Japan took
several measures to provide liquidity and support
the financial market, including inter alia increasing
the amount of monthly outright purchase of
government bonds and taking action to facilitate
corporate finance.
The G20 contributed significantly to restoring
global financial stability and conditions for
economic growth. Following the EU's initiative, in
November 2008, G-20 Leaders set up a
comprehensive agenda to guide the global
response to the financial crisis, which included
enhanced economic policy coordination, rejecting
protectionist measures, principles for strengthening
regulatory systems in financial markets, and the
reform of global economic governance. At their
summit in London in April 2009, Leaders agreed
on the detailed implementation of those principles.
The overall achievements of the London summit
are significant and will have a real impact, by (i)
doing what is necessary to restore jobs and growth
(restoring the credit channel; coordinated fiscal
stimulus), (ii) significantly extending the network of financial regulation, reducing pro-cyclicality in
the financial system, and strengthening supervisory
cooperation, (iii) strengthening the international
financial institutions and their resources, (iv)
committing to keep markets open and to an
ambitious conclusion to the Doha Development
Round, (v) and committing to a fair and
sustainable, low carbon recovery for all. The EU
contributed to making the G-20 summit a success.
The strong signal of global unity in the face of the
ongoing crisis is helping to lift economic
confidence. Initial market reactions in the firstdays after the summit confirmed this.
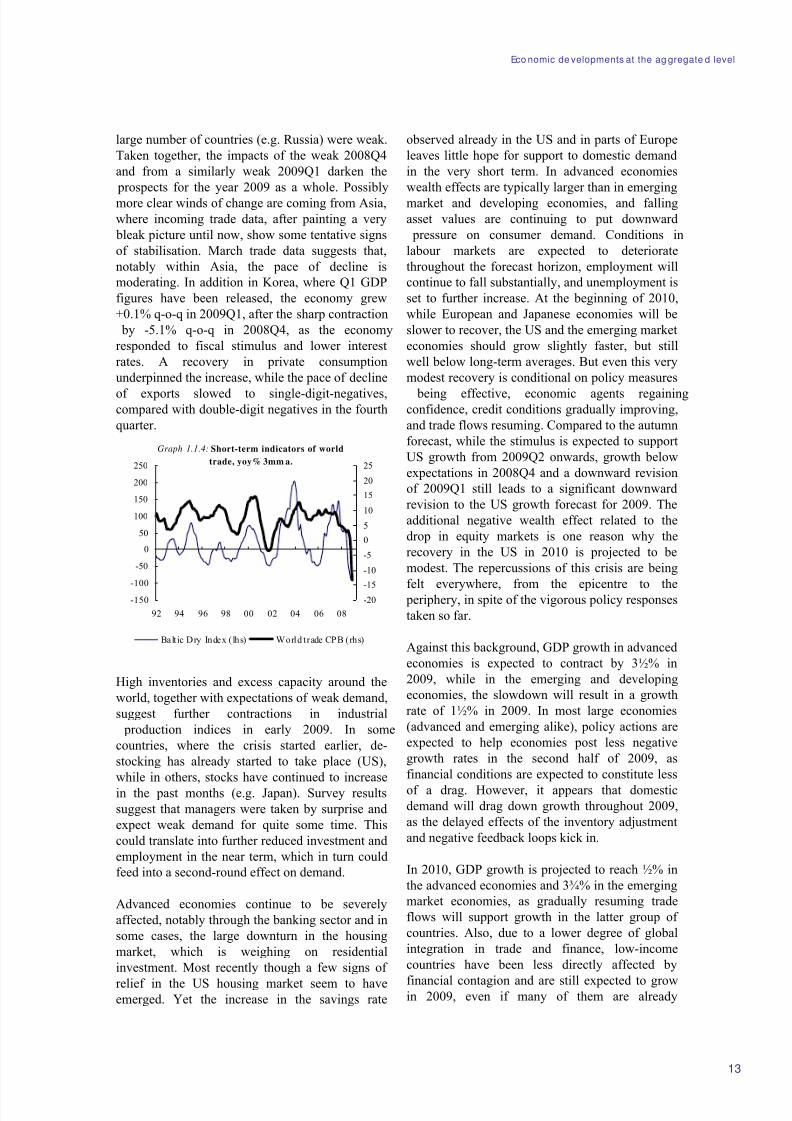
Very few indications of a turnaround a s yet
Short-term indicators of global activity, world
trade and business surveys in most economies are
still posting historical lows. They remain in
contractionary territory despite some surveys
improving slightly in the largest emerging
economies in the early months of 2009. The Baltic
Dry index of shipping costs reached a low at 663
pts on 5 December 2008, suggesting very weak
demand conditions, and then started to increaseagain (but this index is relatively volatile).
Although at still low levels (1797 pts on 21 April),
its recent fluctuations reflect somewhat improved
conditions compared to the December low. Also,
as from February 2009, the Global Manufacturing
PMI appeared to stabilise, although at close to its
weakest ever level. Components (including new
orders and production) declined less steeply, while
the employment component dropped to a new
record low. As the ‘new orders’ component
remains in contractionary territory, the softness in
world trade is expected to persist. The incomingindicators for the first two months of 2009 in a
8/14/2019 Economic Forecast 2009
http://slidepdf.com/reader/full/economic-forecast-2009 19/172
Eco nomic de velopments at the ag gregate d level
13
large number of countries (e.g. Russia) were weak.
Taken together, the impacts of the weak 2008Q4
and from a similarly weak 2009Q1 darken the
prospects for the year 2009 as a whole. Possibly
more clear winds of change are coming from Asia,
where incoming trade data, after painting a very
bleak picture until now, show some tentative signs
of stabilisation. March trade data suggests that,
notably within Asia, the pace of decline is
moderating. In addition in Korea, where Q1 GDP
figures have been released, the economy grew
+0.1% q-o-q in 2009Q1, after the sharp contraction
by -5.1% q-o-q in 2008Q4, as the economy
responded to fiscal stimulus and lower interest
rates. A recovery in private consumption
underpinned the increase, while the pace of decline
of exports slowed to single-digit-negatives,compared with double-digit negatives in the fourth
quarter.
Graph 1.1.4: Short-term indicators of world
trade, yoy% 3mm a.
-150
-100
-50
0
50
100
150
200
250
92 94 96 98 00 02 04 06 08
-20-15
-10
-5
0
5
10
15
20
25
Balt ic Dry Index ( lhs) World trade CPB (rhs)
High inventories and excess capacity around the
world, together with expectations of weak demand,
suggest further contractions in industrial
production indices in early 2009. In some
countries, where the crisis started earlier, de-
stocking has already started to take place (US),
while in others, stocks have continued to increase
in the past months (e.g. Japan). Survey results
suggest that managers were taken by surprise and
expect weak demand for quite some time. This
could translate into further reduced investment and
employment in the near term, which in turn could
feed into a second-round effect on demand.
Advanced economies continue to be severely
affected, notably through the banking sector and in
some cases, the large downturn in the housing
market, which is weighing on residential
investment. Most recently though a few signs of
relief in the US housing market seem to haveemerged. Yet the increase in the savings rate
observed already in the US and in parts of Europe
leaves little hope for support to domestic demand
in the very short term. In advanced economies
wealth effects are typically larger than in emerging
market and developing economies, and falling
asset values are continuing to put downward
pressure on consumer demand. Conditions in
labour markets are expected to deteriorate
throughout the forecast horizon, employment will
continue to fall substantially, and unemployment is
set to further increase. At the beginning of 2010,
while European and Japanese economies will be
slower to recover, the US and the emerging market
economies should grow slightly faster, but still
well below long-term averages. But even this very
modest recovery is conditional on policy measures
being effective, economic agents regainingconfidence, credit conditions gradually improving,
and trade flows resuming. Compared to the autumn
forecast, while the stimulus is expected to support
US growth from 2009Q2 onwards, growth below
expectations in 2008Q4 and a downward revision
of 2009Q1 still leads to a significant downward
revision to the US growth forecast for 2009. The
additional negative wealth effect related to the
drop in equity markets is one reason why the
recovery in the US in 2010 is projected to be
modest. The repercussions of this crisis are being
felt everywhere, from the epicentre to the periphery, in spite of the vigorous policy responses
taken so far.
Against this background, GDP growth in advanced
economies is expected to contract by 3½% in
2009, while in the emerging and developing
economies, the slowdown will result in a growth
rate of 1½% in 2009. In most large economies
(advanced and emerging alike), policy actions are
expected to help economies post less negative
growth rates in the second half of 2009, as
financial conditions are expected to constitute less
of a drag. However, it appears that domesticdemand will drag down growth throughout 2009,
as the delayed effects of the inventory adjustment
and negative feedback loops kick in.
In 2010, GDP growth is projected to reach ½% in
the advanced economies and 3¾% in the emerging
market economies, as gradually resuming trade
flows will support growth in the latter group of
countries. Also, due to a lower degree of global
integration in trade and finance, low-income
countries have been less directly affected by
financial contagion and are still expected to growin 2009, even if many of them are already
8/14/2019 Economic Forecast 2009
http://slidepdf.com/reader/full/economic-forecast-2009 20/172
Econo mic Forec ast, Spring 2009
14
suffering from lower demand for primary
commodities and worsening terms of trade, foreign
investment, remittances, and aid. Overall, as
unemployment rates and fiscal positions are likely
to have deteriorated markedly during this crisis, a
rapid return to growth rates experienced in the past
five to six years is not expected in the near future.
Some countries will continue to be particularly
vulnerable, and among those, the countries with
large external financing needs (the sum of the
current-account balance and the stock of short-
term debt over the next 12 months) will be
particularly at risk. Large foreign exchange
reserves in a number of emerging markets
countries could help to shelter them in the near
term. However, more interventions frominternational financial institutions, on top of those
already agreed to (e.g. to Pakistan, Ukraine),
cannot be excluded. The length of the financial
crisis will determine whether reserve coverage will
be sufficient. Furthermore, these reserves might
not allow countries to implement counter-cyclical
fiscal policies, given the high level of external
liabilities and/or the increased borrowing costs that
would reduce the financing of fiscal stimulus
measures.
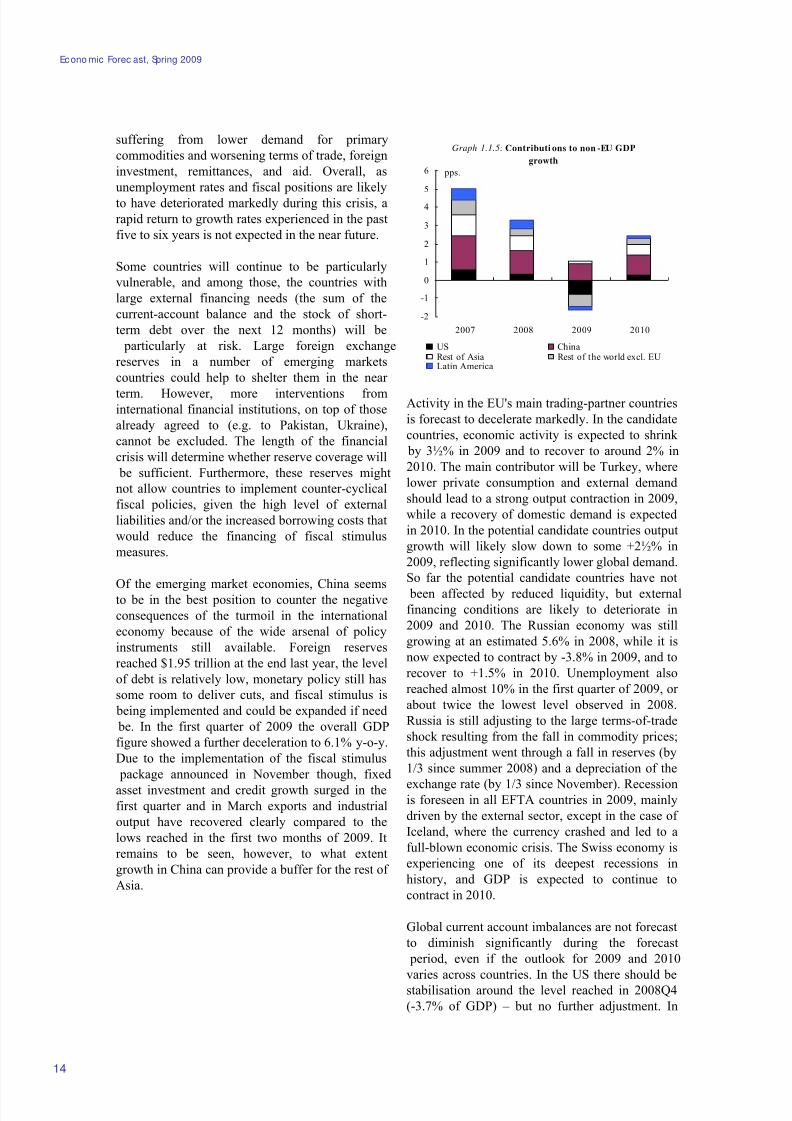
Of the emerging market economies, China seemsto be in the best position to counter the negative
consequences of the turmoil in the international
economy because of the wide arsenal of policy
instruments still available. Foreign reserves
reached $1.95 trillion at the end last year, the level
of debt is relatively low, monetary policy still has
some room to deliver cuts, and fiscal stimulus is
being implemented and could be expanded if need
be. In the first quarter of 2009 the overall GDP
figure showed a further deceleration to 6.1% y-o-y.
Due to the implementation of the fiscal stimulus
package announced in November though, fixed
asset investment and credit growth surged in thefirst quarter and in March exports and industrial
output have recovered clearly compared to the
lows reached in the first two months of 2009. It
remains to be seen, however, to what extent
growth in China can provide a buffer for the rest of
Asia.
Graph 1.1.5: Contributi ons to non -EU GDP
growth
-2
-1
0
1
2
3
4
5
6
2007 2008 2009 2010
US ChinaRest of Asia Rest of the world excl. EULatin America
pps.
Activity in the EU's main trading-partner countries
is forecast to decelerate markedly. In the candidate
countries, economic activity is expected to shrink
by 3½% in 2009 and to recover to around 2% in
2010. The main contributor will be Turkey, where
lower private consumption and external demand
should lead to a strong output contraction in 2009,
while a recovery of domestic demand is expected
in 2010. In the potential candidate countries output
growth will likely slow down to some +2½% in
2009, reflecting significantly lower global demand.
So far the potential candidate countries have not
been affected by reduced liquidity, but externalfinancing conditions are likely to deteriorate in
2009 and 2010. The Russian economy was still
growing at an estimated 5.6% in 2008, while it is
now expected to contract by -3.8% in 2009, and to
recover to +1.5% in 2010. Unemployment also
reached almost 10% in the first quarter of 2009, or
about twice the lowest level observed in 2008.
Russia is still adjusting to the large terms-of-trade
shock resulting from the fall in commodity prices;
this adjustment went through a fall in reserves (by
1/3 since summer 2008) and a depreciation of the
exchange rate (by 1/3 since November). Recessionis foreseen in all EFTA countries in 2009, mainly
driven by the external sector, except in the case of
Iceland, where the currency crashed and led to a
full-blown economic crisis. The Swiss economy is
experiencing one of its deepest recessions in
history, and GDP is expected to continue to
contract in 2010.
Global current account imbalances are not forecast
to diminish significantly during the forecast
period, even if the outlook for 2009 and 2010
varies across countries. In the US there should be
stabilisation around the level reached in 2008Q4
(-3.7% of GDP) – but no further adjustment. In
8/14/2019 Economic Forecast 2009
http://slidepdf.com/reader/full/economic-forecast-2009 21/172
Eco nomic de velopments at the ag gregate d level
15
China, the current account surplus is not expected
to narrow significantly, while in Japan the
stabilisation in the income account and cheaper
imports should lead to some increase in the current
account surplus. Only in the oil-exporting
countries will surpluses narrow significantly, with
some countries such as Saudi Arabia even
projected to experience a significant current
account deficit. In the EU as a whole, a moderate
deterioration from a relatively balanced position is
foreseen.
Looking into 2010 and beyond, there are strong
reasons to expect significantly lower annual
average world growth rates than those observed in
the last 5 years. While it is reasonable to expect
that the trough of this recession will eventuallycome some time this year (possibly in the second
half of 2009), the recovery at the global level is
likely to be muted. Uncertainty remains high, and
the timing of the recovery chiefly depends on the
effectiveness and the speed of implementation of
the announced measures and the policy actions in
the coming months.
Risks to the global growth outlook appear more
balanced in 2009-2010. Growth could be stronger
than expected if fiscal packages restore confidence
among investors and consumers swiftly and if theeffects of massive monetary policy easing gain
traction faster than assumed. The nature of the
recovery in emerging economies will mostly
depend on external financing conditions and on
how fast capital inflows resume. The fragile
financial sector and the possible feedback loops
between the financial and the real sector remain
the largest downside risk. Also, should emerging
economies not have sufficient access to external
financing, this could wipe out the little positive
growth that these economies are still generating.
Moreover, protectionist pressures could further
aggravate the picture. On the upside, if the impactof the different measures taken, the recoveries in
the largest emerging economies (notably in Asia),
in the US housing sector or in the global inventory
liquidation would be faster and/or stronger than
expected, growth might recover sooner (see also
section 1.7 for a more detailed discussion of risks
to the current outlook).
8/14/2019 Economic Forecast 2009
http://slidepdf.com/reader/full/economic-forecast-2009 22/172
Econo mic Forec ast, Spring 2009
16
Box 1.1.1: The c risis has caught up with emerging ma rket and d evelop ing ec onom ies
While these countries were initially affectedthrough the co llapse in wo rld trade , …
Emerging market economies (EMEs) were hit by
the crisis in the last quarter of 2008, initially
through the collapse in world trade. The failure of
Lehman Brothers resulted in a confidence shock, to
which households and firms reacted, inter alia, by
postponing expenditure and investment. The
associated decline in demand for consumer goods
and especially durable goods in advanced
economies (those with high import content) led to
sharp declines in trade in EMEs, especially in Asia.
Trade growth was also driven down by the direct
impact from the financial crisis on the availabilityof trade credit. The fact that trade finance is drying
up, in particular for developing economies and
small enterprises, has contributed to the precipitous
decline in trade. Moreover, currency depreciations
have exacerbated the exchange risk taken by
corporates in a number of countries.
… they were also hit by the financial c hannel
On top of this, the reversal of capital inflows has
aggravated the slowdown in EMEs, as banks have
repatriated cash to cover losses elsewhere and risk
aversion has intensified. While such outflows could be manageable in some countries, they may prove
disruptive in others and may negatively affect
growth in the longer term. The repatriation of
capital by foreign banks has been particularly
abrupt in some cases. For instance, in Ukraine, real
GDP growth is projected to decline by 9½% in
2009, due to a severely curtailed access to external
financing, which has triggered the conclusion of a
stand-by arrangement (SBA) with the IMF.
Noteworthy are the hefty recapitalisation needs of
the 17 largest Ukrainian banks, including foreign
banks (many of which are home in the EU).
Belarus, where the main vulnerability is a weak
external position compounded by a largedependence on the Russian market, also concluded
an SBA with the IMF. The significant and broad-
based slowdown in the CIS could have direct
growth effects in Central and Eastern Europe, and
the presence of EU banks in the region creates
further potential negative spill-overs via the
financial channel.
While trade growth is expected to resume gradually
as the recovery takes hold in advanced economies,
it may take much more time for capital to flow into
these countries again.
As a result, emerging market and developingeco nomies are facing specific challenges
The severity of the global downturn will cause
fiscal positions in EMEs to deteriorate. This may
be the result of lower tax revenues (e.g. Russia or
Saudi Arabia, where the revenues from oil and gas
exports are significant), or increased expenditure
(e.g. China, India). This risk is also spilling over to
countries that rely on import tax revenues (e.g. the
Philippines, Turkey), or tax revenues on exports
(e.g. Argentina). In Latin America, fiscal positions
are expected to markedly deteriorate, due to weaker
activity and lower commodity prices.
Parts of the emerging world, however, have been
affected with a lag (e.g. China). In contrast to the
past, the emerging and developing countries of
Middle-East and North Africa (MENA) are being
hit later than the advanced countries. GDP growth
is expected to be 1½% in 2009 and economic
growth will remain slow in 2010. Latin America
had initially shown significant resilience to the
global crisis due inter alia to strong domestic
demand, sound current account positions, increased
foreign reserves, and low public and external debt
ratios. However, in 2008Q4 growth started to
decelerate and is projected to contract by 1½% in2009. Low consumer and business confidence point
to significant contractions in consumption and
investment. Rising unemployment and declining
remittances are also taking their toll on EMEs.
Under these circumstances, several countries have
eased monetary policies and put in place fiscal
measures to help mitigate the impact of the
economic downturn.
While low-income countries are less directly
affected via the financial sector, the global
economic downturn is increasingly weighing on
growth perspectives. GDP growth is projected to
decelerate to 2½% in sub-Saharan Africa, whereexport growth decreased as global demand for
commodities, the region's main exports, fell
sharply. In view of the low commodity prices,
cancellations and postponements of major
investment projects are expected to become more
widespread, further subduing investment, while job
losses will have an impact on private consumption.
In 2010, GDP is foreseen to regain some
momentum and grow by around 3½%, mainly
owing to an improvement in exports and
investment.
8/14/2019 Economic Forecast 2009
http://slidepdf.com/reader/full/economic-forecast-2009 23/172
2. FINANCIAL MARKETS STABILISED BUT SIZEABLE
VULNERABILITIES REMAIN
17
In the aftermath of the bankruptcy of Lehman
Brothers in September 2008, the wholesale credit
markets became fully dysfunctional and
confidence amongst financial market participants
completely dissipated. In an effort to avoid a
global meltdown of the financial system, central
banks and governments intervened in first instance
by ensuring bank’s access to short-term funding.
As shortly thereafter some major banks were
forced out of business, also in Europe,
governments stepped in with drastic measures tostrengthen banks' capital. In this way, they ensured
banks' solvency and their capacity to continue
supplying credit to the private non-financial sector.
In the euro area, the ECB stepped up efforts to
support bank liquidity by easing its monetary
policy stance, lengthening the maturity of
refinancing operations and adjusting its collateral
framework. Over the last seven months, the ECB
has brought down its key policy rate in several
steps by 300 basis points (bps), from 4.25 percent
on 8 October 2008 to 1.25 percent at present.
The EU also acted decisively by announcing on 16
October 2008 a co-ordinated package of financial
support measures, including reinforced deposit
insurance schemes, recapitalisation of banks using
public funds, government guarantees for bank
borrowing, and asset exchange/purchases to
enhance banks' access to liquidity. More recently,
the option of providing impaired asset relief has
been added to this menu of support measures. So
far, Member States have committed about EUR
270 billion for recapitalisation of banks and about
EUR 3,200 billion for enhancing bank access tofunding (i.e. via guarantees, exchange of assets
etc.). To avoid creating undue distortions of competition
amongst Member States, the European
Commission and the ECB have provided guidance
to the Member States on the different types of
State interventions. Further, an impressive set of
legal initiatives has been or is being taken by the
EU and the Member States in the field of financial
services policy and regulatory structures. The EU
has also been in the lead at the G20 to agree on aset of principles for reforming the financial sector
at a global level.
The actions by governments and central banks
worldwide seem to have succeeded in bringing
some degree of stabilisation to the financial
system, even though the financial markets and
institutions remain under considerable stress.
Moreover, the large policy interventions have
involved governments taking on considerable
financial risks and led to deteriorating public
finances which are already under heavy stress due
to the decline in economic activity. Indeed,
problems in the banking system have increasinglyspilled over into the real economy with major
economies abruptly entering a recession, creating a
negative feedback loop back to the financial sector.
The grad ual repa ir of the interbank ma rket
functioning
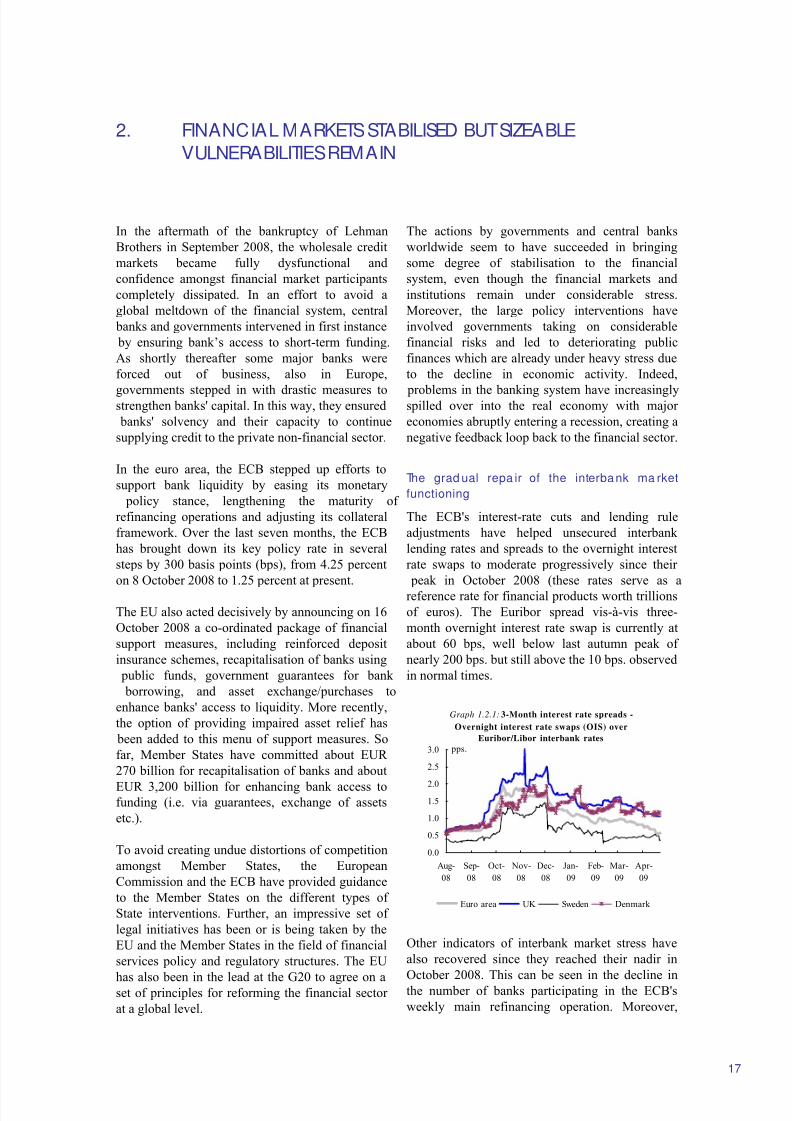
The ECB's interest-rate cuts and lending rule
adjustments have helped unsecured interbank
lending rates and spreads to the overnight interest
rate swaps to moderate progressively since their
peak in October 2008 (these rates serve as a
reference rate for financial products worth trillions
of euros). The Euribor spread vis-à-vis three-
month overnight interest rate swap is currently at
about 60 bps, well below last autumn peak of
nearly 200 bps. but still above the 10 bps. observed
in normal times.
Graph 1.2.1: 3-Month interest rate spreads -
Overnight interest rate swaps (OIS) over
Euribor/Libor interbank rates
0.0
0.5
1.0
1.5
2.0
2.5
3.0
Aug-
08
Sep-
08
Oct-
08
Nov-
08
Dec-
08
Jan-
09
Feb-
09
Mar-
09
Apr-
09
pps.
Euro area UK Sweden Denmark
Other indicators of interbank market stress have
also recovered since they reached their nadir in
October 2008. This can be seen in the decline in
the number of banks participating in the ECB's
weekly main refinancing operation. Moreover,
8/14/2019 Economic Forecast 2009
http://slidepdf.com/reader/full/economic-forecast-2009 24/172
8/14/2019 Economic Forecast 2009
http://slidepdf.com/reader/full/economic-forecast-2009 25/172
Eco nomic de velopments at the ag gregate d level
19
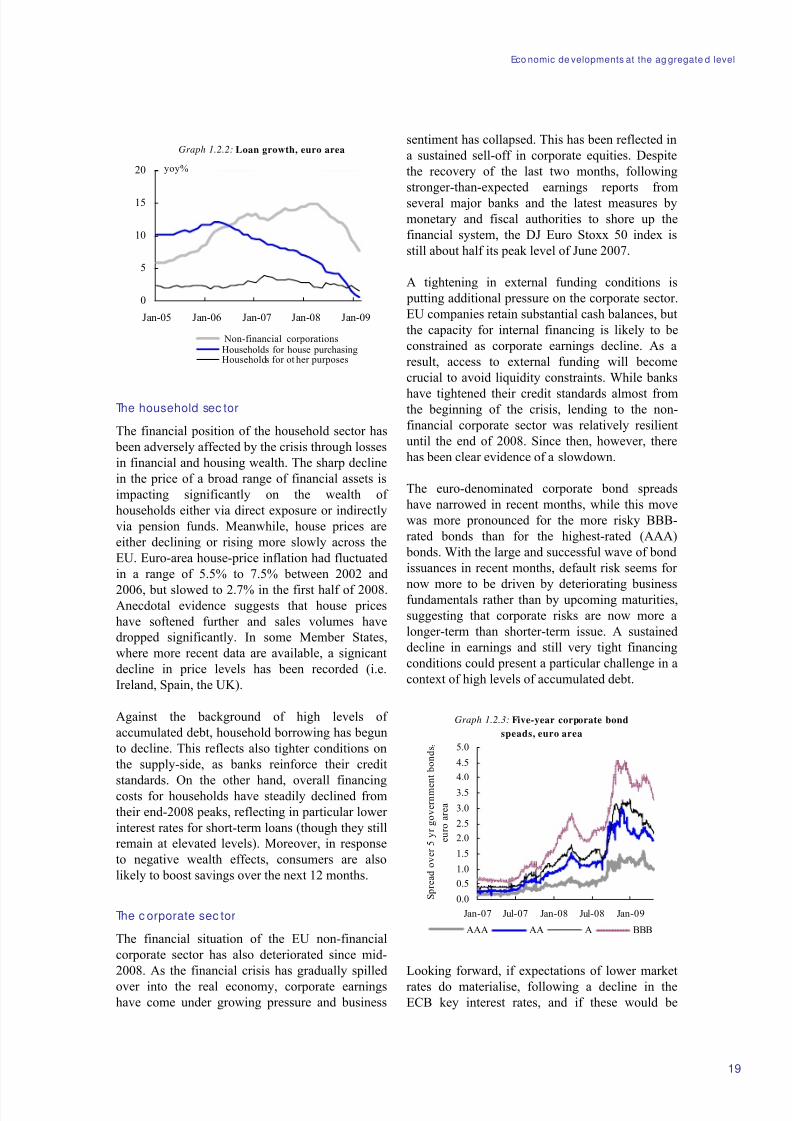
Graph 1.2.2: Loan growth, euro area
0
5
10
15
20
Jan-05 Jan-06 Jan-07 Jan-08 Jan-09
yoy%
Non-financial corporationsHouseholds for house purchasingHouseholds for ot her purposes
The household sec tor
The financial position of the household sector has
been adversely affected by the crisis through losses
in financial and housing wealth. The sharp decline
in the price of a broad range of financial assets is
impacting significantly on the wealth of
households either via direct exposure or indirectly
via pension funds. Meanwhile, house prices are
either declining or rising more slowly across the
EU. Euro-area house-price inflation had fluctuated
in a range of 5.5% to 7.5% between 2002 and
2006, but slowed to 2.7% in the first half of 2008.Anecdotal evidence suggests that house prices
have softened further and sales volumes have
dropped significantly. In some Member States,
where more recent data are available, a signicant
decline in price levels has been recorded (i.e.
Ireland, Spain, the UK).
Against the background of high levels of
accumulated debt, household borrowing has begun
to decline. This reflects also tighter conditions on
the supply-side, as banks reinforce their credit
standards. On the other hand, overall financingcosts for households have steadily declined from
their end-2008 peaks, reflecting in particular lower
interest rates for short-term loans (though they still
remain at elevated levels). Moreover, in response
to negative wealth effects, consumers are also
likely to boost savings over the next 12 months.
The c orporate sec tor
The financial situation of the EU non-financial
corporate sector has also deteriorated since mid-
2008. As the financial crisis has gradually spilled
over into the real economy, corporate earningshave come under growing pressure and business
sentiment has collapsed. This has been reflected in
a sustained sell-off in corporate equities. Despite
the recovery of the last two months, following
stronger-than-expected earnings reports from
several major banks and the latest measures by
monetary and fiscal authorities to shore up the
financial system, the DJ Euro Stoxx 50 index is
still about half its peak level of June 2007.
A tightening in external funding conditions is
putting additional pressure on the corporate sector.
EU companies retain substantial cash balances, but
the capacity for internal financing is likely to be
constrained as corporate earnings decline. As a
result, access to external funding will become
crucial to avoid liquidity constraints. While banks
have tightened their credit standards almost fromthe beginning of the crisis, lending to the non-
financial corporate sector was relatively resilient
until the end of 2008. Since then, however, there
has been clear evidence of a slowdown.
The euro-denominated corporate bond spreads
have narrowed in recent months, while this move
was more pronounced for the more risky BBB-
rated bonds than for the highest-rated (AAA)
bonds. With the large and successful wave of bond
issuances in recent months, default risk seems for
now more to be driven by deteriorating businessfundamentals rather than by upcoming maturities,
suggesting that corporate risks are now more a
longer-term than shorter-term issue. A sustained
decline in earnings and still very tight financing
conditions could present a particular challenge in a
context of high levels of accumulated debt.
Graph 1.2.3: Five-year corporate bond
speads, euro area
0.0
0.5
1.0
1.5
2.0
2.5
3.0
3.5
4.0
4.5
5.0
Jan-07 Jul-07 Jan-08 Jul-08 Jan-09
S p r e a d o v e r 5 y r g o v e r n m e
n t b o n d s
e u r o a r e a
AAA AA A BBB
Looking forward, if expectations of lower market
rates do materialise, following a decline in theECB key interest rates, and if these would be
8/14/2019 Economic Forecast 2009
http://slidepdf.com/reader/full/economic-forecast-2009 26/172
Econo mic Forec ast, Spring 2009
20
passed onto bank-lending rates, the latter could
contribute to declining financing costs. On the
other hand, as banks are still reluctant to lend to
each other and remain risk-averse against the
backdrop of the present economic downturn, non-
price financing conditions could tighten further.
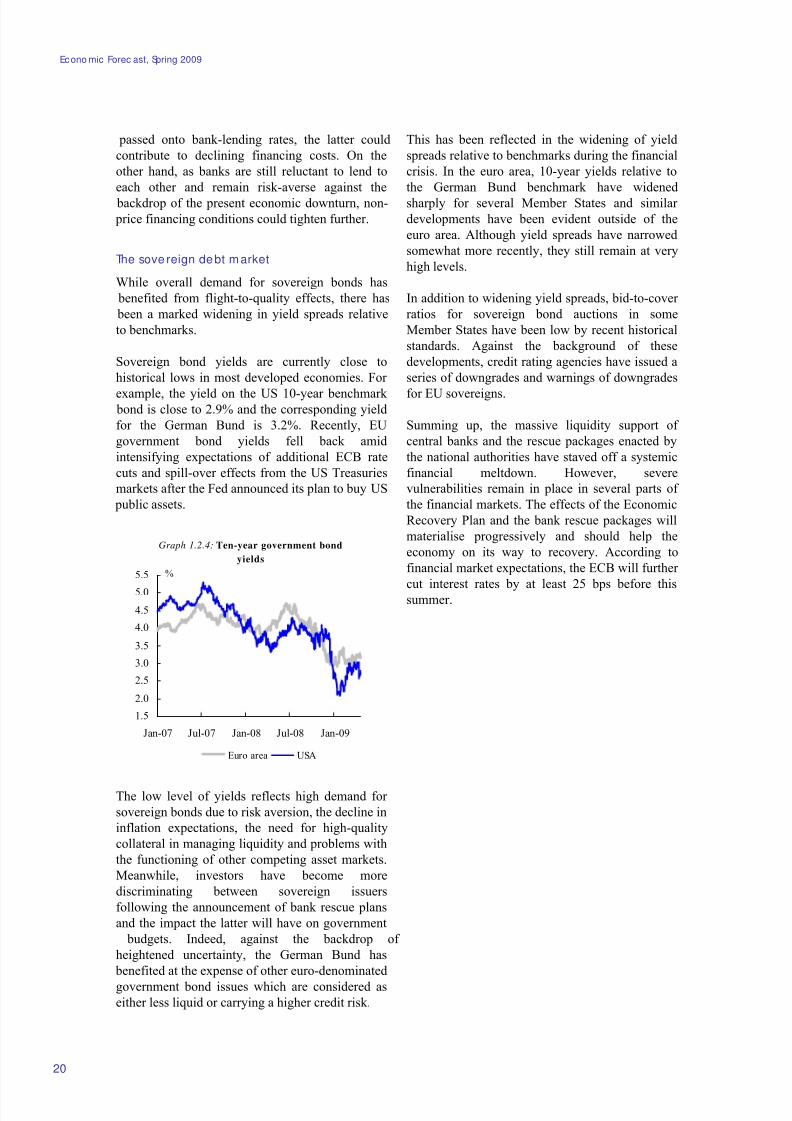
The sove reign debt market
While overall demand for sovereign bonds has
benefited from flight-to-quality effects, there has
been a marked widening in yield spreads relative
to benchmarks.
Sovereign bond yields are currently close to
historical lows in most developed economies. For
example, the yield on the US 10-year benchmark bond is close to 2.9% and the corresponding yield
for the German Bund is 3.2%. Recently, EU
government bond yields fell back amid
intensifying expectations of additional ECB rate
cuts and spill-over effects from the US Treasuries
markets after the Fed announced its plan to buy US
public assets.
Graph 1.2.4: Ten-year government bond
yields
1.5
2.0
2.5
3.0
3.5
4.0
4.5
5.0
5.5
Jan-07 Jul-07 Jan-08 Jul-08 Jan-09
%
Euro area USA
The low level of yields reflects high demand for
sovereign bonds due to risk aversion, the decline in
inflation expectations, the need for high-quality
collateral in managing liquidity and problems with
the functioning of other competing asset markets.
Meanwhile, investors have become more
discriminating between sovereign issuers
following the announcement of bank rescue plans
and the impact the latter will have on government
budgets. Indeed, against the backdrop of
heightened uncertainty, the German Bund has
benefited at the expense of other euro-denominated
government bond issues which are considered aseither less liquid or carrying a higher credit risk.
This has been reflected in the widening of yield
spreads relative to benchmarks during the financial
crisis. In the euro area, 10-year yields relative to
the German Bund benchmark have widened
sharply for several Member States and similar
developments have been evident outside of the
euro area. Although yield spreads have narrowed
somewhat more recently, they still remain at very
high levels.
In addition to widening yield spreads, bid-to-cover
ratios for sovereign bond auctions in some
Member States have been low by recent historical
standards. Against the background of these
developments, credit rating agencies have issued a
series of downgrades and warnings of downgrades
for EU sovereigns.
Summing up, the massive liquidity support of
central banks and the rescue packages enacted by
the national authorities have staved off a systemic
financial meltdown. However, severe
vulnerabilities remain in place in several parts of
the financial markets. The effects of the Economic
Recovery Plan and the bank rescue packages will
materialise progressively and should help the
economy on its way to recovery. According to
financial market expectations, the ECB will further
cut interest rates by at least 25 bps before thissummer.
8/14/2019 Economic Forecast 2009
http://slidepdf.com/reader/full/economic-forecast-2009 27/172
Eco nomic de velopments at the ag gregate d level
21
Box 1.2.1: Some technicalities behind the forecast
The overall cut-off date for taking new informationinto account in this update of the Commission's
macroeconomic outlook was 22 April. The forecast
also incorporates validated public finance data from
Eurostat´s press release 56/2009 of the same date.
External assump tions
This forecast is based on a set of external
assumptions, reflecting market expectations at the
time of the forecast. To shield the assumptions
from possible volatility during any given trading
day, averages from a 10-day reference period
(between 2 to 17 April) were used for exchange
and interest rates, and for oil prices.
Excha nge and interest rates
The technical assumption as regards exchange rates
was standardised using fixed nominal exchange
rates for all currencies. This technical assumption
leads to implied average USD/EUR rates of 1.32 in
2009 and of 1.33 in 2010, and average JPY/EUR
rates of 129.82 in 2009 and 132.52 in 2010.
Interest-rate assumptions are market-based. Short-
term interest rates for the euro area are derived
from future contracts. Long-term interest rates for the euro area, as well as short- and long-term
interest rates for other Member States, are
calculated using implicit forward swap rates,
corrected for the spread between the 3-month inter-
bank interest rate and the 3-month swap rate. In
cases where no market instrument is available, a
fixed spread vis-à-vis euro-area interest rates is
taken for both short- and long-term rates. As a
result, short-term interest rates are expected to be
1.6% on average in 2009 and 2.0% in 2010 in the
euro area. Long-term interest rates are assumed to
be 3.3% in 2009 and 3.6% in 2010.
Commo dity prices
Commodity-price assumptions are also, as far as
possible, based on market conditions. According to
future markets, prices for Brent oil are projected to
be on average 52.9 USD/bl. in 2009 and 63.5 in
2010. This would correspond to an oil price of 40.2
EUR/bl. in 2009 and 47.7 EUR/bl. in 2010.
Budg etary data
Data up to 2008 are based on data notified by
Member States to the European Commission on 1
April 2009 and validated by Eurostat on 22 April
2009. (
1
) In validating the data, Eurostat madereservations for Denmark (for which it is
investigating the sectoral classification of the
Roskilde Bank and AFS-Afviklingsselskabet – a
vehicle for bank rescues – currently both classified
as financial corporations) and the United Kingdom
(for which it is considering the appropriate
treatment of 185 billion GBP of treasury bills
provided to the Bank of England for use in the
Special Liquidity Scheme, currently not recorded
as part of United Kingdom government debt). As
usual UK deficit data for the years to 2008 have
been slightly amended for consistency with
Eurostat's view on the recording of UMTS licences
proceeds. In addition, Eurostat announced that it isin the process of drawing up guidance on the
statistical treatment of public operations to support
financial markets.
For the forecast, measures in support of financial
stability have – as a rule – been recorded as
follows. Unless reported otherwise by the Member
State concerned, capital injections known in
sufficient detail have been included in the forecast
as financial transactions, i.e. increasing the debt,
but not the deficit. State guarantees on bank
liabilities and deposits are not included as
government expenditure, unless there is evidencethat they have been called at the time the forecast
was closed. Note however that loans granted to
banks by the government, or by other entities
classified in the government sector, usually add to
government debt. This approach is to be considered
a technical assumption and in no way prejudges
Eurostat’s final decision on the statistical recording
of each of these transactions. For reasons of
prudence, there was no attempt to forecast fees paid
to government by financial institutions in relation
to state guarantees. Only those payments that were
considered certain at the time of the forecast were
recorded as government revenue.
For 2009, budgets adopted or presented to national
parliaments and all other measures known in
sufficient detail are taken into consideration. For
2010, the 'no-policy-change' assumption used in the
forecasts implies the extrapolation of revenue and
expenditure trends and the inclusion of measures
that are known in sufficient detail.
The general government balances that are relevant
for the excessive deficit procedure may be slightly
(
1
) Eurostat News Release N° 56/2009.(Continued on the next page)
8/14/2019 Economic Forecast 2009
http://slidepdf.com/reader/full/economic-forecast-2009 28/172
Econo mic Forec ast, Spring 2009
22
Box (continued)
different from those published in the national
accounts. The difference concerns settlements
under swaps and forward rate agreements (FRA).
According to ESA95 (amended by regulation No
2558/2001), swap and FRA-related flows are
financial transactions and therefore excluded from
the calculation of the government balance.
However, for the purposes of the excessive deficit
procedure, those flows are recorded as net interest
expenditure.
Calendar effects on GDP growth and output
gaps
The number of working days may differ from one
year to another. The Commission's annual GDP
forecasts are not adjusted for the number of working days, but quarterly forecasts are. However,
the working-day effect in the EU and the euro area
is estimated to be broadly neutral in 2009 and
marginally positive in 2010.
The calculation of potential growth and the output
gap does not adjust for working days. Since it is
considered temporary, it should not affect the
cyclically-adjusted balances.
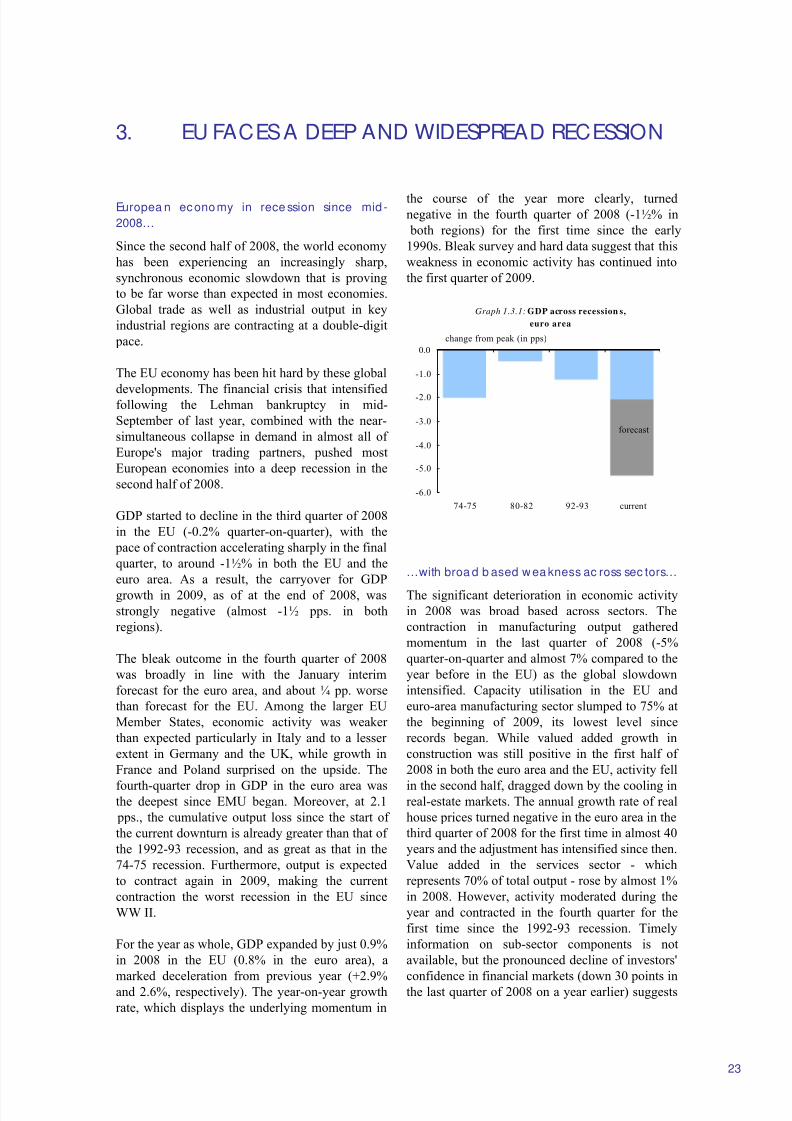
8/14/2019 Economic Forecast 2009
http://slidepdf.com/reader/full/economic-forecast-2009 29/172
3. EU FACES A DEEP AND WIDESPREAD RECESSION
23
Europea n economy in rece ssion since mid -
2008…
Since the second half of 2008, the world economy
has been experiencing an increasingly sharp,
synchronous economic slowdown that is proving
to be far worse than expected in most economies.
Global trade as well as industrial output in key
industrial regions are contracting at a double-digit
pace.
The EU economy has been hit hard by these global
developments. The financial crisis that intensifiedfollowing the Lehman bankruptcy in mid-
September of last year, combined with the near-
simultaneous collapse in demand in almost all of
Europe's major trading partners, pushed most
European economies into a deep recession in the
second half of 2008.
GDP started to decline in the third quarter of 2008
in the EU (-0.2% quarter-on-quarter), with the
pace of contraction accelerating sharply in the final
quarter, to around -1½% in both the EU and the
euro area. As a result, the carryover for GDP
growth in 2009, as of at the end of 2008, was
strongly negative (almost -1½ pps. in both
regions).
The bleak outcome in the fourth quarter of 2008
was broadly in line with the January interim
forecast for the euro area, and about ¼ pp. worse
than forecast for the EU. Among the larger EU
Member States, economic activity was weaker
than expected particularly in Italy and to a lesser
extent in Germany and the UK, while growth in
France and Poland surprised on the upside. The
fourth-quarter drop in GDP in the euro area wasthe deepest since EMU began. Moreover, at 2.1
pps., the cumulative output loss since the start of
the current downturn is already greater than that of
the 1992-93 recession, and as great as that in the
74-75 recession. Furthermore, output is expected
to contract again in 2009, making the current
contraction the worst recession in the EU since
WW II.
For the year as whole, GDP expanded by just 0.9%
in 2008 in the EU (0.8% in the euro area), a
marked deceleration from previous year (+2.9%and 2.6%, respectively). The year-on-year growth
rate, which displays the underlying momentum in
the course of the year more clearly, turnednegative in the fourth quarter of 2008 (-1½% in
both regions) for the first time since the early
1990s. Bleak survey and hard data suggest that this
weakness in economic activity has continued into
the first quarter of 2009.
-6.0
-5.0
-4.0
-3.0
-2.0
-1.0
0.0
74-75 80-82 92-93 current
change from peak (in pps)
forecast
Graph 1.3.1: GDP across recession s,
euro area
…with broa d b ased wea kness ac ross sec tors…
The significant deterioration in economic activity
in 2008 was broad based across sectors. The
contraction in manufacturing output gathered
momentum in the last quarter of 2008 (-5%
quarter-on-quarter and almost 7% compared to the
year before in the EU) as the global slowdown
intensified. Capacity utilisation in the EU and
euro-area manufacturing sector slumped to 75% at
the beginning of 2009, its lowest level since
records began. While valued added growth in
construction was still positive in the first half of
2008 in both the euro area and the EU, activity fell
in the second half, dragged down by the cooling inreal-estate markets. The annual growth rate of real
house prices turned negative in the euro area in the
third quarter of 2008 for the first time in almost 40
years and the adjustment has intensified since then.
Value added in the services sector - which
represents 70% of total output - rose by almost 1%
in 2008. However, activity moderated during the
year and contracted in the fourth quarter for the
first time since the 1992-93 recession. Timely
information on sub-sector components is not
available, but the pronounced decline of investors'
confidence in financial markets (down 30 points inthe last quarter of 2008 on a year earlier) suggests
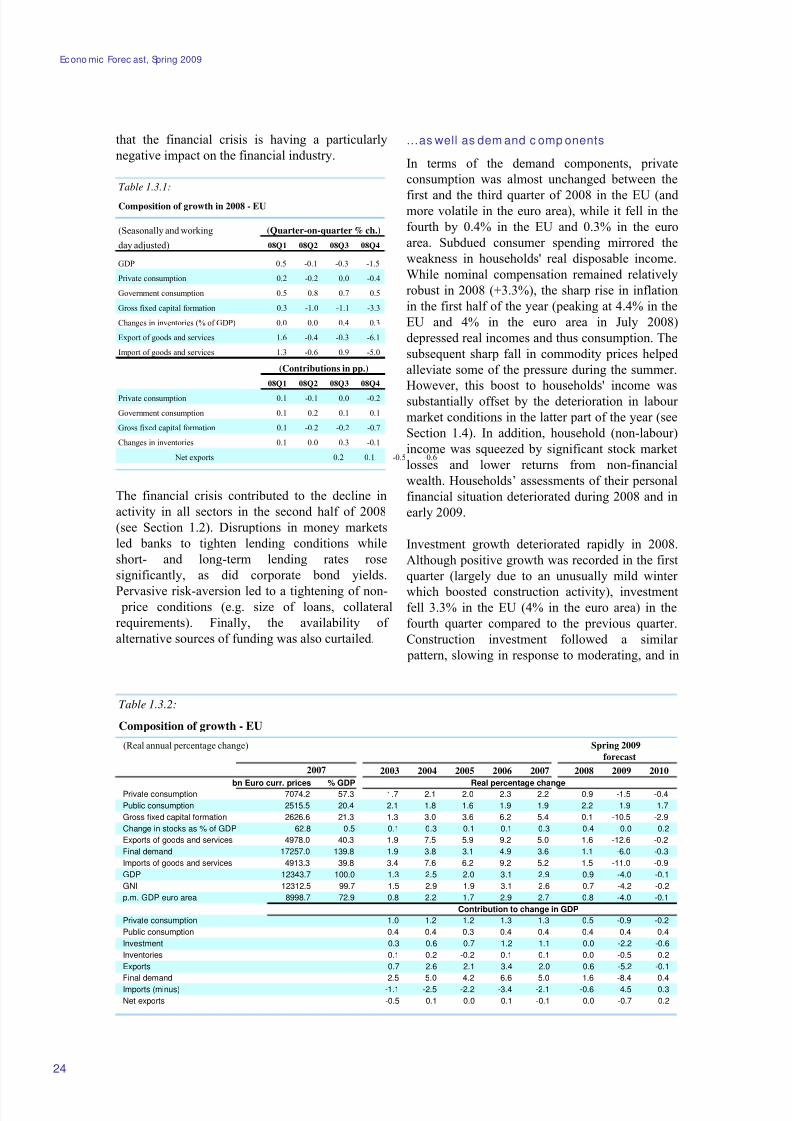
8/14/2019 Economic Forecast 2009
http://slidepdf.com/reader/full/economic-forecast-2009 30/172
Econo mic Forec ast, Spring 2009
Table 1.3.2:
Composition of growth - EU
(Real annual percentage change) Spring 2009
forecast
2007 2003 2004 2005 2006 2007 2008 2009 2010
bn Euro curr. prices % GDP Real percentage changePrivate consumption 7074.2 57.3 1.7 2.1 2.0 2.3 2.2 0.9 -1.5 -0.4
Public consumption 2515.5 20.4 2.1 1.8 1.6 1.9 1.9 2.2 1.9 1.7
Gross fixed capital formation 2626.6 21.3 1.3 3.0 3.6 6.2 5.4 0.1 -10.5 -2.9
Change in stocks as % of GDP 62.8 0.5 0.1 0.3 0.1 0.1 0.3 0.4 0.0 0.2
Exports of goods and services 4978.0 40.3 1.9 7.5 5.9 9.2 5.0 1.6 -12.6 -0.2
Final demand 17257.0 139.8 1.9 3.8 3.1 4.9 3.6 1.1 -6.0 -0.3
Imports of goods and services 4913.3 39.8 3.4 7.6 6.2 9.2 5.2 1.5 -11.0 -0.9
GDP 12343.7 100.0 1.3 2.5 2.0 3.1 2.9 0.9 -4.0 -0.1
GNI 12312.5 99.7 1.5 2.9 1.9 3.1 2.6 0.7 -4.2 -0.2
p.m. GDP euro area 8998.7 72.9 0.8 2.2 1.7 2.9 2.7 0.8 -4.0 -0.1
Contribution to change in GDP
Private consumption 1.0 1.2 1.2 1.3 1.3 0.5 -0.9 -0.2
Public consumption 0.4 0.4 0.3 0.4 0.4 0.4 0.4 0.4
Investment 0.3 0.6 0.7 1.2 1.1 0.0 -2.2 -0.6
Inventories 0.1 0.2 -0.2 0.1 0.1 0.0 -0.5 0.2
Exports 0.7 2.6 2.1 3.4 2.0 0.6 -5.2 -0.1
Final demand 2.5 5.0 4.2 6.6 5.0 1.6 -8.4 -0.4Imports (minus) -1.1 -2.5 -2.2 -3.4 -2.1 -0.6 4.5 0.3
Net exports -0.5 0.1 0.0 0.1 -0.1 0.0 -0.7 0.2
24
that the financial crisis is having a particularly
negative impact on the financial industry.
Table 1.3.1:
(Seasonally and working
day adjusted) 08Q1 08Q2 08Q3 08Q4
GDP 0.5 -0.1 -0.3 -1.5
Private consumption 0.2 -0.2 0.0 -0.4
Government consumption 0.5 0.8 0.7 0.5
Gross fixed capital formation 0.3 -1.0 -1.1 -3.3
Changes in inventories (% of GDP) 0.0 0.0 0.4 0.3
Export of goods and services 1.6 -0.4 -0.3 -6.1
Import of goods and services 1.3 -0.6 0.9 -5.0
08Q1 08Q2 08Q3 08Q4
Private consumption 0.1 -0.1 0.0 -0.2
Government consumption 0.1 0.2 0.1 0.1
Gross fixed capital formation 0.1 -0.2 -0.2 -0.7
Changes in inventories 0.1 0.0 0.3 -0.1
Net exports 0.2 0.1 -0.5 -0.6
Composition of growth in 2008 - EU
(Quarter-on-quarter % ch.)
(Contributions in pp.)
The financial crisis contributed to the decline in
activity in all sectors in the second half of 2008
(see Section 1.2). Disruptions in money markets
led banks to tighten lending conditions while
short- and long-term lending rates rose
significantly, as did corporate bond yields.
Pervasive risk-aversion led to a tightening of non- price conditions (e.g. size of loans, collateral
requirements). Finally, the availability of
alternative sources of funding was also curtailed.
…as well as dem and c omp onents
In terms of the demand components, private
consumption was almost unchanged between the
first and the third quarter of 2008 in the EU (andmore volatile in the euro area), while it fell in the
fourth by 0.4% in the EU and 0.3% in the euro
area. Subdued consumer spending mirrored the
weakness in households' real disposable income.
While nominal compensation remained relatively
robust in 2008 (+3.3%), the sharp rise in inflation
in the first half of the year (peaking at 4.4% in the
EU and 4% in the euro area in July 2008)
depressed real incomes and thus consumption. The
subsequent sharp fall in commodity prices helped
alleviate some of the pressure during the summer.
However, this boost to households' income was
substantially offset by the deterioration in labour
market conditions in the latter part of the year (see
Section 1.4). In addition, household (non-labour)
income was squeezed by significant stock market
losses and lower returns from non-financial
wealth. Households’ assessments of their personal
financial situation deteriorated during 2008 and in
early 2009.
Investment growth deteriorated rapidly in 2008.
Although positive growth was recorded in the first
quarter (largely due to an unusually mild winter
which boosted construction activity), investmentfell 3.3% in the EU (4% in the euro area) in the
fourth quarter compared to the previous quarter.
Construction investment followed a similar
pattern, slowing in response to moderating, and in
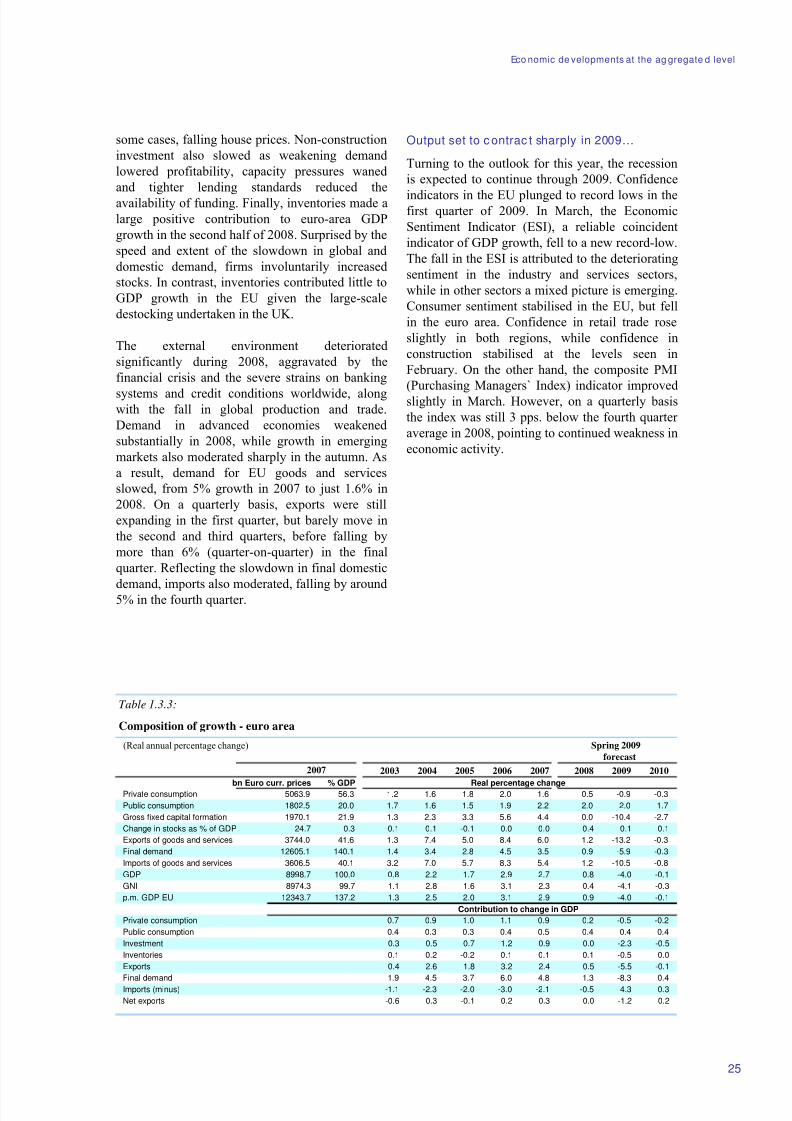
8/14/2019 Economic Forecast 2009
http://slidepdf.com/reader/full/economic-forecast-2009 31/172
Eco nomic de velopments at the ag gregate d level
Table 1.3.3:
Composition of growth - euro area
(Real annual percentage change) Spring 2009
forecast
2007 2003 2004 2005 2006 2007 2008 2009 2010
bn Euro curr. prices % GDP Real percentage changePrivate consumption 5063.9 56.3 1.2 1.6 1.8 2.0 1.6 0.5 -0.9 -0.3
Public consumption 1802.5 20.0 1.7 1.6 1.5 1.9 2.2 2.0 2.0 1.7
Gross fixed capital formation 1970.1 21.9 1.3 2.3 3.3 5.6 4.4 0.0 -10.4 -2.7
Change in stocks as % of GDP 24.7 0.3 -0.1 0.1 -0.1 0.0 0.0 0.4 0.1 0.1
Exports of goods and services 3744.0 41.6 1.3 7.4 5.0 8.4 6.0 1.2 -13.2 -0.3
Final demand 12605.1 140.1 1.4 3.4 2.8 4.5 3.5 0.9 -5.9 -0.3
Imports of goods and services 3606.5 40.1 3.2 7.0 5.7 8.3 5.4 1.2 -10.5 -0.8
GDP 8998.7 100.0 0.8 2.2 1.7 2.9 2.7 0.8 -4.0 -0.1
GNI 8974.3 99.7 1.1 2.8 1.6 3.1 2.3 0.4 -4.1 -0.3
p.m. GDP EU 12343.7 137.2 1.3 2.5 2.0 3.1 2.9 0.9 -4.0 -0.1
Contribution to change in GDP
Private consumption 0.7 0.9 1.0 1.1 0.9 0.2 -0.5 -0.2
Public consumption 0.4 0.3 0.3 0.4 0.5 0.4 0.4 0.4
Investment 0.3 0.5 0.7 1.2 0.9 0.0 -2.3 -0.5
Inventories 0.1 0.2 -0.2 0.1 0.1 0.1 -0.5 0.0
Exports 0.4 2.6 1.8 3.2 2.4 0.5 -5.5 -0.1
Final demand 1.9 4.5 3.7 6.0 4.8 1.3 -8.3 -0.4Imports (minus) -1.1 -2.3 -2.0 -3.0 -2.1 -0.5 4.3 0.3
Net exports -0.6 0.3 -0.1 0.2 0.3 0.0 -1.2 0.2
25
some cases, falling house prices. Non-construction
investment also slowed as weakening demand
lowered profitability, capacity pressures waned
and tighter lending standards reduced the
availability of funding. Finally, inventories made a
large positive contribution to euro-area GDP
growth in the second half of 2008. Surprised by the
speed and extent of the slowdown in global and
domestic demand, firms involuntarily increased
stocks. In contrast, inventories contributed little to
GDP growth in the EU given the large-scale
destocking undertaken in the UK.
The external environment deteriorated
significantly during 2008, aggravated by the
financial crisis and the severe strains on banking
systems and credit conditions worldwide, alongwith the fall in global production and trade.
Demand in advanced economies weakened
substantially in 2008, while growth in emerging
markets also moderated sharply in the autumn. As
a result, demand for EU goods and services
slowed, from 5% growth in 2007 to just 1.6% in
2008. On a quarterly basis, exports were still
expanding in the first quarter, but barely move in
the second and third quarters, before falling by
more than 6% (quarter-on-quarter) in the final
quarter. Reflecting the slowdown in final domestic
demand, imports also moderated, falling by around5% in the fourth quarter.
Output set to c ontrac t sharply in 2009…
Turning to the outlook for this year, the recession
is expected to continue through 2009. Confidence
indicators in the EU plunged to record lows in thefirst quarter of 2009. In March, the Economic
Sentiment Indicator (ESI), a reliable coincident
indicator of GDP growth, fell to a new record-low.
The fall in the ESI is attributed to the deteriorating
sentiment in the industry and services sectors,
while in other sectors a mixed picture is emerging.
Consumer sentiment stabilised in the EU, but fell
in the euro area. Confidence in retail trade rose
slightly in both regions, while confidence in
construction stabilised at the levels seen in
February. On the other hand, the composite PMI
(Purchasing Managers` Index) indicator improved
slightly in March. However, on a quarterly basis
the index was still 3 pps. below the fourth quarter
average in 2008, pointing to continued weakness in
economic activity.
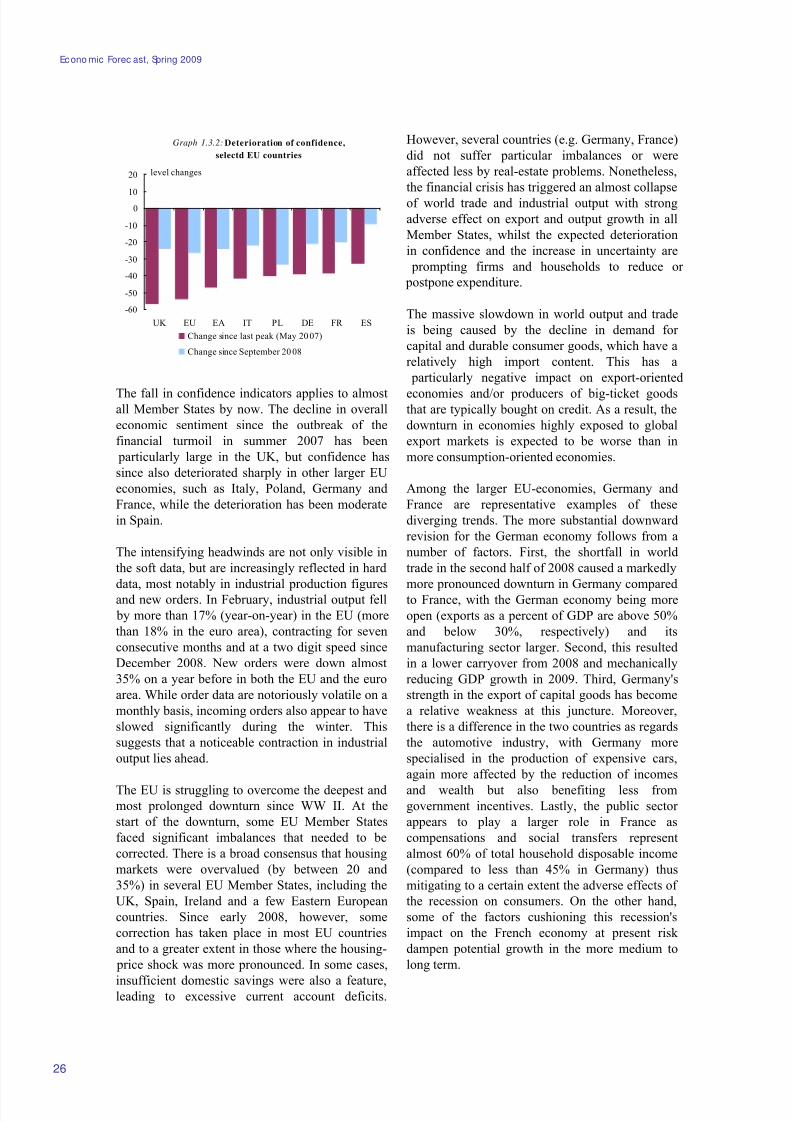
8/14/2019 Economic Forecast 2009
http://slidepdf.com/reader/full/economic-forecast-2009 32/172
Econo mic Forec ast, Spring 2009
26
Graph 1.3.2: Deterioration of confidence,
selectd EU countries
-60
-50
-40
-30
-20
-10
010
20
UK EU EA IT PL DE FR ES
Change since last peak (May 20 07)
Change since September 20 08
level changes
The fall in confidence indicators applies to almostall Member States by now. The decline in overall
economic sentiment since the outbreak of the
financial turmoil in summer 2007 has been
particularly large in the UK, but confidence has
since also deteriorated sharply in other larger EU
economies, such as Italy, Poland, Germany and
France, while the deterioration has been moderate
in Spain.
The intensifying headwinds are not only visible in
the soft data, but are increasingly reflected in hard
data, most notably in industrial production figuresand new orders. In February, industrial output fell
by more than 17% (year-on-year) in the EU (more
than 18% in the euro area), contracting for seven
consecutive months and at a two digit speed since
December 2008. New orders were down almost
35% on a year before in both the EU and the euro
area. While order data are notoriously volatile on a
monthly basis, incoming orders also appear to have
slowed significantly during the winter. This
suggests that a noticeable contraction in industrial
output lies ahead.
The EU is struggling to overcome the deepest andmost prolonged downturn since WW II. At the
start of the downturn, some EU Member States
faced significant imbalances that needed to be
corrected. There is a broad consensus that housing
markets were overvalued (by between 20 and
35%) in several EU Member States, including the
UK, Spain, Ireland and a few Eastern European
countries. Since early 2008, however, some
correction has taken place in most EU countries
and to a greater extent in those where the housing-
price shock was more pronounced. In some cases,
insufficient domestic savings were also a feature,leading to excessive current account deficits.
However, several countries (e.g. Germany, France)
did not suffer particular imbalances or were
affected less by real-estate problems. Nonetheless,
the financial crisis has triggered an almost collapse
of world trade and industrial output with strong
adverse effect on export and output growth in all
Member States, whilst the expected deterioration
in confidence and the increase in uncertainty are
prompting firms and households to reduce or
postpone expenditure.
The massive slowdown in world output and trade
is being caused by the decline in demand for
capital and durable consumer goods, which have a
relatively high import content. This has a
particularly negative impact on export-oriented
economies and/or producers of big-ticket goodsthat are typically bought on credit. As a result, the
downturn in economies highly exposed to global
export markets is expected to be worse than in
more consumption-oriented economies.
Among the larger EU-economies, Germany and
France are representative examples of these
diverging trends. The more substantial downward
revision for the German economy follows from a
number of factors. First, the shortfall in world
trade in the second half of 2008 caused a markedly
more pronounced downturn in Germany comparedto France, with the German economy being more
open (exports as a percent of GDP are above 50%
and below 30%, respectively) and its
manufacturing sector larger. Second, this resulted
in a lower carryover from 2008 and mechanically
reducing GDP growth in 2009. Third, Germany's
strength in the export of capital goods has become
a relative weakness at this juncture. Moreover,
there is a difference in the two countries as regards
the automotive industry, with Germany more
specialised in the production of expensive cars,
again more affected by the reduction of incomes
and wealth but also benefiting less fromgovernment incentives. Lastly, the public sector
appears to play a larger role in France as
compensations and social transfers represent
almost 60% of total household disposable income
(compared to less than 45% in Germany) thus
mitigating to a certain extent the adverse effects of
the recession on consumers. On the other hand,
some of the factors cushioning this recession's
impact on the French economy at present risk
dampen potential growth in the more medium to
long term.
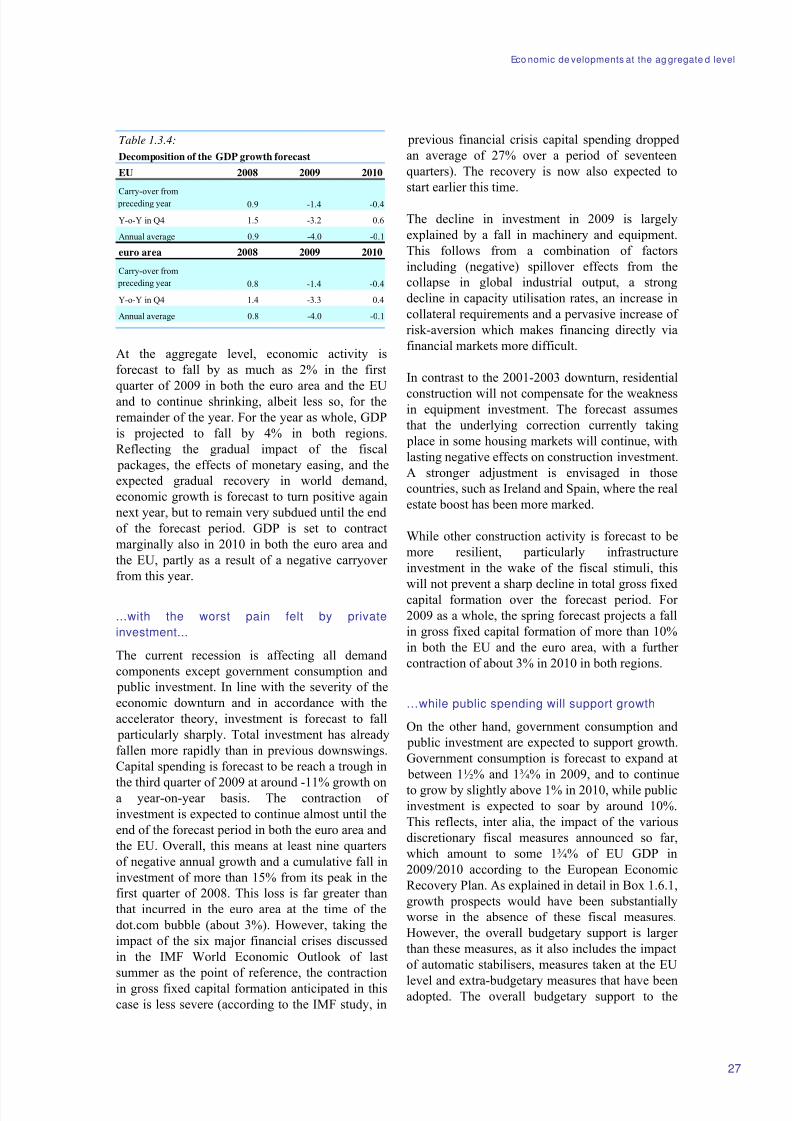
8/14/2019 Economic Forecast 2009
http://slidepdf.com/reader/full/economic-forecast-2009 33/172
Eco nomic de velopments at the ag gregate d level
27
Table 1.3.4:
EU 2008 2009 2010
Carry-over from
preceding year 0.9 -1.4 -0.4
Y-o-Y in Q4 1.5 -3.2 0.6
Annual average 0.9 -4.0 -0.1
euro area 2008 2009 2010
Carry-over from
preceding year 0.8 -1.4 -0.4
Y-o-Y in Q4 1.4 -3.3 0.4
Annual average 0.8 -4.0 -0.1
Decomposition of the GDP growth forecast
At the aggregate level, economic activity is
forecast to fall by as much as 2% in the first
quarter of 2009 in both the euro area and the EU
and to continue shrinking, albeit less so, for the
remainder of the year. For the year as whole, GDP
is projected to fall by 4% in both regions.
Reflecting the gradual impact of the fiscal
packages, the effects of monetary easing, and the
expected gradual recovery in world demand,
economic growth is forecast to turn positive again
next year, but to remain very subdued until the end
of the forecast period. GDP is set to contract
marginally also in 2010 in both the euro area and
the EU, partly as a result of a negative carryover
from this year.
...with the worst pain felt by private
investment...
The current recession is affecting all demand
components except government consumption and
public investment. In line with the severity of the
economic downturn and in accordance with the
accelerator theory, investment is forecast to fall
particularly sharply. Total investment has already
fallen more rapidly than in previous downswings.
Capital spending is forecast to be reach a trough in
the third quarter of 2009 at around -11% growth ona year-on-year basis. The contraction of
investment is expected to continue almost until the
end of the forecast period in both the euro area and
the EU. Overall, this means at least nine quarters
of negative annual growth and a cumulative fall in
investment of more than 15% from its peak in the
first quarter of 2008. This loss is far greater than
that incurred in the euro area at the time of the
dot.com bubble (about 3%). However, taking the
impact of the six major financial crises discussed
in the IMF World Economic Outlook of last
summer as the point of reference, the contraction
in gross fixed capital formation anticipated in this
case is less severe (according to the IMF study, in
previous financial crisis capital spending dropped
an average of 27% over a period of seventeen
quarters). The recovery is now also expected to
start earlier this time.
The decline in investment in 2009 is largely
explained by a fall in machinery and equipment.
This follows from a combination of factors
including (negative) spillover effects from the
collapse in global industrial output, a strong
decline in capacity utilisation rates, an increase in
collateral requirements and a pervasive increase of
risk-aversion which makes financing directly via
financial markets more difficult.
In contrast to the 2001-2003 downturn, residential
construction will not compensate for the weaknessin equipment investment. The forecast assumes
that the underlying correction currently taking
place in some housing markets will continue, with
lasting negative effects on construction investment.
A stronger adjustment is envisaged in those
countries, such as Ireland and Spain, where the real
estate boost has been more marked.
While other construction activity is forecast to be
more resilient, particularly infrastructure
investment in the wake of the fiscal stimuli, this
will not prevent a sharp decline in total gross fixedcapital formation over the forecast period. For
2009 as a whole, the spring forecast projects a fall
in gross fixed capital formation of more than 10%
in both the EU and the euro area, with a further
contraction of about 3% in 2010 in both regions.
…while public spending will support growth
On the other hand, government consumption and
public investment are expected to support growth.
Government consumption is forecast to expand at
between 1½% and 1¾% in 2009, and to continue
to grow by slightly above 1% in 2010, while publicinvestment is expected to soar by around 10%.
This reflects, inter alia, the impact of the various
discretionary fiscal measures announced so far,
which amount to some 1¾% of EU GDP in
2009/2010 according to the European Economic
Recovery Plan. As explained in detail in Box 1.6.1,
growth prospects would have been substantially
worse in the absence of these fiscal measures.
However, the overall budgetary support is larger
than these measures, as it also includes the impact
of automatic stabilisers, measures taken at the EU
level and extra-budgetary measures that have beenadopted. The overall budgetary support to the
8/14/2019 Economic Forecast 2009
http://slidepdf.com/reader/full/economic-forecast-2009 34/172
Econo mic Forec ast, Spring 2009
28
European economy is estimated at around 5% of
GDP spread over 2009 and 2010. As a result the
total impact on GDP growth is larger.
On a less positive note, both hard and soft data
indicate that the significant increase in stocks in
the euro area in the second half of 2008 was
involuntary, even when taking the double-digit
decline in industrial production into account. This
conclusion follows from the wide gap between
GDP growth and stock developments, a
comparison of the assessment of stocks with that
of demand prospects in survey data and a
comparison of trade data and changes in
inventories. As a result, it seems likely that stocks
will contribute negatively to euro-area GDP
growth in the first quarters of 2009, while thestock-adjustment process appears to be at a more
advanced stage in the EU.
Expo rts seve rely a ffec ted…
Recent survey indicators seem to be pointing to a
continuation of the global recession in the coming
quarters. Despite the pick-up in March, the Global
PMI index, now at 40.1, remains well below the
50-level threshold which separates expansion from
contraction. The PMI index for manufacturing
activity currently stands at an even lower level(37.2), event tough it has rebounded more than 3
points since the record-low of December 2008. In
addition, world trade remains subdued. Before the
marginal increase in February (+0.8% m-o-m),
world trade had recorded large declines for three
consecutive months, with a 7% contraction in
December, the largest since 1991. The current
level of world trade is about 15% lower than one
year ago with a carryover into 2009 of a similar
magnitude. Even if world trade were to resume its
long-term growth from March on, world trade in
2009 would remain about 12% below the 2008
figure.
The lagged effects of the appreciation of the euro
will also dampen euro-area exports going forward.
The euro exchange rate has been highly volatile
against the US dollar and the Japanese yen since
the beginning of 2009, while it has appreciated
against the pound sterling and the Swiss franc in
recent months. The recent appreciation of the euro
against the currencies of the area's main trading
partners has pushed the euro's nominal effective
exchange rate back to its end-2008 peaks. In real
terms (CPI deflated), the euro's effective exchangerate currently stands at around 8.5% above its
historical average, compared to slightly more than
2% in November 2008.
Given the near-collapse of world-trade, the
negative growth rate projected for global output
and the strength of the euro, euro-area exports are
forecast to suffer one of the worst setbacks on
record.
As exports are usually the first component to
recover in the euro-area business cycle, the export
outlook is key. The baseline scenario assumes that
the euro-area's main trading partners will exit
recession sometime in the second half of 2009. In
line with this view, exports are set to contract
strongly in the first half of 2009, before regaining
some momentum and turning positive at the beginning of 2010. A longer-than-currently-
expected recession in the euro-area’s export
markets would however delay the timing of the
recovery. For the year 2009 as a whole, exports are
set to slump by around 13% in both the EU and the
euro area. Given the very moderate recovery
envisaged in 2010 (as witnessed by a annual
growth rate just above 2% in the final quarter of
the year) and the substantial negative carryover
from 2009 (-1½%), exports would continue to
contract also next year (by around ¼ pp.).
Not surprisingly, the slowdown in global demand
and recession in the euro-area are expected to have
a strong adverse effect on the exports of non-euro
area Member States. Notwithstanding an estimated
10% depreciation of the real effective exchange
rate (REER) in 2009 in the EU (stemming from
two-digit corrections in the REER of key non-euro
area economies) as compared to a broadly stable
REER in the euro area, the EU is expected to
continue losing market shares, although to a lesser
degree than the euro area.
The decline in imports is also expected to bestrong, particularly in 2009 (-10%), with a more
moderate contraction persisting in 2010 (-1%). As
a consequence, net external demand is expected to
subtract ¾ pp. from GDP growth in the EU in 2009
and more than 1 pp. from euro area growth, while
the support of net foreign demand to growth
should turn mildly positive in 2010 (about ¼ pp. in
both regions). The current-account balance of the
euro area and the EU is forecast at around 1½% of
GDP in both 2009 and 2010. However, the strong
negative current-account position of some
individual Member States is not expected to widenany further, in most cases.
8/14/2019 Economic Forecast 2009
http://slidepdf.com/reader/full/economic-forecast-2009 35/172
Eco nomic de velopments at the ag gregate d level
29
…while consumption, though weak, should
withstand the recession be tter
The pattern of private consumption is largely
driven by employment and inflation trends. Thisyear, however, the quarterly profile for household
spending could see a temporary departure from
these standard driving forces, as a result of
government measures. In particular, a rebound in
durable goods consumption in the second and third
quarter is likely as households bring forward car
purchases in order to take advantage of
government incentives. However, a pay-back
could be expected in the second half of 2009, or
early 2010.
Barring these short-term developments, the
outlook for overall private consumption appears
more benign than for other demand components.
While contracting both this year and next,
household spending is expected to hold up
relatively well. The main reason for this is that the
impact of the large deterioration in the labour
market will be partly offset by a benign inflation
outlook (see Section 1.5). In quarter-on-quarter
terms, the largest job losses will probably be
recorded in mid-2009, but job shedding will extend
through to mid-2010 at least. Higher transfers to
the household sector following the implementation
of the European Economic Recovery Plan willoffer further support to the purchasing power of
households. Indeed, real disposable income - the
key driving force for private consumption in the
EU - is forecast to expand in 2009 (0.6%) and in
2010 (0.3%), although clearly more slowly than in
previous years.
With private consumption declining and real
disposable income increasing, the private
household saving rate is expected to rise by
2½ pps. between 2008 and 2010. This follows
from an increase in precautionary saving andreflects the countercyclical behaviour seen in
earlier business cycles. As a result, the downward
trend in the savings rate, which has been visible in
most Member States since the mid-1990s, is
expected to come to an end.
First glim me rs of hope ?
Detecting the timing of a possible economic
recovery is never easy. It is all the more difficult at
the current juncture given that the cyclical upturn
depends crucially on the stabilisation of financial
markets and institutions and on repairing the credit
channel.
While almost all leading indicators and hard data
on actual economic performance paint a bleak
picture, a few glimmers of hope are visible. Firstly,
nominal short-term interest rates have come down
sharply, reflecting lower policy rates and more
aggressive injections of liquidity into money
markets. Apart from reducing bank's funding costs,
the decline in interest rates has beneficial effects
for mortgage payments, particularly in those
countries where mortgages are directly linked to
Euribor rates. This could help smoothen the
downturn in residential construction, as well as
slowing down the correction in house prices. It
may also have beneficial effects on income and
spending of households, especially if they are net
borrowers. Secondly, in the last few months, real
narrow money supply (so-called M1) hasrecovered, helped by a rebound in nominal money
supply and a decline in headline inflation. Unlike
business confidence, real money supply leads GDP
growth by about three quarters. If confirmed, this
turnaround offers support for a gradual
stabilisation of the EU economy in the second half
of 2009. Third, EU credit markets have shown
some improvement since the beginning of 2009
and, more importantly, companies are finding it
easier to raise capital on debt markets than they did
just a few weeks ago. Lastly, the expectation
component of several widely observed businesscycle indicators (EU manufacturing and services
survey, the services and composite PMI, the
German IFO and ZEW) has either rebounded or, at
least, stopped deteriorating recently. This suggests
that a growing number of firms expect
improvements in the economic situation over the
next six months.
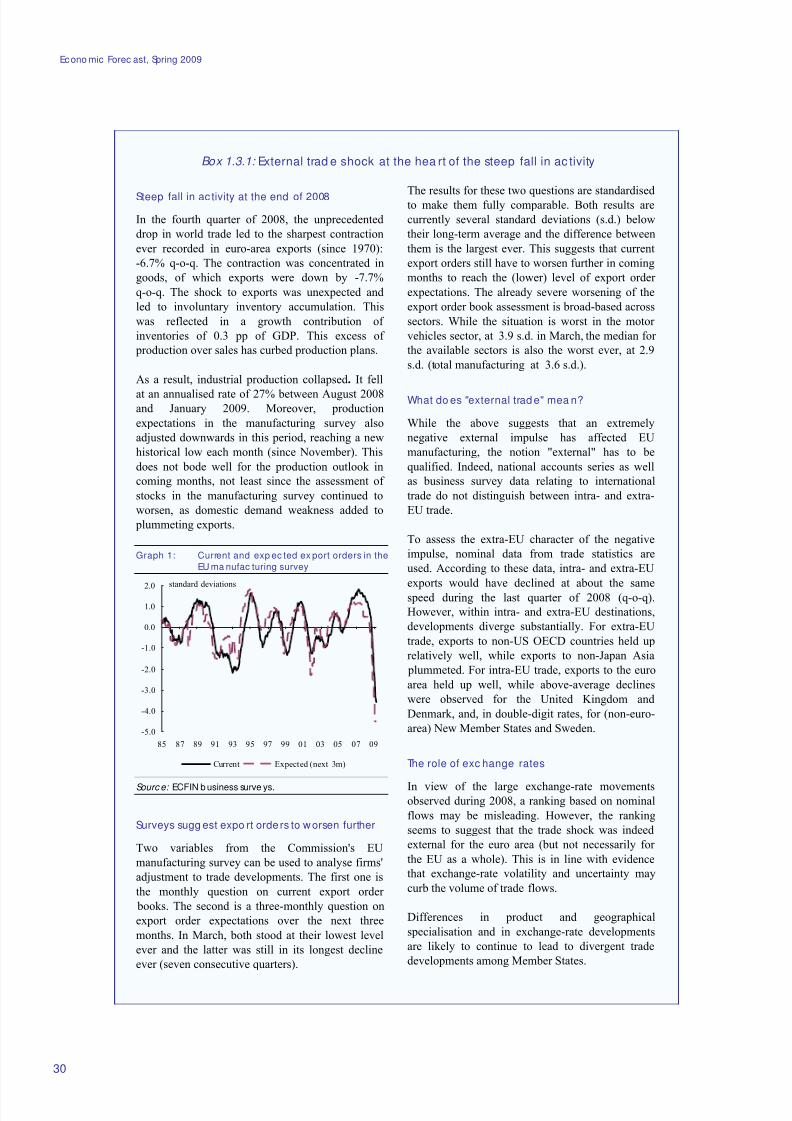
8/14/2019 Economic Forecast 2009
http://slidepdf.com/reader/full/economic-forecast-2009 36/172
Econo mic Forec ast, Spring 2009
30
Box 1.3.1: External trad e shock at the hea rt of the steep fall in ac tivity
Steep fall in ac tivity at the end of 2008
In the fourth quarter of 2008, the unprecedented
drop in world trade led to the sharpest contraction
ever recorded in euro-area exports (since 1970):
-6.7% q-o-q. The contraction was concentrated in
goods, of which exports were down by -7.7%
q-o-q. The shock to exports was unexpected and
led to involuntary inventory accumulation. This
was reflected in a growth contribution of
inventories of 0.3 pp of GDP. This excess of
production over sales has curbed production plans.
As a result, industrial production collapsed. It fell
at an annualised rate of 27% between August 2008and January 2009. Moreover, production
expectations in the manufacturing survey also
adjusted downwards in this period, reaching a new
historical low each month (since November). This
does not bode well for the production outlook in
coming months, not least since the assessment of
stocks in the manufacturing survey continued to
worsen, as domestic demand weakness added to
plummeting exports.
Graph 1: Current and exp ec ted ex port orders in the
EU ma nufac turing survey
-5.0
-4.0
-3.0
-2.0
-1.0
0.0
1.0
2.0
85 87 89 91 93 95 97 99 01 03 05 07 09
Current Expected (next 3m)
standard deviations
Sourc e: ECFIN b usiness surve ys.
Surveys sugg est expo rt orde rs to worsen further
Two variables from the Commission's EU
manufacturing survey can be used to analyse firms'
adjustment to trade developments. The first one is
the monthly question on current export order
books. The second is a three-monthly question on
export order expectations over the next three
months. In March, both stood at their lowest level
ever and the latter was still in its longest decline
ever (seven consecutive quarters).
The results for these two questions are standardisedto make them fully comparable. Both results are
currently several standard deviations (s.d.) below
their long-term average and the difference between
them is the largest ever. This suggests that current
export orders still have to worsen further in coming
months to reach the (lower) level of export order
expectations. The already severe worsening of the
export order book assessment is broad-based across
sectors. While the situation is worst in the motor
vehicles sector, at 3.9 s.d. in March, the median for
the available sectors is also the worst ever, at 2.9
s.d. (total manufacturing at 3.6 s.d.).
What do es "external trad e" mea n?
While the above suggests that an extremely
negative external impulse has affected EU
manufacturing, the notion "external" has to be
qualified. Indeed, national accounts series as well
as business survey data relating to international
trade do not distinguish between intra- and extra-
EU trade.
To assess the extra-EU character of the negative
impulse, nominal data from trade statistics are
used. According to these data, intra- and extra-EU
exports would have declined at about the same
speed during the last quarter of 2008 (q-o-q).
However, within intra- and extra-EU destinations,
developments diverge substantially. For extra-EU
trade, exports to non-US OECD countries held up
relatively well, while exports to non-Japan Asia
plummeted. For intra-EU trade, exports to the euro
area held up well, while above-average declines
were observed for the United Kingdom and
Denmark, and, in double-digit rates, for (non-euro-
area) New Member States and Sweden.
The role of exc hange rates
In view of the large exchange-rate movementsobserved during 2008, a ranking based on nominal
flows may be misleading. However, the ranking
seems to suggest that the trade shock was indeed
external for the euro area (but not necessarily for
the EU as a whole). This is in line with evidence
that exchange-rate volatility and uncertainty may
curb the volume of trade flows.
Differences in product and geographical
specialisation and in exchange-rate developments
are likely to continue to lead to divergent trade
developments among Member States.
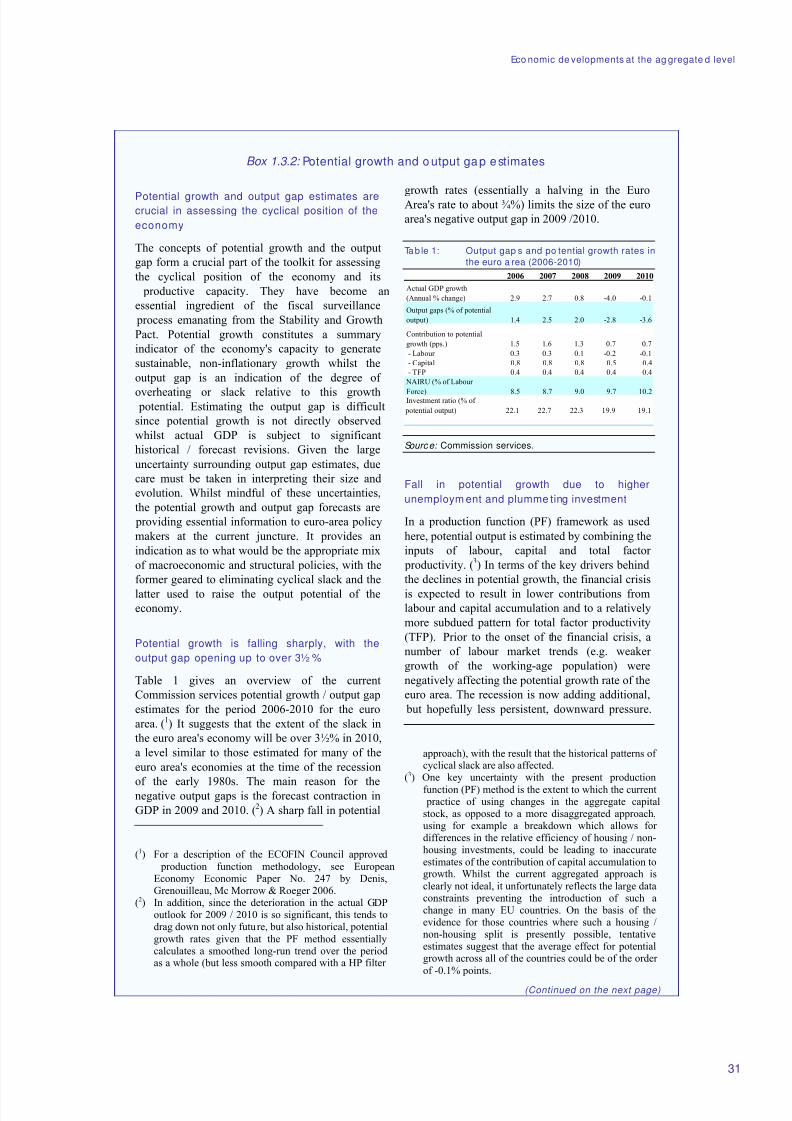
8/14/2019 Economic Forecast 2009
http://slidepdf.com/reader/full/economic-forecast-2009 37/172
Eco nomic de velopments at the ag gregate d level
31
Box 1.3.2: Potential growth and o utput gap estimates
Potential growth and output gap estimates arecrucial in assessing the cyclical position of the
economy
The concepts of potential growth and the output
gap form a crucial part of the toolkit for assessing
the cyclical position of the economy and its
productive capacity. They have become an
essential ingredient of the fiscal surveillance
process emanating from the Stability and Growth
Pact. Potential growth constitutes a summary
indicator of the economy's capacity to generate
sustainable, non-inflationary growth whilst the
output gap is an indication of the degree of
overheating or slack relative to this growth potential. Estimating the output gap is difficult
since potential growth is not directly observed
whilst actual GDP is subject to significant
historical / forecast revisions. Given the large
uncertainty surrounding output gap estimates, due
care must be taken in interpreting their size and
evolution. Whilst mindful of these uncertainties,
the potential growth and output gap forecasts are
providing essential information to euro-area policy
makers at the current juncture. It provides an
indication as to what would be the appropriate mix
of macroeconomic and structural policies, with the
former geared to eliminating cyclical slack and the
latter used to raise the output potential of the
economy.
Potential growth is falling sharply, with the
output gap opening up to over 3½ %
Table 1 gives an overview of the current
Commission services potential growth / output gap
estimates for the period 2006-2010 for the euro
area. (1) It suggests that the extent of the slack in
the euro area's economy will be over 3½% in 2010,
a level similar to those estimated for many of the
euro area's economies at the time of the recession
of the early 1980s. The main reason for thenegative output gaps is the forecast contraction in
GDP in 2009 and 2010. (2) A sharp fall in potential
(1) For a description of the ECOFIN Council approved production function methodology, see EuropeanEconomy Economic Paper No. 247 by Denis,Grenouilleau, Mc Morrow & Roeger 2006.
(2) In addition, since the deterioration in the actual GDPoutlook for 2009 / 2010 is so significant, this tends todrag down not only future, but also historical, potentialgrowth rates given that the PF method essentiallycalculates a smoothed long-run trend over the periodas a whole (but less smooth compared with a HP filter
growth rates (essentially a halving in the EuroArea's rate to about ¾%) limits the size of the euro
area's negative output gap in 2009 /2010.
Tab le 1: Output gap s and po tential growth rates in
the euro a rea (2006-2010)
2006 2007 2008 2009 2010
Actual GDP growth
(Annual % change) 2.9 2.7 0.8 -4.0 -0.1
Output gaps (% of potential
output) 1.4 2.5 2.0 -2.8 -3.6
Contribution to potential
growth (pps.) 1.5 1.6 1.3 0.7 0.7
- Labour 0.3 0.3 0.1 -0.2 -0.1
- Capital 0.8 0.8 0.8 0.5 0.4
- TFP 0.4 0.4 0.4 0.4 0.4
NAIRU (% of Labour
Force) 8.5 8.7 9.0 9.7 10.2Investment ratio (% of
potential output) 22.1 22.7 22.3 19.9 19.1
Source: Commission services.
Fall in potential growth due to higher
unemploym ent and plumme ting investment
In a production function (PF) framework as used
here, potential output is estimated by combining the
inputs of labour, capital and total factor
productivity. (3) In terms of the key drivers behind
the declines in potential growth, the financial crisis
is expected to result in lower contributions from
labour and capital accumulation and to a relatively
more subdued pattern for total factor productivity
(TFP). Prior to the onset of the financial crisis, a
number of labour market trends (e.g. weaker
growth of the working-age population) were
negatively affecting the potential growth rate of the
euro area. The recession is now adding additional,
but hopefully less persistent, downward pressure.
approach), with the result that the historical patterns of cyclical slack are also affected.
(3) One key uncertainty with the present production
function (PF) method is the extent to which the current practice of using changes in the aggregate capitalstock, as opposed to a more disaggregated approach,using for example a breakdown which allows for differences in the relative efficiency of housing / non-housing investments, could be leading to inaccurateestimates of the contribution of capital accumulation togrowth. Whilst the current aggregated approach isclearly not ideal, it unfortunately reflects the large dataconstraints preventing the introduction of such achange in many EU countries. On the basis of theevidence for those countries where such a housing /non-housing split is presently possible, tentativeestimates suggest that the average effect for potentialgrowth across all of the countries could be of the order of -0.1% points.
(Continued on the next page)
8/14/2019 Economic Forecast 2009
http://slidepdf.com/reader/full/economic-forecast-2009 38/172
Econo mic Forec ast, Spring 2009
32
Box (continued)
The forecast suggests a significant upward
movement in structural unemployment rates,
measured by the non-accelerating inflation rate of
unemployment (NAIRU). Every percentage point
(pp.) increase in the NAIRU reduces potential
growth rates by approximately 0.6 pp.
In addition, investment trends will deteriorate due
to the financial upheaval. Whilst the impact on
potential may not be as dramatic as with the
NAIRU, falls of 2 to 3 pps. in investment to GDP
ratios would cut an additional 0.2 / 0.3 pp. off
underlying growth rates in the affected countries.
Finally, compared with previous forecasting
exercises, the estimated contribution from trend
TFP to potential growth is revised downwards byaround 0.1 pp. per annum. These TFP estimates
may still be conservative as they may not fully take
into account any expected "one-off" downward
shifts in the level of TFP and potential output
associated with industrial restructuring. Some
industries such as, for example, financial services
and motor vehicles, are likely to experience
permanent reductions in the level of their activities
as a result of the crisis.
New results in line with emp irical evidenc e
In addition to the PF results, there is considerable
empirical evidence to support the view that
financial crises tend to be associated with
prolonged / permanent reductions in the level of
output. For example Serra and Saxena et al. and
Haugh et al. (1) report results which show declines
in potential growth rates associated with a large
number of historical banking / financial crises. In
this respect, the early 1990's experiences of
countries such as Japan, Finland and Sweden, in the
aftermath of their own respective crises, suggests
that the present financial shock is likely to result in
marked declines in potential growth rates, driven
by persistent increases in unemployment and
declines in investment rates. (2)
(1) Cerra, V. and S.C. Saxena (2008), Growth dynamics:the myth of economic recovery; in: AmericanEconomic Review, Vol. 98, No. 1. Haugh, D.,Ollivaud, P. and D. Turner (2009), Themacroeconomic consequences of banking crises inOECD countries; OECD Working Paper No. 683. Seealso C.M. Reinhart and K.S. Rogoff (2009), Theaftermath of financial crisis; NBER Working Paper No. 14656.
(2) For example, the particularly weak pattern of investment in Japan in the years following its financial
crisis in the early 1990's ensured that the replacement
The downward pressure on investment will result
firstly from increases in risk premia on loans to
firms and households; secondly, from the more
cautious lending behaviour of banks; and thirdly,
from a correction to more "normal" investment
levels following the over-investment pattern of the
"boom" period (generated, on this occasion, by
bubbles in both the financial and housing markets).
With respect to the negative contribution to
potential growth from higher NAIRUs, simulations
with the Quest model (3) point to nominal frictions
in both labour and goods markets as being key
factors. The simulations also suggest that the
failure of many labour markets to provoke a
sufficient degree of nominal wage adjustment,
following a crisis, has significant negative knock-on effects in terms of rising levels of structural
unemployment / falling employment rates.
of old capital equipment with newer vintages progressed at a historically slow pace, leading tohigher capital obsolescence rates and weaker potentialgrowth.
(3) Ratto, M., W. Roeger and J. in't Veld (2008). QUESTIII - An estimated DSGE model of the Euro Area withfiscal and monetary policy, European EconomyEconomic Paper No. 335.
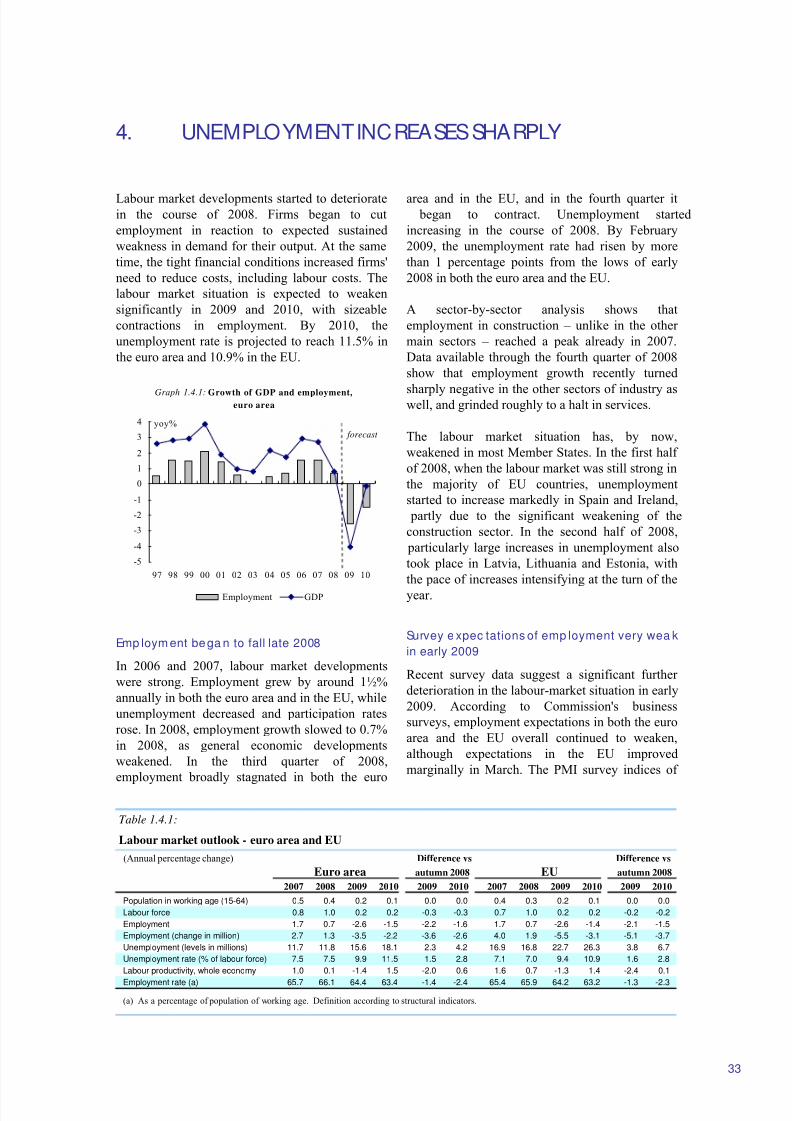
8/14/2019 Economic Forecast 2009
http://slidepdf.com/reader/full/economic-forecast-2009 39/172
4. UNEMPLOYMENT INCREASES SHARPLY
Table 1.4.1:
Labour market outlook - euro area and EU
(Annual percentage change) Difference vs Difference vs
Euro area autumn 2008 EU autumn 2008
2007 2008 2009 2010 2009 2010 2007 2008 2009 2010 2009 2010
Population in working age (15-64) 0.5 0.4 0.2 0.1 0.0 0.0 0.4 0.3 0.2 0.1 0.0 0.0
Labour force 0.8 1.0 0.2 0.2 -0.3 -0.3 0.7 1.0 0.2 0.2 -0.2 -0.2
Employment 1.7 0.7 -2.6 -1.5 -2.2 -1.6 1.7 0.7 -2.6 -1.4 -2.1 -1.5
Employment (change in million) 2.7 1.3 -3.5 -2.2 -3.6 -2.6 4.0 1.9 -5.5 -3.1 -5.1 -3.7
Unemployment (levels in millions) 11.7 11.8 15.6 18.1 2.3 4.2 16.9 16.8 22.7 26.3 3.8 6.7
Unemployment rate (% of labour force) 7.5 7.5 9.9 11.5 1.5 2.8 7.1 7.0 9.4 10.9 1.6 2.8
Labour productivity, whole economy 1.0 0.1 -1.4 1.5 -2.0 0.6 1.6 0.7 -1.3 1.4 -2.4 0.1
Employment rate (a) 65.7 66.1 64.4 63.4 -1.4 -2.4 65.4 65.9 64.2 63.2 -1.3 -2.3
(a) As a percentage of population of working age. Definition according to structural indicators.
33
Labour market developments started to deterioratein the course of 2008. Firms began to cut
employment in reaction to expected sustained
weakness in demand for their output. At the same
time, the tight financial conditions increased firms'
need to reduce costs, including labour costs. The
labour market situation is expected to weaken
significantly in 2009 and 2010, with sizeable
contractions in employment. By 2010, the
unemployment rate is projected to reach 11.5% in
the euro area and 10.9% in the EU.
Graph 1.4.1: Growth of GDP and employment,euro area
-5
-4
-3
-2
-1
0
1
2
3
4
97 98 99 00 01 02 03 04 05 06 07 08 09 10
Employment GDP
forecast
yoy%
Emp loym ent bega n to fall late 2008
In 2006 and 2007, labour market developments
were strong. Employment grew by around 1½%
annually in both the euro area and in the EU, while
unemployment decreased and participation rates
rose. In 2008, employment growth slowed to 0.7%
in 2008, as general economic developments
weakened. In the third quarter of 2008,
employment broadly stagnated in both the euro
area and in the EU, and in the fourth quarter it began to contract. Unemployment started
increasing in the course of 2008. By February
2009, the unemployment rate had risen by more
than 1 percentage points from the lows of early
2008 in both the euro area and the EU.
A sector-by-sector analysis shows that
employment in construction – unlike in the other
main sectors – reached a peak already in 2007.
Data available through the fourth quarter of 2008
show that employment growth recently turned
sharply negative in the other sectors of industry aswell, and grinded roughly to a halt in services.
The labour market situation has, by now,
weakened in most Member States. In the first half
of 2008, when the labour market was still strong in
the majority of EU countries, unemployment
started to increase markedly in Spain and Ireland,
partly due to the significant weakening of the
construction sector. In the second half of 2008,
particularly large increases in unemployment also
took place in Latvia, Lithuania and Estonia, with
the pace of increases intensifying at the turn of the
year.
Survey e xpec tations of emp loyment very wea k
in early 2009
Recent survey data suggest a significant further
deterioration in the labour-market situation in early
2009. According to Commission's business
surveys, employment expectations in both the euro
area and the EU overall continued to weaken,
although expectations in the EU improved
marginally in March. The PMI survey indices of
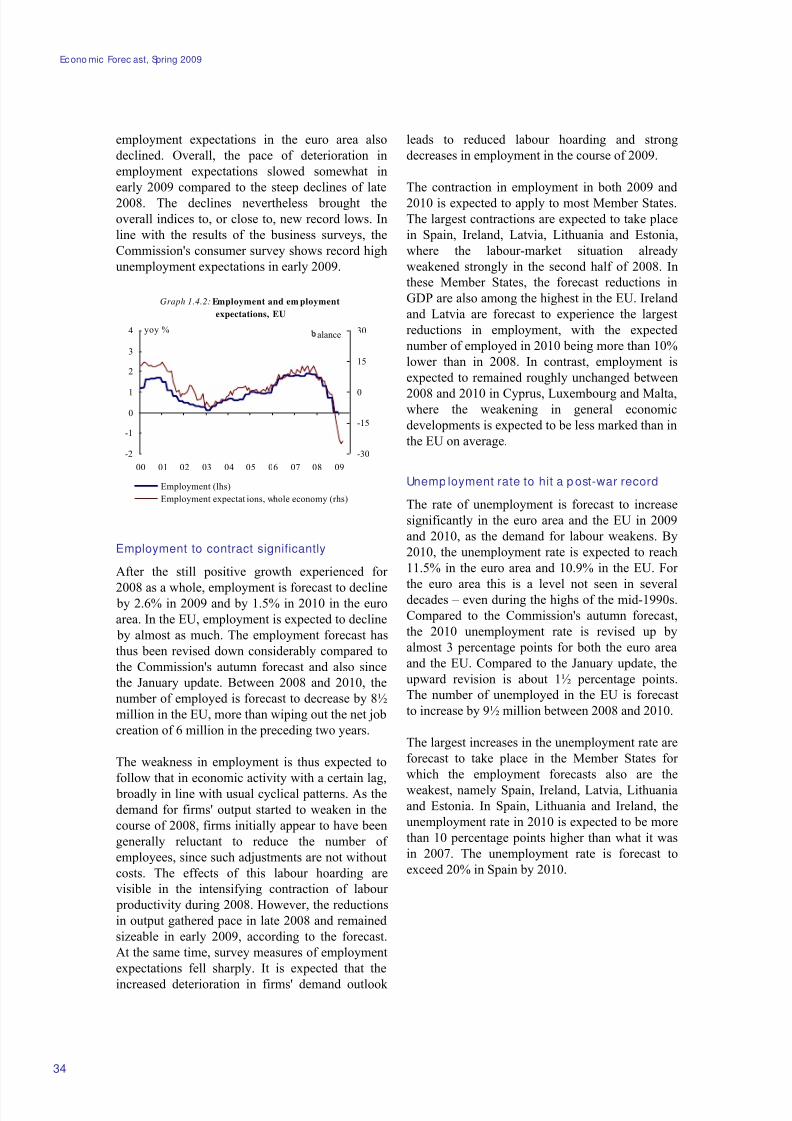
8/14/2019 Economic Forecast 2009
http://slidepdf.com/reader/full/economic-forecast-2009 40/172
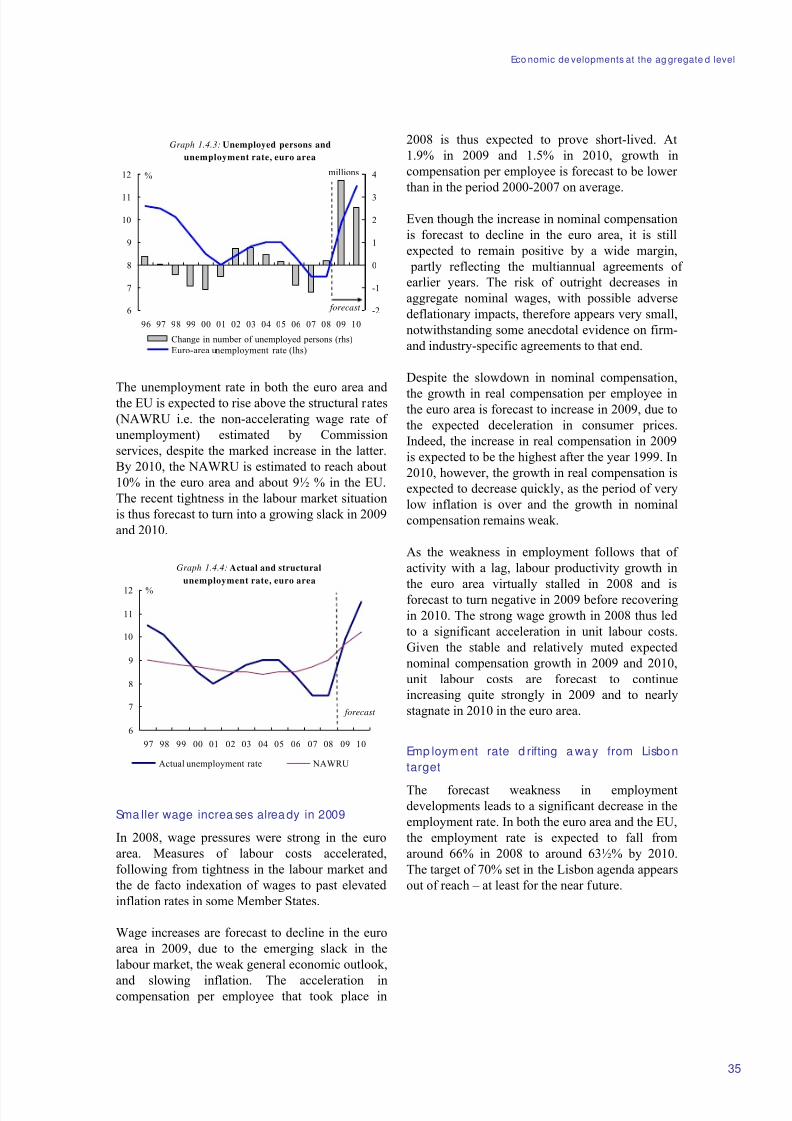
8/14/2019 Economic Forecast 2009
http://slidepdf.com/reader/full/economic-forecast-2009 41/172
Eco nomic de velopments at the ag gregate d level
35
Graph 1.4.3: Unemployed persons and
unemployment rate, euro area
6
7
8
9
10
11
12
96 97 98 99 00 01 02 03 04 05 06 07 08 09 10
-2
-1
0
1
2
3
4
Change in number of unemployed persons (rhs)
Euro-area unemployment rate (lhs)
%
forecast
millions
The unemployment rate in both the euro area andthe EU is expected to rise above the structural rates
(NAWRU i.e. the non-accelerating wage rate of
unemployment) estimated by Commission
services, despite the marked increase in the latter.
By 2010, the NAWRU is estimated to reach about
10% in the euro area and about 9½ % in the EU.
The recent tightness in the labour market situation
is thus forecast to turn into a growing slack in 2009
and 2010.
Graph 1.4.4: Actual and structural
unemployment rate, euro area
6
7
8
9
10
11
12
97 98 99 00 01 02 03 04 05 06 07 08 09 10
Actual unemployment rate NAWRU
%
forecast
Sma ller wage increa ses already in 2009
In 2008, wage pressures were strong in the euro
area. Measures of labour costs accelerated,
following from tightness in the labour market and
the de facto indexation of wages to past elevated
inflation rates in some Member States.
Wage increases are forecast to decline in the euro
area in 2009, due to the emerging slack in the
labour market, the weak general economic outlook,
and slowing inflation. The acceleration incompensation per employee that took place in
2008 is thus expected to prove short-lived. At
1.9% in 2009 and 1.5% in 2010, growth in
compensation per employee is forecast to be lower
than in the period 2000-2007 on average.
Even though the increase in nominal compensation
is forecast to decline in the euro area, it is still
expected to remain positive by a wide margin,
partly reflecting the multiannual agreements of
earlier years. The risk of outright decreases in
aggregate nominal wages, with possible adverse
deflationary impacts, therefore appears very small,
notwithstanding some anecdotal evidence on firm-
and industry-specific agreements to that end.
Despite the slowdown in nominal compensation,
the growth in real compensation per employee inthe euro area is forecast to increase in 2009, due to
the expected deceleration in consumer prices.
Indeed, the increase in real compensation in 2009
is expected to be the highest after the year 1999. In
2010, however, the growth in real compensation is
expected to decrease quickly, as the period of very
low inflation is over and the growth in nominal
compensation remains weak.
As the weakness in employment follows that of
activity with a lag, labour productivity growth in
the euro area virtually stalled in 2008 and isforecast to turn negative in 2009 before recovering
in 2010. The strong wage growth in 2008 thus led
to a significant acceleration in unit labour costs.
Given the stable and relatively muted expected
nominal compensation growth in 2009 and 2010,
unit labour costs are forecast to continue
increasing quite strongly in 2009 and to nearly
stagnate in 2010 in the euro area.
Emp loym ent rate d rifting a way from Lisbon
target
The forecast weakness in employmentdevelopments leads to a significant decrease in the
employment rate. In both the euro area and the EU,
the employment rate is expected to fall from
around 66% in 2008 to around 63½% by 2010.
The target of 70% set in the Lisbon agenda appears
out of reach – at least for the near future.
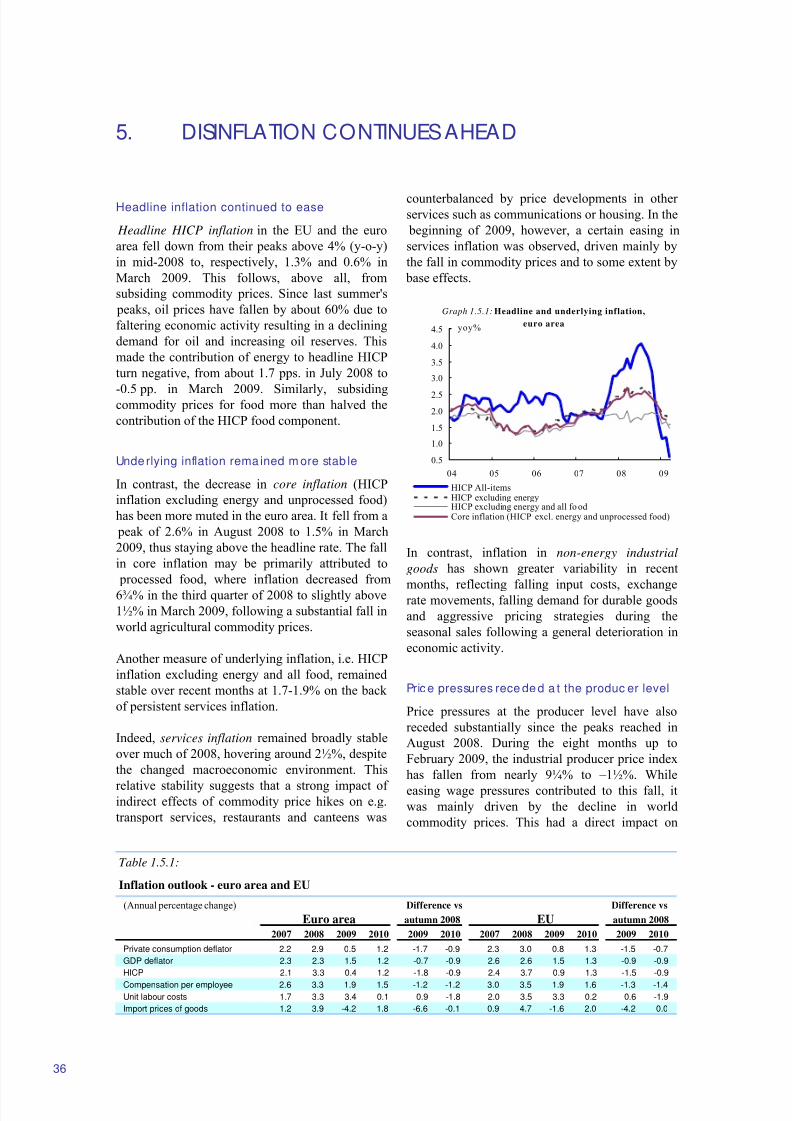
8/14/2019 Economic Forecast 2009
http://slidepdf.com/reader/full/economic-forecast-2009 42/172
5. DISINFLATION CONTINUES AHEAD
Table 1.5.1:
Inflation outlook - euro area and EU
(Annual percentage change) Difference vs Difference vs
Euro area autumn 2008 EU autumn 2008
2007 2008 2009 2010 2009 2010 2007 2008 2009 2010 2009 2010
Private consumption deflator 2.2 2.9 0.5 1.2 -1.7 -0.9 2.3 3.0 0.8 1.3 -1.5 -0.7
GDP deflator 2.3 2.3 1.5 1.2 -0.7 -0.9 2.6 2.6 1.5 1.3 -0.9 -0.9
HICP 2.1 3.3 0.4 1.2 -1.8 -0.9 2.4 3.7 0.9 1.3 -1.5 -0.9
Compensation per employee 2.6 3.3 1.9 1.5 -1.2 -1.2 3.0 3.5 1.9 1.6 -1.3 -1.4
Unit labour costs 1.7 3.3 3.4 0.1 0.9 -1.8 2.0 3.5 3.3 0.2 0.6 -1.9
Import prices of goods 1.2 3.9 -4.2 1.8 -6.6 -0.1 0.9 4.7 -1.6 2.0 -4.2 0.0
36
Headline inflation continued to ease
Headline HICP inflation in the EU and the euro
area fell down from their peaks above 4% (y-o-y)
in mid-2008 to, respectively, 1.3% and 0.6% in
March 2009. This follows, above all, from
subsiding commodity prices. Since last summer's
peaks, oil prices have fallen by about 60% due to
faltering economic activity resulting in a declining
demand for oil and increasing oil reserves. This
made the contribution of energy to headline HICP
turn negative, from about 1.7 pps. in July 2008 to
-0.5 pp. in March 2009. Similarly, subsidingcommodity prices for food more than halved the
contribution of the HICP food component.
Underlying inflation rema ined m ore stab le
In contrast, the decrease in core inflation (HICP
inflation excluding energy and unprocessed food)
has been more muted in the euro area. It fell from a
peak of 2.6% in August 2008 to 1.5% in March
2009, thus staying above the headline rate. The fall
in core inflation may be primarily attributed to
processed food, where inflation decreased from
6¾% in the third quarter of 2008 to slightly above
1½% in March 2009, following a substantial fall in
world agricultural commodity prices.
Another measure of underlying inflation, i.e. HICP
inflation excluding energy and all food, remained
stable over recent months at 1.7-1.9% on the back
of persistent services inflation.
Indeed, services inflation remained broadly stable
over much of 2008, hovering around 2½%, despite
the changed macroeconomic environment. This
relative stability suggests that a strong impact of indirect effects of commodity price hikes on e.g.
transport services, restaurants and canteens was
counterbalanced by price developments in other services such as communications or housing. In the
beginning of 2009, however, a certain easing in
services inflation was observed, driven mainly by
the fall in commodity prices and to some extent by
base effects.
0.5
1.0
1.5
2.0
2.5
3.0
3.5
4.0
4.5
04 05 06 07 08 09
yoy%
HICP All-itemsHICP excluding energyHICP excluding energy and all fo odCore inflation (HICP excl. energy and unprocessed food)
Graph 1.5.1: Headline and underlying inflation,
euro area
In contrast, inflation in non-energy industrial
goods has shown greater variability in recent
months, reflecting falling input costs, exchangerate movements, falling demand for durable goods
and aggressive pricing strategies during the
seasonal sales following a general deterioration in
economic activity.
Pric e pressures rece de d a t the produc er level
Price pressures at the producer level have also
receded substantially since the peaks reached in
August 2008. During the eight months up to
February 2009, the industrial producer price index
has fallen from nearly 9¼% to –1½%. While
easing wage pressures contributed to this fall, itwas mainly driven by the decline in world
commodity prices. This had a direct impact on
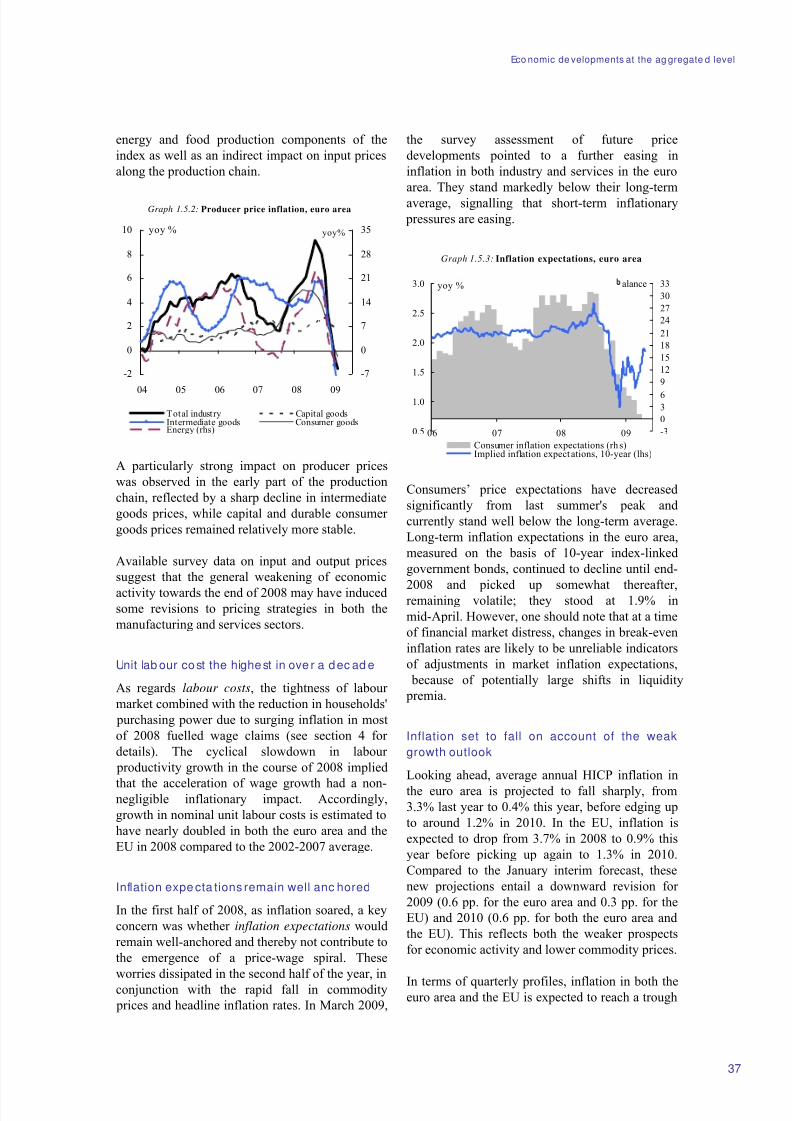
8/14/2019 Economic Forecast 2009
http://slidepdf.com/reader/full/economic-forecast-2009 43/172
Eco nomic de velopments at the ag gregate d level
37
energy and food production components of the
index as well as an indirect impact on input prices
along the production chain.
Graph 1.5.2: Producer price inflation, euro area
-2
0
2
4
6
8
10
04 05 06 07 08 09
yoy %
-7
0
7
14
21
28
35yoy%
Total industry Capital goodsIntermediate goods Consumer goodsEnergy (rhs)
A particularly strong impact on producer prices
was observed in the early part of the production
chain, reflected by a sharp decline in intermediate
goods prices, while capital and durable consumer
goods prices remained relatively more stable.
Available survey data on input and output prices
suggest that the general weakening of economic
activity towards the end of 2008 may have inducedsome revisions to pricing strategies in both the
manufacturing and services sectors.
Unit lab our cost the highest in ove r a dec ad e
As regards labour costs, the tightness of labour
market combined with the reduction in households'
purchasing power due to surging inflation in most
of 2008 fuelled wage claims (see section 4 for
details). The cyclical slowdown in labour
productivity growth in the course of 2008 implied
that the acceleration of wage growth had a non-negligible inflationary impact. Accordingly,
growth in nominal unit labour costs is estimated to
have nearly doubled in both the euro area and the
EU in 2008 compared to the 2002-2007 average.
Inflation expe cta tions remain well anc hored
In the first half of 2008, as inflation soared, a key
concern was whether inflation expectations would
remain well-anchored and thereby not contribute to
the emergence of a price-wage spiral. These
worries dissipated in the second half of the year, in
conjunction with the rapid fall in commodity
prices and headline inflation rates. In March 2009,
the survey assessment of future price
developments pointed to a further easing in
inflation in both industry and services in the euro
area. They stand markedly below their long-term
average, signalling that short-term inflationary
pressures are easing.
Graph 1.5.3: Inflation expectations, euro area
0.5
1.0
1.5
2.0
2.5
3.0
06 07 08 09 -3
0
36
9
12
15
18
21
24
27
30
33
Consumer inflation expectations (rh s)Implied inflation expectations, 10-year (lhs)
yoy % alance
Consumers’ price expectations have decreased
significantly from last summer's peak and
currently stand well below the long-term average.
Long-term inflation expectations in the euro area,
measured on the basis of 10-year index-linked
government bonds, continued to decline until end-
2008 and picked up somewhat thereafter,remaining volatile; they stood at 1.9% in
mid-April. However, one should note that at a time
of financial market distress, changes in break-even
inflation rates are likely to be unreliable indicators
of adjustments in market inflation expectations,
because of potentially large shifts in liquidity
premia.
Inflation set to fall on account of the weak
growth outlook
Looking ahead, average annual HICP inflation in
the euro area is projected to fall sharply, from
3.3% last year to 0.4% this year, before edging up
to around 1.2% in 2010. In the EU, inflation is
expected to drop from 3.7% in 2008 to 0.9% this
year before picking up again to 1.3% in 2010.
Compared to the January interim forecast, these
new projections entail a downward revision for
2009 (0.6 pp. for the euro area and 0.3 pp. for the
EU) and 2010 (0.6 pp. for both the euro area and
the EU). This reflects both the weaker prospects
for economic activity and lower commodity prices.
In terms of quarterly profiles, inflation in both theeuro area and the EU is expected to reach a trough
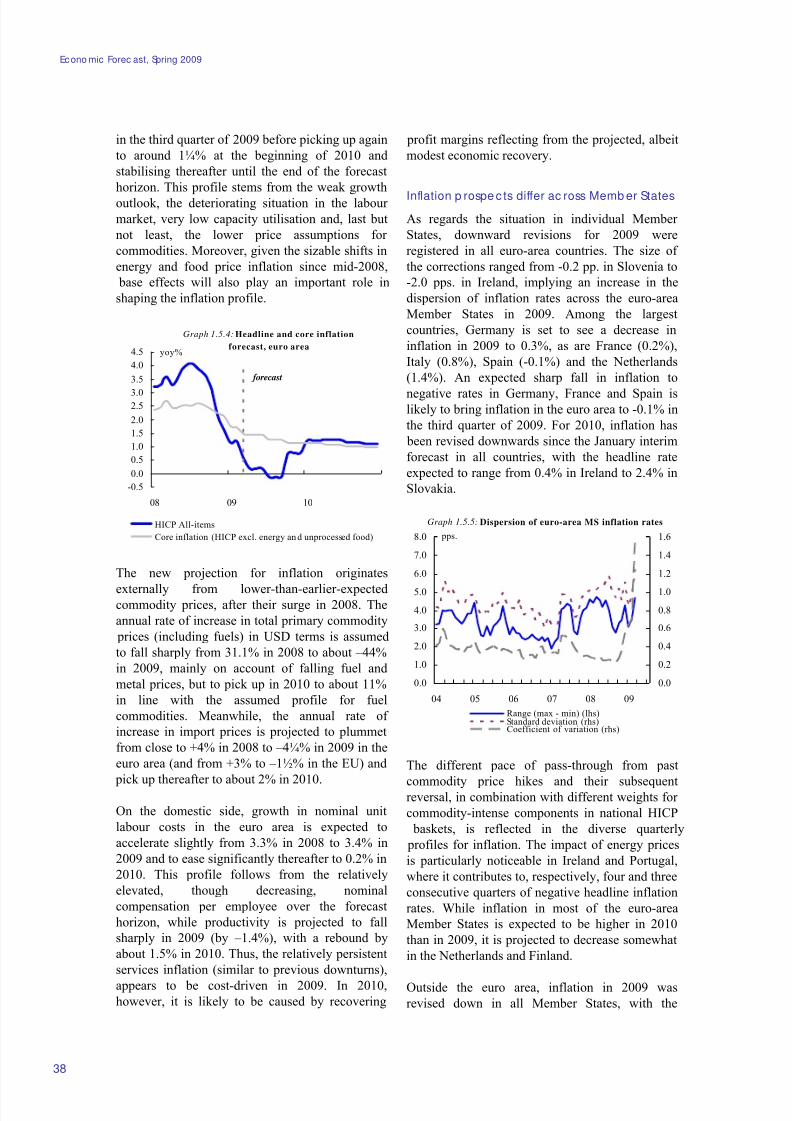
8/14/2019 Economic Forecast 2009
http://slidepdf.com/reader/full/economic-forecast-2009 44/172
Econo mic Forec ast, Spring 2009
38
in the third quarter of 2009 before picking up again
to around 1¼% at the beginning of 2010 and
stabilising thereafter until the end of the forecast
horizon. This profile stems from the weak growth
outlook, the deteriorating situation in the labour
market, very low capacity utilisation and, last but
not least, the lower price assumptions for
commodities. Moreover, given the sizable shifts in
energy and food price inflation since mid-2008,
base effects will also play an important role in
shaping the inflation profile.
Graph 1.5.4: Headline and core inflation
forecast, euro area
-0.5
0.0
0.5
1.0
1.5
2.0
2.53.0
3.5
4.0
4.5
08 09 10
forecast
yoy%
HICP All-items
Core inflation (HICP excl. energy an d unprocessed food)
The new projection for inflation originates
externally from lower-than-earlier-expectedcommodity prices, after their surge in 2008. The
annual rate of increase in total primary commodity
prices (including fuels) in USD terms is assumed
to fall sharply from 31.1% in 2008 to about –44%
in 2009, mainly on account of falling fuel and
metal prices, but to pick up in 2010 to about 11%
in line with the assumed profile for fuel
commodities. Meanwhile, the annual rate of
increase in import prices is projected to plummet
from close to +4% in 2008 to –4¼% in 2009 in the
euro area (and from +3% to –1½% in the EU) and
pick up thereafter to about 2% in 2010.
On the domestic side, growth in nominal unit
labour costs in the euro area is expected to
accelerate slightly from 3.3% in 2008 to 3.4% in
2009 and to ease significantly thereafter to 0.2% in
2010. This profile follows from the relatively
elevated, though decreasing, nominal
compensation per employee over the forecast
horizon, while productivity is projected to fall
sharply in 2009 (by –1.4%), with a rebound by
about 1.5% in 2010. Thus, the relatively persistent
services inflation (similar to previous downturns),
appears to be cost-driven in 2009. In 2010,however, it is likely to be caused by recovering
profit margins reflecting from the projected, albeit
modest economic recovery.
Inflation p rospe c ts differ ac ross Memb er States
As regards the situation in individual Member
States, downward revisions for 2009 were
registered in all euro-area countries. The size of
the corrections ranged from -0.2 pp. in Slovenia to
-2.0 pps. in Ireland, implying an increase in the
dispersion of inflation rates across the euro-area
Member States in 2009. Among the largest
countries, Germany is set to see a decrease in
inflation in 2009 to 0.3%, as are France (0.2%),
Italy (0.8%), Spain (-0.1%) and the Netherlands
(1.4%). An expected sharp fall in inflation to
negative rates in Germany, France and Spain islikely to bring inflation in the euro area to -0.1% in
the third quarter of 2009. For 2010, inflation has
been revised downwards since the January interim
forecast in all countries, with the headline rate
expected to range from 0.4% in Ireland to 2.4% in
Slovakia.
0.0
1.0
2.0
3.0
4.0
5.0
6.0
7.0
8.0
04 05 06 07 08 09
pps.
0.0
0.2
0.4
0.6
0.8
1.0
1.2
1.4
1.6
Range (max - min) (lhs)Standard deviation (rhs)Coefficient of variation (rhs)
Graph 1.5.5: Dispersion of euro-area MS inflation rates
The different pace of pass-through from past
commodity price hikes and their subsequentreversal, in combination with different weights for
commodity-intense components in national HICP
baskets, is reflected in the diverse quarterly
profiles for inflation. The impact of energy prices
is particularly noticeable in Ireland and Portugal,
where it contributes to, respectively, four and three
consecutive quarters of negative headline inflation
rates. While inflation in most of the euro-area
Member States is expected to be higher in 2010
than in 2009, it is projected to decrease somewhat
in the Netherlands and Finland.
Outside the euro area, inflation in 2009 was
revised down in all Member States, with the
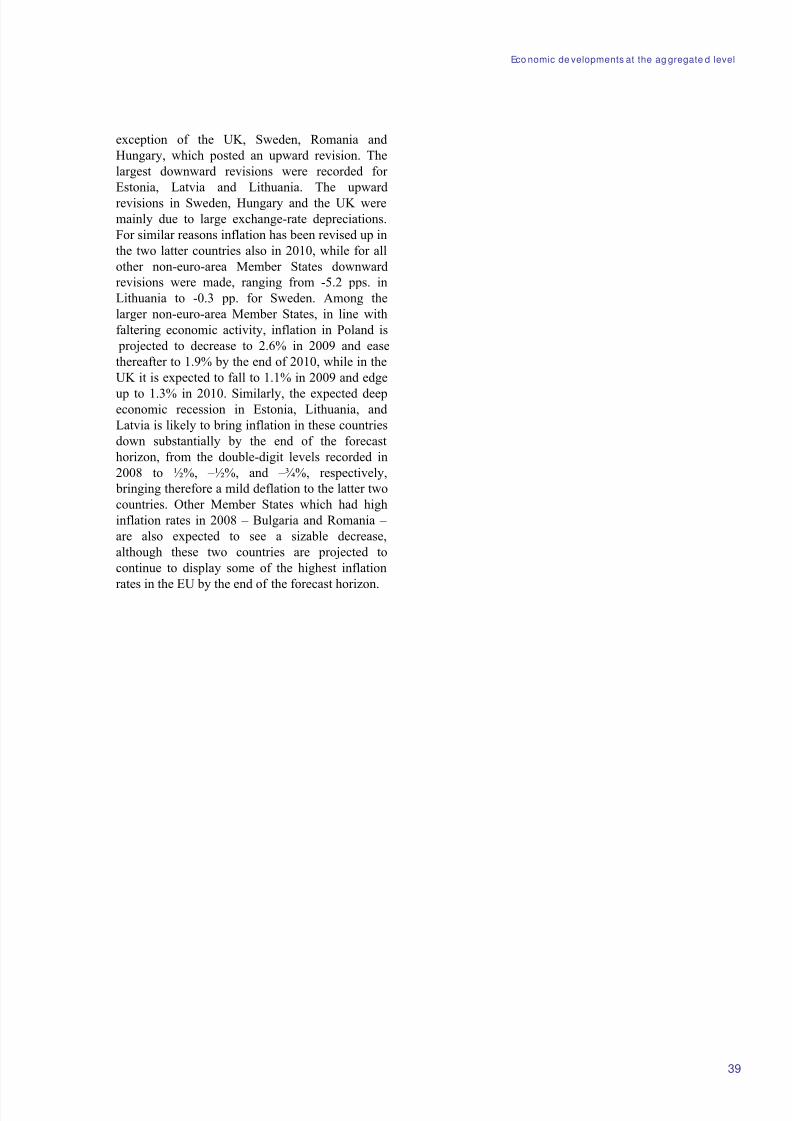
8/14/2019 Economic Forecast 2009
http://slidepdf.com/reader/full/economic-forecast-2009 45/172
Eco nomic de velopments at the ag gregate d level
39
exception of the UK, Sweden, Romania and
Hungary, which posted an upward revision. The
largest downward revisions were recorded for
Estonia, Latvia and Lithuania. The upward
revisions in Sweden, Hungary and the UK were
mainly due to large exchange-rate depreciations.
For similar reasons inflation has been revised up in
the two latter countries also in 2010, while for all
other non-euro-area Member States downward
revisions were made, ranging from -5.2 pps. in
Lithuania to -0.3 pp. for Sweden. Among the
larger non-euro-area Member States, in line with
faltering economic activity, inflation in Poland is
projected to decrease to 2.6% in 2009 and ease
thereafter to 1.9% by the end of 2010, while in the
UK it is expected to fall to 1.1% in 2009 and edge
up to 1.3% in 2010. Similarly, the expected deepeconomic recession in Estonia, Lithuania, and
Latvia is likely to bring inflation in these countries
down substantially by the end of the forecast
horizon, from the double-digit levels recorded in
2008 to ½%, –½%, and –¾%, respectively,
bringing therefore a mild deflation to the latter two
countries. Other Member States which had high
inflation rates in 2008 – Bulgaria and Romania –
are also expected to see a sizable decrease,
although these two countries are projected to
continue to display some of the highest inflation
rates in the EU by the end of the forecast horizon.
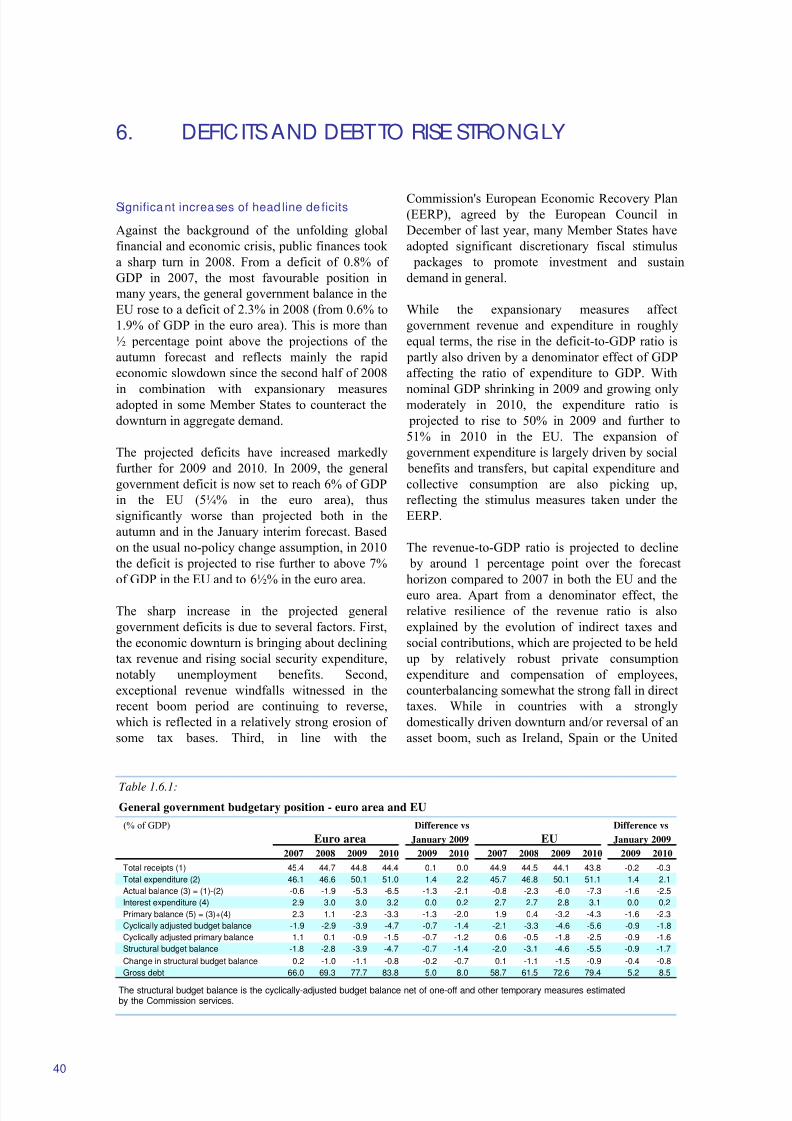
8/14/2019 Economic Forecast 2009
http://slidepdf.com/reader/full/economic-forecast-2009 46/172
6. DEFICITS AND DEBT TO RISE STRONGLY
Table 1.6.1:
General government budgetary position - euro area and EU
(% of GDP) Difference vs Difference vs
Euro area January 2009 EU January 2009
2007 2008 2009 2010 2009 2010 2007 2008 2009 2010 2009 2010
Total receipts (1) 45.4 44.7 44.8 44.4 0.1 0.0 44.9 44.5 44.1 43.8 -0.2 -0.3
Total expenditure (2) 46.1 46.6 50.1 51.0 1.4 2.2 45.7 46.8 50.1 51.1 1.4 2.1
Actual balance (3) = (1)-(2) -0.6 -1.9 -5.3 -6.5 -1.3 -2.1 -0.8 -2.3 -6.0 -7.3 -1.6 -2.5
Interest expenditure (4) 2.9 3.0 3.0 3.2 0.0 0.2 2.7 2.7 2.8 3.1 0.0 0.2
Primary balance (5) = (3)+(4) 2.3 1.1 -2.3 -3.3 -1.3 -2.0 1.9 0.4 -3.2 -4.3 -1.6 -2.3
Cyclically adjusted budget balance -1.9 -2.9 -3.9 -4.7 -0.7 -1.4 -2.1 -3.3 -4.6 -5.6 -0.9 -1.8
Cyclically adjusted primary balance 1.1 0.1 -0.9 -1.5 -0.7 -1.2 0.6 -0.5 -1.8 -2.5 -0.9 -1.6
Structural budget balance -1.8 -2.8 -3.9 -4.7 -0.7 -1.4 -2.0 -3.1 -4.6 -5.5 -0.9 -1.7
Change in structural budget balance 0.2 -1.0 -1.1 -0.8 -0.2 -0.7 0.1 -1.1 -1.5 -0.9 -0.4 -0.8
Gross debt 66.0 69.3 77.7 83.8 5.0 8.0 58.7 61.5 72.6 79.4 5.2 8.5
The structural budget balance is the cyclically-adjusted budget balance net of one-off and other temporary measures estimatedby the Commission services.
40
Significant increases of head line de ficits
Against the background of the unfolding global
financial and economic crisis, public finances took
a sharp turn in 2008. From a deficit of 0.8% of
GDP in 2007, the most favourable position in
many years, the general government balance in the
EU rose to a deficit of 2.3% in 2008 (from 0.6% to
1.9% of GDP in the euro area). This is more than
½ percentage point above the projections of the
autumn forecast and reflects mainly the rapid
economic slowdown since the second half of 2008
in combination with expansionary measuresadopted in some Member States to counteract the
downturn in aggregate demand.
The projected deficits have increased markedly
further for 2009 and 2010. In 2009, the general
government deficit is now set to reach 6% of GDP
in the EU (5¼% in the euro area), thus
significantly worse than projected both in the
autumn and in the January interim forecast. Based
on the usual no-policy change assumption, in 2010
the deficit is projected to rise further to above 7%
of GDP in the EU and to 6½% in the euro area.
The sharp increase in the projected general
government deficits is due to several factors. First,
the economic downturn is bringing about declining
tax revenue and rising social security expenditure,
notably unemployment benefits. Second,
exceptional revenue windfalls witnessed in the
recent boom period are continuing to reverse,
which is reflected in a relatively strong erosion of
some tax bases. Third, in line with the
Commission's European Economic Recovery Plan(EERP), agreed by the European Council in
December of last year, many Member States have
adopted significant discretionary fiscal stimulus
packages to promote investment and sustain
demand in general.
While the expansionary measures affect
government revenue and expenditure in roughly
equal terms, the rise in the deficit-to-GDP ratio is
partly also driven by a denominator effect of GDP
affecting the ratio of expenditure to GDP. With
nominal GDP shrinking in 2009 and growing onlymoderately in 2010, the expenditure ratio is
projected to rise to 50% in 2009 and further to
51% in 2010 in the EU. The expansion of
government expenditure is largely driven by social
benefits and transfers, but capital expenditure and
collective consumption are also picking up,
reflecting the stimulus measures taken under the
EERP.
The revenue-to-GDP ratio is projected to decline
by around 1 percentage point over the forecast
horizon compared to 2007 in both the EU and the
euro area. Apart from a denominator effect, the
relative resilience of the revenue ratio is also
explained by the evolution of indirect taxes and
social contributions, which are projected to be held
up by relatively robust private consumption
expenditure and compensation of employees,
counterbalancing somewhat the strong fall in direct
taxes. While in countries with a strongly
domestically driven downturn and/or reversal of an
asset boom, such as Ireland, Spain or the United
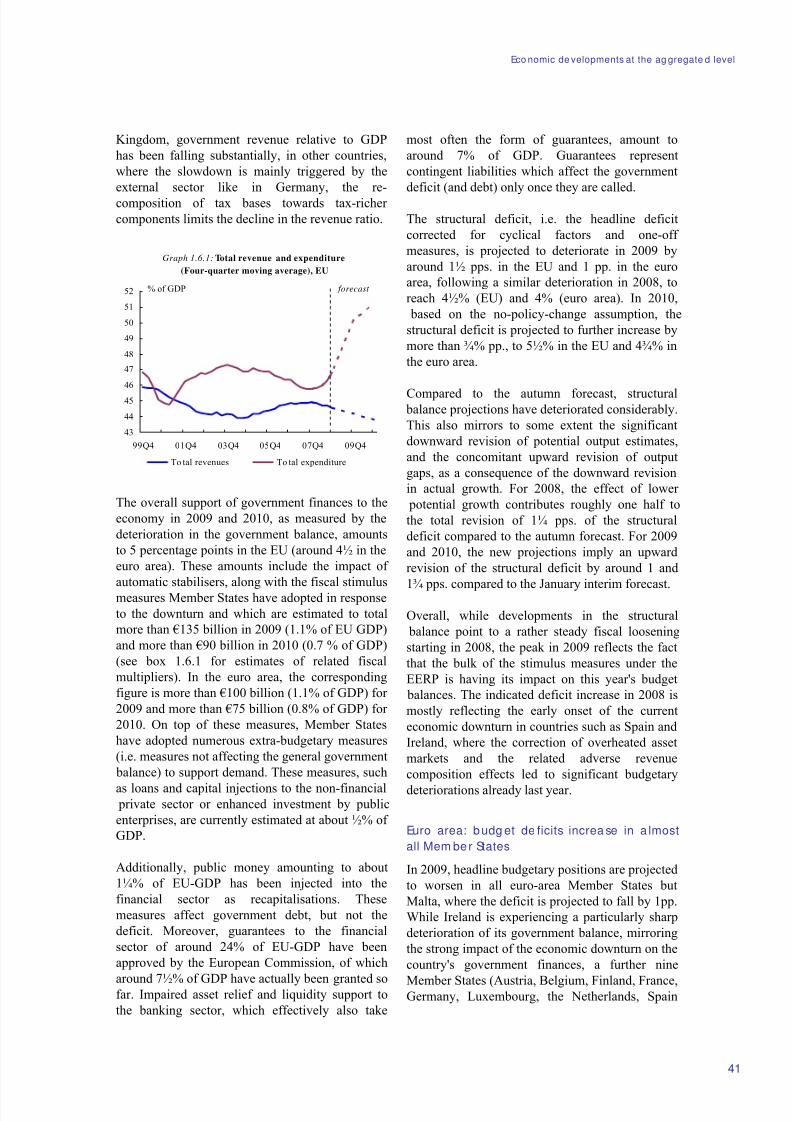
8/14/2019 Economic Forecast 2009
http://slidepdf.com/reader/full/economic-forecast-2009 47/172
Eco nomic de velopments at the ag gregate d level
41
Kingdom, government revenue relative to GDP
has been falling substantially, in other countries,
where the slowdown is mainly triggered by the
external sector like in Germany, the re-
composition of tax bases towards tax-richer
components limits the decline in the revenue ratio.
Graph 1.6.1: Total revenue and expenditure
(Four-quarter moving average), EU
43
44
45
46
47
48
49
50
51
52
99Q4 01Q4 03Q4 05Q4 07Q4 09Q4
To tal revenues To tal expenditure
forecast % of GDP
The overall support of government finances to the
economy in 2009 and 2010, as measured by the
deterioration in the government balance, amounts
to 5 percentage points in the EU (around 4½ in the
euro area). These amounts include the impact of
automatic stabilisers, along with the fiscal stimulus
measures Member States have adopted in response
to the downturn and which are estimated to total
more than €135 billion in 2009 (1.1% of EU GDP)
and more than €90 billion in 2010 (0.7 % of GDP)
(see box 1.6.1 for estimates of related fiscal
multipliers). In the euro area, the corresponding
figure is more than €100 billion (1.1% of GDP) for
2009 and more than €75 billion (0.8% of GDP) for
2010. On top of these measures, Member States
have adopted numerous extra-budgetary measures
(i.e. measures not affecting the general government
balance) to support demand. These measures, such
as loans and capital injections to the non-financial private sector or enhanced investment by public
enterprises, are currently estimated at about ½% of
GDP.
Additionally, public money amounting to about
1¼% of EU-GDP has been injected into the
financial sector as recapitalisations. These
measures affect government debt, but not the
deficit. Moreover, guarantees to the financial
sector of around 24% of EU-GDP have been
approved by the European Commission, of which
around 7½% of GDP have actually been granted sofar. Impaired asset relief and liquidity support to
the banking sector, which effectively also take
most often the form of guarantees, amount to
around 7% of GDP. Guarantees represent
contingent liabilities which affect the government
deficit (and debt) only once they are called.
The structural deficit, i.e. the headline deficit
corrected for cyclical factors and one-off
measures, is projected to deteriorate in 2009 by
around 1½ pps. in the EU and 1 pp. in the euro
area, following a similar deterioration in 2008, to
reach 4½% (EU) and 4% (euro area). In 2010,
based on the no-policy-change assumption, the
structural deficit is projected to further increase by
more than ¾% pp., to 5½% in the EU and 4¾% in
the euro area.
Compared to the autumn forecast, structural balance projections have deteriorated considerably.
This also mirrors to some extent the significant
downward revision of potential output estimates,
and the concomitant upward revision of output
gaps, as a consequence of the downward revision
in actual growth. For 2008, the effect of lower
potential growth contributes roughly one half to
the total revision of 1¼ pps. of the structural
deficit compared to the autumn forecast. For 2009
and 2010, the new projections imply an upward
revision of the structural deficit by around 1 and
1¾ pps. compared to the January interim forecast.
Overall, while developments in the structural
balance point to a rather steady fiscal loosening
starting in 2008, the peak in 2009 reflects the fact
that the bulk of the stimulus measures under the
EERP is having its impact on this year's budget
balances. The indicated deficit increase in 2008 is
mostly reflecting the early onset of the current
economic downturn in countries such as Spain and
Ireland, where the correction of overheated asset
markets and the related adverse revenue
composition effects led to significant budgetary
deteriorations already last year.
Euro area: budg et de ficits increa se in a lmost
all Mem ber States
In 2009, headline budgetary positions are projected
to worsen in all euro-area Member States but
Malta, where the deficit is projected to fall by 1pp.
While Ireland is experiencing a particularly sharp
deterioration of its government balance, mirroring
the strong impact of the economic downturn on the
country's government finances, a further nine
Member States (Austria, Belgium, Finland, France,Germany, Luxembourg, the Netherlands, Spain
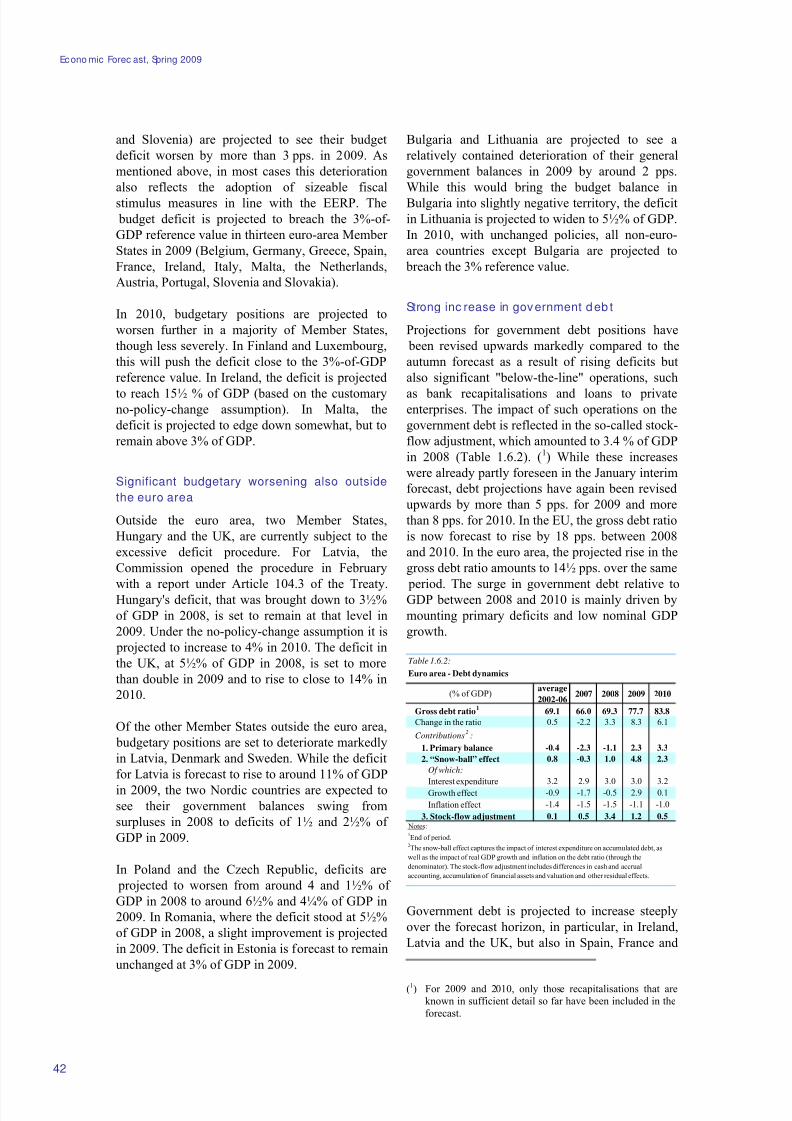
8/14/2019 Economic Forecast 2009
http://slidepdf.com/reader/full/economic-forecast-2009 48/172
Econo mic Forec ast, Spring 2009
42
and Slovenia) are projected to see their budget
deficit worsen by more than 3 pps. in 2009. As
mentioned above, in most cases this deterioration
also reflects the adoption of sizeable fiscal
stimulus measures in line with the EERP. The
budget deficit is projected to breach the 3%-of-
GDP reference value in thirteen euro-area Member
States in 2009 (Belgium, Germany, Greece, Spain,
France, Ireland, Italy, Malta, the Netherlands,
Austria, Portugal, Slovenia and Slovakia).
In 2010, budgetary positions are projected to
worsen further in a majority of Member States,
though less severely. In Finland and Luxembourg,
this will push the deficit close to the 3%-of-GDP
reference value. In Ireland, the deficit is projected
to reach 15½ % of GDP (based on the customaryno-policy-change assumption). In Malta, the
deficit is projected to edge down somewhat, but to
remain above 3% of GDP.
Significant budgetary worsening also outside
the euro area
Outside the euro area, two Member States,
Hungary and the UK, are currently subject to the
excessive deficit procedure. For Latvia, the
Commission opened the procedure in February
with a report under Article 104.3 of the Treaty.Hungary's deficit, that was brought down to 3½%
of GDP in 2008, is set to remain at that level in
2009. Under the no-policy-change assumption it is
projected to increase to 4% in 2010. The deficit in
the UK, at 5½% of GDP in 2008, is set to more
than double in 2009 and to rise to close to 14% in
2010.
Of the other Member States outside the euro area,
budgetary positions are set to deteriorate markedly
in Latvia, Denmark and Sweden. While the deficit
for Latvia is forecast to rise to around 11% of GDP
in 2009, the two Nordic countries are expected tosee their government balances swing from
surpluses in 2008 to deficits of 1½ and 2½% of
GDP in 2009.
In Poland and the Czech Republic, deficits are
projected to worsen from around 4 and 1½% of
GDP in 2008 to around 6½% and 4¼% of GDP in
2009. In Romania, where the deficit stood at 5½%
of GDP in 2008, a slight improvement is projected
in 2009. The deficit in Estonia is forecast to remain
unchanged at 3% of GDP in 2009.
Bulgaria and Lithuania are projected to see a
relatively contained deterioration of their general
government balances in 2009 by around 2 pps.
While this would bring the budget balance in
Bulgaria into slightly negative territory, the deficit
in Lithuania is projected to widen to 5½% of GDP.
In 2010, with unchanged policies, all non-euro-
area countries except Bulgaria are projected to
breach the 3% reference value.
Strong inc rease in government deb t
Projections for government debt positions have
been revised upwards markedly compared to the
autumn forecast as a result of rising deficits but
also significant "below-the-line" operations, such
as bank recapitalisations and loans to privateenterprises. The impact of such operations on the
government debt is reflected in the so-called stock-
flow adjustment, which amounted to 3.4 % of GDP
in 2008 (Table 1.6.2). (1) While these increases
were already partly foreseen in the January interim
forecast, debt projections have again been revised
upwards by more than 5 pps. for 2009 and more
than 8 pps. for 2010. In the EU, the gross debt ratio
is now forecast to rise by 18 pps. between 2008
and 2010. In the euro area, the projected rise in the
gross debt ratio amounts to 14½ pps. over the same
period. The surge in government debt relative toGDP between 2008 and 2010 is mainly driven by
mounting primary deficits and low nominal GDP
growth.
Table 1.6.2:
Euro area - Debt dynamics
Gross debt ratio1
69.1 66.0 69.3 77.7 83.8
Change in the ratio 0.5 -2.2 3.3 8.3 6.1
Contributions2
:
1. Primary balance -0.4 -2.3 -1.1 2.3 3.3
2. “Snow-ball” effect 0.8 -0.3 1.0 4.8 2.3
Of which:
Interest expenditure 3.2 2.9 3.0 3.0 3.2Growth effect -0.9 -1.7 -0.5 2.9 0.1
Inflation effect -1.4 -1.5 -1.5 -1.1 -1.0
3. Stock-flow adjustment 0.1 0.5 3.4 1.2 0.5 Notes:
2The snow-ball effect captures the impact of interest expenditure on accumulated debt, as
well as the impact of real GDP growth and inflation on the debt ratio (through the
denominator). The stock-flow adjustment includes differences in cash and accrual
accounting, accumulation of financial assets and valuation and other residual effects.
(% of GDP) 2007average
2002-062008 2009 2010
1End of period.
Government debt is projected to increase steeply
over the forecast horizon, in particular, in Ireland,
Latvia and the UK, but also in Spain, France and
(1) For 2009 and 2010, only those recapitalisations that areknown in sufficient detail so far have been included in theforecast.
8/14/2019 Economic Forecast 2009
http://slidepdf.com/reader/full/economic-forecast-2009 49/172
Eco nomic de velopments at the ag gregate d level
43
Lithuania. Reductions in the debt burden are
foreseen only for Cyprus, while the ratio to GDP is
expected to remain practically unchanged in
Denmark at a low level and to increase only
slightly in Bulgaria, Estonia and Luxembourg.
Notwithstanding the observed decline in the
German Bund interest rate compared with past
years (Graph 1.2.4), in the euro area as a whole
interest payments relative to GDP are projected to
remain broadly steady over the forecast horizon.
This is due to a widening of yield spreads relative
to the German Bund as investors turned more
discriminating between sovereign bond issuers,
thereby raising the cost of financing government
debt for a number of countries both inside and
outside the euro area.
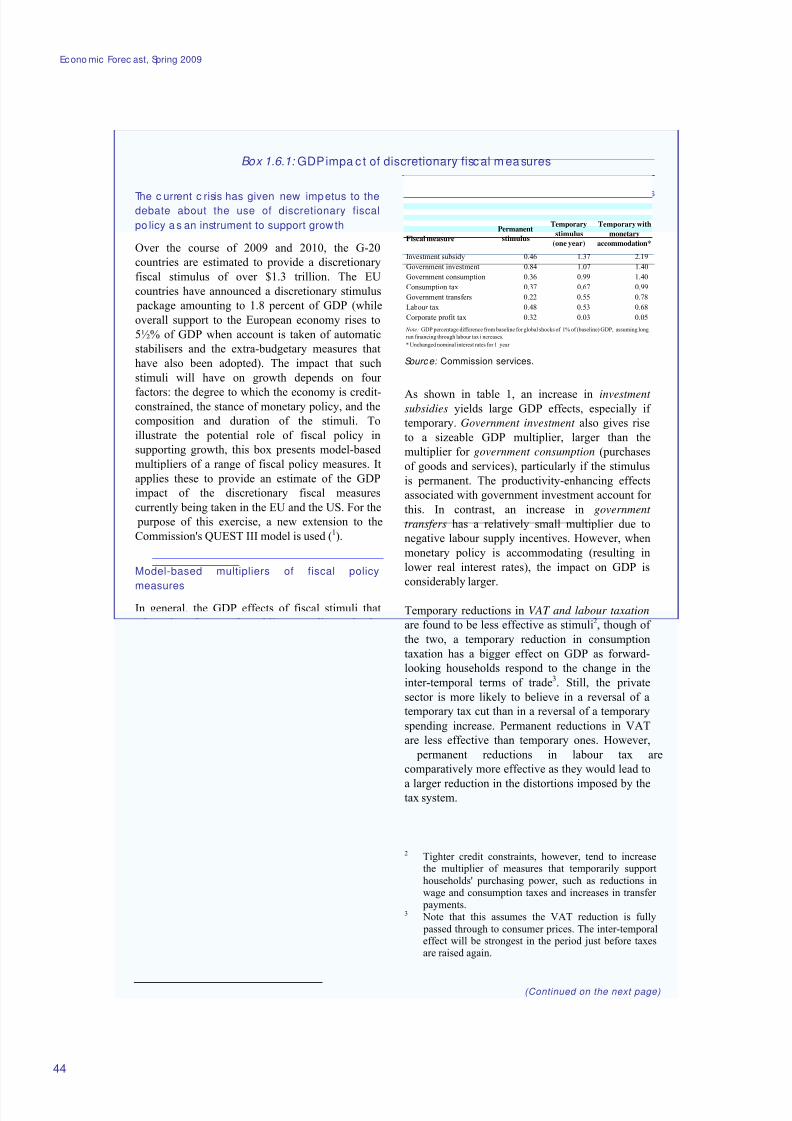
8/14/2019 Economic Forecast 2009
http://slidepdf.com/reader/full/economic-forecast-2009 50/172
Econo mic Forec ast, Spring 2009
44
Box 1.6.1: GDP impa c t of discretionary fiscal m easures
The c urrent c risis has given new impetus to thedebate about the use of discretionary fiscal
po licy a s an instrument to support growth
Over the course of 2009 and 2010, the G-20
countries are estimated to provide a discretionary
fiscal stimulus of over $1.3 trillion. The EU
countries have announced a discretionary stimulus
package amounting to 1.8 percent of GDP (while
overall support to the European economy rises to
5½% of GDP when account is taken of automatic
stabilisers and the extra-budgetary measures that
have also been adopted). The impact that such
stimuli will have on growth depends on four
factors: the degree to which the economy is credit-constrained, the stance of monetary policy, and the
composition and duration of the stimuli. To
illustrate the potential role of fiscal policy in
supporting growth, this box presents model-based
multipliers of a range of fiscal policy measures. It
applies these to provide an estimate of the GDP
impact of the discretionary fiscal measures
currently being taken in the EU and the US. For the
purpose of this exercise, a new extension to the
Commission's QUEST III model is used (1).
Model-based multipliers of fiscal policy
measures
In general, the GDP effects of fiscal stimuli that
take the form of public spending shocks
(government consumption and investment), are
larger than those of tax reductions or transfers to
households. However, the impact of a given
stimulus also depends crucially on whether the
shock is credibly temporary or not. In the latter
case, economic agents will anticipate higher tax
liabilities in the future and will increase savings,
leading to stronger crowding out and a smaller
GDP effect.
(1) To improve the way in which financial market shocksrelated to the crisis are transmitted to the rest of theeconomy, the QUEST III model has been adaptedto incorporate credit-constrained households(see Roeger W. and J. in ’t Veld (2009), “Fiscal Policyand Credit Constrained Households”, European
Economy Economic Paper no.357 ,http://ec.europa.eu/economy_finance/publications/publication13839_en.pdf ). These households base their consumption and leisure decisions on inter-temporaloptimisation but face a borrowing constraint linked tothe value of their collateral (housing). This model is better able to capture the linkages between house prices, credit rationing, residential investment andconsumption.
Tab le 1: First ye ar GDP effec ts of fisc al shoc ksamounting to 1% of GDP
Fiscal measure
Investment subsidy 0.46 1.37 2.19
Government investment 0.84 1.07 1.40
Government consumption 0.36 0.99 1.40
Consumption tax 0.37 0.67 0.99
Government transfers 0.22 0.55 0.78
Labour tax 0.48 0.53 0.68
Corporate profit tax 0.32 0.03 0.05
* Unchanged nominal interest rates for 1 year.
Note: GDP percentage difference from baseline for global shocks of 1% of (baseline) GDP, assuming long
run financing through labour tax i ncreases.
Permanent
stimulus
Temporary
stimulus
(one year)
Temporary with
monetary
accommodation*
Source: Commission services.
As shown in table 1, an increase in investment subsidies yields large GDP effects, especially if
temporary. Government investment also gives rise
to a sizeable GDP multiplier, larger than the
multiplier for government consumption (purchases
of goods and services), particularly if the stimulus
is permanent. The productivity-enhancing effects
associated with government investment account for
this. In contrast, an increase in government
transfers has a relatively small multiplier due to
negative labour supply incentives. However, when
monetary policy is accommodating (resulting in
lower real interest rates), the impact on GDP is
considerably larger.
Temporary reductions in VAT and labour taxation
are found to be less effective as stimuli2, though of
the two, a temporary reduction in consumption
taxation has a bigger effect on GDP as forward-
looking households respond to the change in the
inter-temporal terms of trade3. Still, the private
sector is more likely to believe in a reversal of a
temporary tax cut than in a reversal of a temporary
spending increase. Permanent reductions in VAT
are less effective than temporary ones. However,
permanent reductions in labour tax are
comparatively more effective as they would lead to
a larger reduction in the distortions imposed by thetax system.
2 Tighter credit constraints, however, tend to increasethe multiplier of measures that temporarily supporthouseholds' purchasing power, such as reductions inwage and consumption taxes and increases in transfer payments.
3 Note that this assumes the VAT reduction is fully passed through to consumer prices. The inter-temporaleffect will be strongest in the period just before taxesare raised again.
(Continued on the next page)
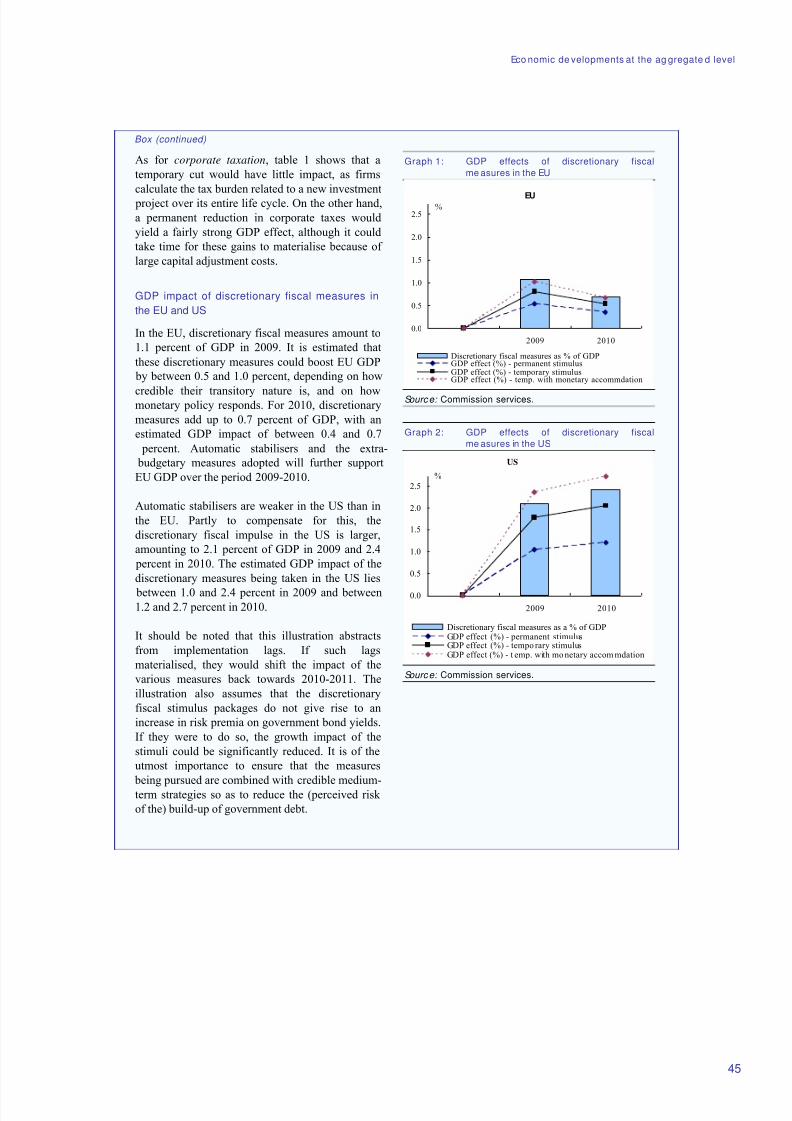
8/14/2019 Economic Forecast 2009
http://slidepdf.com/reader/full/economic-forecast-2009 51/172
Eco nomic de velopments at the ag gregate d level
45
Box (continued)
As for corporate taxation, table 1 shows that a
temporary cut would have little impact, as firms
calculate the tax burden related to a new investment
project over its entire life cycle. On the other hand,
a permanent reduction in corporate taxes would
yield a fairly strong GDP effect, although it could
take time for these gains to materialise because of
large capital adjustment costs.
GDP impact of discretionary fiscal measures in
the EU and US
In the EU, discretionary fiscal measures amount to
1.1 percent of GDP in 2009. It is estimated that
these discretionary measures could boost EU GDP
by between 0.5 and 1.0 percent, depending on how
credible their transitory nature is, and on howmonetary policy responds. For 2010, discretionary
measures add up to 0.7 percent of GDP, with an
estimated GDP impact of between 0.4 and 0.7
percent. Automatic stabilisers and the extra-
budgetary measures adopted will further support
EU GDP over the period 2009-2010.
Automatic stabilisers are weaker in the US than in
the EU. Partly to compensate for this, the
discretionary fiscal impulse in the US is larger,
amounting to 2.1 percent of GDP in 2009 and 2.4
percent in 2010. The estimated GDP impact of the
discretionary measures being taken in the US lies
between 1.0 and 2.4 percent in 2009 and between1.2 and 2.7 percent in 2010.
It should be noted that this illustration abstracts
from implementation lags. If such lags
materialised, they would shift the impact of the
various measures back towards 2010-2011. The
illustration also assumes that the discretionary
fiscal stimulus packages do not give rise to an
increase in risk premia on government bond yields.
If they were to do so, the growth impact of the
stimuli could be significantly reduced. It is of the
utmost importance to ensure that the measures
being pursued are combined with credible medium-term strategies so as to reduce the (perceived risk
of the) build-up of government debt.
Graph 1: GDP effects of discretionary fiscal
me asures in the EU
EU
0.0
0.5
1.0
1.5
2.0
2.5
2009 2010
%
Discretionary fiscal measures as % of GDPGDP effect (%) - permanent stimulusGDP effect (%) - temporary stimulusGDP effect (%) - temp. with monetary accommdation
Source: Commission services.
Graph 2: GDP effects of discretionary fiscal
me asures in the US
US
0.0
0.5
1.0
1.5
2.0
2.5
2009 2010
%
Discretionary fiscal measures as a % of GDPGDP effect (%) - permanent stimulusGDP effect (%) - tempo rary stimulusGDP effect (%) - t emp. with mo netary accom mdation
Source: Commission services.
8/14/2019 Economic Forecast 2009
http://slidepdf.com/reader/full/economic-forecast-2009 52/172
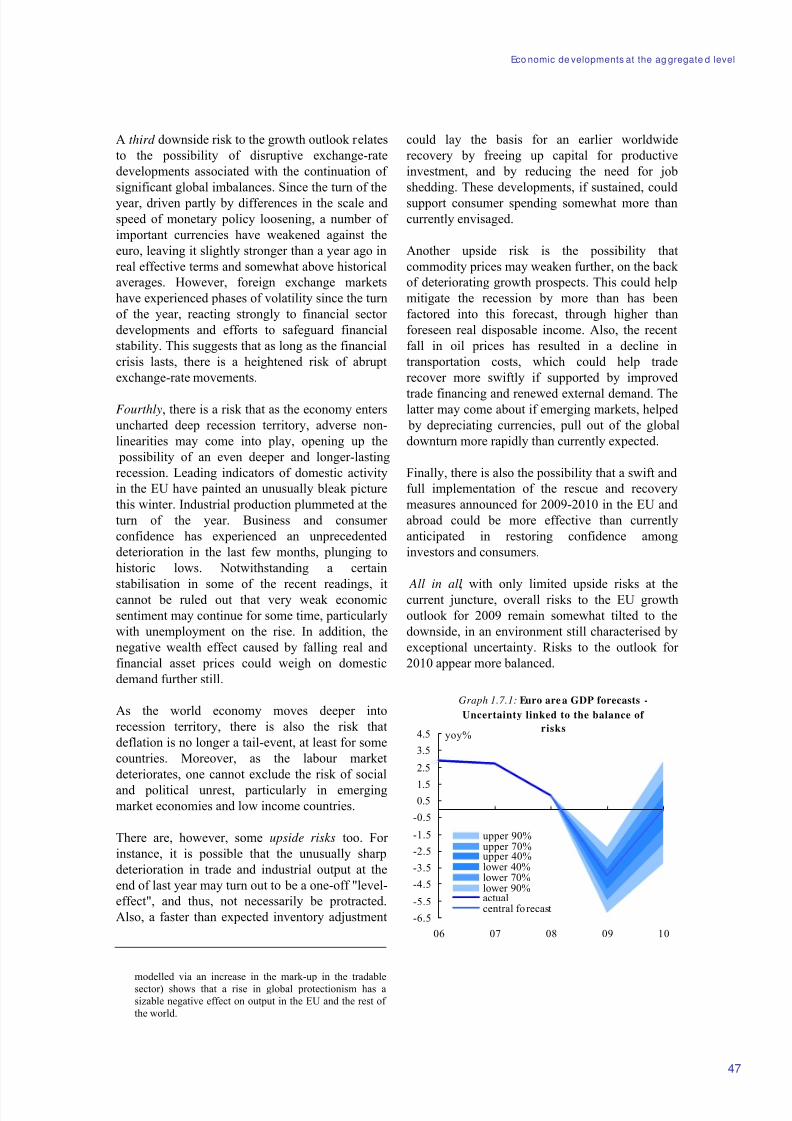
8/14/2019 Economic Forecast 2009
http://slidepdf.com/reader/full/economic-forecast-2009 53/172
Eco nomic de velopments at the ag gregate d level
47
A third downside risk to the growth outlook relates
to the possibility of disruptive exchange-rate
developments associated with the continuation of
significant global imbalances. Since the turn of the
year, driven partly by differences in the scale and
speed of monetary policy loosening, a number of
important currencies have weakened against the
euro, leaving it slightly stronger than a year ago in
real effective terms and somewhat above historical
averages. However, foreign exchange markets
have experienced phases of volatility since the turn
of the year, reacting strongly to financial sector
developments and efforts to safeguard financial
stability. This suggests that as long as the financial
crisis lasts, there is a heightened risk of abrupt
exchange-rate movements.
Fourthly, there is a risk that as the economy enters
uncharted deep recession territory, adverse non-
linearities may come into play, opening up the
possibility of an even deeper and longer-lasting
recession. Leading indicators of domestic activity
in the EU have painted an unusually bleak picture
this winter. Industrial production plummeted at the
turn of the year. Business and consumer
confidence has experienced an unprecedented
deterioration in the last few months, plunging to
historic lows. Notwithstanding a certain
stabilisation in some of the recent readings, itcannot be ruled out that very weak economic
sentiment may continue for some time, particularly
with unemployment on the rise. In addition, the
negative wealth effect caused by falling real and
financial asset prices could weigh on domestic
demand further still.
As the world economy moves deeper into
recession territory, there is also the risk that
deflation is no longer a tail-event, at least for some
countries. Moreover, as the labour market
deteriorates, one cannot exclude the risk of social
and political unrest, particularly in emergingmarket economies and low income countries.
There are, however, some upside risks too. For
instance, it is possible that the unusually sharp
deterioration in trade and industrial output at the
end of last year may turn out to be a one-off "level-
effect", and thus, not necessarily be protracted.
Also, a faster than expected inventory adjustment
modelled via an increase in the mark-up in the tradablesector) shows that a rise in global protectionism has asizable negative effect on output in the EU and the rest of the world.
could lay the basis for an earlier worldwide
recovery by freeing up capital for productive
investment, and by reducing the need for job
shedding. These developments, if sustained, could
support consumer spending somewhat more than
currently envisaged.
Another upside risk is the possibility that
commodity prices may weaken further, on the back
of deteriorating growth prospects. This could help
mitigate the recession by more than has been
factored into this forecast, through higher than
foreseen real disposable income. Also, the recent
fall in oil prices has resulted in a decline in
transportation costs, which could help trade
recover more swiftly if supported by improved
trade financing and renewed external demand. Thelatter may come about if emerging markets, helped
by depreciating currencies, pull out of the global
downturn more rapidly than currently expected.
Finally, there is also the possibility that a swift and
full implementation of the rescue and recovery
measures announced for 2009-2010 in the EU and
abroad could be more effective than currently
anticipated in restoring confidence among
investors and consumers.
All in all, with only limited upside risks at thecurrent juncture, overall risks to the EU growth
outlook for 2009 remain somewhat tilted to the
downside, in an environment still characterised by
exceptional uncertainty. Risks to the outlook for
2010 appear more balanced.
Graph 1.7.1: Euro are a GDP forecasts -
Uncertainty linked to the balance of
risks
-6.5
-5.5
-4.5
-3.5
-2.5
-1.5
-0.5
0.51.5
2.5
3.5
4.5
06 07 08 09 10
yoy%
upper 90%upper 70%upper 40%lower 40%lower 70%lower 90%actualcentral fo recast
8/14/2019 Economic Forecast 2009
http://slidepdf.com/reader/full/economic-forecast-2009 54/172
Econo mic Forec ast, Spring 2009
48
Graph 1.7.1 quantifies the risks in terms of the
possible deviation of output growth from the
central forecast. It shows the impact that various
combinations of risks could have on euro-area
GDP growth, the outcomes being weighted by the
probability of their occurrence. At a 90%
confidence interval, GDP growth in the euro area
in 2009 could be about 2¼ pps. lower than the
central scenario if all negative factors materialise,
but it could also be up to 1¾ pps. higher if the
positive risks to the outlook were all to materialise.
In 2010, uncertainties surrounding the forecast
increase, though the risks appear more balanced.
As regards the inflation outlook, risks appear to be
broadly balanced for 2009, while skewed to the
downside for 2010. On the one hand, thedownward trend in oil prices (and other
commodities) came to a halt in early 2009, as
weaker demand was offset by the OPEC supply
reductions. Further supply restrictions are possible,
posing an upside risk to the inflation outlook. On
the other hand, in a recession environment, the
decline in inflation in 2009 may be more
pronounced than currently projected or, in
particular, the upturn in inflation in 2010 may be
less pronounced. Should the risk of a sharper
downturn materialise, implying an even bigger
deterioration in the labour market, a deeper moderation of wages and further falls in capacity
utilisation, the pricing power of companies would
be further limited. This would serve to put a lid on
inflationary pressures in 2010, notwithstanding
positive base-effects.
The risk of a deflation scenario, i.e. a persistent
decline in a very broad set of prices, propagated by
a self-reinforcing expectation of further price
declines, appears limited at the current juncture, at
least at the aggregate level. This follows from
several factors: inflation expectations remain
anchored at levels consistent with price stability,wage growth is expected to remain positive, and
both fiscal and monetary policies have turned
expansionary (see section 1.5). However, at the
Member State level, the risk of deflation might be
larger in countries where the headline inflation rate
is expected to fall into negative territory for one to
four quarters, even if this is mostly a consequence
of energy-related base effects.

8/14/2019 Economic Forecast 2009
http://slidepdf.com/reader/full/economic-forecast-2009 55/172
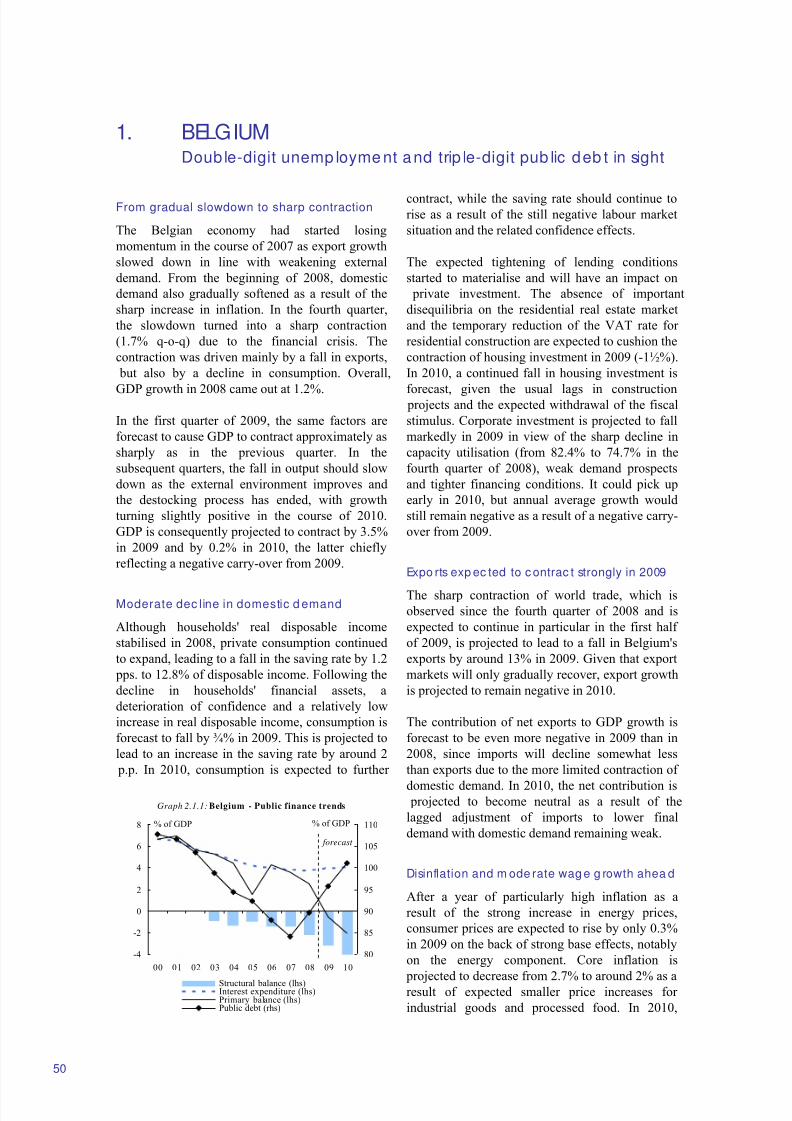
8/14/2019 Economic Forecast 2009
http://slidepdf.com/reader/full/economic-forecast-2009 56/172
1. BELGIUMDoub le-digit unemp loyme nt and trip le-digit pub lic deb t in sight
Graph 2.1.1: Belgium - Public finance trends
-4
-2
0
2
4
6
8
00 01 02 03 04 05 06 07 08 09 10
% of GDP
80
85
90
95
100
105
110% of GDP
Structural balance (lhs)Interest expenditure (lhs)Primary balance (lhs)Public debt (rhs)
forecast
50
From gradual slowdown to sharp contraction
The Belgian economy had started losing
momentum in the course of 2007 as export growth
slowed down in line with weakening external
demand. From the beginning of 2008, domestic
demand also gradually softened as a result of the
sharp increase in inflation. In the fourth quarter,
the slowdown turned into a sharp contraction
(1.7% q-o-q) due to the financial crisis. The
contraction was driven mainly by a fall in exports,
but also by a decline in consumption. Overall,
GDP growth in 2008 came out at 1.2%.
In the first quarter of 2009, the same factors are
forecast to cause GDP to contract approximately as
sharply as in the previous quarter. In the
subsequent quarters, the fall in output should slow
down as the external environment improves and
the destocking process has ended, with growth
turning slightly positive in the course of 2010.
GDP is consequently projected to contract by 3.5%
in 2009 and by 0.2% in 2010, the latter chiefly
reflecting a negative carry-over from 2009.
Moderate dec line in domestic d emand
Although households' real disposable income
stabilised in 2008, private consumption continued
to expand, leading to a fall in the saving rate by 1.2
pps. to 12.8% of disposable income. Following the
decline in households' financial assets, a
deterioration of confidence and a relatively low
increase in real disposable income, consumption is
forecast to fall by ¾% in 2009. This is projected to
lead to an increase in the saving rate by around 2
p.p. In 2010, consumption is expected to further
contract, while the saving rate should continue torise as a result of the still negative labour market
situation and the related confidence effects.
The expected tightening of lending conditions
started to materialise and will have an impact on
private investment. The absence of important
disequilibria on the residential real estate market
and the temporary reduction of the VAT rate for
residential construction are expected to cushion the
contraction of housing investment in 2009 (-1½%).
In 2010, a continued fall in housing investment is
forecast, given the usual lags in construction projects and the expected withdrawal of the fiscal
stimulus. Corporate investment is projected to fall
markedly in 2009 in view of the sharp decline in
capacity utilisation (from 82.4% to 74.7% in the
fourth quarter of 2008), weak demand prospects
and tighter financing conditions. It could pick up
early in 2010, but annual average growth would
still remain negative as a result of a negative carry-
over from 2009.
Expo rts exp ec ted to c ontrac t strongly in 2009
The sharp contraction of world trade, which is
observed since the fourth quarter of 2008 and is
expected to continue in particular in the first half
of 2009, is projected to lead to a fall in Belgium's
exports by around 13% in 2009. Given that export
markets will only gradually recover, export growth
is projected to remain negative in 2010.
The contribution of net exports to GDP growth is
forecast to be even more negative in 2009 than in
2008, since imports will decline somewhat less
than exports due to the more limited contraction of
domestic demand. In 2010, the net contribution is projected to become neutral as a result of the
lagged adjustment of imports to lower final
demand with domestic demand remaining weak.
Disinflation and m ode rate wag e g rowth ahea d
After a year of particularly high inflation as a
result of the strong increase in energy prices,
consumer prices are expected to rise by only 0.3%
in 2009 on the back of strong base effects, notably
on the energy component. Core inflation is
projected to decrease from 2.7% to around 2% as aresult of expected smaller price increases for
industrial goods and processed food. In 2010,
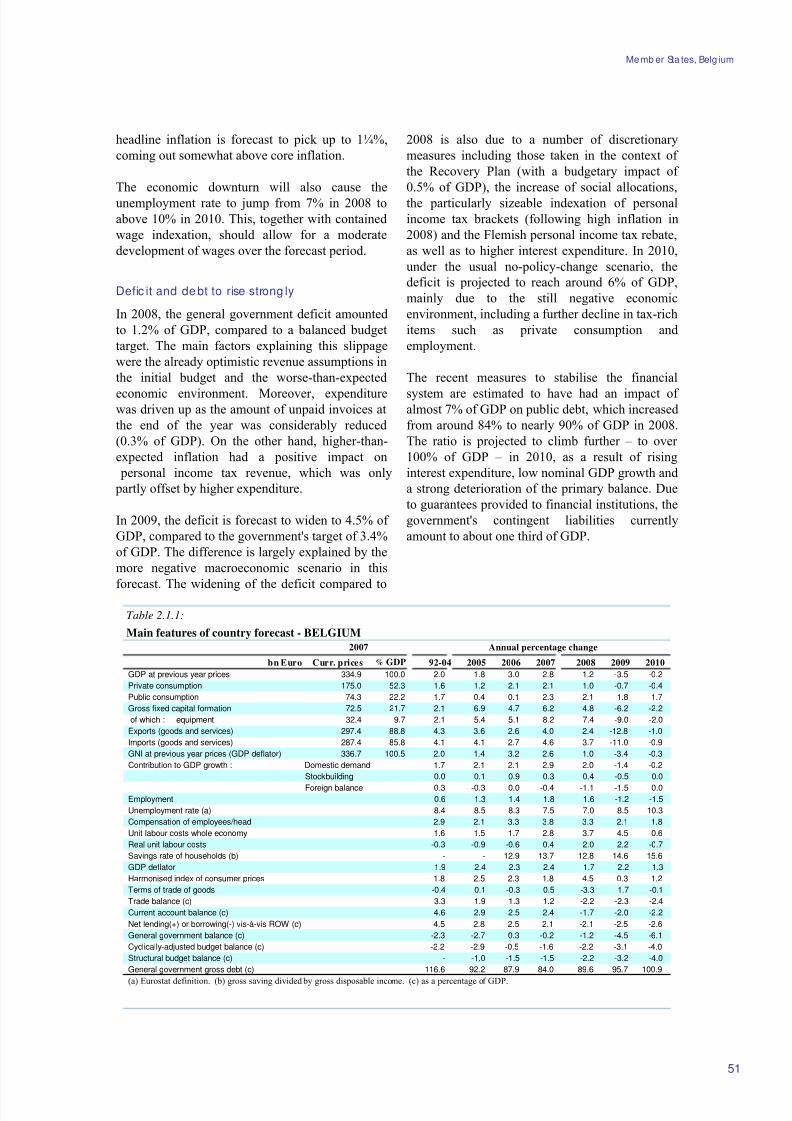
8/14/2019 Economic Forecast 2009
http://slidepdf.com/reader/full/economic-forecast-2009 57/172
Memb er Sta tes, Belg ium
Table 2.1.1:
Main features of country forecast - BELGIUM
2007 Annual percentage change
bn Euro Curr. prices % GDP 92-04 2005 2006 2007 2008 2009 2010
GDP at previous year prices 334.9 100.0 2.0 1.8 3.0 2.8 1.2 -3.5 -0.2
Private consumption 175.0 52.3 1.6 1.2 2.1 2.1 1.0 -0.7 -0.4
Public consumption 74.3 22.2 1.7 0.4 0.1 2.3 2.1 1.8 1.7
Gross fixed capital formation 72.5 21.7 2.1 6.9 4.7 6.2 4.8 -6.2 -2.2
of which : equipment 32.4 9.7 2.1 5.4 5.1 8.2 7.4 -9.0 -2.0
Exports (goods and services) 297.4 88.8 4.3 3.6 2.6 4.0 2.4 -12.8 -1.0
Imports (goods and services) 287.4 85.8 4.1 4.1 2.7 4.6 3.7 -11.0 -0.9
GNI at previous year prices (GDP deflator) 336.7 100.5 2.0 1.4 3.2 2.6 1.0 -3.4 -0.3
Contribution to GDP growth : Domestic demand 1.7 2.1 2.1 2.9 2.0 -1.4 -0.2
Stockbuilding 0.0 0.1 0.9 0.3 0.4 -0.5 0.0
Foreign balance 0.3 -0.3 0.0 -0.4 -1.1 -1.5 0.0Employment 0.6 1.3 1.4 1.8 1.6 -1.2 -1.5
Unemployment rate (a) 8.4 8.5 8.3 7.5 7.0 8.5 10.3
Compensation of employees/head 2.9 2.1 3.3 3.8 3.3 2.1 1.8
Unit labour costs whole economy 1.6 1.5 1.7 2.8 3.7 4.5 0.6
Real unit labour costs -0.3 -0.9 -0.6 0.4 2.0 2.2 -0.7
Savings rate of households (b) - - 12.9 13.7 12.8 14.6 15.6
GDP deflator 1.9 2.4 2.3 2.4 1.7 2.2 1.3
Harmonised index of consumer prices 1.8 2.5 2.3 1.8 4.5 0.3 1.2
Terms of trade of goods -0.4 0.1 -0.3 0.5 -3.3 1.7 -0.1
Trade balance (c) 3.3 1.9 1.3 1.2 -2.2 -2.3 -2.4
Current account balance (c) 4.6 2.9 2.5 2.4 -1.7 -2.0 -2.2
Net lending(+) or borrowing(-) vis-à-vis ROW (c) 4.5 2.8 2.5 2.1 -2.1 -2.5 -2.6
General government balance (c) -2.3 -2.7 0.3 -0.2 -1.2 -4.5 -6.1
Cyclically-adjusted budget balance (c) -2.2 -2.9 -0.5 -1.6 -2.2 -3.1 -4.0
Structural budget balance (c) - -1.0 -1.5 -1.5 -2.2 -3.2 -4.0
General government gross debt (c) 116.6 92.2 87.9 84.0 89.6 95.7 100.9
(a) Eurostat definition. (b) gross saving divided by gross disposable income. (c) as a percentage of GDP.
51
headline inflation is forecast to pick up to 1¼%,
coming out somewhat above core inflation.
The economic downturn will also cause the
unemployment rate to jump from 7% in 2008 to
above 10% in 2010. This, together with contained
wage indexation, should allow for a moderate
development of wages over the forecast period.
Defic it and debt to rise strong ly
In 2008, the general government deficit amounted
to 1.2% of GDP, compared to a balanced budget
target. The main factors explaining this slippage
were the already optimistic revenue assumptions in
the initial budget and the worse-than-expected
economic environment. Moreover, expenditurewas driven up as the amount of unpaid invoices at
the end of the year was considerably reduced
(0.3% of GDP). On the other hand, higher-than-
expected inflation had a positive impact on
personal income tax revenue, which was only
partly offset by higher expenditure.
In 2009, the deficit is forecast to widen to 4.5% of
GDP, compared to the government's target of 3.4%
of GDP. The difference is largely explained by the
more negative macroeconomic scenario in this
forecast. The widening of the deficit compared to
2008 is also due to a number of discretionary
measures including those taken in the context of
the Recovery Plan (with a budgetary impact of
0.5% of GDP), the increase of social allocations,
the particularly sizeable indexation of personal
income tax brackets (following high inflation in
2008) and the Flemish personal income tax rebate,
as well as to higher interest expenditure. In 2010,
under the usual no-policy-change scenario, the
deficit is projected to reach around 6% of GDP,
mainly due to the still negative economic
environment, including a further decline in tax-rich
items such as private consumption and
employment.
The recent measures to stabilise the financial
system are estimated to have had an impact of almost 7% of GDP on public debt, which increased
from around 84% to nearly 90% of GDP in 2008.
The ratio is projected to climb further – to over
100% of GDP – in 2010, as a result of rising
interest expenditure, low nominal GDP growth and
a strong deterioration of the primary balance. Due
to guarantees provided to financial institutions, the
government's contingent liabilities currently
amount to about one third of GDP.
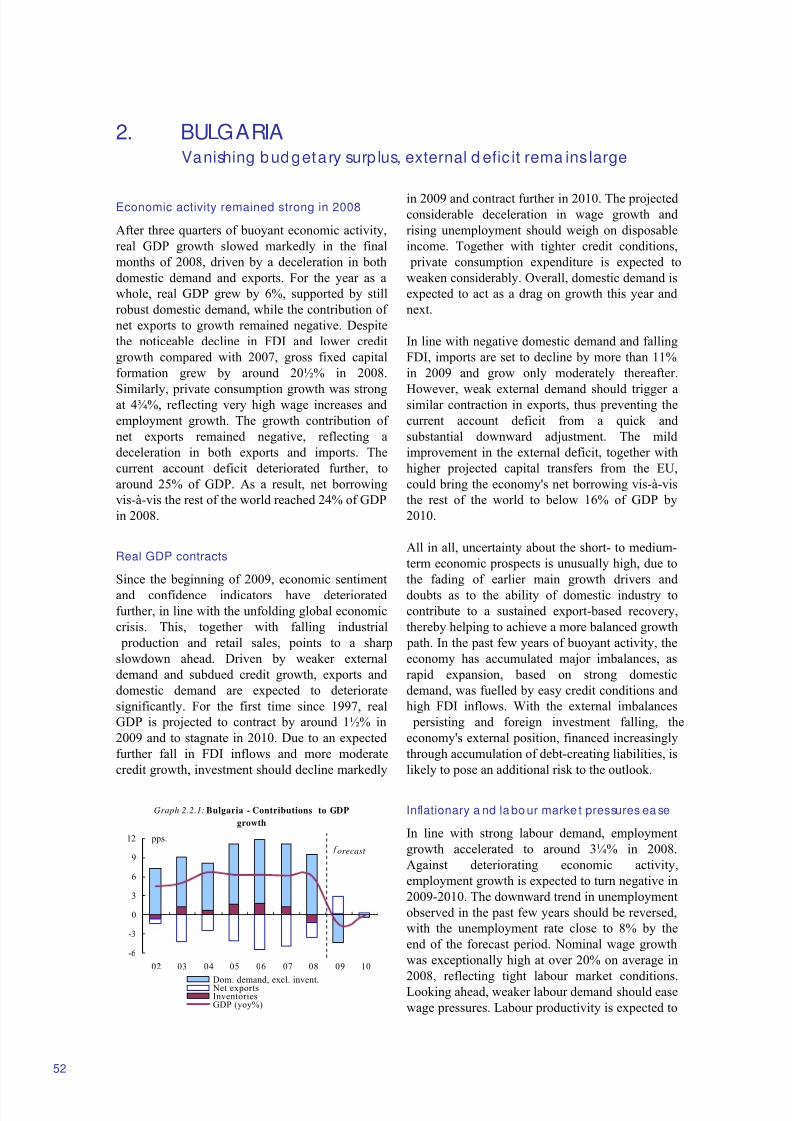
8/14/2019 Economic Forecast 2009
http://slidepdf.com/reader/full/economic-forecast-2009 58/172
2. BULGARIAVanishing budgetary surp lus, external d efic it rema ins large
Graph 2.2.1: Bulgaria - Contributions to GDP
growth
-6
-3
0
3
6
9
12
02 03 04 05 06 07 08 09 10
pps.
Dom. demand, excl. invent. Net exportsInventoriesGDP (yoy%)
orecast
52
Economic activity remained strong in 2008
After three quarters of buoyant economic activity,
real GDP growth slowed markedly in the final
months of 2008, driven by a deceleration in both
domestic demand and exports. For the year as a
whole, real GDP grew by 6%, supported by still
robust domestic demand, while the contribution of
net exports to growth remained negative. Despite
the noticeable decline in FDI and lower credit
growth compared with 2007, gross fixed capital
formation grew by around 20½% in 2008.
Similarly, private consumption growth was strongat 4¾%, reflecting very high wage increases and
employment growth. The growth contribution of
net exports remained negative, reflecting a
deceleration in both exports and imports. The
current account deficit deteriorated further, to
around 25% of GDP. As a result, net borrowing
vis-à-vis the rest of the world reached 24% of GDP
in 2008.
Real GDP contracts
Since the beginning of 2009, economic sentiment
and confidence indicators have deteriorated
further, in line with the unfolding global economic
crisis. This, together with falling industrial
production and retail sales, points to a sharp
slowdown ahead. Driven by weaker external
demand and subdued credit growth, exports and
domestic demand are expected to deteriorate
significantly. For the first time since 1997, real
GDP is projected to contract by around 1½% in
2009 and to stagnate in 2010. Due to an expected
further fall in FDI inflows and more moderate
credit growth, investment should decline markedly
in 2009 and contract further in 2010. The projectedconsiderable deceleration in wage growth and
rising unemployment should weigh on disposable
income. Together with tighter credit conditions,
private consumption expenditure is expected to
weaken considerably. Overall, domestic demand is
expected to act as a drag on growth this year and
next.
In line with negative domestic demand and falling
FDI, imports are set to decline by more than 11%
in 2009 and grow only moderately thereafter.
However, weak external demand should trigger asimilar contraction in exports, thus preventing the
current account deficit from a quick and
substantial downward adjustment. The mild
improvement in the external deficit, together with
higher projected capital transfers from the EU,
could bring the economy's net borrowing vis-à-vis
the rest of the world to below 16% of GDP by
2010.
All in all, uncertainty about the short- to medium-
term economic prospects is unusually high, due to
the fading of earlier main growth drivers and
doubts as to the ability of domestic industry to
contribute to a sustained export-based recovery,
thereby helping to achieve a more balanced growth
path. In the past few years of buoyant activity, the
economy has accumulated major imbalances, as
rapid expansion, based on strong domestic
demand, was fuelled by easy credit conditions and
high FDI inflows. With the external imbalances
persisting and foreign investment falling, the
economy's external position, financed increasingly
through accumulation of debt-creating liabilities, is
likely to pose an additional risk to the outlook.
Inflationary a nd la bo ur marke t pressures ea se
In line with strong labour demand, employment
growth accelerated to around 3¼% in 2008.
Against deteriorating economic activity,
employment growth is expected to turn negative in
2009-2010. The downward trend in unemployment
observed in the past few years should be reversed,
with the unemployment rate close to 8% by the
end of the forecast period. Nominal wage growth
was exceptionally high at over 20% on average in
2008, reflecting tight labour market conditions.Looking ahead, weaker labour demand should ease
wage pressures. Labour productivity is expected to
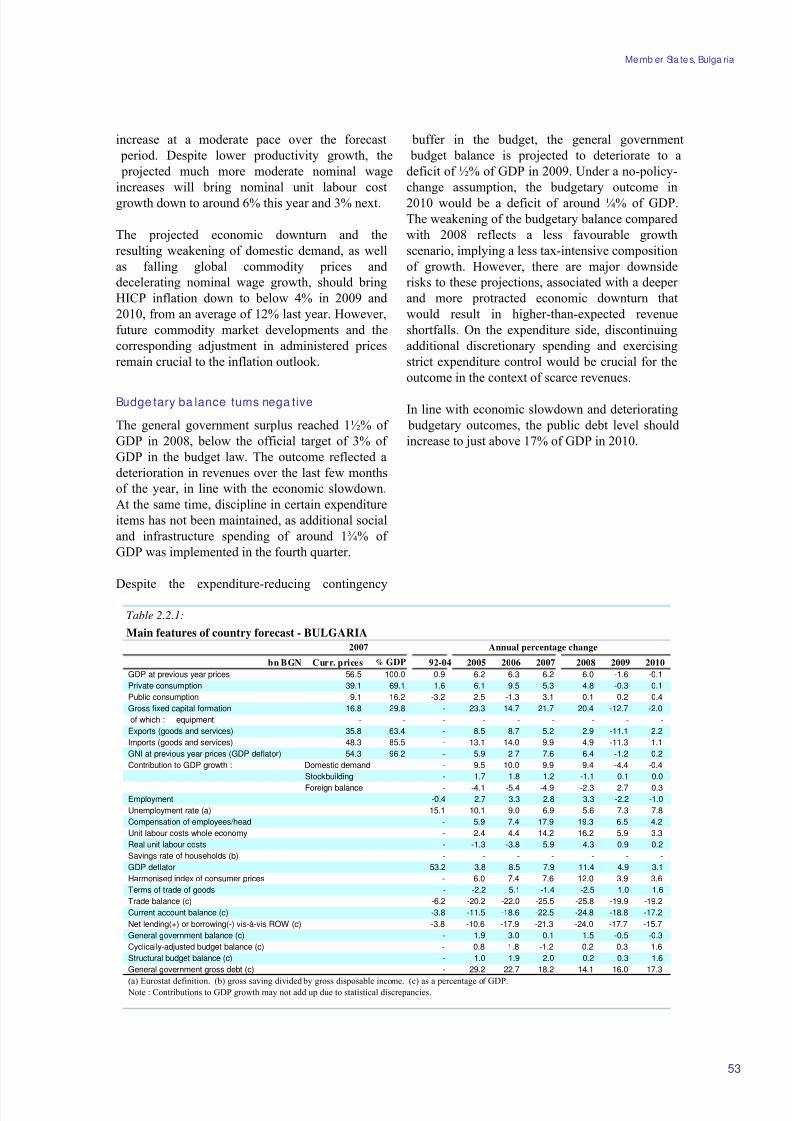
8/14/2019 Economic Forecast 2009
http://slidepdf.com/reader/full/economic-forecast-2009 59/172
Memb er Sta tes, Bulga ria
Table 2.2.1:
Main features of country forecast - BULGARIA
2007 Annual percentage change
bn BGN Curr. prices % GDP 92-04 2005 2006 2007 2008 2009 2010
GDP at previous year prices 56.5 100.0 0.9 6.2 6.3 6.2 6.0 -1.6 -0.1
Private consumption 39.1 69.1 1.6 6.1 9.5 5.3 4.8 -0.3 0.1
Public consumption 9.1 16.2 -3.2 2.5 -1.3 3.1 0.1 0.2 0.4
Gross fixed capital formation 16.8 29.8 - 23.3 14.7 21.7 20.4 -12.7 -2.0
of which : equipment - - - - - - - - -
Exports (goods and services) 35.8 63.4 - 8.5 8.7 5.2 2.9 -11.1 2.2
Imports (goods and services) 48.3 85.5 - 13.1 14.0 9.9 4.9 -11.3 1.1
GNI at previous year prices (GDP deflator) 54.3 96.2 - 5.9 2.7 7.6 6.4 -1.2 0.2
Contribution to GDP growth : Domestic demand - 9.5 10.0 9.9 9.4 -4.4 -0.4
Stockbuilding - 1.7 1.8 1.2 -1.1 0.1 0.0
Foreign balance - -4.1 -5.4 -4.9 -2.3 2.7 0.3Employment -0.4 2.7 3.3 2.8 3.3 -2.2 -1.0
Unemployment rate (a) 15.1 10.1 9.0 6.9 5.6 7.3 7.8
Compensation of employees/head - 5.9 7.4 17.9 19.3 6.5 4.2
Unit labour costs whole economy - 2.4 4.4 14.2 16.2 5.9 3.3
Real unit labour costs - -1.3 -3.8 5.9 4.3 0.9 0.2
Savings rate of households (b) - - - - - - -
GDP deflator 53.2 3.8 8.5 7.9 11.4 4.9 3.1
Harmonised index of consumer prices - 6.0 7.4 7.6 12.0 3.9 3.6
Terms of trade of goods - -2.2 5.1 -1.4 -2.5 1.0 1.6
Trade balance (c) -6.2 -20.2 -22.0 -25.5 -25.8 -19.9 -19.2
Current account balance (c) -3.8 -11.5 -18.6 -22.5 -24.8 -18.8 -17.2
Net lending(+) or borrowing(-) vis-à-vis ROW (c) -3.8 -10.6 -17.9 -21.3 -24.0 -17.7 -15.7
General government balance (c) - 1.9 3.0 0.1 1.5 -0.5 -0.3
Cyclically-adjusted budget balance (c) - 0.8 1.8 -1.2 0.2 0.3 1.6
Structural budget balance (c) - 1.0 1.9 2.0 0.2 0.3 1.6
General government gross debt (c) - 29.2 22.7 18.2 14.1 16.0 17.3
(a) Eurostat definition. (b) gross saving divided by gross disposable income. (c) as a percentage of GDP.Note : Contributions to GDP growth may not add up due to statistical discrepancies.
53
increase at a moderate pace over the forecast
period. Despite lower productivity growth, the
projected much more moderate nominal wage
increases will bring nominal unit labour cost
growth down to around 6% this year and 3% next.
The projected economic downturn and the
resulting weakening of domestic demand, as well
as falling global commodity prices and
decelerating nominal wage growth, should bring
HICP inflation down to below 4% in 2009 and
2010, from an average of 12% last year. However,
future commodity market developments and the
corresponding adjustment in administered prices
remain crucial to the inflation outlook.
Budge tary ba lance turns nega tive
The general government surplus reached 1½% of
GDP in 2008, below the official target of 3% of
GDP in the budget law. The outcome reflected a
deterioration in revenues over the last few months
of the year, in line with the economic slowdown.
At the same time, discipline in certain expenditure
items has not been maintained, as additional social
and infrastructure spending of around 1¾% of
GDP was implemented in the fourth quarter.
Despite the expenditure-reducing contingency
buffer in the budget, the general government
budget balance is projected to deteriorate to a
deficit of ½% of GDP in 2009. Under a no-policy-
change assumption, the budgetary outcome in
2010 would be a deficit of around ¼% of GDP.
The weakening of the budgetary balance compared
with 2008 reflects a less favourable growth
scenario, implying a less tax-intensive composition
of growth. However, there are major downside
risks to these projections, associated with a deeper
and more protracted economic downturn that
would result in higher-than-expected revenue
shortfalls. On the expenditure side, discontinuing
additional discretionary spending and exercising
strict expenditure control would be crucial for the
outcome in the context of scarce revenues.
In line with economic slowdown and deteriorating
budgetary outcomes, the public debt level should
increase to just above 17% of GDP in 2010.
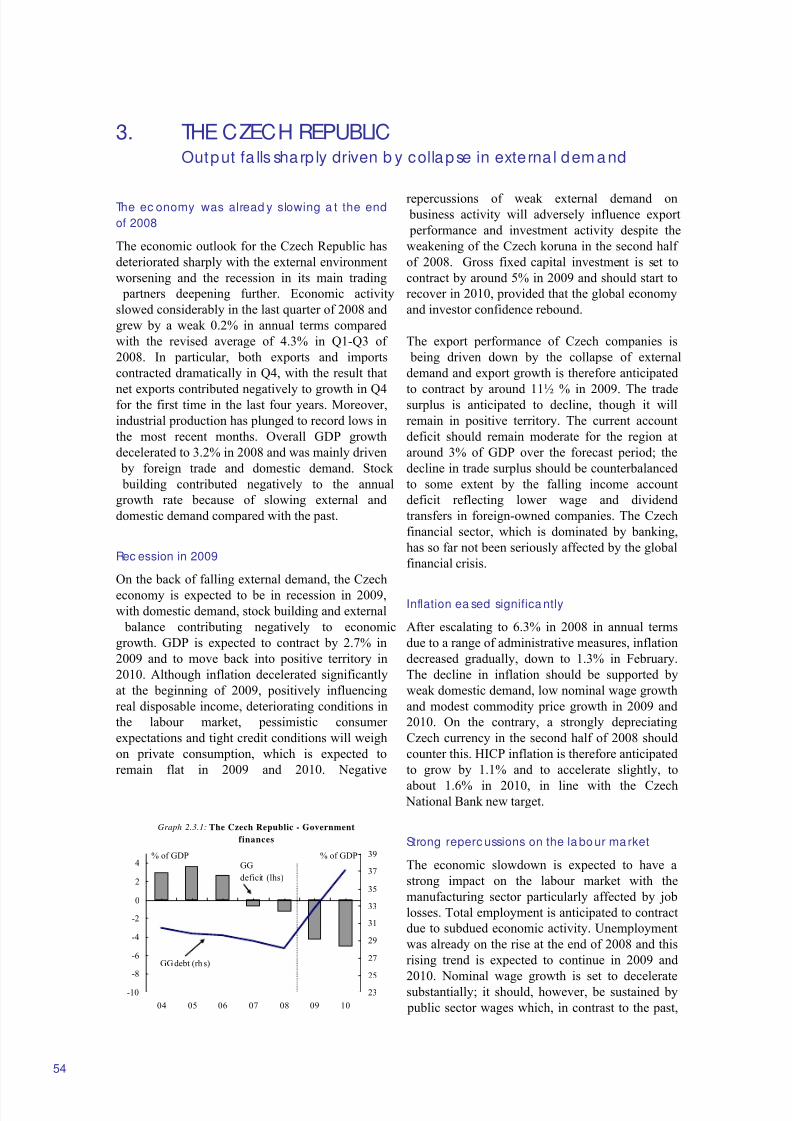
8/14/2019 Economic Forecast 2009
http://slidepdf.com/reader/full/economic-forecast-2009 60/172
3. THE CZECH REPUBLICOutput fa lls sharp ly driven b y collapse in externa l dem and
Graph 2.3.1: The Czech Republic - Government
finances
-10
-8
-6
-4
-2
0
2
4
04 05 06 07 08 09 10
23
25
27
29
31
33
35
37
39% of GDPGG
deficit (lhs)
GG debt (rh s)
% of GDP
54
The ec onomy was alread y slowing a t the end
of 2008
The economic outlook for the Czech Republic has
deteriorated sharply with the external environment
worsening and the recession in its main trading
partners deepening further. Economic activity
slowed considerably in the last quarter of 2008 and
grew by a weak 0.2% in annual terms compared
with the revised average of 4.3% in Q1-Q3 of
2008. In particular, both exports and imports
contracted dramatically in Q4, with the result that
net exports contributed negatively to growth in Q4for the first time in the last four years. Moreover,
industrial production has plunged to record lows in
the most recent months. Overall GDP growth
decelerated to 3.2% in 2008 and was mainly driven
by foreign trade and domestic demand. Stock
building contributed negatively to the annual
growth rate because of slowing external and
domestic demand compared with the past.
Rec ession in 2009
On the back of falling external demand, the Czech
economy is expected to be in recession in 2009,
with domestic demand, stock building and external
balance contributing negatively to economic
growth. GDP is expected to contract by 2.7% in
2009 and to move back into positive territory in
2010. Although inflation decelerated significantly
at the beginning of 2009, positively influencing
real disposable income, deteriorating conditions in
the labour market, pessimistic consumer
expectations and tight credit conditions will weigh
on private consumption, which is expected to
remain flat in 2009 and 2010. Negative
repercussions of weak external demand on business activity will adversely influence export
performance and investment activity despite the
weakening of the Czech koruna in the second half
of 2008. Gross fixed capital investment is set to
contract by around 5% in 2009 and should start to
recover in 2010, provided that the global economy
and investor confidence rebound.
The export performance of Czech companies is
being driven down by the collapse of external
demand and export growth is therefore anticipated
to contract by around 11½ % in 2009. The tradesurplus is anticipated to decline, though it will
remain in positive territory. The current account
deficit should remain moderate for the region at
around 3% of GDP over the forecast period; the
decline in trade surplus should be counterbalanced
to some extent by the falling income account
deficit reflecting lower wage and dividend
transfers in foreign-owned companies. The Czech
financial sector, which is dominated by banking,
has so far not been seriously affected by the global
financial crisis.
Inflation ea sed significa ntly
After escalating to 6.3% in 2008 in annual terms
due to a range of administrative measures, inflation
decreased gradually, down to 1.3% in February.
The decline in inflation should be supported by
weak domestic demand, low nominal wage growth
and modest commodity price growth in 2009 and
2010. On the contrary, a strongly depreciating
Czech currency in the second half of 2008 should
counter this. HICP inflation is therefore anticipated
to grow by 1.1% and to accelerate slightly, to
about 1.6% in 2010, in line with the Czech National Bank new target.
Strong reperc ussions on the la bour market
The economic slowdown is expected to have a
strong impact on the labour market with the
manufacturing sector particularly affected by job
losses. Total employment is anticipated to contract
due to subdued economic activity. Unemployment
was already on the rise at the end of 2008 and this
rising trend is expected to continue in 2009 and
2010. Nominal wage growth is set to deceleratesubstantially; it should, however, be sustained by
public sector wages which, in contrast to the past,
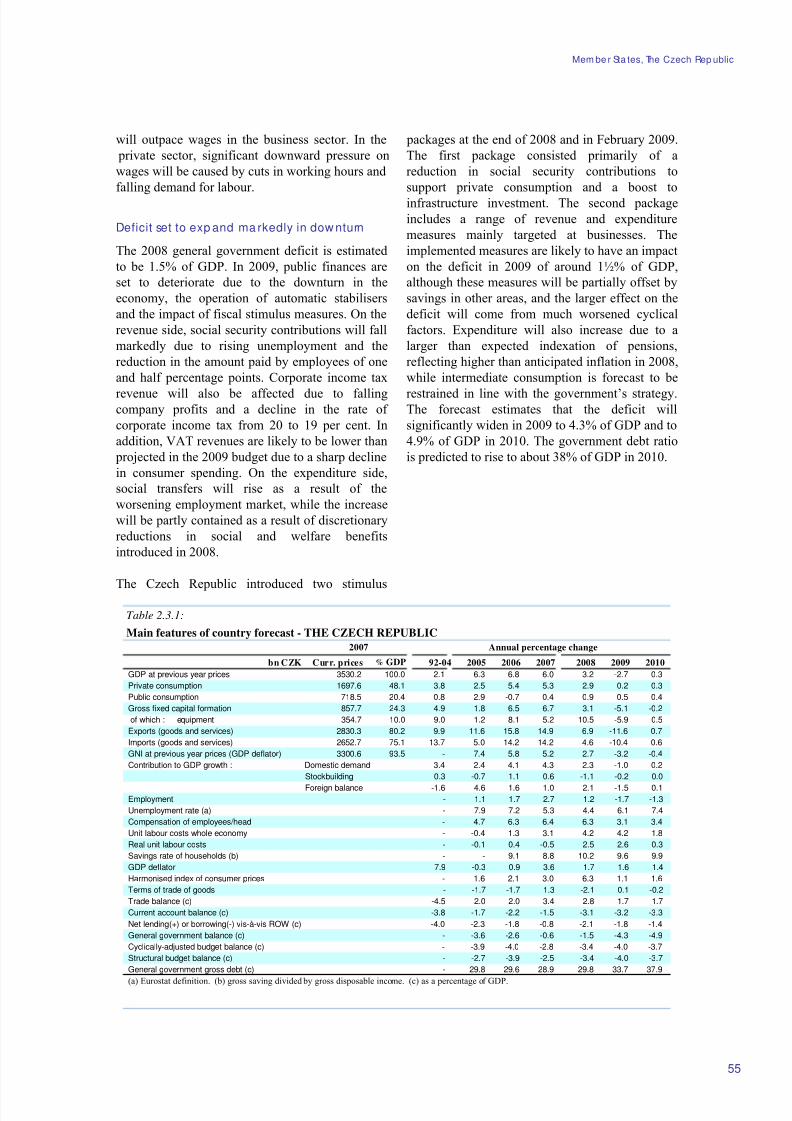
8/14/2019 Economic Forecast 2009
http://slidepdf.com/reader/full/economic-forecast-2009 61/172
Mem be r Sta tes, The Czech Rep ublic
Table 2.3.1:
Main features of country forecast - THE CZECH REPUBLIC
2007 Annual percentage change
bn CZK Curr. prices % GDP 92-04 2005 2006 2007 2008 2009 2010
GDP at previous year prices 3530.2 100.0 2.1 6.3 6.8 6.0 3.2 -2.7 0.3
Private consumption 1697.6 48.1 3.8 2.5 5.4 5.3 2.9 0.2 0.3
Public consumption 718.5 20.4 0.8 2.9 -0.7 0.4 0.9 0.5 0.4
Gross fixed capital formation 857.7 24.3 4.9 1.8 6.5 6.7 3.1 -5.1 -0.2
of which : equipment 354.7 10.0 9.0 1.2 8.1 5.2 10.5 -5.9 -0.5
Exports (goods and services) 2830.3 80.2 9.9 11.6 15.8 14.9 6.9 -11.6 0.7
Imports (goods and services) 2652.7 75.1 13.7 5.0 14.2 14.2 4.6 -10.4 0.6
GNI at previous year prices (GDP deflator) 3300.6 93.5 - 7.4 5.8 5.2 2.7 -3.2 -0.4
Contribution to GDP growth : Domestic demand 3.4 2.4 4.1 4.3 2.3 -1.0 0.2
Stockbuilding 0.3 -0.7 1.1 0.6 -1.1 -0.2 0.0
Foreign balance -1.6 4.6 1.6 1.0 2.1 -1.5 0.1Employment - 1.1 1.7 2.7 1.2 -1.7 -1.3
Unemployment rate (a) - 7.9 7.2 5.3 4.4 6.1 7.4
Compensation of employees/head - 4.7 6.3 6.4 6.3 3.1 3.4
Unit labour costs whole economy - -0.4 1.3 3.1 4.2 4.2 1.8
Real unit labour costs - -0.1 0.4 -0.5 2.5 2.6 0.3
Savings rate of households (b) - - 9.1 8.8 10.2 9.6 9.9
GDP deflator 7.9 -0.3 0.9 3.6 1.7 1.6 1.4
Harmonised index of consumer prices - 1.6 2.1 3.0 6.3 1.1 1.6
Terms of trade of goods - -1.7 -1.7 1.3 -2.1 0.1 -0.2
Trade balance (c) -4.5 2.0 2.0 3.4 2.8 1.7 1.7
Current account balance (c) -3.8 -1.7 -2.2 -1.5 -3.1 -3.2 -3.3
Net lending(+) or borrowing(-) vis-à-vis ROW (c) -4.0 -2.3 -1.8 -0.8 -2.1 -1.8 -1.4
General government balance (c) - -3.6 -2.6 -0.6 -1.5 -4.3 -4.9
Cyclically-adjusted budget balance (c) - -3.9 -4.0 -2.8 -3.4 -4.0 -3.7
Structural budget balance (c) - -2.7 -3.9 -2.5 -3.4 -4.0 -3.7
General government gross debt (c) - 29.8 29.6 28.9 29.8 33.7 37.9
(a) Eurostat definition. (b) gross saving divided by gross disposable income. (c) as a percentage of GDP.
55
will outpace wages in the business sector. In the
private sector, significant downward pressure on
wages will be caused by cuts in working hours and
falling demand for labour.
Deficit set to exp and ma rkedly in dow nturn
The 2008 general government deficit is estimated
to be 1.5% of GDP. In 2009, public finances are
set to deteriorate due to the downturn in the
economy, the operation of automatic stabilisers
and the impact of fiscal stimulus measures. On the
revenue side, social security contributions will fall
markedly due to rising unemployment and the
reduction in the amount paid by employees of one
and half percentage points. Corporate income tax
revenue will also be affected due to fallingcompany profits and a decline in the rate of
corporate income tax from 20 to 19 per cent. In
addition, VAT revenues are likely to be lower than
projected in the 2009 budget due to a sharp decline
in consumer spending. On the expenditure side,
social transfers will rise as a result of the
worsening employment market, while the increase
will be partly contained as a result of discretionary
reductions in social and welfare benefits
introduced in 2008.
The Czech Republic introduced two stimulus
packages at the end of 2008 and in February 2009.
The first package consisted primarily of a
reduction in social security contributions to
support private consumption and a boost to
infrastructure investment. The second package
includes a range of revenue and expenditure
measures mainly targeted at businesses. The
implemented measures are likely to have an impact
on the deficit in 2009 of around 1½% of GDP,
although these measures will be partially offset by
savings in other areas, and the larger effect on the
deficit will come from much worsened cyclical
factors. Expenditure will also increase due to a
larger than expected indexation of pensions,
reflecting higher than anticipated inflation in 2008,
while intermediate consumption is forecast to be
restrained in line with the government’s strategy.The forecast estimates that the deficit will
significantly widen in 2009 to 4.3% of GDP and to
4.9% of GDP in 2010. The government debt ratio
is predicted to rise to about 38% of GDP in 2010.
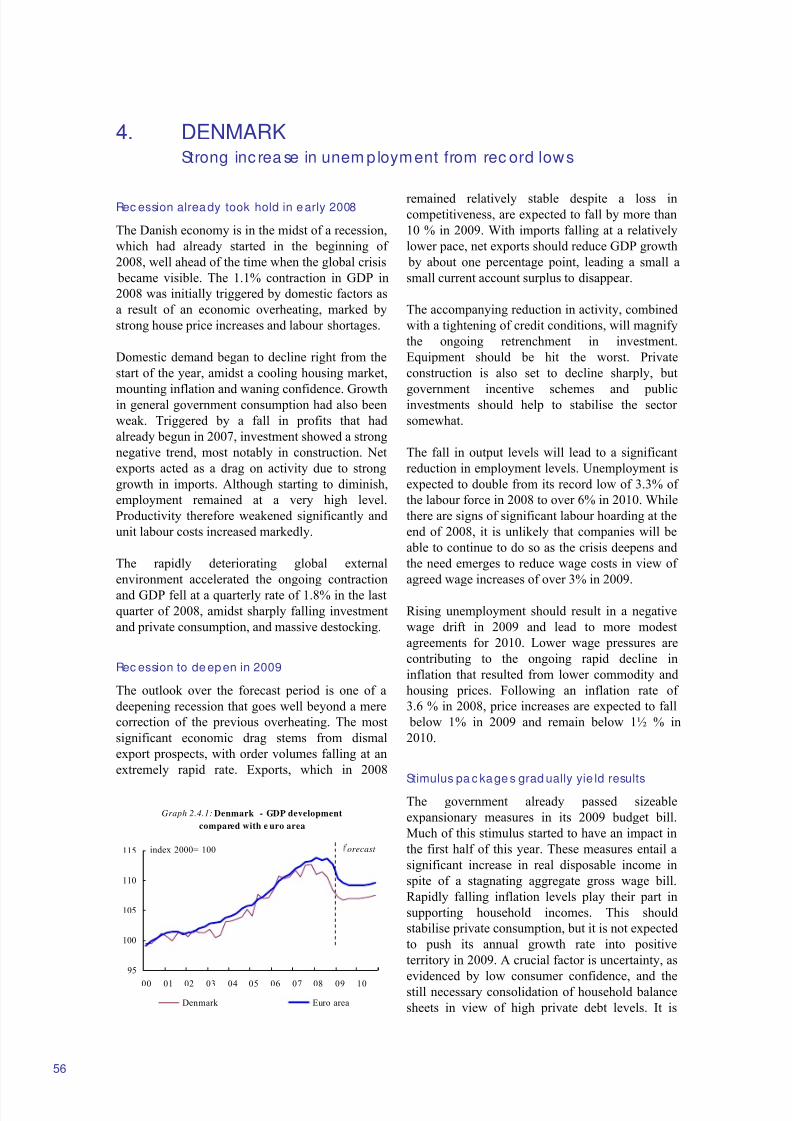
8/14/2019 Economic Forecast 2009
http://slidepdf.com/reader/full/economic-forecast-2009 62/172
4. DENMARKStrong inc rea se in unem ployment from rec ord lows
Graph 2.4.1: Denmark - GDP development
compared with e uro area
95
100
105
110
115
00 01 02 03 04 05 06 07 08 09 10
Denmark Euro area
orecast index 2000= 100
56
Rec ession already took hold in early 2008
The Danish economy is in the midst of a recession,
which had already started in the beginning of
2008, well ahead of the time when the global crisis
became visible. The 1.1% contraction in GDP in
2008 was initially triggered by domestic factors as
a result of an economic overheating, marked by
strong house price increases and labour shortages.
Domestic demand began to decline right from the
start of the year, amidst a cooling housing market,
mounting inflation and waning confidence. Growthin general government consumption had also been
weak. Triggered by a fall in profits that had
already begun in 2007, investment showed a strong
negative trend, most notably in construction. Net
exports acted as a drag on activity due to strong
growth in imports. Although starting to diminish,
employment remained at a very high level.
Productivity therefore weakened significantly and
unit labour costs increased markedly.
The rapidly deteriorating global external
environment accelerated the ongoing contraction
and GDP fell at a quarterly rate of 1.8% in the last
quarter of 2008, amidst sharply falling investment
and private consumption, and massive destocking.
Rec ession to de epen in 2009
The outlook over the forecast period is one of a
deepening recession that goes well beyond a mere
correction of the previous overheating. The most
significant economic drag stems from dismal
export prospects, with order volumes falling at an
extremely rapid rate. Exports, which in 2008
remained relatively stable despite a loss incompetitiveness, are expected to fall by more than
10 % in 2009. With imports falling at a relatively
lower pace, net exports should reduce GDP growth
by about one percentage point, leading a small a
small current account surplus to disappear.
The accompanying reduction in activity, combined
with a tightening of credit conditions, will magnify
the ongoing retrenchment in investment.
Equipment should be hit the worst. Private
construction is also set to decline sharply, but
government incentive schemes and publicinvestments should help to stabilise the sector
somewhat.
The fall in output levels will lead to a significant
reduction in employment levels. Unemployment is
expected to double from its record low of 3.3% of
the labour force in 2008 to over 6% in 2010. While
there are signs of significant labour hoarding at the
end of 2008, it is unlikely that companies will be
able to continue to do so as the crisis deepens and
the need emerges to reduce wage costs in view of
agreed wage increases of over 3% in 2009.
Rising unemployment should result in a negative
wage drift in 2009 and lead to more modest
agreements for 2010. Lower wage pressures are
contributing to the ongoing rapid decline in
inflation that resulted from lower commodity and
housing prices. Following an inflation rate of
3.6 % in 2008, price increases are expected to fall
below 1% in 2009 and remain below 1½ % in
2010.
Stimulus pa c kage s grad ually yie ld results
The government already passed sizeable
expansionary measures in its 2009 budget bill.
Much of this stimulus started to have an impact in
the first half of this year. These measures entail a
significant increase in real disposable income in
spite of a stagnating aggregate gross wage bill.
Rapidly falling inflation levels play their part in
supporting household incomes. This should
stabilise private consumption, but it is not expected
to push its annual growth rate into positive
territory in 2009. A crucial factor is uncertainty, as
evidenced by low consumer confidence, and thestill necessary consolidation of household balance
sheets in view of high private debt levels. It is
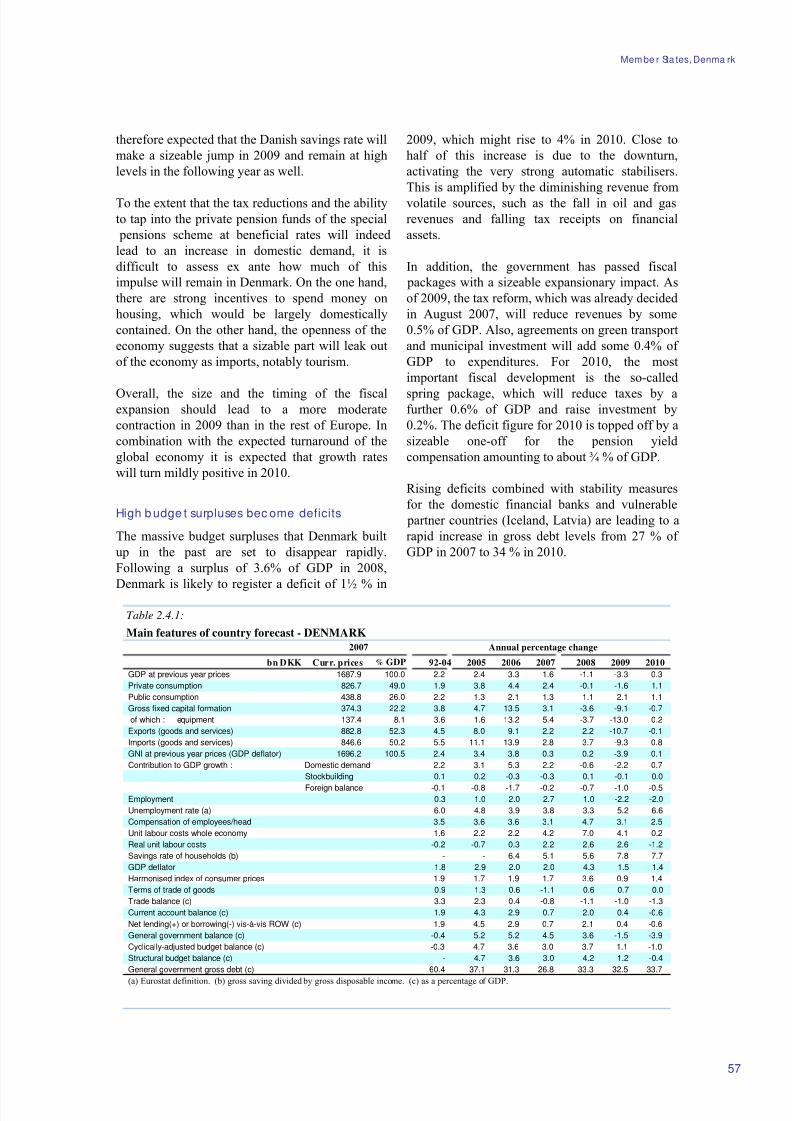
8/14/2019 Economic Forecast 2009
http://slidepdf.com/reader/full/economic-forecast-2009 63/172
Mem be r Sta tes, Denma rk
Table 2.4.1:
Main features of country forecast - DENMARK
2007 Annual percentage change
bn DKK Curr. prices % GDP 92-04 2005 2006 2007 2008 2009 2010
GDP at previous year prices 1687.9 100.0 2.2 2.4 3.3 1.6 -1.1 -3.3 0.3
Private consumption 826.7 49.0 1.9 3.8 4.4 2.4 -0.1 -1.6 1.1
Public consumption 438.8 26.0 2.2 1.3 2.1 1.3 1.1 2.1 1.1
Gross fixed capital formation 374.3 22.2 3.8 4.7 13.5 3.1 -3.6 -9.1 -0.7
of which : equipment 137.4 8.1 3.6 1.6 13.2 5.4 -3.7 -13.0 0.2
Exports (goods and services) 882.8 52.3 4.5 8.0 9.1 2.2 2.2 -10.7 -0.1
Imports (goods and services) 846.6 50.2 5.5 11.1 13.9 2.8 3.7 -9.3 0.8
GNI at previous year prices (GDP deflator) 1696.2 100.5 2.4 3.4 3.8 0.3 0.2 -3.9 0.1
Contribution to GDP growth : Domestic demand 2.2 3.1 5.3 2.2 -0.6 -2.2 0.7
Stockbuilding 0.1 0.2 -0.3 -0.3 0.1 -0.1 0.0
Foreign balance -0.1 -0.8 -1.7 -0.2 -0.7 -1.0 -0.5Employment 0.3 1.0 2.0 2.7 1.0 -2.2 -2.0
Unemployment rate (a) 6.0 4.8 3.9 3.8 3.3 5.2 6.6
Compensation of employees/head 3.5 3.6 3.6 3.1 4.7 3.1 2.5
Unit labour costs whole economy 1.6 2.2 2.2 4.2 7.0 4.1 0.2
Real unit labour costs -0.2 -0.7 0.3 2.2 2.6 2.6 -1.2
Savings rate of households (b) - - 6.4 5.1 5.6 7.8 7.7
GDP deflator 1.8 2.9 2.0 2.0 4.3 1.5 1.4
Harmonised index of consumer prices 1.9 1.7 1.9 1.7 3.6 0.9 1.4
Terms of trade of goods 0.9 1.3 0.6 -1.1 0.6 0.7 0.0
Trade balance (c) 3.3 2.3 0.4 -0.8 -1.1 -1.0 -1.3
Current account balance (c) 1.9 4.3 2.9 0.7 2.0 0.4 -0.6
Net lending(+) or borrowing(-) vis-à-vis ROW (c) 1.9 4.5 2.9 0.7 2.1 0.4 -0.6
General government balance (c) -0.4 5.2 5.2 4.5 3.6 -1.5 -3.9
Cyclically-adjusted budget balance (c) -0.3 4.7 3.6 3.0 3.7 1.1 -1.0
Structural budget balance (c) - 4.7 3.6 3.0 4.2 1.2 -0.4
General government gross debt (c) 60.4 37.1 31.3 26.8 33.3 32.5 33.7
(a) Eurostat definition. (b) gross saving divided by gross disposable income. (c) as a percentage of GDP.
57
therefore expected that the Danish savings rate will
make a sizeable jump in 2009 and remain at high
levels in the following year as well.
To the extent that the tax reductions and the ability
to tap into the private pension funds of the special
pensions scheme at beneficial rates will indeed
lead to an increase in domestic demand, it is
difficult to assess ex ante how much of this
impulse will remain in Denmark. On the one hand,
there are strong incentives to spend money on
housing, which would be largely domestically
contained. On the other hand, the openness of the
economy suggests that a sizable part will leak out
of the economy as imports, notably tourism.
Overall, the size and the timing of the fiscalexpansion should lead to a more moderate
contraction in 2009 than in the rest of Europe. In
combination with the expected turnaround of the
global economy it is expected that growth rates
will turn mildly positive in 2010.
High b udge t surpluses bec ome deficits
The massive budget surpluses that Denmark built
up in the past are set to disappear rapidly.
Following a surplus of 3.6% of GDP in 2008,
Denmark is likely to register a deficit of 1½ % in
2009, which might rise to 4% in 2010. Close to
half of this increase is due to the downturn,
activating the very strong automatic stabilisers.
This is amplified by the diminishing revenue from
volatile sources, such as the fall in oil and gas
revenues and falling tax receipts on financial
assets.
In addition, the government has passed fiscal
packages with a sizeable expansionary impact. As
of 2009, the tax reform, which was already decided
in August 2007, will reduce revenues by some
0.5% of GDP. Also, agreements on green transport
and municipal investment will add some 0.4% of
GDP to expenditures. For 2010, the most
important fiscal development is the so-called
spring package, which will reduce taxes by afurther 0.6% of GDP and raise investment by
0.2%. The deficit figure for 2010 is topped off by a
sizeable one-off for the pension yield
compensation amounting to about ¾ % of GDP.
Rising deficits combined with stability measures
for the domestic financial banks and vulnerable
partner countries (Iceland, Latvia) are leading to a
rapid increase in gross debt levels from 27 % of
GDP in 2007 to 34 % in 2010.
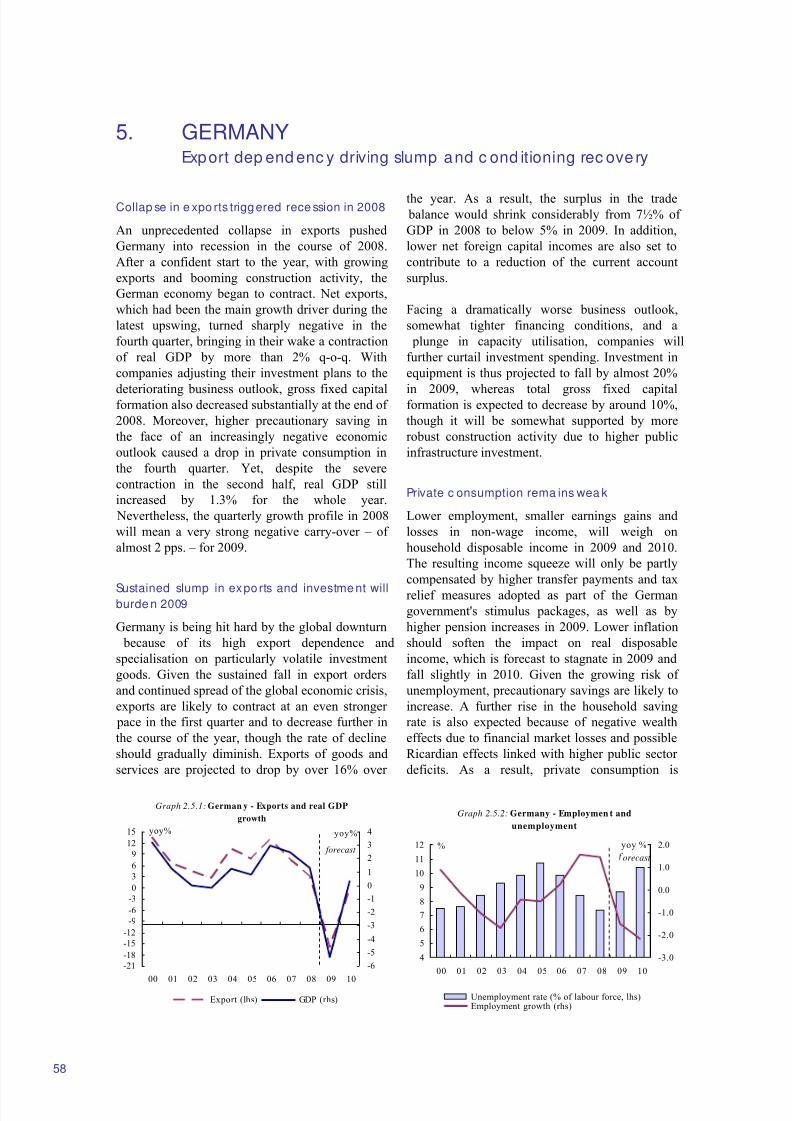
8/14/2019 Economic Forecast 2009
http://slidepdf.com/reader/full/economic-forecast-2009 64/172
5. GERMANYExport dep end enc y driving slump and c ond itioning rec ove ry
Graph 2.5.2: Germany - Employmen t and
unemployment
4
5
6
7
8
9
10
11
12
00 01 02 03 04 05 06 07 08 09 10
-3.0
-2.0
-1.0
0.0
1.0
2.0
Unemployment rate (% of labour force, lhs)Employment growth (rhs)
orecast
yoy %%
Graph 2.5.1: German y - Exports and real GDP
growth
-21-18
-15
-12
-9
-6
-3
0
3
6
9
12
15
00 01 02 03 04 05 06 07 08 09 10
yoy%
-6
-5
-4
-3
-2
-1
0
1
2
3
4yoy%
Export (lhs) GDP (rhs)
forecast
58
Collap se in e xpo rts triggered rece ssion in 2008
An unprecedented collapse in exports pushed
Germany into recession in the course of 2008.
After a confident start to the year, with growing
exports and booming construction activity, the
German economy began to contract. Net exports,
which had been the main growth driver during the
latest upswing, turned sharply negative in the
fourth quarter, bringing in their wake a contraction
of real GDP by more than 2% q-o-q. With
companies adjusting their investment plans to the
deteriorating business outlook, gross fixed capitalformation also decreased substantially at the end of
2008. Moreover, higher precautionary saving in
the face of an increasingly negative economic
outlook caused a drop in private consumption in
the fourth quarter. Yet, despite the severe
contraction in the second half, real GDP still
increased by 1.3% for the whole year.
Nevertheless, the quarterly growth profile in 2008
will mean a very strong negative carry-over – of
almost 2 pps. – for 2009.
Sustained slump in exports and investme nt willburde n 2009
Germany is being hit hard by the global downturn
because of its high export dependence and
specialisation on particularly volatile investment
goods. Given the sustained fall in export orders
and continued spread of the global economic crisis,
exports are likely to contract at an even stronger
pace in the first quarter and to decrease further in
the course of the year, though the rate of decline
should gradually diminish. Exports of goods and
services are projected to drop by over 16% over
the year. As a result, the surplus in the trade balance would shrink considerably from 7½% of
GDP in 2008 to below 5% in 2009. In addition,
lower net foreign capital incomes are also set to
contribute to a reduction of the current account
surplus.
Facing a dramatically worse business outlook,
somewhat tighter financing conditions, and a
plunge in capacity utilisation, companies will
further curtail investment spending. Investment in
equipment is thus projected to fall by almost 20%
in 2009, whereas total gross fixed capitalformation is expected to decrease by around 10%,
though it will be somewhat supported by more
robust construction activity due to higher public
infrastructure investment.
Private c onsumption rema ins wea k
Lower employment, smaller earnings gains and
losses in non-wage income, will weigh on
household disposable income in 2009 and 2010.
The resulting income squeeze will only be partly
compensated by higher transfer payments and tax
relief measures adopted as part of the German
government's stimulus packages, as well as by
higher pension increases in 2009. Lower inflation
should soften the impact on real disposable
income, which is forecast to stagnate in 2009 and
fall slightly in 2010. Given the growing risk of
unemployment, precautionary savings are likely to
increase. A further rise in the household saving
rate is also expected because of negative wealth
effects due to financial market losses and possible
Ricardian effects linked with higher public sector
deficits. As a result, private consumption is
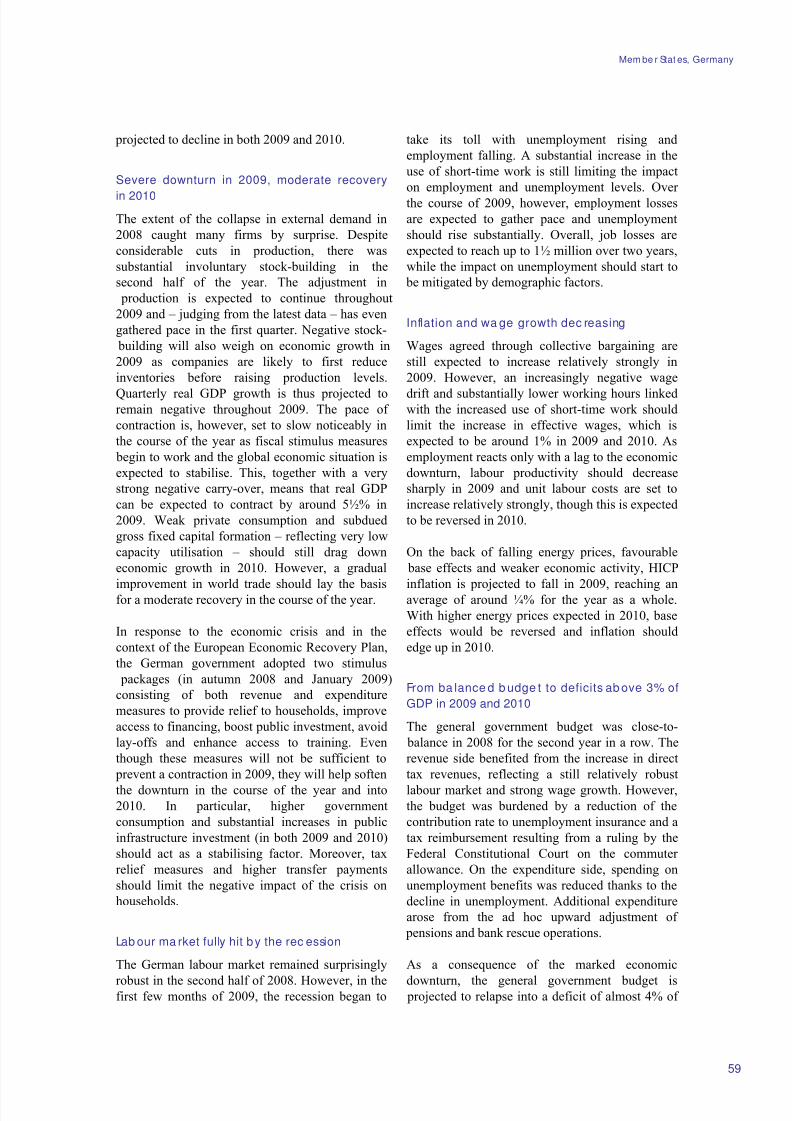
8/14/2019 Economic Forecast 2009
http://slidepdf.com/reader/full/economic-forecast-2009 65/172
Mem be r Stat es, Germany
59
projected to decline in both 2009 and 2010.
Severe downturn in 2009, moderate recovery
in 2010
The extent of the collapse in external demand in
2008 caught many firms by surprise. Despite
considerable cuts in production, there was
substantial involuntary stock-building in the
second half of the year. The adjustment in
production is expected to continue throughout
2009 and – judging from the latest data – has even
gathered pace in the first quarter. Negative stock-
building will also weigh on economic growth in
2009 as companies are likely to first reduce
inventories before raising production levels.
Quarterly real GDP growth is thus projected toremain negative throughout 2009. The pace of
contraction is, however, set to slow noticeably in
the course of the year as fiscal stimulus measures
begin to work and the global economic situation is
expected to stabilise. This, together with a very
strong negative carry-over, means that real GDP
can be expected to contract by around 5½% in
2009. Weak private consumption and subdued
gross fixed capital formation – reflecting very low
capacity utilisation – should still drag down
economic growth in 2010. However, a gradual
improvement in world trade should lay the basisfor a moderate recovery in the course of the year.
In response to the economic crisis and in the
context of the European Economic Recovery Plan,
the German government adopted two stimulus
packages (in autumn 2008 and January 2009)
consisting of both revenue and expenditure
measures to provide relief to households, improve
access to financing, boost public investment, avoid
lay-offs and enhance access to training. Even
though these measures will not be sufficient to
prevent a contraction in 2009, they will help soften
the downturn in the course of the year and into2010. In particular, higher government
consumption and substantial increases in public
infrastructure investment (in both 2009 and 2010)
should act as a stabilising factor. Moreover, tax
relief measures and higher transfer payments
should limit the negative impact of the crisis on
households.
Lab our ma rket fully hit by the rec ession
The German labour market remained surprisingly
robust in the second half of 2008. However, in thefirst few months of 2009, the recession began to
take its toll with unemployment rising and
employment falling. A substantial increase in the
use of short-time work is still limiting the impact
on employment and unemployment levels. Over
the course of 2009, however, employment losses
are expected to gather pace and unemployment
should rise substantially. Overall, job losses are
expected to reach up to 1½ million over two years,
while the impact on unemployment should start to
be mitigated by demographic factors.
Inflation and wa ge growth dec reasing
Wages agreed through collective bargaining are
still expected to increase relatively strongly in
2009. However, an increasingly negative wage
drift and substantially lower working hours linkedwith the increased use of short-time work should
limit the increase in effective wages, which is
expected to be around 1% in 2009 and 2010. As
employment reacts only with a lag to the economic
downturn, labour productivity should decrease
sharply in 2009 and unit labour costs are set to
increase relatively strongly, though this is expected
to be reversed in 2010.
On the back of falling energy prices, favourable
base effects and weaker economic activity, HICP
inflation is projected to fall in 2009, reaching anaverage of around ¼% for the year as a whole.
With higher energy prices expected in 2010, base
effects would be reversed and inflation should
edge up in 2010.
From ba lance d b udge t to deficits ab ove 3% of
GDP in 2009 and 2010
The general government budget was close-to-
balance in 2008 for the second year in a row. The
revenue side benefited from the increase in direct
tax revenues, reflecting a still relatively robust
labour market and strong wage growth. However,the budget was burdened by a reduction of the
contribution rate to unemployment insurance and a
tax reimbursement resulting from a ruling by the
Federal Constitutional Court on the commuter
allowance. On the expenditure side, spending on
unemployment benefits was reduced thanks to the
decline in unemployment. Additional expenditure
arose from the ad hoc upward adjustment of
pensions and bank rescue operations.
As a consequence of the marked economic
downturn, the general government budget is projected to relapse into a deficit of almost 4% of
8/14/2019 Economic Forecast 2009
http://slidepdf.com/reader/full/economic-forecast-2009 66/172
Econo mic Forec ast, Spring 2009
Table 2.5.1:
Main features of country forecast - GERMANY
2007 Annual percentage change
bn Euro Curr. prices % GDP 92-04 2005 2006 2007 2008 2009 2010
GDP at previous year prices 2422.9 100.0 1.4 0.8 3.0 2.5 1.3 -5.4 0.3
Private consumption 1373.7 56.7 1.4 0.2 1.0 -0.4 -0.1 -0.5 -0.7
Public consumption 435.6 18.0 1.4 0.4 0.6 2.2 2.0 2.0 1.8
Gross fixed capital formation 453.5 18.7 0.4 1.1 7.7 4.3 4.4 -10.3 -0.8
of which : equipment 189.4 7.8 1.0 6.0 11.1 6.9 5.3 -19.7 -5.5
Exports (goods and services) 1137.2 46.9 5.8 7.7 12.7 7.5 2.7 -16.1 -0.4
Imports (goods and services) 966.2 39.9 4.9 6.5 11.9 5.0 4.0 -10.8 -1.7
GNI at previous year prices (GDP deflator) 2464.2 101.7 1.4 1.0 3.5 2.4 1.1 -5.5 -0.1
Contribution to GDP growth : Domestic demand 1.2 0.4 2.1 1.0 1.1 -1.9 -0.2
Stockbuilding -0.2 -0.4 -0.1 0.1 0.5 -0.3 0.0
Foreign balance 0.4 0.8 1.0 1.4 -0.3 -3.2 0.5Employment -0.8 -0.5 0.2 1.6 1.4 -1.5 -2.2
Unemployment rate (a) 8.3 10.7 9.8 8.4 7.3 8.6 10.4
Compensation of employees/f.t.e. 3.4 0.5 1.5 1.3 1.9 1.0 0.9
Unit labour costs whole economy 1.2 -0.8 -1.2 0.4 2.1 5.1 -1.5
Real unit labour costs -0.2 -1.5 -1.7 -1.4 0.5 3.8 -2.2
Savings rate of households (b) - - 16.2 16.7 17.2 17.5 17.6
GDP deflator 1.4 0.7 0.5 1.9 1.5 1.2 0.7
Harmonised index of consumer prices - 1.9 1.8 2.3 2.8 0.3 0.7
Terms of trade of goods 0.7 -1.8 -1.8 0.8 -1.0 1.1 -0.6
Trade balance (c) 3.7 7.1 7.1 8.4 7.5 4.8 5.1
Current account balance (c) 0.0 5.3 6.3 7.6 6.6 3.6 3.4
Net lending(+) or borrowing(-) vis-à-vis ROW (c) 0.0 5.3 6.3 7.6 6.6 3.6 3.4
General government balance (c) -2.6 -3.3 -1.5 -0.2 -0.1 -3.9 -5.9
Cyclically-adjusted budget balance (c) -2.6 -2.8 -2.1 -1.5 -1.7 -2.3 -4.0
Structural budget balance (c) - -2.9 -2.1 -1.2 -1.2 -2.4 -3.9
General government gross debt (c) 56.8 67.8 67.6 65.1 65.9 73.4 78.7
(a) Eurostat definition. (b) gross saving divided by gross disposable income. (c) as a percentage of GDP.
60
GDP in 2009, increasing further to around 6% of
GDP in 2010. The deficit is forecast to widen on
the back of sizeable tax revenue losses and higher
expenditure due to automatic stabilisers and two
fiscal stimulus packages amounting to around
1½% of GDP for 2009 and 2% of GDP for 2010.
The most significant budgetary measures on the
revenue side in 2009 are the reduction in social
contribution rates (-0.3% of GDP), income and
investment support measures (-0.3% of GDP) as
well as the re-introduction of the commuter
allowance (-0.1% of GDP). Total government
spending will increase by around 4 pps. of GDP on
the back of additional investment expenditure,
spending in the health-care sector, the
environmental premium and measures in supportof the labour market. In 2010, the tax deductibility
of health-care insurance contributions is expected
to result in tax revenue losses in the order of 0.3%
of GDP and the additional investment expenditure
of around 0.4% of GDP is likely to weigh on the
budget.
In both years, the deterioration of the labour
market is expected to lead to lower tax revenues,
higher unemployment benefits and higher
expenditure on short-time work. In addition, the
2009 budget is likely to be burdened by the
upward adjustment of retirement benefits due to
the ad hoc changes to the pension adjustment
formula a year earlier; in 2010 the modifications
are expected to be reversed. In 2009, temporary
budget relief of around 0.1% of GDP is expected
from a reduction in Germany's contributions to the
EU budget based on the Council decision on own
resources for the EU budget 2007-2013.
The uncertainty related to the financial and
economic crisis poses a risk to Germany's public
finances in the medium term. In addition to the
above-mentioned direct effects, the budget is likely
to be affected indirectly through tax revenue
losses, in particular from profit-related taxes.
The debt ratio is projected to increase from almost66% of GDP in 2008 to around 79% of GDP by
2010 on the back of new borrowing, lower
nominal GDP and the financial market stabilisation
measures at the federal and Länder level. At the
time of the forecast, the effects of the bank rescue
operations on government debt in 2009 were
estimated at around 0.7% of GDP.
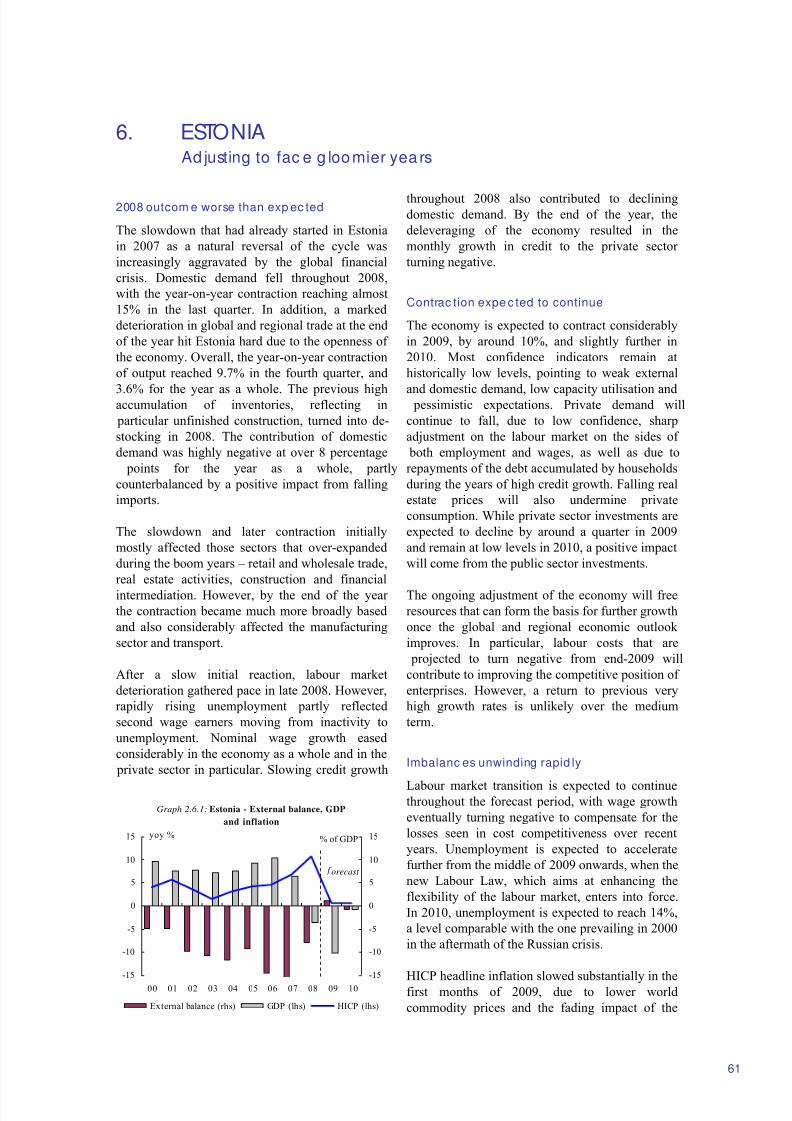
8/14/2019 Economic Forecast 2009
http://slidepdf.com/reader/full/economic-forecast-2009 67/172
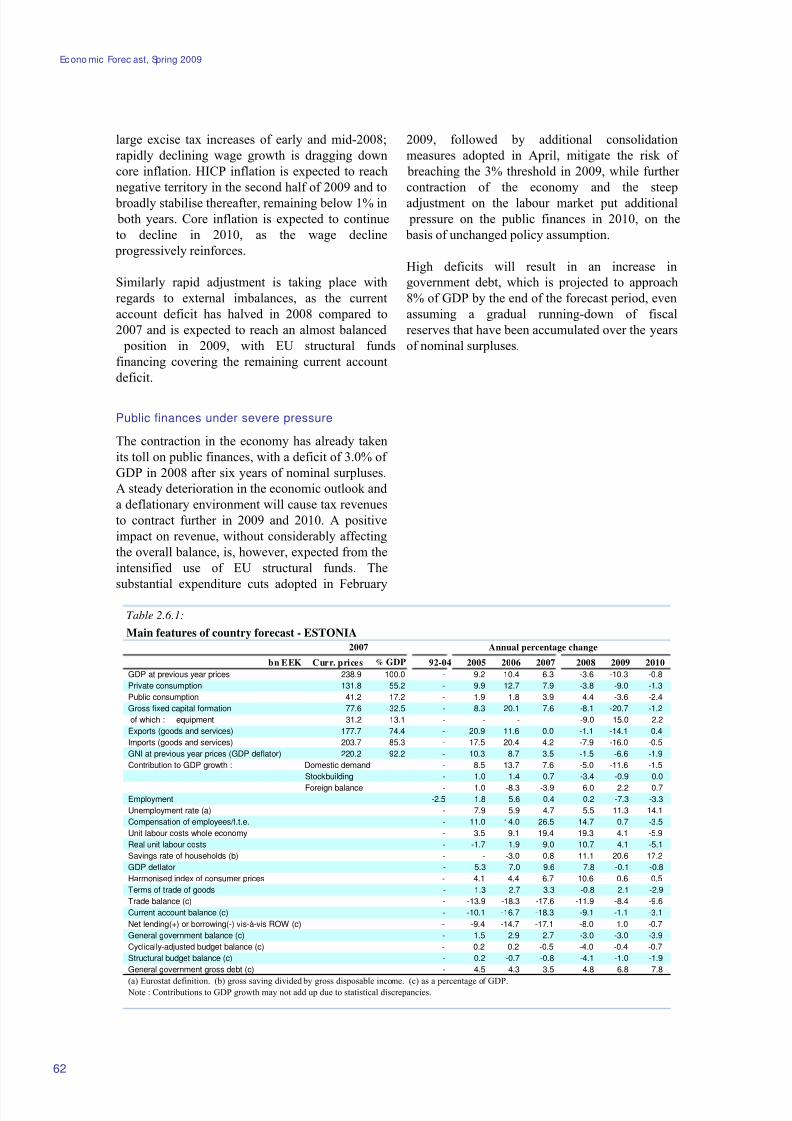
8/14/2019 Economic Forecast 2009
http://slidepdf.com/reader/full/economic-forecast-2009 68/172
Econo mic Forec ast, Spring 2009
Table 2.6.1:
Main features of country forecast - ESTONIA
2007 Annual percentage change
bn EEK Curr. prices % GDP 92-04 2005 2006 2007 2008 2009 2010
GDP at previous year prices 238.9 100.0 - 9.2 10.4 6.3 -3.6 -10.3 -0.8
Private consumption 131.8 55.2 - 9.9 12.7 7.9 -3.8 -9.0 -1.3
Public consumption 41.2 17.2 - 1.9 1.8 3.9 4.4 -3.6 -2.4
Gross fixed capital formation 77.6 32.5 - 8.3 20.1 7.6 -8.1 -20.7 -1.2
of which : equipment 31.2 13.1 - - - - -9.0 -15.0 2.2
Exports (goods and services) 177.7 74.4 - 20.9 11.6 0.0 -1.1 -14.1 0.4
Imports (goods and services) 203.7 85.3 - 17.5 20.4 4.2 -7.9 -16.0 -0.5
GNI at previous year prices (GDP deflator) 220.2 92.2 - 10.3 8.7 3.5 -1.5 -6.6 -1.9
Contribution to GDP growth : Domestic demand - 8.5 13.7 7.6 -5.0 -11.6 -1.5
Stockbuilding - 1.0 1.4 0.7 -3.4 -0.9 0.0
Foreign balance - 1.0 -8.3 -3.9 6.0 2.2 0.7Employment -2.5 1.8 5.6 0.4 0.2 -7.3 -3.3
Unemployment rate (a) - 7.9 5.9 4.7 5.5 11.3 14.1
Compensation of employees/f.t.e. - 11.0 14.0 26.5 14.7 0.7 -3.5
Unit labour costs whole economy - 3.5 9.1 19.4 19.3 4.1 -5.9
Real unit labour costs - -1.7 1.9 9.0 10.7 4.1 -5.1
Savings rate of households (b) - - -3.0 0.8 11.1 20.6 17.2
GDP deflator - 5.3 7.0 9.6 7.8 -0.1 -0.8
Harmonised index of consumer prices - 4.1 4.4 6.7 10.6 0.6 0.5
Terms of trade of goods - 1.3 2.7 3.3 -0.8 2.1 -2.9
Trade balance (c) - -13.9 -18.3 -17.6 -11.9 -8.4 -9.6
Current account balance (c) - -10.1 -16.7 -18.3 -9.1 -1.1 -3.1
Net lending(+) or borrowing(-) vis-à-vis ROW (c) - -9.4 -14.7 -17.1 -8.0 1.0 -0.7
General government balance (c) - 1.5 2.9 2.7 -3.0 -3.0 -3.9
Cyclically-adjusted budget balance (c) - 0.2 0.2 -0.5 -4.0 -0.4 -0.7
Structural budget balance (c) - 0.2 -0.7 -0.8 -4.1 -1.0 -1.9
General government gross debt (c) - 4.5 4.3 3.5 4.8 6.8 7.8
(a) Eurostat definition. (b) gross saving divided by gross disposable income. (c) as a percentage of GDP.Note : Contributions to GDP growth may not add up due to statistical discrepancies.
62
large excise tax increases of early and mid-2008;
rapidly declining wage growth is dragging down
core inflation. HICP inflation is expected to reach
negative territory in the second half of 2009 and to
broadly stabilise thereafter, remaining below 1% in
both years. Core inflation is expected to continue
to decline in 2010, as the wage decline
progressively reinforces.
Similarly rapid adjustment is taking place with
regards to external imbalances, as the current
account deficit has halved in 2008 compared to
2007 and is expected to reach an almost balanced
position in 2009, with EU structural funds
financing covering the remaining current account
deficit.
Public finances under severe pressure
The contraction in the economy has already taken
its toll on public finances, with a deficit of 3.0% of
GDP in 2008 after six years of nominal surpluses.
A steady deterioration in the economic outlook and
a deflationary environment will cause tax revenues
to contract further in 2009 and 2010. A positive
impact on revenue, without considerably affecting
the overall balance, is, however, expected from the
intensified use of EU structural funds. The
substantial expenditure cuts adopted in February
2009, followed by additional consolidation
measures adopted in April, mitigate the risk of
breaching the 3% threshold in 2009, while further
contraction of the economy and the steep
adjustment on the labour market put additional
pressure on the public finances in 2010, on the
basis of unchanged policy assumption.
High deficits will result in an increase in
government debt, which is projected to approach
8% of GDP by the end of the forecast period, even
assuming a gradual running-down of fiscal
reserves that have been accumulated over the years
of nominal surpluses.
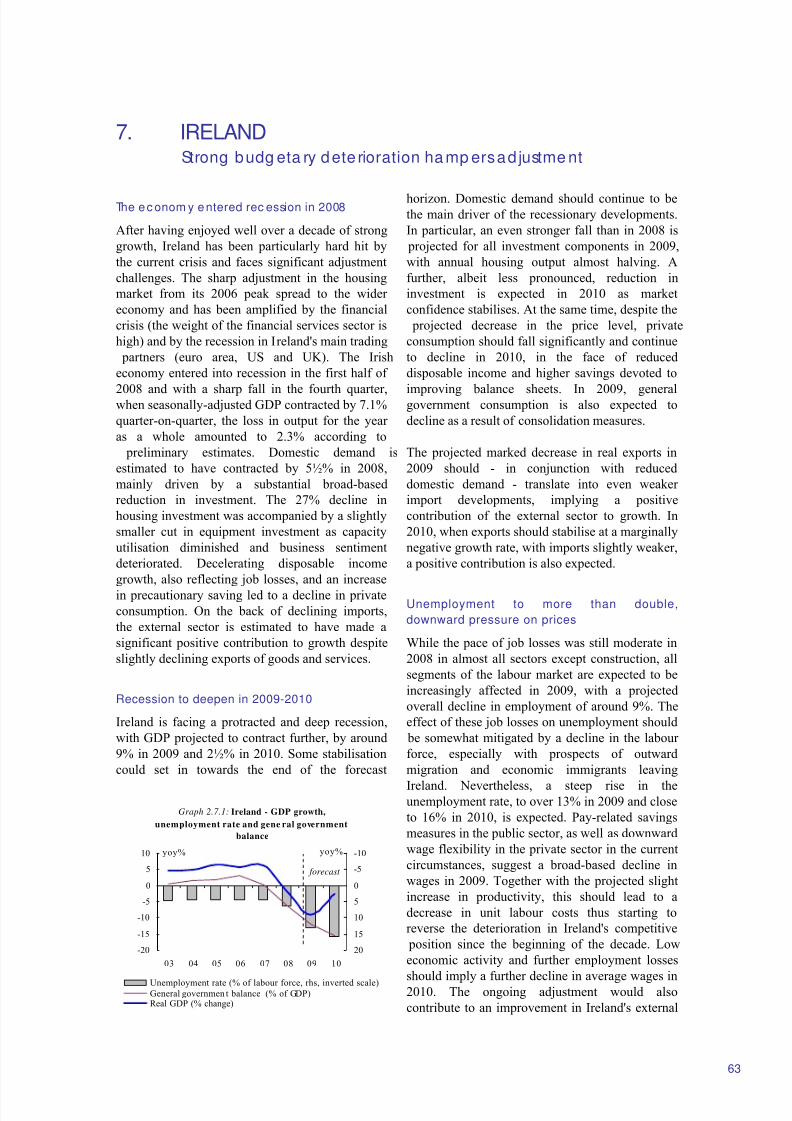
8/14/2019 Economic Forecast 2009
http://slidepdf.com/reader/full/economic-forecast-2009 69/172
7. IRELANDStrong budg eta ry dete rioration ha mp ers ad justme nt
Graph 2.7.1: Ireland - GDP growth,
unemployment rate and gene ral government
balance
-20
-15
-10
-5
0
5
10
03 04 05 06 07 08 09 10
yoy% -10
-5
0
5
10
15
20
Unemployment rate (% of labour force, rhs, inverted scale)General governmen t balance (% of GDP)Real GDP (% change)
forecast
yoy%
63
The ec onom y entered rec ession in 2008
After having enjoyed well over a decade of strong
growth, Ireland has been particularly hard hit by
the current crisis and faces significant adjustment
challenges. The sharp adjustment in the housing
market from its 2006 peak spread to the wider
economy and has been amplified by the financial
crisis (the weight of the financial services sector is
high) and by the recession in Ireland's main trading
partners (euro area, US and UK). The Irish
economy entered into recession in the first half of
2008 and with a sharp fall in the fourth quarter,when seasonally-adjusted GDP contracted by 7.1%
quarter-on-quarter, the loss in output for the year
as a whole amounted to 2.3% according to
preliminary estimates. Domestic demand is
estimated to have contracted by 5½% in 2008,
mainly driven by a substantial broad-based
reduction in investment. The 27% decline in
housing investment was accompanied by a slightly
smaller cut in equipment investment as capacity
utilisation diminished and business sentiment
deteriorated. Decelerating disposable income
growth, also reflecting job losses, and an increase
in precautionary saving led to a decline in private
consumption. On the back of declining imports,
the external sector is estimated to have made a
significant positive contribution to growth despite
slightly declining exports of goods and services.
Recession to deepen in 2009-2010
Ireland is facing a protracted and deep recession,
with GDP projected to contract further, by around
9% in 2009 and 2½% in 2010. Some stabilisation
could set in towards the end of the forecast
horizon. Domestic demand should continue to bethe main driver of the recessionary developments.
In particular, an even stronger fall than in 2008 is
projected for all investment components in 2009,
with annual housing output almost halving. A
further, albeit less pronounced, reduction in
investment is expected in 2010 as market
confidence stabilises. At the same time, despite the
projected decrease in the price level, private
consumption should fall significantly and continue
to decline in 2010, in the face of reduced
disposable income and higher savings devoted to
improving balance sheets. In 2009, generalgovernment consumption is also expected to
decline as a result of consolidation measures.
The projected marked decrease in real exports in
2009 should - in conjunction with reduced
domestic demand - translate into even weaker
import developments, implying a positive
contribution of the external sector to growth. In
2010, when exports should stabilise at a marginally
negative growth rate, with imports slightly weaker,
a positive contribution is also expected.
Unemployment to more than double,
downward pressure on prices
While the pace of job losses was still moderate in
2008 in almost all sectors except construction, all
segments of the labour market are expected to be
increasingly affected in 2009, with a projected
overall decline in employment of around 9%. The
effect of these job losses on unemployment should
be somewhat mitigated by a decline in the labour
force, especially with prospects of outward
migration and economic immigrants leaving
Ireland. Nevertheless, a steep rise in theunemployment rate, to over 13% in 2009 and close
to 16% in 2010, is expected. Pay-related savings
measures in the public sector, as well as downward
wage flexibility in the private sector in the current
circumstances, suggest a broad-based decline in
wages in 2009. Together with the projected slight
increase in productivity, this should lead to a
decrease in unit labour costs thus starting to
reverse the deterioration in Ireland's competitive
position since the beginning of the decade. Low
economic activity and further employment losses
should imply a further decline in average wages in2010. The ongoing adjustment would also
contribute to an improvement in Ireland's external
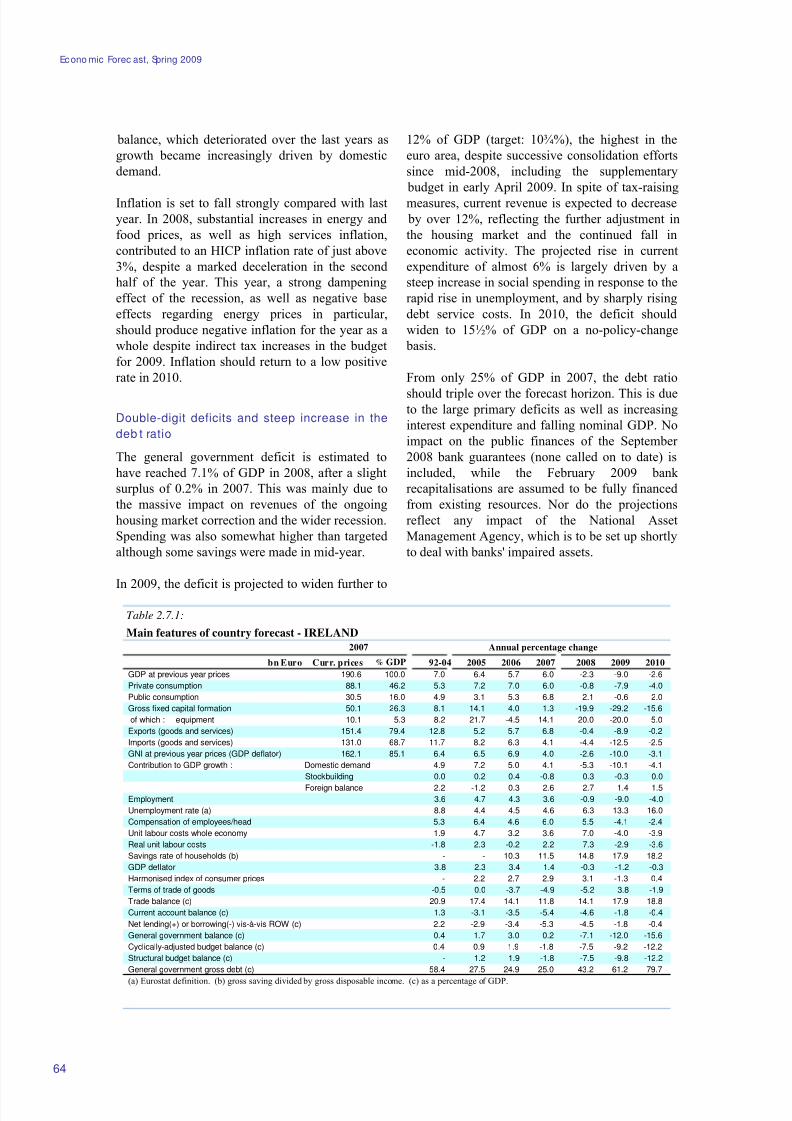
8/14/2019 Economic Forecast 2009
http://slidepdf.com/reader/full/economic-forecast-2009 70/172
Econo mic Forec ast, Spring 2009
Table 2.7.1:
Main features of country forecast - IRELAND
2007 Annual percentage change
bn Euro Curr. prices % GDP 92-04 2005 2006 2007 2008 2009 2010
GDP at previous year prices 190.6 100.0 7.0 6.4 5.7 6.0 -2.3 -9.0 -2.6
Private consumption 88.1 46.2 5.3 7.2 7.0 6.0 -0.8 -7.9 -4.0
Public consumption 30.5 16.0 4.9 3.1 5.3 6.8 2.1 -0.6 2.0
Gross fixed capital formation 50.1 26.3 8.1 14.1 4.0 1.3 -19.9 -29.2 -15.6
of which : equipment 10.1 5.3 8.2 21.7 -4.5 14.1 -20.0 -20.0 -5.0
Exports (goods and services) 151.4 79.4 12.8 5.2 5.7 6.8 -0.4 -8.9 -0.2
Imports (goods and services) 131.0 68.7 11.7 8.2 6.3 4.1 -4.4 -12.5 -2.5
GNI at previous year prices (GDP deflator) 162.1 85.1 6.4 6.5 6.9 4.0 -2.6 -10.0 -3.1
Contribution to GDP growth : Domestic demand 4.9 7.2 5.0 4.1 -5.3 -10.1 -4.1
Stockbuilding 0.0 0.2 0.4 -0.8 0.3 -0.3 0.0
Foreign balance 2.2 -1.2 0.3 2.6 2.7 1.4 1.5Employment 3.6 4.7 4.3 3.6 -0.9 -9.0 -4.0
Unemployment rate (a) 8.8 4.4 4.5 4.6 6.3 13.3 16.0
Compensation of employees/head 5.3 6.4 4.6 6.0 5.5 -4.1 -2.4
Unit labour costs whole economy 1.9 4.7 3.2 3.6 7.0 -4.0 -3.9
Real unit labour costs -1.8 2.3 -0.2 2.2 7.3 -2.9 -3.6
Savings rate of households (b) - - 10.3 11.5 14.8 17.9 18.2
GDP deflator 3.8 2.3 3.4 1.4 -0.3 -1.2 -0.3
Harmonised index of consumer prices - 2.2 2.7 2.9 3.1 -1.3 0.4
Terms of trade of goods -0.5 0.0 -3.7 -4.9 -5.2 3.8 -1.9
Trade balance (c) 20.9 17.4 14.1 11.8 14.1 17.9 18.8
Current account balance (c) 1.3 -3.1 -3.5 -5.4 -4.6 -1.8 -0.4
Net lending(+) or borrowing(-) vis-à-vis ROW (c) 2.2 -2.9 -3.4 -5.3 -4.5 -1.8 -0.4
General government balance (c) 0.4 1.7 3.0 0.2 -7.1 -12.0 -15.6
Cyclically-adjusted budget balance (c) 0.4 0.9 1.9 -1.8 -7.5 -9.2 -12.2
Structural budget balance (c) - 1.2 1.9 -1.8 -7.5 -9.8 -12.2
General government gross debt (c) 58.4 27.5 24.9 25.0 43.2 61.2 79.7
(a) Eurostat definition. (b) gross saving divided by gross disposable income. (c) as a percentage of GDP.
64
balance, which deteriorated over the last years as
growth became increasingly driven by domestic
demand.
Inflation is set to fall strongly compared with last
year. In 2008, substantial increases in energy and
food prices, as well as high services inflation,
contributed to an HICP inflation rate of just above
3%, despite a marked deceleration in the second
half of the year. This year, a strong dampening
effect of the recession, as well as negative base
effects regarding energy prices in particular,
should produce negative inflation for the year as a
whole despite indirect tax increases in the budget
for 2009. Inflation should return to a low positive
rate in 2010.
Double-digit deficits and steep increase in the
deb t ratio
The general government deficit is estimated to
have reached 7.1% of GDP in 2008, after a slight
surplus of 0.2% in 2007. This was mainly due to
the massive impact on revenues of the ongoing
housing market correction and the wider recession.
Spending was also somewhat higher than targeted
although some savings were made in mid-year.
In 2009, the deficit is projected to widen further to
12% of GDP (target: 10¾%), the highest in the
euro area, despite successive consolidation efforts
since mid-2008, including the supplementary
budget in early April 2009. In spite of tax-raising
measures, current revenue is expected to decrease
by over 12%, reflecting the further adjustment in
the housing market and the continued fall in
economic activity. The projected rise in current
expenditure of almost 6% is largely driven by a
steep increase in social spending in response to the
rapid rise in unemployment, and by sharply rising
debt service costs. In 2010, the deficit should
widen to 15½% of GDP on a no-policy-change
basis.
From only 25% of GDP in 2007, the debt ratio
should triple over the forecast horizon. This is dueto the large primary deficits as well as increasing
interest expenditure and falling nominal GDP. No
impact on the public finances of the September
2008 bank guarantees (none called on to date) is
included, while the February 2009 bank
recapitalisations are assumed to be fully financed
from existing resources. Nor do the projections
reflect any impact of the National Asset
Management Agency, which is to be set up shortly
to deal with banks' impaired assets.
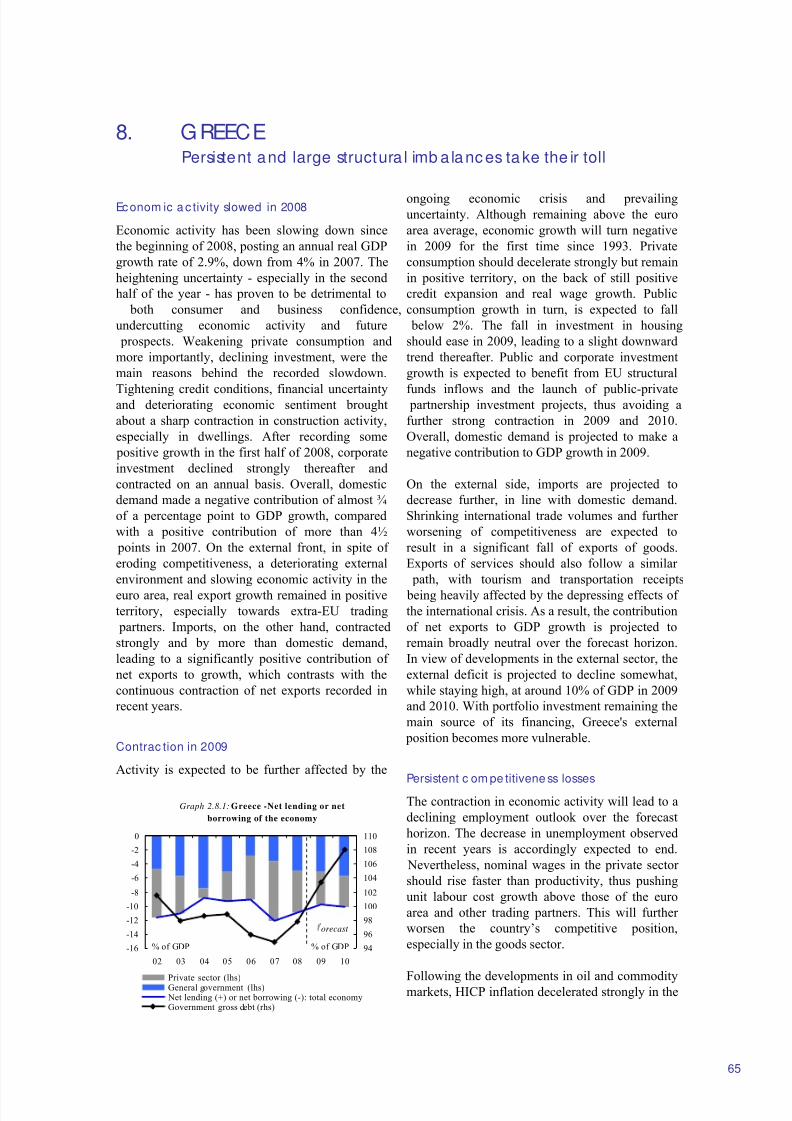
8/14/2019 Economic Forecast 2009
http://slidepdf.com/reader/full/economic-forecast-2009 71/172
8. GREECEPersistent and large structura l imb a lanc es ta ke the ir toll
Graph 2.8.1: Greece -Net lending or net
borrowing of the economy
-16
-14
-12
-10
-8
-6
-4
-2
0
02 03 04 05 06 07 08 09 10
94
96
98
100
102
104
106
108
110
Private sector (lhs)General government (lhs) Net lending (+) or net borrowing (-): total economyGovernment gross debt (rhs)
orecast
% of GDP % of GDP
65
Econom ic a c tivity slowed in 2008
Economic activity has been slowing down since
the beginning of 2008, posting an annual real GDP
growth rate of 2.9%, down from 4% in 2007. The
heightening uncertainty - especially in the second
half of the year - has proven to be detrimental to
both consumer and business confidence,
undercutting economic activity and future
prospects. Weakening private consumption and
more importantly, declining investment, were the
main reasons behind the recorded slowdown.
Tightening credit conditions, financial uncertaintyand deteriorating economic sentiment brought
about a sharp contraction in construction activity,
especially in dwellings. After recording some
positive growth in the first half of 2008, corporate
investment declined strongly thereafter and
contracted on an annual basis. Overall, domestic
demand made a negative contribution of almost ¾
of a percentage point to GDP growth, compared
with a positive contribution of more than 4½
points in 2007. On the external front, in spite of
eroding competitiveness, a deteriorating external
environment and slowing economic activity in the
euro area, real export growth remained in positive
territory, especially towards extra-EU trading
partners. Imports, on the other hand, contracted
strongly and by more than domestic demand,
leading to a significantly positive contribution of
net exports to growth, which contrasts with the
continuous contraction of net exports recorded in
recent years.
Contrac tion in 2009
Activity is expected to be further affected by the
ongoing economic crisis and prevailinguncertainty. Although remaining above the euro
area average, economic growth will turn negative
in 2009 for the first time since 1993. Private
consumption should decelerate strongly but remain
in positive territory, on the back of still positive
credit expansion and real wage growth. Public
consumption growth in turn, is expected to fall
below 2%. The fall in investment in housing
should ease in 2009, leading to a slight downward
trend thereafter. Public and corporate investment
growth is expected to benefit from EU structural
funds inflows and the launch of public-private partnership investment projects, thus avoiding a
further strong contraction in 2009 and 2010.
Overall, domestic demand is projected to make a
negative contribution to GDP growth in 2009.
On the external side, imports are projected to
decrease further, in line with domestic demand.
Shrinking international trade volumes and further
worsening of competitiveness are expected to
result in a significant fall of exports of goods.
Exports of services should also follow a similar
path, with tourism and transportation receipts
being heavily affected by the depressing effects of
the international crisis. As a result, the contribution
of net exports to GDP growth is projected to
remain broadly neutral over the forecast horizon.
In view of developments in the external sector, the
external deficit is projected to decline somewhat,
while staying high, at around 10% of GDP in 2009
and 2010. With portfolio investment remaining the
main source of its financing, Greece's external
position becomes more vulnerable.
Persistent c om pe titivene ss losses
The contraction in economic activity will lead to a
declining employment outlook over the forecast
horizon. The decrease in unemployment observed
in recent years is accordingly expected to end.
Nevertheless, nominal wages in the private sector
should rise faster than productivity, thus pushing
unit labour cost growth above those of the euro
area and other trading partners. This will further
worsen the country’s competitive position,
especially in the goods sector.
Following the developments in oil and commoditymarkets, HICP inflation decelerated strongly in the
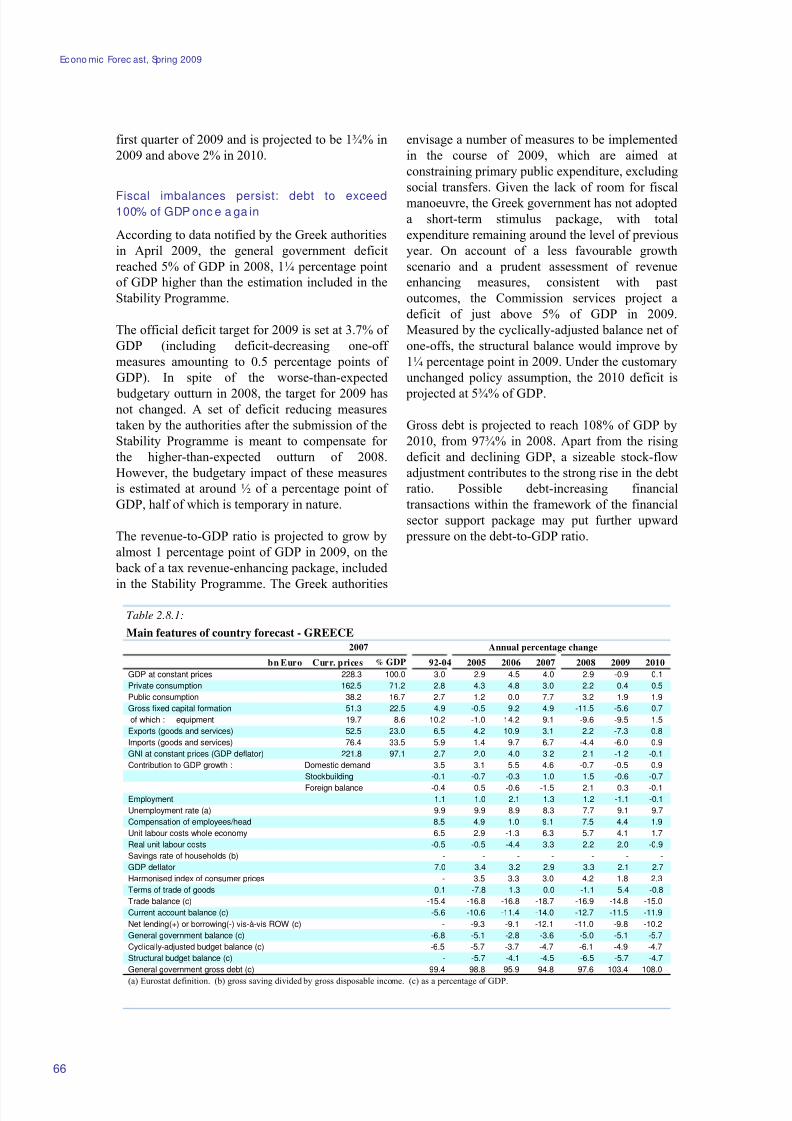
8/14/2019 Economic Forecast 2009
http://slidepdf.com/reader/full/economic-forecast-2009 72/172
Econo mic Forec ast, Spring 2009
Table 2.8.1:
Main features of country forecast - GREECE
2007 Annual percentage change
bn Euro Curr. prices % GDP 92-04 2005 2006 2007 2008 2009 2010
GDP at constant prices 228.3 100.0 3.0 2.9 4.5 4.0 2.9 -0.9 0.1
Private consumption 162.5 71.2 2.8 4.3 4.8 3.0 2.2 0.4 0.5
Public consumption 38.2 16.7 2.7 1.2 0.0 7.7 3.2 1.9 1.9
Gross fixed capital formation 51.3 22.5 4.9 -0.5 9.2 4.9 -11.5 -5.6 0.7
of which : equipment 19.7 8.6 10.2 -1.0 14.2 9.1 -9.6 -9.5 1.5
Exports (goods and services) 52.5 23.0 6.5 4.2 10.9 3.1 2.2 -7.3 0.8
Imports (goods and services) 76.4 33.5 5.9 1.4 9.7 6.7 -4.4 -6.0 0.9
GNI at constant prices (GDP deflator) 221.8 97.1 2.7 2.0 4.0 3.2 2.1 -1.2 -0.1
Contribution to GDP growth : Domestic demand 3.5 3.1 5.5 4.6 -0.7 -0.5 0.9
Stockbuilding -0.1 -0.7 -0.3 1.0 1.5 -0.6 -0.7
Foreign balance -0.4 0.5 -0.6 -1.5 2.1 0.3 -0.1Employment 1.1 1.0 2.1 1.3 1.2 -1.1 -0.1
Unemployment rate (a) 9.9 9.9 8.9 8.3 7.7 9.1 9.7
Compensation of employees/head 8.5 4.9 1.0 9.1 7.5 4.4 1.9
Unit labour costs whole economy 6.5 2.9 -1.3 6.3 5.7 4.1 1.7
Real unit labour costs -0.5 -0.5 -4.4 3.3 2.2 2.0 -0.9
Savings rate of households (b) - - - - - - -
GDP deflator 7.0 3.4 3.2 2.9 3.3 2.1 2.7
Harmonised index of consumer prices - 3.5 3.3 3.0 4.2 1.8 2.3
Terms of trade of goods 0.1 -7.8 1.3 0.0 -1.1 5.4 -0.8
Trade balance (c) -15.4 -16.8 -16.8 -18.7 -16.9 -14.8 -15.0
Current account balance (c) -5.6 -10.6 -11.4 -14.0 -12.7 -11.5 -11.9
Net lending(+) or borrowing(-) vis-à-vis ROW (c) - -9.3 -9.1 -12.1 -11.0 -9.8 -10.2
General government balance (c) -6.8 -5.1 -2.8 -3.6 -5.0 -5.1 -5.7
Cyclically-adjusted budget balance (c) -6.5 -5.7 -3.7 -4.7 -6.1 -4.9 -4.7
Structural budget balance (c) - -5.7 -4.1 -4.5 -6.5 -5.7 -4.7
General government gross debt (c) 99.4 98.8 95.9 94.8 97.6 103.4 108.0
(a) Eurostat definition. (b) gross saving divided by gross disposable income. (c) as a percentage of GDP.
66
first quarter of 2009 and is projected to be 1¾% in
2009 and above 2% in 2010.
Fiscal imbalances persist: debt to exceed100% of GDP onc e a ga in
According to data notified by the Greek authorities
in April 2009, the general government deficit
reached 5% of GDP in 2008, 1¼ percentage point
of GDP higher than the estimation included in the
Stability Programme.
The official deficit target for 2009 is set at 3.7% of
GDP (including deficit-decreasing one-off
measures amounting to 0.5 percentage points of
GDP). In spite of the worse-than-expected
budgetary outturn in 2008, the target for 2009 hasnot changed. A set of deficit reducing measures
taken by the authorities after the submission of the
Stability Programme is meant to compensate for
the higher-than-expected outturn of 2008.
However, the budgetary impact of these measures
is estimated at around ½ of a percentage point of
GDP, half of which is temporary in nature.
The revenue-to-GDP ratio is projected to grow by
almost 1 percentage point of GDP in 2009, on the
back of a tax revenue-enhancing package, included
in the Stability Programme. The Greek authorities
envisage a number of measures to be implemented
in the course of 2009, which are aimed at
constraining primary public expenditure, excluding
social transfers. Given the lack of room for fiscal
manoeuvre, the Greek government has not adopted
a short-term stimulus package, with total
expenditure remaining around the level of previous
year. On account of a less favourable growth
scenario and a prudent assessment of revenue
enhancing measures, consistent with past
outcomes, the Commission services project a
deficit of just above 5% of GDP in 2009.
Measured by the cyclically-adjusted balance net of
one-offs, the structural balance would improve by
1¼ percentage point in 2009. Under the customary
unchanged policy assumption, the 2010 deficit is
projected at 5¾% of GDP.
Gross debt is projected to reach 108% of GDP by
2010, from 97¾% in 2008. Apart from the rising
deficit and declining GDP, a sizeable stock-flow
adjustment contributes to the strong rise in the debt
ratio. Possible debt-increasing financial
transactions within the framework of the financial
sector support package may put further upward
pressure on the debt-to-GDP ratio.
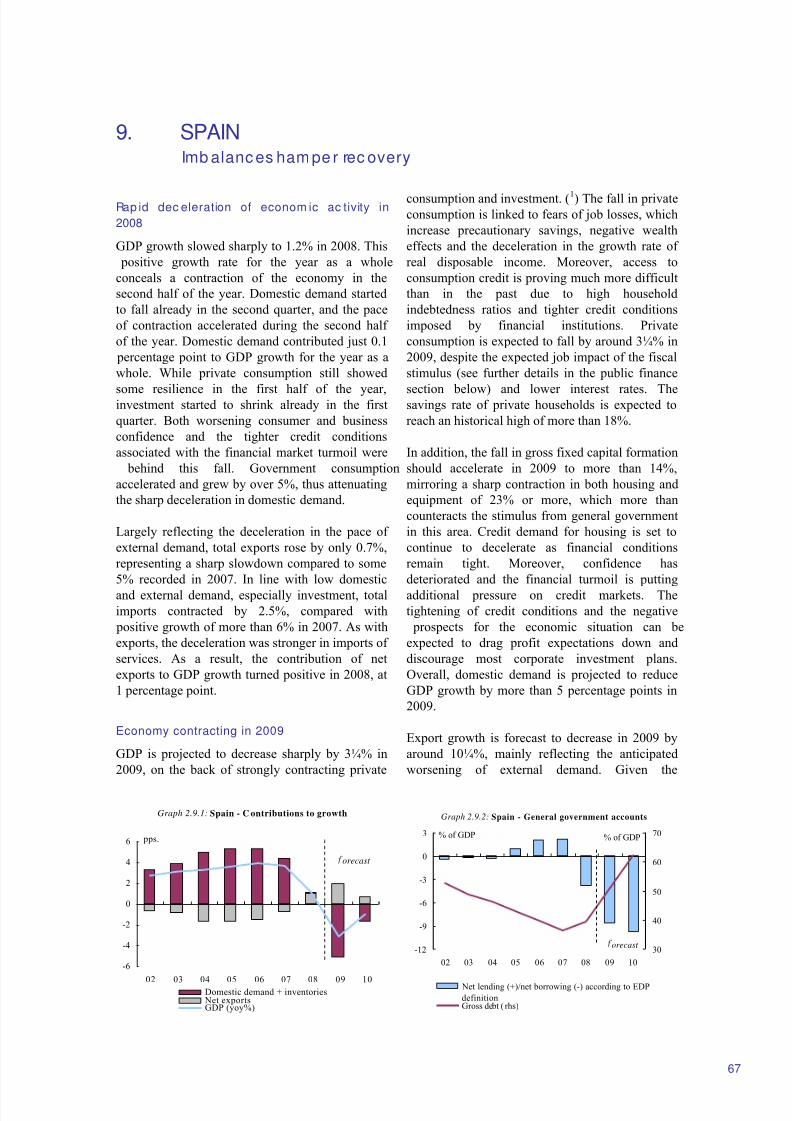
8/14/2019 Economic Forecast 2009
http://slidepdf.com/reader/full/economic-forecast-2009 73/172
9. SPAINImb alanc es ham pe r rec overy
Graph 2.9.2: Spain - General government accounts
-12
-9
-6
-3
0
3
02 03 04 05 06 07 08 09 10
% of GDP% of GDP
30
40
50
60
70
Net lending (+)/net borrowing (-) according to EDP
definitionGross debt ( rhs)
orecast
Graph 2.9.1: Spain - C ontributions to growth
-6
-4
-2
0
2
4
6
02 03 04 05 06 07 08 09 10
pps.
Domestic demand + inventories Net exportsGDP (yoy%)
orecast
67
Rap id dec eleration of econom ic ac tivity in
2008
GDP growth slowed sharply to 1.2% in 2008. This
positive growth rate for the year as a whole
conceals a contraction of the economy in the
second half of the year. Domestic demand started
to fall already in the second quarter, and the pace
of contraction accelerated during the second half
of the year. Domestic demand contributed just 0.1
percentage point to GDP growth for the year as a
whole. While private consumption still showed
some resilience in the first half of the year,investment started to shrink already in the first
quarter. Both worsening consumer and business
confidence and the tighter credit conditions
associated with the financial market turmoil were
behind this fall. Government consumption
accelerated and grew by over 5%, thus attenuating
the sharp deceleration in domestic demand.
Largely reflecting the deceleration in the pace of
external demand, total exports rose by only 0.7%,
representing a sharp slowdown compared to some
5% recorded in 2007. In line with low domestic
and external demand, especially investment, total
imports contracted by 2.5%, compared with
positive growth of more than 6% in 2007. As with
exports, the deceleration was stronger in imports of
services. As a result, the contribution of net
exports to GDP growth turned positive in 2008, at
1 percentage point.
Economy contracting in 2009
GDP is projected to decrease sharply by 3¼% in
2009, on the back of strongly contracting private
consumption and investment. (1) The fall in privateconsumption is linked to fears of job losses, which
increase precautionary savings, negative wealth
effects and the deceleration in the growth rate of
real disposable income. Moreover, access to
consumption credit is proving much more difficult
than in the past due to high household
indebtedness ratios and tighter credit conditions
imposed by financial institutions. Private
consumption is expected to fall by around 3¼% in
2009, despite the expected job impact of the fiscal
stimulus (see further details in the public finance
section below) and lower interest rates. Thesavings rate of private households is expected to
reach an historical high of more than 18%.
In addition, the fall in gross fixed capital formation
should accelerate in 2009 to more than 14%,
mirroring a sharp contraction in both housing and
equipment of 23% or more, which more than
counteracts the stimulus from general government
in this area. Credit demand for housing is set to
continue to decelerate as financial conditions
remain tight. Moreover, confidence has
deteriorated and the financial turmoil is putting
additional pressure on credit markets. The
tightening of credit conditions and the negative
prospects for the economic situation can be
expected to drag profit expectations down and
discourage most corporate investment plans.
Overall, domestic demand is projected to reduce
GDP growth by more than 5 percentage points in
2009.
Export growth is forecast to decrease in 2009 by
around 10¼%, mainly reflecting the anticipated
worsening of external demand. Given the
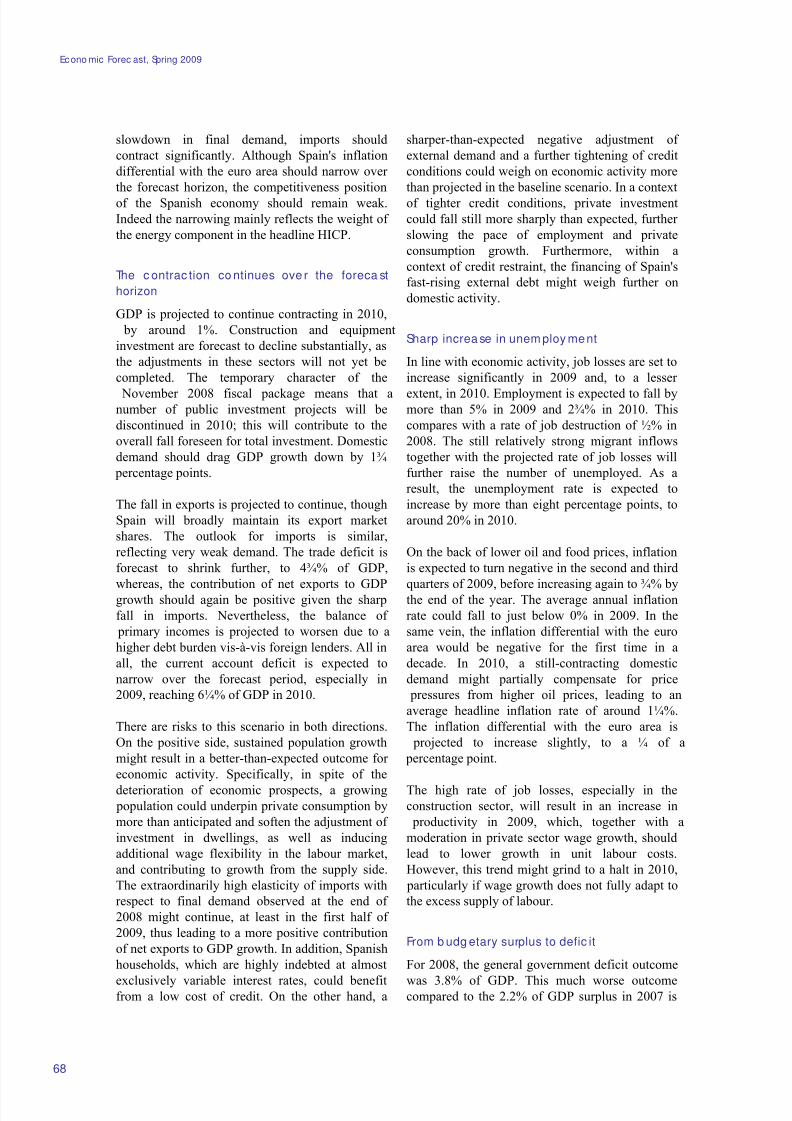
8/14/2019 Economic Forecast 2009
http://slidepdf.com/reader/full/economic-forecast-2009 74/172
Econo mic Forec ast, Spring 2009
68
slowdown in final demand, imports should
contract significantly. Although Spain's inflation
differential with the euro area should narrow over
the forecast horizon, the competitiveness position
of the Spanish economy should remain weak.
Indeed the narrowing mainly reflects the weight of
the energy component in the headline HICP.
The c ontrac tion co ntinues ove r the foreca st
horizon
GDP is projected to continue contracting in 2010,
by around 1%. Construction and equipment
investment are forecast to decline substantially, as
the adjustments in these sectors will not yet be
completed. The temporary character of the
November 2008 fiscal package means that anumber of public investment projects will be
discontinued in 2010; this will contribute to the
overall fall foreseen for total investment. Domestic
demand should drag GDP growth down by 1¾
percentage points.
The fall in exports is projected to continue, though
Spain will broadly maintain its export market
shares. The outlook for imports is similar,
reflecting very weak demand. The trade deficit is
forecast to shrink further, to 4¾% of GDP,
whereas, the contribution of net exports to GDPgrowth should again be positive given the sharp
fall in imports. Nevertheless, the balance of
primary incomes is projected to worsen due to a
higher debt burden vis-à-vis foreign lenders. All in
all, the current account deficit is expected to
narrow over the forecast period, especially in
2009, reaching 6¼% of GDP in 2010.
There are risks to this scenario in both directions.
On the positive side, sustained population growth
might result in a better-than-expected outcome for
economic activity. Specifically, in spite of the
deterioration of economic prospects, a growing population could underpin private consumption by
more than anticipated and soften the adjustment of
investment in dwellings, as well as inducing
additional wage flexibility in the labour market,
and contributing to growth from the supply side.
The extraordinarily high elasticity of imports with
respect to final demand observed at the end of
2008 might continue, at least in the first half of
2009, thus leading to a more positive contribution
of net exports to GDP growth. In addition, Spanish
households, which are highly indebted at almost
exclusively variable interest rates, could benefitfrom a low cost of credit. On the other hand, a
sharper-than-expected negative adjustment of
external demand and a further tightening of credit
conditions could weigh on economic activity more
than projected in the baseline scenario. In a context
of tighter credit conditions, private investment
could fall still more sharply than expected, further
slowing the pace of employment and private
consumption growth. Furthermore, within a
context of credit restraint, the financing of Spain's
fast-rising external debt might weigh further on
domestic activity.
Sharp increa se in unem ploy ment
In line with economic activity, job losses are set to
increase significantly in 2009 and, to a lesser
extent, in 2010. Employment is expected to fall bymore than 5% in 2009 and 2¾% in 2010. This
compares with a rate of job destruction of ½% in
2008. The still relatively strong migrant inflows
together with the projected rate of job losses will
further raise the number of unemployed. As a
result, the unemployment rate is expected to
increase by more than eight percentage points, to
around 20% in 2010.
On the back of lower oil and food prices, inflation
is expected to turn negative in the second and third
quarters of 2009, before increasing again to ¾% bythe end of the year. The average annual inflation
rate could fall to just below 0% in 2009. In the
same vein, the inflation differential with the euro
area would be negative for the first time in a
decade. In 2010, a still-contracting domestic
demand might partially compensate for price
pressures from higher oil prices, leading to an
average headline inflation rate of around 1¼%.
The inflation differential with the euro area is
projected to increase slightly, to a ¼ of a
percentage point.
The high rate of job losses, especially in theconstruction sector, will result in an increase in
productivity in 2009, which, together with a
moderation in private sector wage growth, should
lead to lower growth in unit labour costs.
However, this trend might grind to a halt in 2010,
particularly if wage growth does not fully adapt to
the excess supply of labour.
From b udg etary surplus to defic it
For 2008, the general government deficit outcome
was 3.8% of GDP. This much worse outcomecompared to the 2.2% of GDP surplus in 2007 is
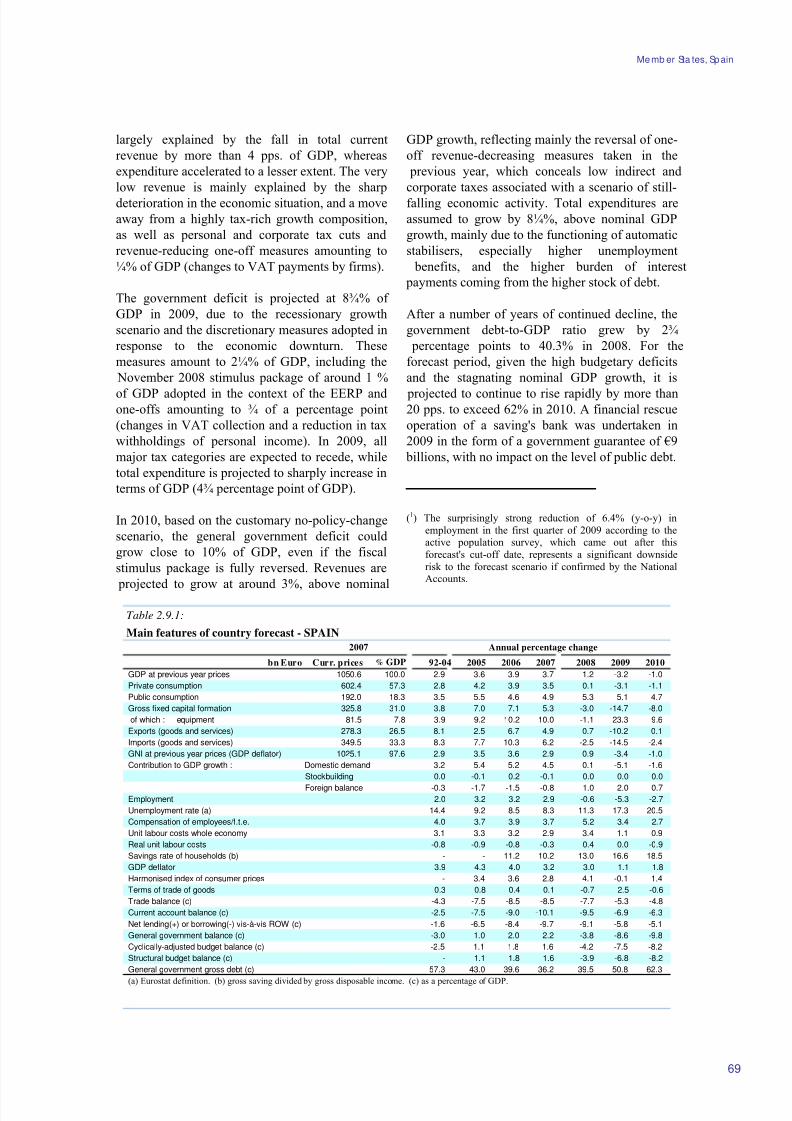
8/14/2019 Economic Forecast 2009
http://slidepdf.com/reader/full/economic-forecast-2009 75/172
Memb er Sta tes, Spain
Table 2.9.1:
Main features of country forecast - SPAIN
2007 Annual percentage change
bn Euro Curr. prices % GDP 92-04 2005 2006 2007 2008 2009 2010
GDP at previous year prices 1050.6 100.0 2.9 3.6 3.9 3.7 1.2 -3.2 -1.0
Private consumption 602.4 57.3 2.8 4.2 3.9 3.5 0.1 -3.1 -1.1
Public consumption 192.0 18.3 3.5 5.5 4.6 4.9 5.3 5.1 4.7
Gross fixed capital formation 325.8 31.0 3.8 7.0 7.1 5.3 -3.0 -14.7 -8.0
of which : equipment 81.5 7.8 3.9 9.2 10.2 10.0 -1.1 -23.3 -9.6
Exports (goods and services) 278.3 26.5 8.1 2.5 6.7 4.9 0.7 -10.2 0.1
Imports (goods and services) 349.5 33.3 8.3 7.7 10.3 6.2 -2.5 -14.5 -2.4
GNI at previous year prices (GDP deflator) 1025.1 97.6 2.9 3.5 3.6 2.9 0.9 -3.4 -1.0
Contribution to GDP growth : Domestic demand 3.2 5.4 5.2 4.5 0.1 -5.1 -1.6
Stockbuilding 0.0 -0.1 0.2 -0.1 0.0 0.0 0.0
Foreign balance -0.3 -1.7 -1.5 -0.8 1.0 2.0 0.7Employment 2.0 3.2 3.2 2.9 -0.6 -5.3 -2.7
Unemployment rate (a) 14.4 9.2 8.5 8.3 11.3 17.3 20.5
Compensation of employees/f.t.e. 4.0 3.7 3.9 3.7 5.2 3.4 2.7
Unit labour costs whole economy 3.1 3.3 3.2 2.9 3.4 1.1 0.9
Real unit labour costs -0.8 -0.9 -0.8 -0.3 0.4 0.0 -0.9
Savings rate of households (b) - - 11.2 10.2 13.0 16.6 18.5
GDP deflator 3.9 4.3 4.0 3.2 3.0 1.1 1.8
Harmonised index of consumer prices - 3.4 3.6 2.8 4.1 -0.1 1.4
Terms of trade of goods 0.3 0.8 0.4 0.1 -0.7 2.5 -0.6
Trade balance (c) -4.3 -7.5 -8.5 -8.5 -7.7 -5.3 -4.8
Current account balance (c) -2.5 -7.5 -9.0 -10.1 -9.5 -6.9 -6.3
Net lending(+) or borrowing(-) vis-à-vis ROW (c) -1.6 -6.5 -8.4 -9.7 -9.1 -5.8 -5.1
General government balance (c) -3.0 1.0 2.0 2.2 -3.8 -8.6 -9.8
Cyclically-adjusted budget balance (c) -2.5 1.1 1.8 1.6 -4.2 -7.5 -8.2
Structural budget balance (c) - 1.1 1.8 1.6 -3.9 -6.8 -8.2
General government gross debt (c) 57.3 43.0 39.6 36.2 39.5 50.8 62.3
(a) Eurostat definition. (b) gross saving divided by gross disposable income. (c) as a percentage of GDP.
69
largely explained by the fall in total current
revenue by more than 4 pps. of GDP, whereas
expenditure accelerated to a lesser extent. The very
low revenue is mainly explained by the sharp
deterioration in the economic situation, and a move
away from a highly tax-rich growth composition,
as well as personal and corporate tax cuts and
revenue-reducing one-off measures amounting to
¼% of GDP (changes to VAT payments by firms).
The government deficit is projected at 8¾% of
GDP in 2009, due to the recessionary growth
scenario and the discretionary measures adopted in
response to the economic downturn. These
measures amount to 2¼% of GDP, including the
November 2008 stimulus package of around 1 %
of GDP adopted in the context of the EERP andone-offs amounting to ¾ of a percentage point
(changes in VAT collection and a reduction in tax
withholdings of personal income). In 2009, all
major tax categories are expected to recede, while
total expenditure is projected to sharply increase in
terms of GDP (4¾ percentage point of GDP).
In 2010, based on the customary no-policy-change
scenario, the general government deficit could
grow close to 10% of GDP, even if the fiscal
stimulus package is fully reversed. Revenues are
projected to grow at around 3%, above nominal
GDP growth, reflecting mainly the reversal of one-
off revenue-decreasing measures taken in the
previous year, which conceals low indirect and
corporate taxes associated with a scenario of still-
falling economic activity. Total expenditures are
assumed to grow by 8¼%, above nominal GDP
growth, mainly due to the functioning of automatic
stabilisers, especially higher unemployment
benefits, and the higher burden of interest
payments coming from the higher stock of debt.
After a number of years of continued decline, the
government debt-to-GDP ratio grew by 2¾
percentage points to 40.3% in 2008. For the
forecast period, given the high budgetary deficits
and the stagnating nominal GDP growth, it is
projected to continue to rise rapidly by more than20 pps. to exceed 62% in 2010. A financial rescue
operation of a saving's bank was undertaken in
2009 in the form of a government guarantee of €9
billions, with no impact on the level of public debt.
(1) The surprisingly strong reduction of 6.4% (y-o-y) inemployment in the first quarter of 2009 according to theactive population survey, which came out after thisforecast's cut-off date, represents a significant downsiderisk to the forecast scenario if confirmed by the NationalAccounts.
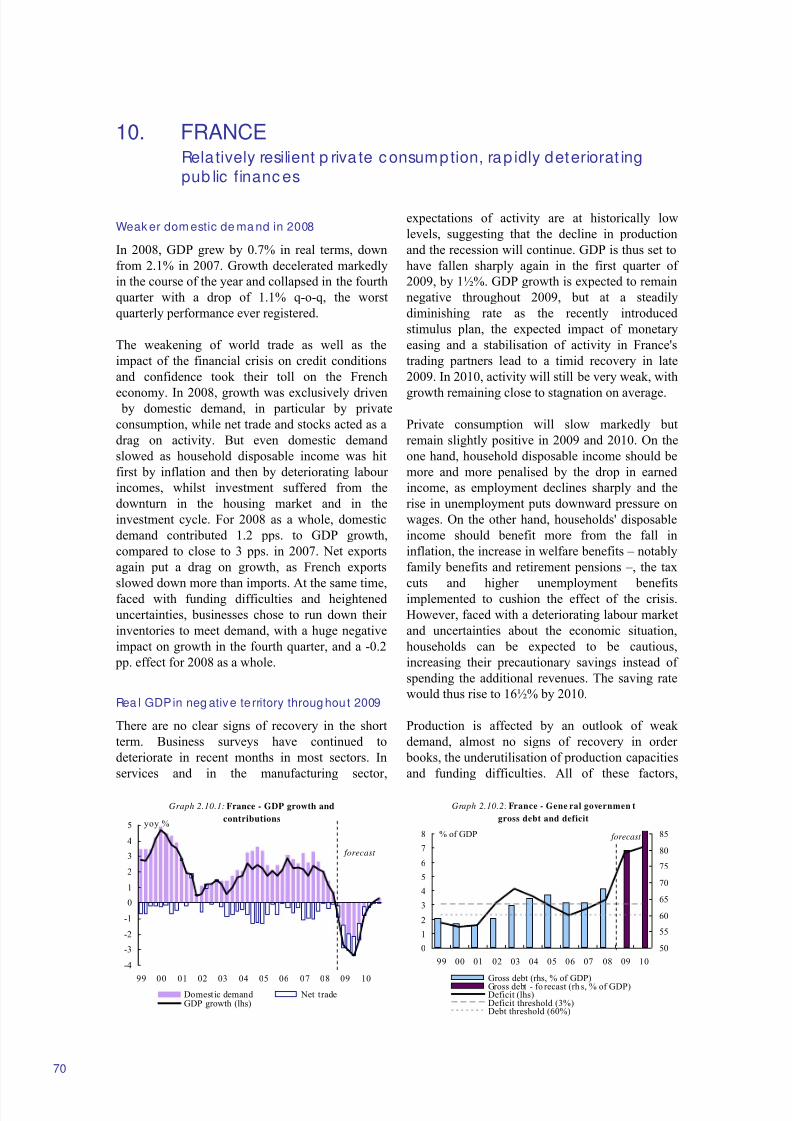
8/14/2019 Economic Forecast 2009
http://slidepdf.com/reader/full/economic-forecast-2009 76/172
10. FRANCERelatively resilient p riva te c onsumption, rap idly deteriorat ing
pub lic financ es
Graph 2.10.2: France - Gene ral governmen t
gross debt and deficit
0
1
2
3
4
5
6
7
8
99 00 01 02 03 04 05 06 07 08 09 10
% of GDP
50
55
60
65
70
75
80
85
Gross debt (rhs, % of GDP)Gross debt - fo recast (rh s, % of GDP)Deficit (lhs)Deficit threshold (3%)Debt threshold (60%)
forecast
Graph 2.10.1: France - GDP growth and
contributions
-4
-3
-2
-1
0
1
2
3
4
5
99 00 01 02 03 04 05 06 07 08 09 10Domest ic demand Net tradeGDP growth (lhs)
yoy %
forecast
70
Weak er dom estic de ma nd in 2008
In 2008, GDP grew by 0.7% in real terms, down
from 2.1% in 2007. Growth decelerated markedly
in the course of the year and collapsed in the fourth
quarter with a drop of 1.1% q-o-q, the worst
quarterly performance ever registered.
The weakening of world trade as well as the
impact of the financial crisis on credit conditions
and confidence took their toll on the French
economy. In 2008, growth was exclusively driven by domestic demand, in particular by private
consumption, while net trade and stocks acted as a
drag on activity. But even domestic demand
slowed as household disposable income was hit
first by inflation and then by deteriorating labour
incomes, whilst investment suffered from the
downturn in the housing market and in the
investment cycle. For 2008 as a whole, domestic
demand contributed 1.2 pps. to GDP growth,
compared to close to 3 pps. in 2007. Net exports
again put a drag on growth, as French exports
slowed down more than imports. At the same time,faced with funding difficulties and heightened
uncertainties, businesses chose to run down their
inventories to meet demand, with a huge negative
impact on growth in the fourth quarter, and a -0.2
pp. effect for 2008 as a whole.
Rea l GDP in neg ative territory throug hout 2009
There are no clear signs of recovery in the short
term. Business surveys have continued to
deteriorate in recent months in most sectors. In
services and in the manufacturing sector,
expectations of activity are at historically low
levels, suggesting that the decline in production
and the recession will continue. GDP is thus set to
have fallen sharply again in the first quarter of
2009, by 1½%. GDP growth is expected to remain
negative throughout 2009, but at a steadily
diminishing rate as the recently introduced
stimulus plan, the expected impact of monetary
easing and a stabilisation of activity in France's
trading partners lead to a timid recovery in late
2009. In 2010, activity will still be very weak, with
growth remaining close to stagnation on average.
Private consumption will slow markedly but
remain slightly positive in 2009 and 2010. On the
one hand, household disposable income should be
more and more penalised by the drop in earned
income, as employment declines sharply and the
rise in unemployment puts downward pressure on
wages. On the other hand, households' disposable
income should benefit more from the fall in
inflation, the increase in welfare benefits – notably
family benefits and retirement pensions –, the tax
cuts and higher unemployment benefitsimplemented to cushion the effect of the crisis.
However, faced with a deteriorating labour market
and uncertainties about the economic situation,
households can be expected to be cautious,
increasing their precautionary savings instead of
spending the additional revenues. The saving rate
would thus rise to 16½% by 2010.
Production is affected by an outlook of weak
demand, almost no signs of recovery in order
books, the underutilisation of production capacities
and funding difficulties. All of these factors,
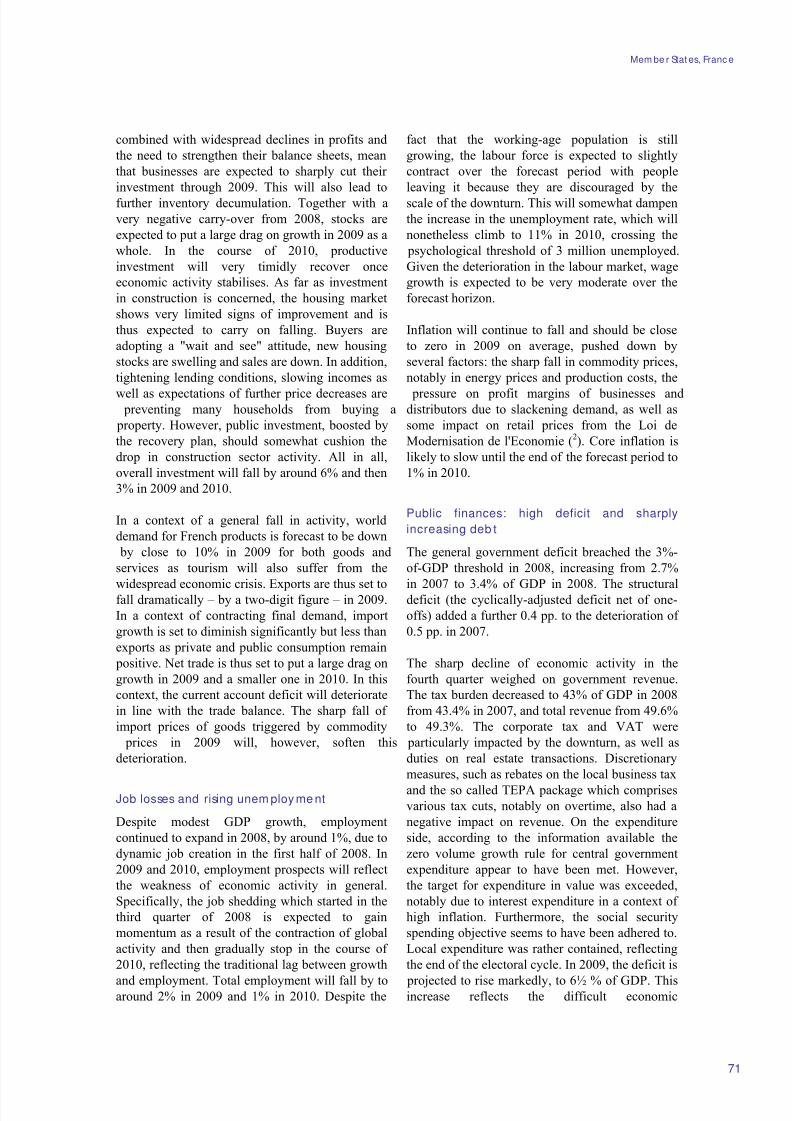
8/14/2019 Economic Forecast 2009
http://slidepdf.com/reader/full/economic-forecast-2009 77/172
Mem be r Stat es, Franc e
71
combined with widespread declines in profits and
the need to strengthen their balance sheets, mean
that businesses are expected to sharply cut their
investment through 2009. This will also lead to
further inventory decumulation. Together with a
very negative carry-over from 2008, stocks are
expected to put a large drag on growth in 2009 as a
whole. In the course of 2010, productive
investment will very timidly recover once
economic activity stabilises. As far as investment
in construction is concerned, the housing market
shows very limited signs of improvement and is
thus expected to carry on falling. Buyers are
adopting a "wait and see" attitude, new housing
stocks are swelling and sales are down. In addition,
tightening lending conditions, slowing incomes as
well as expectations of further price decreases are preventing many households from buying a
property. However, public investment, boosted by
the recovery plan, should somewhat cushion the
drop in construction sector activity. All in all,
overall investment will fall by around 6% and then
3% in 2009 and 2010.
In a context of a general fall in activity, world
demand for French products is forecast to be down
by close to 10% in 2009 for both goods and
services as tourism will also suffer from the
widespread economic crisis. Exports are thus set tofall dramatically – by a two-digit figure – in 2009.
In a context of contracting final demand, import
growth is set to diminish significantly but less than
exports as private and public consumption remain
positive. Net trade is thus set to put a large drag on
growth in 2009 and a smaller one in 2010. In this
context, the current account deficit will deteriorate
in line with the trade balance. The sharp fall of
import prices of goods triggered by commodity
prices in 2009 will, however, soften this
deterioration.
Job losses and rising unem ploy me nt
Despite modest GDP growth, employment
continued to expand in 2008, by around 1%, due to
dynamic job creation in the first half of 2008. In
2009 and 2010, employment prospects will reflect
the weakness of economic activity in general.
Specifically, the job shedding which started in the
third quarter of 2008 is expected to gain
momentum as a result of the contraction of global
activity and then gradually stop in the course of
2010, reflecting the traditional lag between growth
and employment. Total employment will fall by toaround 2% in 2009 and 1% in 2010. Despite the
fact that the working-age population is still
growing, the labour force is expected to slightly
contract over the forecast period with people
leaving it because they are discouraged by the
scale of the downturn. This will somewhat dampen
the increase in the unemployment rate, which will
nonetheless climb to 11% in 2010, crossing the
psychological threshold of 3 million unemployed.
Given the deterioration in the labour market, wage
growth is expected to be very moderate over the
forecast horizon.
Inflation will continue to fall and should be close
to zero in 2009 on average, pushed down by
several factors: the sharp fall in commodity prices,
notably in energy prices and production costs, the
pressure on profit margins of businesses anddistributors due to slackening demand, as well as
some impact on retail prices from the Loi de
Modernisation de l'Economie (2). Core inflation is
likely to slow until the end of the forecast period to
1% in 2010.
Public finances: high deficit and sharply
increasing deb t
The general government deficit breached the 3%-
of-GDP threshold in 2008, increasing from 2.7%
in 2007 to 3.4% of GDP in 2008. The structuraldeficit (the cyclically-adjusted deficit net of one-
offs) added a further 0.4 pp. to the deterioration of
0.5 pp. in 2007.
The sharp decline of economic activity in the
fourth quarter weighed on government revenue.
The tax burden decreased to 43% of GDP in 2008
from 43.4% in 2007, and total revenue from 49.6%
to 49.3%. The corporate tax and VAT were
particularly impacted by the downturn, as well as
duties on real estate transactions. Discretionary
measures, such as rebates on the local business tax
and the so called TEPA package which comprisesvarious tax cuts, notably on overtime, also had a
negative impact on revenue. On the expenditure
side, according to the information available the
zero volume growth rule for central government
expenditure appear to have been met. However,
the target for expenditure in value was exceeded,
notably due to interest expenditure in a context of
high inflation. Furthermore, the social security
spending objective seems to have been adhered to.
Local expenditure was rather contained, reflecting
the end of the electoral cycle. In 2009, the deficit is
projected to rise markedly, to 6½ % of GDP. Thisincrease reflects the difficult economic
8/14/2019 Economic Forecast 2009
http://slidepdf.com/reader/full/economic-forecast-2009 78/172
Econo mic Forec ast, Spring 2009
Table 2.10.1:
Main features of country forecast - FRANCE
2007 Annual percentage change
bn Euro Curr. prices % GDP 92-04 2005 2006 2007 2008 2009 2010
GDP at previous year prices 1892.2 100.0 1.9 1.9 2.2 2.2 0.7 -3.0 -0.2
Private consumption 1072.0 56.7 2.0 2.6 2.3 2.4 1.4 0.2 0.3
Public consumption 438.0 23.1 1.6 1.2 1.3 1.4 1.7 1.8 1.1
Gross fixed capital formation 406.3 21.5 1.9 4.4 4.7 4.9 0.5 -5.9 -2.6
of which : equipment 113.4 6.0 3.2 3.2 2.8 5.8 -0.5 -11.4 -4.4
Exports (goods and services) 501.9 26.5 5.4 3.1 5.4 3.1 1.2 -11.7 -1.0
Imports (goods and services) 538.3 28.4 5.2 5.9 6.1 5.6 2.2 -6.9 0.0
GNI at previous year prices (GDP deflator) 1902.1 100.5 2.0 1.7 2.2 2.0 0.7 -3.0 -0.2
Contribution to GDP growth : Domestic demand 1.8 2.6 2.6 2.7 1.3 -0.8 -0.1
Stockbuilding 0.0 0.0 -0.1 0.2 -0.3 -1.2 0.2
Foreign balance 0.1 -0.7 -0.2 -0.7 -0.3 -1.0 -0.2Employment 0.6 0.6 0.8 1.7 0.6 -2.2 -1.2
Unemployment rate (a) 10.2 9.2 9.2 8.3 7.8 9.6 10.7
Compensation of employees/f.t.e. 2.6 3.1 3.4 2.6 2.8 1.3 1.5
Unit labour costs whole economy 1.2 1.8 2.0 2.1 2.7 2.0 0.4
Real unit labour costs -0.3 -0.3 -0.5 -0.4 0.3 0.6 -0.7
Savings rate of households (b) - - 14.9 15.6 15.4 16.1 16.5
GDP deflator 1.5 2.0 2.5 2.5 2.4 1.4 1.2
Harmonised index of consumer prices 1.8 1.9 1.9 1.6 3.2 0.2 0.9
Terms of trade of goods 0.1 -1.3 -0.5 0.2 -2.7 3.0 -0.3
Trade balance (c) 0.6 -1.3 -1.5 -2.0 -2.9 -3.1 -3.4
Current account balance (c) 1.0 -1.8 -2.1 -2.8 -3.8 -4.3 -4.6
Net lending(+) or borrowing(-) vis-à-vis ROW (c) 1.0 -1.8 -2.0 -2.8 -3.8 -4.4 -4.7
General government balance (c) -3.5 -2.9 -2.3 -2.7 -3.4 -6.6 -7.0
Cyclically-adjusted budget balance (c) -3.2 -3.5 -3.1 -3.8 -4.2 -5.5 -5.5
Structural budget balance (c) - -4.1 -3.4 -3.9 -4.3 -5.5 -5.5
General government gross debt (c) 55.9 66.4 63.7 63.8 68.0 79.7 86.0
(a) Eurostat definition. (b) gross saving divided by gross disposable income. (c) as a percentage of GDP.
72
environment and takes into account the recovery
measures announced so far. Tax revenue is
forecast to be hit hard by the economic downturn
and particularly by the sharp decline in asset
prices, which is expected to have a significant
impact, notably on corporate and property
transaction taxes. Concerning expenditure, on top
of higher social transfers in line with
unemployment, this forecast takes into account the
impact of the recovery plan on the deficit (0.8 pp.),
as well as the measures announced following the
18 February social summit in favour of households
(0.1 pp.). It is assumed that the zero volume
growth rule for central government expenditure
will be adhered to. Local authorities' investment
growth is expected to remain relatively moderate.
Overall, the revenue-to-GDP ratio is estimated todecrease by about ½ pp. of GDP, while the
expenditure-to-GDP ratio is set to increase by 3
pps. of GDP.
Under the conventional assumption of unchanged
policies, the deficit could widen further in 2010, to
7% of GDP. Although the almost complete
phasing-out of the recovery plan will have a
positive impact on the expenditure-to-GDP ratio,
this is expected to be more than offset by the effect
of the normal functioning of automatic stabilisers
and increased interest payments. Revenues as a
share of GDP are projected to slightly increase as
the economy begins to recover.
Debt, which stood at 68% of GDP in 2008, is
forecast to reach almost 80% of GDP in 2009,
before attaining a record level of 86% of GDP in
2010. This is due to the high expected deficit and
to the financial rescue measures already
implemented. In particular, this projection includes
liabilities stemming from the Société de
financement de l'économie française, a scheme to
improve the liquidity of banks (around 3.7% of
GDP).
(2
) The law (summer 2008) relaxed the rules governing thenegotiation of sales conditions and the opening of large-scale retail outlets with a view to increasing competition inthe retail sector.
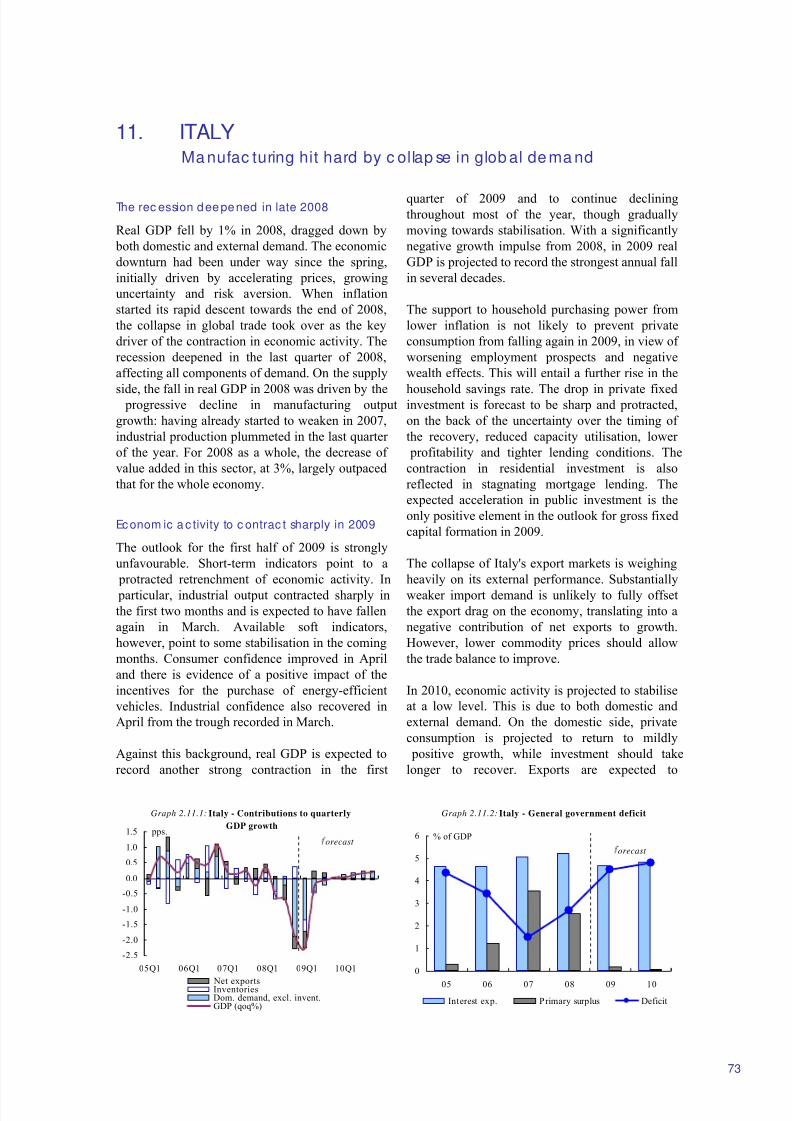
8/14/2019 Economic Forecast 2009
http://slidepdf.com/reader/full/economic-forecast-2009 79/172
11. ITALYMa nufac turing hit hard by c ollap se in glob al de ma nd
Graph 2.11.2: Italy - General government deficit
0
1
2
3
4
5
6
05 06 07 08 09 10
Interest exp. Primary surplus Deficit
orecast
% of GDP
Graph 2.11.1: Italy - Contributions to quarterly
GDP growth
-2.5
-2.0
-1.5
-1.0
-0.5
0.0
0.5
1.0
1.5
05Q1 06Q1 07Q1 08Q1 09Q1 10Q1
Net exportsInventoriesDom. demand, excl. invent.GDP (qoq%)
pps.orecast
73
The rec ession deepened in late 2008
Real GDP fell by 1% in 2008, dragged down by
both domestic and external demand. The economic
downturn had been under way since the spring,
initially driven by accelerating prices, growing
uncertainty and risk aversion. When inflation
started its rapid descent towards the end of 2008,
the collapse in global trade took over as the key
driver of the contraction in economic activity. The
recession deepened in the last quarter of 2008,
affecting all components of demand. On the supply
side, the fall in real GDP in 2008 was driven by the progressive decline in manufacturing output
growth: having already started to weaken in 2007,
industrial production plummeted in the last quarter
of the year. For 2008 as a whole, the decrease of
value added in this sector, at 3%, largely outpaced
that for the whole economy.
Econom ic a c tivity to c ontrac t sharply in 2009
The outlook for the first half of 2009 is strongly
unfavourable. Short-term indicators point to a
protracted retrenchment of economic activity. In
particular, industrial output contracted sharply in
the first two months and is expected to have fallen
again in March. Available soft indicators,
however, point to some stabilisation in the coming
months. Consumer confidence improved in April
and there is evidence of a positive impact of the
incentives for the purchase of energy-efficient
vehicles. Industrial confidence also recovered in
April from the trough recorded in March.
Against this background, real GDP is expected to
record another strong contraction in the first
quarter of 2009 and to continue decliningthroughout most of the year, though gradually
moving towards stabilisation. With a significantly
negative growth impulse from 2008, in 2009 real
GDP is projected to record the strongest annual fall
in several decades.
The support to household purchasing power from
lower inflation is not likely to prevent private
consumption from falling again in 2009, in view of
worsening employment prospects and negative
wealth effects. This will entail a further rise in the
household savings rate. The drop in private fixedinvestment is forecast to be sharp and protracted,
on the back of the uncertainty over the timing of
the recovery, reduced capacity utilisation, lower
profitability and tighter lending conditions. The
contraction in residential investment is also
reflected in stagnating mortgage lending. The
expected acceleration in public investment is the
only positive element in the outlook for gross fixed
capital formation in 2009.
The collapse of Italy's export markets is weighing
heavily on its external performance. Substantially
weaker import demand is unlikely to fully offset
the export drag on the economy, translating into a
negative contribution of net exports to growth.
However, lower commodity prices should allow
the trade balance to improve.
In 2010, economic activity is projected to stabilise
at a low level. This is due to both domestic and
external demand. On the domestic side, private
consumption is projected to return to mildly
positive growth, while investment should take
longer to recover. Exports are expected to
8/14/2019 Economic Forecast 2009
http://slidepdf.com/reader/full/economic-forecast-2009 80/172
Econo mic Forec ast, Spring 2009
74
gradually regain some strength on the back of the
assumed moderate improvement of the global
environment.
Eco nomic downturn hitting the labour ma rket
with a lag
The impact of the economic downturn on the
labour market has so far been more visible in terms
of hours worked than of headcount employment. In
spite of declining economic activity, employment
still rose in the first three quarters of 2008,
particularly in the services sector. It started to fall
only in the last quarter. Job losses are expected to
build up in 2009, hitting the industrial sector most,
and to continue in 2010, although with less
intensity. The unemployment rate began to rise in2008 as new jobseekers, many of them women and
new or newly recorded immigrants, outnumbered
new hires. The employment decline projected for
2009 and 2010 will result in further increases in
the unemployment rate.
Labour productivity decreased substantially in
2008 and is forecast to decline further in 2009,
although a turnaround is expected in 2010. The
wage agreements signed in 2007-2008 in most
sectors of the economy, both private and public, lie
behind the marked acceleration in compensation per employee in 2008 and the still-resilient growth
in contractual wages already in place for 2009.
However, negative wage drift is likely to produce a
moderation in overall labour cost growth in 2009.
Rising unemployment should contain wage
dynamics in 2010.
Combined with negative labour productivity
growth, positive wage growth in 2008 gave rise to
a sharp acceleration in unit labour costs. The latter
are expected to moderate significantly only in
2010. Subdued demand, sluggish productivity
growth and lower prices are adversely affecting profitability of corporations: after decelerating in
2008, the gross operating surplus is expected to
contract sharply in 2009 and to improve somewhat
in 2010 as the economy recovers and growth in
labour costs eases.
Inflation d rops to historica lly low leve ls
In 2009, headline inflation is expected to fall to an
unprecedented 0.8%. The energy component of the
HICP index is set to continue declining, but energy
prices are assumed to recover momentum in 2010.The substantial rise in unit labour costs should
continue to affect core inflation in 2009, which is
therefore anticipated to remain more dynamic than
headline inflation. In 2010, the two measures of
inflation should converge to a level still below 2%.
Rec ession p ushes defic it ab ove 3% of GDP
In 2008, the government deficit increased to 2.7%
of GDP, from 1.5% in 2007. The revenue ratio fell
by nearly ½ of a percentage point of GDP as the
still healthy growth of direct taxes and social
contributions, supported by the considerable rise in
employment and wages, was offset by the
substantial fall of indirect taxes, which was also
due to discretionary measures. The primary
expenditure-to-GDP ratio increased. Discretionary
measures, including a sizeable increase incompensation of employees, resulted in a 4½%
rise in current primary expenditure, whereas
capital expenditure dropped.
The higher headline deficit in 2008 than in 2007
implied a worsening in the structural balance, i.e.
the balance excluding the effects of the cycle and
one-offs, thus undoing some of the substantial
structural improvement achieved over 2006-2007
to correct the excessive deficit.
The forecast for 2009 and 2010 incorporates theimpact of both the three-year fiscal consolidation
package approved by Parliament last summer and
the measures adopted so far as a response to the
economic downturn in the context of the European
Economic Recovery Plan.
For the current year, the relative soundness of the
banking system and the prudent fiscal response by
the government to the downturn have so far
contained the negative impact of the crisis on the
public finances. Over 2009 as a whole, the
headline deficit is forecast to increase to 4½% of
GDP. The significant reduction in interestexpenditure, thanks to lower short-term interest
rates, will only partly offset the erosion of the
primary surplus linked to the working of the
automatic stabilisers.
Revenues are set to decline in response to the
downturn. Direct taxes paid by corporations will
be hardest hit because of falling profits, despite
some revenue-increasing discretionary measures –
namely, the so-called "Robin Hood tax" on banks,
insurance companies and firms in the energy sector
and one-off taxes to finance the recovery package.Social contributions should decrease in line with
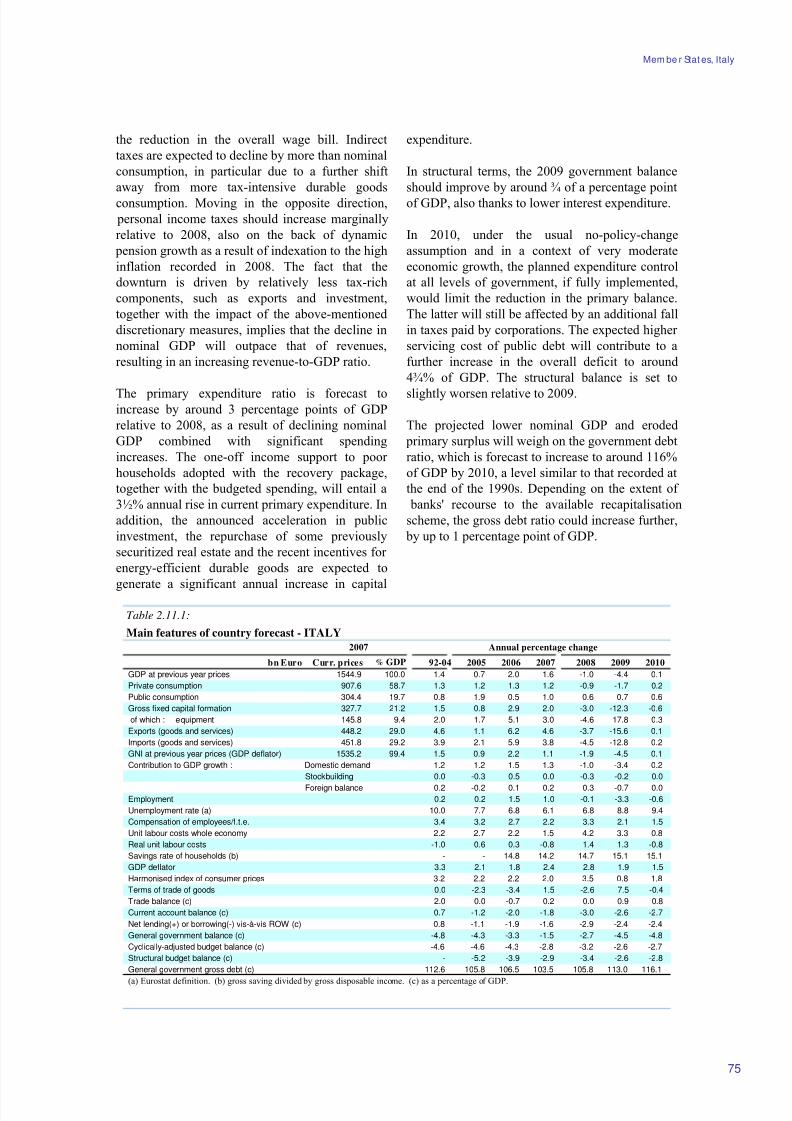
8/14/2019 Economic Forecast 2009
http://slidepdf.com/reader/full/economic-forecast-2009 81/172
Mem be r Stat es, Italy
Table 2.11.1:
Main features of country forecast - ITALY
2007 Annual percentage change
bn Euro Curr. prices % GDP 92-04 2005 2006 2007 2008 2009 2010
GDP at previous year prices 1544.9 100.0 1.4 0.7 2.0 1.6 -1.0 -4.4 0.1
Private consumption 907.6 58.7 1.3 1.2 1.3 1.2 -0.9 -1.7 0.2
Public consumption 304.4 19.7 0.8 1.9 0.5 1.0 0.6 0.7 0.6
Gross fixed capital formation 327.7 21.2 1.5 0.8 2.9 2.0 -3.0 -12.3 -0.6
of which : equipment 145.8 9.4 2.0 1.7 5.1 3.0 -4.6 -17.8 0.3
Exports (goods and services) 448.2 29.0 4.6 1.1 6.2 4.6 -3.7 -15.6 0.1
Imports (goods and services) 451.8 29.2 3.9 2.1 5.9 3.8 -4.5 -12.8 0.2
GNI at previous year prices (GDP deflator) 1535.2 99.4 1.5 0.9 2.2 1.1 -1.9 -4.5 0.1
Contribution to GDP growth : Domestic demand 1.2 1.2 1.5 1.3 -1.0 -3.4 0.2
Stockbuilding 0.0 -0.3 0.5 0.0 -0.3 -0.2 0.0
Foreign balance 0.2 -0.2 0.1 0.2 0.3 -0.7 0.0Employment 0.2 0.2 1.5 1.0 -0.1 -3.3 -0.6
Unemployment rate (a) 10.0 7.7 6.8 6.1 6.8 8.8 9.4
Compensation of employees/f.t.e. 3.4 3.2 2.7 2.2 3.3 2.1 1.5
Unit labour costs whole economy 2.2 2.7 2.2 1.5 4.2 3.3 0.8
Real unit labour costs -1.0 0.6 0.3 -0.8 1.4 1.3 -0.8
Savings rate of households (b) - - 14.8 14.2 14.7 15.1 15.1
GDP deflator 3.3 2.1 1.8 2.4 2.8 1.9 1.5
Harmonised index of consumer prices 3.2 2.2 2.2 2.0 3.5 0.8 1.8
Terms of trade of goods 0.0 -2.3 -3.4 1.5 -2.6 7.5 -0.4
Trade balance (c) 2.0 0.0 -0.7 0.2 0.0 0.9 0.8
Current account balance (c) 0.7 -1.2 -2.0 -1.8 -3.0 -2.6 -2.7
Net lending(+) or borrowing(-) vis-à-vis ROW (c) 0.8 -1.1 -1.9 -1.6 -2.9 -2.4 -2.4
General government balance (c) -4.8 -4.3 -3.3 -1.5 -2.7 -4.5 -4.8
Cyclically-adjusted budget balance (c) -4.6 -4.6 -4.3 -2.8 -3.2 -2.6 -2.7
Structural budget balance (c) - -5.2 -3.9 -2.9 -3.4 -2.6 -2.8
General government gross debt (c) 112.6 105.8 106.5 103.5 105.8 113.0 116.1
(a) Eurostat definition. (b) gross saving divided by gross disposable income. (c) as a percentage of GDP.
75
the reduction in the overall wage bill. Indirect
taxes are expected to decline by more than nominal
consumption, in particular due to a further shift
away from more tax-intensive durable goods
consumption. Moving in the opposite direction,
personal income taxes should increase marginally
relative to 2008, also on the back of dynamic
pension growth as a result of indexation to the high
inflation recorded in 2008. The fact that the
downturn is driven by relatively less tax-rich
components, such as exports and investment,
together with the impact of the above-mentioned
discretionary measures, implies that the decline in
nominal GDP will outpace that of revenues,
resulting in an increasing revenue-to-GDP ratio.
The primary expenditure ratio is forecast toincrease by around 3 percentage points of GDP
relative to 2008, as a result of declining nominal
GDP combined with significant spending
increases. The one-off income support to poor
households adopted with the recovery package,
together with the budgeted spending, will entail a
3½% annual rise in current primary expenditure. In
addition, the announced acceleration in public
investment, the repurchase of some previously
securitized real estate and the recent incentives for
energy-efficient durable goods are expected to
generate a significant annual increase in capital
expenditure.
In structural terms, the 2009 government balance
should improve by around ¾ of a percentage point
of GDP, also thanks to lower interest expenditure.
In 2010, under the usual no-policy-change
assumption and in a context of very moderate
economic growth, the planned expenditure control
at all levels of government, if fully implemented,
would limit the reduction in the primary balance.
The latter will still be affected by an additional fall
in taxes paid by corporations. The expected higher
servicing cost of public debt will contribute to a
further increase in the overall deficit to around
4¾% of GDP. The structural balance is set to
slightly worsen relative to 2009.
The projected lower nominal GDP and eroded
primary surplus will weigh on the government debt
ratio, which is forecast to increase to around 116%
of GDP by 2010, a level similar to that recorded at
the end of the 1990s. Depending on the extent of
banks' recourse to the available recapitalisation
scheme, the gross debt ratio could increase further,
by up to 1 percentage point of GDP.
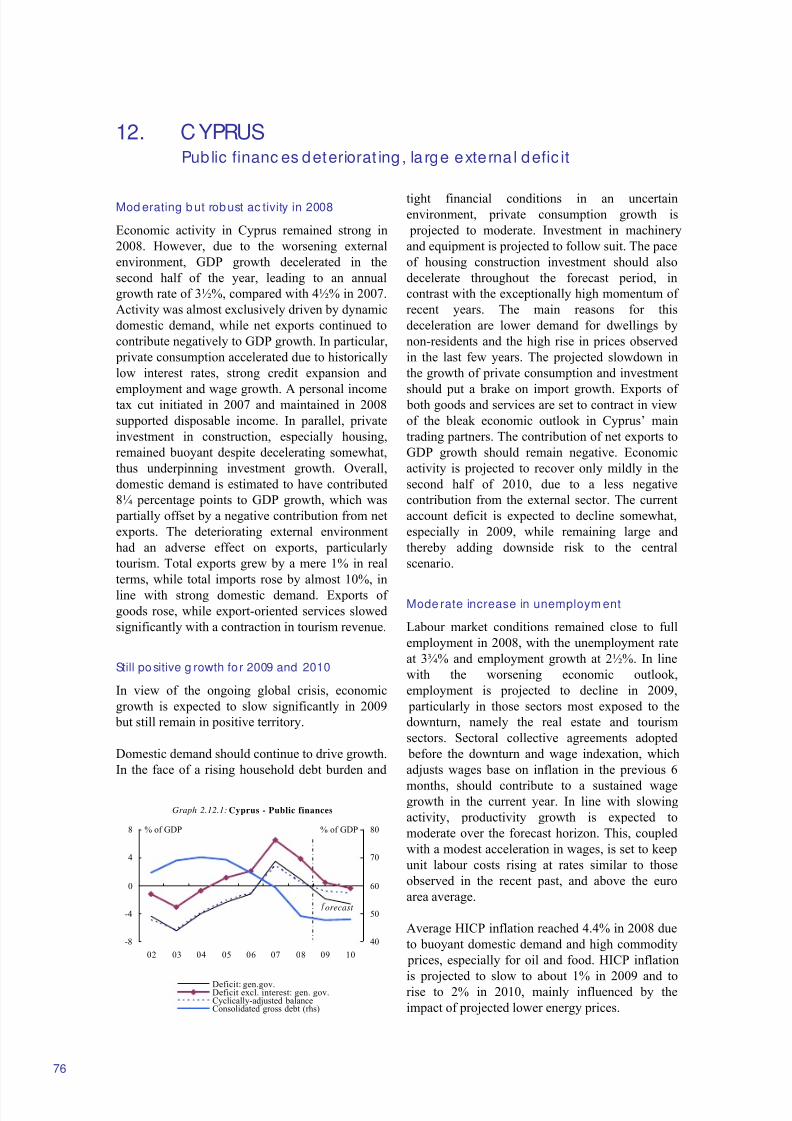
8/14/2019 Economic Forecast 2009
http://slidepdf.com/reader/full/economic-forecast-2009 82/172
12. CYPRUSPub lic financ es deteriorat ing , la rge externa l defic it
Graph 2.12.1: Cyprus - Public finances
-8
-4
0
4
8
02 03 04 05 06 07 08 09 10
40
50
60
70
80
Deficit: gen.gov.Deficit excl. interest: gen. gov.Cyclically-adjusted balanceConsolidated gross debt (rhs)
orecast
% of GDP% of GDP
76
Mod erating b ut robust ac tivity in 2008
Economic activity in Cyprus remained strong in
2008. However, due to the worsening external
environment, GDP growth decelerated in the
second half of the year, leading to an annual
growth rate of 3½%, compared with 4½% in 2007.
Activity was almost exclusively driven by dynamic
domestic demand, while net exports continued to
contribute negatively to GDP growth. In particular,
private consumption accelerated due to historically
low interest rates, strong credit expansion and
employment and wage growth. A personal incometax cut initiated in 2007 and maintained in 2008
supported disposable income. In parallel, private
investment in construction, especially housing,
remained buoyant despite decelerating somewhat,
thus underpinning investment growth. Overall,
domestic demand is estimated to have contributed
8¼ percentage points to GDP growth, which was
partially offset by a negative contribution from net
exports. The deteriorating external environment
had an adverse effect on exports, particularly
tourism. Total exports grew by a mere 1% in real
terms, while total imports rose by almost 10%, in
line with strong domestic demand. Exports of
goods rose, while export-oriented services slowed
significantly with a contraction in tourism revenue.
Still positive g rowth for 2009 and 2010
In view of the ongoing global crisis, economic
growth is expected to slow significantly in 2009
but still remain in positive territory.
Domestic demand should continue to drive growth.
In the face of a rising household debt burden and
tight financial conditions in an uncertainenvironment, private consumption growth is
projected to moderate. Investment in machinery
and equipment is projected to follow suit. The pace
of housing construction investment should also
decelerate throughout the forecast period, in
contrast with the exceptionally high momentum of
recent years. The main reasons for this
deceleration are lower demand for dwellings by
non-residents and the high rise in prices observed
in the last few years. The projected slowdown in
the growth of private consumption and investment
should put a brake on import growth. Exports of both goods and services are set to contract in view
of the bleak economic outlook in Cyprus’ main
trading partners. The contribution of net exports to
GDP growth should remain negative. Economic
activity is projected to recover only mildly in the
second half of 2010, due to a less negative
contribution from the external sector. The current
account deficit is expected to decline somewhat,
especially in 2009, while remaining large and
thereby adding downside risk to the central
scenario.
Mode rate increase in unemploym ent
Labour market conditions remained close to full
employment in 2008, with the unemployment rate
at 3¾% and employment growth at 2½%. In line
with the worsening economic outlook,
employment is projected to decline in 2009,
particularly in those sectors most exposed to the
downturn, namely the real estate and tourism
sectors. Sectoral collective agreements adopted
before the downturn and wage indexation, which
adjusts wages base on inflation in the previous 6
months, should contribute to a sustained wagegrowth in the current year. In line with slowing
activity, productivity growth is expected to
moderate over the forecast horizon. This, coupled
with a modest acceleration in wages, is set to keep
unit labour costs rising at rates similar to those
observed in the recent past, and above the euro
area average.
Average HICP inflation reached 4.4% in 2008 due
to buoyant domestic demand and high commodity
prices, especially for oil and food. HICP inflation
is projected to slow to about 1% in 2009 and torise to 2% in 2010, mainly influenced by the
impact of projected lower energy prices.
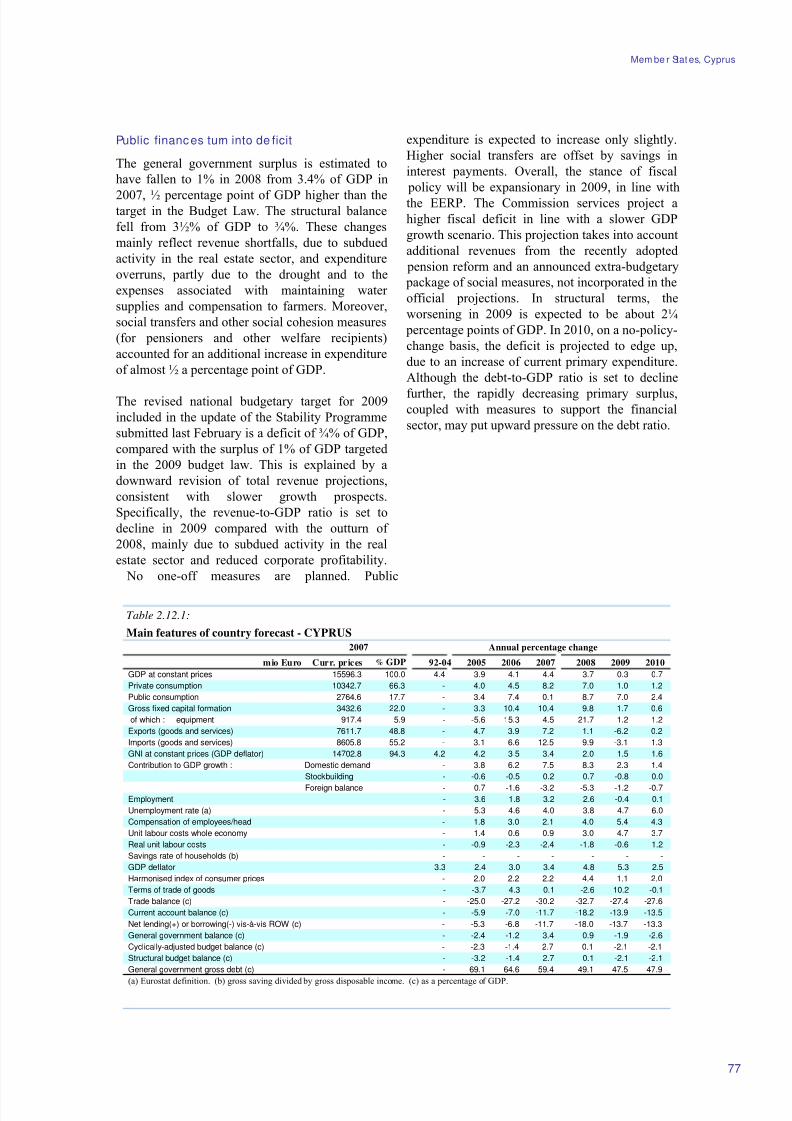
8/14/2019 Economic Forecast 2009
http://slidepdf.com/reader/full/economic-forecast-2009 83/172
Mem be r Stat es, Cyprus
Table 2.12.1:
Main features of country forecast - CYPRUS
2007 Annual percentage change
mio Euro Curr. prices % GDP 92-04 2005 2006 2007 2008 2009 2010
GDP at constant prices 15596.3 100.0 4.4 3.9 4.1 4.4 3.7 0.3 0.7
Private consumption 10342.7 66.3 - 4.0 4.5 8.2 7.0 1.0 1.2
Public consumption 2764.6 17.7 - 3.4 7.4 0.1 8.7 7.0 2.4
Gross fixed capital formation 3432.6 22.0 - 3.3 10.4 10.4 9.8 1.7 0.6
of which : equipment 917.4 5.9 - -5.6 15.3 4.5 21.7 1.2 1.2
Exports (goods and services) 7611.7 48.8 - 4.7 3.9 7.2 1.1 -6.2 0.2
Imports (goods and services) 8605.8 55.2 - 3.1 6.6 12.5 9.9 -3.1 1.3
GNI at constant prices (GDP deflator) 14702.8 94.3 4.2 4.2 3.5 3.4 2.0 1.5 1.6
Contribution to GDP growth : Domestic demand - 3.8 6.2 7.5 8.3 2.3 1.4
Stockbuilding - -0.6 -0.5 0.2 0.7 -0.8 0.0
Foreign balance - 0.7 -1.6 -3.2 -5.3 -1.2 -0.7Employment - 3.6 1.8 3.2 2.6 -0.4 0.1
Unemployment rate (a) - 5.3 4.6 4.0 3.8 4.7 6.0
Compensation of employees/head - 1.8 3.0 2.1 4.0 5.4 4.3
Unit labour costs whole economy - 1.4 0.6 0.9 3.0 4.7 3.7
Real unit labour costs - -0.9 -2.3 -2.4 -1.8 -0.6 1.2
Savings rate of households (b) - - - - - - -
GDP deflator 3.3 2.4 3.0 3.4 4.8 5.3 2.5
Harmonised index of consumer prices - 2.0 2.2 2.2 4.4 1.1 2.0
Terms of trade of goods - -3.7 4.3 0.1 -2.6 10.2 -0.1
Trade balance (c) - -25.0 -27.2 -30.2 -32.7 -27.4 -27.6
Current account balance (c) - -5.9 -7.0 -11.7 -18.2 -13.9 -13.5
Net lending(+) or borrowing(-) vis-à-vis ROW (c) - -5.3 -6.8 -11.7 -18.0 -13.7 -13.3
General government balance (c) - -2.4 -1.2 3.4 0.9 -1.9 -2.6
Cyclically-adjusted budget balance (c) - -2.3 -1.4 2.7 0.1 -2.1 -2.1
Structural budget balance (c) - -3.2 -1.4 2.7 0.1 -2.1 -2.1
General government gross debt (c) - 69.1 64.6 59.4 49.1 47.5 47.9
(a) Eurostat definition. (b) gross saving divided by gross disposable income. (c) as a percentage of GDP.
77
Public finances turn into de ficit
The general government surplus is estimated to
have fallen to 1% in 2008 from 3.4% of GDP in
2007, ½ percentage point of GDP higher than thetarget in the Budget Law. The structural balance
fell from 3½% of GDP to ¾%. These changes
mainly reflect revenue shortfalls, due to subdued
activity in the real estate sector, and expenditure
overruns, partly due to the drought and to the
expenses associated with maintaining water
supplies and compensation to farmers. Moreover,
social transfers and other social cohesion measures
(for pensioners and other welfare recipients)
accounted for an additional increase in expenditure
of almost ½ a percentage point of GDP.
The revised national budgetary target for 2009
included in the update of the Stability Programme
submitted last February is a deficit of ¾% of GDP,
compared with the surplus of 1% of GDP targeted
in the 2009 budget law. This is explained by a
downward revision of total revenue projections,
consistent with slower growth prospects.
Specifically, the revenue-to-GDP ratio is set to
decline in 2009 compared with the outturn of
2008, mainly due to subdued activity in the real
estate sector and reduced corporate profitability.
No one-off measures are planned. Public
expenditure is expected to increase only slightly.
Higher social transfers are offset by savings in
interest payments. Overall, the stance of fiscal
policy will be expansionary in 2009, in line with
the EERP. The Commission services project a
higher fiscal deficit in line with a slower GDP
growth scenario. This projection takes into account
additional revenues from the recently adopted
pension reform and an announced extra-budgetary
package of social measures, not incorporated in the
official projections. In structural terms, the
worsening in 2009 is expected to be about 2¼
percentage points of GDP. In 2010, on a no-policy-
change basis, the deficit is projected to edge up,
due to an increase of current primary expenditure.
Although the debt-to-GDP ratio is set to decline
further, the rapidly decreasing primary surplus,coupled with measures to support the financial
sector, may put upward pressure on the debt ratio.
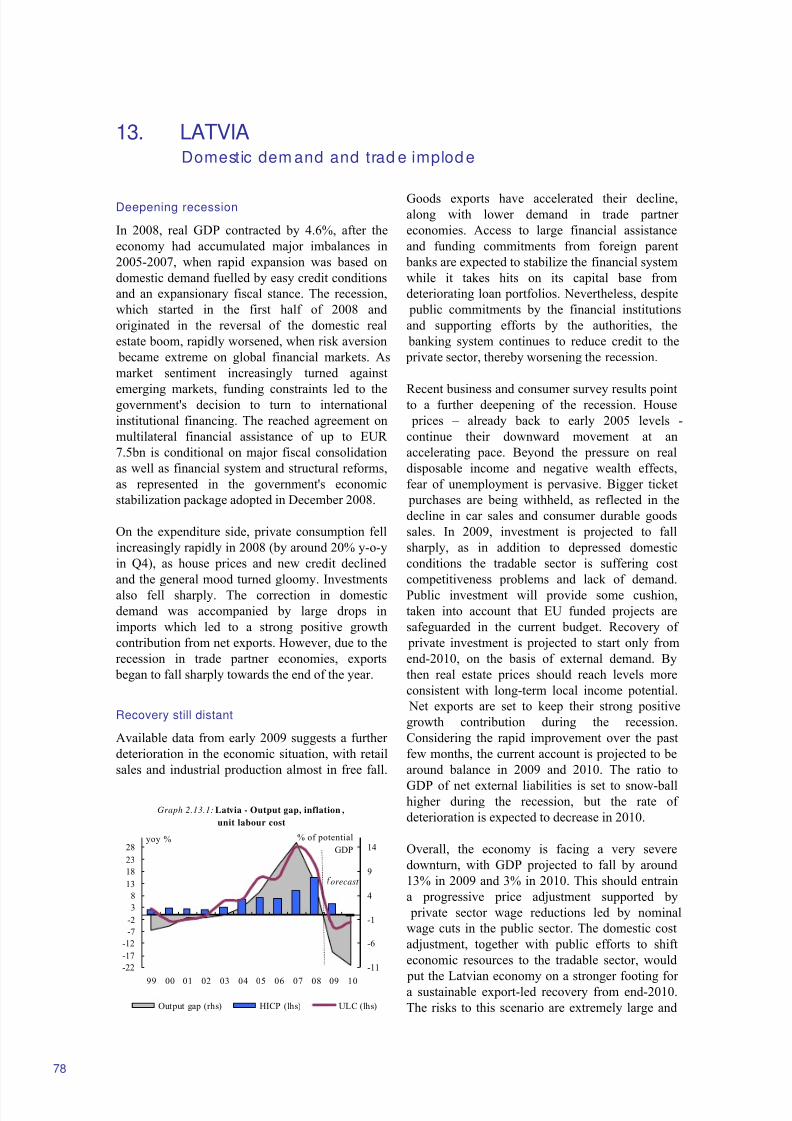
8/14/2019 Economic Forecast 2009
http://slidepdf.com/reader/full/economic-forecast-2009 84/172
13. LATVIADomestic dem and and trad e implod e
Graph 2.13.1: Latvia - Output gap, inflation ,
unit labour cost
-22
-17
-12
-7
-2
3
8
13
18
23
28
99 00 01 02 03 04 05 06 07 08 09 10
yoy %
-11
-6
-1
4
9
14
Output gap (rhs) HICP (lhs) ULC (lhs)
orecast
% of potential
GDP
78
Deepening recession
In 2008, real GDP contracted by 4.6%, after the
economy had accumulated major imbalances in
2005-2007, when rapid expansion was based on
domestic demand fuelled by easy credit conditions
and an expansionary fiscal stance. The recession,
which started in the first half of 2008 and
originated in the reversal of the domestic real
estate boom, rapidly worsened, when risk aversion
became extreme on global financial markets. As
market sentiment increasingly turned against
emerging markets, funding constraints led to thegovernment's decision to turn to international
institutional financing. The reached agreement on
multilateral financial assistance of up to EUR
7.5bn is conditional on major fiscal consolidation
as well as financial system and structural reforms,
as represented in the government's economic
stabilization package adopted in December 2008.
On the expenditure side, private consumption fell
increasingly rapidly in 2008 (by around 20% y-o-y
in Q4), as house prices and new credit declined
and the general mood turned gloomy. Investments
also fell sharply. The correction in domestic
demand was accompanied by large drops in
imports which led to a strong positive growth
contribution from net exports. However, due to the
recession in trade partner economies, exports
began to fall sharply towards the end of the year.
Recovery still distant
Available data from early 2009 suggests a further
deterioration in the economic situation, with retail
sales and industrial production almost in free fall.
Goods exports have accelerated their decline,along with lower demand in trade partner
economies. Access to large financial assistance
and funding commitments from foreign parent
banks are expected to stabilize the financial system
while it takes hits on its capital base from
deteriorating loan portfolios. Nevertheless, despite
public commitments by the financial institutions
and supporting efforts by the authorities, the
banking system continues to reduce credit to the
private sector, thereby worsening the recession.
Recent business and consumer survey results pointto a further deepening of the recession. House
prices – already back to early 2005 levels -
continue their downward movement at an
accelerating pace. Beyond the pressure on real
disposable income and negative wealth effects,
fear of unemployment is pervasive. Bigger ticket
purchases are being withheld, as reflected in the
decline in car sales and consumer durable goods
sales. In 2009, investment is projected to fall
sharply, as in addition to depressed domestic
conditions the tradable sector is suffering cost
competitiveness problems and lack of demand.
Public investment will provide some cushion,
taken into account that EU funded projects are
safeguarded in the current budget. Recovery of
private investment is projected to start only from
end-2010, on the basis of external demand. By
then real estate prices should reach levels more
consistent with long-term local income potential.
Net exports are set to keep their strong positive
growth contribution during the recession.
Considering the rapid improvement over the past
few months, the current account is projected to be
around balance in 2009 and 2010. The ratio to
GDP of net external liabilities is set to snow-ballhigher during the recession, but the rate of
deterioration is expected to decrease in 2010.
Overall, the economy is facing a very severe
downturn, with GDP projected to fall by around
13% in 2009 and 3% in 2010. This should entrain
a progressive price adjustment supported by
private sector wage reductions led by nominal
wage cuts in the public sector. The domestic cost
adjustment, together with public efforts to shift
economic resources to the tradable sector, would
put the Latvian economy on a stronger footing for a sustainable export-led recovery from end-2010.
The risks to this scenario are extremely large and
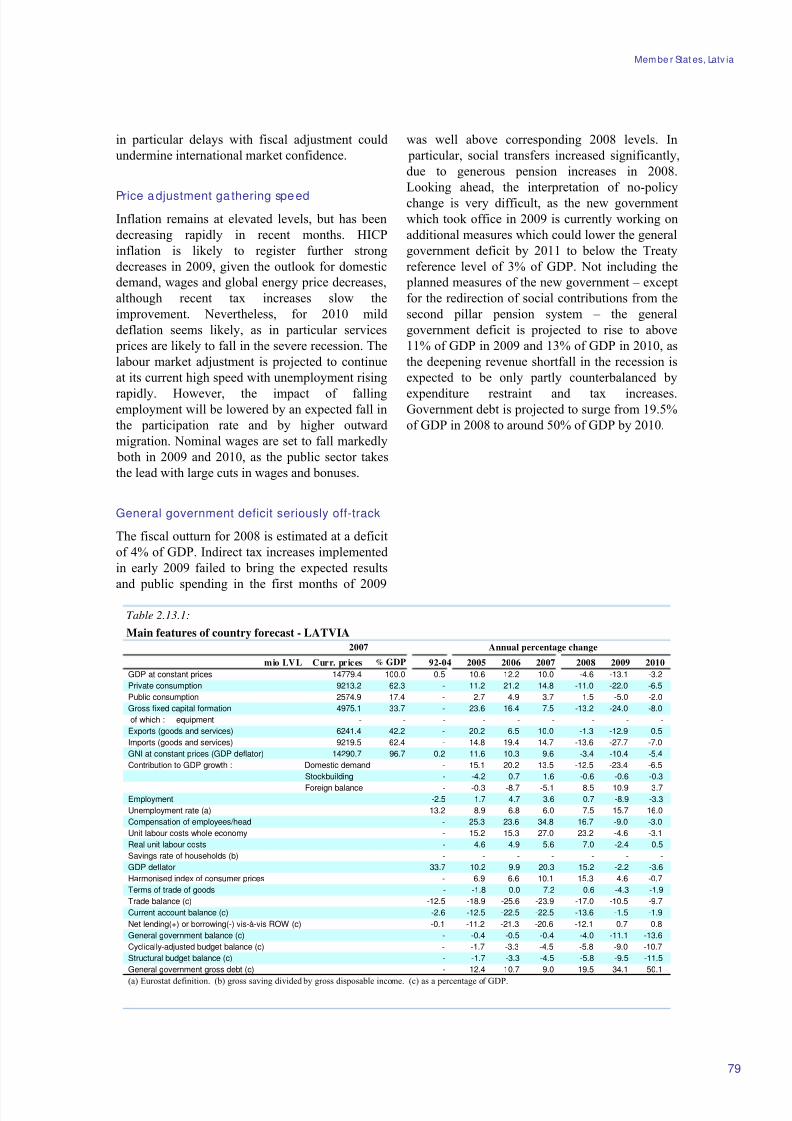
8/14/2019 Economic Forecast 2009
http://slidepdf.com/reader/full/economic-forecast-2009 85/172
Mem be r Stat es, Latv ia
Table 2.13.1:
Main features of country forecast - LATVIA
2007 Annual percentage change
mio LVL Curr. prices % GDP 92-04 2005 2006 2007 2008 2009 2010
GDP at constant prices 14779.4 100.0 0.5 10.6 12.2 10.0 -4.6 -13.1 -3.2
Private consumption 9213.2 62.3 - 11.2 21.2 14.8 -11.0 -22.0 -6.5
Public consumption 2574.9 17.4 - 2.7 4.9 3.7 1.5 -5.0 -2.0
Gross fixed capital formation 4975.1 33.7 - 23.6 16.4 7.5 -13.2 -24.0 -8.0
of which : equipment - - - - - - - - -
Exports (goods and services) 6241.4 42.2 - 20.2 6.5 10.0 -1.3 -12.9 0.5
Imports (goods and services) 9219.5 62.4 - 14.8 19.4 14.7 -13.6 -27.7 -7.0
GNI at constant prices (GDP deflator) 14290.7 96.7 0.2 11.6 10.3 9.6 -3.4 -10.4 -5.4
Contribution to GDP growth : Domestic demand - 15.1 20.2 13.5 -12.5 -23.4 -6.5
Stockbuilding - -4.2 0.7 1.6 -0.6 -0.6 -0.3
Foreign balance - -0.3 -8.7 -5.1 8.5 10.9 3.7Employment -2.5 1.7 4.7 3.6 0.7 -8.9 -3.3
Unemployment rate (a) 13.2 8.9 6.8 6.0 7.5 15.7 16.0
Compensation of employees/head - 25.3 23.6 34.8 16.7 -9.0 -3.0
Unit labour costs whole economy - 15.2 15.3 27.0 23.2 -4.6 -3.1
Real unit labour costs - 4.6 4.9 5.6 7.0 -2.4 0.5
Savings rate of households (b) - - - - - - -
GDP deflator 33.7 10.2 9.9 20.3 15.2 -2.2 -3.6
Harmonised index of consumer prices - 6.9 6.6 10.1 15.3 4.6 -0.7
Terms of trade of goods - -1.8 0.0 7.2 0.6 -4.3 -1.9
Trade balance (c) -12.5 -18.9 -25.6 -23.9 -17.0 -10.5 -9.7
Current account balance (c) -2.6 -12.5 -22.5 -22.5 -13.6 -1.5 -1.9
Net lending(+) or borrowing(-) vis-à-vis ROW (c) -0.1 -11.2 -21.3 -20.6 -12.1 0.7 0.8
General government balance (c) - -0.4 -0.5 -0.4 -4.0 -11.1 -13.6
Cyclically-adjusted budget balance (c) - -1.7 -3.3 -4.5 -5.8 -9.0 -10.7
Structural budget balance (c) - -1.7 -3.3 -4.5 -5.8 -9.5 -11.5
General government gross debt (c) - 12.4 10.7 9.0 19.5 34.1 50.1
(a) Eurostat definition. (b) gross saving divided by gross disposable income. (c) as a percentage of GDP.
79
in particular delays with fiscal adjustment could
undermine international market confidence.
Price adjustment ga thering speed
Inflation remains at elevated levels, but has been
decreasing rapidly in recent months. HICP
inflation is likely to register further strong
decreases in 2009, given the outlook for domestic
demand, wages and global energy price decreases,
although recent tax increases slow the
improvement. Nevertheless, for 2010 mild
deflation seems likely, as in particular services
prices are likely to fall in the severe recession. The
labour market adjustment is projected to continue
at its current high speed with unemployment rising
rapidly. However, the impact of fallingemployment will be lowered by an expected fall in
the participation rate and by higher outward
migration. Nominal wages are set to fall markedly
both in 2009 and 2010, as the public sector takes
the lead with large cuts in wages and bonuses.
General government deficit seriously off-track
The fiscal outturn for 2008 is estimated at a deficit
of 4% of GDP. Indirect tax increases implemented
in early 2009 failed to bring the expected results
and public spending in the first months of 2009
was well above corresponding 2008 levels. In
particular, social transfers increased significantly,
due to generous pension increases in 2008.
Looking ahead, the interpretation of no-policy
change is very difficult, as the new government
which took office in 2009 is currently working on
additional measures which could lower the general
government deficit by 2011 to below the Treaty
reference level of 3% of GDP. Not including the
planned measures of the new government – except
for the redirection of social contributions from the
second pillar pension system – the general
government deficit is projected to rise to above
11% of GDP in 2009 and 13% of GDP in 2010, as
the deepening revenue shortfall in the recession is
expected to be only partly counterbalanced by
expenditure restraint and tax increases.Government debt is projected to surge from 19.5%
of GDP in 2008 to around 50% of GDP by 2010.
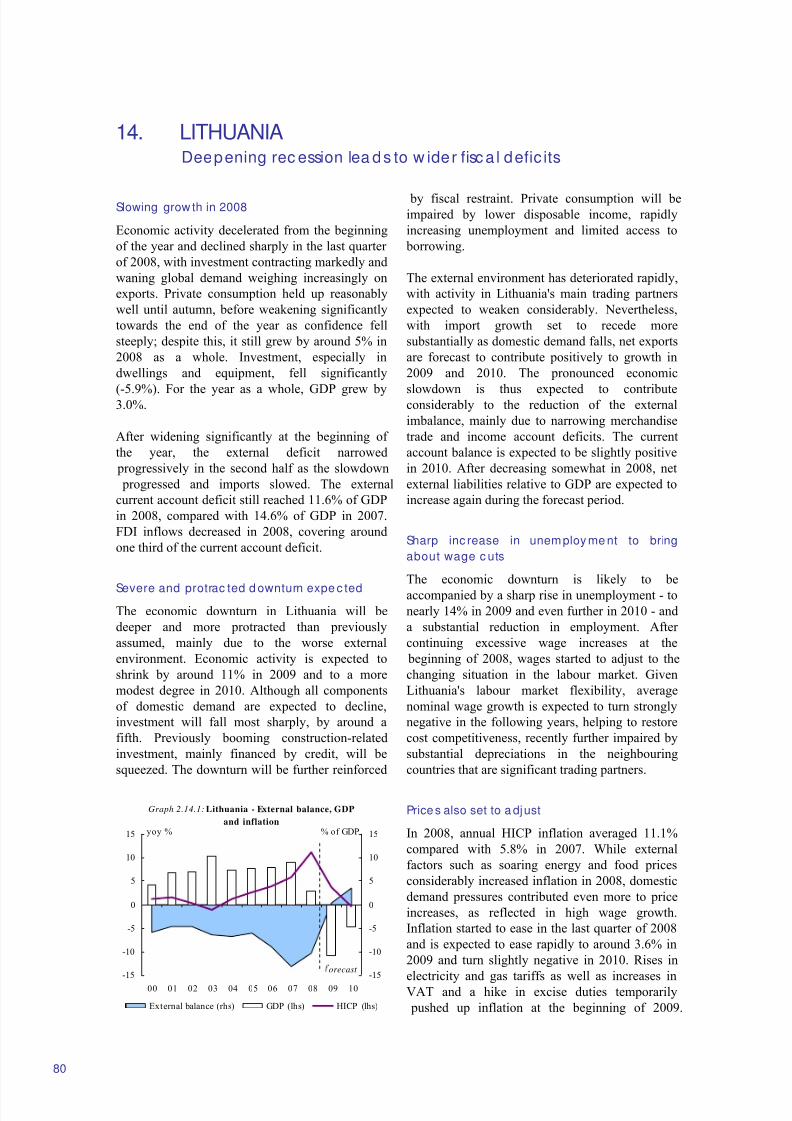
8/14/2019 Economic Forecast 2009
http://slidepdf.com/reader/full/economic-forecast-2009 86/172
14. LITHUANIADeepening rec ession lea ds to w ider fisc a l defic its
Graph 2.14.1: Lithuania - External balance, GDP
and inflation
-15
-10
-5
0
5
10
15
00 01 02 03 04 05 06 07 08 09 10
-15
-10
-5
0
5
10
15
External balance (rhs) GDP (lhs) HICP (lhs)
orecast
yoy % % of GDP
80
Slowing grow th in 2008
Economic activity decelerated from the beginning
of the year and declined sharply in the last quarter
of 2008, with investment contracting markedly and
waning global demand weighing increasingly on
exports. Private consumption held up reasonably
well until autumn, before weakening significantly
towards the end of the year as confidence fell
steeply; despite this, it still grew by around 5% in
2008 as a whole. Investment, especially in
dwellings and equipment, fell significantly
(-5.9%). For the year as a whole, GDP grew by3.0%.
After widening significantly at the beginning of
the year, the external deficit narrowed
progressively in the second half as the slowdown
progressed and imports slowed. The external
current account deficit still reached 11.6% of GDP
in 2008, compared with 14.6% of GDP in 2007.
FDI inflows decreased in 2008, covering around
one third of the current account deficit.
Severe and protrac ted d ownturn expe c ted
The economic downturn in Lithuania will be
deeper and more protracted than previously
assumed, mainly due to the worse external
environment. Economic activity is expected to
shrink by around 11% in 2009 and to a more
modest degree in 2010. Although all components
of domestic demand are expected to decline,
investment will fall most sharply, by around a
fifth. Previously booming construction-related
investment, mainly financed by credit, will be
squeezed. The downturn will be further reinforced
by fiscal restraint. Private consumption will beimpaired by lower disposable income, rapidly
increasing unemployment and limited access to
borrowing.
The external environment has deteriorated rapidly,
with activity in Lithuania's main trading partners
expected to weaken considerably. Nevertheless,
with import growth set to recede more
substantially as domestic demand falls, net exports
are forecast to contribute positively to growth in
2009 and 2010. The pronounced economic
slowdown is thus expected to contributeconsiderably to the reduction of the external
imbalance, mainly due to narrowing merchandise
trade and income account deficits. The current
account balance is expected to be slightly positive
in 2010. After decreasing somewhat in 2008, net
external liabilities relative to GDP are expected to
increase again during the forecast period.
Sharp inc rease in unemploy me nt to bring
about wage c uts
The economic downturn is likely to be
accompanied by a sharp rise in unemployment - to
nearly 14% in 2009 and even further in 2010 - and
a substantial reduction in employment. After
continuing excessive wage increases at the
beginning of 2008, wages started to adjust to the
changing situation in the labour market. Given
Lithuania's labour market flexibility, average
nominal wage growth is expected to turn strongly
negative in the following years, helping to restore
cost competitiveness, recently further impaired by
substantial depreciations in the neighbouring
countries that are significant trading partners.
Prices also set to a djust
In 2008, annual HICP inflation averaged 11.1%
compared with 5.8% in 2007. While external
factors such as soaring energy and food prices
considerably increased inflation in 2008, domestic
demand pressures contributed even more to price
increases, as reflected in high wage growth.
Inflation started to ease in the last quarter of 2008
and is expected to ease rapidly to around 3.6% in
2009 and turn slightly negative in 2010. Rises in
electricity and gas tariffs as well as increases inVAT and a hike in excise duties temporarily
pushed up inflation at the beginning of 2009.
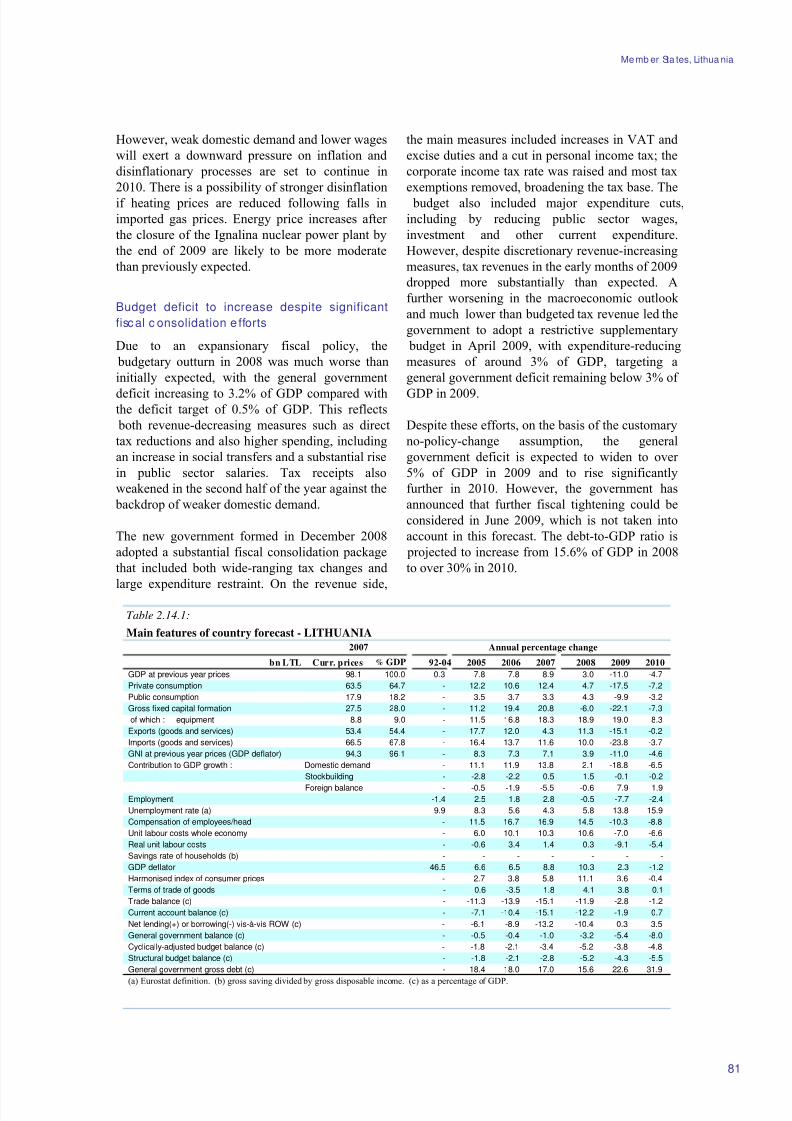
8/14/2019 Economic Forecast 2009
http://slidepdf.com/reader/full/economic-forecast-2009 87/172
Memb er Sta tes, Lithua nia
Table 2.14.1:
Main features of country forecast - LITHUANIA
2007 Annual percentage change
bn LTL Curr. prices % GDP 92-04 2005 2006 2007 2008 2009 2010
GDP at previous year prices 98.1 100.0 0.3 7.8 7.8 8.9 3.0 -11.0 -4.7
Private consumption 63.5 64.7 - 12.2 10.6 12.4 4.7 -17.5 -7.2
Public consumption 17.9 18.2 - 3.5 3.7 3.3 4.3 -9.9 -3.2
Gross fixed capital formation 27.5 28.0 - 11.2 19.4 20.8 -6.0 -22.1 -7.3
of which : equipment 8.8 9.0 - 11.5 16.8 18.3 -18.9 -19.0 -8.3
Exports (goods and services) 53.4 54.4 - 17.7 12.0 4.3 11.3 -15.1 -0.2
Imports (goods and services) 66.5 67.8 - 16.4 13.7 11.6 10.0 -23.8 -3.7
GNI at previous year prices (GDP deflator) 94.3 96.1 - 8.3 7.3 7.1 3.9 -11.0 -4.6
Contribution to GDP growth : Domestic demand - 11.1 11.9 13.8 2.1 -18.8 -6.5
Stockbuilding - -2.8 -2.2 0.5 1.5 -0.1 -0.2
Foreign balance - -0.5 -1.9 -5.5 -0.6 7.9 1.9Employment -1.4 2.5 1.8 2.8 -0.5 -7.7 -2.4
Unemployment rate (a) 9.9 8.3 5.6 4.3 5.8 13.8 15.9
Compensation of employees/head - 11.5 16.7 16.9 14.5 -10.3 -8.8
Unit labour costs whole economy - 6.0 10.1 10.3 10.6 -7.0 -6.6
Real unit labour costs - -0.6 3.4 1.4 0.3 -9.1 -5.4
Savings rate of households (b) - - - - - - -
GDP deflator 46.5 6.6 6.5 8.8 10.3 2.3 -1.2
Harmonised index of consumer prices - 2.7 3.8 5.8 11.1 3.6 -0.4
Terms of trade of goods - 0.6 -3.5 1.8 4.1 3.8 0.1
Trade balance (c) - -11.3 -13.9 -15.1 -11.9 -2.8 -1.2
Current account balance (c) - -7.1 -10.4 -15.1 -12.2 -1.9 0.7
Net lending(+) or borrowing(-) vis-à-vis ROW (c) - -6.1 -8.9 -13.2 -10.4 0.3 3.5
General government balance (c) - -0.5 -0.4 -1.0 -3.2 -5.4 -8.0
Cyclically-adjusted budget balance (c) - -1.8 -2.1 -3.4 -5.2 -3.8 -4.8
Structural budget balance (c) - -1.8 -2.1 -2.8 -5.2 -4.3 -5.5
General government gross debt (c) - 18.4 18.0 17.0 15.6 22.6 31.9
(a) Eurostat definition. (b) gross saving divided by gross disposable income. (c) as a percentage of GDP.
81
However, weak domestic demand and lower wages
will exert a downward pressure on inflation and
disinflationary processes are set to continue in
2010. There is a possibility of stronger disinflation
if heating prices are reduced following falls in
imported gas prices. Energy price increases after
the closure of the Ignalina nuclear power plant by
the end of 2009 are likely to be more moderate
than previously expected.
Budget deficit to increase despite significant
fiscal c onsolidation e fforts
Due to an expansionary fiscal policy, the
budgetary outturn in 2008 was much worse than
initially expected, with the general government
deficit increasing to 3.2% of GDP compared withthe deficit target of 0.5% of GDP. This reflects
both revenue-decreasing measures such as direct
tax reductions and also higher spending, including
an increase in social transfers and a substantial rise
in public sector salaries. Tax receipts also
weakened in the second half of the year against the
backdrop of weaker domestic demand.
The new government formed in December 2008
adopted a substantial fiscal consolidation package
that included both wide-ranging tax changes and
large expenditure restraint. On the revenue side,
the main measures included increases in VAT and
excise duties and a cut in personal income tax; the
corporate income tax rate was raised and most tax
exemptions removed, broadening the tax base. The
budget also included major expenditure cuts,
including by reducing public sector wages,
investment and other current expenditure.
However, despite discretionary revenue-increasing
measures, tax revenues in the early months of 2009
dropped more substantially than expected. A
further worsening in the macroeconomic outlook
and much lower than budgeted tax revenue led the
government to adopt a restrictive supplementary
budget in April 2009, with expenditure-reducing
measures of around 3% of GDP, targeting a
general government deficit remaining below 3% of
GDP in 2009.
Despite these efforts, on the basis of the customary
no-policy-change assumption, the general
government deficit is expected to widen to over
5% of GDP in 2009 and to rise significantly
further in 2010. However, the government has
announced that further fiscal tightening could be
considered in June 2009, which is not taken into
account in this forecast. The debt-to-GDP ratio is
projected to increase from 15.6% of GDP in 2008
to over 30% in 2010.
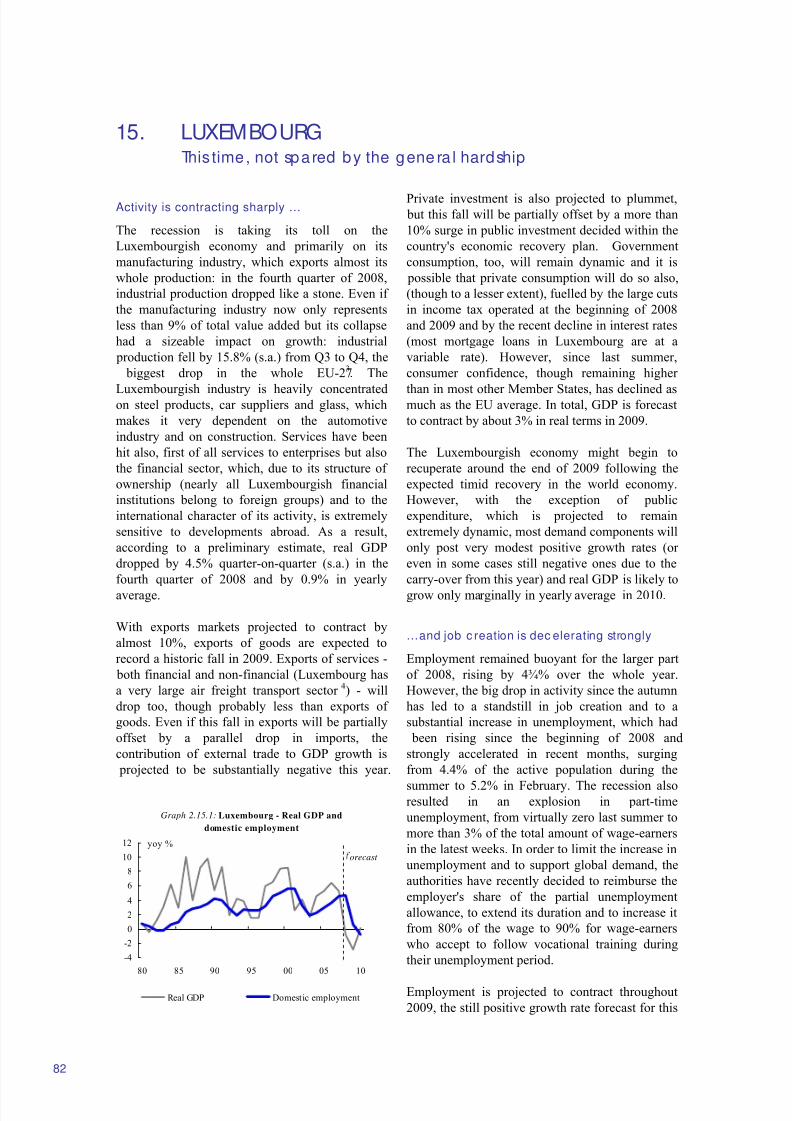
8/14/2019 Economic Forecast 2009
http://slidepdf.com/reader/full/economic-forecast-2009 88/172
15. LUXEMBOURGThis time, not spared by the gene ra l hardship
Graph 2.15.1: Luxembourg - Real GDP and
domestic employment
-4
-2
0
2
4
6
8
10
12
80 85 90 95 00 05 10
yoy %
Real GDP Domestic employment
orecast
82
Activity is contracting sharply …
The recession is taking its toll on the
Luxembourgish economy and primarily on its
manufacturing industry, which exports almost its
whole production: in the fourth quarter of 2008,
industrial production dropped like a stone. Even if
the manufacturing industry now only represents
less than 9% of total value added but its collapse
had a sizeable impact on growth: industrial
production fell by 15.8% (s.a.) from Q3 to Q4, the
biggest drop in the whole EU-273. The
Luxembourgish industry is heavily concentratedon steel products, car suppliers and glass, which
makes it very dependent on the automotive
industry and on construction. Services have been
hit also, first of all services to enterprises but also
the financial sector, which, due to its structure of
ownership (nearly all Luxembourgish financial
institutions belong to foreign groups) and to the
international character of its activity, is extremely
sensitive to developments abroad. As a result,
according to a preliminary estimate, real GDP
dropped by 4.5% quarter-on-quarter (s.a.) in the
fourth quarter of 2008 and by 0.9% in yearly
average.
With exports markets projected to contract by
almost 10%, exports of goods are expected to
record a historic fall in 2009. Exports of services -
both financial and non-financial (Luxembourg has
a very large air freight transport sector 4) - will
drop too, though probably less than exports of
goods. Even if this fall in exports will be partially
offset by a parallel drop in imports, the
contribution of external trade to GDP growth is
projected to be substantially negative this year.
Private investment is also projected to plummet, but this fall will be partially offset by a more than
10% surge in public investment decided within the
country's economic recovery plan. Government
consumption, too, will remain dynamic and it is
possible that private consumption will do so also,
(though to a lesser extent), fuelled by the large cuts
in income tax operated at the beginning of 2008
and 2009 and by the recent decline in interest rates
(most mortgage loans in Luxembourg are at a
variable rate). However, since last summer,
consumer confidence, though remaining higher
than in most other Member States, has declined asmuch as the EU average. In total, GDP is forecast
to contract by about 3% in real terms in 2009.
The Luxembourgish economy might begin to
recuperate around the end of 2009 following the
expected timid recovery in the world economy.
However, with the exception of public
expenditure, which is projected to remain
extremely dynamic, most demand components will
only post very modest positive growth rates (or
even in some cases still negative ones due to the
carry-over from this year) and real GDP is likely to
grow only marginally in yearly average in 2010.
…and job c reation is dec elerating strongly
Employment remained buoyant for the larger part
of 2008, rising by 4¾% over the whole year.
However, the big drop in activity since the autumn
has led to a standstill in job creation and to a
substantial increase in unemployment, which had
been rising since the beginning of 2008 and
strongly accelerated in recent months, surging
from 4.4% of the active population during the
summer to 5.2% in February. The recession alsoresulted in an explosion in part-time
unemployment, from virtually zero last summer to
more than 3% of the total amount of wage-earners
in the latest weeks. In order to limit the increase in
unemployment and to support global demand, the
authorities have recently decided to reimburse the
employer's share of the partial unemployment
allowance, to extend its duration and to increase it
from 80% of the wage to 90% for wage-earners
who accept to follow vocational training during
their unemployment period.
Employment is projected to contract throughout
2009, the still positive growth rate forecast for this
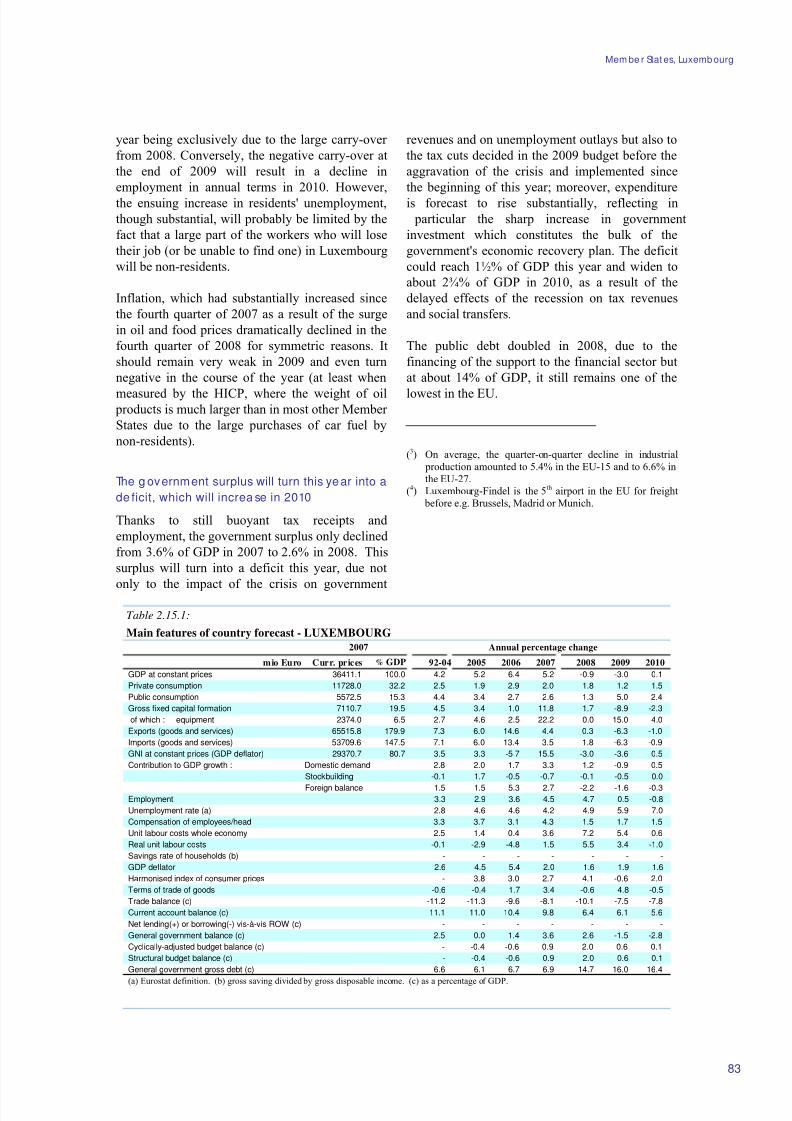
8/14/2019 Economic Forecast 2009
http://slidepdf.com/reader/full/economic-forecast-2009 89/172
Mem be r Stat es, Luxemb ourg
Table 2.15.1:
Main features of country forecast - LUXEMBOURG
2007 Annual percentage change
mio Euro Curr. prices % GDP 92-04 2005 2006 2007 2008 2009 2010
GDP at constant prices 36411.1 100.0 4.2 5.2 6.4 5.2 -0.9 -3.0 0.1
Private consumption 11728.0 32.2 2.5 1.9 2.9 2.0 1.8 1.2 1.5
Public consumption 5572.5 15.3 4.4 3.4 2.7 2.6 1.3 5.0 2.4
Gross fixed capital formation 7110.7 19.5 4.5 3.4 1.0 11.8 1.7 -8.9 -2.3
of which : equipment 2374.0 6.5 2.7 4.6 2.5 22.2 0.0 -15.0 -4.0
Exports (goods and services) 65515.8 179.9 7.3 6.0 14.6 4.4 0.3 -6.3 -1.0
Imports (goods and services) 53709.6 147.5 7.1 6.0 13.4 3.5 1.8 -6.3 -0.9
GNI at constant prices (GDP deflator) 29370.7 80.7 3.5 3.3 -5.7 15.5 -3.0 -3.6 0.5
Contribution to GDP growth : Domestic demand 2.8 2.0 1.7 3.3 1.2 -0.9 0.5
Stockbuilding -0.1 1.7 -0.5 -0.7 -0.1 -0.5 0.0
Foreign balance 1.5 1.5 5.3 2.7 -2.2 -1.6 -0.3Employment 3.3 2.9 3.6 4.5 4.7 0.5 -0.8
Unemployment rate (a) 2.8 4.6 4.6 4.2 4.9 5.9 7.0
Compensation of employees/head 3.3 3.7 3.1 4.3 1.5 1.7 1.5
Unit labour costs whole economy 2.5 1.4 0.4 3.6 7.2 5.4 0.6
Real unit labour costs -0.1 -2.9 -4.8 1.5 5.5 3.4 -1.0
Savings rate of households (b) - - - - - - -
GDP deflator 2.6 4.5 5.4 2.0 1.6 1.9 1.6
Harmonised index of consumer prices - 3.8 3.0 2.7 4.1 -0.6 2.0
Terms of trade of goods -0.6 -0.4 1.7 3.4 -0.6 4.8 -0.5
Trade balance (c) -11.2 -11.3 -9.6 -8.1 -10.1 -7.5 -7.8
Current account balance (c) 11.1 11.0 10.4 9.8 6.4 6.1 5.6
Net lending(+) or borrowing(-) vis-à-vis ROW (c) - - - - - - -
General government balance (c) 2.5 0.0 1.4 3.6 2.6 -1.5 -2.8
Cyclically-adjusted budget balance (c) - -0.4 -0.6 0.9 2.0 0.6 0.1
Structural budget balance (c) - -0.4 -0.6 0.9 2.0 0.6 0.1
General government gross debt (c) 6.6 6.1 6.7 6.9 14.7 16.0 16.4
(a) Eurostat definition. (b) gross saving divided by gross disposable income. (c) as a percentage of GDP.
83
year being exclusively due to the large carry-over
from 2008. Conversely, the negative carry-over at
the end of 2009 will result in a decline in
employment in annual terms in 2010. However,
the ensuing increase in residents' unemployment,
though substantial, will probably be limited by the
fact that a large part of the workers who will lose
their job (or be unable to find one) in Luxembourg
will be non-residents.
Inflation, which had substantially increased since
the fourth quarter of 2007 as a result of the surge
in oil and food prices dramatically declined in the
fourth quarter of 2008 for symmetric reasons. It
should remain very weak in 2009 and even turn
negative in the course of the year (at least when
measured by the HICP, where the weight of oil products is much larger than in most other Member
States due to the large purchases of car fuel by
non-residents).
The g overnment surplus will turn this year into a
de ficit, which will increa se in 2010
Thanks to still buoyant tax receipts and
employment, the government surplus only declined
from 3.6% of GDP in 2007 to 2.6% in 2008. This
surplus will turn into a deficit this year, due not
only to the impact of the crisis on government
revenues and on unemployment outlays but also to
the tax cuts decided in the 2009 budget before the
aggravation of the crisis and implemented since
the beginning of this year; moreover, expenditure
is forecast to rise substantially, reflecting in
particular the sharp increase in government
investment which constitutes the bulk of the
government's economic recovery plan. The deficit
could reach 1½% of GDP this year and widen to
about 2¾% of GDP in 2010, as a result of the
delayed effects of the recession on tax revenues
and social transfers.
The public debt doubled in 2008, due to the
financing of the support to the financial sector but
at about 14% of GDP, it still remains one of the
lowest in the EU.
(3) On average, the quarter-on-quarter decline in industrial production amounted to 5.4% in the EU-15 and to 6.6% inthe EU-27.
(4) Luxembourg-Findel is the 5th airport in the EU for freight before e.g. Brussels, Madrid or Munich.
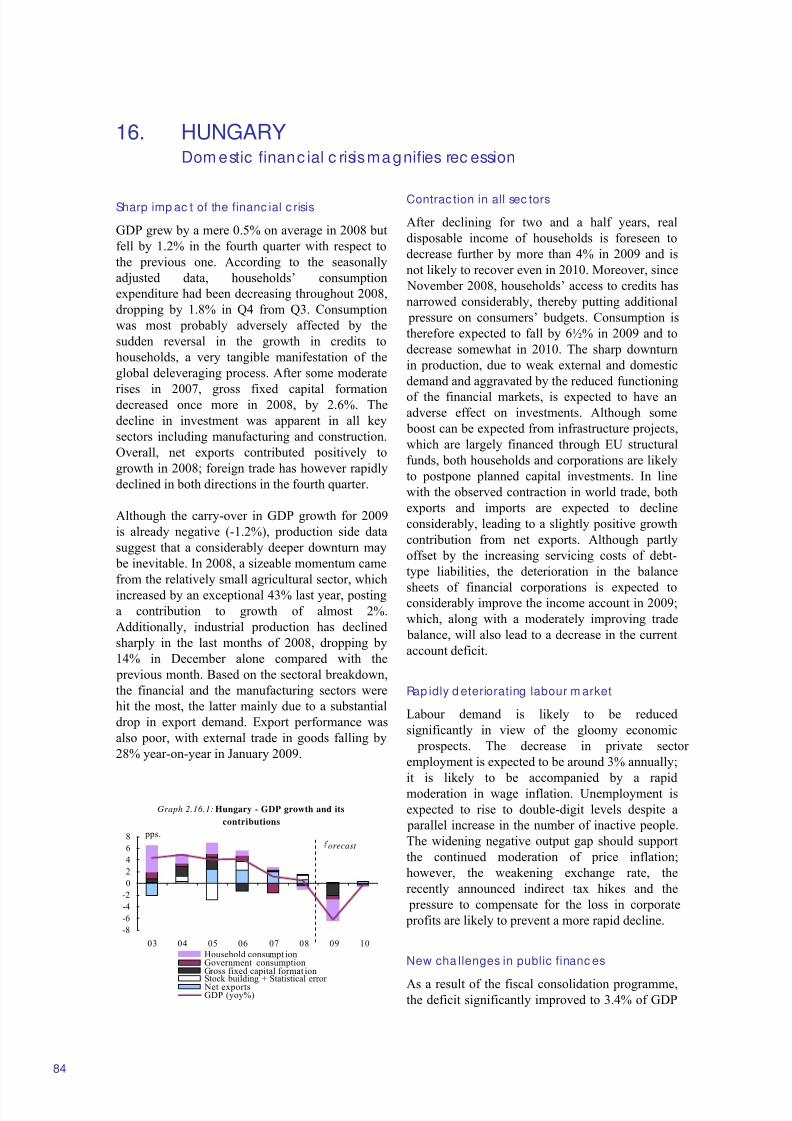
8/14/2019 Economic Forecast 2009
http://slidepdf.com/reader/full/economic-forecast-2009 90/172
16. HUNGARYDom estic financ ial c risis magnifies rec ession
Graph 2.16.1: Hungary - GDP growth and its
contributions
-8
-6
-4
-2
0
2
4
6
8
03 04 05 06 07 08 09 10
pps.
Household consumpt ionGovernment consumptionGross fixed capital format ion
Stock building + Statistical error Net exportsGDP (yoy%)
orecast
84
Sharp imp ac t of the financ ial c risis
GDP grew by a mere 0.5% on average in 2008 but
fell by 1.2% in the fourth quarter with respect to
the previous one. According to the seasonally
adjusted data, households’ consumption
expenditure had been decreasing throughout 2008,
dropping by 1.8% in Q4 from Q3. Consumption
was most probably adversely affected by the
sudden reversal in the growth in credits to
households, a very tangible manifestation of the
global deleveraging process. After some moderate
rises in 2007, gross fixed capital formationdecreased once more in 2008, by 2.6%. The
decline in investment was apparent in all key
sectors including manufacturing and construction.
Overall, net exports contributed positively to
growth in 2008; foreign trade has however rapidly
declined in both directions in the fourth quarter.
Although the carry-over in GDP growth for 2009
is already negative (-1.2%), production side data
suggest that a considerably deeper downturn may
be inevitable. In 2008, a sizeable momentum came
from the relatively small agricultural sector, which
increased by an exceptional 43% last year, posting
a contribution to growth of almost 2%.
Additionally, industrial production has declined
sharply in the last months of 2008, dropping by
14% in December alone compared with the
previous month. Based on the sectoral breakdown,
the financial and the manufacturing sectors were
hit the most, the latter mainly due to a substantial
drop in export demand. Export performance was
also poor, with external trade in goods falling by
28% year-on-year in January 2009.
Contrac tion in all sec tors
After declining for two and a half years, real
disposable income of households is foreseen to
decrease further by more than 4% in 2009 and is
not likely to recover even in 2010. Moreover, since
November 2008, households’ access to credits has
narrowed considerably, thereby putting additional
pressure on consumers’ budgets. Consumption is
therefore expected to fall by 6½% in 2009 and to
decrease somewhat in 2010. The sharp downturn
in production, due to weak external and domestic
demand and aggravated by the reduced functioning
of the financial markets, is expected to have anadverse effect on investments. Although some
boost can be expected from infrastructure projects,
which are largely financed through EU structural
funds, both households and corporations are likely
to postpone planned capital investments. In line
with the observed contraction in world trade, both
exports and imports are expected to decline
considerably, leading to a slightly positive growth
contribution from net exports. Although partly
offset by the increasing servicing costs of debt-
type liabilities, the deterioration in the balance
sheets of financial corporations is expected toconsiderably improve the income account in 2009;
which, along with a moderately improving trade
balance, will also lead to a decrease in the current
account deficit.
Rap idly d eteriorating labour m arket
Labour demand is likely to be reduced
significantly in view of the gloomy economic
prospects. The decrease in private sector
employment is expected to be around 3% annually;
it is likely to be accompanied by a rapid
moderation in wage inflation. Unemployment is
expected to rise to double-digit levels despite a
parallel increase in the number of inactive people.
The widening negative output gap should support
the continued moderation of price inflation;
however, the weakening exchange rate, the
recently announced indirect tax hikes and the
pressure to compensate for the loss in corporate
profits are likely to prevent a more rapid decline.
New cha llenges in public financ es
As a result of the fiscal consolidation programme,the deficit significantly improved to 3.4% of GDP
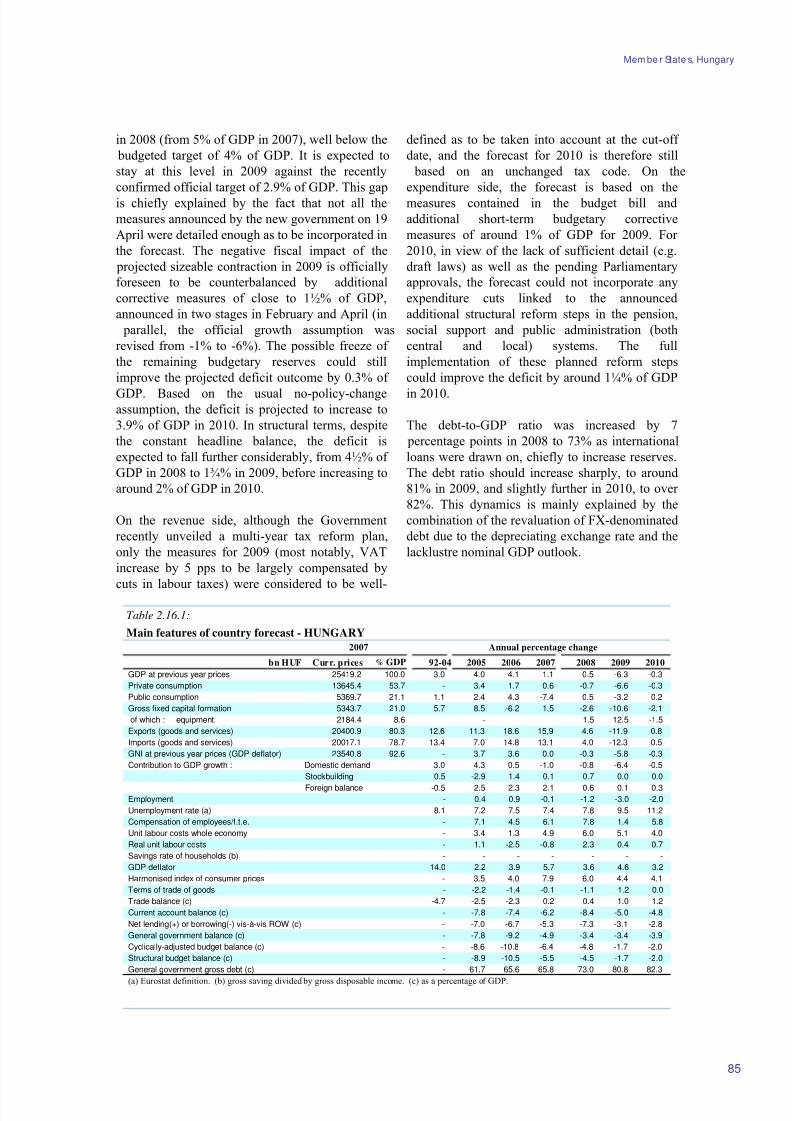
8/14/2019 Economic Forecast 2009
http://slidepdf.com/reader/full/economic-forecast-2009 91/172
Mem be r State s, Hungary
Table 2.16.1:
Main features of country forecast - HUNGARY
2007 Annual percentage change
bn HUF Curr. prices % GDP 92-04 2005 2006 2007 2008 2009 2010
GDP at previous year prices 25419.2 100.0 3.0 4.0 4.1 1.1 0.5 -6.3 -0.3
Private consumption 13645.4 53.7 - 3.4 1.7 0.6 -0.7 -6.6 -0.3
Public consumption 5369.7 21.1 1.1 2.4 4.3 -7.4 0.5 -3.2 0.2
Gross fixed capital formation 5343.7 21.0 5.7 8.5 -6.2 1.5 -2.6 -10.6 -2.1
of which : equipment 2184.4 8.6 - - - - 1.5 -12.5 -1.5
Exports (goods and services) 20400.9 80.3 12.6 11.3 18.6 15.9 4.6 -11.9 0.8
Imports (goods and services) 20017.1 78.7 13.4 7.0 14.8 13.1 4.0 -12.3 0.5
GNI at previous year prices (GDP deflator) 23540.8 92.6 - 3.7 3.6 0.0 -0.3 -5.8 -0.3
Contribution to GDP growth : Domestic demand 3.0 4.3 0.5 -1.0 -0.8 -6.4 -0.5
Stockbuilding 0.5 -2.9 1.4 0.1 0.7 0.0 0.0
Foreign balance -0.5 2.5 2.3 2.1 0.6 0.1 0.3Employment - 0.4 0.9 -0.1 -1.2 -3.0 -2.0
Unemployment rate (a) 8.1 7.2 7.5 7.4 7.8 9.5 11.2
Compensation of employees/f.t.e. - 7.1 4.5 6.1 7.8 1.4 5.8
Unit labour costs whole economy - 3.4 1.3 4.9 6.0 5.1 4.0
Real unit labour costs - 1.1 -2.5 -0.8 2.3 0.4 0.7
Savings rate of households (b) - - - - - - -
GDP deflator 14.0 2.2 3.9 5.7 3.6 4.6 3.2
Harmonised index of consumer prices - 3.5 4.0 7.9 6.0 4.4 4.1
Terms of trade of goods - -2.2 -1.4 -0.1 -1.1 1.2 0.0
Trade balance (c) -4.7 -2.5 -2.3 0.2 0.4 1.0 1.2
Current account balance (c) - -7.8 -7.4 -6.2 -8.4 -5.0 -4.8
Net lending(+) or borrowing(-) vis-à-vis ROW (c) - -7.0 -6.7 -5.3 -7.3 -3.1 -2.8
General government balance (c) - -7.8 -9.2 -4.9 -3.4 -3.4 -3.9
Cyclically-adjusted budget balance (c) - -8.6 -10.8 -6.4 -4.8 -1.7 -2.0
Structural budget balance (c) - -8.9 -10.5 -5.5 -4.5 -1.7 -2.0
General government gross debt (c) - 61.7 65.6 65.8 73.0 80.8 82.3
(a) Eurostat definition. (b) gross saving divided by gross disposable income. (c) as a percentage of GDP.
85
in 2008 (from 5% of GDP in 2007), well below the
budgeted target of 4% of GDP. It is expected to
stay at this level in 2009 against the recently
confirmed official target of 2.9% of GDP. This gap
is chiefly explained by the fact that not all the
measures announced by the new government on 19
April were detailed enough as to be incorporated in
the forecast. The negative fiscal impact of the
projected sizeable contraction in 2009 is officially
foreseen to be counterbalanced by additional
corrective measures of close to 1½% of GDP,
announced in two stages in February and April (in
parallel, the official growth assumption was
revised from -1% to -6%). The possible freeze of
the remaining budgetary reserves could still
improve the projected deficit outcome by 0.3% of
GDP. Based on the usual no-policy-changeassumption, the deficit is projected to increase to
3.9% of GDP in 2010. In structural terms, despite
the constant headline balance, the deficit is
expected to fall further considerably, from 4½% of
GDP in 2008 to 1¾% in 2009, before increasing to
around 2% of GDP in 2010.
On the revenue side, although the Government
recently unveiled a multi-year tax reform plan,
only the measures for 2009 (most notably, VAT
increase by 5 pps to be largely compensated by
cuts in labour taxes) were considered to be well-
defined as to be taken into account at the cut-off
date, and the forecast for 2010 is therefore still
based on an unchanged tax code. On the
expenditure side, the forecast is based on the
measures contained in the budget bill and
additional short-term budgetary corrective
measures of around 1% of GDP for 2009. For
2010, in view of the lack of sufficient detail (e.g.
draft laws) as well as the pending Parliamentary
approvals, the forecast could not incorporate any
expenditure cuts linked to the announced
additional structural reform steps in the pension,
social support and public administration (both
central and local) systems. The full
implementation of these planned reform steps
could improve the deficit by around 1¼% of GDP
in 2010.
The debt-to-GDP ratio was increased by 7
percentage points in 2008 to 73% as international
loans were drawn on, chiefly to increase reserves.
The debt ratio should increase sharply, to around
81% in 2009, and slightly further in 2010, to over
82%. This dynamics is mainly explained by the
combination of the revaluation of FX-denominated
debt due to the depreciating exchange rate and the
lacklustre nominal GDP outlook.
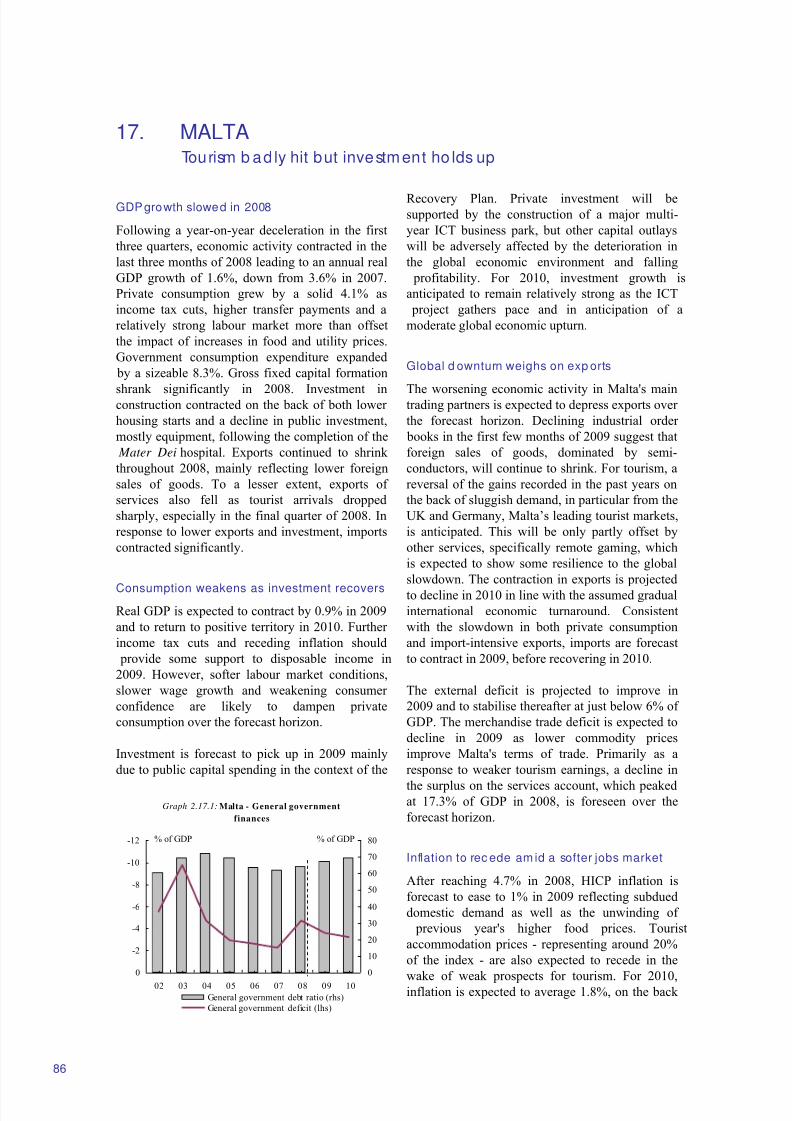
8/14/2019 Economic Forecast 2009
http://slidepdf.com/reader/full/economic-forecast-2009 92/172
17. MALTATourism b ad ly hit but investment ho lds up
Graph 2.17.1: Malta - General government
finances
-12
-10
-8
-6
-4
-2
0
02 03 04 05 06 07 08 09 10
0
10
20
30
40
50
60
70
80
General government debt ratio (rhs)
General government deficit (lhs)
% of GDP% of GDP
86
GDP growth slowed in 2008
Following a year-on-year deceleration in the first
three quarters, economic activity contracted in the
last three months of 2008 leading to an annual real
GDP growth of 1.6%, down from 3.6% in 2007.
Private consumption grew by a solid 4.1% as
income tax cuts, higher transfer payments and a
relatively strong labour market more than offset
the impact of increases in food and utility prices.
Government consumption expenditure expanded
by a sizeable 8.3%. Gross fixed capital formation
shrank significantly in 2008. Investment inconstruction contracted on the back of both lower
housing starts and a decline in public investment,
mostly equipment, following the completion of the
Mater Dei hospital. Exports continued to shrink
throughout 2008, mainly reflecting lower foreign
sales of goods. To a lesser extent, exports of
services also fell as tourist arrivals dropped
sharply, especially in the final quarter of 2008. In
response to lower exports and investment, imports
contracted significantly.
Consumption weakens as investment recovers
Real GDP is expected to contract by 0.9% in 2009
and to return to positive territory in 2010. Further
income tax cuts and receding inflation should
provide some support to disposable income in
2009. However, softer labour market conditions,
slower wage growth and weakening consumer
confidence are likely to dampen private
consumption over the forecast horizon.
Investment is forecast to pick up in 2009 mainly
due to public capital spending in the context of the
Recovery Plan. Private investment will besupported by the construction of a major multi-
year ICT business park, but other capital outlays
will be adversely affected by the deterioration in
the global economic environment and falling
profitability. For 2010, investment growth is
anticipated to remain relatively strong as the ICT
project gathers pace and in anticipation of a
moderate global economic upturn.
Global d ownturn weighs on exp orts
The worsening economic activity in Malta's maintrading partners is expected to depress exports over
the forecast horizon. Declining industrial order
books in the first few months of 2009 suggest that
foreign sales of goods, dominated by semi-
conductors, will continue to shrink. For tourism, a
reversal of the gains recorded in the past years on
the back of sluggish demand, in particular from the
UK and Germany, Malta’s leading tourist markets,
is anticipated. This will be only partly offset by
other services, specifically remote gaming, which
is expected to show some resilience to the global
slowdown. The contraction in exports is projected
to decline in 2010 in line with the assumed gradual
international economic turnaround. Consistent
with the slowdown in both private consumption
and import-intensive exports, imports are forecast
to contract in 2009, before recovering in 2010.
The external deficit is projected to improve in
2009 and to stabilise thereafter at just below 6% of
GDP. The merchandise trade deficit is expected to
decline in 2009 as lower commodity prices
improve Malta's terms of trade. Primarily as a
response to weaker tourism earnings, a decline in
the surplus on the services account, which peakedat 17.3% of GDP in 2008, is foreseen over the
forecast horizon.
Inflation to rec ede am id a softer jobs market
After reaching 4.7% in 2008, HICP inflation is
forecast to ease to 1% in 2009 reflecting subdued
domestic demand as well as the unwinding of
previous year's higher food prices. Tourist
accommodation prices - representing around 20%
of the index - are also expected to recede in the
wake of weak prospects for tourism. For 2010,inflation is expected to average 1.8%, on the back
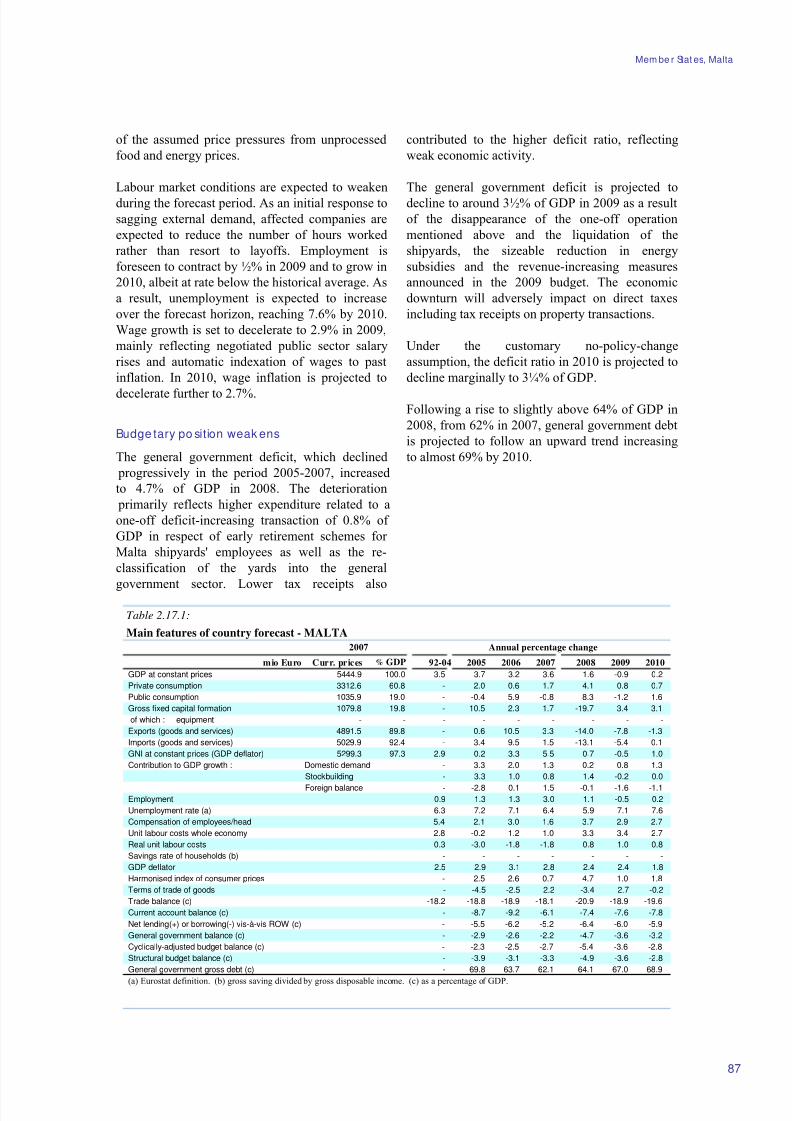
8/14/2019 Economic Forecast 2009
http://slidepdf.com/reader/full/economic-forecast-2009 93/172
Mem be r Stat es, Malta
Table 2.17.1:
Main features of country forecast - MALTA
2007 Annual percentage change
mio Euro Curr. prices % GDP 92-04 2005 2006 2007 2008 2009 2010
GDP at constant prices 5444.9 100.0 3.5 3.7 3.2 3.6 1.6 -0.9 0.2
Private consumption 3312.6 60.8 - 2.0 0.6 1.7 4.1 0.8 0.7
Public consumption 1035.9 19.0 - -0.4 5.9 -0.8 8.3 -1.2 1.6
Gross fixed capital formation 1079.8 19.8 - 10.5 2.3 1.7 -19.7 3.4 3.1
of which : equipment - - - - - - - - -
Exports (goods and services) 4891.5 89.8 - 0.6 10.5 3.3 -14.0 -7.8 -1.3
Imports (goods and services) 5029.9 92.4 - 3.4 9.5 1.5 -13.1 -5.4 0.1
GNI at constant prices (GDP deflator) 5299.3 97.3 2.9 0.2 3.3 5.5 0.7 -0.5 1.0
Contribution to GDP growth : Domestic demand - 3.3 2.0 1.3 0.2 0.8 1.3
Stockbuilding - 3.3 1.0 0.8 1.4 -0.2 0.0
Foreign balance - -2.8 0.1 1.5 -0.1 -1.6 -1.1Employment 0.9 1.3 1.3 3.0 1.1 -0.5 0.2
Unemployment rate (a) 6.3 7.2 7.1 6.4 5.9 7.1 7.6
Compensation of employees/head 5.4 2.1 3.0 1.6 3.7 2.9 2.7
Unit labour costs whole economy 2.8 -0.2 1.2 1.0 3.3 3.4 2.7
Real unit labour costs 0.3 -3.0 -1.8 -1.8 0.8 1.0 0.8
Savings rate of households (b) - - - - - - -
GDP deflator 2.5 2.9 3.1 2.8 2.4 2.4 1.8
Harmonised index of consumer prices - 2.5 2.6 0.7 4.7 1.0 1.8
Terms of trade of goods - -4.5 -2.5 2.2 -3.4 2.7 -0.2
Trade balance (c) -18.2 -18.8 -18.9 -18.1 -20.9 -18.9 -19.6
Current account balance (c) - -8.7 -9.2 -6.1 -7.4 -7.6 -7.8
Net lending(+) or borrowing(-) vis-à-vis ROW (c) - -5.5 -6.2 -5.2 -6.4 -6.0 -5.9
General government balance (c) - -2.9 -2.6 -2.2 -4.7 -3.6 -3.2
Cyclically-adjusted budget balance (c) - -2.3 -2.5 -2.7 -5.4 -3.6 -2.8
Structural budget balance (c) - -3.9 -3.1 -3.3 -4.9 -3.6 -2.8
General government gross debt (c) - 69.8 63.7 62.1 64.1 67.0 68.9
(a) Eurostat definition. (b) gross saving divided by gross disposable income. (c) as a percentage of GDP.
87
of the assumed price pressures from unprocessed
food and energy prices.
Labour market conditions are expected to weaken
during the forecast period. As an initial response to
sagging external demand, affected companies are
expected to reduce the number of hours worked
rather than resort to layoffs. Employment is
foreseen to contract by ½% in 2009 and to grow in
2010, albeit at rate below the historical average. As
a result, unemployment is expected to increase
over the forecast horizon, reaching 7.6% by 2010.
Wage growth is set to decelerate to 2.9% in 2009,
mainly reflecting negotiated public sector salary
rises and automatic indexation of wages to past
inflation. In 2010, wage inflation is projected to
decelerate further to 2.7%.
Budge tary po sition weak ens
The general government deficit, which declined
progressively in the period 2005-2007, increased
to 4.7% of GDP in 2008. The deterioration
primarily reflects higher expenditure related to a
one-off deficit-increasing transaction of 0.8% of
GDP in respect of early retirement schemes for
Malta shipyards' employees as well as the re-
classification of the yards into the general
government sector. Lower tax receipts also
contributed to the higher deficit ratio, reflecting
weak economic activity.
The general government deficit is projected to
decline to around 3½% of GDP in 2009 as a result
of the disappearance of the one-off operation
mentioned above and the liquidation of the
shipyards, the sizeable reduction in energy
subsidies and the revenue-increasing measures
announced in the 2009 budget. The economic
downturn will adversely impact on direct taxes
including tax receipts on property transactions.
Under the customary no-policy-change
assumption, the deficit ratio in 2010 is projected to
decline marginally to 3¼% of GDP.
Following a rise to slightly above 64% of GDP in
2008, from 62% in 2007, general government debt
is projected to follow an upward trend increasing
to almost 69% by 2010.
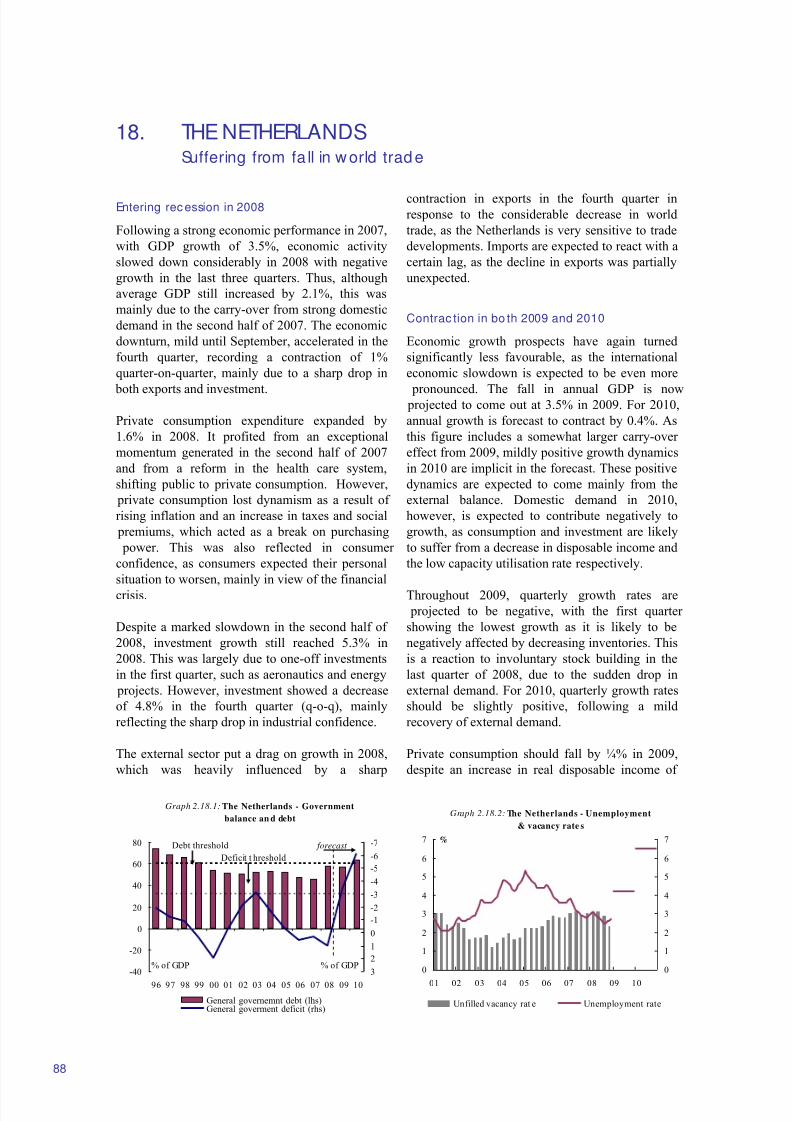
8/14/2019 Economic Forecast 2009
http://slidepdf.com/reader/full/economic-forecast-2009 94/172
18. THE NETHERLANDSSuffering from fa ll in w orld trad e
Graph 2.18.2: The Netherlands - Unemployment
& vacancy rate s
0
1
2
3
4
5
6
7
01 02 03 04 05 06 07 08 09 10
%
0
1
2
3
4
5
6
7
Unfilled vacancy rat e Unemployment rate
Graph 2.18.1: The Netherlands - Government
balance an d debt
-40
-20
0
20
40
60
80
96 97 98 99 00 01 02 03 04 05 06 07 08 09 10
-7
-6
-5
-4
-3
-2
-1
0
1
2
3
General governemnt debt (lhs)General goverment deficit (rhs)
% of GDP % of GDP
forecast Debt threshold
Deficit t hreshold
88
Entering rec ession in 2008
Following a strong economic performance in 2007,
with GDP growth of 3.5%, economic activity
slowed down considerably in 2008 with negative
growth in the last three quarters. Thus, although
average GDP still increased by 2.1%, this was
mainly due to the carry-over from strong domestic
demand in the second half of 2007. The economic
downturn, mild until September, accelerated in the
fourth quarter, recording a contraction of 1%
quarter-on-quarter, mainly due to a sharp drop in
both exports and investment.
Private consumption expenditure expanded by
1.6% in 2008. It profited from an exceptional
momentum generated in the second half of 2007
and from a reform in the health care system,
shifting public to private consumption. However,
private consumption lost dynamism as a result of
rising inflation and an increase in taxes and social
premiums, which acted as a break on purchasing
power. This was also reflected in consumer
confidence, as consumers expected their personal
situation to worsen, mainly in view of the financial
crisis.
Despite a marked slowdown in the second half of
2008, investment growth still reached 5.3% in
2008. This was largely due to one-off investments
in the first quarter, such as aeronautics and energy
projects. However, investment showed a decrease
of 4.8% in the fourth quarter (q-o-q), mainly
reflecting the sharp drop in industrial confidence.
The external sector put a drag on growth in 2008,
which was heavily influenced by a sharp
contraction in exports in the fourth quarter inresponse to the considerable decrease in world
trade, as the Netherlands is very sensitive to trade
developments. Imports are expected to react with a
certain lag, as the decline in exports was partially
unexpected.
Contrac tion in bo th 2009 and 2010
Economic growth prospects have again turned
significantly less favourable, as the international
economic slowdown is expected to be even more
pronounced. The fall in annual GDP is now projected to come out at 3.5% in 2009. For 2010,
annual growth is forecast to contract by 0.4%. As
this figure includes a somewhat larger carry-over
effect from 2009, mildly positive growth dynamics
in 2010 are implicit in the forecast. These positive
dynamics are expected to come mainly from the
external balance. Domestic demand in 2010,
however, is expected to contribute negatively to
growth, as consumption and investment are likely
to suffer from a decrease in disposable income and
the low capacity utilisation rate respectively.
Throughout 2009, quarterly growth rates are
projected to be negative, with the first quarter
showing the lowest growth as it is likely to be
negatively affected by decreasing inventories. This
is a reaction to involuntary stock building in the
last quarter of 2008, due to the sudden drop in
external demand. For 2010, quarterly growth rates
should be slightly positive, following a mild
recovery of external demand.
Private consumption should fall by ¼% in 2009,
despite an increase in real disposable income of
8/14/2019 Economic Forecast 2009
http://slidepdf.com/reader/full/economic-forecast-2009 95/172
Mem be r Stat es, The Ne therland s
89
2%. This increase in disposable income is the
result of contained inflation and a lowering of
taxes and social premiums, which will only be
partly offset by rising unemployment and declining
non-labour income. The decrease in private
consumption is assumed to be mainly caused by
confidence and wealth effects, as well as
tightening credit conditions. In particular, the
significant drop in the value of assets, such as
stocks, is expected to have a negative effect on
consumption and is likely to increase the
propensity to save. For 2010, a further decrease in
private consumption is expected, as a sharp rise in
unemployment will most probably put strong
pressure on disposable income.
Overall, investment growth will remain in negativeterritory during the forecast horizon. The
combination of tightening credit conditions,
decreasing production and falling confidence is
expected to have a significant negative impact on
gross fixed capital formation. Private investment
should decrease by 9½% in 2009. In particular,
strong cyclically-sensitive investment, like
equipment, should record a large decline.
Construction is likely to show a more protracted
contraction, which could last until well into 2010,
because of its relatively long planning period,
helping to explain negative private investmentgrowth of 4¼% in 2010.
The sharp fall in world trade will have a
substantial effect on Dutch exports, which are
foreseen to decrease by 10¾% in 2009. Together
with negative private consumption and investment
growth, and given that the Netherlands is an
important transit country, imports should also post
strong negative growth. The external balance is
expected to contribute negatively to GDP growth
by almost 2%, as external demand would decline
faster than domestic demand and because
domestically produced exports are likely to suffer from the projected increase in unit labour costs,
which negatively affects their competitiveness. In
2010, both exports and imports are expected to
further contract, although to a lesser extent.
Sharp inc rease in unemp loyment
In 2008, the labour market was very tight, with a
very low unemployment rate of 2.8% and a high
number of unfilled vacancies. The fourth quarter,
however, was the turning point, with
unemployment rising for the first time since the beginning of 2005. At the same time unfilled
vacancies dropped by approximately 20% quarter-
on-quarter. In 2009, a further loosening of the
labour market is expected and unemployment is
forecast to rise to around 4%. This increase is
subdued by labour hoarding. As this effect will
disappear in 2010, unemployment is likely to gain
momentum in 2010 and exceed 6%.
Employment growth, which had already slowed
considerably to 1.8% in 2008, is assumed to be
negative in both 2009 and 2010, falling by around
1¼% and 2½% respectively. Labour supply is
likely to suffer from the discouraged worker effect
and a decrease in migrant workers.
For 2009, most wages agreements were concluded
at a time of positive economic growth assumptionsand high inflation expectations. Wage growth in
2009 is therefore expected to be relatively strong at
3½%. This, together with an expected decrease in
production, leads to a sharp increase in unit labour
costs. Rising unemployment and declining
company profits are forecast to put downward
pressure on wages in 2010, leading to an expected
moderate wage increase per full-time equivalent of
2½%.
HICP inflation remained relatively subdued in
2008, coming out at 2.2%. This is in large part dueto the slow pass-through of price changes in raw
materials into consumer prices. In particular,
energy and rental prices tend to have long
adjustment lags, as consumer gas prices are only
adjusted twice a year and rental prices of regulated
housing only once. The sharp increase in oil prices
during the first half of 2008 has therefore not fully
been absorbed in the 2008 inflation rate. This
lagged effect will also have a limited effect on
inflation in 2009, as it will be offset by the sharp
drop in oil prices at the end of 2008. Overall,
inflation is expected to decrease to 1.4% in 2009.
In 2010, inflation is projected to decrease further to below 1%.
Quick d eterioration of public financ es
In 2008, the headline budget balance improved to a
surplus of 1.0% of GDP, up from +0.3% of GDP
in 2007. This is in large part due to a sharp
increase in non-tax gas revenues, which increased
to 2.1% of GDP in 2008. Furthermore, the budget
balance profited from consolidation efforts on the
revenue side, involving increases in a variety of
taxes, such as fuel levies and excise duties, as wellas social contributions, like health care premiums.
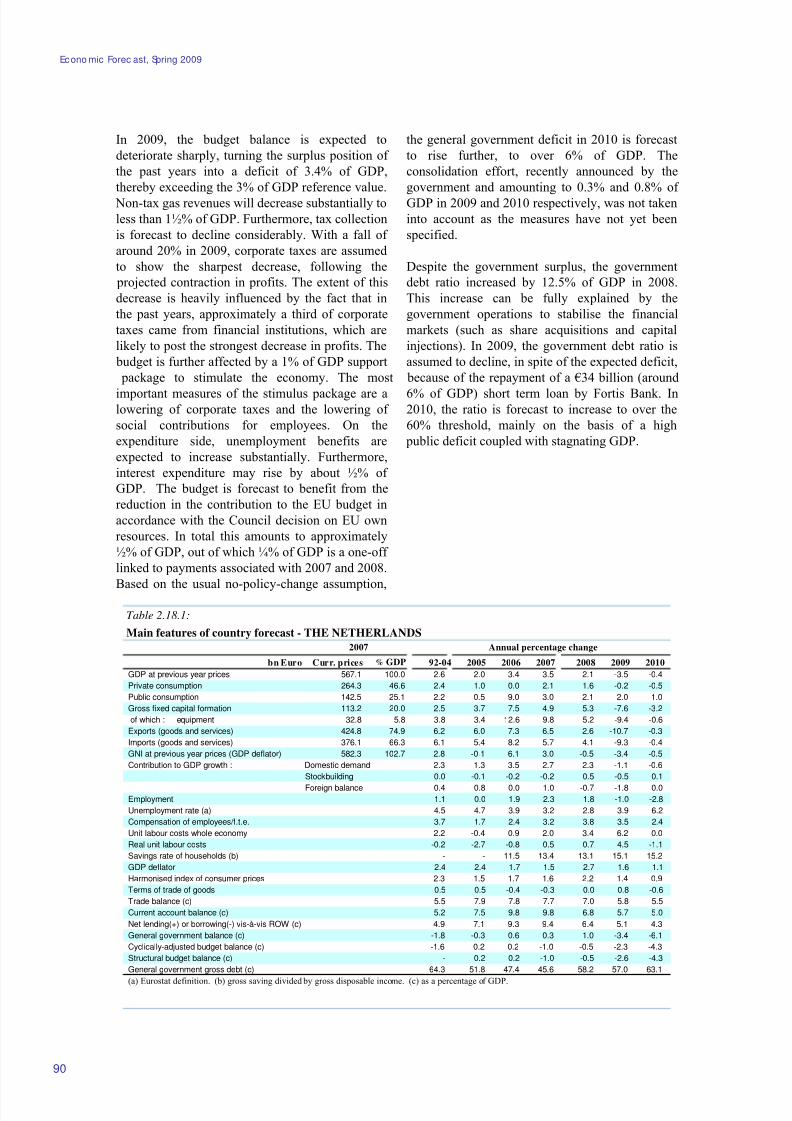
8/14/2019 Economic Forecast 2009
http://slidepdf.com/reader/full/economic-forecast-2009 96/172
Econo mic Forec ast, Spring 2009
Table 2.18.1:
Main features of country forecast - THE NETHERLANDS
2007 Annual percentage change
bn Euro Curr. prices % GDP 92-04 2005 2006 2007 2008 2009 2010
GDP at previous year prices 567.1 100.0 2.6 2.0 3.4 3.5 2.1 -3.5 -0.4
Private consumption 264.3 46.6 2.4 1.0 0.0 2.1 1.6 -0.2 -0.5
Public consumption 142.5 25.1 2.2 0.5 9.0 3.0 2.1 2.0 1.0
Gross fixed capital formation 113.2 20.0 2.5 3.7 7.5 4.9 5.3 -7.6 -3.2
of which : equipment 32.8 5.8 3.8 3.4 12.6 9.8 5.2 -9.4 -0.6
Exports (goods and services) 424.8 74.9 6.2 6.0 7.3 6.5 2.6 -10.7 -0.3
Imports (goods and services) 376.1 66.3 6.1 5.4 8.2 5.7 4.1 -9.3 -0.4
GNI at previous year prices (GDP deflator) 582.3 102.7 2.8 -0.1 6.1 3.0 -0.5 -3.4 -0.5
Contribution to GDP growth : Domestic demand 2.3 1.3 3.5 2.7 2.3 -1.1 -0.6
Stockbuilding 0.0 -0.1 -0.2 -0.2 0.5 -0.5 0.1
Foreign balance 0.4 0.8 0.0 1.0 -0.7 -1.8 0.0Employment 1.1 0.0 1.9 2.3 1.8 -1.0 -2.8
Unemployment rate (a) 4.5 4.7 3.9 3.2 2.8 3.9 6.2
Compensation of employees/f.t.e. 3.7 1.7 2.4 3.2 3.8 3.5 2.4
Unit labour costs whole economy 2.2 -0.4 0.9 2.0 3.4 6.2 0.0
Real unit labour costs -0.2 -2.7 -0.8 0.5 0.7 4.5 -1.1
Savings rate of households (b) - - 11.5 13.4 13.1 15.1 15.2
GDP deflator 2.4 2.4 1.7 1.5 2.7 1.6 1.1
Harmonised index of consumer prices 2.3 1.5 1.7 1.6 2.2 1.4 0.9
Terms of trade of goods 0.5 0.5 -0.4 -0.3 0.0 0.8 -0.6
Trade balance (c) 5.5 7.9 7.8 7.7 7.0 5.8 5.5
Current account balance (c) 5.2 7.5 9.8 9.8 6.8 5.7 5.0
Net lending(+) or borrowing(-) vis-à-vis ROW (c) 4.9 7.1 9.3 9.4 6.4 5.1 4.3
General government balance (c) -1.8 -0.3 0.6 0.3 1.0 -3.4 -6.1
Cyclically-adjusted budget balance (c) -1.6 0.2 0.2 -1.0 -0.5 -2.3 -4.3
Structural budget balance (c) - 0.2 0.2 -1.0 -0.5 -2.6 -4.3
General government gross debt (c) 64.3 51.8 47.4 45.6 58.2 57.0 63.1
(a) Eurostat definition. (b) gross saving divided by gross disposable income. (c) as a percentage of GDP.
90
In 2009, the budget balance is expected to
deteriorate sharply, turning the surplus position of
the past years into a deficit of 3.4% of GDP,
thereby exceeding the 3% of GDP reference value.
Non-tax gas revenues will decrease substantially to
less than 1½% of GDP. Furthermore, tax collection
is forecast to decline considerably. With a fall of
around 20% in 2009, corporate taxes are assumed
to show the sharpest decrease, following the
projected contraction in profits. The extent of this
decrease is heavily influenced by the fact that in
the past years, approximately a third of corporate
taxes came from financial institutions, which are
likely to post the strongest decrease in profits. The
budget is further affected by a 1% of GDP support
package to stimulate the economy. The most
important measures of the stimulus package are alowering of corporate taxes and the lowering of
social contributions for employees. On the
expenditure side, unemployment benefits are
expected to increase substantially. Furthermore,
interest expenditure may rise by about ½% of
GDP. The budget is forecast to benefit from the
reduction in the contribution to the EU budget in
accordance with the Council decision on EU own
resources. In total this amounts to approximately
½% of GDP, out of which ¼% of GDP is a one-off
linked to payments associated with 2007 and 2008.
Based on the usual no-policy-change assumption,
the general government deficit in 2010 is forecast
to rise further, to over 6% of GDP. The
consolidation effort, recently announced by the
government and amounting to 0.3% and 0.8% of
GDP in 2009 and 2010 respectively, was not taken
into account as the measures have not yet been
specified.
Despite the government surplus, the government
debt ratio increased by 12.5% of GDP in 2008.
This increase can be fully explained by the
government operations to stabilise the financial
markets (such as share acquisitions and capital
injections). In 2009, the government debt ratio is
assumed to decline, in spite of the expected deficit,
because of the repayment of a €34 billion (around
6% of GDP) short term loan by Fortis Bank. In2010, the ratio is forecast to increase to over the
60% threshold, mainly on the basis of a high
public deficit coupled with stagnating GDP.
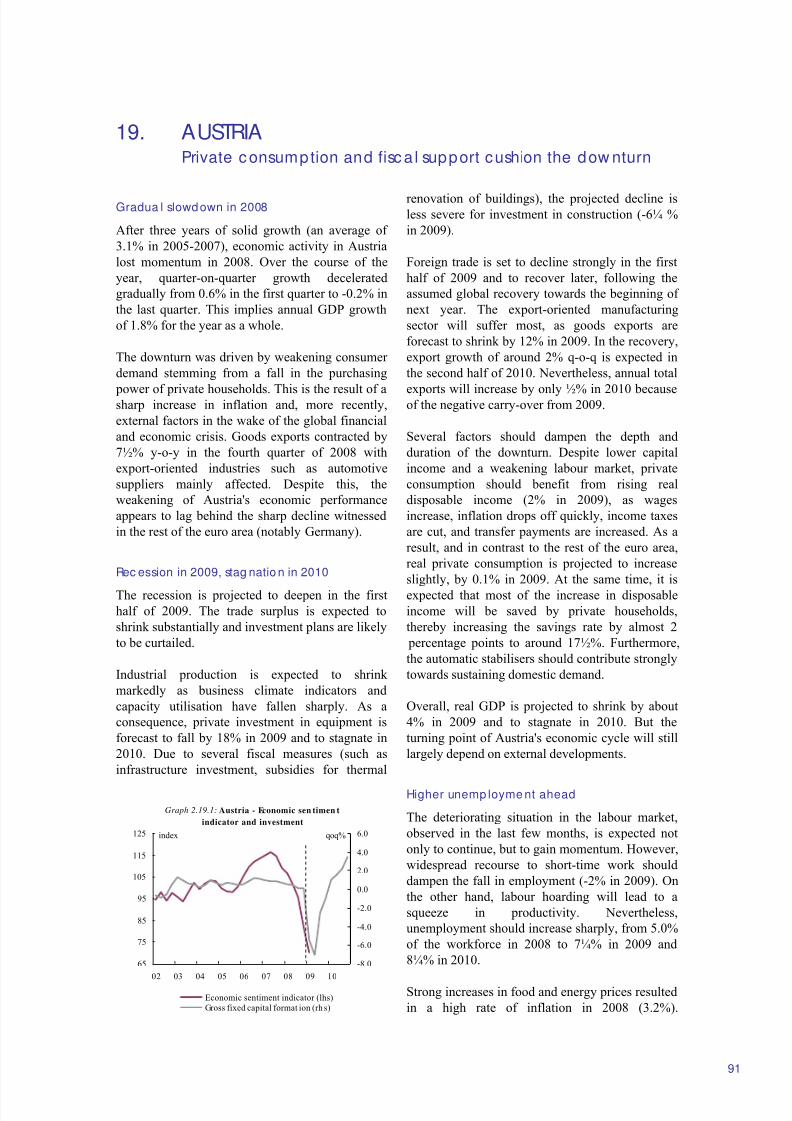
8/14/2019 Economic Forecast 2009
http://slidepdf.com/reader/full/economic-forecast-2009 97/172
19. AUSTRIAPrivate c onsumption and fisc a l support cushion the dow nturn
Graph 2.19.1: Austria - Economic sen timen t
indicator and investment
65
75
85
95
105
115
125
02 03 04 05 06 07 08 09 10
index
-8.0
-6.0
-4.0
-2.0
0.0
2.0
4.0
6.0qoq%
Economic sentiment indicator (lhs)Gross fixed capital format ion (rh s)
91
Gradua l slowdown in 2008
After three years of solid growth (an average of
3.1% in 2005-2007), economic activity in Austria
lost momentum in 2008. Over the course of the
year, quarter-on-quarter growth decelerated
gradually from 0.6% in the first quarter to -0.2% in
the last quarter. This implies annual GDP growth
of 1.8% for the year as a whole.
The downturn was driven by weakening consumer
demand stemming from a fall in the purchasing
power of private households. This is the result of asharp increase in inflation and, more recently,
external factors in the wake of the global financial
and economic crisis. Goods exports contracted by
7½% y-o-y in the fourth quarter of 2008 with
export-oriented industries such as automotive
suppliers mainly affected. Despite this, the
weakening of Austria's economic performance
appears to lag behind the sharp decline witnessed
in the rest of the euro area (notably Germany).
Rec ession in 2009, stag natio n in 2010
The recession is projected to deepen in the first
half of 2009. The trade surplus is expected to
shrink substantially and investment plans are likely
to be curtailed.
Industrial production is expected to shrink
markedly as business climate indicators and
capacity utilisation have fallen sharply. As a
consequence, private investment in equipment is
forecast to fall by 18% in 2009 and to stagnate in
2010. Due to several fiscal measures (such as
infrastructure investment, subsidies for thermal
renovation of buildings), the projected decline isless severe for investment in construction (-6¼ %
in 2009).
Foreign trade is set to decline strongly in the first
half of 2009 and to recover later, following the
assumed global recovery towards the beginning of
next year. The export-oriented manufacturing
sector will suffer most, as goods exports are
forecast to shrink by 12% in 2009. In the recovery,
export growth of around 2% q-o-q is expected in
the second half of 2010. Nevertheless, annual total
exports will increase by only ½% in 2010 becauseof the negative carry-over from 2009.
Several factors should dampen the depth and
duration of the downturn. Despite lower capital
income and a weakening labour market, private
consumption should benefit from rising real
disposable income (2% in 2009), as wages
increase, inflation drops off quickly, income taxes
are cut, and transfer payments are increased. As a
result, and in contrast to the rest of the euro area,
real private consumption is projected to increase
slightly, by 0.1% in 2009. At the same time, it is
expected that most of the increase in disposable
income will be saved by private households,
thereby increasing the savings rate by almost 2
percentage points to around 17½%. Furthermore,
the automatic stabilisers should contribute strongly
towards sustaining domestic demand.
Overall, real GDP is projected to shrink by about
4% in 2009 and to stagnate in 2010. But the
turning point of Austria's economic cycle will still
largely depend on external developments.
Higher unemp loyme nt ahead
The deteriorating situation in the labour market,
observed in the last few months, is expected not
only to continue, but to gain momentum. However,
widespread recourse to short-time work should
dampen the fall in employment (-2% in 2009). On
the other hand, labour hoarding will lead to a
squeeze in productivity. Nevertheless,
unemployment should increase sharply, from 5.0%
of the workforce in 2008 to 7¼% in 2009 and
8¼% in 2010.
Strong increases in food and energy prices resulted
in a high rate of inflation in 2008 (3.2%).
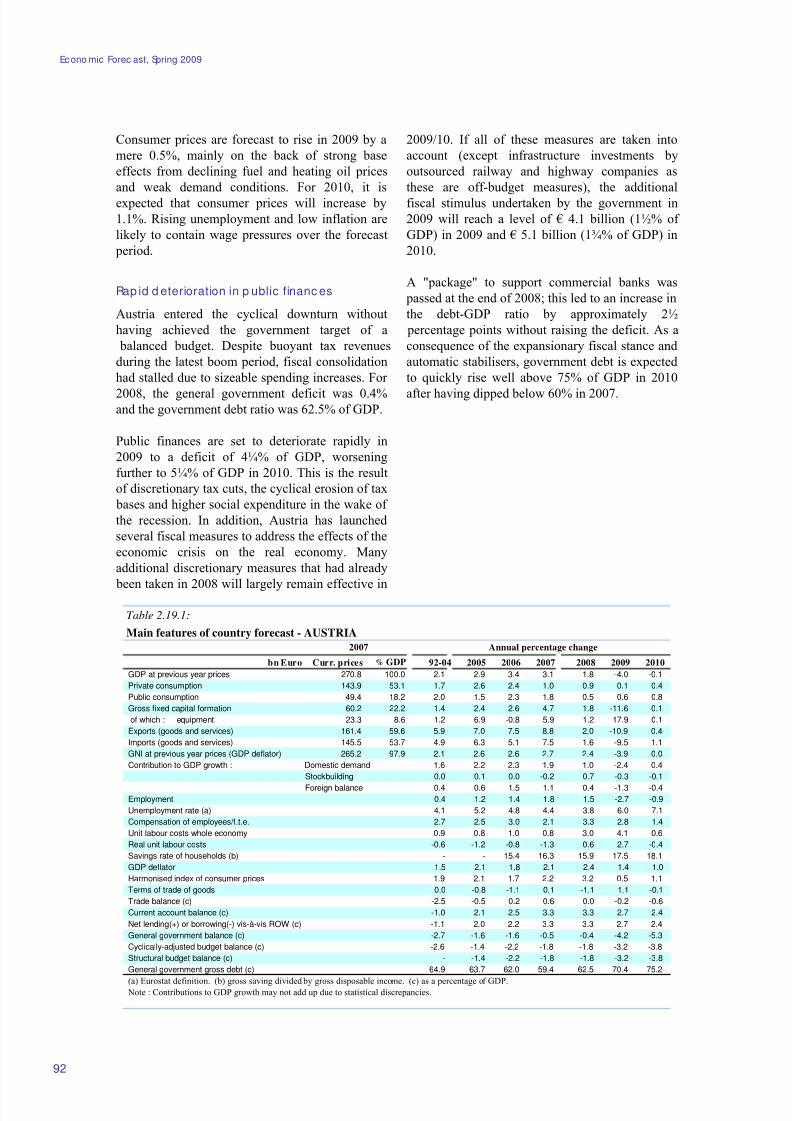
8/14/2019 Economic Forecast 2009
http://slidepdf.com/reader/full/economic-forecast-2009 98/172
Econo mic Forec ast, Spring 2009
Table 2.19.1:
Main features of country forecast - AUSTRIA
2007 Annual percentage change
bn Euro Curr. prices % GDP 92-04 2005 2006 2007 2008 2009 2010
GDP at previous year prices 270.8 100.0 2.1 2.9 3.4 3.1 1.8 -4.0 -0.1
Private consumption 143.9 53.1 1.7 2.6 2.4 1.0 0.9 0.1 0.4
Public consumption 49.4 18.2 2.0 1.5 2.3 1.8 0.5 0.6 0.8
Gross fixed capital formation 60.2 22.2 1.4 2.4 2.6 4.7 1.8 -11.6 0.1
of which : equipment 23.3 8.6 1.2 6.9 -0.8 5.9 1.2 -17.9 0.1
Exports (goods and services) 161.4 59.6 5.9 7.0 7.5 8.8 2.0 -10.9 0.4
Imports (goods and services) 145.5 53.7 4.9 6.3 5.1 7.5 1.6 -9.5 1.1
GNI at previous year prices (GDP deflator) 265.2 97.9 2.1 2.6 2.6 2.7 2.4 -3.9 0.0
Contribution to GDP growth : Domestic demand 1.6 2.2 2.3 1.9 1.0 -2.4 0.4
Stockbuilding 0.0 0.1 0.0 -0.2 0.7 -0.3 -0.1
Foreign balance 0.4 0.6 1.5 1.1 0.4 -1.3 -0.4Employment 0.4 1.2 1.4 1.8 1.5 -2.7 -0.9
Unemployment rate (a) 4.1 5.2 4.8 4.4 3.8 6.0 7.1
Compensation of employees/f.t.e. 2.7 2.5 3.0 2.1 3.3 2.8 1.4
Unit labour costs whole economy 0.9 0.8 1.0 0.8 3.0 4.1 0.6
Real unit labour costs -0.6 -1.2 -0.8 -1.3 0.6 2.7 -0.4
Savings rate of households (b) - - 15.4 16.3 15.9 17.5 18.1
GDP deflator 1.5 2.1 1.8 2.1 2.4 1.4 1.0
Harmonised index of consumer prices 1.9 2.1 1.7 2.2 3.2 0.5 1.1
Terms of trade of goods 0.0 -0.8 -1.1 0.1 -1.1 1.1 -0.1
Trade balance (c) -2.5 -0.5 0.2 0.6 0.0 -0.2 -0.6
Current account balance (c) -1.0 2.1 2.5 3.3 3.3 2.7 2.4
Net lending(+) or borrowing(-) vis-à-vis ROW (c) -1.1 2.0 2.2 3.3 3.3 2.7 2.4
General government balance (c) -2.7 -1.6 -1.6 -0.5 -0.4 -4.2 -5.3
Cyclically-adjusted budget balance (c) -2.6 -1.4 -2.2 -1.8 -1.8 -3.2 -3.8
Structural budget balance (c) - -1.4 -2.2 -1.8 -1.8 -3.2 -3.8
General government gross debt (c) 64.9 63.7 62.0 59.4 62.5 70.4 75.2
(a) Eurostat definition. (b) gross saving divided by gross disposable income. (c) as a percentage of GDP.Note : Contributions to GDP growth may not add up due to statistical discrepancies.
92
Consumer prices are forecast to rise in 2009 by a
mere 0.5%, mainly on the back of strong base
effects from declining fuel and heating oil prices
and weak demand conditions. For 2010, it is
expected that consumer prices will increase by
1.1%. Rising unemployment and low inflation are
likely to contain wage pressures over the forecast
period.
Rap id d eterioration in p ublic financ es
Austria entered the cyclical downturn without
having achieved the government target of a
balanced budget. Despite buoyant tax revenues
during the latest boom period, fiscal consolidation
had stalled due to sizeable spending increases. For
2008, the general government deficit was 0.4%and the government debt ratio was 62.5% of GDP.
Public finances are set to deteriorate rapidly in
2009 to a deficit of 4¼% of GDP, worsening
further to 5¼% of GDP in 2010. This is the result
of discretionary tax cuts, the cyclical erosion of tax
bases and higher social expenditure in the wake of
the recession. In addition, Austria has launched
several fiscal measures to address the effects of the
economic crisis on the real economy. Many
additional discretionary measures that had already
been taken in 2008 will largely remain effective in
2009/10. If all of these measures are taken into
account (except infrastructure investments by
outsourced railway and highway companies as
these are off-budget measures), the additional
fiscal stimulus undertaken by the government in
2009 will reach a level of € 4.1 billion (1½% of
GDP) in 2009 and € 5.1 billion (1¾% of GDP) in
2010.
A "package" to support commercial banks was
passed at the end of 2008; this led to an increase in
the debt-GDP ratio by approximately 2½
percentage points without raising the deficit. As a
consequence of the expansionary fiscal stance and
automatic stabilisers, government debt is expected
to quickly rise well above 75% of GDP in 2010
after having dipped below 60% in 2007.
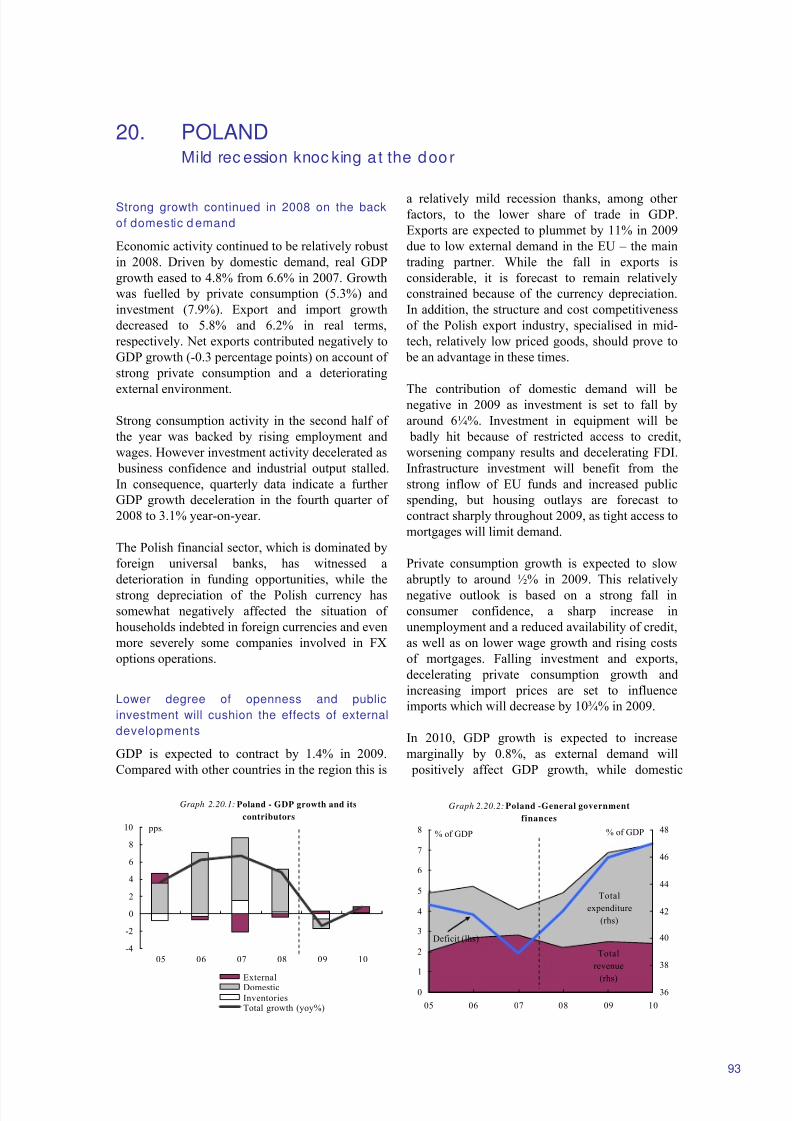
8/14/2019 Economic Forecast 2009
http://slidepdf.com/reader/full/economic-forecast-2009 99/172
20. POLANDMild rec ession knoc king a t the doo r
Graph 2.20.2: Poland -General government
finances
Total
expenditure
(rhs)
Total
revenue
(rhs)0
1
2
3
4
5
6
7
8
05 06 07 08 09 10
% of GDP
36
38
40
42
44
46
48% of GDP
Deficit (lhs)-4
-2
0
2
4
6
8
10
05 06 07 08 09 10
ExternalDomesticInventoriesTotal growth (yoy%)
Graph 2.20.1: Poland - GDP growth and its
contributors
pps.
93
Strong growth continued in 2008 on the back
of domestic d emand
Economic activity continued to be relatively robust
in 2008. Driven by domestic demand, real GDP
growth eased to 4.8% from 6.6% in 2007. Growth
was fuelled by private consumption (5.3%) and
investment (7.9%). Export and import growth
decreased to 5.8% and 6.2% in real terms,
respectively. Net exports contributed negatively to
GDP growth (-0.3 percentage points) on account of
strong private consumption and a deteriorating
external environment.
Strong consumption activity in the second half of
the year was backed by rising employment and
wages. However investment activity decelerated as
business confidence and industrial output stalled.
In consequence, quarterly data indicate a further
GDP growth deceleration in the fourth quarter of
2008 to 3.1% year-on-year.
The Polish financial sector, which is dominated by
foreign universal banks, has witnessed a
deterioration in funding opportunities, while the
strong depreciation of the Polish currency has
somewhat negatively affected the situation of
households indebted in foreign currencies and even
more severely some companies involved in FX
options operations.
Lower degree of openness and public
investment will cushion the effects of external
developments
GDP is expected to contract by 1.4% in 2009.
Compared with other countries in the region this is
a relatively mild recession thanks, among other factors, to the lower share of trade in GDP.
Exports are expected to plummet by 11% in 2009
due to low external demand in the EU – the main
trading partner. While the fall in exports is
considerable, it is forecast to remain relatively
constrained because of the currency depreciation.
In addition, the structure and cost competitiveness
of the Polish export industry, specialised in mid-
tech, relatively low priced goods, should prove to
be an advantage in these times.
The contribution of domestic demand will benegative in 2009 as investment is set to fall by
around 6¼%. Investment in equipment will be
badly hit because of restricted access to credit,
worsening company results and decelerating FDI.
Infrastructure investment will benefit from the
strong inflow of EU funds and increased public
spending, but housing outlays are forecast to
contract sharply throughout 2009, as tight access to
mortgages will limit demand.
Private consumption growth is expected to slow
abruptly to around ½% in 2009. This relatively
negative outlook is based on a strong fall in
consumer confidence, a sharp increase in
unemployment and a reduced availability of credit,
as well as on lower wage growth and rising costs
of mortgages. Falling investment and exports,
decelerating private consumption growth and
increasing import prices are set to influence
imports which will decrease by 10¾% in 2009.
In 2010, GDP growth is expected to increase
marginally by 0.8%, as external demand will
positively affect GDP growth, while domestic
8/14/2019 Economic Forecast 2009
http://slidepdf.com/reader/full/economic-forecast-2009 100/172
Econo mic Forec ast, Spring 2009
94
demand is forecast to be broadly neutral.
Equipment investment is set to rebound slightly
supported by the improved results of enterprises
and FDI inflows, while construction investment
will continue to benefit from strong public
spending, despite a further contraction in housing
outlays.
Private consumption growth is expected to slow to
¼% in 2010 because of a worsening labour market
situation. Decelerating private consumption
growth and increasing import prices are set to
influence imports which will decrease further, by
1½% in 2010. Exports are expected to grow by
¼% in 2010 supported by rebounding external
demand and the lagged effects of the recent
depreciation.
External imbalances will subdue slightly, with the
current account deficit shrinking in 2009 to below
5% of GDP and around 4% in 2010. Thanks to
higher transfers from the EU, the external deficit
will be limited to around 2¼% of GDP in 2010,
which still represents a moderate widening
compared with the previous years.
The main downside risk to the forecast results
from the depreciation of the Polish currency; this
could hamper consumption by foreign-currency-indebted households, increase the financial costs of
companies and affect also the inflation outlook.
Emp loyment e xpec ted to fall sharply
In the course of 2008 an impressive improvement
was seen in the labour market, continuing the trend
seen since 2006, as the average annual
unemployment rate fell to 7% from 9½% in 2007.
Total employment increased by around 600,000 in
2008, but as the participation rate increased the
drop in the number of unemployed was limited to
400,000. As economic activity is expected toweaken, employment should fall by 2¼% in 2009
and a further 1½% in 2010, while a return of
emigrants, less generous early retirement rules and
a reduction of taxes on labour should increase the
activity rate. The number of unemployed is
projected to reach some 1.7 million in 2009 – close
to 10% of the labour force – and to increase in
2010 by about ½ a million, leaving the
unemployment rate at around 12%.
Inflationary pressures limited by weakening
econom ic outlook
Annual HICP inflation increased from 2½% in
2007 to 4.2% in 2008, boosted by strong wage pressure and elevated energy and food prices. It is
likely to fall sharply, on the back of favourable
base effects, stabilising fuel and food prices and
weakening growth, to 2.6% in 2009; it should
decrease further, to 1.9% in 2010, which remains
within the Polish central bank’s medium-term
target range of 2.5% ± 1 p.p.
Unit labour costs are projected to have increased
by about 7% in 2008, as a result of strong wage
growth combined with modest productivity
increases. In 2009 nominal unit labour costs are
likely to continue to rise, albeit at a slower pace, as
productivity growth recovers slightly supported by
falling employment, especially among the least
skilled, while the rise in wages is expected to
remain subdued. In 2010 nominal unit labour costs
are expected to fall in line with rising productivity
and decelerating wage growth.
Fiscal de ficit inc reasing due to autom atic
stab ilisers and discretionary m ea sures
Due to the reduction of social contributions, an
increase in personal income tax reliefs for families,a generous indexation of pensions and social
benefits and a deterioration of the economic
situation towards the end of the year, the general
government deficit was expected to widen in 2008.
It increased by about 2 percentage points to 3.9%
of GDP in 2008, significantly more than estimated
in the December 2008 convergence programme
(2.7%) and in the Commission services’ January
2009 interim forecast (2.5%). In particular, non-tax
revenues were much lower (mainly capital
transfers due to underexecution of EU funds at the
regional level) and intermediate consumption (e.g.military expenditure) much higher than presented
in the programme.
Despite an additional reduction of central
government expenditure of ¾% of GDP,
introduced after the adoption of the 2009 budget,
the general government deficit is forecast to
deteriorate to about 6½% of GDP in 2009. This is
the expected outcome of the recession and
discretionary measures. Automatic stabilisers will
contribute to an increase in social transfers on top
of high statutory growth under new indexation
rules referring to high inflation and wages in 2008.
Among the stimulus measures, a rise in public
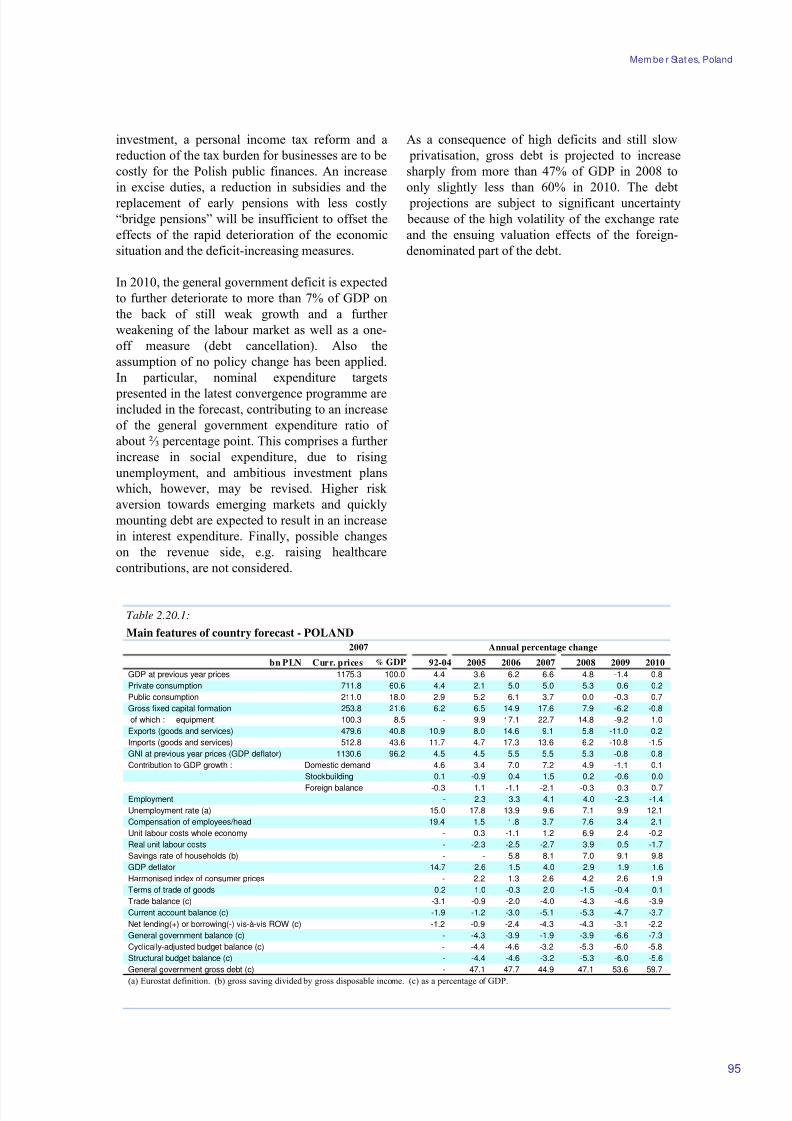
8/14/2019 Economic Forecast 2009
http://slidepdf.com/reader/full/economic-forecast-2009 101/172
Mem be r Stat es, Poland
Table 2.20.1:
Main features of country forecast - POLAND
2007 Annual percentage change
bn PLN Curr. prices % GDP 92-04 2005 2006 2007 2008 2009 2010
GDP at previous year prices 1175.3 100.0 4.4 3.6 6.2 6.6 4.8 -1.4 0.8
Private consumption 711.8 60.6 4.4 2.1 5.0 5.0 5.3 0.6 0.2
Public consumption 211.0 18.0 2.9 5.2 6.1 3.7 0.0 -0.3 0.7
Gross fixed capital formation 253.8 21.6 6.2 6.5 14.9 17.6 7.9 -6.2 -0.8
of which : equipment 100.3 8.5 - 9.9 17.1 22.7 14.8 -9.2 1.0
Exports (goods and services) 479.6 40.8 10.9 8.0 14.6 9.1 5.8 -11.0 0.2
Imports (goods and services) 512.8 43.6 11.7 4.7 17.3 13.6 6.2 -10.8 -1.5
GNI at previous year prices (GDP deflator) 1130.6 96.2 4.5 4.5 5.5 5.5 5.3 -0.8 0.8
Contribution to GDP growth : Domestic demand 4.6 3.4 7.0 7.2 4.9 -1.1 0.1
Stockbuilding 0.1 -0.9 0.4 1.5 0.2 -0.6 0.0
Foreign balance -0.3 1.1 -1.1 -2.1 -0.3 0.3 0.7Employment - 2.3 3.3 4.1 4.0 -2.3 -1.4
Unemployment rate (a) 15.0 17.8 13.9 9.6 7.1 9.9 12.1
Compensation of employees/head 19.4 1.5 1.8 3.7 7.6 3.4 2.1
Unit labour costs whole economy - 0.3 -1.1 1.2 6.9 2.4 -0.2
Real unit labour costs - -2.3 -2.5 -2.7 3.9 0.5 -1.7
Savings rate of households (b) - - 5.8 8.1 7.0 9.1 9.8
GDP deflator 14.7 2.6 1.5 4.0 2.9 1.9 1.6
Harmonised index of consumer prices - 2.2 1.3 2.6 4.2 2.6 1.9
Terms of trade of goods 0.2 1.0 -0.3 2.0 -1.5 -0.4 0.1
Trade balance (c) -3.1 -0.9 -2.0 -4.0 -4.3 -4.6 -3.9
Current account balance (c) -1.9 -1.2 -3.0 -5.1 -5.3 -4.7 -3.7
Net lending(+) or borrowing(-) vis-à-vis ROW (c) -1.2 -0.9 -2.4 -4.3 -4.3 -3.1 -2.2
General government balance (c) - -4.3 -3.9 -1.9 -3.9 -6.6 -7.3
Cyclically-adjusted budget balance (c) - -4.4 -4.6 -3.2 -5.3 -6.0 -5.8
Structural budget balance (c) - -4.4 -4.6 -3.2 -5.3 -6.0 -5.6
General government gross debt (c) - 47.1 47.7 44.9 47.1 53.6 59.7
(a) Eurostat definition. (b) gross saving divided by gross disposable income. (c) as a percentage of GDP.
95
investment, a personal income tax reform and a
reduction of the tax burden for businesses are to be
costly for the Polish public finances. An increase
in excise duties, a reduction in subsidies and the
replacement of early pensions with less costly
“bridge pensions” will be insufficient to offset the
effects of the rapid deterioration of the economic
situation and the deficit-increasing measures.
In 2010, the general government deficit is expected
to further deteriorate to more than 7% of GDP on
the back of still weak growth and a further
weakening of the labour market as well as a one-
off measure (debt cancellation). Also the
assumption of no policy change has been applied.
In particular, nominal expenditure targets
presented in the latest convergence programme areincluded in the forecast, contributing to an increase
of the general government expenditure ratio of
about ⅔ percentage point. This comprises a further
increase in social expenditure, due to rising
unemployment, and ambitious investment plans
which, however, may be revised. Higher risk
aversion towards emerging markets and quickly
mounting debt are expected to result in an increase
in interest expenditure. Finally, possible changes
on the revenue side, e.g. raising healthcare
contributions, are not considered.
As a consequence of high deficits and still slow
privatisation, gross debt is projected to increase
sharply from more than 47% of GDP in 2008 to
only slightly less than 60% in 2010. The debt
projections are subject to significant uncertainty
because of the high volatility of the exchange rate
and the ensuing valuation effects of the foreign-
denominated part of the debt.
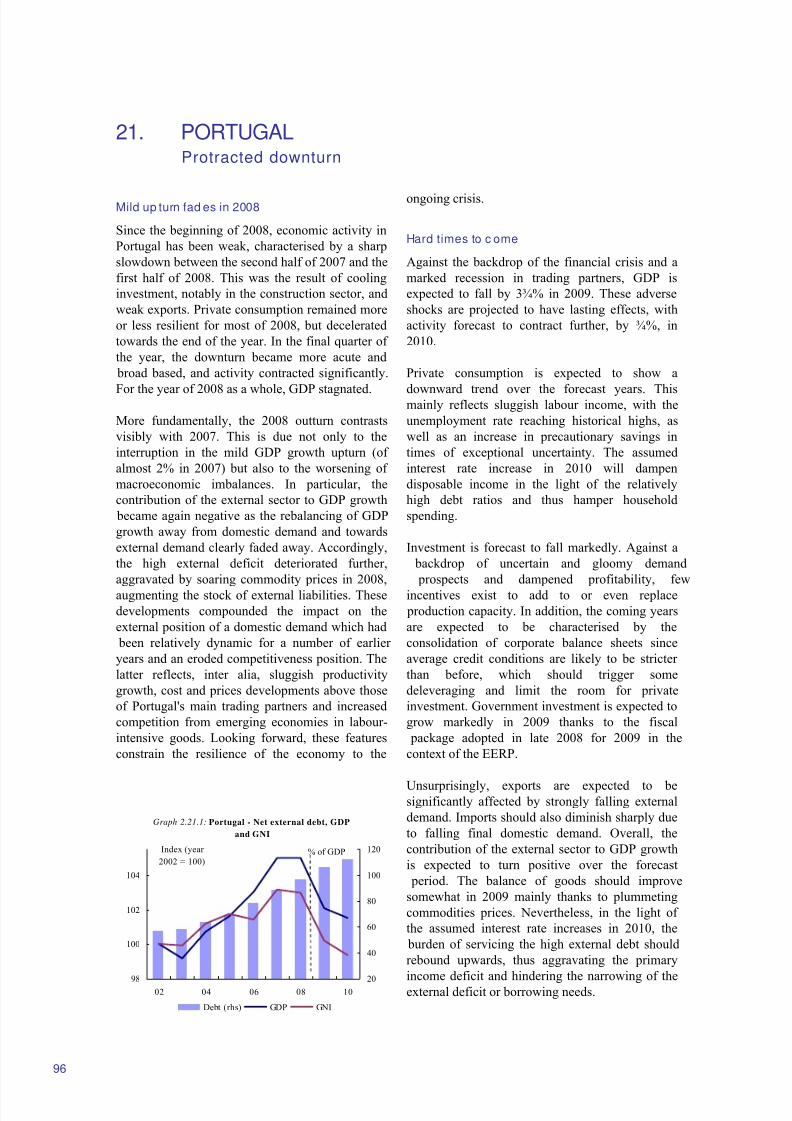
8/14/2019 Economic Forecast 2009
http://slidepdf.com/reader/full/economic-forecast-2009 102/172
21. PORTUGALProtracted downturn
Graph 2.21.1: Portugal - Net external debt, GDP
and GNI
98
100
102
104
02 04 06 08 10
Index (year
2002 = 100)
20
40
60
80
100
120% of GDP
Debt (rhs) GDP GNI
96
Mild up turn fad es in 2008
Since the beginning of 2008, economic activity in
Portugal has been weak, characterised by a sharp
slowdown between the second half of 2007 and the
first half of 2008. This was the result of cooling
investment, notably in the construction sector, and
weak exports. Private consumption remained more
or less resilient for most of 2008, but decelerated
towards the end of the year. In the final quarter of
the year, the downturn became more acute and
broad based, and activity contracted significantly.
For the year of 2008 as a whole, GDP stagnated.
More fundamentally, the 2008 outturn contrasts
visibly with 2007. This is due not only to the
interruption in the mild GDP growth upturn (of
almost 2% in 2007) but also to the worsening of
macroeconomic imbalances. In particular, the
contribution of the external sector to GDP growth
became again negative as the rebalancing of GDP
growth away from domestic demand and towards
external demand clearly faded away. Accordingly,
the high external deficit deteriorated further,
aggravated by soaring commodity prices in 2008,
augmenting the stock of external liabilities. These
developments compounded the impact on the
external position of a domestic demand which had
been relatively dynamic for a number of earlier
years and an eroded competitiveness position. The
latter reflects, inter alia, sluggish productivity
growth, cost and prices developments above those
of Portugal's main trading partners and increased
competition from emerging economies in labour-
intensive goods. Looking forward, these features
constrain the resilience of the economy to the
ongoing crisis.
Hard times to c ome
Against the backdrop of the financial crisis and a
marked recession in trading partners, GDP is
expected to fall by 3¾% in 2009. These adverse
shocks are projected to have lasting effects, with
activity forecast to contract further, by ¾%, in
2010.
Private consumption is expected to show a
downward trend over the forecast years. Thismainly reflects sluggish labour income, with the
unemployment rate reaching historical highs, as
well as an increase in precautionary savings in
times of exceptional uncertainty. The assumed
interest rate increase in 2010 will dampen
disposable income in the light of the relatively
high debt ratios and thus hamper household
spending.
Investment is forecast to fall markedly. Against a
backdrop of uncertain and gloomy demand
prospects and dampened profitability, few
incentives exist to add to or even replace
production capacity. In addition, the coming years
are expected to be characterised by the
consolidation of corporate balance sheets since
average credit conditions are likely to be stricter
than before, which should trigger some
deleveraging and limit the room for private
investment. Government investment is expected to
grow markedly in 2009 thanks to the fiscal
package adopted in late 2008 for 2009 in the
context of the EERP.
Unsurprisingly, exports are expected to besignificantly affected by strongly falling external
demand. Imports should also diminish sharply due
to falling final domestic demand. Overall, the
contribution of the external sector to GDP growth
is expected to turn positive over the forecast
period. The balance of goods should improve
somewhat in 2009 mainly thanks to plummeting
commodities prices. Nevertheless, in the light of
the assumed interest rate increases in 2010, the
burden of servicing the high external debt should
rebound upwards, thus aggravating the primary
income deficit and hindering the narrowing of theexternal deficit or borrowing needs.
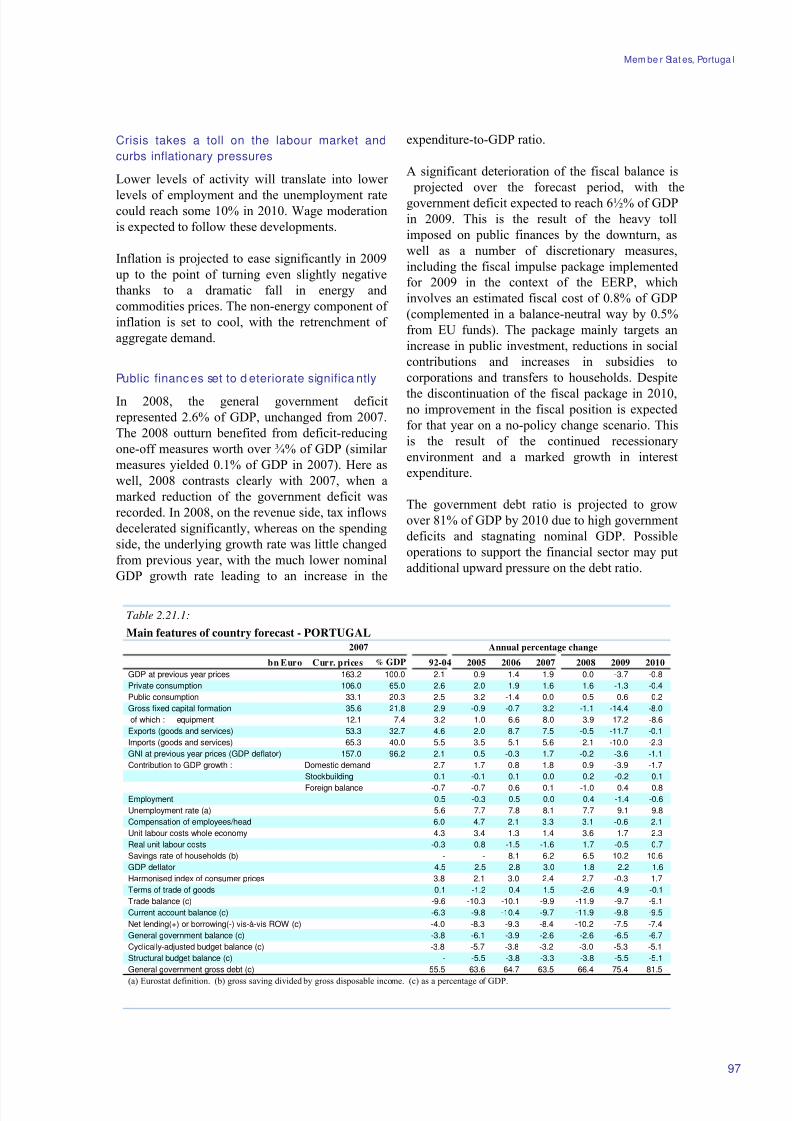
8/14/2019 Economic Forecast 2009
http://slidepdf.com/reader/full/economic-forecast-2009 103/172
Mem be r Stat es, Portuga l
Table 2.21.1:
Main features of country forecast - PORTUGAL
2007 Annual percentage change
bn Euro Curr. prices % GDP 92-04 2005 2006 2007 2008 2009 2010
GDP at previous year prices 163.2 100.0 2.1 0.9 1.4 1.9 0.0 -3.7 -0.8
Private consumption 106.0 65.0 2.6 2.0 1.9 1.6 1.6 -1.3 -0.4
Public consumption 33.1 20.3 2.5 3.2 -1.4 0.0 0.5 0.6 0.2
Gross fixed capital formation 35.6 21.8 2.9 -0.9 -0.7 3.2 -1.1 -14.4 -8.0
of which : equipment 12.1 7.4 3.2 1.0 6.6 8.0 3.9 -17.2 -8.6
Exports (goods and services) 53.3 32.7 4.6 2.0 8.7 7.5 -0.5 -11.7 -0.1
Imports (goods and services) 65.3 40.0 5.5 3.5 5.1 5.6 2.1 -10.0 -2.3
GNI at previous year prices (GDP deflator) 157.0 96.2 2.1 0.5 -0.3 1.7 -0.2 -3.6 -1.1
Contribution to GDP growth : Domestic demand 2.7 1.7 0.8 1.8 0.9 -3.9 -1.7
Stockbuilding 0.1 -0.1 0.1 0.0 0.2 -0.2 0.1
Foreign balance -0.7 -0.7 0.6 0.1 -1.0 0.4 0.8Employment 0.5 -0.3 0.5 0.0 0.4 -1.4 -0.6
Unemployment rate (a) 5.6 7.7 7.8 8.1 7.7 9.1 9.8
Compensation of employees/head 6.0 4.7 2.1 3.3 3.1 -0.6 2.1
Unit labour costs whole economy 4.3 3.4 1.3 1.4 3.6 1.7 2.3
Real unit labour costs -0.3 0.8 -1.5 -1.6 1.7 -0.5 0.7
Savings rate of households (b) - - 8.1 6.2 6.5 10.2 10.6
GDP deflator 4.5 2.5 2.8 3.0 1.8 2.2 1.6
Harmonised index of consumer prices 3.8 2.1 3.0 2.4 2.7 -0.3 1.7
Terms of trade of goods 0.1 -1.2 0.4 1.5 -2.6 4.9 -0.1
Trade balance (c) -9.6 -10.3 -10.1 -9.9 -11.9 -9.7 -9.1
Current account balance (c) -6.3 -9.8 -10.4 -9.7 -11.9 -9.8 -9.5
Net lending(+) or borrowing(-) vis-à-vis ROW (c) -4.0 -8.3 -9.3 -8.4 -10.2 -7.5 -7.4
General government balance (c) -3.8 -6.1 -3.9 -2.6 -2.6 -6.5 -6.7
Cyclically-adjusted budget balance (c) -3.8 -5.7 -3.8 -3.2 -3.0 -5.3 -5.1
Structural budget balance (c) - -5.5 -3.8 -3.3 -3.8 -5.5 -5.1
General government gross debt (c) 55.5 63.6 64.7 63.5 66.4 75.4 81.5
(a) Eurostat definition. (b) gross saving divided by gross disposable income. (c) as a percentage of GDP.
97
Crisis takes a toll on the labour market and
curbs inflationary pressures
Lower levels of activity will translate into lower
levels of employment and the unemployment ratecould reach some 10% in 2010. Wage moderation
is expected to follow these developments.
Inflation is projected to ease significantly in 2009
up to the point of turning even slightly negative
thanks to a dramatic fall in energy and
commodities prices. The non-energy component of
inflation is set to cool, with the retrenchment of
aggregate demand.
Public finances set to d eteriorate significa ntly
In 2008, the general government deficit
represented 2.6% of GDP, unchanged from 2007.
The 2008 outturn benefited from deficit-reducing
one-off measures worth over ¾% of GDP (similar
measures yielded 0.1% of GDP in 2007). Here as
well, 2008 contrasts clearly with 2007, when a
marked reduction of the government deficit was
recorded. In 2008, on the revenue side, tax inflows
decelerated significantly, whereas on the spending
side, the underlying growth rate was little changed
from previous year, with the much lower nominal
GDP growth rate leading to an increase in the
expenditure-to-GDP ratio.
A significant deterioration of the fiscal balance is
projected over the forecast period, with the
government deficit expected to reach 6½% of GDP
in 2009. This is the result of the heavy toll
imposed on public finances by the downturn, as
well as a number of discretionary measures,
including the fiscal impulse package implemented
for 2009 in the context of the EERP, which
involves an estimated fiscal cost of 0.8% of GDP
(complemented in a balance-neutral way by 0.5%
from EU funds). The package mainly targets an
increase in public investment, reductions in social
contributions and increases in subsidies to
corporations and transfers to households. Despite
the discontinuation of the fiscal package in 2010,no improvement in the fiscal position is expected
for that year on a no-policy change scenario. This
is the result of the continued recessionary
environment and a marked growth in interest
expenditure.
The government debt ratio is projected to grow
over 81% of GDP by 2010 due to high government
deficits and stagnating nominal GDP. Possible
operations to support the financial sector may put
additional upward pressure on the debt ratio.
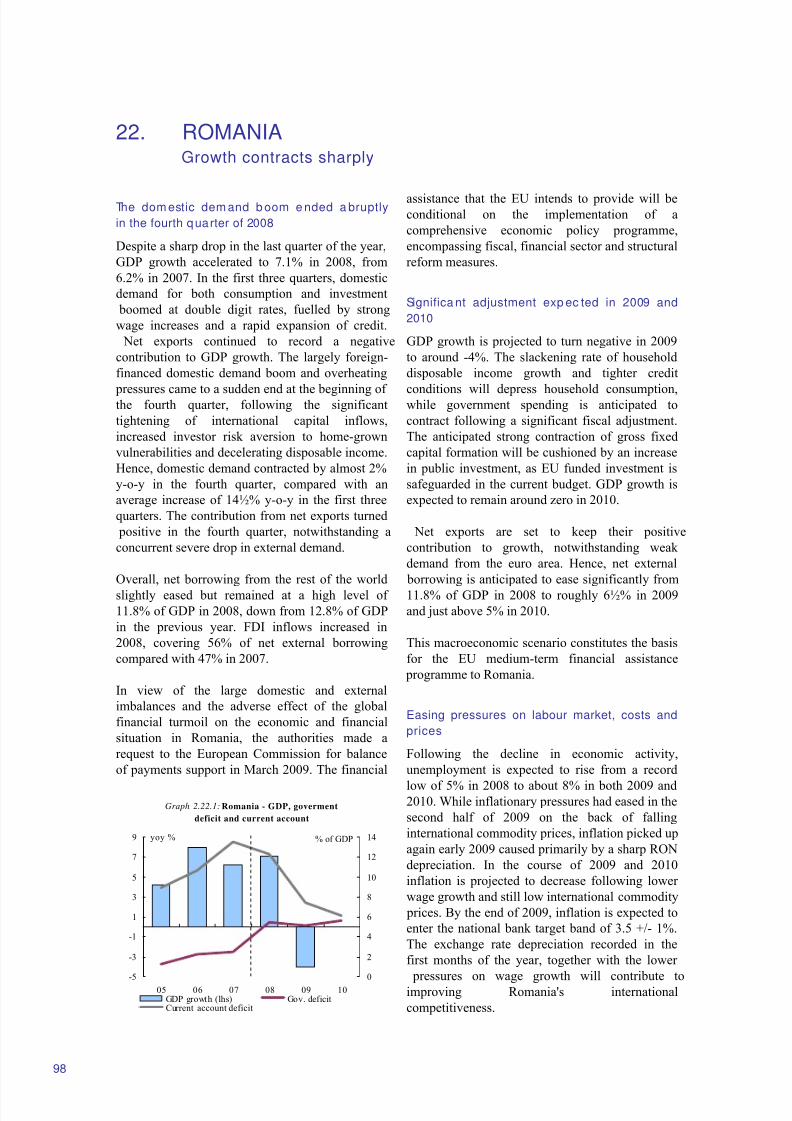
8/14/2019 Economic Forecast 2009
http://slidepdf.com/reader/full/economic-forecast-2009 104/172
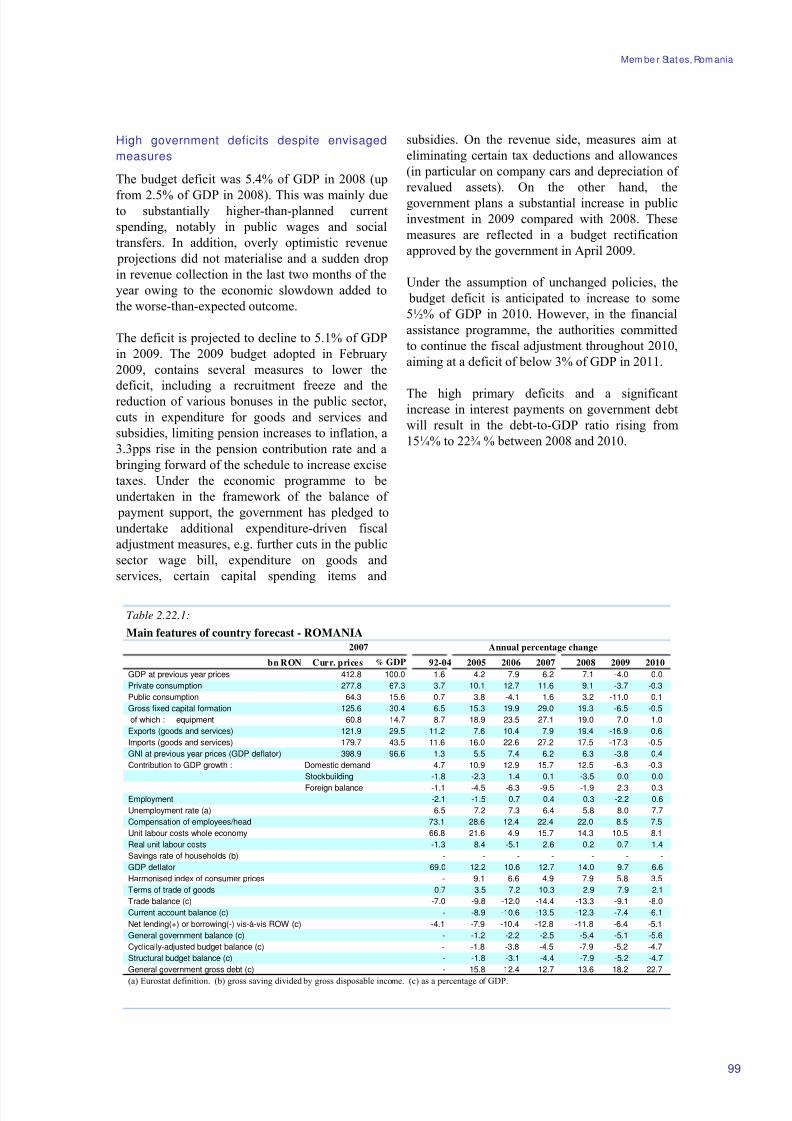
8/14/2019 Economic Forecast 2009
http://slidepdf.com/reader/full/economic-forecast-2009 105/172
Mem be r Stat es, Rom ania
Table 2.22.1:
Main features of country forecast - ROMANIA
2007 Annual percentage change
bn RON Curr. prices % GDP 92-04 2005 2006 2007 2008 2009 2010
GDP at previous year prices 412.8 100.0 1.6 4.2 7.9 6.2 7.1 -4.0 0.0
Private consumption 277.8 67.3 3.7 10.1 12.7 11.6 9.1 -3.7 -0.3
Public consumption 64.3 15.6 0.7 3.8 -4.1 1.6 3.2 -11.0 0.1
Gross fixed capital formation 125.6 30.4 6.5 15.3 19.9 29.0 19.3 -6.5 -0.5
of which : equipment 60.8 14.7 8.7 18.9 23.5 27.1 19.0 -7.0 -1.0
Exports (goods and services) 121.9 29.5 11.2 7.6 10.4 7.9 19.4 -16.9 0.6
Imports (goods and services) 179.7 43.5 11.6 16.0 22.6 27.2 17.5 -17.3 -0.5
GNI at previous year prices (GDP deflator) 398.9 96.6 1.3 5.5 7.4 6.2 6.3 -3.8 0.4
Contribution to GDP growth : Domestic demand 4.7 10.9 12.9 15.7 12.5 -6.3 -0.3
Stockbuilding -1.8 -2.3 1.4 0.1 -3.5 0.0 0.0
Foreign balance -1.1 -4.5 -6.3 -9.5 -1.9 2.3 0.3Employment -2.1 -1.5 0.7 0.4 0.3 -2.2 0.6
Unemployment rate (a) 6.5 7.2 7.3 6.4 5.8 8.0 7.7
Compensation of employees/head 73.1 28.6 12.4 22.4 22.0 8.5 7.5
Unit labour costs whole economy 66.8 21.6 4.9 15.7 14.3 10.5 8.1
Real unit labour costs -1.3 8.4 -5.1 2.6 0.2 0.7 1.4
Savings rate of households (b) - - - - - - -
GDP deflator 69.0 12.2 10.6 12.7 14.0 9.7 6.6
Harmonised index of consumer prices - 9.1 6.6 4.9 7.9 5.8 3.5
Terms of trade of goods 0.7 3.5 7.2 10.3 2.9 7.9 2.1
Trade balance (c) -7.0 -9.8 -12.0 -14.4 -13.3 -9.1 -8.0
Current account balance (c) - -8.9 -10.6 -13.5 -12.3 -7.4 -6.1
Net lending(+) or borrowing(-) vis-à-vis ROW (c) -4.1 -7.9 -10.4 -12.8 -11.8 -6.4 -5.1
General government balance (c) - -1.2 -2.2 -2.5 -5.4 -5.1 -5.6
Cyclically-adjusted budget balance (c) - -1.8 -3.8 -4.5 -7.9 -5.2 -4.7
Structural budget balance (c) - -1.8 -3.1 -4.4 -7.9 -5.2 -4.7
General government gross debt (c) - 15.8 12.4 12.7 13.6 18.2 22.7
(a) Eurostat definition. (b) gross saving divided by gross disposable income. (c) as a percentage of GDP.
99
High government deficits despite envisaged
measures
The budget deficit was 5.4% of GDP in 2008 (up
from 2.5% of GDP in 2008). This was mainly dueto substantially higher-than-planned current
spending, notably in public wages and social
transfers. In addition, overly optimistic revenue
projections did not materialise and a sudden drop
in revenue collection in the last two months of the
year owing to the economic slowdown added to
the worse-than-expected outcome.
The deficit is projected to decline to 5.1% of GDP
in 2009. The 2009 budget adopted in February
2009, contains several measures to lower the
deficit, including a recruitment freeze and the
reduction of various bonuses in the public sector,
cuts in expenditure for goods and services and
subsidies, limiting pension increases to inflation, a
3.3pps rise in the pension contribution rate and a
bringing forward of the schedule to increase excise
taxes. Under the economic programme to be
undertaken in the framework of the balance of
payment support, the government has pledged to
undertake additional expenditure-driven fiscal
adjustment measures, e.g. further cuts in the public
sector wage bill, expenditure on goods and
services, certain capital spending items and
subsidies. On the revenue side, measures aim at
eliminating certain tax deductions and allowances
(in particular on company cars and depreciation of
revalued assets). On the other hand, the
government plans a substantial increase in public
investment in 2009 compared with 2008. These
measures are reflected in a budget rectification
approved by the government in April 2009.
Under the assumption of unchanged policies, the
budget deficit is anticipated to increase to some
5½% of GDP in 2010. However, in the financial
assistance programme, the authorities committed
to continue the fiscal adjustment throughout 2010,
aiming at a deficit of below 3% of GDP in 2011.
The high primary deficits and a significantincrease in interest payments on government debt
will result in the debt-to-GDP ratio rising from
15¼% to 22¾ % between 2008 and 2010.
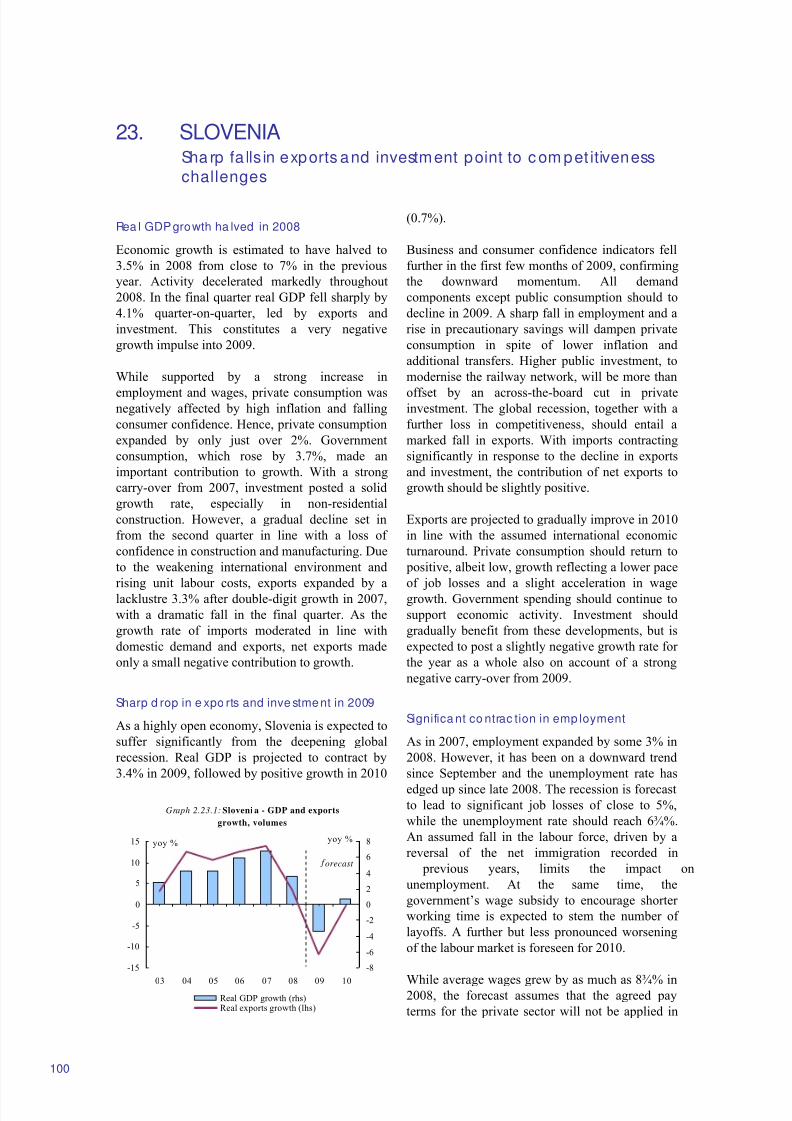
8/14/2019 Economic Forecast 2009
http://slidepdf.com/reader/full/economic-forecast-2009 106/172
23. SLOVENIASharp fa lls in exports and investment point to c om pet itiveness
challenges
Graph 2.23.1: Sloveni a - GDP and exports
growth, volumes
-15
-10
-5
0
5
10
15
03 04 05 06 07 08 09 10
-8
-6
-4
-2
0
2
4
6
8
Real GDP growth (rhs)Real exports growth (lhs)
orecast
yoy %yoy %
100
Rea l GDP growth ha lved in 2008
Economic growth is estimated to have halved to
3.5% in 2008 from close to 7% in the previous
year. Activity decelerated markedly throughout
2008. In the final quarter real GDP fell sharply by
4.1% quarter-on-quarter, led by exports and
investment. This constitutes a very negative
growth impulse into 2009.
While supported by a strong increase in
employment and wages, private consumption wasnegatively affected by high inflation and falling
consumer confidence. Hence, private consumption
expanded by only just over 2%. Government
consumption, which rose by 3.7%, made an
important contribution to growth. With a strong
carry-over from 2007, investment posted a solid
growth rate, especially in non-residential
construction. However, a gradual decline set in
from the second quarter in line with a loss of
confidence in construction and manufacturing. Due
to the weakening international environment and
rising unit labour costs, exports expanded by alacklustre 3.3% after double-digit growth in 2007,
with a dramatic fall in the final quarter. As the
growth rate of imports moderated in line with
domestic demand and exports, net exports made
only a small negative contribution to growth.
Sharp d rop in e xpo rts and inve stment in 2009
As a highly open economy, Slovenia is expected to
suffer significantly from the deepening global
recession. Real GDP is projected to contract by
3.4% in 2009, followed by positive growth in 2010
(0.7%).
Business and consumer confidence indicators fell
further in the first few months of 2009, confirming
the downward momentum. All demand
components except public consumption should to
decline in 2009. A sharp fall in employment and a
rise in precautionary savings will dampen private
consumption in spite of lower inflation and
additional transfers. Higher public investment, to
modernise the railway network, will be more than
offset by an across-the-board cut in privateinvestment. The global recession, together with a
further loss in competitiveness, should entail a
marked fall in exports. With imports contracting
significantly in response to the decline in exports
and investment, the contribution of net exports to
growth should be slightly positive.
Exports are projected to gradually improve in 2010
in line with the assumed international economic
turnaround. Private consumption should return to
positive, albeit low, growth reflecting a lower pace
of job losses and a slight acceleration in wagegrowth. Government spending should continue to
support economic activity. Investment should
gradually benefit from these developments, but is
expected to post a slightly negative growth rate for
the year as a whole also on account of a strong
negative carry-over from 2009.
Significa nt co ntrac tion in emp loyment
As in 2007, employment expanded by some 3% in
2008. However, it has been on a downward trend
since September and the unemployment rate has
edged up since late 2008. The recession is forecastto lead to significant job losses of close to 5%,
while the unemployment rate should reach 6¾%.
An assumed fall in the labour force, driven by a
reversal of the net immigration recorded in
previous years, limits the impact on
unemployment. At the same time, the
government’s wage subsidy to encourage shorter
working time is expected to stem the number of
layoffs. A further but less pronounced worsening
of the labour market is foreseen for 2010.
While average wages grew by as much as 8¾% in2008, the forecast assumes that the agreed pay
terms for the private sector will not be applied in
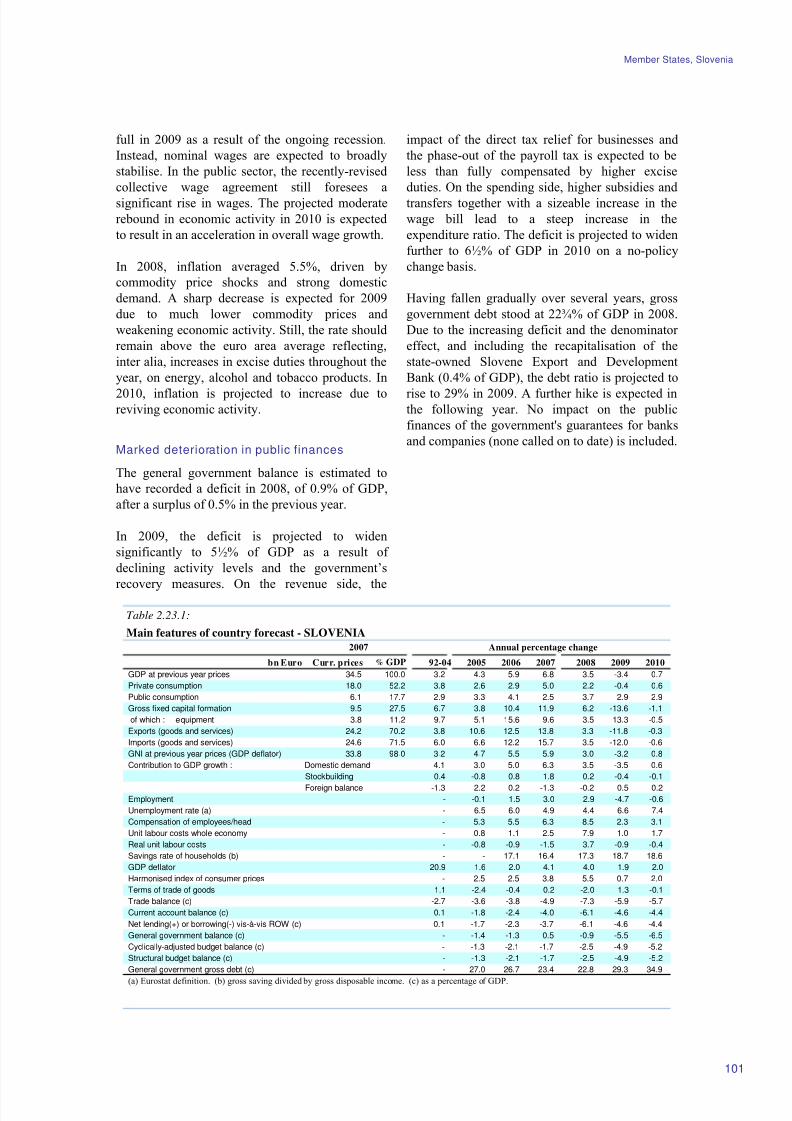
8/14/2019 Economic Forecast 2009
http://slidepdf.com/reader/full/economic-forecast-2009 107/172
Member States, Slovenia
Table 2.23.1:
Main features of country forecast - SLOVENIA
2007 Annual percentage change
bn Euro Curr. prices % GDP 92-04 2005 2006 2007 2008 2009 2010
GDP at previous year prices 34.5 100.0 3.2 4.3 5.9 6.8 3.5 -3.4 0.7
Private consumption 18.0 52.2 3.8 2.6 2.9 5.0 2.2 -0.4 0.6
Public consumption 6.1 17.7 2.9 3.3 4.1 2.5 3.7 2.9 2.9
Gross fixed capital formation 9.5 27.5 6.7 3.8 10.4 11.9 6.2 -13.6 -1.1
of which : equipment 3.8 11.2 9.7 5.1 15.6 9.6 3.5 -13.3 -0.5
Exports (goods and services) 24.2 70.2 3.8 10.6 12.5 13.8 3.3 -11.8 -0.3
Imports (goods and services) 24.6 71.5 6.0 6.6 12.2 15.7 3.5 -12.0 -0.6
GNI at previous year prices (GDP deflator) 33.8 98.0 3.2 4.7 5.5 5.9 3.0 -3.2 0.8
Contribution to GDP growth : Domestic demand 4.1 3.0 5.0 6.3 3.5 -3.5 0.6
Stockbuilding 0.4 -0.8 0.8 1.8 0.2 -0.4 -0.1
Foreign balance -1.3 2.2 0.2 -1.3 -0.2 0.5 0.2Employment - -0.1 1.5 3.0 2.9 -4.7 -0.6
Unemployment rate (a) - 6.5 6.0 4.9 4.4 6.6 7.4
Compensation of employees/head - 5.3 5.5 6.3 8.5 2.3 3.1
Unit labour costs whole economy - 0.8 1.1 2.5 7.9 1.0 1.7
Real unit labour costs - -0.8 -0.9 -1.5 3.7 -0.9 -0.4
Savings rate of households (b) - - 17.1 16.4 17.3 18.7 18.6
GDP deflator 20.9 1.6 2.0 4.1 4.0 1.9 2.0
Harmonised index of consumer prices - 2.5 2.5 3.8 5.5 0.7 2.0
Terms of trade of goods 1.1 -2.4 -0.4 0.2 -2.0 1.3 -0.1
Trade balance (c) -2.7 -3.6 -3.8 -4.9 -7.3 -5.9 -5.7
Current account balance (c) 0.1 -1.8 -2.4 -4.0 -6.1 -4.6 -4.4
Net lending(+) or borrowing(-) vis-à-vis ROW (c) 0.1 -1.7 -2.3 -3.7 -6.1 -4.6 -4.4
General government balance (c) - -1.4 -1.3 0.5 -0.9 -5.5 -6.5
Cyclically-adjusted budget balance (c) - -1.3 -2.1 -1.7 -2.5 -4.9 -5.2
Structural budget balance (c) - -1.3 -2.1 -1.7 -2.5 -4.9 -5.2
General government gross debt (c) - 27.0 26.7 23.4 22.8 29.3 34.9
(a) Eurostat definition. (b) gross saving divided by gross disposable income. (c) as a percentage of GDP.
101
full in 2009 as a result of the ongoing recession.
Instead, nominal wages are expected to broadly
stabilise. In the public sector, the recently-revised
collective wage agreement still foresees a
significant rise in wages. The projected moderate
rebound in economic activity in 2010 is expected
to result in an acceleration in overall wage growth.
In 2008, inflation averaged 5.5%, driven by
commodity price shocks and strong domestic
demand. A sharp decrease is expected for 2009
due to much lower commodity prices and
weakening economic activity. Still, the rate should
remain above the euro area average reflecting,
inter alia, increases in excise duties throughout the
year, on energy, alcohol and tobacco products. In
2010, inflation is projected to increase due toreviving economic activity.
Marked deterioration in public finances
The general government balance is estimated to
have recorded a deficit in 2008, of 0.9% of GDP,
after a surplus of 0.5% in the previous year.
In 2009, the deficit is projected to widen
significantly to 5½% of GDP as a result of
declining activity levels and the government’s
recovery measures. On the revenue side, the
impact of the direct tax relief for businesses and
the phase-out of the payroll tax is expected to be
less than fully compensated by higher excise
duties. On the spending side, higher subsidies and
transfers together with a sizeable increase in the
wage bill lead to a steep increase in the
expenditure ratio. The deficit is projected to widen
further to 6½% of GDP in 2010 on a no-policy
change basis.
Having fallen gradually over several years, gross
government debt stood at 22¾% of GDP in 2008.
Due to the increasing deficit and the denominator
effect, and including the recapitalisation of the
state-owned Slovene Export and Development
Bank (0.4% of GDP), the debt ratio is projected to
rise to 29% in 2009. A further hike is expected inthe following year. No impact on the public
finances of the government's guarantees for banks
and companies (none called on to date) is included.
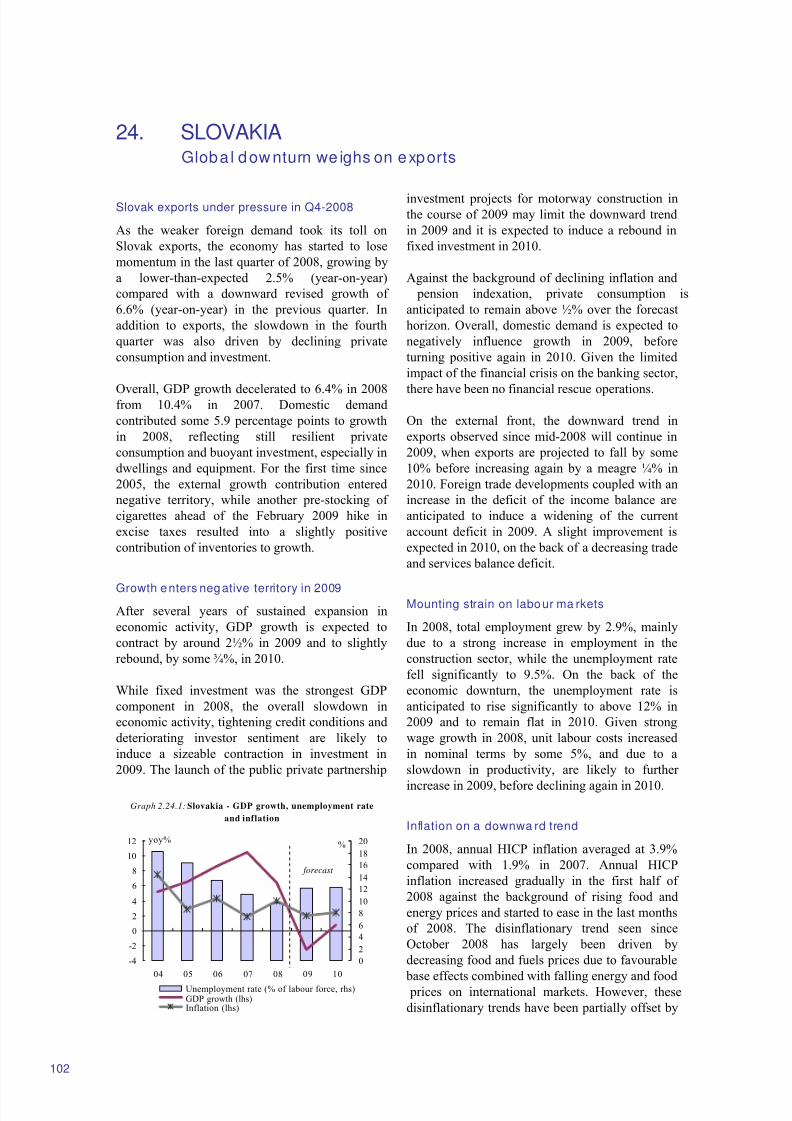
8/14/2019 Economic Forecast 2009
http://slidepdf.com/reader/full/economic-forecast-2009 108/172
24. SLOVAKIAGloba l dow nturn we ighs on exports
-4
-2
0
2
4
6
8
10
12
04 05 06 07 08 09 10
0
2
4
6
8
10
12
14
16
18
20
Unemployment rate (% of labour force, rhs)GDP growth (lhs)Inflation (lhs)
forecast
Graph 2.24.1: Slovakia - GDP growth, unemployment rate
and inflation
yoy%%
102
Slovak exports under pressure in Q4-2008
As the weaker foreign demand took its toll on
Slovak exports, the economy has started to lose
momentum in the last quarter of 2008, growing by
a lower-than-expected 2.5% (year-on-year)
compared with a downward revised growth of
6.6% (year-on-year) in the previous quarter. In
addition to exports, the slowdown in the fourth
quarter was also driven by declining private
consumption and investment.
Overall, GDP growth decelerated to 6.4% in 2008from 10.4% in 2007. Domestic demand
contributed some 5.9 percentage points to growth
in 2008, reflecting still resilient private
consumption and buoyant investment, especially in
dwellings and equipment. For the first time since
2005, the external growth contribution entered
negative territory, while another pre-stocking of
cigarettes ahead of the February 2009 hike in
excise taxes resulted into a slightly positive
contribution of inventories to growth.
Growth enters negative territory in 2009
After several years of sustained expansion in
economic activity, GDP growth is expected to
contract by around 2½% in 2009 and to slightly
rebound, by some ¾%, in 2010.
While fixed investment was the strongest GDP
component in 2008, the overall slowdown in
economic activity, tightening credit conditions and
deteriorating investor sentiment are likely to
induce a sizeable contraction in investment in
2009. The launch of the public private partnership
investment projects for motorway construction inthe course of 2009 may limit the downward trend
in 2009 and it is expected to induce a rebound in
fixed investment in 2010.
Against the background of declining inflation and
pension indexation, private consumption is
anticipated to remain above ½% over the forecast
horizon. Overall, domestic demand is expected to
negatively influence growth in 2009, before
turning positive again in 2010. Given the limited
impact of the financial crisis on the banking sector,
there have been no financial rescue operations.
On the external front, the downward trend in
exports observed since mid-2008 will continue in
2009, when exports are projected to fall by some
10% before increasing again by a meagre ¼% in
2010. Foreign trade developments coupled with an
increase in the deficit of the income balance are
anticipated to induce a widening of the current
account deficit in 2009. A slight improvement is
expected in 2010, on the back of a decreasing trade
and services balance deficit.
Mounting strain on labour ma rkets
In 2008, total employment grew by 2.9%, mainly
due to a strong increase in employment in the
construction sector, while the unemployment rate
fell significantly to 9.5%. On the back of the
economic downturn, the unemployment rate is
anticipated to rise significantly to above 12% in
2009 and to remain flat in 2010. Given strong
wage growth in 2008, unit labour costs increased
in nominal terms by some 5%, and due to a
slowdown in productivity, are likely to further
increase in 2009, before declining again in 2010.
Inflation on a downwa rd trend
In 2008, annual HICP inflation averaged at 3.9%
compared with 1.9% in 2007. Annual HICP
inflation increased gradually in the first half of
2008 against the background of rising food and
energy prices and started to ease in the last months
of 2008. The disinflationary trend seen since
October 2008 has largely been driven by
decreasing food and fuels prices due to favourable
base effects combined with falling energy and food prices on international markets. However, these
disinflationary trends have been partially offset by
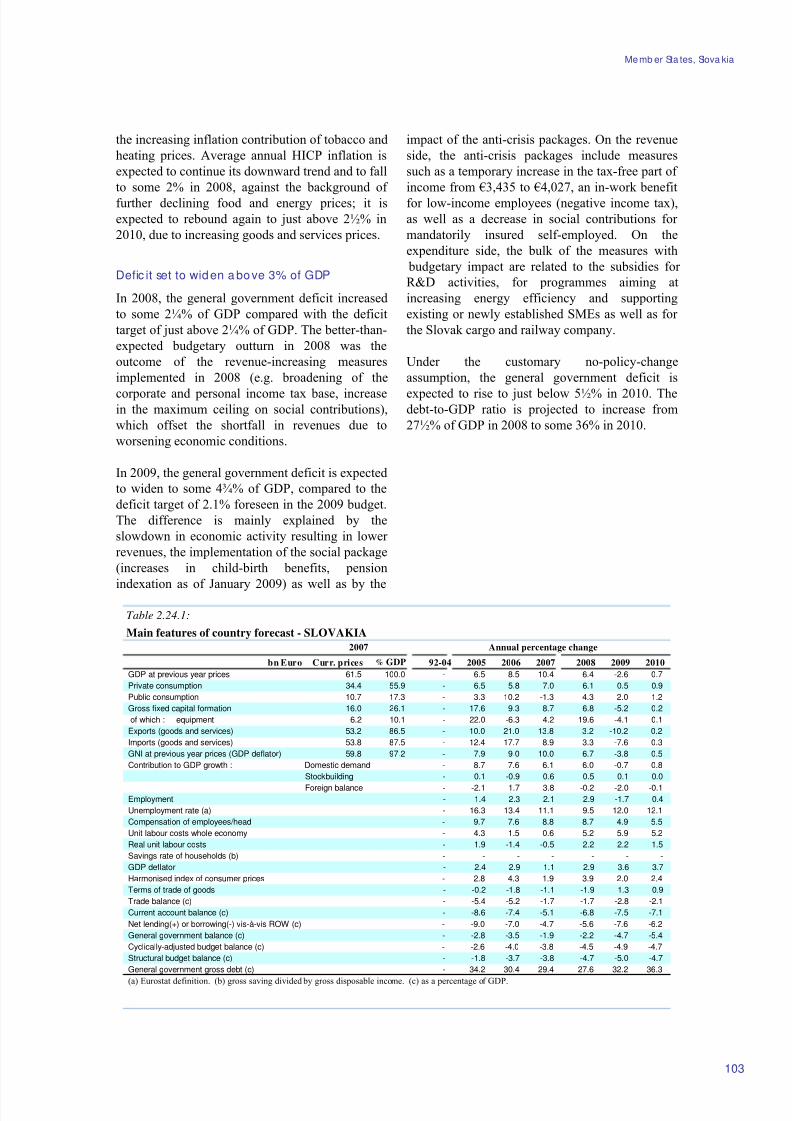
8/14/2019 Economic Forecast 2009
http://slidepdf.com/reader/full/economic-forecast-2009 109/172
Memb er Sta tes, Slova kia
Table 2.24.1:
Main features of country forecast - SLOVAKIA
2007 Annual percentage change
bn Euro Curr. prices % GDP 92-04 2005 2006 2007 2008 2009 2010
GDP at previous year prices 61.5 100.0 - 6.5 8.5 10.4 6.4 -2.6 0.7
Private consumption 34.4 55.9 - 6.5 5.8 7.0 6.1 0.5 0.9
Public consumption 10.7 17.3 - 3.3 10.2 -1.3 4.3 2.0 1.2
Gross fixed capital formation 16.0 26.1 - 17.6 9.3 8.7 6.8 -5.2 0.2
of which : equipment 6.2 10.1 - 22.0 -6.3 4.2 19.6 -4.1 0.1
Exports (goods and services) 53.2 86.5 - 10.0 21.0 13.8 3.2 -10.2 0.2
Imports (goods and services) 53.8 87.5 - 12.4 17.7 8.9 3.3 -7.6 0.3
GNI at previous year prices (GDP deflator) 59.8 97.2 - 7.9 9.0 10.0 6.7 -3.8 0.5
Contribution to GDP growth : Domestic demand - 8.7 7.6 6.1 6.0 -0.7 0.8
Stockbuilding - 0.1 -0.9 0.6 0.5 0.1 0.0
Foreign balance - -2.1 1.7 3.8 -0.2 -2.0 -0.1Employment - 1.4 2.3 2.1 2.9 -1.7 0.4
Unemployment rate (a) - 16.3 13.4 11.1 9.5 12.0 12.1
Compensation of employees/head - 9.7 7.6 8.8 8.7 4.9 5.5
Unit labour costs whole economy - 4.3 1.5 0.6 5.2 5.9 5.2
Real unit labour costs - 1.9 -1.4 -0.5 2.2 2.2 1.5
Savings rate of households (b) - - - - - - -
GDP deflator - 2.4 2.9 1.1 2.9 3.6 3.7
Harmonised index of consumer prices - 2.8 4.3 1.9 3.9 2.0 2.4
Terms of trade of goods - -0.2 -1.8 -1.1 -1.9 1.3 0.9
Trade balance (c) - -5.4 -5.2 -1.7 -1.7 -2.8 -2.1
Current account balance (c) - -8.6 -7.4 -5.1 -6.8 -7.5 -7.1
Net lending(+) or borrowing(-) vis-à-vis ROW (c) - -9.0 -7.0 -4.7 -5.6 -7.6 -6.2
General government balance (c) - -2.8 -3.5 -1.9 -2.2 -4.7 -5.4
Cyclically-adjusted budget balance (c) - -2.6 -4.0 -3.8 -4.5 -4.9 -4.7
Structural budget balance (c) - -1.8 -3.7 -3.8 -4.7 -5.0 -4.7
General government gross debt (c) - 34.2 30.4 29.4 27.6 32.2 36.3
(a) Eurostat definition. (b) gross saving divided by gross disposable income. (c) as a percentage of GDP.
103
the increasing inflation contribution of tobacco and
heating prices. Average annual HICP inflation is
expected to continue its downward trend and to fall
to some 2% in 2008, against the background of
further declining food and energy prices; it is
expected to rebound again to just above 2½% in
2010, due to increasing goods and services prices.
Defic it set to widen a bove 3% of GDP
In 2008, the general government deficit increased
to some 2¼% of GDP compared with the deficit
target of just above 2¼% of GDP. The better-than-
expected budgetary outturn in 2008 was the
outcome of the revenue-increasing measures
implemented in 2008 (e.g. broadening of the
corporate and personal income tax base, increasein the maximum ceiling on social contributions),
which offset the shortfall in revenues due to
worsening economic conditions.
In 2009, the general government deficit is expected
to widen to some 4¾% of GDP, compared to the
deficit target of 2.1% foreseen in the 2009 budget.
The difference is mainly explained by the
slowdown in economic activity resulting in lower
revenues, the implementation of the social package
(increases in child-birth benefits, pension
indexation as of January 2009) as well as by the
impact of the anti-crisis packages. On the revenue
side, the anti-crisis packages include measures
such as a temporary increase in the tax-free part of
income from €3,435 to €4,027, an in-work benefit
for low-income employees (negative income tax),
as well as a decrease in social contributions for
mandatorily insured self-employed. On the
expenditure side, the bulk of the measures with
budgetary impact are related to the subsidies for
R&D activities, for programmes aiming at
increasing energy efficiency and supporting
existing or newly established SMEs as well as for
the Slovak cargo and railway company.
Under the customary no-policy-change
assumption, the general government deficit is
expected to rise to just below 5½% in 2010. Thedebt-to-GDP ratio is projected to increase from
27½% of GDP in 2008 to some 36% in 2010.
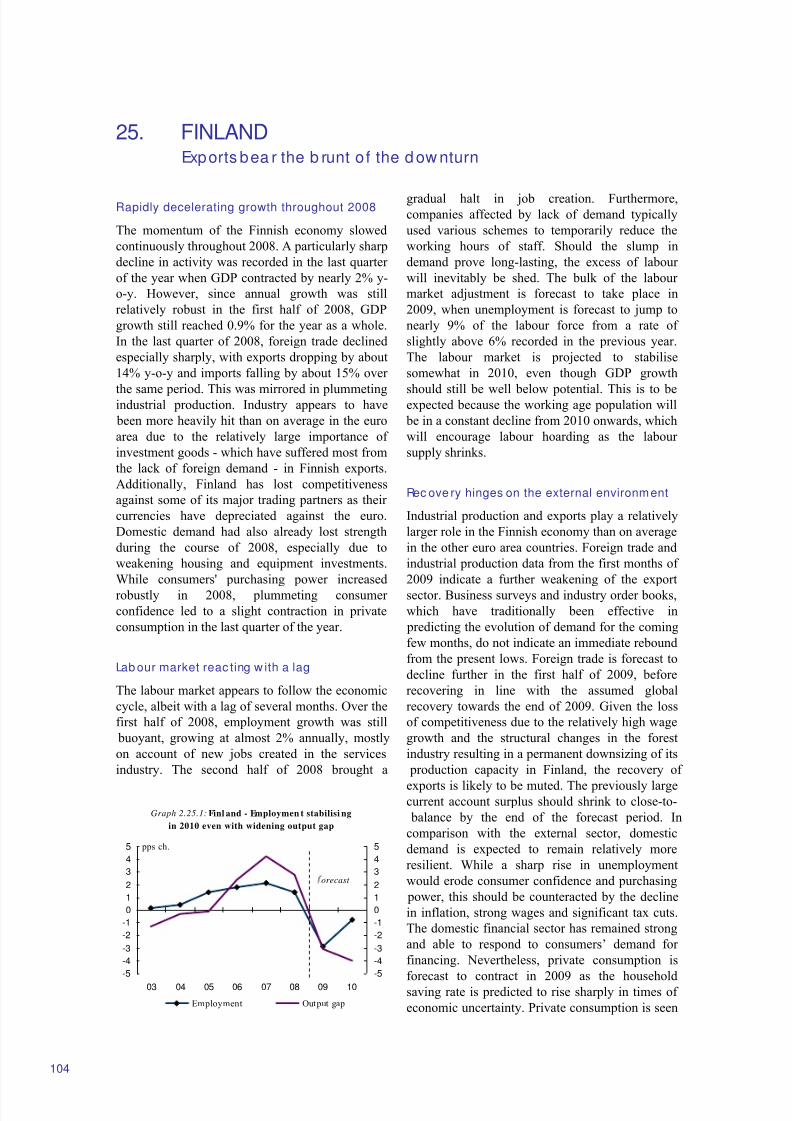
8/14/2019 Economic Forecast 2009
http://slidepdf.com/reader/full/economic-forecast-2009 110/172
25. FINLANDExports bea r the b runt o f the d ow nturn
Graph 2.25.1: Finl and - Employmen t stabilisi ng
in 2010 even with widening output gap
-5
-4
-3
-2
-1
0
1
2
3
4
5
03 04 05 06 07 08 09 10
pps ch.
-5
-4
-3
-2
-1
0
1
2
3
4
5
Employment Output gap
orecast
104
Rapidly decelerating growth throughout 2008
The momentum of the Finnish economy slowed
continuously throughout 2008. A particularly sharp
decline in activity was recorded in the last quarter
of the year when GDP contracted by nearly 2% y-
o-y. However, since annual growth was still
relatively robust in the first half of 2008, GDP
growth still reached 0.9% for the year as a whole.
In the last quarter of 2008, foreign trade declined
especially sharply, with exports dropping by about
14% y-o-y and imports falling by about 15% over
the same period. This was mirrored in plummetingindustrial production. Industry appears to have
been more heavily hit than on average in the euro
area due to the relatively large importance of
investment goods - which have suffered most from
the lack of foreign demand - in Finnish exports.
Additionally, Finland has lost competitiveness
against some of its major trading partners as their
currencies have depreciated against the euro.
Domestic demand had also already lost strength
during the course of 2008, especially due to
weakening housing and equipment investments.
While consumers' purchasing power increased
robustly in 2008, plummeting consumer
confidence led to a slight contraction in private
consumption in the last quarter of the year.
Lab our market reac ting w ith a lag
The labour market appears to follow the economic
cycle, albeit with a lag of several months. Over the
first half of 2008, employment growth was still
buoyant, growing at almost 2% annually, mostly
on account of new jobs created in the services
industry. The second half of 2008 brought a
gradual halt in job creation. Furthermore,companies affected by lack of demand typically
used various schemes to temporarily reduce the
working hours of staff. Should the slump in
demand prove long-lasting, the excess of labour
will inevitably be shed. The bulk of the labour
market adjustment is forecast to take place in
2009, when unemployment is forecast to jump to
nearly 9% of the labour force from a rate of
slightly above 6% recorded in the previous year.
The labour market is projected to stabilise
somewhat in 2010, even though GDP growth
should still be well below potential. This is to beexpected because the working age population will
be in a constant decline from 2010 onwards, which
will encourage labour hoarding as the labour
supply shrinks.
Rec ove ry hinges on the external environment
Industrial production and exports play a relatively
larger role in the Finnish economy than on average
in the other euro area countries. Foreign trade and
industrial production data from the first months of
2009 indicate a further weakening of the export
sector. Business surveys and industry order books,
which have traditionally been effective in
predicting the evolution of demand for the coming
few months, do not indicate an immediate rebound
from the present lows. Foreign trade is forecast to
decline further in the first half of 2009, before
recovering in line with the assumed global
recovery towards the end of 2009. Given the loss
of competitiveness due to the relatively high wage
growth and the structural changes in the forest
industry resulting in a permanent downsizing of its
production capacity in Finland, the recovery of
exports is likely to be muted. The previously largecurrent account surplus should shrink to close-to-
balance by the end of the forecast period. In
comparison with the external sector, domestic
demand is expected to remain relatively more
resilient. While a sharp rise in unemployment
would erode consumer confidence and purchasing
power, this should be counteracted by the decline
in inflation, strong wages and significant tax cuts.
The domestic financial sector has remained strong
and able to respond to consumers’ demand for
financing. Nevertheless, private consumption is
forecast to contract in 2009 as the householdsaving rate is predicted to rise sharply in times of
economic uncertainty. Private consumption is seen
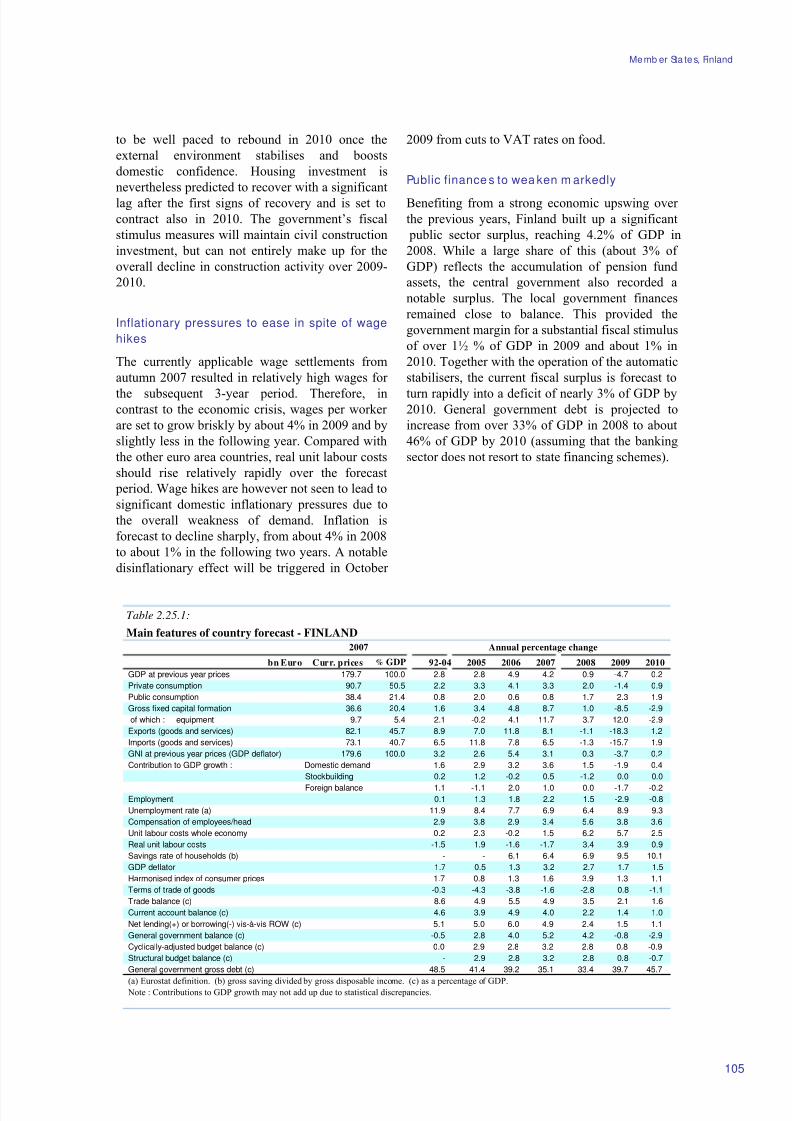
8/14/2019 Economic Forecast 2009
http://slidepdf.com/reader/full/economic-forecast-2009 111/172
Memb er Sta tes, Finland
Table 2.25.1:
Main features of country forecast - FINLAND
2007 Annual percentage change
bn Euro Curr. prices % GDP 92-04 2005 2006 2007 2008 2009 2010
GDP at previous year prices 179.7 100.0 2.8 2.8 4.9 4.2 0.9 -4.7 0.2
Private consumption 90.7 50.5 2.2 3.3 4.1 3.3 2.0 -1.4 0.9
Public consumption 38.4 21.4 0.8 2.0 0.6 0.8 1.7 2.3 1.9
Gross fixed capital formation 36.6 20.4 1.6 3.4 4.8 8.7 1.0 -8.5 -2.9
of which : equipment 9.7 5.4 2.1 -0.2 4.1 11.7 3.7 -12.0 -2.9
Exports (goods and services) 82.1 45.7 8.9 7.0 11.8 8.1 -1.1 -18.3 1.2
Imports (goods and services) 73.1 40.7 6.5 11.8 7.8 6.5 -1.3 -15.7 1.9
GNI at previous year prices (GDP deflator) 179.6 100.0 3.2 2.6 5.4 3.1 0.3 -3.7 0.2
Contribution to GDP growth : Domestic demand 1.6 2.9 3.2 3.6 1.5 -1.9 0.4
Stockbuilding 0.2 1.2 -0.2 0.5 -1.2 0.0 0.0
Foreign balance 1.1 -1.1 2.0 1.0 0.0 -1.7 -0.2Employment 0.1 1.3 1.8 2.2 1.5 -2.9 -0.8
Unemployment rate (a) 11.9 8.4 7.7 6.9 6.4 8.9 9.3
Compensation of employees/head 2.9 3.8 2.9 3.4 5.6 3.8 3.6
Unit labour costs whole economy 0.2 2.3 -0.2 1.5 6.2 5.7 2.5
Real unit labour costs -1.5 1.9 -1.6 -1.7 3.4 3.9 0.9
Savings rate of households (b) - - 6.1 6.4 6.9 9.5 10.1
GDP deflator 1.7 0.5 1.3 3.2 2.7 1.7 1.5
Harmonised index of consumer prices 1.7 0.8 1.3 1.6 3.9 1.3 1.1
Terms of trade of goods -0.3 -4.3 -3.8 -1.6 -2.8 0.8 -1.1
Trade balance (c) 8.6 4.9 5.5 4.9 3.5 2.1 1.6
Current account balance (c) 4.6 3.9 4.9 4.0 2.2 1.4 1.0
Net lending(+) or borrowing(-) vis-à-vis ROW (c) 5.1 5.0 6.0 4.9 2.4 1.5 1.1
General government balance (c) -0.5 2.8 4.0 5.2 4.2 -0.8 -2.9
Cyclically-adjusted budget balance (c) 0.0 2.9 2.8 3.2 2.8 0.8 -0.9
Structural budget balance (c) - 2.9 2.8 3.2 2.8 0.8 -0.7
General government gross debt (c) 48.5 41.4 39.2 35.1 33.4 39.7 45.7
(a) Eurostat definition. (b) gross saving divided by gross disposable income. (c) as a percentage of GDP.Note : Contributions to GDP growth may not add up due to statistical discrepancies.
105
to be well paced to rebound in 2010 once the
external environment stabilises and boosts
domestic confidence. Housing investment is
nevertheless predicted to recover with a significant
lag after the first signs of recovery and is set to
contract also in 2010. The government’s fiscal
stimulus measures will maintain civil construction
investment, but can not entirely make up for the
overall decline in construction activity over 2009-
2010.
Inflationary pressures to ease in spite of wage
hikes
The currently applicable wage settlements from
autumn 2007 resulted in relatively high wages for
the subsequent 3-year period. Therefore, incontrast to the economic crisis, wages per worker
are set to grow briskly by about 4% in 2009 and by
slightly less in the following year. Compared with
the other euro area countries, real unit labour costs
should rise relatively rapidly over the forecast
period. Wage hikes are however not seen to lead to
significant domestic inflationary pressures due to
the overall weakness of demand. Inflation is
forecast to decline sharply, from about 4% in 2008
to about 1% in the following two years. A notable
disinflationary effect will be triggered in October
2009 from cuts to VAT rates on food.
Public finance s to wea ken m arkedly
Benefiting from a strong economic upswing over
the previous years, Finland built up a significant
public sector surplus, reaching 4.2% of GDP in
2008. While a large share of this (about 3% of
GDP) reflects the accumulation of pension fund
assets, the central government also recorded a
notable surplus. The local government finances
remained close to balance. This provided the
government margin for a substantial fiscal stimulus
of over 1½ % of GDP in 2009 and about 1% in
2010. Together with the operation of the automatic
stabilisers, the current fiscal surplus is forecast to
turn rapidly into a deficit of nearly 3% of GDP by2010. General government debt is projected to
increase from over 33% of GDP in 2008 to about
46% of GDP by 2010 (assuming that the banking
sector does not resort to state financing schemes).
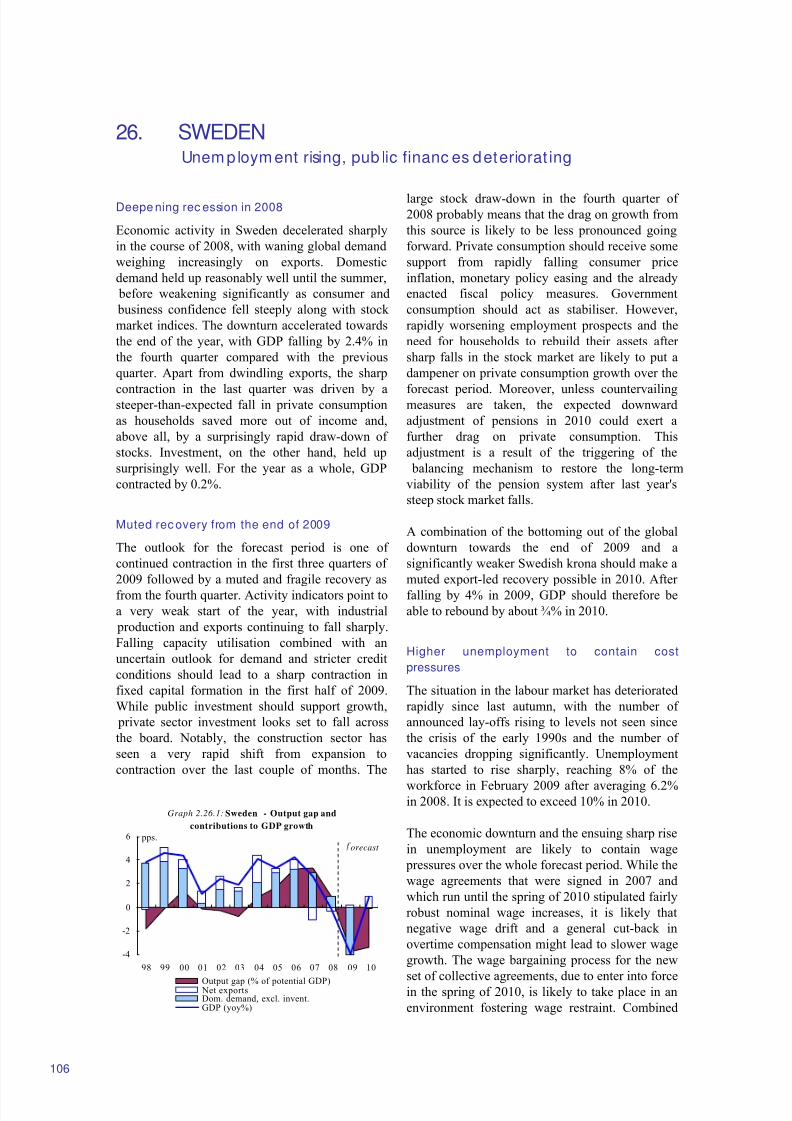
8/14/2019 Economic Forecast 2009
http://slidepdf.com/reader/full/economic-forecast-2009 112/172
26. SWEDENUnem ploym ent rising, pub lic financ es deteriorat ing
Graph 2.26.1: Sweden - Output gap and
contributions to GDP growth
-4
-2
0
2
4
6
98 99 00 01 02 03 04 05 06 07 08 09 10
pps.
Output gap (% of potential GDP) Net exportsDom. demand, excl. invent.GDP (yoy%)
orecast
106
Deepe ning rec ession in 2008
Economic activity in Sweden decelerated sharply
in the course of 2008, with waning global demand
weighing increasingly on exports. Domestic
demand held up reasonably well until the summer,
before weakening significantly as consumer and
business confidence fell steeply along with stock
market indices. The downturn accelerated towards
the end of the year, with GDP falling by 2.4% in
the fourth quarter compared with the previous
quarter. Apart from dwindling exports, the sharp
contraction in the last quarter was driven by asteeper-than-expected fall in private consumption
as households saved more out of income and,
above all, by a surprisingly rapid draw-down of
stocks. Investment, on the other hand, held up
surprisingly well. For the year as a whole, GDP
contracted by 0.2%.
Muted rec overy from the end of 2009
The outlook for the forecast period is one of
continued contraction in the first three quarters of
2009 followed by a muted and fragile recovery as
from the fourth quarter. Activity indicators point to
a very weak start of the year, with industrial
production and exports continuing to fall sharply.
Falling capacity utilisation combined with an
uncertain outlook for demand and stricter credit
conditions should lead to a sharp contraction in
fixed capital formation in the first half of 2009.
While public investment should support growth,
private sector investment looks set to fall across
the board. Notably, the construction sector has
seen a very rapid shift from expansion to
contraction over the last couple of months. The
large stock draw-down in the fourth quarter of 2008 probably means that the drag on growth from
this source is likely to be less pronounced going
forward. Private consumption should receive some
support from rapidly falling consumer price
inflation, monetary policy easing and the already
enacted fiscal policy measures. Government
consumption should act as stabiliser. However,
rapidly worsening employment prospects and the
need for households to rebuild their assets after
sharp falls in the stock market are likely to put a
dampener on private consumption growth over the
forecast period. Moreover, unless countervailingmeasures are taken, the expected downward
adjustment of pensions in 2010 could exert a
further drag on private consumption. This
adjustment is a result of the triggering of the
balancing mechanism to restore the long-term
viability of the pension system after last year's
steep stock market falls.
A combination of the bottoming out of the global
downturn towards the end of 2009 and a
significantly weaker Swedish krona should make a
muted export-led recovery possible in 2010. After
falling by 4% in 2009, GDP should therefore be
able to rebound by about ¾% in 2010.
Higher unemployment to contain cost
pressures
The situation in the labour market has deteriorated
rapidly since last autumn, with the number of
announced lay-offs rising to levels not seen since
the crisis of the early 1990s and the number of
vacancies dropping significantly. Unemployment
has started to rise sharply, reaching 8% of the
workforce in February 2009 after averaging 6.2%in 2008. It is expected to exceed 10% in 2010.
The economic downturn and the ensuing sharp rise
in unemployment are likely to contain wage
pressures over the whole forecast period. While the
wage agreements that were signed in 2007 and
which run until the spring of 2010 stipulated fairly
robust nominal wage increases, it is likely that
negative wage drift and a general cut-back in
overtime compensation might lead to slower wage
growth. The wage bargaining process for the new
set of collective agreements, due to enter into forcein the spring of 2010, is likely to take place in an
environment fostering wage restraint. Combined
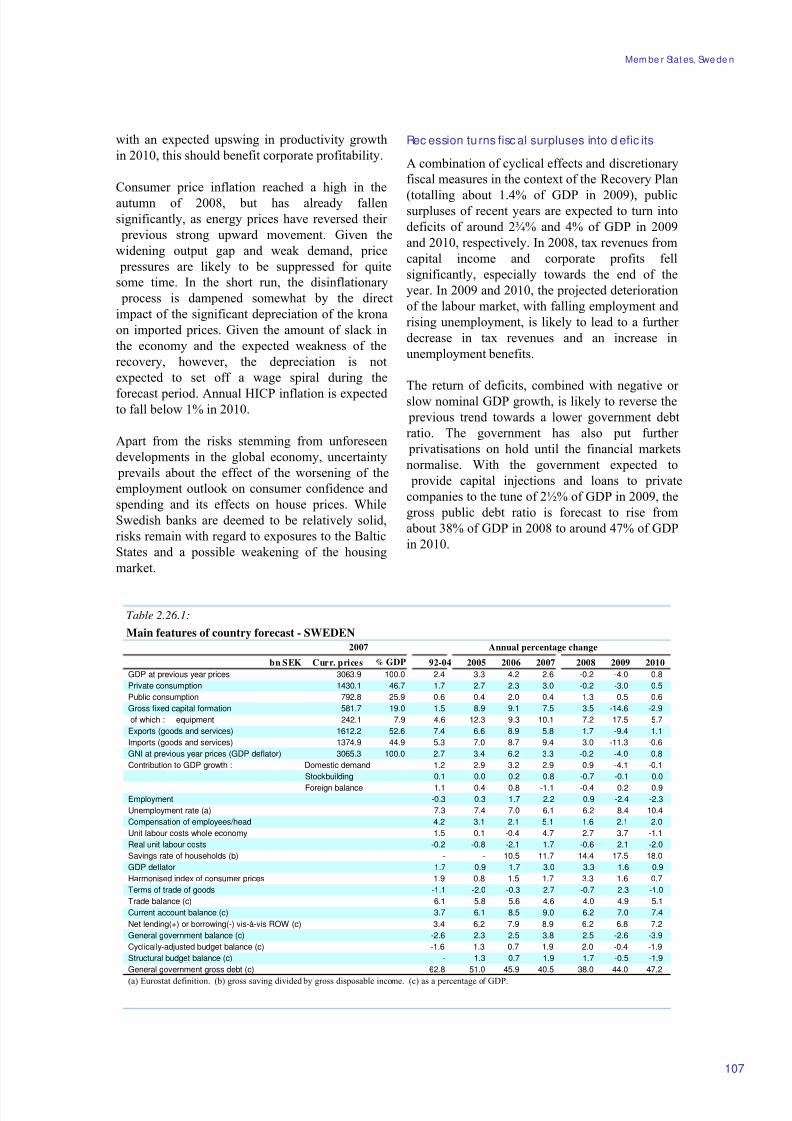
8/14/2019 Economic Forecast 2009
http://slidepdf.com/reader/full/economic-forecast-2009 113/172
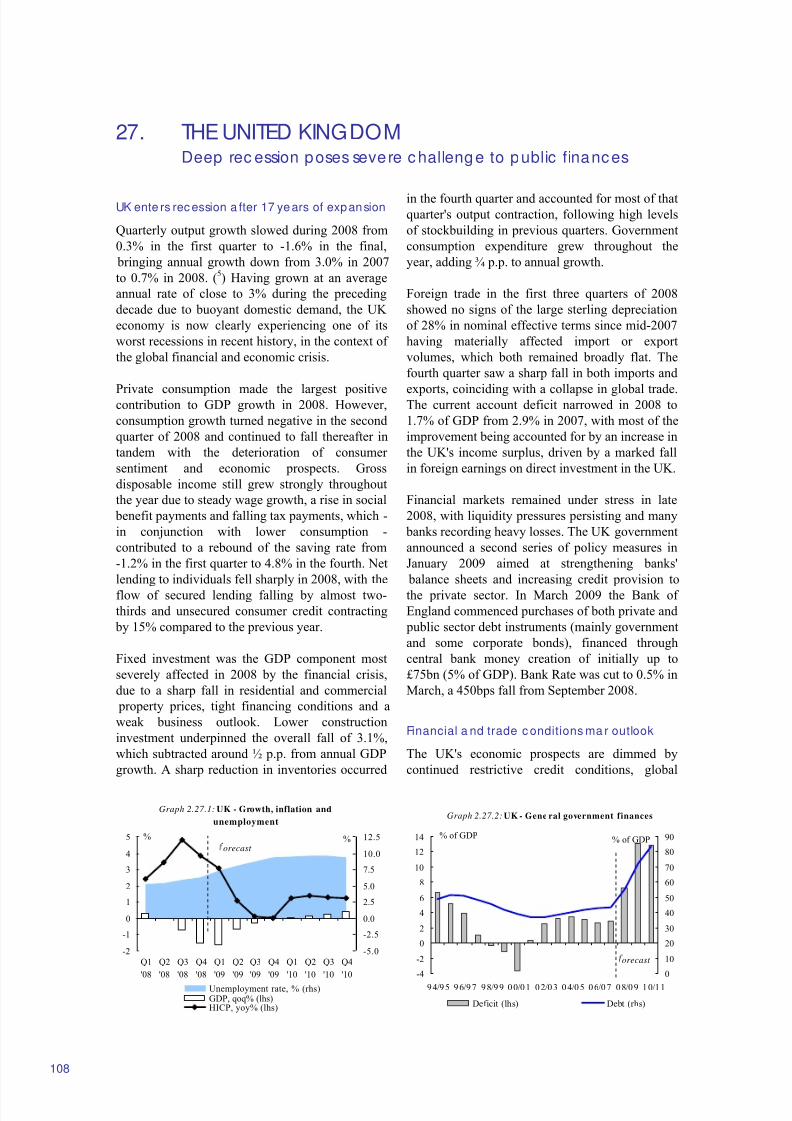
8/14/2019 Economic Forecast 2009
http://slidepdf.com/reader/full/economic-forecast-2009 114/172
27. THE UNITED KINGDOMDeep rec ession poses severe c hallenge to public finances
-4
-2
0
2
4
6
8
10
12
14
94/95 96/97 98/99 00/01 02/03 04/05 06/07 08/09 10/11
0
10
20
30
40
50
60
70
80
90
Deficit (lhs) Debt (rhs)
Graph 2.27.2: UK - Gene ral government finances
% of GDP
orecast
% of GDP
Graph 2.27.1: UK - Growth, inflation and
unemployment
-2
-1
0
1
2
3
4
5
Q1
'08
Q2
'08
Q3
'08
Q4
'08
Q1
'09
Q2
'09
Q3
'09
Q4
'09
Q1
'10
Q2
'10
Q3
'10
Q4
'10
%
-5.0
-2.5
0.0
2.5
5.0
7.5
10.0
12.5%
Unemployment rate, % (rhs)GDP, qoq% (lhs)HICP, yoy% (lhs)
orecast
108
UK ente rs rec ession a fter 17 years of expansion
Quarterly output growth slowed during 2008 from
0.3% in the first quarter to -1.6% in the final,
bringing annual growth down from 3.0% in 2007
to 0.7% in 2008. (5) Having grown at an average
annual rate of close to 3% during the preceding
decade due to buoyant domestic demand, the UK
economy is now clearly experiencing one of its
worst recessions in recent history, in the context of
the global financial and economic crisis.
Private consumption made the largest positivecontribution to GDP growth in 2008. However,
consumption growth turned negative in the second
quarter of 2008 and continued to fall thereafter in
tandem with the deterioration of consumer
sentiment and economic prospects. Gross
disposable income still grew strongly throughout
the year due to steady wage growth, a rise in social
benefit payments and falling tax payments, which -
in conjunction with lower consumption -
contributed to a rebound of the saving rate from
-1.2% in the first quarter to 4.8% in the fourth. Net
lending to individuals fell sharply in 2008, with the
flow of secured lending falling by almost two-
thirds and unsecured consumer credit contracting
by 15% compared to the previous year.
Fixed investment was the GDP component most
severely affected in 2008 by the financial crisis,
due to a sharp fall in residential and commercial
property prices, tight financing conditions and a
weak business outlook. Lower construction
investment underpinned the overall fall of 3.1%,
which subtracted around ½ p.p. from annual GDP
growth. A sharp reduction in inventories occurred
in the fourth quarter and accounted for most of thatquarter's output contraction, following high levels
of stockbuilding in previous quarters. Government
consumption expenditure grew throughout the
year, adding ¾ p.p. to annual growth.
Foreign trade in the first three quarters of 2008
showed no signs of the large sterling depreciation
of 28% in nominal effective terms since mid-2007
having materially affected import or export
volumes, which both remained broadly flat. The
fourth quarter saw a sharp fall in both imports and
exports, coinciding with a collapse in global trade.The current account deficit narrowed in 2008 to
1.7% of GDP from 2.9% in 2007, with most of the
improvement being accounted for by an increase in
the UK's income surplus, driven by a marked fall
in foreign earnings on direct investment in the UK.
Financial markets remained under stress in late
2008, with liquidity pressures persisting and many
banks recording heavy losses. The UK government
announced a second series of policy measures in
January 2009 aimed at strengthening banks'
balance sheets and increasing credit provision to
the private sector. In March 2009 the Bank of
England commenced purchases of both private and
public sector debt instruments (mainly government
and some corporate bonds), financed through
central bank money creation of initially up to
£75bn (5% of GDP). Bank Rate was cut to 0.5% in
March, a 450bps fall from September 2008.
Financial a nd trade c onditions ma r outlook
The UK's economic prospects are dimmed by
continued restrictive credit conditions, global
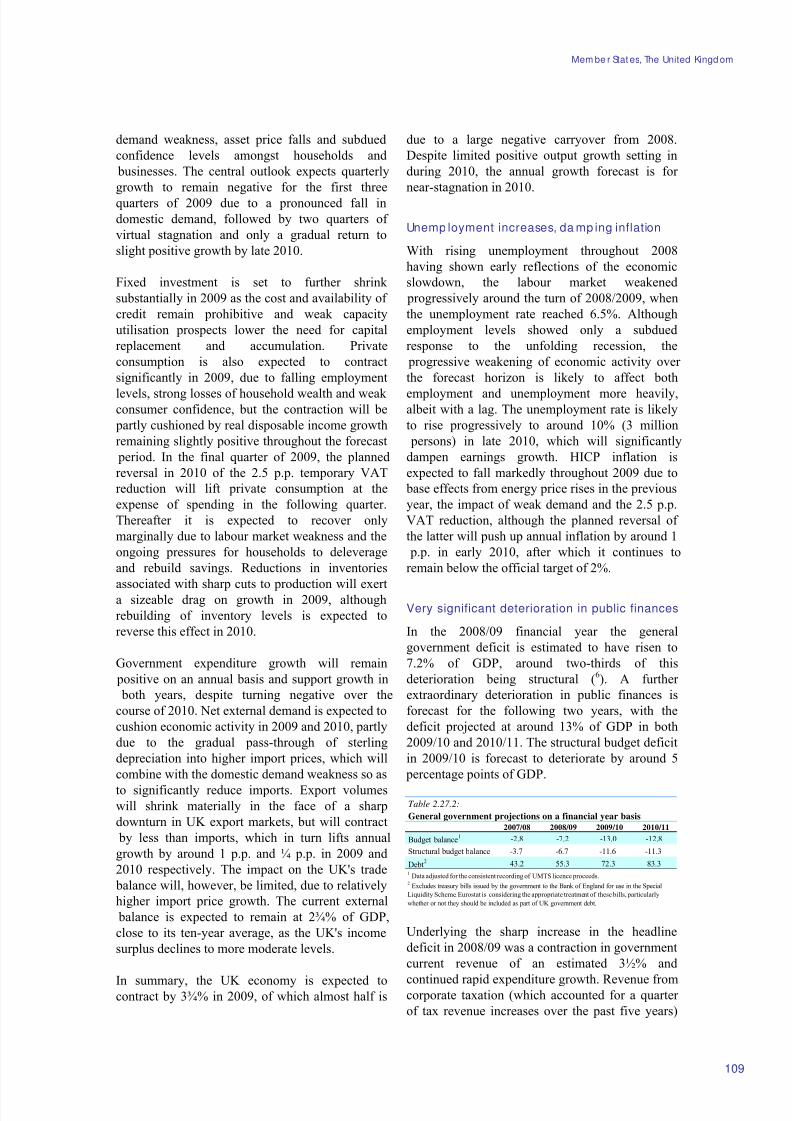
8/14/2019 Economic Forecast 2009
http://slidepdf.com/reader/full/economic-forecast-2009 115/172
Mem be r Stat es, The United Kingd om
109
demand weakness, asset price falls and subdued
confidence levels amongst households and
businesses. The central outlook expects quarterly
growth to remain negative for the first three
quarters of 2009 due to a pronounced fall in
domestic demand, followed by two quarters of
virtual stagnation and only a gradual return to
slight positive growth by late 2010.
Fixed investment is set to further shrink
substantially in 2009 as the cost and availability of
credit remain prohibitive and weak capacity
utilisation prospects lower the need for capital
replacement and accumulation. Private
consumption is also expected to contract
significantly in 2009, due to falling employment
levels, strong losses of household wealth and weak consumer confidence, but the contraction will be
partly cushioned by real disposable income growth
remaining slightly positive throughout the forecast
period. In the final quarter of 2009, the planned
reversal in 2010 of the 2.5 p.p. temporary VAT
reduction will lift private consumption at the
expense of spending in the following quarter.
Thereafter it is expected to recover only
marginally due to labour market weakness and the
ongoing pressures for households to deleverage
and rebuild savings. Reductions in inventories
associated with sharp cuts to production will exerta sizeable drag on growth in 2009, although
rebuilding of inventory levels is expected to
reverse this effect in 2010.
Government expenditure growth will remain
positive on an annual basis and support growth in
both years, despite turning negative over the
course of 2010. Net external demand is expected to
cushion economic activity in 2009 and 2010, partly
due to the gradual pass-through of sterling
depreciation into higher import prices, which will
combine with the domestic demand weakness so as
to significantly reduce imports. Export volumeswill shrink materially in the face of a sharp
downturn in UK export markets, but will contract
by less than imports, which in turn lifts annual
growth by around 1 p.p. and ¼ p.p. in 2009 and
2010 respectively. The impact on the UK's trade
balance will, however, be limited, due to relatively
higher import price growth. The current external
balance is expected to remain at 2¾% of GDP,
close to its ten-year average, as the UK's income
surplus declines to more moderate levels.
In summary, the UK economy is expected tocontract by 3¾% in 2009, of which almost half is
due to a large negative carryover from 2008.
Despite limited positive output growth setting in
during 2010, the annual growth forecast is for
near-stagnation in 2010.
Unemp loyment increases, da mp ing inflation
With rising unemployment throughout 2008
having shown early reflections of the economic
slowdown, the labour market weakened
progressively around the turn of 2008/2009, when
the unemployment rate reached 6.5%. Although
employment levels showed only a subdued
response to the unfolding recession, the
progressive weakening of economic activity over
the forecast horizon is likely to affect both
employment and unemployment more heavily,albeit with a lag. The unemployment rate is likely
to rise progressively to around 10% (3 million
persons) in late 2010, which will significantly
dampen earnings growth. HICP inflation is
expected to fall markedly throughout 2009 due to
base effects from energy price rises in the previous
year, the impact of weak demand and the 2.5 p.p.
VAT reduction, although the planned reversal of
the latter will push up annual inflation by around 1
p.p. in early 2010, after which it continues to
remain below the official target of 2%.
Very significant deterioration in public finances
In the 2008/09 financial year the general
government deficit is estimated to have risen to
7.2% of GDP, around two-thirds of this
deterioration being structural (6). A further
extraordinary deterioration in public finances is
forecast for the following two years, with the
deficit projected at around 13% of GDP in both
2009/10 and 2010/11. The structural budget deficit
in 2009/10 is forecast to deteriorate by around 5
percentage points of GDP.
Table 2.27.2:
General government projections on a financial year basis2007/08 2008/09 2009/10 2010/11
Budget balance1 -2.8 -7.2 -13.0 -12.8
Structural budget balance -3.7 -6.7 -11.6 -11.3
Debt2 43.2 55.3 72.3 83.3
1Data adjusted for the consistent recording of UMTS licence proceeds.
2Excludes treasury bills issued by the government to the Bank of England for use in the Special
Liquidity Scheme. Eurostat is considering the appropriate treatment of these bills, particularly
whether or not they should be included as part of UK government debt.
Underlying the sharp increase in the headline
deficit in 2008/09 was a contraction in government
current revenue of an estimated 3½% and
continued rapid expenditure growth. Revenue fromcorporate taxation (which accounted for a quarter
of tax revenue increases over the past five years)
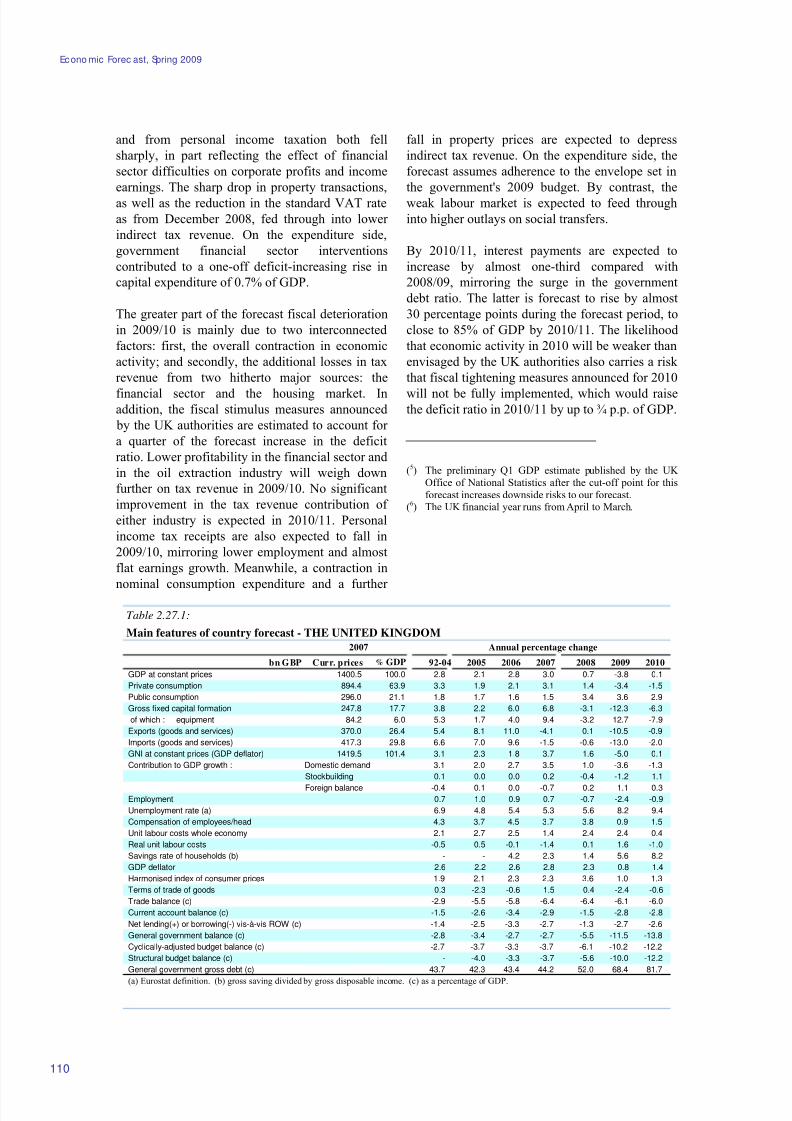
8/14/2019 Economic Forecast 2009
http://slidepdf.com/reader/full/economic-forecast-2009 116/172
Econo mic Forec ast, Spring 2009
Table 2.27.1:
Main features of country forecast - THE UNITED KINGDOM
2007 Annual percentage change
bn GBP Curr. prices % GDP 92-04 2005 2006 2007 2008 2009 2010
GDP at constant prices 1400.5 100.0 2.8 2.1 2.8 3.0 0.7 -3.8 0.1
Private consumption 894.4 63.9 3.3 1.9 2.1 3.1 1.4 -3.4 -1.5
Public consumption 296.0 21.1 1.8 1.7 1.6 1.5 3.4 3.6 2.9
Gross fixed capital formation 247.8 17.7 3.8 2.2 6.0 6.8 -3.1 -12.3 -6.3
of which : equipment 84.2 6.0 5.3 1.7 4.0 9.4 -3.2 -12.7 -7.9
Exports (goods and services) 370.0 26.4 5.4 8.1 11.0 -4.1 0.1 -10.5 -0.9
Imports (goods and services) 417.3 29.8 6.6 7.0 9.6 -1.5 -0.6 -13.0 -2.0
GNI at constant prices (GDP deflator) 1419.5 101.4 3.1 2.3 1.8 3.7 1.6 -5.0 0.1
Contribution to GDP growth : Domestic demand 3.1 2.0 2.7 3.5 1.0 -3.6 -1.3
Stockbuilding 0.1 0.0 0.0 0.2 -0.4 -1.2 1.1
Foreign balance -0.4 0.1 0.0 -0.7 0.2 1.1 0.3Employment 0.7 1.0 0.9 0.7 -0.7 -2.4 -0.9
Unemployment rate (a) 6.9 4.8 5.4 5.3 5.6 8.2 9.4
Compensation of employees/head 4.3 3.7 4.5 3.7 3.8 0.9 1.5
Unit labour costs whole economy 2.1 2.7 2.5 1.4 2.4 2.4 0.4
Real unit labour costs -0.5 0.5 -0.1 -1.4 0.1 1.6 -1.0
Savings rate of households (b) - - 4.2 2.3 1.4 5.6 8.2
GDP deflator 2.6 2.2 2.6 2.8 2.3 0.8 1.4
Harmonised index of consumer prices 1.9 2.1 2.3 2.3 3.6 1.0 1.3
Terms of trade of goods 0.3 -2.3 -0.6 1.5 0.4 -2.4 -0.6
Trade balance (c) -2.9 -5.5 -5.8 -6.4 -6.4 -6.1 -6.0
Current account balance (c) -1.5 -2.6 -3.4 -2.9 -1.5 -2.8 -2.8
Net lending(+) or borrowing(-) vis-à-vis ROW (c) -1.4 -2.5 -3.3 -2.7 -1.3 -2.7 -2.6
General government balance (c) -2.8 -3.4 -2.7 -2.7 -5.5 -11.5 -13.8
Cyclically-adjusted budget balance (c) -2.7 -3.7 -3.3 -3.7 -6.1 -10.2 -12.2
Structural budget balance (c) - -4.0 -3.3 -3.7 -5.6 -10.0 -12.2
General government gross debt (c) 43.7 42.3 43.4 44.2 52.0 68.4 81.7
(a) Eurostat definition. (b) gross saving divided by gross disposable income. (c) as a percentage of GDP.
110
and from personal income taxation both fell
sharply, in part reflecting the effect of financial
sector difficulties on corporate profits and income
earnings. The sharp drop in property transactions,
as well as the reduction in the standard VAT rate
as from December 2008, fed through into lower
indirect tax revenue. On the expenditure side,
government financial sector interventions
contributed to a one-off deficit-increasing rise in
capital expenditure of 0.7% of GDP.
The greater part of the forecast fiscal deterioration
in 2009/10 is mainly due to two interconnected
factors: first, the overall contraction in economic
activity; and secondly, the additional losses in tax
revenue from two hitherto major sources: the
financial sector and the housing market. Inaddition, the fiscal stimulus measures announced
by the UK authorities are estimated to account for
a quarter of the forecast increase in the deficit
ratio. Lower profitability in the financial sector and
in the oil extraction industry will weigh down
further on tax revenue in 2009/10. No significant
improvement in the tax revenue contribution of
either industry is expected in 2010/11. Personal
income tax receipts are also expected to fall in
2009/10, mirroring lower employment and almost
flat earnings growth. Meanwhile, a contraction in
nominal consumption expenditure and a further
fall in property prices are expected to depress
indirect tax revenue. On the expenditure side, the
forecast assumes adherence to the envelope set in
the government's 2009 budget. By contrast, the
weak labour market is expected to feed through
into higher outlays on social transfers.
By 2010/11, interest payments are expected to
increase by almost one-third compared with
2008/09, mirroring the surge in the government
debt ratio. The latter is forecast to rise by almost
30 percentage points during the forecast period, to
close to 85% of GDP by 2010/11. The likelihood
that economic activity in 2010 will be weaker than
envisaged by the UK authorities also carries a risk
that fiscal tightening measures announced for 2010
will not be fully implemented, which would raisethe deficit ratio in 2010/11 by up to ¾ p.p. of GDP.
(5) The preliminary Q1 GDP estimate published by the UK Office of National Statistics after the cut-off point for thisforecast increases downside risks to our forecast.
(6) The UK financial year runs from April to March.

8/14/2019 Economic Forecast 2009
http://slidepdf.com/reader/full/economic-forecast-2009 117/172
Chapter 3Ca ndida te Countries
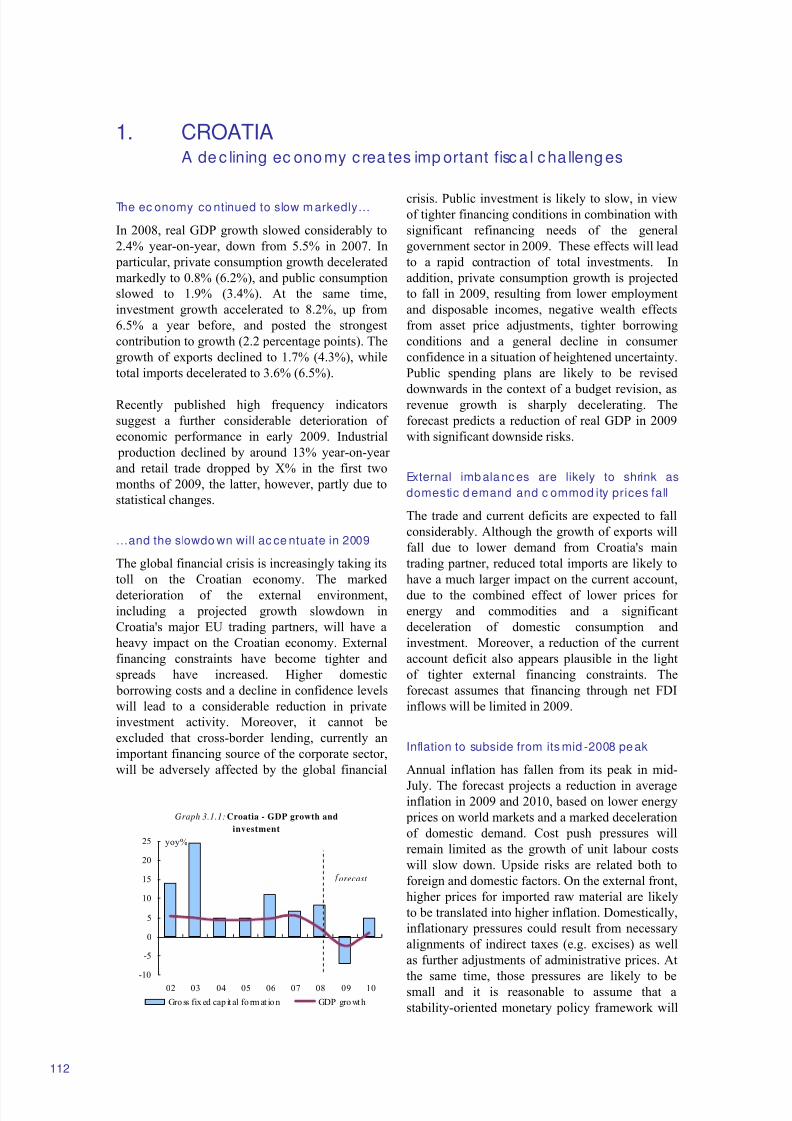
8/14/2019 Economic Forecast 2009
http://slidepdf.com/reader/full/economic-forecast-2009 118/172
1. CROATIAA de c lining ec onomy c rea tes imp ortant fisc a l c ha lleng es
Graph 3.1.1: Croatia - GDP growth and
investment
-10
-5
0
5
10
15
20
25
02 03 04 05 06 07 08 09 10
yoy%
Gro ss fix ed cap it al fo rm at io n GDP gro wt h
orecast
112
The ec onomy co ntinued to slow m arkedly…
In 2008, real GDP growth slowed considerably to
2.4% year-on-year, down from 5.5% in 2007. In
particular, private consumption growth decelerated
markedly to 0.8% (6.2%), and public consumption
slowed to 1.9% (3.4%). At the same time,
investment growth accelerated to 8.2%, up from
6.5% a year before, and posted the strongest
contribution to growth (2.2 percentage points). The
growth of exports declined to 1.7% (4.3%), while
total imports decelerated to 3.6% (6.5%).
Recently published high frequency indicators
suggest a further considerable deterioration of
economic performance in early 2009. Industrial
production declined by around 13% year-on-year
and retail trade dropped by X% in the first two
months of 2009, the latter, however, partly due to
statistical changes.
…and the slowdo wn will ac ce ntuate in 2009
The global financial crisis is increasingly taking its
toll on the Croatian economy. The marked
deterioration of the external environment,
including a projected growth slowdown in
Croatia's major EU trading partners, will have a
heavy impact on the Croatian economy. External
financing constraints have become tighter and
spreads have increased. Higher domestic
borrowing costs and a decline in confidence levels
will lead to a considerable reduction in private
investment activity. Moreover, it cannot be
excluded that cross-border lending, currently an
important financing source of the corporate sector,
will be adversely affected by the global financial
crisis. Public investment is likely to slow, in viewof tighter financing conditions in combination with
significant refinancing needs of the general
government sector in 2009. These effects will lead
to a rapid contraction of total investments. In
addition, private consumption growth is projected
to fall in 2009, resulting from lower employment
and disposable incomes, negative wealth effects
from asset price adjustments, tighter borrowing
conditions and a general decline in consumer
confidence in a situation of heightened uncertainty.
Public spending plans are likely to be revised
downwards in the context of a budget revision, asrevenue growth is sharply decelerating. The
forecast predicts a reduction of real GDP in 2009
with significant downside risks.
External imb alanc es are likely to shrink as
domestic d emand and c ommod ity prices fall
The trade and current deficits are expected to fall
considerably. Although the growth of exports will
fall due to lower demand from Croatia's main
trading partner, reduced total imports are likely to
have a much larger impact on the current account,
due to the combined effect of lower prices for
energy and commodities and a significant
deceleration of domestic consumption and
investment. Moreover, a reduction of the current
account deficit also appears plausible in the light
of tighter external financing constraints. The
forecast assumes that financing through net FDI
inflows will be limited in 2009.
Inflation to subside from its mid -2008 peak
Annual inflation has fallen from its peak in mid-
July. The forecast projects a reduction in averageinflation in 2009 and 2010, based on lower energy
prices on world markets and a marked deceleration
of domestic demand. Cost push pressures will
remain limited as the growth of unit labour costs
will slow down. Upside risks are related both to
foreign and domestic factors. On the external front,
higher prices for imported raw material are likely
to be translated into higher inflation. Domestically,
inflationary pressures could result from necessary
alignments of indirect taxes (e.g. excises) as well
as further adjustments of administrative prices. At
the same time, those pressures are likely to besmall and it is reasonable to assume that a
stability-oriented monetary policy framework will
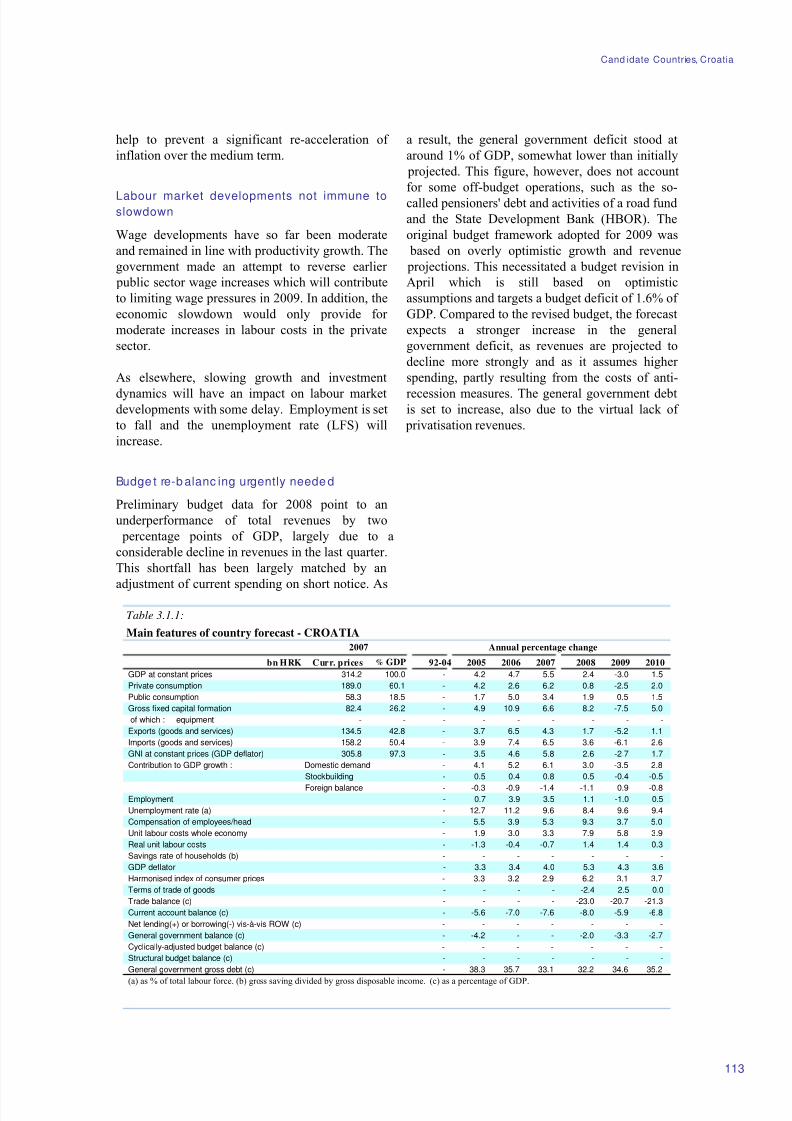
8/14/2019 Economic Forecast 2009
http://slidepdf.com/reader/full/economic-forecast-2009 119/172
Cand idate Countries, Croatia
Table 3.1.1:
Main features of country forecast - CROATIA
2007 Annual percentage change
bn HRK Curr. prices % GDP 92-04 2005 2006 2007 2008 2009 2010
GDP at constant prices 314.2 100.0 - 4.2 4.7 5.5 2.4 -3.0 1.5
Private consumption 189.0 60.1 - 4.2 2.6 6.2 0.8 -2.5 2.0
Public consumption 58.3 18.5 - 1.7 5.0 3.4 1.9 0.5 1.5
Gross fixed capital formation 82.4 26.2 - 4.9 10.9 6.6 8.2 -7.5 5.0
of which : equipment - - - - - - - - -
Exports (goods and services) 134.5 42.8 - 3.7 6.5 4.3 1.7 -5.2 1.1
Imports (goods and services) 158.2 50.4 - 3.9 7.4 6.5 3.6 -6.1 2.6
GNI at constant prices (GDP deflator) 305.8 97.3 - 3.5 4.6 5.8 2.6 -2.7 1.7
Contribution to GDP growth : Domestic demand - 4.1 5.2 6.1 3.0 -3.5 2.8
Stockbuilding - 0.5 0.4 0.8 0.5 -0.4 -0.5
Foreign balance - -0.3 -0.9 -1.4 -1.1 0.9 -0.8Employment - 0.7 3.9 3.5 1.1 -1.0 0.5
Unemployment rate (a) - 12.7 11.2 9.6 8.4 9.6 9.4
Compensation of employees/head - 5.5 3.9 5.3 9.3 3.7 5.0
Unit labour costs whole economy - 1.9 3.0 3.3 7.9 5.8 3.9
Real unit labour costs - -1.3 -0.4 -0.7 1.4 1.4 0.3
Savings rate of households (b) - - - - - - -
GDP deflator - 3.3 3.4 4.0 5.3 4.3 3.6
Harmonised index of consumer prices - 3.3 3.2 2.9 6.2 3.1 3.7
Terms of trade of goods - - - - -2.4 2.5 0.0
Trade balance (c) - - - - -23.0 -20.7 -21.3
Current account balance (c) - -5.6 -7.0 -7.6 -8.0 -5.9 -6.8
Net lending(+) or borrowing(-) vis-à-vis ROW (c) - - - - - - -
General government balance (c) - -4.2 - - -2.0 -3.3 -2.7
Cyclically-adjusted budget balance (c) - - - - - - -
Structural budget balance (c) - - - - - - -
General government gross debt (c) - 38.3 35.7 33.1 32.2 34.6 35.2
(a) as % of total labour force. (b) gross saving divided by gross disposable income. (c) as a percentage of GDP.
113
help to prevent a significant re-acceleration of
inflation over the medium term.
Labour market developments not immune toslowdown
Wage developments have so far been moderate
and remained in line with productivity growth. The
government made an attempt to reverse earlier
public sector wage increases which will contribute
to limiting wage pressures in 2009. In addition, the
economic slowdown would only provide for
moderate increases in labour costs in the private
sector.
As elsewhere, slowing growth and investment
dynamics will have an impact on labour marketdevelopments with some delay. Employment is set
to fall and the unemployment rate (LFS) will
increase.
Budge t re-b alanc ing urgently neede d
Preliminary budget data for 2008 point to an
underperformance of total revenues by two
percentage points of GDP, largely due to a
considerable decline in revenues in the last quarter.
This shortfall has been largely matched by an
adjustment of current spending on short notice. As
a result, the general government deficit stood at
around 1% of GDP, somewhat lower than initially
projected. This figure, however, does not account
for some off-budget operations, such as the so-
called pensioners' debt and activities of a road fund
and the State Development Bank (HBOR). The
original budget framework adopted for 2009 was
based on overly optimistic growth and revenue
projections. This necessitated a budget revision in
April which is still based on optimistic
assumptions and targets a budget deficit of 1.6% of
GDP. Compared to the revised budget, the forecast
expects a stronger increase in the general
government deficit, as revenues are projected to
decline more strongly and as it assumes higher
spending, partly resulting from the costs of anti-
recession measures. The general government debtis set to increase, also due to the virtual lack of
privatisation revenues.
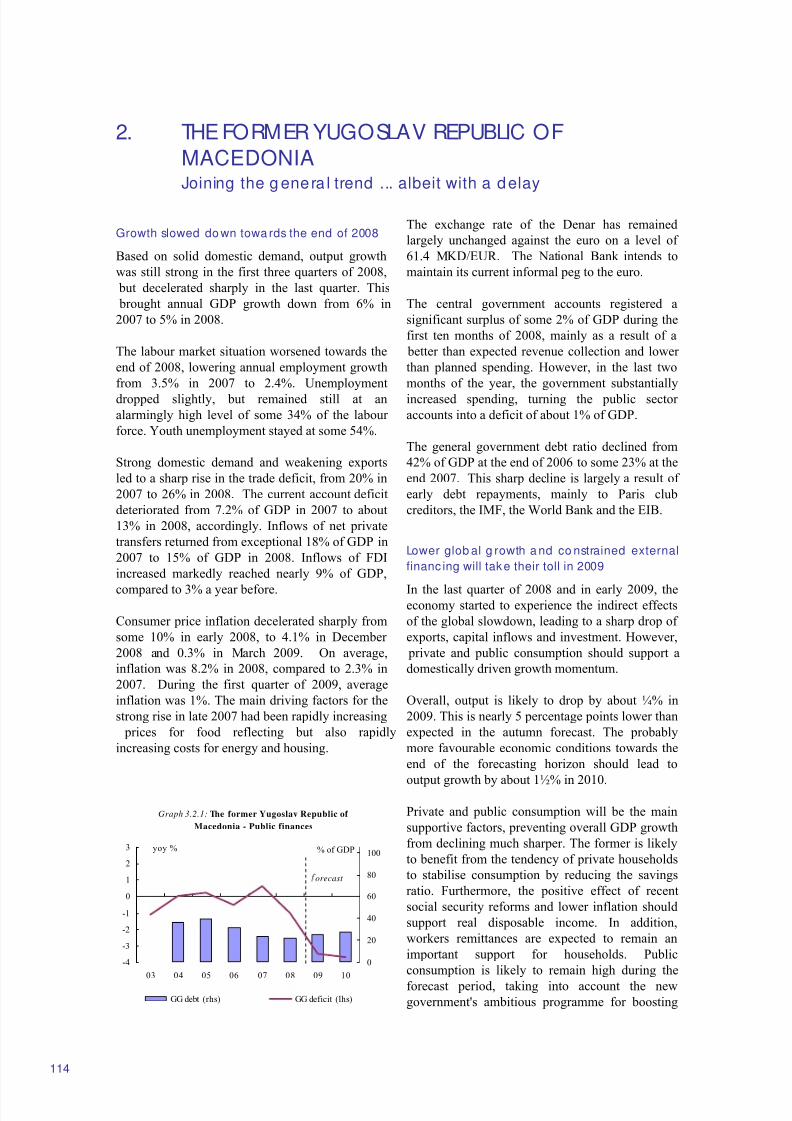
8/14/2019 Economic Forecast 2009
http://slidepdf.com/reader/full/economic-forecast-2009 120/172
2. THE FORMER YUGOSLAV REPUBLIC OF
MACEDONIAJoining the g enera l trend ... albeit with a delay
Graph 3.2.1: The former Yugoslav Republic of
Macedonia - Public finances
-4
-3
-2
-1
0
1
2
3
03 04 05 06 07 08 09 10
yoy %
0
20
40
60
80
100
GG debt (rhs) GG deficit (lhs)
orecast
% of GDP
114
Growth slowed do wn towa rds the end of 2008
Based on solid domestic demand, output growth
was still strong in the first three quarters of 2008,
but decelerated sharply in the last quarter. This
brought annual GDP growth down from 6% in
2007 to 5% in 2008.
The labour market situation worsened towards the
end of 2008, lowering annual employment growth
from 3.5% in 2007 to 2.4%. Unemployment
dropped slightly, but remained still at an
alarmingly high level of some 34% of the labour
force. Youth unemployment stayed at some 54%.
Strong domestic demand and weakening exports
led to a sharp rise in the trade deficit, from 20% in
2007 to 26% in 2008. The current account deficit
deteriorated from 7.2% of GDP in 2007 to about
13% in 2008, accordingly. Inflows of net private
transfers returned from exceptional 18% of GDP in
2007 to 15% of GDP in 2008. Inflows of FDI
increased markedly reached nearly 9% of GDP,
compared to 3% a year before.
Consumer price inflation decelerated sharply from
some 10% in early 2008, to 4.1% in December
2008 and 0.3% in March 2009. On average,
inflation was 8.2% in 2008, compared to 2.3% in
2007. During the first quarter of 2009, average
inflation was 1%. The main driving factors for the
strong rise in late 2007 had been rapidly increasing
prices for food reflecting but also rapidly
increasing costs for energy and housing.
The exchange rate of the Denar has remained
largely unchanged against the euro on a level of
61.4 MKD/EUR. The National Bank intends to
maintain its current informal peg to the euro.
The central government accounts registered a
significant surplus of some 2% of GDP during the
first ten months of 2008, mainly as a result of a
better than expected revenue collection and lower
than planned spending. However, in the last two
months of the year, the government substantially
increased spending, turning the public sector
accounts into a deficit of about 1% of GDP.
The general government debt ratio declined from
42% of GDP at the end of 2006 to some 23% at the
end 2007. This sharp decline is largely a result of
early debt repayments, mainly to Paris club
creditors, the IMF, the World Bank and the EIB.
Lower glob al g rowth a nd co nstrained external
financ ing will take their toll in 2009
In the last quarter of 2008 and in early 2009, theeconomy started to experience the indirect effects
of the global slowdown, leading to a sharp drop of
exports, capital inflows and investment. However,
private and public consumption should support a
domestically driven growth momentum.
Overall, output is likely to drop by about ¼% in
2009. This is nearly 5 percentage points lower than
expected in the autumn forecast. The probably
more favourable economic conditions towards the
end of the forecasting horizon should lead to
output growth by about 1½% in 2010.
Private and public consumption will be the main
supportive factors, preventing overall GDP growth
from declining much sharper. The former is likely
to benefit from the tendency of private households
to stabilise consumption by reducing the savings
ratio. Furthermore, the positive effect of recent
social security reforms and lower inflation should
support real disposable income. In addition,
workers remittances are expected to remain an
important support for households. Public
consumption is likely to remain high during the
forecast period, taking into account the newgovernment's ambitious programme for boosting
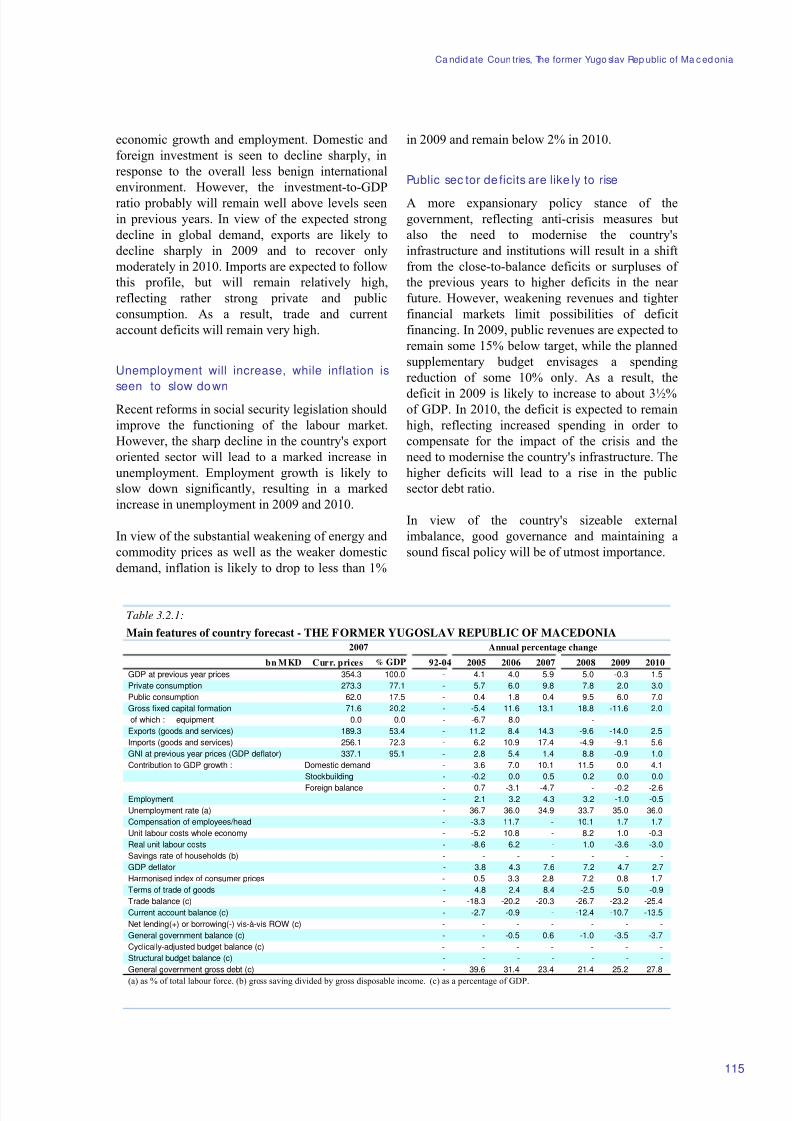
8/14/2019 Economic Forecast 2009
http://slidepdf.com/reader/full/economic-forecast-2009 121/172
Ca ndid ate Coun tries, The former Yugo slav Rep ublic of Ma c ed onia
Table 3.2.1:
Main features of country forecast - THE FORMER YUGOSLAV REPUBLIC OF MACEDONIA
2007 Annual percentage change
bn MKD Curr. prices % GDP 92-04 2005 2006 2007 2008 2009 2010
GDP at previous year prices 354.3 100.0 - 4.1 4.0 5.9 5.0 -0.3 1.5
Private consumption 273.3 77.1 - 5.7 6.0 9.8 7.8 2.0 3.0
Public consumption 62.0 17.5 - 0.4 1.8 0.4 9.5 6.0 7.0
Gross fixed capital formation 71.6 20.2 - -5.4 11.6 13.1 18.8 -11.6 2.0
of which : equipment 0.0 0.0 - -6.7 8.0 - - - -
Exports (goods and services) 189.3 53.4 - 11.2 8.4 14.3 -9.6 -14.0 2.5
Imports (goods and services) 256.1 72.3 - 6.2 10.9 17.4 -4.9 -9.1 5.6
GNI at previous year prices (GDP deflator) 337.1 95.1 - 2.8 5.4 1.4 8.8 -0.9 1.0
Contribution to GDP growth : Domestic demand - 3.6 7.0 10.1 11.5 0.0 4.1
Stockbuilding - -0.2 0.0 0.5 0.2 0.0 0.0
Foreign balance - 0.7 -3.1 -4.7 - -0.2 -2.6Employment - 2.1 3.2 4.3 3.2 -1.0 -0.5
Unemployment rate (a) - 36.7 36.0 34.9 33.7 35.0 36.0
Compensation of employees/head - -3.3 11.7 - 10.1 1.7 1.7
Unit labour costs whole economy - -5.2 10.8 - 8.2 1.0 -0.3
Real unit labour costs - -8.6 6.2 - 1.0 -3.6 -3.0
Savings rate of households (b) - - - - - - -
GDP deflator - 3.8 4.3 7.6 7.2 4.7 2.7
Harmonised index of consumer prices - 0.5 3.3 2.8 7.2 0.8 1.7
Terms of trade of goods - 4.8 2.4 8.4 -2.5 5.0 -0.9
Trade balance (c) - -18.3 -20.2 -20.3 -26.7 -23.2 -25.4
Current account balance (c) - -2.7 -0.9 - -12.4 -10.7 -13.5
Net lending(+) or borrowing(-) vis-à-vis ROW (c) - - - - - - -
General government balance (c) - - -0.5 0.6 -1.0 -3.5 -3.7
Cyclically-adjusted budget balance (c) - - - - - - -
Structural budget balance (c) - - - - - - -
General government gross debt (c) - 39.6 31.4 23.4 21.4 25.2 27.8
(a) as % of total labour force. (b) gross saving divided by gross disposable income. (c) as a percentage of GDP.
115
economic growth and employment. Domestic and
foreign investment is seen to decline sharply, in
response to the overall less benign international
environment. However, the investment-to-GDP
ratio probably will remain well above levels seen
in previous years. In view of the expected strong
decline in global demand, exports are likely to
decline sharply in 2009 and to recover only
moderately in 2010. Imports are expected to follow
this profile, but will remain relatively high,
reflecting rather strong private and public
consumption. As a result, trade and current
account deficits will remain very high.
Unemployment will increase, while inflation is
seen to slow down
Recent reforms in social security legislation should
improve the functioning of the labour market.
However, the sharp decline in the country's export
oriented sector will lead to a marked increase in
unemployment. Employment growth is likely to
slow down significantly, resulting in a marked
increase in unemployment in 2009 and 2010.
In view of the substantial weakening of energy and
commodity prices as well as the weaker domestic
demand, inflation is likely to drop to less than 1%
in 2009 and remain below 2% in 2010.
Public sec tor de ficits are like ly to rise
A more expansionary policy stance of the
government, reflecting anti-crisis measures but
also the need to modernise the country's
infrastructure and institutions will result in a shift
from the close-to-balance deficits or surpluses of
the previous years to higher deficits in the near
future. However, weakening revenues and tighter
financial markets limit possibilities of deficit
financing. In 2009, public revenues are expected to
remain some 15% below target, while the planned
supplementary budget envisages a spending
reduction of some 10% only. As a result, the
deficit in 2009 is likely to increase to about 3½%of GDP. In 2010, the deficit is expected to remain
high, reflecting increased spending in order to
compensate for the impact of the crisis and the
need to modernise the country's infrastructure. The
higher deficits will lead to a rise in the public
sector debt ratio.
In view of the country's sizeable external
imbalance, good governance and maintaining a
sound fiscal policy will be of utmost importance.
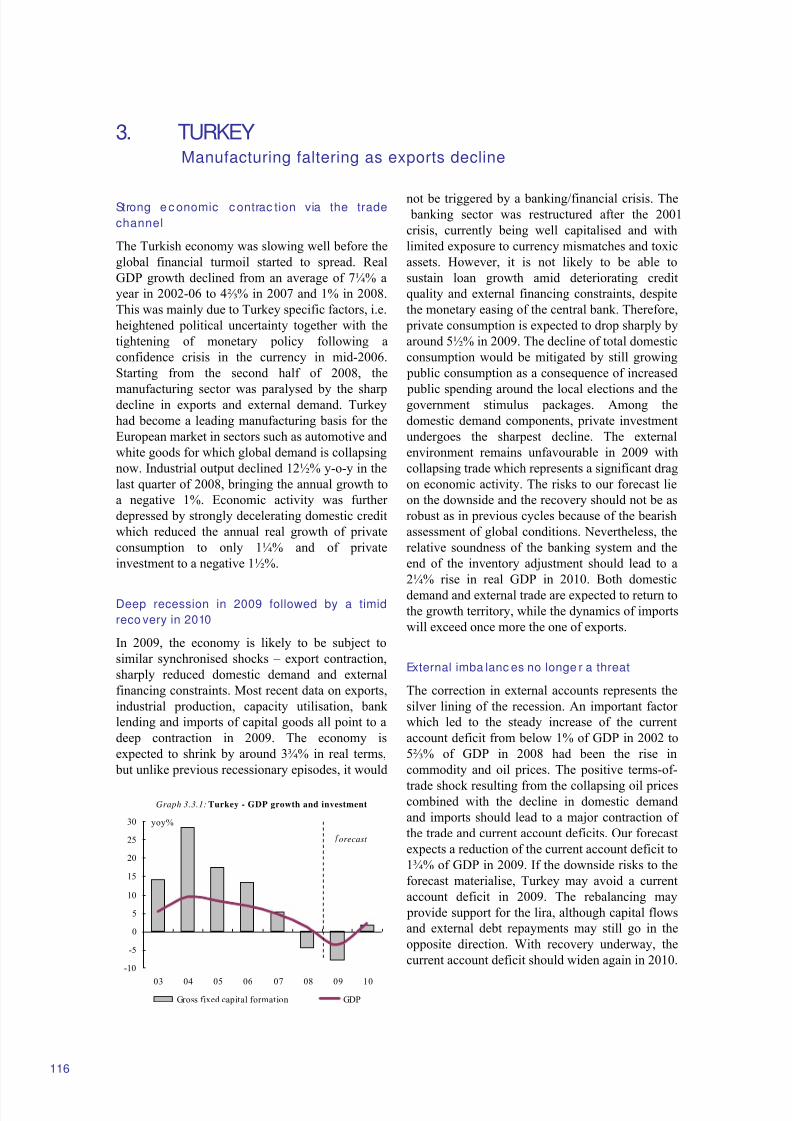
8/14/2019 Economic Forecast 2009
http://slidepdf.com/reader/full/economic-forecast-2009 122/172
3. TURKEYManufacturing faltering as exports decline
-10
-5
0
5
10
15
20
25
30
03 04 05 06 07 08 09 10
yoy%
Gross fixed capital formation GDP
orecast
Graph 3.3.1: Turkey - GDP growth and investment
116
Strong e c onomic c ontrac tion via the trade
channel
The Turkish economy was slowing well before the
global financial turmoil started to spread. Real
GDP growth declined from an average of 7¼% a
year in 2002-06 to 4⅔% in 2007 and 1% in 2008.
This was mainly due to Turkey specific factors, i.e.
heightened political uncertainty together with the
tightening of monetary policy following a
confidence crisis in the currency in mid-2006.
Starting from the second half of 2008, the
manufacturing sector was paralysed by the sharpdecline in exports and external demand. Turkey
had become a leading manufacturing basis for the
European market in sectors such as automotive and
white goods for which global demand is collapsing
now. Industrial output declined 12½% y-o-y in the
last quarter of 2008, bringing the annual growth to
a negative 1%. Economic activity was further
depressed by strongly decelerating domestic credit
which reduced the annual real growth of private
consumption to only 1¼% and of private
investment to a negative 1½%.
Deep recession in 2009 followed by a timid
reco very in 2010
In 2009, the economy is likely to be subject to
similar synchronised shocks – export contraction,
sharply reduced domestic demand and external
financing constraints. Most recent data on exports,
industrial production, capacity utilisation, bank
lending and imports of capital goods all point to a
deep contraction in 2009. The economy is
expected to shrink by around 3¾% in real terms,
but unlike previous recessionary episodes, it would
not be triggered by a banking/financial crisis. The banking sector was restructured after the 2001
crisis, currently being well capitalised and with
limited exposure to currency mismatches and toxic
assets. However, it is not likely to be able to
sustain loan growth amid deteriorating credit
quality and external financing constraints, despite
the monetary easing of the central bank. Therefore,
private consumption is expected to drop sharply by
around 5½% in 2009. The decline of total domestic
consumption would be mitigated by still growing
public consumption as a consequence of increased
public spending around the local elections and thegovernment stimulus packages. Among the
domestic demand components, private investment
undergoes the sharpest decline. The external
environment remains unfavourable in 2009 with
collapsing trade which represents a significant drag
on economic activity. The risks to our forecast lie
on the downside and the recovery should not be as
robust as in previous cycles because of the bearish
assessment of global conditions. Nevertheless, the
relative soundness of the banking system and the
end of the inventory adjustment should lead to a
2¼% rise in real GDP in 2010. Both domestic
demand and external trade are expected to return to
the growth territory, while the dynamics of imports
will exceed once more the one of exports.
External imba lanc es no longe r a threat
The correction in external accounts represents the
silver lining of the recession. An important factor
which led to the steady increase of the current
account deficit from below 1% of GDP in 2002 to
5⅔% of GDP in 2008 had been the rise in
commodity and oil prices. The positive terms-of-
trade shock resulting from the collapsing oil pricescombined with the decline in domestic demand
and imports should lead to a major contraction of
the trade and current account deficits. Our forecast
expects a reduction of the current account deficit to
1¾% of GDP in 2009. If the downside risks to the
forecast materialise, Turkey may avoid a current
account deficit in 2009. The rebalancing may
provide support for the lira, although capital flows
and external debt repayments may still go in the
opposite direction. With recovery underway, the
current account deficit should widen again in 2010.
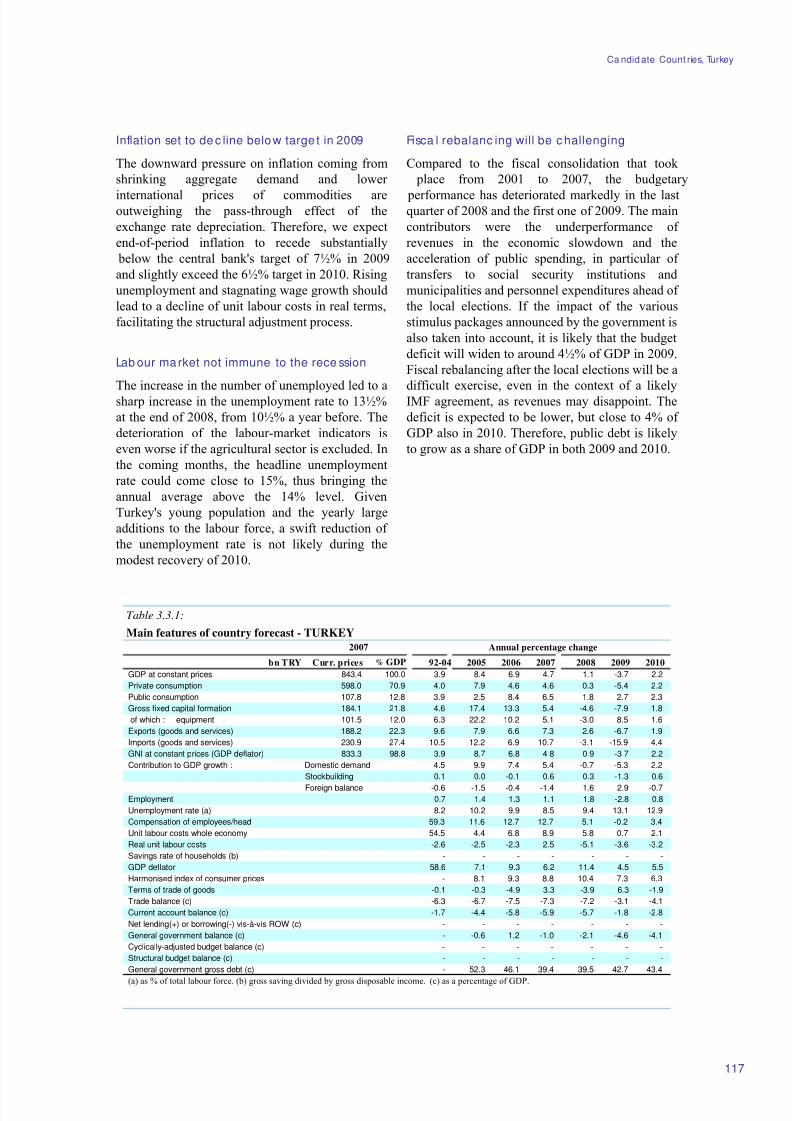
8/14/2019 Economic Forecast 2009
http://slidepdf.com/reader/full/economic-forecast-2009 123/172
Ca ndid ate Count ries, Turkey
Table 3.3.1:
Main features of country forecast - TURKEY
2007 Annual percentage change
bn TRY Curr. prices % GDP 92-04 2005 2006 2007 2008 2009 2010
GDP at constant prices 843.4 100.0 3.9 8.4 6.9 4.7 1.1 -3.7 2.2
Private consumption 598.0 70.9 4.0 7.9 4.6 4.6 0.3 -5.4 2.2
Public consumption 107.8 12.8 3.9 2.5 8.4 6.5 1.8 2.7 2.3
Gross fixed capital formation 184.1 21.8 4.6 17.4 13.3 5.4 -4.6 -7.9 1.8
of which : equipment 101.5 12.0 6.3 22.2 10.2 5.1 -3.0 -8.5 1.6
Exports (goods and services) 188.2 22.3 9.6 7.9 6.6 7.3 2.6 -6.7 1.9
Imports (goods and services) 230.9 27.4 10.5 12.2 6.9 10.7 -3.1 -15.9 4.4
GNI at constant prices (GDP deflator) 833.3 98.8 3.9 8.7 6.8 4.8 0.9 -3.7 2.2
Contribution to GDP growth : Domestic demand 4.5 9.9 7.4 5.4 -0.7 -5.3 2.2
Stockbuilding 0.1 0.0 -0.1 0.6 0.3 -1.3 0.6
Foreign balance -0.6 -1.5 -0.4 -1.4 1.6 2.9 -0.7Employment 0.7 1.4 1.3 1.1 1.8 -2.8 0.8
Unemployment rate (a) 8.2 10.2 9.9 8.5 9.4 13.1 12.9
Compensation of employees/head 59.3 11.6 12.7 12.7 5.1 -0.2 3.4
Unit labour costs whole economy 54.5 4.4 6.8 8.9 5.8 0.7 2.1
Real unit labour costs -2.6 -2.5 -2.3 2.5 -5.1 -3.6 -3.2
Savings rate of households (b) - - - - - - -
GDP deflator 58.6 7.1 9.3 6.2 11.4 4.5 5.5
Harmonised index of consumer prices - 8.1 9.3 8.8 10.4 7.3 6.3
Terms of trade of goods -0.1 -0.3 -4.9 3.3 -3.9 6.3 -1.9
Trade balance (c) -6.3 -6.7 -7.5 -7.3 -7.2 -3.1 -4.1
Current account balance (c) -1.7 -4.4 -5.8 -5.9 -5.7 -1.8 -2.8
Net lending(+) or borrowing(-) vis-à-vis ROW (c) - - - - - - -
General government balance (c) - -0.6 1.2 -1.0 -2.1 -4.6 -4.1
Cyclically-adjusted budget balance (c) - - - - - - -
Structural budget balance (c) - - - - - - -
General government gross debt (c) - 52.3 46.1 39.4 39.5 42.7 43.4
(a) as % of total labour force. (b) gross saving divided by gross disposable income. (c) as a percentage of GDP.
117
Inflation set to de c line below targe t in 2009
The downward pressure on inflation coming from
shrinking aggregate demand and lower
international prices of commodities areoutweighing the pass-through effect of the
exchange rate depreciation. Therefore, we expect
end-of-period inflation to recede substantially
below the central bank's target of 7½% in 2009
and slightly exceed the 6½% target in 2010. Rising
unemployment and stagnating wage growth should
lead to a decline of unit labour costs in real terms,
facilitating the structural adjustment process.
Lab our market not immune to the rece ssion
The increase in the number of unemployed led to a
sharp increase in the unemployment rate to 13½%
at the end of 2008, from 10½% a year before. The
deterioration of the labour-market indicators is
even worse if the agricultural sector is excluded. In
the coming months, the headline unemployment
rate could come close to 15%, thus bringing the
annual average above the 14% level. Given
Turkey's young population and the yearly large
additions to the labour force, a swift reduction of
the unemployment rate is not likely during the
modest recovery of 2010.
Fisca l rebalanc ing will be c hallenging
Compared to the fiscal consolidation that took
place from 2001 to 2007, the budgetary
performance has deteriorated markedly in the lastquarter of 2008 and the first one of 2009. The main
contributors were the underperformance of
revenues in the economic slowdown and the
acceleration of public spending, in particular of
transfers to social security institutions and
municipalities and personnel expenditures ahead of
the local elections. If the impact of the various
stimulus packages announced by the government is
also taken into account, it is likely that the budget
deficit will widen to around 4½% of GDP in 2009.
Fiscal rebalancing after the local elections will be a
difficult exercise, even in the context of a likely
IMF agreement, as revenues may disappoint. The
deficit is expected to be lower, but close to 4% of
GDP also in 2010. Therefore, public debt is likely
to grow as a share of GDP in both 2009 and 2010.

8/14/2019 Economic Forecast 2009
http://slidepdf.com/reader/full/economic-forecast-2009 124/172

8/14/2019 Economic Forecast 2009
http://slidepdf.com/reader/full/economic-forecast-2009 125/172
Chapter 4Other non-EU Countries
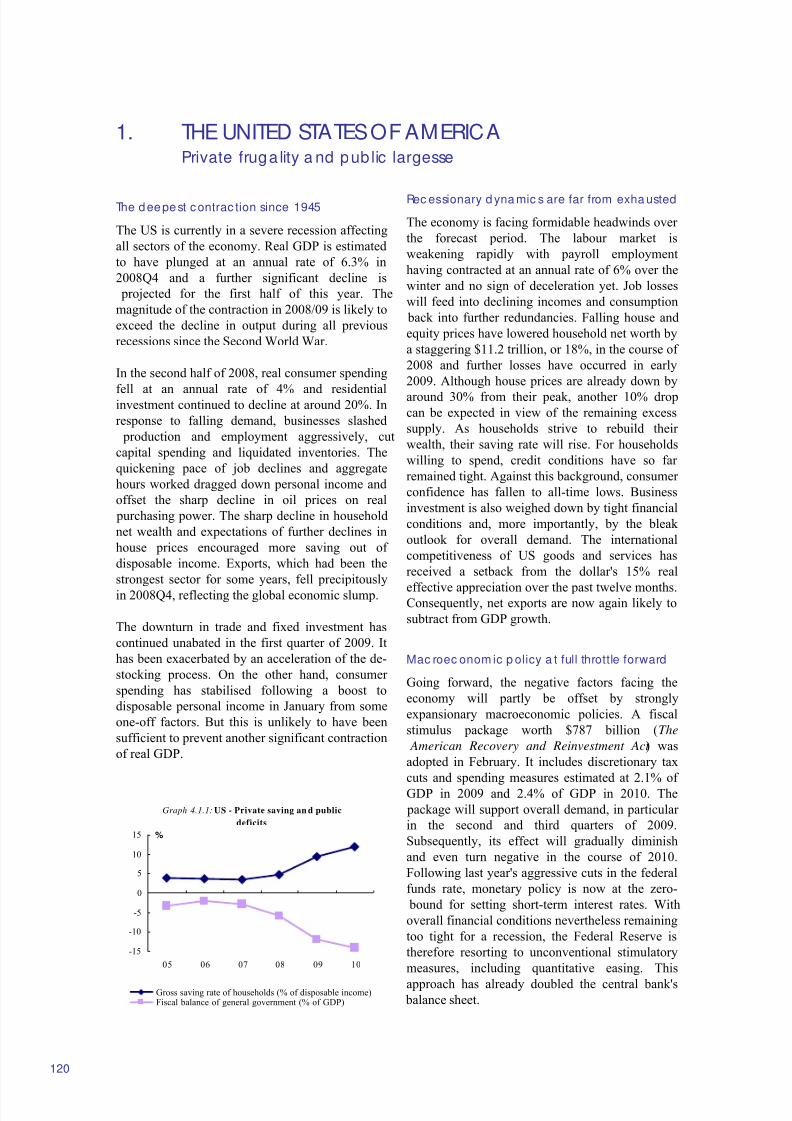
8/14/2019 Economic Forecast 2009
http://slidepdf.com/reader/full/economic-forecast-2009 126/172
1. THE UNITED STATES OF AMERICAPrivate fruga lity a nd pub lic largesse
Graph 4.1.1: US - Private saving an d public
deficits
-15
-10
-5
0
5
10
15
05 06 07 08 09 10
%
Gross saving rate of households (% of disposable income)Fiscal balance of general government (% of GDP)
120
The deepest contrac tion since 1945
The US is currently in a severe recession affecting
all sectors of the economy. Real GDP is estimated
to have plunged at an annual rate of 6.3% in
2008Q4 and a further significant decline is
projected for the first half of this year. The
magnitude of the contraction in 2008/09 is likely to
exceed the decline in output during all previous
recessions since the Second World War.
In the second half of 2008, real consumer spending
fell at an annual rate of 4% and residentialinvestment continued to decline at around 20%. In
response to falling demand, businesses slashed
production and employment aggressively, cut
capital spending and liquidated inventories. The
quickening pace of job declines and aggregate
hours worked dragged down personal income and
offset the sharp decline in oil prices on real
purchasing power. The sharp decline in household
net wealth and expectations of further declines in
house prices encouraged more saving out of
disposable income. Exports, which had been the
strongest sector for some years, fell precipitously
in 2008Q4, reflecting the global economic slump.
The downturn in trade and fixed investment has
continued unabated in the first quarter of 2009. It
has been exacerbated by an acceleration of the de-
stocking process. On the other hand, consumer
spending has stabilised following a boost to
disposable personal income in January from some
one-off factors. But this is unlikely to have been
sufficient to prevent another significant contraction
of real GDP.
Rec essionary d yna mic s are far from exha usted
The economy is facing formidable headwinds over
the forecast period. The labour market is
weakening rapidly with payroll employment
having contracted at an annual rate of 6% over the
winter and no sign of deceleration yet. Job losses
will feed into declining incomes and consumption
back into further redundancies. Falling house and
equity prices have lowered household net worth by
a staggering $11.2 trillion, or 18%, in the course of
2008 and further losses have occurred in early
2009. Although house prices are already down by
around 30% from their peak, another 10% dropcan be expected in view of the remaining excess
supply. As households strive to rebuild their
wealth, their saving rate will rise. For households
willing to spend, credit conditions have so far
remained tight. Against this background, consumer
confidence has fallen to all-time lows. Business
investment is also weighed down by tight financial
conditions and, more importantly, by the bleak
outlook for overall demand. The international
competitiveness of US goods and services has
received a setback from the dollar's 15% real
effective appreciation over the past twelve months.Consequently, net exports are now again likely to
subtract from GDP growth.
Mac roec onom ic p olicy a t full throttle forward
Going forward, the negative factors facing the
economy will partly be offset by strongly
expansionary macroeconomic policies. A fiscal
stimulus package worth $787 billion (The
American Recovery and Reinvestment Act ) was
adopted in February. It includes discretionary tax
cuts and spending measures estimated at 2.1% of
GDP in 2009 and 2.4% of GDP in 2010. The
package will support overall demand, in particular
in the second and third quarters of 2009.
Subsequently, its effect will gradually diminish
and even turn negative in the course of 2010.
Following last year's aggressive cuts in the federal
funds rate, monetary policy is now at the zero-
bound for setting short-term interest rates. With
overall financial conditions nevertheless remaining
too tight for a recession, the Federal Reserve is
therefore resorting to unconventional stimulatory
measures, including quantitative easing. This
approach has already doubled the central bank's balance sheet.
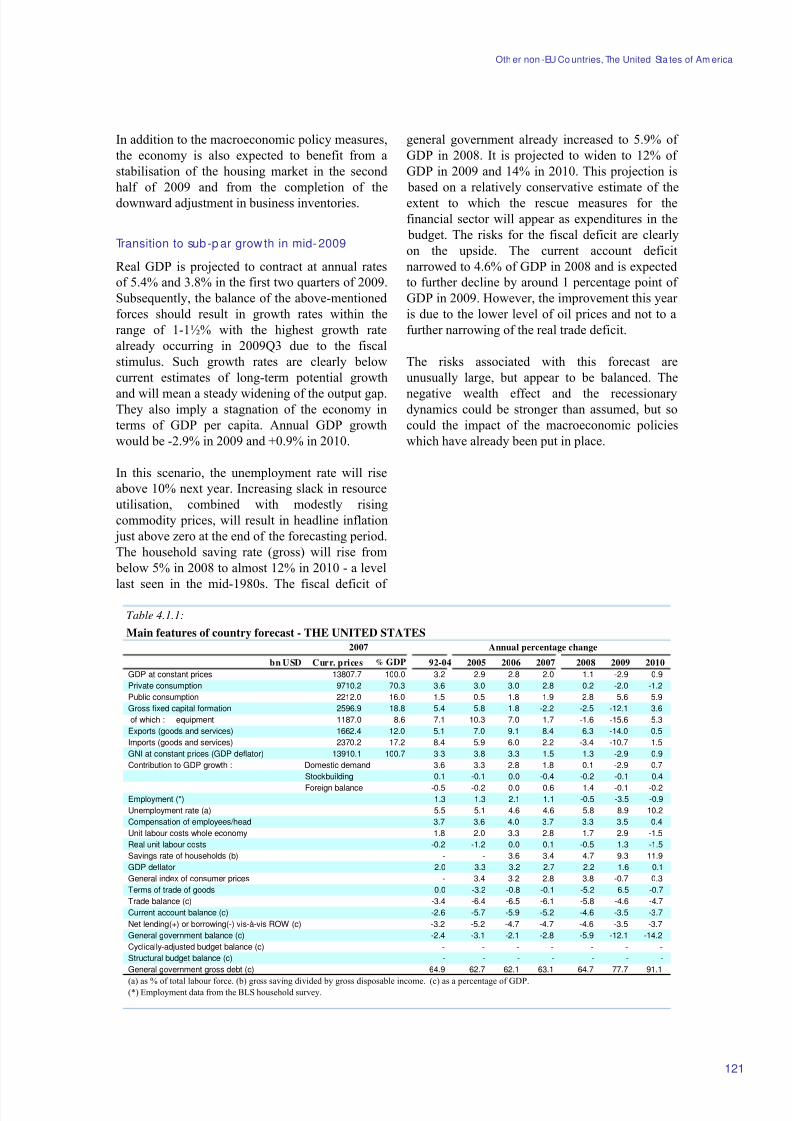
8/14/2019 Economic Forecast 2009
http://slidepdf.com/reader/full/economic-forecast-2009 127/172
Oth er non -EU Co untries, The United Sta tes of Am erica
Table 4.1.1:
Main features of country forecast - THE UNITED STATES
2007 Annual percentage change
bn USD Curr. prices % GDP 92-04 2005 2006 2007 2008 2009 2010
GDP at constant prices 13807.7 100.0 3.2 2.9 2.8 2.0 1.1 -2.9 0.9
Private consumption 9710.2 70.3 3.6 3.0 3.0 2.8 0.2 -2.0 -1.2
Public consumption 2212.0 16.0 1.5 0.5 1.8 1.9 2.8 5.6 5.9
Gross fixed capital formation 2596.9 18.8 5.4 5.8 1.8 -2.2 -2.5 -12.1 3.6
of which : equipment 1187.0 8.6 7.1 10.3 7.0 1.7 -1.6 -15.6 5.3
Exports (goods and services) 1662.4 12.0 5.1 7.0 9.1 8.4 6.3 -14.0 0.5
Imports (goods and services) 2370.2 17.2 8.4 5.9 6.0 2.2 -3.4 -10.7 1.5
GNI at constant prices (GDP deflator) 13910.1 100.7 3.3 3.8 3.3 1.5 1.3 -2.9 0.9
Contribution to GDP growth : Domestic demand 3.6 3.3 2.8 1.8 0.1 -2.9 0.7
Stockbuilding 0.1 -0.1 0.0 -0.4 -0.2 -0.1 0.4
Foreign balance -0.5 -0.2 0.0 0.6 1.4 -0.1 -0.2Employment (*) 1.3 1.3 2.1 1.1 -0.5 -3.5 -0.9
Unemployment rate (a) 5.5 5.1 4.6 4.6 5.8 8.9 10.2
Compensation of employees/head 3.7 3.6 4.0 3.7 3.3 3.5 0.4
Unit labour costs whole economy 1.8 2.0 3.3 2.8 1.7 2.9 -1.5
Real unit labour costs -0.2 -1.2 0.0 0.1 -0.5 1.3 -1.5
Savings rate of households (b) - - 3.6 3.4 4.7 9.3 11.9
GDP deflator 2.0 3.3 3.2 2.7 2.2 1.6 0.1
General index of consumer prices - 3.4 3.2 2.8 3.8 -0.7 0.3
Terms of trade of goods 0.0 -3.2 -0.8 -0.1 -5.2 6.5 -0.7
Trade balance (c) -3.4 -6.4 -6.5 -6.1 -5.8 -4.6 -4.7
Current account balance (c) -2.6 -5.7 -5.9 -5.2 -4.6 -3.5 -3.7
Net lending(+) or borrowing(-) vis-à-vis ROW (c) -3.2 -5.2 -4.7 -4.7 -4.6 -3.5 -3.7
General government balance (c) -2.4 -3.1 -2.1 -2.8 -5.9 -12.1 -14.2
Cyclically-adjusted budget balance (c) - - - - - - -
Structural budget balance (c) - - - - - - -
General government gross debt (c) 64.9 62.7 62.1 63.1 64.7 77.7 91.1
(a) as % of total labour force. (b) gross saving divided by gross disposable income. (c) as a percentage of GDP.(*) Employment data from the BLS household survey.
121
In addition to the macroeconomic policy measures,
the economy is also expected to benefit from a
stabilisation of the housing market in the second
half of 2009 and from the completion of the
downward adjustment in business inventories.
Transition to sub-p ar grow th in mid- 2009
Real GDP is projected to contract at annual rates
of 5.4% and 3.8% in the first two quarters of 2009.
Subsequently, the balance of the above-mentioned
forces should result in growth rates within the
range of 1-1½% with the highest growth rate
already occurring in 2009Q3 due to the fiscal
stimulus. Such growth rates are clearly below
current estimates of long-term potential growth
and will mean a steady widening of the output gap.They also imply a stagnation of the economy in
terms of GDP per capita. Annual GDP growth
would be -2.9% in 2009 and +0.9% in 2010.
In this scenario, the unemployment rate will rise
above 10% next year. Increasing slack in resource
utilisation, combined with modestly rising
commodity prices, will result in headline inflation
just above zero at the end of the forecasting period.
The household saving rate (gross) will rise from
below 5% in 2008 to almost 12% in 2010 - a level
last seen in the mid-1980s. The fiscal deficit of
general government already increased to 5.9% of
GDP in 2008. It is projected to widen to 12% of
GDP in 2009 and 14% in 2010. This projection is
based on a relatively conservative estimate of the
extent to which the rescue measures for the
financial sector will appear as expenditures in the
budget. The risks for the fiscal deficit are clearly
on the upside. The current account deficit
narrowed to 4.6% of GDP in 2008 and is expected
to further decline by around 1 percentage point of
GDP in 2009. However, the improvement this year
is due to the lower level of oil prices and not to a
further narrowing of the real trade deficit.
The risks associated with this forecast are
unusually large, but appear to be balanced. The
negative wealth effect and the recessionarydynamics could be stronger than assumed, but so
could the impact of the macroeconomic policies
which have already been put in place.
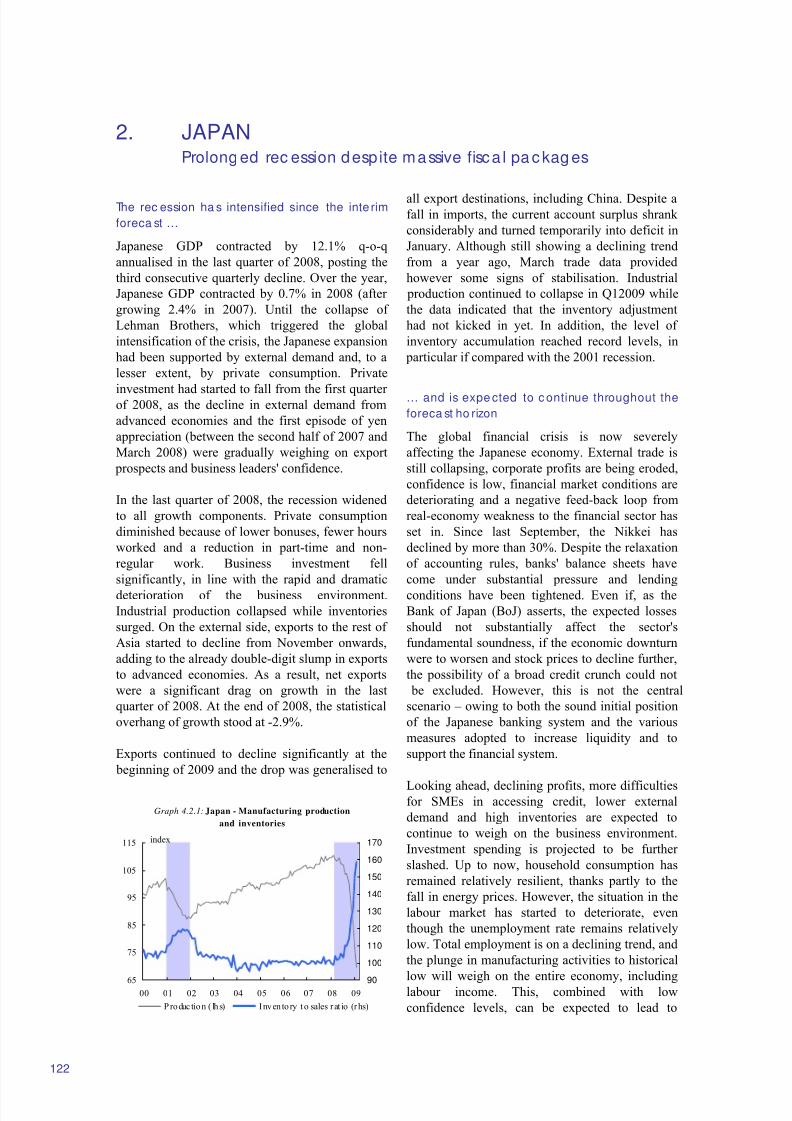
8/14/2019 Economic Forecast 2009
http://slidepdf.com/reader/full/economic-forecast-2009 128/172
2. JAPANProlong ed rec ession despite massive fisca l pa c kag es
Graph 4.2.1: Japan - Manufacturing production
and inventories
65
75
85
95
105
115
00 01 02 03 04 05 06 07 08 09
index
90
100
110
120
130
140
150
160
170
Production ( lhs) Inventory t o sales rat io (rhs)
122
The rec ession ha s intensified since the inte rim
foreca st …
Japanese GDP contracted by 12.1% q-o-q
annualised in the last quarter of 2008, posting the
third consecutive quarterly decline. Over the year,
Japanese GDP contracted by 0.7% in 2008 (after
growing 2.4% in 2007). Until the collapse of
Lehman Brothers, which triggered the global
intensification of the crisis, the Japanese expansion
had been supported by external demand and, to a
lesser extent, by private consumption. Private
investment had started to fall from the first quarter of 2008, as the decline in external demand from
advanced economies and the first episode of yen
appreciation (between the second half of 2007 and
March 2008) were gradually weighing on export
prospects and business leaders' confidence.
In the last quarter of 2008, the recession widened
to all growth components. Private consumption
diminished because of lower bonuses, fewer hours
worked and a reduction in part-time and non-
regular work. Business investment fell
significantly, in line with the rapid and dramatic
deterioration of the business environment.
Industrial production collapsed while inventories
surged. On the external side, exports to the rest of
Asia started to decline from November onwards,
adding to the already double-digit slump in exports
to advanced economies. As a result, net exports
were a significant drag on growth in the last
quarter of 2008. At the end of 2008, the statistical
overhang of growth stood at -2.9%.
Exports continued to decline significantly at the
beginning of 2009 and the drop was generalised to
all export destinations, including China. Despite afall in imports, the current account surplus shrank
considerably and turned temporarily into deficit in
January. Although still showing a declining trend
from a year ago, March trade data provided
however some signs of stabilisation. Industrial
production continued to collapse in Q12009 while
the data indicated that the inventory adjustment
had not kicked in yet. In addition, the level of
inventory accumulation reached record levels, in
particular if compared with the 2001 recession.
… and is expe cted to c ontinue throughout the
foreca st ho rizon
The global financial crisis is now severely
affecting the Japanese economy. External trade is
still collapsing, corporate profits are being eroded,
confidence is low, financial market conditions are
deteriorating and a negative feed-back loop from
real-economy weakness to the financial sector has
set in. Since last September, the Nikkei has
declined by more than 30%. Despite the relaxation
of accounting rules, banks' balance sheets have
come under substantial pressure and lending
conditions have been tightened. Even if, as the
Bank of Japan (BoJ) asserts, the expected losses
should not substantially affect the sector's
fundamental soundness, if the economic downturn
were to worsen and stock prices to decline further,
the possibility of a broad credit crunch could not
be excluded. However, this is not the central
scenario – owing to both the sound initial position
of the Japanese banking system and the various
measures adopted to increase liquidity and to
support the financial system.
Looking ahead, declining profits, more difficultiesfor SMEs in accessing credit, lower external
demand and high inventories are expected to
continue to weigh on the business environment.
Investment spending is projected to be further
slashed. Up to now, household consumption has
remained relatively resilient, thanks partly to the
fall in energy prices. However, the situation in the
labour market has started to deteriorate, even
though the unemployment rate remains relatively
low. Total employment is on a declining trend, and
the plunge in manufacturing activities to historical
low will weigh on the entire economy, includinglabour income. This, combined with low
confidence levels, can be expected to lead to
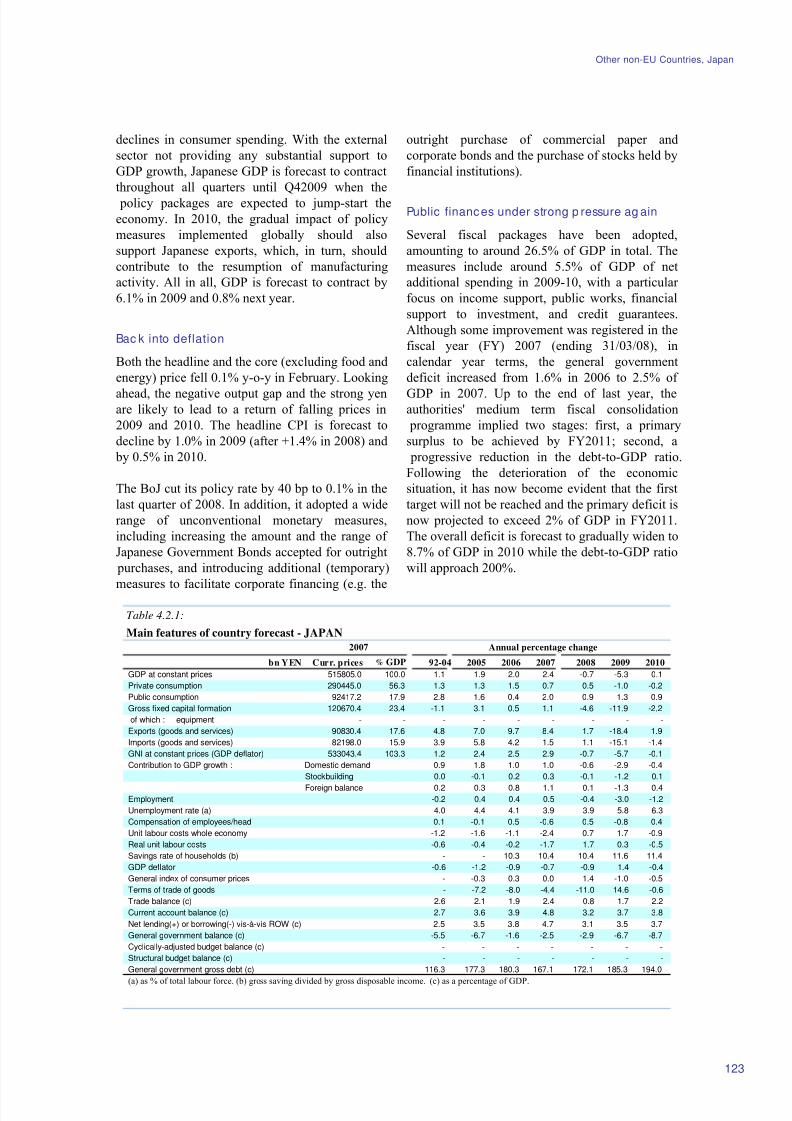
8/14/2019 Economic Forecast 2009
http://slidepdf.com/reader/full/economic-forecast-2009 129/172
Other non-EU Countries, Japan
Table 4.2.1:
Main features of country forecast - JAPAN
2007 Annual percentage change
bn YEN Curr. prices % GDP 92-04 2005 2006 2007 2008 2009 2010
GDP at constant prices 515805.0 100.0 1.1 1.9 2.0 2.4 -0.7 -5.3 0.1
Private consumption 290445.0 56.3 1.3 1.3 1.5 0.7 0.5 -1.0 -0.2
Public consumption 92417.2 17.9 2.8 1.6 0.4 2.0 0.9 1.3 0.9
Gross fixed capital formation 120670.4 23.4 -1.1 3.1 0.5 1.1 -4.6 -11.9 -2.2
of which : equipment - - - - - - - - -
Exports (goods and services) 90830.4 17.6 4.8 7.0 9.7 8.4 1.7 -18.4 1.9
Imports (goods and services) 82198.0 15.9 3.9 5.8 4.2 1.5 1.1 -15.1 -1.4
GNI at constant prices (GDP deflator) 533043.4 103.3 1.2 2.4 2.5 2.9 -0.7 -5.7 -0.1
Contribution to GDP growth : Domestic demand 0.9 1.8 1.0 1.0 -0.6 -2.9 -0.4
Stockbuilding 0.0 -0.1 0.2 0.3 -0.1 -1.2 0.1
Foreign balance 0.2 0.3 0.8 1.1 0.1 -1.3 0.4Employment -0.2 0.4 0.4 0.5 -0.4 -3.0 -1.2
Unemployment rate (a) 4.0 4.4 4.1 3.9 3.9 5.8 6.3
Compensation of employees/head 0.1 -0.1 0.5 -0.6 0.5 -0.8 0.4
Unit labour costs whole economy -1.2 -1.6 -1.1 -2.4 0.7 1.7 -0.9
Real unit labour costs -0.6 -0.4 -0.2 -1.7 1.7 0.3 -0.5
Savings rate of households (b) - - 10.3 10.4 10.4 11.6 11.4
GDP deflator -0.6 -1.2 -0.9 -0.7 -0.9 1.4 -0.4
General index of consumer prices - -0.3 0.3 0.0 1.4 -1.0 -0.5
Terms of trade of goods - -7.2 -8.0 -4.4 -11.0 14.6 -0.6
Trade balance (c) 2.6 2.1 1.9 2.4 0.8 1.7 2.2
Current account balance (c) 2.7 3.6 3.9 4.8 3.2 3.7 3.8
Net lending(+) or borrowing(-) vis-à-vis ROW (c) 2.5 3.5 3.8 4.7 3.1 3.5 3.7
General government balance (c) -5.5 -6.7 -1.6 -2.5 -2.9 -6.7 -8.7
Cyclically-adjusted budget balance (c) - - - - - - -
Structural budget balance (c) - - - - - - -
General government gross debt (c) 116.3 177.3 180.3 167.1 172.1 185.3 194.0
(a) as % of total labour force. (b) gross saving divided by gross disposable income. (c) as a percentage of GDP.
123
declines in consumer spending. With the external
sector not providing any substantial support to
GDP growth, Japanese GDP is forecast to contract
throughout all quarters until Q42009 when the
policy packages are expected to jump-start the
economy. In 2010, the gradual impact of policy
measures implemented globally should also
support Japanese exports, which, in turn, should
contribute to the resumption of manufacturing
activity. All in all, GDP is forecast to contract by
6.1% in 2009 and 0.8% next year.
Bac k into deflation
Both the headline and the core (excluding food and
energy) price fell 0.1% y-o-y in February. Looking
ahead, the negative output gap and the strong yenare likely to lead to a return of falling prices in
2009 and 2010. The headline CPI is forecast to
decline by 1.0% in 2009 (after +1.4% in 2008) and
by 0.5% in 2010.
The BoJ cut its policy rate by 40 bp to 0.1% in the
last quarter of 2008. In addition, it adopted a wide
range of unconventional monetary measures,
including increasing the amount and the range of
Japanese Government Bonds accepted for outright
purchases, and introducing additional (temporary)
measures to facilitate corporate financing (e.g. the
outright purchase of commercial paper and
corporate bonds and the purchase of stocks held by
financial institutions).
Public finances under strong p ressure ag ain
Several fiscal packages have been adopted,
amounting to around 26.5% of GDP in total. The
measures include around 5.5% of GDP of net
additional spending in 2009-10, with a particular
focus on income support, public works, financial
support to investment, and credit guarantees.
Although some improvement was registered in the
fiscal year (FY) 2007 (ending 31/03/08), in
calendar year terms, the general government
deficit increased from 1.6% in 2006 to 2.5% of
GDP in 2007. Up to the end of last year, theauthorities' medium term fiscal consolidation
programme implied two stages: first, a primary
surplus to be achieved by FY2011; second, a
progressive reduction in the debt-to-GDP ratio.
Following the deterioration of the economic
situation, it has now become evident that the first
target will not be reached and the primary deficit is
now projected to exceed 2% of GDP in FY2011.
The overall deficit is forecast to gradually widen to
8.7% of GDP in 2010 while the debt-to-GDP ratio
will approach 200%.
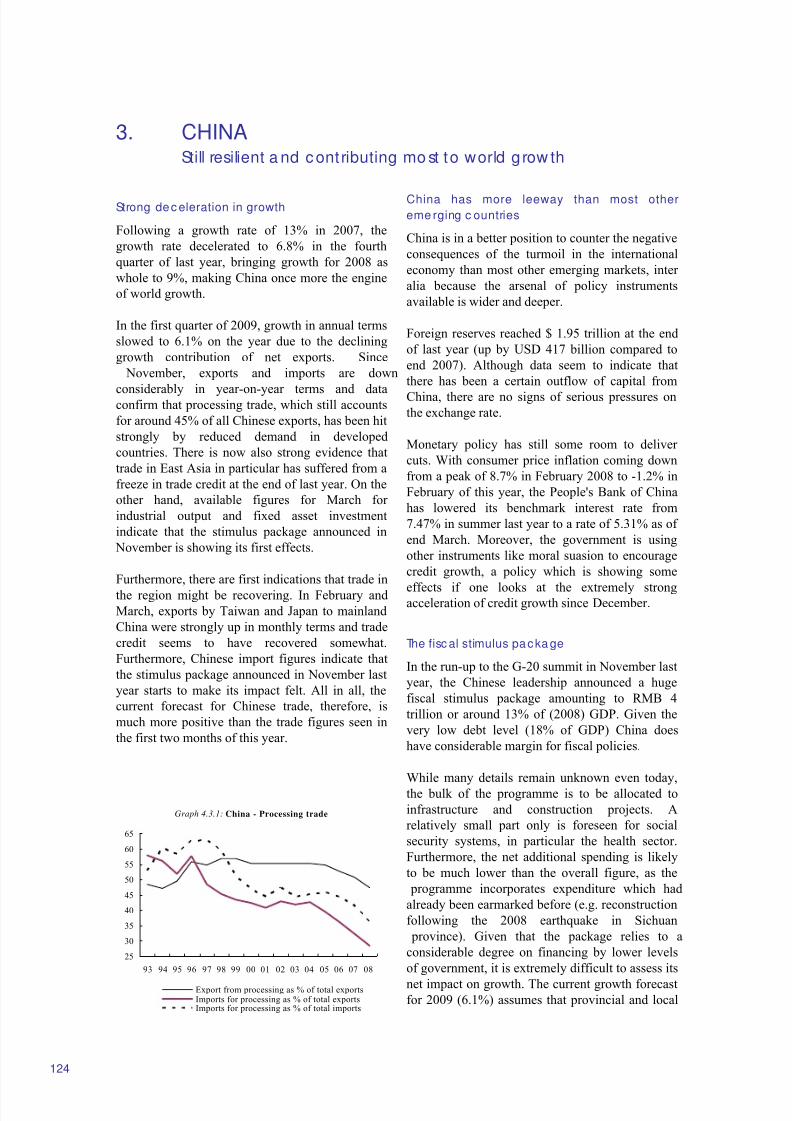
8/14/2019 Economic Forecast 2009
http://slidepdf.com/reader/full/economic-forecast-2009 130/172
3. CHINAStill resilient a nd c ontributing mo st to world g row th
Graph 4.3.1: China - Processing trade
25
30
35
40
45
50
55
60
65
93 94 95 96 97 98 99 00 01 02 03 04 05 06 07 08
Export from processing as % of total exportsImports for processing as % of total exportsImports for processing as % of total imports
124
Strong dec eleration in growth
Following a growth rate of 13% in 2007, the
growth rate decelerated to 6.8% in the fourth
quarter of last year, bringing growth for 2008 as
whole to 9%, making China once more the engine
of world growth.
In the first quarter of 2009, growth in annual terms
slowed to 6.1% on the year due to the declining
growth contribution of net exports. Since
November, exports and imports are down
considerably in year-on-year terms and dataconfirm that processing trade, which still accounts
for around 45% of all Chinese exports, has been hit
strongly by reduced demand in developed
countries. There is now also strong evidence that
trade in East Asia in particular has suffered from a
freeze in trade credit at the end of last year. On the
other hand, available figures for March for
industrial output and fixed asset investment
indicate that the stimulus package announced in
November is showing its first effects.
Furthermore, there are first indications that trade in
the region might be recovering. In February and
March, exports by Taiwan and Japan to mainland
China were strongly up in monthly terms and trade
credit seems to have recovered somewhat.
Furthermore, Chinese import figures indicate that
the stimulus package announced in November last
year starts to make its impact felt. All in all, the
current forecast for Chinese trade, therefore, is
much more positive than the trade figures seen in
the first two months of this year.
China has more leeway than most othereme rging c ountries
China is in a better position to counter the negative
consequences of the turmoil in the international
economy than most other emerging markets, inter
alia because the arsenal of policy instruments
available is wider and deeper.
Foreign reserves reached $ 1.95 trillion at the end
of last year (up by USD 417 billion compared to
end 2007). Although data seem to indicate that
there has been a certain outflow of capital from
China, there are no signs of serious pressures onthe exchange rate.
Monetary policy has still some room to deliver
cuts. With consumer price inflation coming down
from a peak of 8.7% in February 2008 to -1.2% in
February of this year, the People's Bank of China
has lowered its benchmark interest rate from
7.47% in summer last year to a rate of 5.31% as of
end March. Moreover, the government is using
other instruments like moral suasion to encourage
credit growth, a policy which is showing some
effects if one looks at the extremely strongacceleration of credit growth since December.
The fisc al stimulus packa ge
In the run-up to the G-20 summit in November last
year, the Chinese leadership announced a huge
fiscal stimulus package amounting to RMB 4
trillion or around 13% of (2008) GDP. Given the
very low debt level (18% of GDP) China does
have considerable margin for fiscal policies.
While many details remain unknown even today,
the bulk of the programme is to be allocated to
infrastructure and construction projects. A
relatively small part only is foreseen for social
security systems, in particular the health sector.
Furthermore, the net additional spending is likely
to be much lower than the overall figure, as the
programme incorporates expenditure which had
already been earmarked before (e.g. reconstruction
following the 2008 earthquake in Sichuan
province). Given that the package relies to a
considerable degree on financing by lower levels
of government, it is extremely difficult to assess its
net impact on growth. The current growth forecastfor 2009 (6.1%) assumes that provincial and local
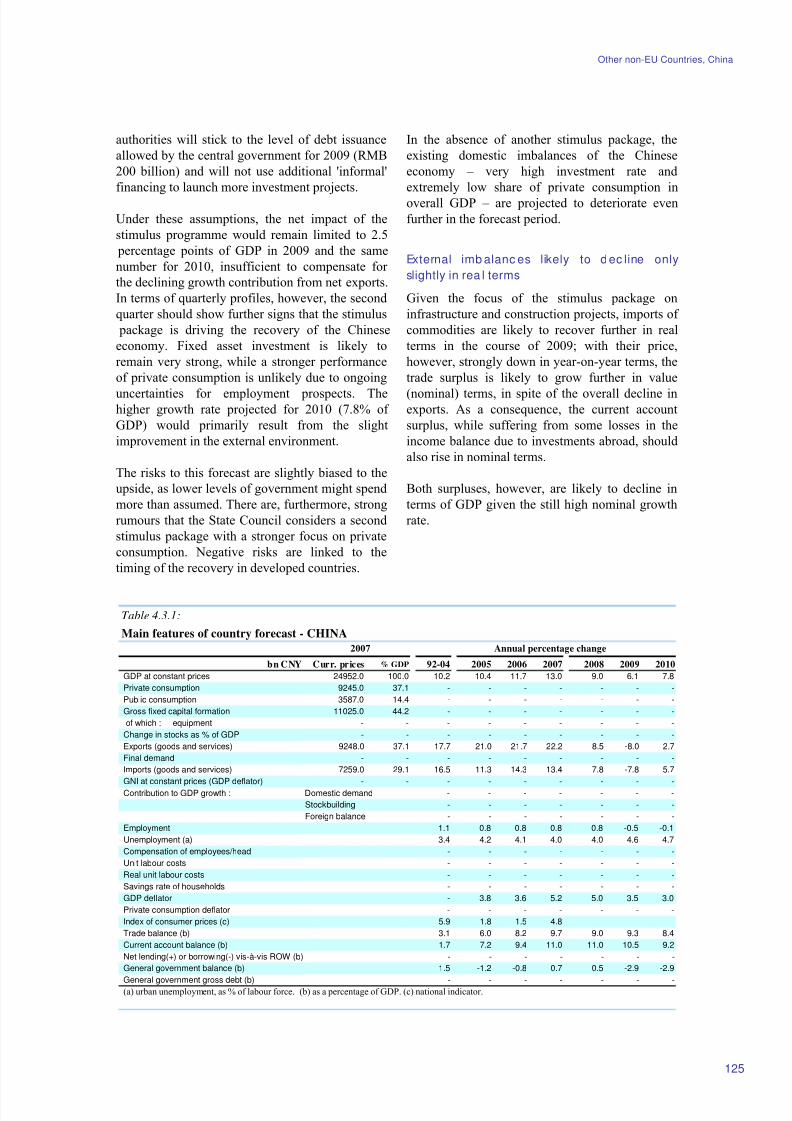
8/14/2019 Economic Forecast 2009
http://slidepdf.com/reader/full/economic-forecast-2009 131/172
Other non-EU Countries, China
Table 4.3.1:
Main features of country forecast - CHINA
2007 Annual percentage change
bn CNY Curr. prices % GDP 92-04 2005 2006 2007 2008 2009 2010
GDP at constant prices 24952.0 100.0 10.2 10.4 11.7 13.0 9.0 6.1 7.8
Private consumption 9245.0 37.1 - - - - - - -
Public consumption 3587.0 14.4 - - - - - - -
Gross fixed capital formation 11025.0 44.2 - - - - - - -
of which : equipment - - - - - - - - -
Change in stocks as % of GDP - - - - - - - - -
Exports (goods and services) 9248.0 37.1 17.7 21.0 21.7 22.2 8.5 -8.0 2.7
Final demand - - - - - - - - -
Imports (goods and services) 7259.0 29.1 16.5 11.3 14.3 13.4 7.8 -7.8 5.7
GNI at constant prices (GDP deflator) - - - - - - - - -Contribution to GDP growth : Domestic demand - - - - - - -
Stockbuilding - - - - - - -
Foreign balance - - - - - - -
Employment 1.1 0.8 0.8 0.8 0.8 -0.5 -0.1
Unemployment (a) 3.4 4.2 4.1 4.0 4.0 4.6 4.7
Compensation of employees/head - - - - - - -
Unit labour costs - - - - - - -
Real unit labour costs - - - - - - -
Savings rate of households - - - - - - -
GDP deflator - 3.8 3.6 5.2 5.0 3.5 3.0
Private consumption deflator - - - - - - -
Index of consumer prices (c) 5.9 1.8 1.5 4.8
Trade balance (b) 3.1 6.0 8.2 9.7 9.0 9.3 8.4
Current account balance (b) 1.7 7.2 9.4 11.0 11.0 10.5 9.2
Net lending(+) or borrowing(-) vis-à-vis ROW (b) - - - - - - -
General government balance (b) 1.5 -1.2 -0.8 0.7 0.5 -2.9 -2.9
General government gross debt (b) - - - - - - -(a) urban unemployment, as % of labour force. (b) as a percentage of GDP. (c) national indicator.
125
authorities will stick to the level of debt issuance
allowed by the central government for 2009 (RMB
200 billion) and will not use additional 'informal'
financing to launch more investment projects.
Under these assumptions, the net impact of the
stimulus programme would remain limited to 2.5
percentage points of GDP in 2009 and the same
number for 2010, insufficient to compensate for
the declining growth contribution from net exports.
In terms of quarterly profiles, however, the second
quarter should show further signs that the stimulus
package is driving the recovery of the Chinese
economy. Fixed asset investment is likely to
remain very strong, while a stronger performance
of private consumption is unlikely due to ongoing
uncertainties for employment prospects. Thehigher growth rate projected for 2010 (7.8% of
GDP) would primarily result from the slight
improvement in the external environment.
The risks to this forecast are slightly biased to the
upside, as lower levels of government might spend
more than assumed. There are, furthermore, strong
rumours that the State Council considers a second
stimulus package with a stronger focus on private
consumption. Negative risks are linked to the
timing of the recovery in developed countries.
In the absence of another stimulus package, the
existing domestic imbalances of the Chinese
economy – very high investment rate and
extremely low share of private consumption in
overall GDP – are projected to deteriorate even
further in the forecast period.
External imb alanc es likely to d ec line only
slightly in rea l terms
Given the focus of the stimulus package on
infrastructure and construction projects, imports of
commodities are likely to recover further in real
terms in the course of 2009; with their price,
however, strongly down in year-on-year terms, the
trade surplus is likely to grow further in value
(nominal) terms, in spite of the overall decline inexports. As a consequence, the current account
surplus, while suffering from some losses in the
income balance due to investments abroad, should
also rise in nominal terms.
Both surpluses, however, are likely to decline in
terms of GDP given the still high nominal growth
rate.
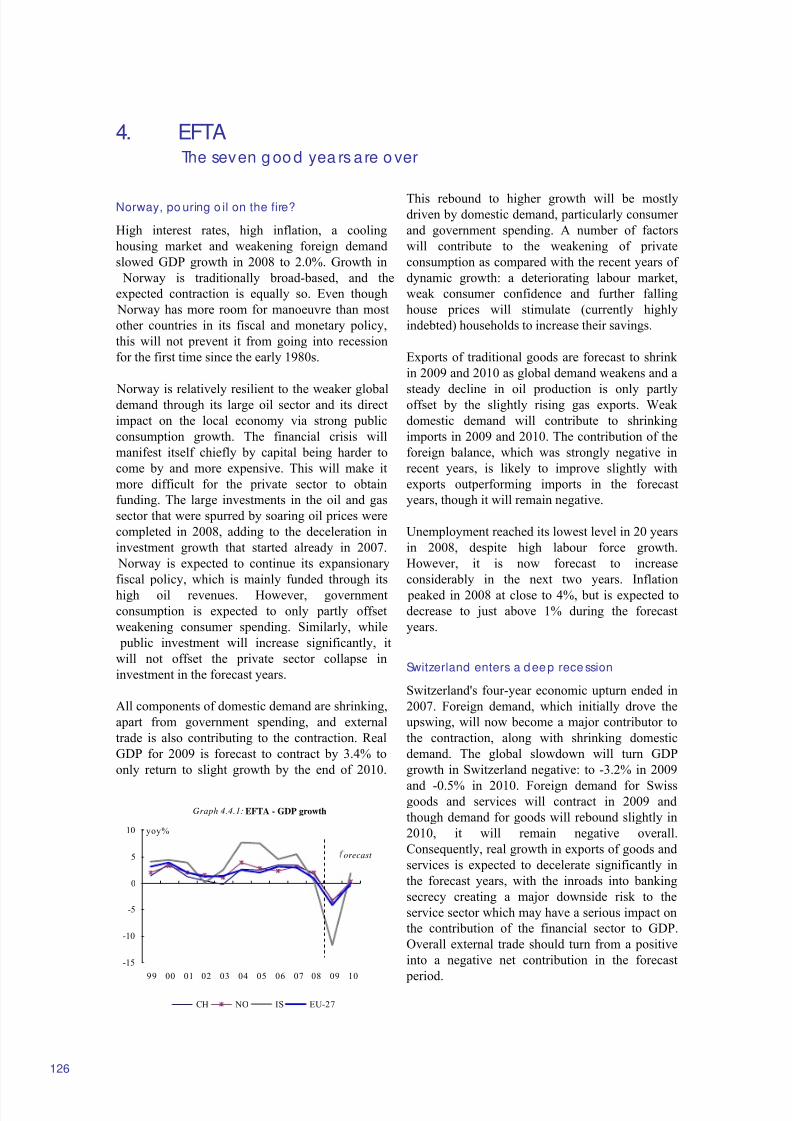
8/14/2019 Economic Forecast 2009
http://slidepdf.com/reader/full/economic-forecast-2009 132/172
4. EFTAThe seven g oo d yea rs a re o ver
Graph 4.4.1: EFTA - GDP growth
-15
-10
-5
0
5
10
99 00 01 02 03 04 05 06 07 08 09 10
CH NO IS EU-27
orecast
yoy%
126
Norway, po uring o il on the fire?
High interest rates, high inflation, a cooling
housing market and weakening foreign demand
slowed GDP growth in 2008 to 2.0%. Growth in
Norway is traditionally broad-based, and the
expected contraction is equally so. Even though
Norway has more room for manoeuvre than most
other countries in its fiscal and monetary policy,
this will not prevent it from going into recession
for the first time since the early 1980s.
Norway is relatively resilient to the weaker globaldemand through its large oil sector and its direct
impact on the local economy via strong public
consumption growth. The financial crisis will
manifest itself chiefly by capital being harder to
come by and more expensive. This will make it
more difficult for the private sector to obtain
funding. The large investments in the oil and gas
sector that were spurred by soaring oil prices were
completed in 2008, adding to the deceleration in
investment growth that started already in 2007.
Norway is expected to continue its expansionary
fiscal policy, which is mainly funded through its
high oil revenues. However, government
consumption is expected to only partly offset
weakening consumer spending. Similarly, while
public investment will increase significantly, it
will not offset the private sector collapse in
investment in the forecast years.
All components of domestic demand are shrinking,
apart from government spending, and external
trade is also contributing to the contraction. Real
GDP for 2009 is forecast to contract by 3.4% to
only return to slight growth by the end of 2010.
This rebound to higher growth will be mostlydriven by domestic demand, particularly consumer
and government spending. A number of factors
will contribute to the weakening of private
consumption as compared with the recent years of
dynamic growth: a deteriorating labour market,
weak consumer confidence and further falling
house prices will stimulate (currently highly
indebted) households to increase their savings.
Exports of traditional goods are forecast to shrink
in 2009 and 2010 as global demand weakens and a
steady decline in oil production is only partlyoffset by the slightly rising gas exports. Weak
domestic demand will contribute to shrinking
imports in 2009 and 2010. The contribution of the
foreign balance, which was strongly negative in
recent years, is likely to improve slightly with
exports outperforming imports in the forecast
years, though it will remain negative.
Unemployment reached its lowest level in 20 years
in 2008, despite high labour force growth.
However, it is now forecast to increase
considerably in the next two years. Inflation
peaked in 2008 at close to 4%, but is expected to
decrease to just above 1% during the forecast
years.
Switzerland enters a deep rece ssion
Switzerland's four-year economic upturn ended in
2007. Foreign demand, which initially drove the
upswing, will now become a major contributor to
the contraction, along with shrinking domestic
demand. The global slowdown will turn GDP
growth in Switzerland negative: to -3.2% in 2009
and -0.5% in 2010. Foreign demand for Swissgoods and services will contract in 2009 and
though demand for goods will rebound slightly in
2010, it will remain negative overall.
Consequently, real growth in exports of goods and
services is expected to decelerate significantly in
the forecast years, with the inroads into banking
secrecy creating a major downside risk to the
service sector which may have a serious impact on
the contribution of the financial sector to GDP.
Overall external trade should turn from a positive
into a negative net contribution in the forecast
period.
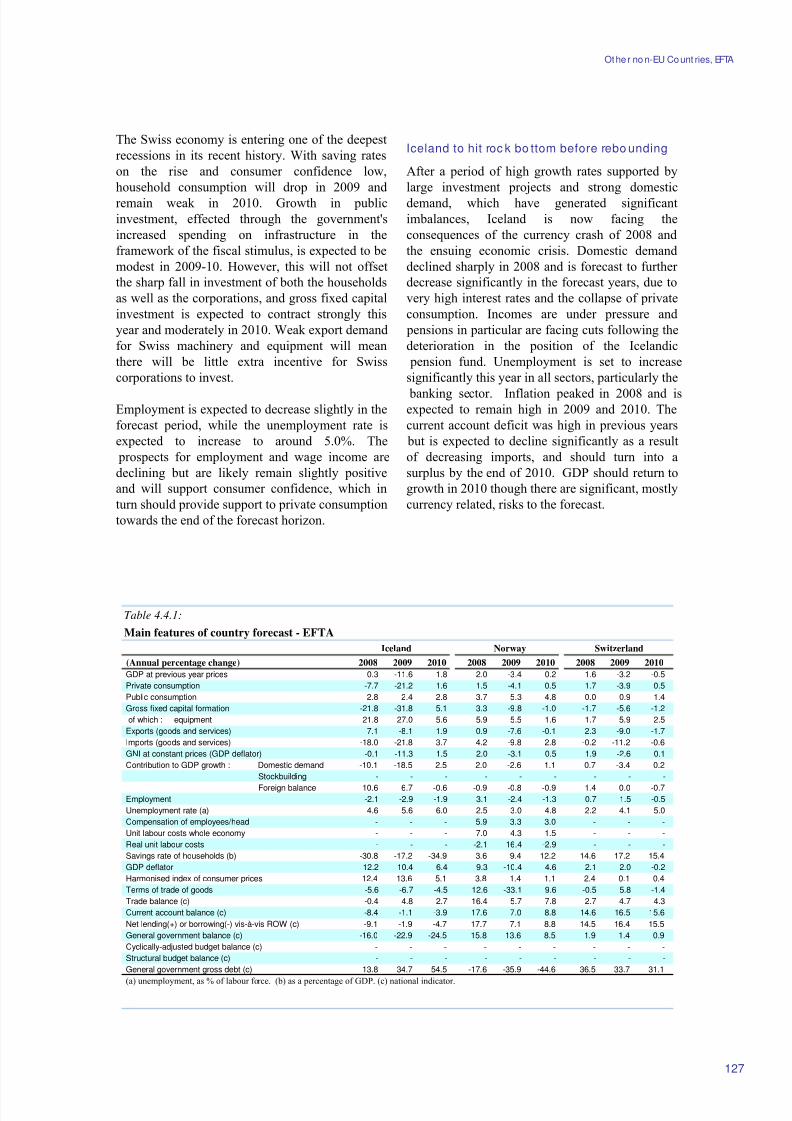
8/14/2019 Economic Forecast 2009
http://slidepdf.com/reader/full/economic-forecast-2009 133/172
Other no n-EU Count ries, EFTA
Table 4.4.1:
Main features of country forecast - EFTA
Iceland Norway Switzerland
(Annual percentage change) 2008 2009 2010 2008 2009 2010 2008 2009 2010
GDP at previous year prices 0.3 -11.6 1.8 2.0 -3.4 0.2 1.6 -3.2 -0.5
Private consumption -7.7 -21.2 1.6 1.5 -4.1 0.5 1.7 -3.9 0.5
Public consumption 2.8 2.4 2.8 3.7 5.3 4.8 0.0 0.9 1.4
Gross fixed capital formation -21.8 -31.8 5.1 3.3 -9.8 -1.0 -1.7 -5.6 -1.2
of which : equipment -21.8 -27.0 5.6 5.9 -5.5 1.6 -1.7 -5.9 -2.5
Exports (goods and services) 7.1 -8.1 1.9 0.9 -7.6 -0.1 2.3 -9.0 -1.7
Imports (goods and services) -18.0 -21.8 3.7 4.2 -9.8 2.8 -0.2 -11.2 -0.6
GNI at constant prices (GDP deflator) -0.1 -11.3 1.5 2.0 -3.1 0.5 1.9 -2.6 0.1
Contribution to GDP growth : Domestic demand -10.1 -18.5 2.5 2.0 -2.6 1.1 0.7 -3.4 0.2
Stockbuilding - - - - - - - - -
Foreign balance 10.6 6.7 -0.6 -0.9 -0.8 -0.9 1.4 0.0 -0.7Employment -2.1 -2.9 -1.9 3.1 -2.4 -1.3 0.7 1.5 -0.5
Unemployment rate (a) 4.6 5.6 6.0 2.5 3.0 4.8 2.2 4.1 5.0
Compensation of employees/head - - - 5.9 3.3 3.0 - - -
Unit labour costs whole economy - - - 7.0 4.3 1.5 - - -
Real unit labour costs - - - -2.1 16.4 -2.9 - - -
Savings rate of households (b) -30.8 -17.2 -34.9 3.6 9.4 12.2 14.6 17.2 15.4
GDP deflator 12.2 10.4 6.4 9.3 -10.4 4.6 2.1 2.0 -0.2
Harmonised index of consumer prices 12.4 13.6 5.1 3.8 1.4 1.1 2.4 0.1 0.4
Terms of trade of goods -5.6 -6.7 -4.5 12.6 -33.1 9.6 -0.5 5.8 -1.4
Trade balance (c) -0.4 4.8 2.7 16.4 5.7 7.8 2.7 4.7 4.3
Current account balance (c) -8.4 -1.1 -3.9 17.6 7.0 8.8 14.6 16.5 15.6
Net lending(+) or borrowing(-) vis-à-vis ROW (c) -9.1 -1.9 -4.7 17.7 7.1 8.8 14.5 16.4 15.5
General government balance (c) -16.0 -22.9 -24.5 15.8 13.6 8.5 1.9 1.4 0.9
Cyclically-adjusted budget balance (c) - - - - - - - - -
Structural budget balance (c) - - - - - - - - -
General government gross debt (c) 13.8 34.7 54.5 -17.6 -35.9 -44.6 36.5 33.7 31.1
(a) unemployment, as % of labour force. (b) as a percentage of GDP. (c) national indicator.
127
The Swiss economy is entering one of the deepest
recessions in its recent history. With saving rates
on the rise and consumer confidence low,
household consumption will drop in 2009 and
remain weak in 2010. Growth in public
investment, effected through the government's
increased spending on infrastructure in the
framework of the fiscal stimulus, is expected to be
modest in 2009-10. However, this will not offset
the sharp fall in investment of both the households
as well as the corporations, and gross fixed capital
investment is expected to contract strongly this
year and moderately in 2010. Weak export demand
for Swiss machinery and equipment will mean
there will be little extra incentive for Swiss
corporations to invest.
Employment is expected to decrease slightly in the
forecast period, while the unemployment rate is
expected to increase to around 5.0%. The
prospects for employment and wage income are
declining but are likely remain slightly positive
and will support consumer confidence, which in
turn should provide support to private consumption
towards the end of the forecast horizon.
Iceland to hit roc k bo ttom before rebo unding
After a period of high growth rates supported by
large investment projects and strong domestic
demand, which have generated significant
imbalances, Iceland is now facing the
consequences of the currency crash of 2008 and
the ensuing economic crisis. Domestic demand
declined sharply in 2008 and is forecast to further
decrease significantly in the forecast years, due to
very high interest rates and the collapse of private
consumption. Incomes are under pressure and
pensions in particular are facing cuts following the
deterioration in the position of the Icelandic
pension fund. Unemployment is set to increase
significantly this year in all sectors, particularly the
banking sector. Inflation peaked in 2008 and isexpected to remain high in 2009 and 2010. The
current account deficit was high in previous years
but is expected to decline significantly as a result
of decreasing imports, and should turn into a
surplus by the end of 2010. GDP should return to
growth in 2010 though there are significant, mostly
currency related, risks to the forecast.
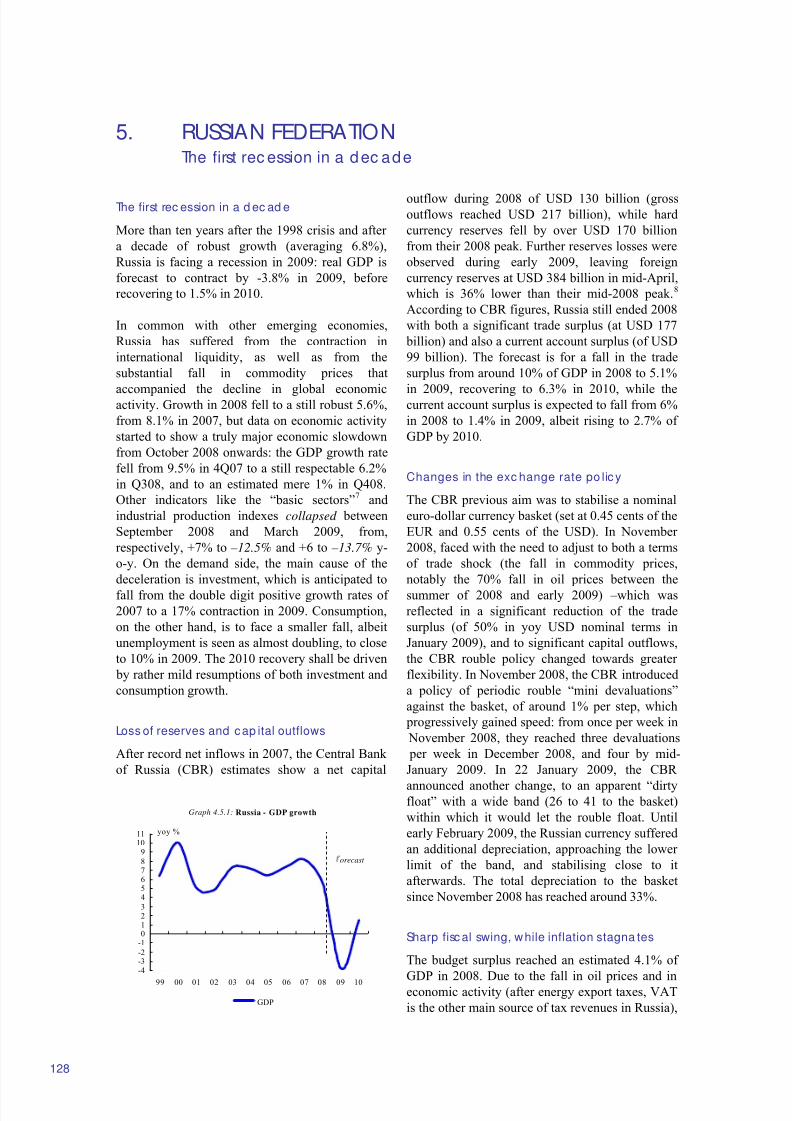
8/14/2019 Economic Forecast 2009
http://slidepdf.com/reader/full/economic-forecast-2009 134/172
5. RUSSIAN FEDERATIONThe first rec ession in a dec ade
Graph 4.5.1: Russia - GDP growth
-4-3-2
-10123
45678
91011
99 00 01 02 03 04 05 06 07 08 09 10
yoy %
GDP
orecast
128
The first rec ession in a d ec ad e
More than ten years after the 1998 crisis and after
a decade of robust growth (averaging 6.8%),
Russia is facing a recession in 2009: real GDP is
forecast to contract by -3.8% in 2009, before
recovering to 1.5% in 2010.
In common with other emerging economies,
Russia has suffered from the contraction in
international liquidity, as well as from the
substantial fall in commodity prices that
accompanied the decline in global economicactivity. Growth in 2008 fell to a still robust 5.6%,
from 8.1% in 2007, but data on economic activity
started to show a truly major economic slowdown
from October 2008 onwards: the GDP growth rate
fell from 9.5% in 4Q07 to a still respectable 6.2%
in Q308, and to an estimated mere 1% in Q408.
Other indicators like the “basic sectors”7 and
industrial production indexes collapsed between
September 2008 and March 2009, from,
respectively, +7% to –12.5% and +6 to –13.7% y-
o-y. On the demand side, the main cause of the
deceleration is investment, which is anticipated to
fall from the double digit positive growth rates of
2007 to a 17% contraction in 2009. Consumption,
on the other hand, is to face a smaller fall, albeit
unemployment is seen as almost doubling, to close
to 10% in 2009. The 2010 recovery shall be driven
by rather mild resumptions of both investment and
consumption growth.
Loss of reserves and cap ital outflows
After record net inflows in 2007, the Central Bank
of Russia (CBR) estimates show a net capital
outflow during 2008 of USD 130 billion (grossoutflows reached USD 217 billion), while hard
currency reserves fell by over USD 170 billion
from their 2008 peak. Further reserves losses were
observed during early 2009, leaving foreign
currency reserves at USD 384 billion in mid-April,
which is 36% lower than their mid-2008 peak.8
According to CBR figures, Russia still ended 2008
with both a significant trade surplus (at USD 177
billion) and also a current account surplus (of USD
99 billion). The forecast is for a fall in the trade
surplus from around 10% of GDP in 2008 to 5.1%
in 2009, recovering to 6.3% in 2010, while thecurrent account surplus is expected to fall from 6%
in 2008 to 1.4% in 2009, albeit rising to 2.7% of
GDP by 2010.
Changes in the exc hange rate po lic y
The CBR previous aim was to stabilise a nominal
euro-dollar currency basket (set at 0.45 cents of the
EUR and 0.55 cents of the USD). In November
2008, faced with the need to adjust to both a terms
of trade shock (the fall in commodity prices,
notably the 70% fall in oil prices between the
summer of 2008 and early 2009) –which was
reflected in a significant reduction of the trade
surplus (of 50% in yoy USD nominal terms in
January 2009), and to significant capital outflows,
the CBR rouble policy changed towards greater
flexibility. In November 2008, the CBR introduced
a policy of periodic rouble “mini devaluations”
against the basket, of around 1% per step, which
progressively gained speed: from once per week in
November 2008, they reached three devaluations
per week in December 2008, and four by mid-
January 2009. In 22 January 2009, the CBR
announced another change, to an apparent “dirtyfloat” with a wide band (26 to 41 to the basket)
within which it would let the rouble float. Until
early February 2009, the Russian currency suffered
an additional depreciation, approaching the lower
limit of the band, and stabilising close to it
afterwards. The total depreciation to the basket
since November 2008 has reached around 33%.
Sharp fisc al swing, while inflation stagna tes
The budget surplus reached an estimated 4.1% of
GDP in 2008. Due to the fall in oil prices and ineconomic activity (after energy export taxes, VAT
is the other main source of tax revenues in Russia),
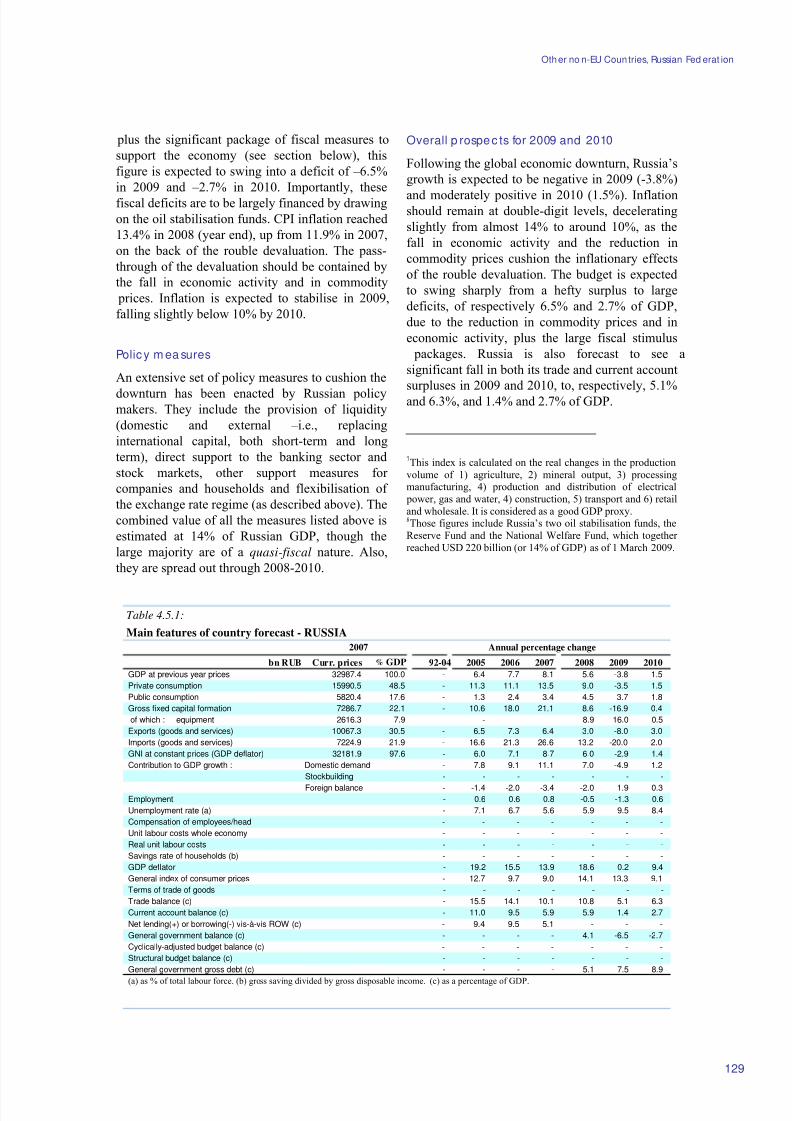
8/14/2019 Economic Forecast 2009
http://slidepdf.com/reader/full/economic-forecast-2009 135/172
Other no n-EU Coun tries, Russian Fed erat ion
Table 4.5.1:
Main features of country forecast - RUSSIA
2007 Annual percentage change
bn RUB Curr. prices % GDP 92-04 2005 2006 2007 2008 2009 2010
GDP at previous year prices 32987.4 100.0 - 6.4 7.7 8.1 5.6 -3.8 1.5
Private consumption 15990.5 48.5 - 11.3 11.1 13.5 9.0 -3.5 1.5
Public consumption 5820.4 17.6 - 1.3 2.4 3.4 4.5 3.7 1.8
Gross fixed capital formation 7286.7 22.1 - 10.6 18.0 21.1 8.6 -16.9 0.4
of which : equipment 2616.3 7.9 - - - - 8.9 -16.0 0.5
Exports (goods and services) 10067.3 30.5 - 6.5 7.3 6.4 3.0 -8.0 3.0
Imports (goods and services) 7224.9 21.9 - 16.6 21.3 26.6 13.2 -20.0 2.0
GNI at constant prices (GDP deflator) 32181.9 97.6 - 6.0 7.1 8.7 6.0 -2.9 1.4
Contribution to GDP growth : Domestic demand - 7.8 9.1 11.1 7.0 -4.9 1.2
Stockbuilding - - - - - - -
Foreign balance - -1.4 -2.0 -3.4 -2.0 1.9 0.3Employment - 0.6 0.6 0.8 -0.5 -1.3 0.6
Unemployment rate (a) - 7.1 6.7 5.6 5.9 9.5 8.4
Compensation of employees/head - - - - - - -
Unit labour costs whole economy - - - - - - -
Real unit labour costs - - - - - - -
Savings rate of households (b) - - - - - - -
GDP deflator - 19.2 15.5 13.9 18.6 0.2 9.4
General index of consumer prices - 12.7 9.7 9.0 14.1 13.3 9.1
Terms of trade of goods - - - - - - -
Trade balance (c) - 15.5 14.1 10.1 10.8 5.1 6.3
Current account balance (c) - 11.0 9.5 5.9 5.9 1.4 2.7
Net lending(+) or borrowing(-) vis-à-vis ROW (c) - 9.4 9.5 5.1 - - -
General government balance (c) - - - - 4.1 -6.5 -2.7
Cyclically-adjusted budget balance (c) - - - - - - -
Structural budget balance (c) - - - - - - -
General government gross debt (c) - - - - 5.1 7.5 8.9
(a) as % of total labour force. (b) gross saving divided by gross disposable income. (c) as a percentage of GDP.
129
plus the significant package of fiscal measures to
support the economy (see section below), this
figure is expected to swing into a deficit of –6.5%
in 2009 and –2.7% in 2010. Importantly, these
fiscal deficits are to be largely financed by drawing
on the oil stabilisation funds. CPI inflation reached
13.4% in 2008 (year end), up from 11.9% in 2007,
on the back of the rouble devaluation. The pass-
through of the devaluation should be contained by
the fall in economic activity and in commodity
prices. Inflation is expected to stabilise in 2009,
falling slightly below 10% by 2010.
Policy m ea sures
An extensive set of policy measures to cushion the
downturn has been enacted by Russian policymakers. They include the provision of liquidity
(domestic and external –i.e., replacing
international capital, both short-term and long
term), direct support to the banking sector and
stock markets, other support measures for
companies and households and flexibilisation of
the exchange rate regime (as described above). The
combined value of all the measures listed above is
estimated at 14% of Russian GDP, though the
large majority are of a quasi-fiscal nature. Also,
they are spread out through 2008-2010.
Overall p rospec ts for 2009 and 2010
Following the global economic downturn, Russia’s
growth is expected to be negative in 2009 (-3.8%)
and moderately positive in 2010 (1.5%). Inflationshould remain at double-digit levels, decelerating
slightly from almost 14% to around 10%, as the
fall in economic activity and the reduction in
commodity prices cushion the inflationary effects
of the rouble devaluation. The budget is expected
to swing sharply from a hefty surplus to large
deficits, of respectively 6.5% and 2.7% of GDP,
due to the reduction in commodity prices and in
economic activity, plus the large fiscal stimulus
packages. Russia is also forecast to see a
significant fall in both its trade and current account
surpluses in 2009 and 2010, to, respectively, 5.1%
and 6.3%, and 1.4% and 2.7% of GDP.
7This index is calculated on the real changes in the productionvolume of 1) agriculture, 2) mineral output, 3) processingmanufacturing, 4) production and distribution of electrical power, gas and water, 4) construction, 5) transport and 6) retailand wholesale. It is considered as a good GDP proxy.8Those figures include Russia’s two oil stabilisation funds, theReserve Fund and the National Welfare Fund, which together reached USD 220 billion (or 14% of GDP) as of 1 March 2009.

8/14/2019 Economic Forecast 2009
http://slidepdf.com/reader/full/economic-forecast-2009 136/172

8/14/2019 Economic Forecast 2009
http://slidepdf.com/reader/full/economic-forecast-2009 137/172
Statistical Annex
8/14/2019 Economic Forecast 2009
http://slidepdf.com/reader/full/economic-forecast-2009 138/172
Contents
132
Outp ut : GDP and its c omponents
1. Gross Dom estic Prod uc t 134
2. Profiles (qoq ) of qua rterly GDP 134
3. Profiles (yoy) of qua rterly GDP 135
4. GDP pe r c ap ita 135
5. Fina l dom estic dem and 136
6. Final dem and 136
7. Priva te c onsump tion expend iture 137
8. Government c onsump tion expe nd iture 1379. Tota l investm ent 138
10. Investment in c onstruc tion 138
11. Investment in eq uipm ent 139
12. Pub lic investm ent 139
13. Pote ntial outp ut ga p 140
Pric es
14. Defla to r of GDP 140
15. Deflator of p riva te c onsump tion 141
16. Co nsumer p ric es index 141
17. Co nsumer p ric es qua rterly p rofiles 14218. Deflator of exports of goo ds 142
19. Deflator of imports of goo ds 143
20. Terms of trad e of goo ds 143
Wages, pop ula tion and lab our ma rket
21. Tota l pop ulation 144
22. Tota l em p loyme nt 144
23. Number of unem ployed 145
24. Comp ensat ion of em p loyee s per hea d 145
25. Rea l c om pensa tion of em ployee s per hea d 146
26. Labour p roduc tivity 14627. Unit lab our costs, whole ec onom y 147
28. Rea l unit lab our c osts 147
Interest and excha nge ra tes
29. Nominal b ilateral excha nge rates 148
30. Nominal effec tive excha nge rates 148
31. Rela tive unit lab our c osts 149
32. Rea l effec tive excha nge ra tes 149
33. Sho rt te rm interest rates 150
34. Long te rm interest rates 150
8/14/2019 Economic Forecast 2009
http://slidepdf.com/reader/full/economic-forecast-2009 139/172
133
General Gove rnment
35. Tota l expend iture 151
36. Tota l revenue 151
37. Net lend ing(+) or net borrowing (-) 152
38. Inte rest expend iture 152
39. Prima ry ba lanc e 15340. Cyc lic ally adjusted net lend ing (+) or net bo rrow ing (-) 153
41. Cyc lic ally adjusted p rima ry ba lanc e 154
42. Gross deb t 154
Saving
43. Gross na tiona l saving 155
44. Gross saving of the priva te sec tor 155
45. Gross saving of genera l governme nt 156
Trade and interna tiona l payments46. Expo rts of good s and services 156
47. Imp orts of goo ds and service s 157
48. Merc ha nd ise trade ba lanc e (% of GDP) 157
49. Current ac count ba lanc e (% of GDP) 158
50. Net lend ing(+) or net borrowing (-) 158
51. Merc ha nd ise trade balanc e (billion Ec u/ euro) 159
52. Current ac count ba lanc e (billion Ec u/ euro) 159
53. Export ma rkets (go od s and service s) 160
54. Export performa nc e (go od s and service s) 160
World ec onom y55. World GDP 161
56. World exports of goo ds and services 162
57. Expo rt sha res (good s) in EU trade 162
58. World imports of goo ds and service s 163
59. Import sha res (goo ds) in EU trade 163
60. World mercha nd ise trad e ba lanc es (b illion USD) 164
61. World c urrent ac c ount ba lanc es (b illion USD) 164
62. Prima ry c om mo d ity p ric es 164
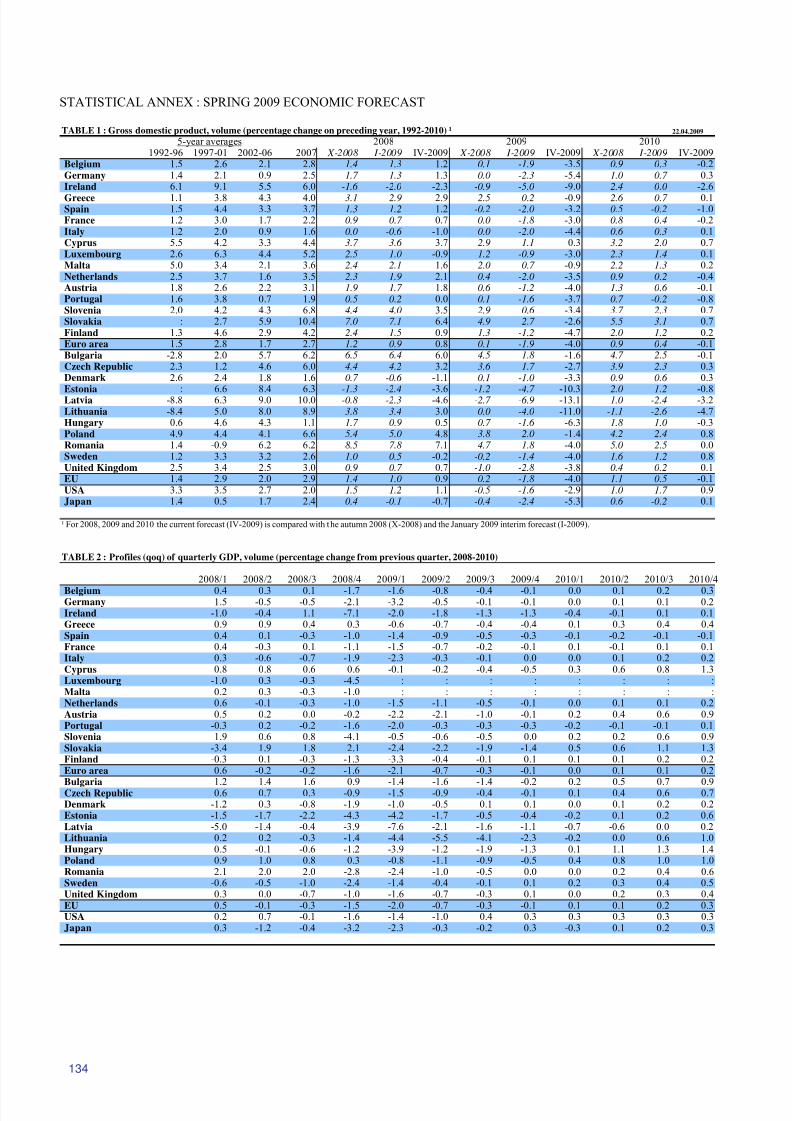
8/14/2019 Economic Forecast 2009
http://slidepdf.com/reader/full/economic-forecast-2009 140/172
134
STATISTICAL ANNEX : SPRING 2009 ECONOMIC FORECAST
TABLE 1 : Gross domestic product, volume (percentage change on preceding year, 1992-2010) ¹ 22.04.2009
5-year averages 2008 2009 20101992-96 1997-01 2002-06 2007 X-2008 I-2009 IV-2009 X-2008 I-2009 IV-2009 X-2008 I-2009 IV-2009
Belgium 1.5 2.6 2.1 2.8 1.4 1.3 1.2 0.1 -1.9 -3.5 0.9 0.3 -0.2Germany 1.4 2.1 0.9 2.5 1.7 1.3 1.3 0.0 -2.3 -5.4 1.0 0.7 0.3Ireland 6.1 9.1 5.5 6.0 -1.6 -2.0 -2.3 -0.9 -5.0 -9.0 2.4 0.0 -2.6
Greece 1.1 3.8 4.3 4.0 3.1 2.9 2.9 2.5 0.2 -0.9 2.6 0.7 0.1Spain 1.5 4.4 3.3 3.7 1.3 1.2 1.2 -0.2 -2.0 -3.2 0.5 -0.2 -1.0France 1.2 3.0 1.7 2.2 0.9 0.7 0.7 0.0 -1.8 -3.0 0.8 0.4 -0.2Italy 1.2 2.0 0.9 1.6 0.0 -0.6 -1.0 0.0 -2.0 -4.4 0.6 0.3 0.1Cyprus 5.5 4.2 3.3 4.4 3.7 3.6 3.7 2.9 1.1 0.3 3.2 2.0 0.7Luxembourg 2.6 6.3 4.4 5.2 2.5 1.0 -0.9 1.2 -0.9 -3.0 2.3 1.4 0.1Malta 5.0 3.4 2.1 3.6 2.4 2.1 1.6 2.0 0.7 -0.9 2.2 1.3 0.2Netherlands 2.5 3.7 1.6 3.5 2.3 1.9 2.1 0.4 -2.0 -3.5 0.9 0.2 -0.4Austria 1.8 2.6 2.2 3.1 1.9 1.7 1.8 0.6 -1.2 -4.0 1.3 0.6 -0.1Portugal 1.6 3.8 0.7 1.9 0.5 0.2 0.0 0.1 -1.6 -3.7 0.7 -0.2 -0.8Slovenia 2.0 4.2 4.3 6.8 4.4 4.0 3.5 2.9 0.6 -3.4 3.7 2.3 0.7Slovakia : 2.7 5.9 10.4 7.0 7.1 6.4 4.9 2.7 -2.6 5.5 3.1 0.7Finland 1.3 4.6 2.9 4.2 2.4 1.5 0.9 1.3 -1.2 -4.7 2.0 1.2 0.2Euro area 1.5 2.8 1.7 2.7 1.2 0.9 0.8 0.1 -1.9 -4.0 0.9 0.4 -0.1Bulgaria -2.8 2.0 5.7 6.2 6.5 6.4 6.0 4.5 1.8 -1.6 4.7 2.5 -0.1Czech Republic 2.3 1.2 4.6 6.0 4.4 4.2 3.2 3.6 1.7 -2.7 3.9 2.3 0.3Denmark 2.6 2.4 1.8 1.6 0.7 -0.6 -1.1 0.1 -1.0 -3.3 0.9 0.6 0.3
Estonia : 6.6 8.4 6.3 -1.3 -2.4 -3.6 -1.2 -4.7 -10.3 2.0 1.2 -0.8Latvia -8.8 6.3 9.0 10.0 -0.8 -2.3 -4.6 -2.7 -6.9 -13.1 1.0 -2.4 -3.2Lithuania -8.4 5.0 8.0 8.9 3.8 3.4 3.0 0.0 -4.0 -11.0 -1.1 -2.6 -4.7Hungary 0.6 4.6 4.3 1.1 1.7 0.9 0.5 0.7 -1.6 -6.3 1.8 1.0 -0.3Poland 4.9 4.4 4.1 6.6 5.4 5.0 4.8 3.8 2.0 -1.4 4.2 2.4 0.8Romania 1.4 -0.9 6.2 6.2 8.5 7.8 7.1 4.7 1.8 -4.0 5.0 2.5 0.0Sweden 1.2 3.3 3.2 2.6 1.0 0.5 -0.2 -0.2 -1.4 -4.0 1.6 1.2 0.8United Kingdom 2.5 3.4 2.5 3.0 0.9 0.7 0.7 -1.0 -2.8 -3.8 0.4 0.2 0.1EU 1.4 2.9 2.0 2.9 1.4 1.0 0.9 0.2 -1.8 -4.0 1.1 0.5 -0.1USA 3.3 3.5 2.7 2.0 1.5 1.2 1.1 -0.5 -1.6 -2.9 1.0 1.7 0.9Japan 1.4 0.5 1.7 2.4 0.4 -0.1 -0.7 -0.4 -2.4 -5.3 0.6 -0.2 0.1
¹ For 2008, 2009 and 2010 the current forecast (IV-2009) is compared with the autumn 2008 (X-2008) and the January 2009 interim forecast (I-2009).
TABLE 2 : Profiles (qoq) of quarterly GDP, volume (percentage change from previous quarter, 2008-2010)
2008/1 2008/2 2008/3 2008/4 2009/1 2009/2 2009/3 2009/4 2010/1 2010/2 2010/3 2010/4
Belgium 0.4 0.3 0.1 -1.7 -1.6 -0.8 -0.4 -0.1 0.0 0.1 0.2 0.3Germany 1.5 -0.5 -0.5 -2.1 -3.2 -0.5 -0.1 -0.1 0.0 0.1 0.1 0.2Ireland -1.0 -0.4 1.1 -7.1 -2.0 -1.8 -1.3 -1.3 -0.4 -0.1 0.1 0.1Greece 0.9 0.9 0.4 0.3 -0.6 -0.7 -0.4 -0.4 0.1 0.3 0.4 0.4Spain 0.4 0.1 -0.3 -1.0 -1.4 -0.9 -0.5 -0.3 -0.1 -0.2 -0.1 -0.1France 0.4 -0.3 0.1 -1.1 -1.5 -0.7 -0.2 -0.1 0.1 -0.1 0.1 0.1Italy 0.3 -0.6 -0.7 -1.9 -2.3 -0.3 -0.1 0.0 0.0 0.1 0.2 0.2Cyprus 0.8 0.8 0.6 0.6 -0.1 -0.2 -0.4 -0.5 0.3 0.6 0.8 1.3Luxembourg -1.0 0.3 -0.3 -4.5 : : : : : : : :Malta 0.2 0.3 -0.3 -1.0 : : : : : : : :Netherlands 0.6 -0.1 -0.3 -1.0 -1.5 -1.1 -0.5 -0.1 0.0 0.1 0.1 0.2Austria 0.5 0.2 0.0 -0.2 -2.2 -2.1 -1.0 -0.1 0.2 0.4 0.6 0.9Portugal -0.3 0.2 -0.2 -1.6 -2.0 -0.3 -0.3 -0.3 -0.2 -0.1 -0.1 0.1Slovenia 1.9 0.6 0.8 -4.1 -0.5 -0.6 -0.5 0.0 0.2 0.2 0.6 0.9Slovakia -3.4 1.9 1.8 2.1 -2.4 -2.2 -1.9 -1.4 0.5 0.6 1.1 1.3Finland -0.3 0.1 -0.3 -1.3 -3.3 -0.4 -0.1 0.1 0.1 0.1 0.2 0.2Euro area 0.6 -0.2 -0.2 -1.6 -2.1 -0.7 -0.3 -0.1 0.0 0.1 0.1 0.2
Bulgaria 1.2 1.4 1.6 0.9 -1.4 -1.6 -1.4 -0.2 0.2 0.5 0.7 0.9Czech Republic 0.6 0.7 0.3 -0.9 -1.5 -0.9 -0.4 -0.1 0.1 0.4 0.6 0.7Denmark -1.2 0.3 -0.8 -1.9 -1.0 -0.5 0.1 0.1 0.0 0.1 0.2 0.2Estonia -1.5 -1.7 -2.2 -4.3 -4.2 -1.7 -0.5 -0.4 -0.2 0.1 0.2 0.6Latvia -5.0 -1.4 -0.4 -3.9 -7.6 -2.1 -1.6 -1.1 -0.7 -0.6 0.0 0.2Lithuania 0.2 0.2 -0.3 -1.4 -4.4 -5.5 -4.1 -2.3 -0.2 0.0 0.6 1.0Hungary 0.5 -0.1 -0.6 -1.2 -3.9 -1.2 -1.9 -1.3 0.1 1.1 1.3 1.4Poland 0.9 1.0 0.8 0.3 -0.8 -1.1 -0.9 -0.5 0.4 0.8 1.0 1.0Romania 2.1 2.0 2.0 -2.8 -2.4 -1.0 -0.5 0.0 0.0 0.2 0.4 0.6Sweden -0.6 -0.5 -1.0 -2.4 -1.4 -0.4 -0.1 0.1 0.2 0.3 0.4 0.5United Kingdom 0.3 0.0 -0.7 -1.0 -1.6 -0.7 -0.3 0.1 0.0 0.2 0.3 0.4EU 0.5 -0.1 -0.3 -1.5 -2.0 -0.7 -0.3 -0.1 0.1 0.1 0.2 0.3USA 0.2 0.7 -0.1 -1.6 -1.4 -1.0 0.4 0.3 0.3 0.3 0.3 0.3Japan 0.3 -1.2 -0.4 -3.2 -2.3 -0.3 -0.2 0.3 -0.3 0.1 0.2 0.3
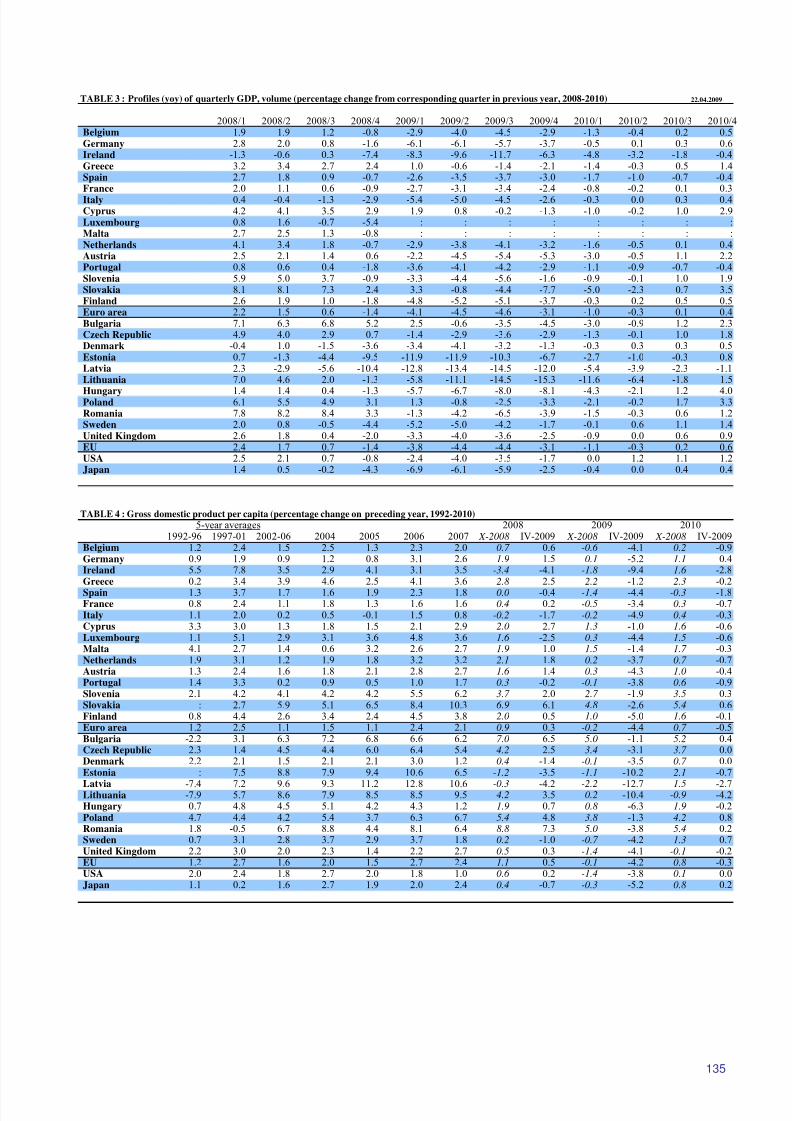
8/14/2019 Economic Forecast 2009
http://slidepdf.com/reader/full/economic-forecast-2009 141/172
135
TABLE 3 : Profiles (yoy) of quarterly GDP, volume (percentage change from corresponding quarter in previous year, 2008-2010) 22.04.2009
2008/1 2008/2 2008/3 2008/4 2009/1 2009/2 2009/3 2009/4 2010/1 2010/2 2010/3 2010/4Belgium 1.9 1.9 1.2 -0.8 -2.9 -4.0 -4.5 -2.9 -1.3 -0.4 0.2 0.5Germany 2.8 2.0 0.8 -1.6 -6.1 -6.1 -5.7 -3.7 -0.5 0.1 0.3 0.6Ireland -1.3 -0.6 0.3 -7.4 -8.3 -9.6 -11.7 -6.3 -4.8 -3.2 -1.8 -0.4Greece 3.2 3.4 2.7 2.4 1.0 -0.6 -1.4 -2.1 -1.4 -0.3 0.5 1.4Spain 2.7 1.8 0.9 -0.7 -2.6 -3.5 -3.7 -3.0 -1.7 -1.0 -0.7 -0.4France 2.0 1.1 0.6 -0.9 -2.7 -3.1 -3.4 -2.4 -0.8 -0.2 0.1 0.3Italy 0.4 -0.4 -1.3 -2.9 -5.4 -5.0 -4.5 -2.6 -0.3 0.0 0.3 0.4Cyprus 4.2 4.1 3.5 2.9 1.9 0.8 -0.2 -1.3 -1.0 -0.2 1.0 2.9Luxembourg 0.8 1.6 -0.7 -5.4 : : : : : : : :Malta 2.7 2.5 1.3 -0.8 : : : : : : : :Netherlands 4.1 3.4 1.8 -0.7 -2.9 -3.8 -4.1 -3.2 -1.6 -0.5 0.1 0.4Austria 2.5 2.1 1.4 0.6 -2.2 -4.5 -5.4 -5.3 -3.0 -0.5 1.1 2.2Portugal 0.8 0.6 0.4 -1.8 -3.6 -4.1 -4.2 -2.9 -1.1 -0.9 -0.7 -0.4Slovenia 5.9 5.0 3.7 -0.9 -3.3 -4.4 -5.6 -1.6 -0.9 -0.1 1.0 1.9Slovakia 8.1 8.1 7.3 2.4 3.3 -0.8 -4.4 -7.7 -5.0 -2.3 0.7 3.5Finland 2.6 1.9 1.0 -1.8 -4.8 -5.2 -5.1 -3.7 -0.3 0.2 0.5 0.5Euro area 2.2 1.5 0.6 -1.4 -4.1 -4.5 -4.6 -3.1 -1.0 -0.3 0.1 0.4Bulgaria 7.1 6.3 6.8 5.2 2.5 -0.6 -3.5 -4.5 -3.0 -0.9 1.2 2.3Czech Republic 4.9 4.0 2.9 0.7 -1.4 -2.9 -3.6 -2.9 -1.3 -0.1 1.0 1.8Denmark -0.4 1.0 -1.5 -3.6 -3.4 -4.1 -3.2 -1.3 -0.3 0.3 0.3 0.5Estonia 0.7 -1.3 -4.4 -9.5 -11.9 -11.9 -10.3 -6.7 -2.7 -1.0 -0.3 0.8Latvia 2.3 -2.9 -5.6 -10.4 -12.8 -13.4 -14.5 -12.0 -5.4 -3.9 -2.3 -1.1Lithuania 7.0 4.6 2.0 -1.3 -5.8 -11.1 -14.5 -15.3 -11.6 -6.4 -1.8 1.5
Hungary 1.4 1.4 0.4 -1.3 -5.7 -6.7 -8.0 -8.1 -4.3 -2.1 1.2 4.0Poland 6.1 5.5 4.9 3.1 1.3 -0.8 -2.5 -3.3 -2.1 -0.2 1.7 3.3Romania 7.8 8.2 8.4 3.3 -1.3 -4.2 -6.5 -3.9 -1.5 -0.3 0.6 1.2Sweden 2.0 0.8 -0.5 -4.4 -5.2 -5.0 -4.2 -1.7 -0.1 0.6 1.1 1.4United Kingdom 2.6 1.8 0.4 -2.0 -3.3 -4.0 -3.6 -2.5 -0.9 0.0 0.6 0.9EU 2.4 1.7 0.7 -1.4 -3.8 -4.4 -4.4 -3.1 -1.1 -0.3 0.2 0.6USA 2.5 2.1 0.7 -0.8 -2.4 -4.0 -3.5 -1.7 0.0 1.2 1.1 1.2Japan 1.4 0.5 -0.2 -4.3 -6.9 -6.1 -5.9 -2.5 -0.4 0.0 0.4 0.4
TABLE 4 : Gross domestic product per capita (percentage change on preceding year, 1992-2010)
5-year averages 2008 2009 20101992-96 1997-01 2002-06 2004 2005 2006 2007 X-2008 IV-2009 X-2008 IV-2009 X-2008 IV-2009
Belgium 1.2 2.4 1.5 2.5 1.3 2.3 2.0 0.7 0.6 -0.6 -4.1 0.2 -0.9Germany 0.9 1.9 0.9 1.2 0.8 3.1 2.6 1.9 1.5 0.1 -5.2 1.1 0.4Ireland 5.5 7.8 3.5 2.9 4.1 3.1 3.5 -3.4 -4.1 -1.8 -9.4 1.6 -2.8Greece 0.2 3.4 3.9 4.6 2.5 4.1 3.6 2.8 2.5 2.2 -1.2 2.3 -0.2Spain 1.3 3.7 1.7 1.6 1.9 2.3 1.8 0.0 -0.4 -1.4 -4.4 -0.3 -1.8France 0.8 2.4 1.1 1.8 1.3 1.6 1.6 0.4 0.2 -0.5 -3.4 0.3 -0.7Italy 1.1 2.0 0.2 0.5 -0.1 1.5 0.8 -0.2 -1.7 -0.2 -4.9 0.4 -0.3Cyprus 3.3 3.0 1.3 1.8 1.5 2.1 2.9 2.0 2.7 1.3 -1.0 1.6 -0.6Luxembourg 1.1 5.1 2.9 3.1 3.6 4.8 3.6 1.6 -2.5 0.3 -4.4 1.5 -0.6Malta 4.1 2.7 1.4 0.6 3.2 2.6 2.7 1.9 1.0 1.5 -1.4 1.7 -0.3Netherlands 1.9 3.1 1.2 1.9 1.8 3.2 3.2 2.1 1.8 0.2 -3.7 0.7 -0.7Austria 1.3 2.4 1.6 1.8 2.1 2.8 2.7 1.6 1.4 0.3 -4.3 1.0 -0.4Portugal 1.4 3.3 0.2 0.9 0.5 1.0 1.7 0.3 -0.2 -0.1 -3.8 0.6 -0.9Slovenia 2.1 4.2 4.1 4.2 4.2 5.5 6.2 3.7 2.0 2.7 -1.9 3.5 0.3Slovakia : 2.7 5.9 5.1 6.5 8.4 10.3 6.9 6.1 4.8 -2.6 5.4 0.6Finland 0.8 4.4 2.6 3.4 2.4 4.5 3.8 2.0 0.5 1.0 -5.0 1.6 -0.1Euro area 1.2 2.5 1.1 1.5 1.1 2.4 2.1 0.9 0.3 -0.2 -4.4 0.7 -0.5Bulgaria -2.2 3.1 6.3 7.2 6.8 6.6 6.2 7.0 6.5 5.0 -1.1 5.2 0.4Czech Republic 2.3 1.4 4.5 4.4 6.0 6.4 5.4 4.2 2.5 3.4 -3.1 3.7 0.0Denmark 2.2 2.1 1.5 2.1 2.1 3.0 1.2 0.4 -1.4 -0.1 -3.5 0.7 0.0Estonia : 7.5 8.8 7.9 9.4 10.6 6.5 -1.2 -3.5 -1.1 -10.2 2.1 -0.7
Latvia -7.4 7.2 9.6 9.3 11.2 12.8 10.6 -0.3 -4.2 -2.2 -12.7 1.5 -2.7Lithuania -7.9 5.7 8.6 7.9 8.5 8.5 9.5 4.2 3.5 0.2 -10.4 -0.9 -4.2Hungary 0.7 4.8 4.5 5.1 4.2 4.3 1.2 1.9 0.7 0.8 -6.3 1.9 -0.2Poland 4.7 4.4 4.2 5.4 3.7 6.3 6.7 5.4 4.8 3.8 -1.3 4.2 0.8Romania 1.8 -0.5 6.7 8.8 4.4 8.1 6.4 8.8 7.3 5.0 -3.8 5.4 0.2Sweden 0.7 3.1 2.8 3.7 2.9 3.7 1.8 0.2 -1.0 -0.7 -4.2 1.3 0.7United Kingdom 2.2 3.0 2.0 2.3 1.4 2.2 2.7 0.5 0.3 -1.4 -4.1 -0.1 -0.2EU 1.2 2.7 1.6 2.0 1.5 2.7 2.4 1.1 0.5 -0.1 -4.2 0.8 -0.3USA 2.0 2.4 1.8 2.7 2.0 1.8 1.0 0.6 0.2 -1.4 -3.8 0.1 0.0Japan 1.1 0.2 1.6 2.7 1.9 2.0 2.4 0.4 -0.7 -0.3 -5.2 0.8 0.2
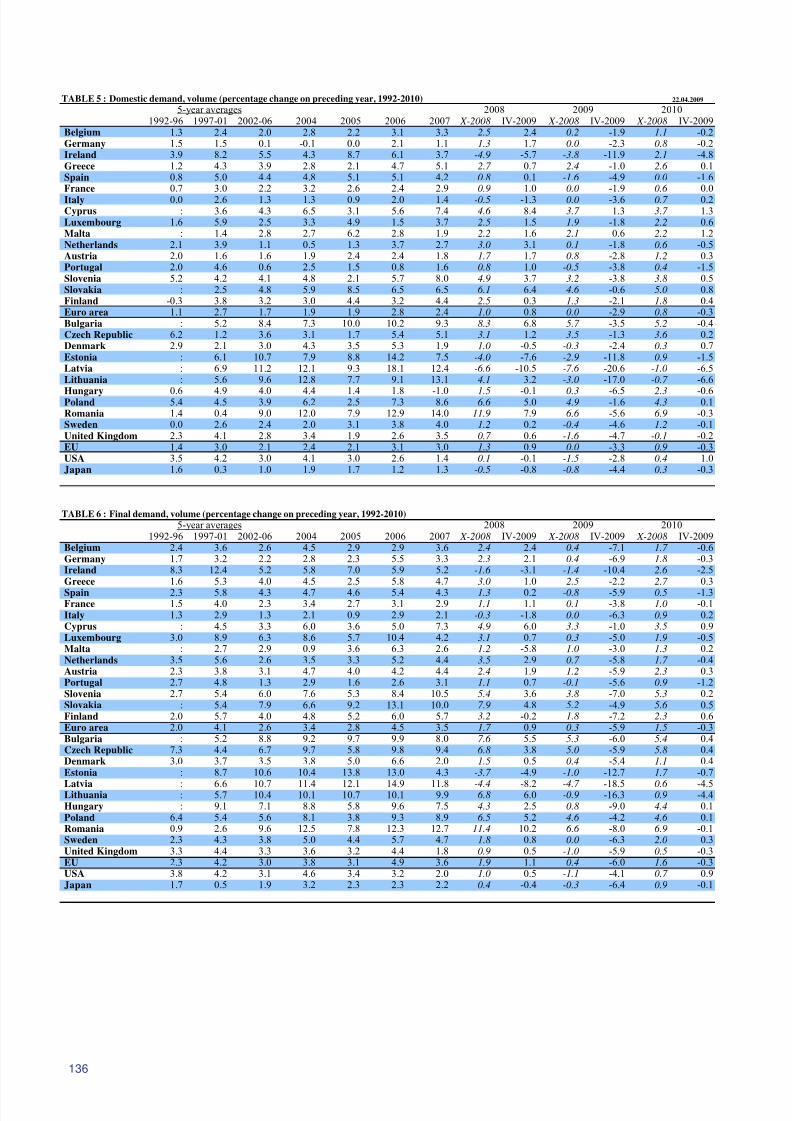
8/14/2019 Economic Forecast 2009
http://slidepdf.com/reader/full/economic-forecast-2009 142/172
136
TABLE 5 : Domestic demand, volume (percentage change on preceding year, 1992-2010) 22.04.2009
5-year averages 2008 2009 20101992-96 1997-01 2002-06 2004 2005 2006 2007 X-2008 IV-2009 X-2008 IV-2009 X-2008 IV-2009
Belgium 1.3 2.4 2.0 2.8 2.2 3.1 3.3 2.5 2.4 0.2 -1.9 1.1 -0.2Germany 1.5 1.5 0.1 -0.1 0.0 2.1 1.1 1.3 1.7 0.0 -2.3 0.8 -0.2Ireland 3.9 8.2 5.5 4.3 8.7 6.1 3.7 -4.9 -5.7 -3.8 -11.9 2.1 -4.8Greece 1.2 4.3 3.9 2.8 2.1 4.7 5.1 2.7 0.7 2.4 -1.0 2.6 0.1Spain 0.8 5.0 4.4 4.8 5.1 5.1 4.2 0.8 0.1 -1.6 -4.9 0.0 -1.6France 0.7 3.0 2.2 3.2 2.6 2.4 2.9 0.9 1.0 0.0 -1.9 0.6 0.0Italy 0.0 2.6 1.3 1.3 0.9 2.0 1.4 -0.5 -1.3 0.0 -3.6 0.7 0.2Cyprus : 3.6 4.3 6.5 3.1 5.6 7.4 4.6 8.4 3.7 1.3 3.7 1.3Luxembourg 1.6 5.9 2.5 3.3 4.9 1.5 3.7 2.5 1.5 1.9 -1.8 2.2 0.6Malta : 1.4 2.8 2.7 6.2 2.8 1.9 2.2 1.6 2.1 0.6 2.2 1.2Netherlands 2.1 3.9 1.1 0.5 1.3 3.7 2.7 3.0 3.1 0.1 -1.8 0.6 -0.5Austria 2.0 1.6 1.6 1.9 2.4 2.4 1.8 1.7 1.7 0.8 -2.8 1.2 0.3Portugal 2.0 4.6 0.6 2.5 1.5 0.8 1.6 0.8 1.0 -0.5 -3.8 0.4 -1.5Slovenia 5.2 4.2 4.1 4.8 2.1 5.7 8.0 4.9 3.7 3.2 -3.8 3.8 0.5Slovakia : 2.5 4.8 5.9 8.5 6.5 6.5 6.1 6.4 4.6 -0.6 5.0 0.8Finland -0.3 3.8 3.2 3.0 4.4 3.2 4.4 2.5 0.3 1.3 -2.1 1.8 0.4Euro area 1.1 2.7 1.7 1.9 1.9 2.8 2.4 1.0 0.8 0.0 -2.9 0.8 -0.3Bulgaria : 5.2 8.4 7.3 10.0 10.2 9.3 8.3 6.8 5.7 -3.5 5.2 -0.4Czech Republic 6.2 1.2 3.6 3.1 1.7 5.4 5.1 3.1 1.2 3.5 -1.3 3.6 0.2Denmark 2.9 2.1 3.0 4.3 3.5 5.3 1.9 1.0 -0.5 -0.3 -2.4 0.3 0.7Estonia : 6.1 10.7 7.9 8.8 14.2 7.5 -4.0 -7.6 -2.9 -11.8 0.9 -1.5Latvia : 6.9 11.2 12.1 9.3 18.1 12.4 -6.6 -10.5 -7.6 -20.6 -1.0 -6.5Lithuania : 5.6 9.6 12.8 7.7 9.1 13.1 4.1 3.2 -3.0 -17.0 -0.7 -6.6
Hungary 0.6 4.9 4.0 4.4 1.4 1.8 -1.0 1.5 -0.1 0.3 -6.5 2.3 -0.6Poland 5.4 4.5 3.9 6.2 2.5 7.3 8.6 6.6 5.0 4.9 -1.6 4.3 0.1Romania 1.4 0.4 9.0 12.0 7.9 12.9 14.0 11.9 7.9 6.6 -5.6 6.9 -0.3Sweden 0.0 2.6 2.4 2.0 3.1 3.8 4.0 1.2 0.2 -0.4 -4.6 1.2 -0.1United Kingdom 2.3 4.1 2.8 3.4 1.9 2.6 3.5 0.7 0.6 -1.6 -4.7 -0.1 -0.2EU 1.4 3.0 2.1 2.4 2.1 3.1 3.0 1.3 0.9 0.0 -3.3 0.9 -0.3USA 3.5 4.2 3.0 4.1 3.0 2.6 1.4 0.1 -0.1 -1.5 -2.8 0.4 1.0Japan 1.6 0.3 1.0 1.9 1.7 1.2 1.3 -0.5 -0.8 -0.8 -4.4 0.3 -0.3
TABLE 6 : Final demand, volume (percentage change on preceding year, 1992-2010)
5-year averages 2008 2009 20101992-96 1997-01 2002-06 2004 2005 2006 2007 X-2008 IV-2009 X-2008 IV-2009 X-2008 IV-2009
Belgium 2.4 3.6 2.6 4.5 2.9 2.9 3.6 2.4 2.4 0.4 -7.1 1.7 -0.6Germany 1.7 3.2 2.2 2.8 2.3 5.5 3.3 2.3 2.1 0.4 -6.9 1.8 -0.3Ireland 8.3 12.4 5.2 5.8 7.0 5.9 5.2 -1.6 -3.1 -1.4 -10.4 2.6 -2.5Greece 1.6 5.3 4.0 4.5 2.5 5.8 4.7 3.0 1.0 2.5 -2.2 2.7 0.3Spain 2.3 5.8 4.3 4.7 4.6 5.4 4.3 1.3 0.2 -0.8 -5.9 0.5 -1.3France 1.5 4.0 2.3 3.4 2.7 3.1 2.9 1.1 1.1 0.1 -3.8 1.0 -0.1Italy 1.3 2.9 1.3 2.1 0.9 2.9 2.1 -0.3 -1.8 0.0 -6.3 0.9 0.2Cyprus : 4.5 3.3 6.0 3.6 5.0 7.3 4.9 6.0 3.3 -1.0 3.5 0.9Luxembourg 3.0 8.9 6.3 8.6 5.7 10.4 4.2 3.1 0.7 0.3 -5.0 1.9 -0.5Malta : 2.7 2.9 0.9 3.6 6.3 2.6 1.2 -5.8 1.0 -3.0 1.3 0.2Netherlands 3.5 5.6 2.6 3.5 3.3 5.2 4.4 3.5 2.9 0.7 -5.8 1.7 -0.4Austria 2.3 3.8 3.1 4.7 4.0 4.2 4.4 2.4 1.9 1.2 -5.9 2.3 0.3Portugal 2.7 4.8 1.3 2.9 1.6 2.6 3.1 1.1 0.7 -0.1 -5.6 0.9 -1.2Slovenia 2.7 5.4 6.0 7.6 5.3 8.4 10.5 5.4 3.6 3.8 -7.0 5.3 0.2Slovakia : 5.4 7.9 6.6 9.2 13.1 10.0 7.9 4.8 5.2 -4.9 5.6 0.5Finland 2.0 5.7 4.0 4.8 5.2 6.0 5.7 3.2 -0.2 1.8 -7.2 2.3 0.6Euro area 2.0 4.1 2.6 3.4 2.8 4.5 3.5 1.7 0.9 0.3 -5.9 1.5 -0.3Bulgaria : 5.2 8.8 9.2 9.7 9.9 8.0 7.6 5.5 5.3 -6.0 5.4 0.4Czech Republic 7.3 4.4 6.7 9.7 5.8 9.8 9.4 6.8 3.8 5.0 -5.9 5.8 0.4Denmark 3.0 3.7 3.5 3.8 5.0 6.6 2.0 1.5 0.5 0.4 -5.4 1.1 0.4Estonia : 8.7 10.6 10.4 13.8 13.0 4.3 -3.7 -4.9 -1.0 -12.7 1.7 -0.7
Latvia : 6.6 10.7 11.4 12.1 14.9 11.8 -4.4 -8.2 -4.7 -18.5 0.6 -4.5Lithuania : 5.7 10.4 10.1 10.7 10.1 9.9 6.8 6.0 -0.9 -16.3 0.9 -4.4Hungary : 9.1 7.1 8.8 5.8 9.6 7.5 4.3 2.5 0.8 -9.0 4.4 0.1Poland 6.4 5.4 5.6 8.1 3.8 9.3 8.9 6.5 5.2 4.6 -4.2 4.6 0.1Romania 0.9 2.6 9.6 12.5 7.8 12.3 12.7 11.4 10.2 6.6 -8.0 6.9 -0.1Sweden 2.3 4.3 3.8 5.0 4.4 5.7 4.7 1.8 0.8 0.0 -6.3 2.0 0.3United Kingdom 3.3 4.4 3.3 3.6 3.2 4.4 1.8 0.9 0.5 -1.0 -5.9 0.5 -0.3EU 2.3 4.2 3.0 3.8 3.1 4.9 3.6 1.9 1.1 0.4 -6.0 1.6 -0.3USA 3.8 4.2 3.1 4.6 3.4 3.2 2.0 1.0 0.5 -1.1 -4.1 0.7 0.9Japan 1.7 0.5 1.9 3.2 2.3 2.3 2.2 0.4 -0.4 -0.3 -6.4 0.9 -0.1
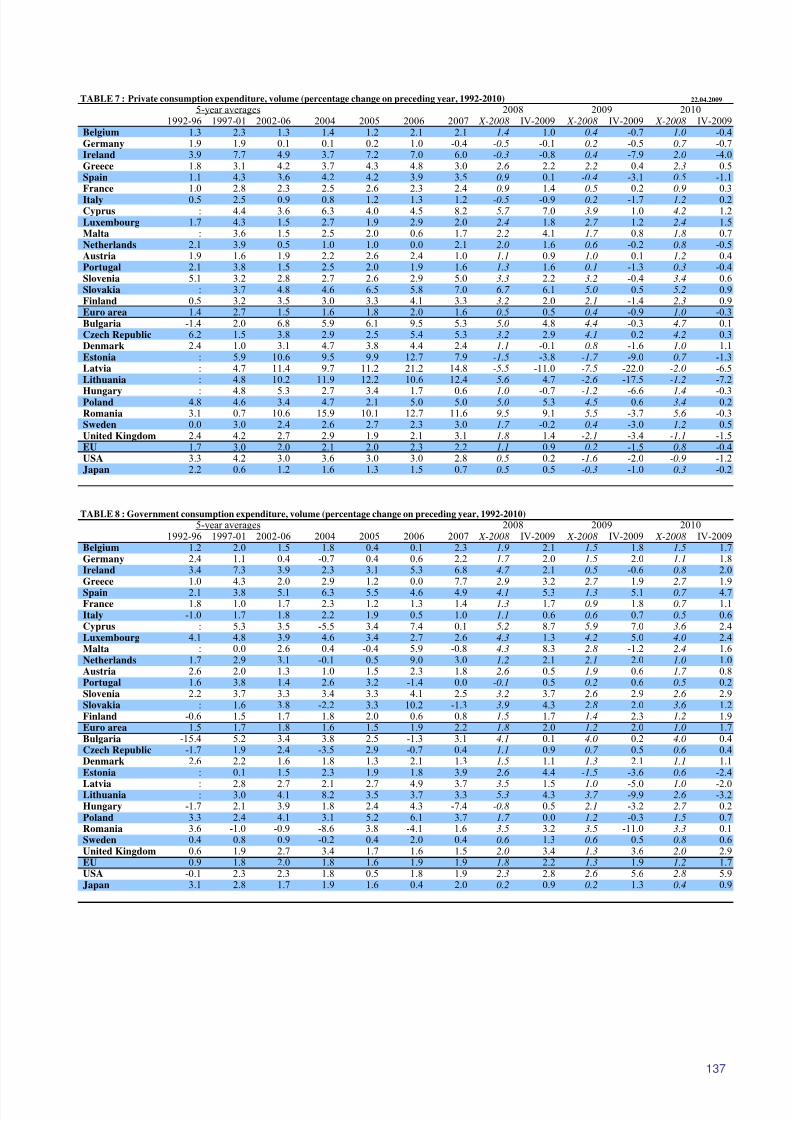
8/14/2019 Economic Forecast 2009
http://slidepdf.com/reader/full/economic-forecast-2009 143/172
137
TABLE 7 : Private consumption expenditure, volume (percentage change on preceding year, 1992-2010) 22.04.2009
5-year averages 2008 2009 20101992-96 1997-01 2002-06 2004 2005 2006 2007 X-2008 IV-2009 X-2008 IV-2009 X-2008 IV-2009
Belgium 1.3 2.3 1.3 1.4 1.2 2.1 2.1 1.4 1.0 0.4 -0.7 1.0 -0.4Germany 1.9 1.9 0.1 0.1 0.2 1.0 -0.4 -0.5 -0.1 0.2 -0.5 0.7 -0.7Ireland 3.9 7.7 4.9 3.7 7.2 7.0 6.0 -0.3 -0.8 0.4 -7.9 2.0 -4.0Greece 1.8 3.1 4.2 3.7 4.3 4.8 3.0 2.6 2.2 2.2 0.4 2.3 0.5Spain 1.1 4.3 3.6 4.2 4.2 3.9 3.5 0.9 0.1 -0.4 -3.1 0.5 -1.1France 1.0 2.8 2.3 2.5 2.6 2.3 2.4 0.9 1.4 0.5 0.2 0.9 0.3Italy 0.5 2.5 0.9 0.8 1.2 1.3 1.2 -0.5 -0.9 0.2 -1.7 1.2 0.2Cyprus : 4.4 3.6 6.3 4.0 4.5 8.2 5.7 7.0 3.9 1.0 4.2 1.2Luxembourg 1.7 4.3 1.5 2.7 1.9 2.9 2.0 2.4 1.8 2.7 1.2 2.4 1.5Malta : 3.6 1.5 2.5 2.0 0.6 1.7 2.2 4.1 1.7 0.8 1.8 0.7Netherlands 2.1 3.9 0.5 1.0 1.0 0.0 2.1 2.0 1.6 0.6 -0.2 0.8 -0.5Austria 1.9 1.6 1.9 2.2 2.6 2.4 1.0 1.1 0.9 1.0 0.1 1.2 0.4Portugal 2.1 3.8 1.5 2.5 2.0 1.9 1.6 1.3 1.6 0.1 -1.3 0.3 -0.4Slovenia 5.1 3.2 2.8 2.7 2.6 2.9 5.0 3.3 2.2 3.2 -0.4 3.4 0.6Slovakia : 3.7 4.8 4.6 6.5 5.8 7.0 6.7 6.1 5.0 0.5 5.2 0.9Finland 0.5 3.2 3.5 3.0 3.3 4.1 3.3 3.2 2.0 2.1 -1.4 2.3 0.9Euro area 1.4 2.7 1.5 1.6 1.8 2.0 1.6 0.5 0.5 0.4 -0.9 1.0 -0.3Bulgaria -1.4 2.0 6.8 5.9 6.1 9.5 5.3 5.0 4.8 4.4 -0.3 4.7 0.1Czech Republic 6.2 1.5 3.8 2.9 2.5 5.4 5.3 3.2 2.9 4.1 0.2 4.2 0.3Denmark 2.4 1.0 3.1 4.7 3.8 4.4 2.4 1.1 -0.1 0.8 -1.6 1.0 1.1Estonia : 5.9 10.6 9.5 9.9 12.7 7.9 -1.5 -3.8 -1.7 -9.0 0.7 -1.3Latvia : 4.7 11.4 9.7 11.2 21.2 14.8 -5.5 -11.0 -7.5 -22.0 -2.0 -6.5Lithuania : 4.8 10.2 11.9 12.2 10.6 12.4 5.6 4.7 -2.6 -17.5 -1.2 -7.2
Hungary : 4.8 5.3 2.7 3.4 1.7 0.6 1.0 -0.7 -1.2 -6.6 1.4 -0.3Poland 4.8 4.6 3.4 4.7 2.1 5.0 5.0 5.0 5.3 4.5 0.6 3.4 0.2Romania 3.1 0.7 10.6 15.9 10.1 12.7 11.6 9.5 9.1 5.5 -3.7 5.6 -0.3Sweden 0.0 3.0 2.4 2.6 2.7 2.3 3.0 1.7 -0.2 0.4 -3.0 1.2 0.5United Kingdom 2.4 4.2 2.7 2.9 1.9 2.1 3.1 1.8 1.4 -2.1 -3.4 -1.1 -1.5EU 1.7 3.0 2.0 2.1 2.0 2.3 2.2 1.1 0.9 0.2 -1.5 0.8 -0.4USA 3.3 4.2 3.0 3.6 3.0 3.0 2.8 0.5 0.2 -1.6 -2.0 -0.9 -1.2Japan 2.2 0.6 1.2 1.6 1.3 1.5 0.7 0.5 0.5 -0.3 -1.0 0.3 -0.2
TABLE 8 : Government consumption expenditure, volume (percentage change on preceding year, 1992-2010)
5-year averages 2008 2009 20101992-96 1997-01 2002-06 2004 2005 2006 2007 X-2008 IV-2009 X-2008 IV-2009 X-2008 IV-2009
Belgium 1.2 2.0 1.5 1.8 0.4 0.1 2.3 1.9 2.1 1.5 1.8 1.5 1.7Germany 2.4 1.1 0.4 -0.7 0.4 0.6 2.2 1.7 2.0 1.5 2.0 1.1 1.8Ireland 3.4 7.3 3.9 2.3 3.1 5.3 6.8 4.7 2.1 0.5 -0.6 0.8 2.0Greece 1.0 4.3 2.0 2.9 1.2 0.0 7.7 2.9 3.2 2.7 1.9 2.7 1.9Spain 2.1 3.8 5.1 6.3 5.5 4.6 4.9 4.1 5.3 1.3 5.1 0.7 4.7France 1.8 1.0 1.7 2.3 1.2 1.3 1.4 1.3 1.7 0.9 1.8 0.7 1.1Italy -1.0 1.7 1.8 2.2 1.9 0.5 1.0 1.1 0.6 0.6 0.7 0.5 0.6Cyprus : 5.3 3.5 -5.5 3.4 7.4 0.1 5.2 8.7 5.9 7.0 3.6 2.4Luxembourg 4.1 4.8 3.9 4.6 3.4 2.7 2.6 4.3 1.3 4.2 5.0 4.0 2.4Malta : 0.0 2.6 0.4 -0.4 5.9 -0.8 4.3 8.3 2.8 -1.2 2.4 1.6Netherlands 1.7 2.9 3.1 -0.1 0.5 9.0 3.0 1.2 2.1 2.1 2.0 1.0 1.0Austria 2.6 2.0 1.3 1.0 1.5 2.3 1.8 2.6 0.5 1.9 0.6 1.7 0.8Portugal 1.6 3.8 1.4 2.6 3.2 -1.4 0.0 -0.1 0.5 0.2 0.6 0.5 0.2Slovenia 2.2 3.7 3.3 3.4 3.3 4.1 2.5 3.2 3.7 2.6 2.9 2.6 2.9Slovakia : 1.6 3.8 -2.2 3.3 10.2 -1.3 3.9 4.3 2.8 2.0 3.6 1.2Finland -0.6 1.5 1.7 1.8 2.0 0.6 0.8 1.5 1.7 1.4 2.3 1.2 1.9Euro area 1.5 1.7 1.8 1.6 1.5 1.9 2.2 1.8 2.0 1.2 2.0 1.0 1.7Bulgaria -15.4 5.2 3.4 3.8 2.5 -1.3 3.1 4.1 0.1 4.0 0.2 4.0 0.4Czech Republic -1.7 1.9 2.4 -3.5 2.9 -0.7 0.4 1.1 0.9 0.7 0.5 0.6 0.4Denmark 2.6 2.2 1.6 1.8 1.3 2.1 1.3 1.5 1.1 1.3 2.1 1.1 1.1Estonia : 0.1 1.5 2.3 1.9 1.8 3.9 2.6 4.4 -1.5 -3.6 0.6 -2.4
Latvia : 2.8 2.7 2.1 2.7 4.9 3.7 3.5 1.5 1.0 -5.0 1.0 -2.0Lithuania : 3.0 4.1 8.2 3.5 3.7 3.3 5.3 4.3 3.7 -9.9 2.6 -3.2Hungary -1.7 2.1 3.9 1.8 2.4 4.3 -7.4 -0.8 0.5 2.1 -3.2 2.7 0.2Poland 3.3 2.4 4.1 3.1 5.2 6.1 3.7 1.7 0.0 1.2 -0.3 1.5 0.7Romania 3.6 -1.0 -0.9 -8.6 3.8 -4.1 1.6 3.5 3.2 3.5 -11.0 3.3 0.1Sweden 0.4 0.8 0.9 -0.2 0.4 2.0 0.4 0.6 1.3 0.6 0.5 0.8 0.6United Kingdom 0.6 1.9 2.7 3.4 1.7 1.6 1.5 2.0 3.4 1.3 3.6 2.0 2.9EU 0.9 1.8 2.0 1.8 1.6 1.9 1.9 1.8 2.2 1.3 1.9 1.2 1.7USA -0.1 2.3 2.3 1.8 0.5 1.8 1.9 2.3 2.8 2.6 5.6 2.8 5.9Japan 3.1 2.8 1.7 1.9 1.6 0.4 2.0 0.2 0.9 0.2 1.3 0.4 0.9
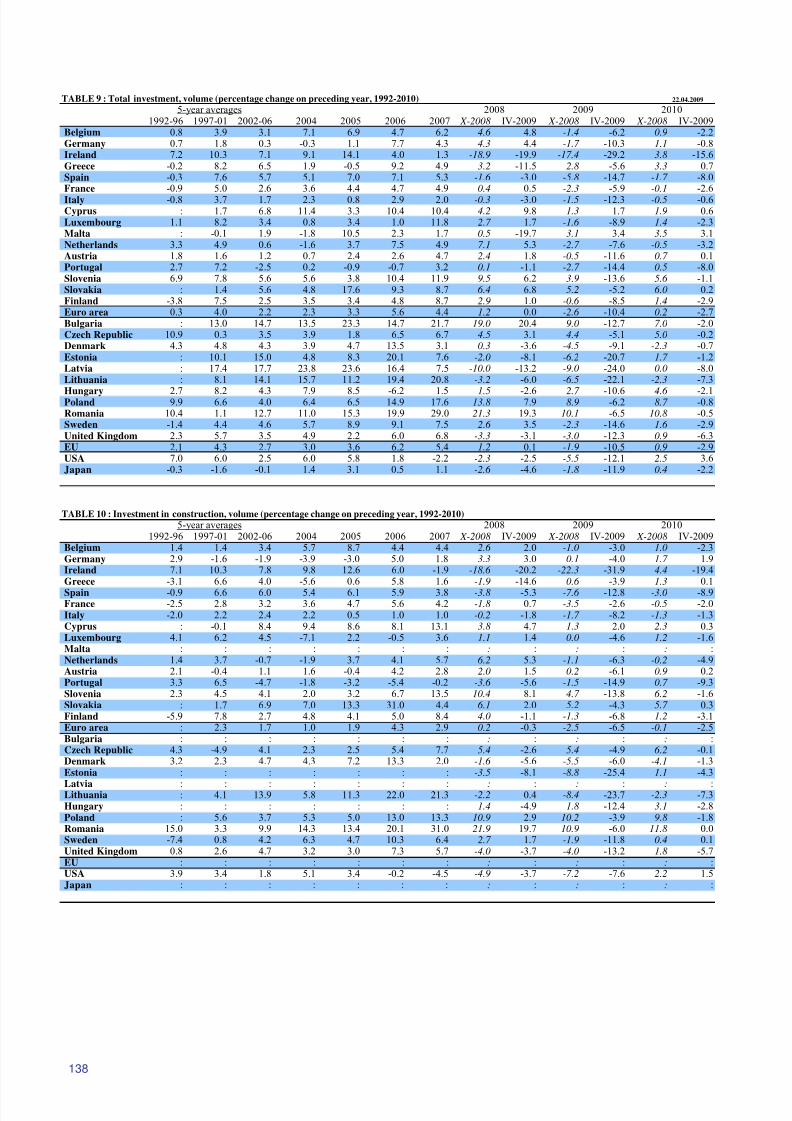
8/14/2019 Economic Forecast 2009
http://slidepdf.com/reader/full/economic-forecast-2009 144/172
138
TABLE 9 : Total investment, volume (percentage change on preceding year, 1992-2010) 22.04.2009
5-year averages 2008 2009 20101992-96 1997-01 2002-06 2004 2005 2006 2007 X-2008 IV-2009 X-2008 IV-2009 X-2008 IV-2009
Belgium 0.8 3.9 3.1 7.1 6.9 4.7 6.2 4.6 4.8 -1.4 -6.2 0.9 -2.2Germany 0.7 1.8 0.3 -0.3 1.1 7.7 4.3 4.3 4.4 -1.7 -10.3 1.1 -0.8Ireland 7.2 10.3 7.1 9.1 14.1 4.0 1.3 -18.9 -19.9 -17.4 -29.2 3.8 -15.6Greece -0.2 8.2 6.5 1.9 -0.5 9.2 4.9 3.2 -11.5 2.8 -5.6 3.3 0.7Spain -0.3 7.6 5.7 5.1 7.0 7.1 5.3 -1.6 -3.0 -5.8 -14.7 -1.7 -8.0France -0.9 5.0 2.6 3.6 4.4 4.7 4.9 0.4 0.5 -2.3 -5.9 -0.1 -2.6Italy -0.8 3.7 1.7 2.3 0.8 2.9 2.0 -0.3 -3.0 -1.5 -12.3 -0.5 -0.6Cyprus : 1.7 6.8 11.4 3.3 10.4 10.4 4.2 9.8 1.3 1.7 1.9 0.6Luxembourg 1.1 8.2 3.4 0.8 3.4 1.0 11.8 2.7 1.7 -1.6 -8.9 1.4 -2.3Malta : -0.1 1.9 -1.8 10.5 2.3 1.7 0.5 -19.7 3.1 3.4 3.5 3.1Netherlands 3.3 4.9 0.6 -1.6 3.7 7.5 4.9 7.1 5.3 -2.7 -7.6 -0.5 -3.2Austria 1.8 1.6 1.2 0.7 2.4 2.6 4.7 2.4 1.8 -0.5 -11.6 0.7 0.1Portugal 2.7 7.2 -2.5 0.2 -0.9 -0.7 3.2 0.1 -1.1 -2.7 -14.4 0.5 -8.0Slovenia 6.9 7.8 5.6 5.6 3.8 10.4 11.9 9.5 6.2 3.9 -13.6 5.6 -1.1Slovakia : 1.4 5.6 4.8 17.6 9.3 8.7 6.4 6.8 5.2 -5.2 6.0 0.2Finland -3.8 7.5 2.5 3.5 3.4 4.8 8.7 2.9 1.0 -0.6 -8.5 1.4 -2.9Euro area 0.3 4.0 2.2 2.3 3.3 5.6 4.4 1.2 0.0 -2.6 -10.4 0.2 -2.7Bulgaria : 13.0 14.7 13.5 23.3 14.7 21.7 19.0 20.4 9.0 -12.7 7.0 -2.0Czech Republic 10.9 0.3 3.5 3.9 1.8 6.5 6.7 4.5 3.1 4.4 -5.1 5.0 -0.2Denmark 4.3 4.8 4.3 3.9 4.7 13.5 3.1 0.3 -3.6 -4.5 -9.1 -2.3 -0.7Estonia : 10.1 15.0 4.8 8.3 20.1 7.6 -2.0 -8.1 -6.2 -20.7 1.7 -1.2Latvia : 17.4 17.7 23.8 23.6 16.4 7.5 -10.0 -13.2 -9.0 -24.0 0.0 -8.0Lithuania : 8.1 14.1 15.7 11.2 19.4 20.8 -3.2 -6.0 -6.5 -22.1 -2.3 -7.3
Hungary 2.7 8.2 4.3 7.9 8.5 -6.2 1.5 1.5 -2.6 2.7 -10.6 4.6 -2.1Poland 9.9 6.6 4.0 6.4 6.5 14.9 17.6 13.8 7.9 8.9 -6.2 8.7 -0.8Romania 10.4 1.1 12.7 11.0 15.3 19.9 29.0 21.3 19.3 10.1 -6.5 10.8 -0.5Sweden -1.4 4.4 4.6 5.7 8.9 9.1 7.5 2.6 3.5 -2.3 -14.6 1.6 -2.9United Kingdom 2.3 5.7 3.5 4.9 2.2 6.0 6.8 -3.3 -3.1 -3.0 -12.3 0.9 -6.3EU 2.1 4.3 2.7 3.0 3.6 6.2 5.4 1.2 0.1 -1.9 -10.5 0.9 -2.9USA 7.0 6.0 2.5 6.0 5.8 1.8 -2.2 -2.3 -2.5 -5.5 -12.1 2.5 3.6Japan -0.3 -1.6 -0.1 1.4 3.1 0.5 1.1 -2.6 -4.6 -1.8 -11.9 0.4 -2.2
TABLE 10 : Investment in construction, volume (percentage change on preceding year, 1992-2010)
5-year averages 2008 2009 20101992-96 1997-01 2002-06 2004 2005 2006 2007 X-2008 IV-2009 X-2008 IV-2009 X-2008 IV-2009
Belgium 1.4 1.4 3.4 5.7 8.7 4.4 4.4 2.6 2.0 -1.0 -3.0 1.0 -2.3Germany 2.9 -1.6 -1.9 -3.9 -3.0 5.0 1.8 3.3 3.0 0.1 -4.0 1.7 1.9Ireland 7.1 10.3 7.8 9.8 12.6 6.0 -1.9 -18.6 -20.2 -22.3 -31.9 4.4 -19.4Greece -3.1 6.6 4.0 -5.6 0.6 5.8 1.6 -1.9 -14.6 0.6 -3.9 1.3 0.1Spain -0.9 6.6 6.0 5.4 6.1 5.9 3.8 -3.8 -5.3 -7.6 -12.8 -3.0 -8.9France -2.5 2.8 3.2 3.6 4.7 5.6 4.2 -1.8 0.7 -3.5 -2.6 -0.5 -2.0Italy -2.0 2.2 2.4 2.2 0.5 1.0 1.0 -0.2 -1.8 -1.7 -8.2 -1.3 -1.3Cyprus : -0.1 8.4 9.4 8.6 8.1 13.1 3.8 4.7 1.3 2.0 2.3 0.3Luxembourg 4.1 6.2 4.5 -7.1 2.2 -0.5 3.6 1.1 1.4 0.0 -4.6 1.2 -1.6Malta : : : : : : : : : : : : :Netherlands 1.4 3.7 -0.7 -1.9 3.7 4.1 5.7 6.2 5.3 -1.1 -6.3 -0.2 -4.9Austria 2.1 -0.4 1.1 1.6 -0.4 4.2 2.8 2.0 1.5 0.2 -6.1 0.9 0.2Portugal 3.3 6.5 -4.7 -1.8 -3.2 -5.4 -0.2 -3.6 -5.6 -1.5 -14.9 0.7 -9.3Slovenia 2.3 4.5 4.1 2.0 3.2 6.7 13.5 10.4 8.1 4.7 -13.8 6.2 -1.6Slovakia : 1.7 6.9 7.0 13.3 31.0 4.4 6.1 2.0 5.2 -4.3 5.7 0.3Finland -5.9 7.8 2.7 4.8 4.1 5.0 8.4 4.0 -1.1 -1.3 -6.8 1.2 -3.1Euro area : 2.3 1.7 1.0 1.9 4.3 2.9 0.2 -0.3 -2.5 -6.5 -0.1 -2.5Bulgaria : : : : : : : : : : : : :Czech Republic 4.3 -4.9 4.1 2.3 2.5 5.4 7.7 5.4 -2.6 5.4 -4.9 6.2 -0.1Denmark 3.2 2.3 4.7 4.3 7.2 13.3 2.0 -1.6 -5.6 -5.5 -6.0 -4.1 -1.3Estonia : : : : : : : -3.5 -8.1 -8.8 -25.4 1.1 -4.3
Latvia : : : : : : : : : : : : :Lithuania : 4.1 13.9 5.8 11.3 22.0 21.3 -2.2 0.4 -8.4 -23.7 -2.3 -7.3Hungary : : : : : : : 1.4 -4.9 1.8 -12.4 3.1 -2.8Poland : 5.6 3.7 5.3 5.0 13.0 13.3 10.9 2.9 10.2 -3.9 9.8 -1.8Romania 15.0 3.3 9.9 14.3 13.4 20.1 31.0 21.9 19.7 10.9 -6.0 11.8 0.0Sweden -7.4 0.8 4.2 6.3 4.7 10.3 6.4 2.7 1.7 -1.9 -11.8 0.4 0.1United Kingdom 0.8 2.6 4.7 3.2 3.0 7.3 5.7 -4.0 -3.7 -4.0 -13.2 1.8 -5.7EU : : : : : : : : : : : : :USA 3.9 3.4 1.8 5.1 3.4 -0.2 -4.5 -4.9 -3.7 -7.2 -7.6 2.2 1.5Japan : : : : : : : : : : : : :
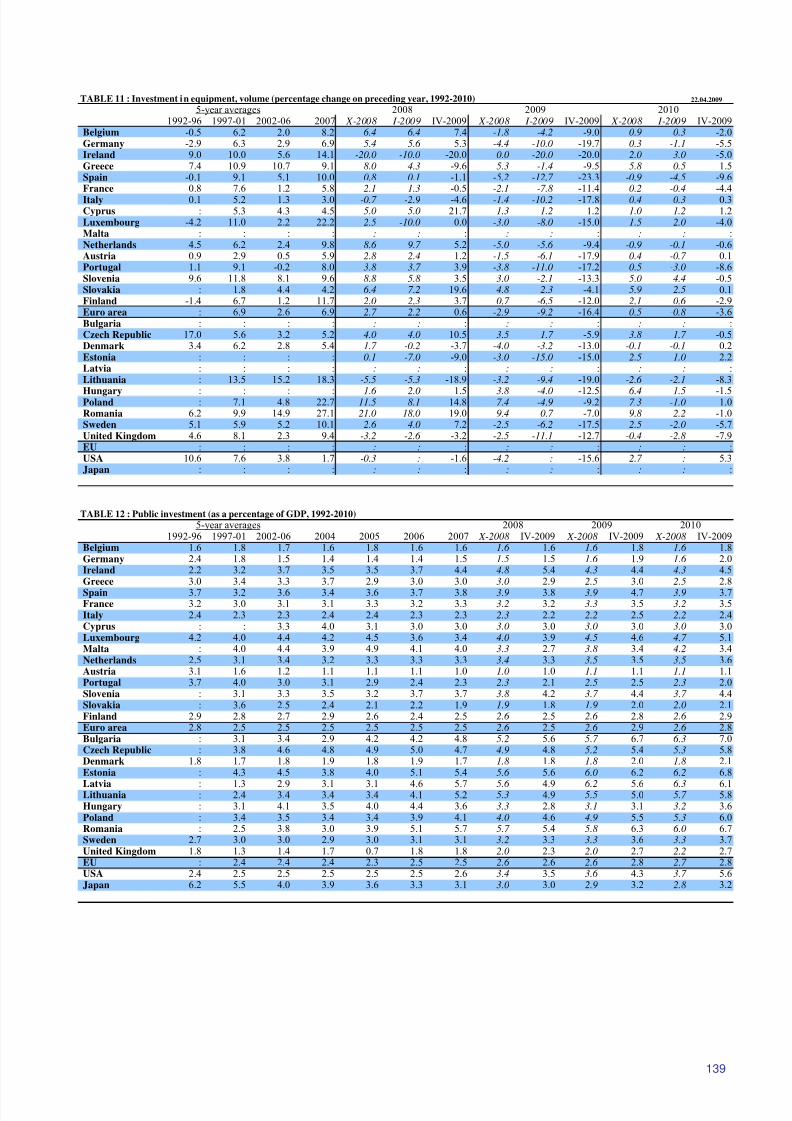
8/14/2019 Economic Forecast 2009
http://slidepdf.com/reader/full/economic-forecast-2009 145/172
139
TABLE 11 : Investment in equipment, volume (percentage change on preceding year, 1992-2010) 22.04.2009
5-year averages 2008 2009 20101992-96 1997-01 2002-06 2007 X-2008 I-2009 IV-2009 X-2008 I-2009 IV-2009 X-2008 I-2009 IV-2009
Belgium -0.5 6.2 2.0 8.2 6.4 6.4 7.4 -1.8 -4.2 -9.0 0.9 0.3 -2.0Germany -2.9 6.3 2.9 6.9 5.4 5.6 5.3 -4.4 -10.0 -19.7 0.3 -1.1 -5.5Ireland 9.0 10.0 5.6 14.1 -20.0 -10.0 -20.0 0.0 -20.0 -20.0 2.0 3.0 -5.0Greece 7.4 10.9 10.7 9.1 8.0 4.3 -9.6 5.3 -1.4 -9.5 5.8 0.5 1.5Spain -0.1 9.1 5.1 10.0 0.8 0.1 -1.1 -5.2 -12.7 -23.3 -0.9 -4.5 -9.6France 0.8 7.6 1.2 5.8 2.1 1.3 -0.5 -2.1 -7.8 -11.4 0.2 -0.4 -4.4Italy 0.1 5.2 1.3 3.0 -0.7 -2.9 -4.6 -1.4 -10.2 -17.8 0.4 0.3 0.3Cyprus : 5.3 4.3 4.5 5.0 5.0 21.7 1.3 1.2 1.2 1.0 1.2 1.2Luxembourg -4.2 11.0 2.2 22.2 2.5 -10.0 0.0 -3.0 -8.0 -15.0 1.5 2.0 -4.0Malta : : : : : : : : : : : : :Netherlands 4.5 6.2 2.4 9.8 8.6 9.7 5.2 -5.0 -5.6 -9.4 -0.9 -0.1 -0.6Austria 0.9 2.9 0.5 5.9 2.8 2.4 1.2 -1.5 -6.1 -17.9 0.4 -0.7 0.1Portugal 1.1 9.1 -0.2 8.0 3.8 3.7 3.9 -3.8 -11.0 -17.2 0.5 -3.0 -8.6Slovenia 9.6 11.8 8.1 9.6 8.8 5.8 3.5 3.0 -2.1 -13.3 5.0 4.4 -0.5Slovakia : 1.8 4.4 4.2 6.4 7.2 19.6 4.8 2.3 -4.1 5.9 2.5 0.1Finland -1.4 6.7 1.2 11.7 2.0 2.3 3.7 0.7 -6.5 -12.0 2.1 0.6 -2.9Euro area : 6.9 2.6 6.9 2.7 2.2 0.6 -2.9 -9.2 -16.4 0.5 -0.8 -3.6Bulgaria : : : : : : : : : : : : :Czech Republic 17.0 5.6 3.2 5.2 4.0 4.0 10.5 3.5 1.7 -5.9 3.8 1.7 -0.5Denmark 3.4 6.2 2.8 5.4 1.7 -0.2 -3.7 -4.0 -3.2 -13.0 -0.1 -0.1 0.2Estonia : : : : 0.1 -7.0 -9.0 -3.0 -15.0 -15.0 2.5 1.0 2.2Latvia : : : : : : : : : : : : :Lithuania : 13.5 15.2 18.3 -5.5 -5.3 -18.9 -3.2 -9.4 -19.0 -2.6 -2.1 -8.3
Hungary : : : : 1.6 2.0 1.5 3.8 -4.0 -12.5 6.4 1.5 -1.5Poland : 7.1 4.8 22.7 11.5 8.1 14.8 7.4 -4.9 -9.2 7.3 -1.0 1.0Romania 6.2 9.9 14.9 27.1 21.0 18.0 19.0 9.4 0.7 -7.0 9.8 2.2 -1.0Sweden 5.1 5.9 5.2 10.1 2.6 4.0 7.2 -2.5 -6.2 -17.5 2.5 -2.0 -5.7United Kingdom 4.6 8.1 2.3 9.4 -3.2 -2.6 -3.2 -2.5 -11.1 -12.7 -0.4 -2.8 -7.9EU : : : : : : : : : : : : :USA 10.6 7.6 3.8 1.7 -0.3 : -1.6 -4.2 : -15.6 2.7 : 5.3Japan : : : : : : : : : : : : :
TABLE 12 : Public investment (as a percentage of GDP, 1992-2010)
5-year averages 2008 2009 20101992-96 1997-01 2002-06 2004 2005 2006 2007 X-2008 IV-2009 X-2008 IV-2009 X-2008 IV-2009
Belgium 1.6 1.8 1.7 1.6 1.8 1.6 1.6 1.6 1.6 1.6 1.8 1.6 1.8Germany 2.4 1.8 1.5 1.4 1.4 1.4 1.5 1.5 1.5 1.6 1.9 1.6 2.0Ireland 2.2 3.2 3.7 3.5 3.5 3.7 4.4 4.8 5.4 4.3 4.4 4.3 4.5Greece 3.0 3.4 3.3 3.7 2.9 3.0 3.0 3.0 2.9 2.5 3.0 2.5 2.8Spain 3.7 3.2 3.6 3.4 3.6 3.7 3.8 3.9 3.8 3.9 4.7 3.9 3.7France 3.2 3.0 3.1 3.1 3.3 3.2 3.3 3.2 3.2 3.3 3.5 3.2 3.5Italy 2.4 2.3 2.3 2.4 2.4 2.3 2.3 2.3 2.2 2.2 2.5 2.2 2.4Cyprus : : 3.3 4.0 3.1 3.0 3.0 3.0 3.0 3.0 3.0 3.0 3.0Luxembourg 4.2 4.0 4.4 4.2 4.5 3.6 3.4 4.0 3.9 4.5 4.6 4.7 5.1Malta : 4.0 4.4 3.9 4.9 4.1 4.0 3.3 2.7 3.8 3.4 4.2 3.4Netherlands 2.5 3.1 3.4 3.2 3.3 3.3 3.3 3.4 3.3 3.5 3.5 3.5 3.6Austria 3.1 1.6 1.2 1.1 1.1 1.1 1.0 1.0 1.0 1.1 1.1 1.1 1.1Portugal 3.7 4.0 3.0 3.1 2.9 2.4 2.3 2.3 2.1 2.5 2.5 2.3 2.0Slovenia : 3.1 3.3 3.5 3.2 3.7 3.7 3.8 4.2 3.7 4.4 3.7 4.4Slovakia : 3.6 2.5 2.4 2.1 2.2 1.9 1.9 1.8 1.9 2.0 2.0 2.1Finland 2.9 2.8 2.7 2.9 2.6 2.4 2.5 2.6 2.5 2.6 2.8 2.6 2.9Euro area 2.8 2.5 2.5 2.5 2.5 2.5 2.5 2.6 2.5 2.6 2.9 2.6 2.8Bulgaria : 3.1 3.4 2.9 4.2 4.2 4.8 5.2 5.6 5.7 6.7 6.3 7.0Czech Republic : 3.8 4.6 4.8 4.9 5.0 4.7 4.9 4.8 5.2 5.4 5.3 5.8Denmark 1.8 1.7 1.8 1.9 1.8 1.9 1.7 1.8 1.8 1.8 2.0 1.8 2.1Estonia : 4.3 4.5 3.8 4.0 5.1 5.4 5.6 5.6 6.0 6.2 6.2 6.8
Latvia : 1.3 2.9 3.1 3.1 4.6 5.7 5.6 4.9 6.2 5.6 6.3 6.1Lithuania : 2.4 3.4 3.4 3.4 4.1 5.2 5.3 4.9 5.5 5.0 5.7 5.8Hungary : 3.1 4.1 3.5 4.0 4.4 3.6 3.3 2.8 3.1 3.1 3.2 3.6Poland : 3.4 3.5 3.4 3.4 3.9 4.1 4.0 4.6 4.9 5.5 5.3 6.0Romania : 2.5 3.8 3.0 3.9 5.1 5.7 5.7 5.4 5.8 6.3 6.0 6.7Sweden 2.7 3.0 3.0 2.9 3.0 3.1 3.1 3.2 3.3 3.3 3.6 3.3 3.7United Kingdom 1.8 1.3 1.4 1.7 0.7 1.8 1.8 2.0 2.3 2.0 2.7 2.2 2.7EU : 2.4 2.4 2.4 2.3 2.5 2.5 2.6 2.6 2.6 2.8 2.7 2.8USA 2.4 2.5 2.5 2.5 2.5 2.5 2.6 3.4 3.5 3.6 4.3 3.7 5.6Japan 6.2 5.5 4.0 3.9 3.6 3.3 3.1 3.0 3.0 2.9 3.2 2.8 3.2
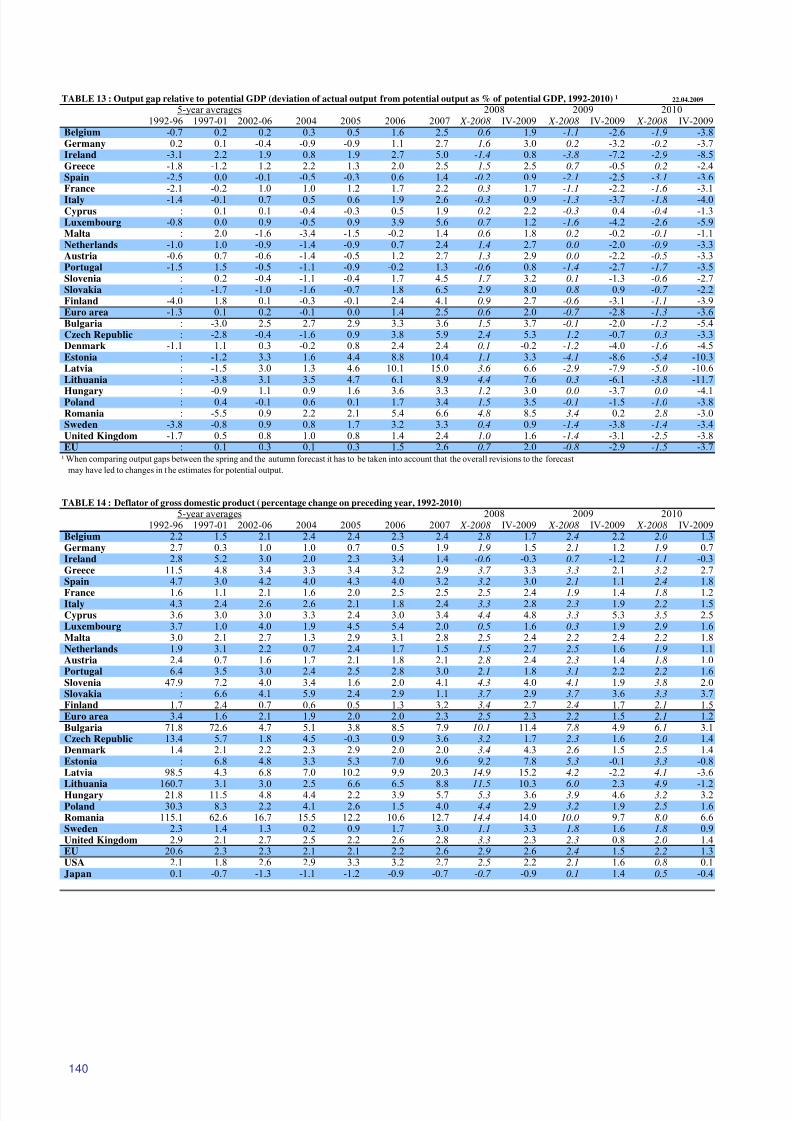
8/14/2019 Economic Forecast 2009
http://slidepdf.com/reader/full/economic-forecast-2009 146/172
140
TABLE 13 : Output gap relative to potential GDP (deviation of actual output from potential output as % of potential GDP, 1992-2010) ¹ 22.04.2009
5-year averages 2008 2009 20101992-96 1997-01 2002-06 2004 2005 2006 2007 X-2008 IV-2009 X-2008 IV-2009 X-2008 IV-2009
Belgium -0.7 0.2 0.2 0.3 0.5 1.6 2.5 0.6 1.9 -1.1 -2.6 -1.9 -3.8Germany 0.2 0.1 -0.4 -0.9 -0.9 1.1 2.7 1.6 3.0 0.2 -3.2 -0.2 -3.7Ireland -3.1 2.2 1.9 0.8 1.9 2.7 5.0 -1.4 0.8 -3.8 -7.2 -2.9 -8.5Greece -1.8 -1.2 1.2 2.2 1.3 2.0 2.5 1.5 2.5 0.7 -0.5 0.2 -2.4Spain -2.5 0.0 -0.1 -0.5 -0.3 0.6 1.4 -0.2 0.9 -2.1 -2.5 -3.1 -3.6France -2.1 -0.2 1.0 1.0 1.2 1.7 2.2 0.3 1.7 -1.1 -2.2 -1.6 -3.1Italy -1.4 -0.1 0.7 0.5 0.6 1.9 2.6 -0.3 0.9 -1.3 -3.7 -1.8 -4.0Cyprus : 0.1 0.1 -0.4 -0.3 0.5 1.9 0.2 2.2 -0.3 0.4 -0.4 -1.3Luxembourg -0.8 0.0 0.9 -0.5 0.9 3.9 5.6 0.7 1.2 -1.6 -4.2 -2.6 -5.9Malta : 2.0 -1.6 -3.4 -1.5 -0.2 1.4 0.6 1.8 0.2 -0.2 -0.1 -1.1Netherlands -1.0 1.0 -0.9 -1.4 -0.9 0.7 2.4 1.4 2.7 0.0 -2.0 -0.9 -3.3Austria -0.6 0.7 -0.6 -1.4 -0.5 1.2 2.7 1.3 2.9 0.0 -2.2 -0.5 -3.3Portugal -1.5 1.5 -0.5 -1.1 -0.9 -0.2 1.3 -0.6 0.8 -1.4 -2.7 -1.7 -3.5Slovenia : 0.2 -0.4 -1.1 -0.4 1.7 4.5 1.7 3.2 0.1 -1.3 -0.6 -2.7Slovakia : -1.7 -1.0 -1.6 -0.7 1.8 6.5 2.9 8.0 0.8 0.9 -0.7 -2.2Finland -4.0 1.8 0.1 -0.3 -0.1 2.4 4.1 0.9 2.7 -0.6 -3.1 -1.1 -3.9Euro area -1.3 0.1 0.2 -0.1 0.0 1.4 2.5 0.6 2.0 -0.7 -2.8 -1.3 -3.6Bulgaria : -3.0 2.5 2.7 2.9 3.3 3.6 1.5 3.7 -0.1 -2.0 -1.2 -5.4Czech Republic : -2.8 -0.4 -1.6 0.9 3.8 5.9 2.4 5.3 1.2 -0.7 0.3 -3.3Denmark -1.1 1.1 0.3 -0.2 0.8 2.4 2.4 0.1 -0.2 -1.2 -4.0 -1.6 -4.5Estonia : -1.2 3.3 1.6 4.4 8.8 10.4 1.1 3.3 -4.1 -8.6 -5.4 -10.3Latvia : -1.5 3.0 1.3 4.6 10.1 15.0 3.6 6.6 -2.9 -7.9 -5.0 -10.6Lithuania : -3.8 3.1 3.5 4.7 6.1 8.9 4.4 7.6 0.3 -6.1 -3.8 -11.7
Hungary : -0.9 1.1 0.9 1.6 3.6 3.3 1.2 3.0 0.0 -3.7 0.0 -4.1Poland : 0.4 -0.1 0.6 0.1 1.7 3.4 1.5 3.5 -0.1 -1.5 -1.0 -3.8Romania : -5.5 0.9 2.2 2.1 5.4 6.6 4.8 8.5 3.4 0.2 2.8 -3.0Sweden -3.8 -0.8 0.9 0.8 1.7 3.2 3.3 0.4 0.9 -1.4 -3.8 -1.4 -3.4United Kingdom -1.7 0.5 0.8 1.0 0.8 1.4 2.4 1.0 1.6 -1.4 -3.1 -2.5 -3.8EU : 0.1 0.3 0.1 0.3 1.5 2.6 0.7 2.0 -0.8 -2.9 -1.5 -3.7
¹ When comparing output gaps between the spring and the autumn forecast it has to be taken into account that the overall revisions to the forecast
may have led to changes in the estimates for potential output.
TABLE 14 : Deflator of gross domestic product (percentage change on preceding year, 1992-2010)
5-year averages 2008 2009 20101992-96 1997-01 2002-06 2004 2005 2006 2007 X-2008 IV-2009 X-2008 IV-2009 X-2008 IV-2009
Belgium 2.2 1.5 2.1 2.4 2.4 2.3 2.4 2.8 1.7 2.4 2.2 2.0 1.3Germany 2.7 0.3 1.0 1.0 0.7 0.5 1.9 1.9 1.5 2.1 1.2 1.9 0.7Ireland 2.8 5.2 3.0 2.0 2.3 3.4 1.4 -0.6 -0.3 0.7 -1.2 1.1 -0.3Greece 11.5 4.8 3.4 3.3 3.4 3.2 2.9 3.7 3.3 3.3 2.1 3.2 2.7Spain 4.7 3.0 4.2 4.0 4.3 4.0 3.2 3.2 3.0 2.1 1.1 2.4 1.8France 1.6 1.1 2.1 1.6 2.0 2.5 2.5 2.5 2.4 1.9 1.4 1.8 1.2Italy 4.3 2.4 2.6 2.6 2.1 1.8 2.4 3.3 2.8 2.3 1.9 2.2 1.5Cyprus 3.6 3.0 3.0 3.3 2.4 3.0 3.4 4.4 4.8 3.3 5.3 3.5 2.5Luxembourg 3.7 1.0 4.0 1.9 4.5 5.4 2.0 0.5 1.6 0.3 1.9 2.9 1.6Malta 3.0 2.1 2.7 1.3 2.9 3.1 2.8 2.5 2.4 2.2 2.4 2.2 1.8Netherlands 1.9 3.1 2.2 0.7 2.4 1.7 1.5 1.5 2.7 2.5 1.6 1.9 1.1Austria 2.4 0.7 1.6 1.7 2.1 1.8 2.1 2.8 2.4 2.3 1.4 1.8 1.0Portugal 6.4 3.5 3.0 2.4 2.5 2.8 3.0 2.1 1.8 3.1 2.2 2.2 1.6Slovenia 47.9 7.2 4.0 3.4 1.6 2.0 4.1 4.3 4.0 4.1 1.9 3.8 2.0Slovakia : 6.6 4.1 5.9 2.4 2.9 1.1 3.7 2.9 3.7 3.6 3.3 3.7Finland 1.7 2.4 0.7 0.6 0.5 1.3 3.2 3.4 2.7 2.4 1.7 2.1 1.5Euro area 3.4 1.6 2.1 1.9 2.0 2.0 2.3 2.5 2.3 2.2 1.5 2.1 1.2Bulgaria 71.8 72.6 4.7 5.1 3.8 8.5 7.9 10.1 11.4 7.8 4.9 6.1 3.1Czech Republic 13.4 5.7 1.8 4.5 -0.3 0.9 3.6 3.2 1.7 2.3 1.6 2.0 1.4Denmark 1.4 2.1 2.2 2.3 2.9 2.0 2.0 3.4 4.3 2.6 1.5 2.5 1.4Estonia : 6.8 4.8 3.3 5.3 7.0 9.6 9.2 7.8 5.3 -0.1 3.3 -0.8Latvia 98.5 4.3 6.8 7.0 10.2 9.9 20.3 14.9 15.2 4.2 -2.2 4.1 -3.6
Lithuania 160.7 3.1 3.0 2.5 6.6 6.5 8.8 11.5 10.3 6.0 2.3 4.9 -1.2Hungary 21.8 11.5 4.8 4.4 2.2 3.9 5.7 5.3 3.6 3.9 4.6 3.2 3.2Poland 30.3 8.3 2.2 4.1 2.6 1.5 4.0 4.4 2.9 3.2 1.9 2.5 1.6Romania 115.1 62.6 16.7 15.5 12.2 10.6 12.7 14.4 14.0 10.0 9.7 8.0 6.6Sweden 2.3 1.4 1.3 0.2 0.9 1.7 3.0 1.1 3.3 1.8 1.6 1.8 0.9United Kingdom 2.9 2.1 2.7 2.5 2.2 2.6 2.8 3.3 2.3 2.3 0.8 2.0 1.4EU 20.6 2.3 2.3 2.1 2.1 2.2 2.6 2.9 2.6 2.4 1.5 2.2 1.3USA 2.1 1.8 2.6 2.9 3.3 3.2 2.7 2.5 2.2 2.1 1.6 0.8 0.1Japan 0.1 -0.7 -1.3 -1.1 -1.2 -0.9 -0.7 -0.7 -0.9 0.1 1.4 0.5 -0.4
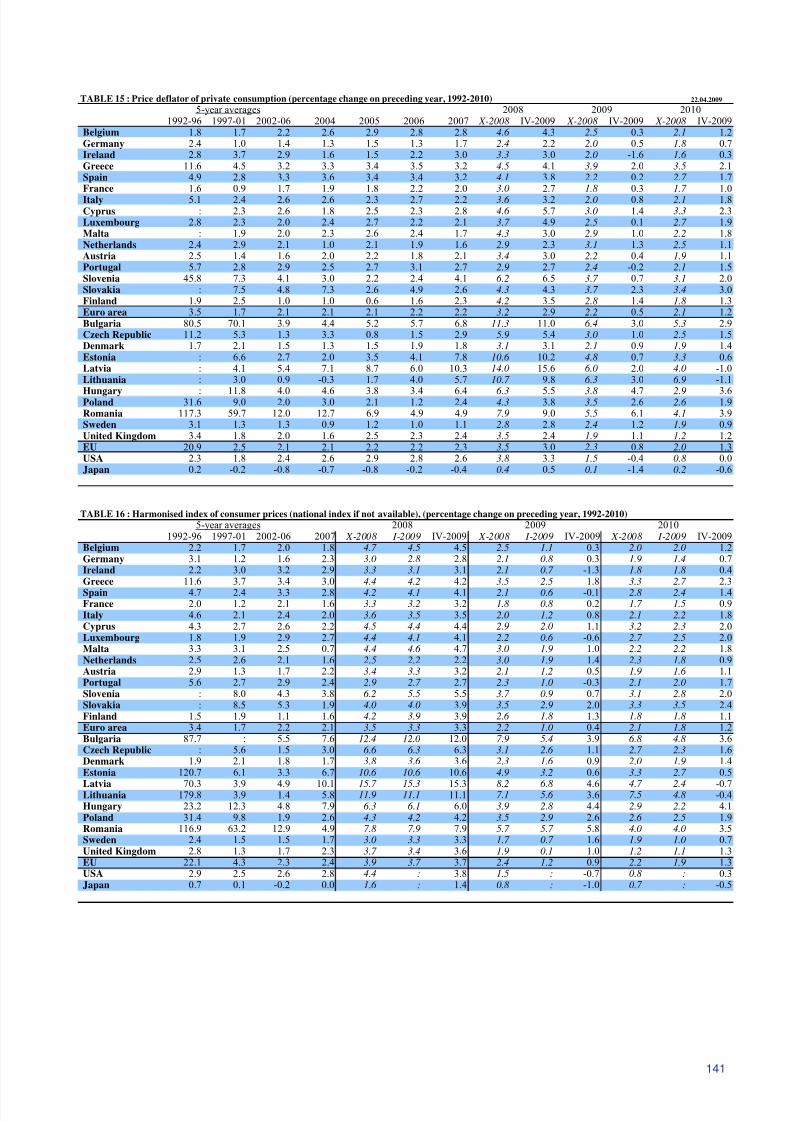
8/14/2019 Economic Forecast 2009
http://slidepdf.com/reader/full/economic-forecast-2009 147/172
141
TABLE 15 : Price deflator of private consumption (percentage change on preceding year, 1992-2010) 22.04.2009
5-year averages 2008 2009 20101992-96 1997-01 2002-06 2004 2005 2006 2007 X-2008 IV-2009 X-2008 IV-2009 X-2008 IV-2009
Belgium 1.8 1.7 2.2 2.6 2.9 2.8 2.8 4.6 4.3 2.5 0.3 2.1 1.2Germany 2.4 1.0 1.4 1.3 1.5 1.3 1.7 2.4 2.2 2.0 0.5 1.8 0.7Ireland 2.8 3.7 2.9 1.6 1.5 2.2 3.0 3.3 3.0 2.0 -1.6 1.6 0.3Greece 11.6 4.5 3.2 3.3 3.4 3.5 3.2 4.5 4.1 3.9 2.0 3.5 2.1Spain 4.9 2.8 3.3 3.6 3.4 3.4 3.2 4.1 3.8 2.2 0.2 2.7 1.7France 1.6 0.9 1.7 1.9 1.8 2.2 2.0 3.0 2.7 1.8 0.3 1.7 1.0Italy 5.1 2.4 2.6 2.6 2.3 2.7 2.2 3.6 3.2 2.0 0.8 2.1 1.8Cyprus : 2.3 2.6 1.8 2.5 2.3 2.8 4.6 5.7 3.0 1.4 3.3 2.3Luxembourg 2.8 2.3 2.0 2.4 2.7 2.2 2.1 3.7 4.9 2.5 0.1 2.7 1.9Malta : 1.9 2.0 2.3 2.6 2.4 1.7 4.3 3.0 2.9 1.0 2.2 1.8Netherlands 2.4 2.9 2.1 1.0 2.1 1.9 1.6 2.9 2.3 3.1 1.3 2.5 1.1Austria 2.5 1.4 1.6 2.0 2.2 1.8 2.1 3.4 3.0 2.2 0.4 1.9 1.1Portugal 5.7 2.8 2.9 2.5 2.7 3.1 2.7 2.9 2.7 2.4 -0.2 2.1 1.5Slovenia 45.8 7.3 4.1 3.0 2.2 2.4 4.1 6.2 6.5 3.7 0.7 3.1 2.0Slovakia : 7.5 4.8 7.3 2.6 4.9 2.6 4.3 4.3 3.7 2.3 3.4 3.0Finland 1.9 2.5 1.0 1.0 0.6 1.6 2.3 4.2 3.5 2.8 1.4 1.8 1.3Euro area 3.5 1.7 2.1 2.1 2.1 2.2 2.2 3.2 2.9 2.2 0.5 2.1 1.2Bulgaria 80.5 70.1 3.9 4.4 5.2 5.7 6.8 11.3 11.0 6.4 3.0 5.3 2.9Czech Republic 11.2 5.3 1.3 3.3 0.8 1.5 2.9 5.9 5.4 3.0 1.0 2.5 1.5Denmark 1.7 2.1 1.5 1.3 1.5 1.9 1.8 3.1 3.1 2.1 0.9 1.9 1.4Estonia : 6.6 2.7 2.0 3.5 4.1 7.8 10.6 10.2 4.8 0.7 3.3 0.6Latvia : 4.1 5.4 7.1 8.7 6.0 10.3 14.0 15.6 6.0 2.0 4.0 -1.0Lithuania : 3.0 0.9 -0.3 1.7 4.0 5.7 10.7 9.8 6.3 3.0 6.9 -1.1
Hungary : 11.8 4.0 4.6 3.8 3.4 6.4 6.3 5.5 3.8 4.7 2.9 3.6Poland 31.6 9.0 2.0 3.0 2.1 1.2 2.4 4.3 3.8 3.5 2.6 2.6 1.9Romania 117.3 59.7 12.0 12.7 6.9 4.9 4.9 7.9 9.0 5.5 6.1 4.1 3.9Sweden 3.1 1.3 1.3 0.9 1.2 1.0 1.1 2.8 2.8 2.4 1.2 1.9 0.9United Kingdom 3.4 1.8 2.0 1.6 2.5 2.3 2.4 3.5 2.4 1.9 1.1 1.2 1.2EU 20.9 2.5 2.1 2.1 2.2 2.2 2.3 3.5 3.0 2.3 0.8 2.0 1.3USA 2.3 1.8 2.4 2.6 2.9 2.8 2.6 3.8 3.3 1.5 -0.4 0.8 0.0Japan 0.2 -0.2 -0.8 -0.7 -0.8 -0.2 -0.4 0.4 0.5 0.1 -1.4 0.2 -0.6
TABLE 16 : Harmonised index of consumer prices (national index if not available), (percentage change on preceding year, 1992-2010)
5-year averages 2008 2009 20101992-96 1997-01 2002-06 2007 X-2008 I-2009 IV-2009 X-2008 I-2009 IV-2009 X-2008 I-2009 IV-2009
Belgium 2.2 1.7 2.0 1.8 4.7 4.5 4.5 2.5 1.1 0.3 2.0 2.0 1.2Germany 3.1 1.2 1.6 2.3 3.0 2.8 2.8 2.1 0.8 0.3 1.9 1.4 0.7Ireland 2.2 3.0 3.2 2.9 3.3 3.1 3.1 2.1 0.7 -1.3 1.8 1.8 0.4Greece 11.6 3.7 3.4 3.0 4.4 4.2 4.2 3.5 2.5 1.8 3.3 2.7 2.3Spain 4.7 2.4 3.3 2.8 4.2 4.1 4.1 2.1 0.6 -0.1 2.8 2.4 1.4France 2.0 1.2 2.1 1.6 3.3 3.2 3.2 1.8 0.8 0.2 1.7 1.5 0.9Italy 4.6 2.1 2.4 2.0 3.6 3.5 3.5 2.0 1.2 0.8 2.1 2.2 1.8Cyprus 4.3 2.7 2.6 2.2 4.5 4.4 4.4 2.9 2.0 1.1 3.2 2.3 2.0Luxembourg 1.8 1.9 2.9 2.7 4.4 4.1 4.1 2.2 0.6 -0.6 2.7 2.5 2.0Malta 3.3 3.1 2.5 0.7 4.4 4.6 4.7 3.0 1.9 1.0 2.2 2.2 1.8Netherlands 2.5 2.6 2.1 1.6 2.5 2.2 2.2 3.0 1.9 1.4 2.3 1.8 0.9Austria 2.9 1.3 1.7 2.2 3.4 3.3 3.2 2.1 1.2 0.5 1.9 1.6 1.1Portugal 5.6 2.7 2.9 2.4 2.9 2.7 2.7 2.3 1.0 -0.3 2.1 2.0 1.7Slovenia : 8.0 4.3 3.8 6.2 5.5 5.5 3.7 0.9 0.7 3.1 2.8 2.0Slovakia : 8.5 5.3 1.9 4.0 4.0 3.9 3.5 2.9 2.0 3.3 3.5 2.4Finland 1.5 1.9 1.1 1.6 4.2 3.9 3.9 2.6 1.8 1.3 1.8 1.8 1.1Euro area 3.4 1.7 2.2 2.1 3.5 3.3 3.3 2.2 1.0 0.4 2.1 1.8 1.2Bulgaria 87.7 : 5.5 7.6 12.4 12.0 12.0 7.9 5.4 3.9 6.8 4.8 3.6Czech Republic : 5.6 1.5 3.0 6.6 6.3 6.3 3.1 2.6 1.1 2.7 2.3 1.6Denmark 1.9 2.1 1.8 1.7 3.8 3.6 3.6 2.3 1.6 0.9 2.0 1.9 1.4Estonia 120.7 6.1 3.3 6.7 10.6 10.6 10.6 4.9 3.2 0.6 3.3 2.7 0.5
Latvia 70.3 3.9 4.9 10.1 15.7 15.3 15.3 8.2 6.8 4.6 4.7 2.4 -0.7Lithuania 179.8 3.9 1.4 5.8 11.9 11.1 11.1 7.1 5.6 3.6 7.5 4.8 -0.4Hungary 23.2 12.3 4.8 7.9 6.3 6.1 6.0 3.9 2.8 4.4 2.9 2.2 4.1Poland 31.4 9.8 1.9 2.6 4.3 4.2 4.2 3.5 2.9 2.6 2.6 2.5 1.9Romania 116.9 63.2 12.9 4.9 7.8 7.9 7.9 5.7 5.7 5.8 4.0 4.0 3.5Sweden 2.4 1.5 1.5 1.7 3.0 3.3 3.3 1.7 0.7 1.6 1.9 1.0 0.7United Kingdom 2.8 1.3 1.7 2.3 3.7 3.4 3.6 1.9 0.1 1.0 1.2 1.1 1.3EU 22.1 4.3 2.3 2.4 3.9 3.7 3.7 2.4 1.2 0.9 2.2 1.9 1.3USA 2.9 2.5 2.6 2.8 4.4 : 3.8 1.5 : -0.7 0.8 : 0.3Japan 0.7 0.1 -0.2 0.0 1.6 : 1.4 0.8 : -1.0 0.7 : -0.5
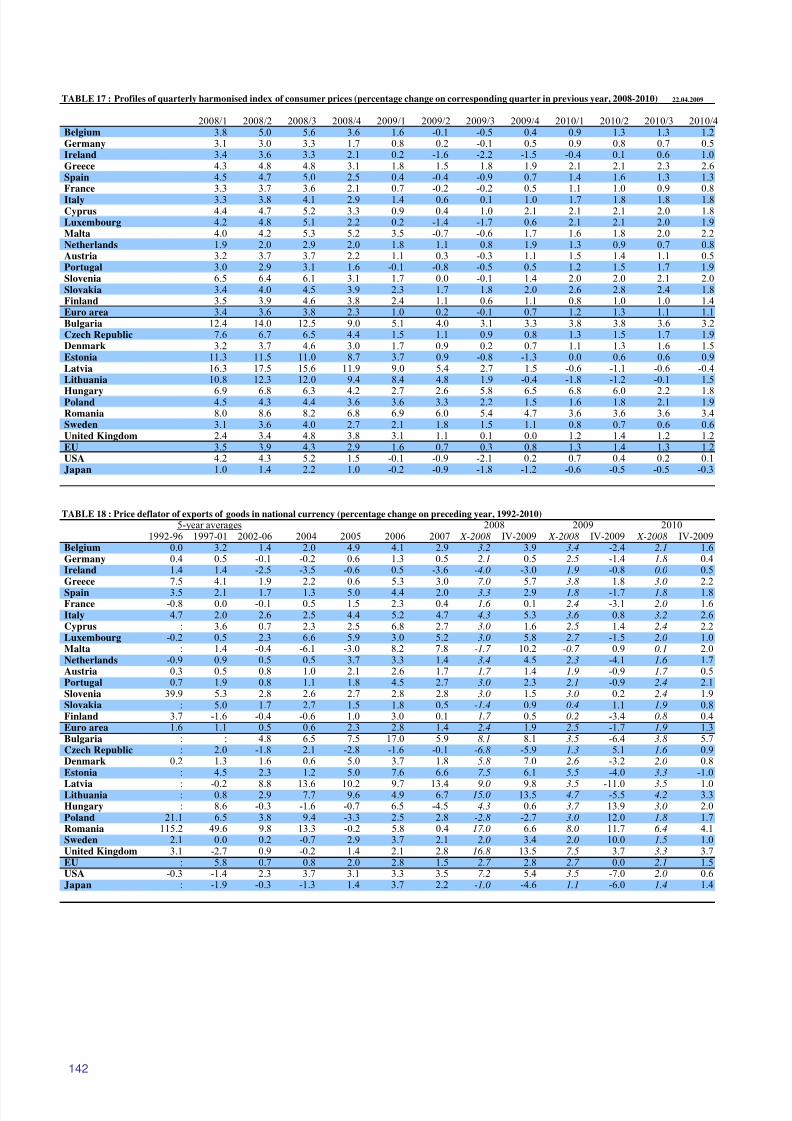
8/14/2019 Economic Forecast 2009
http://slidepdf.com/reader/full/economic-forecast-2009 148/172
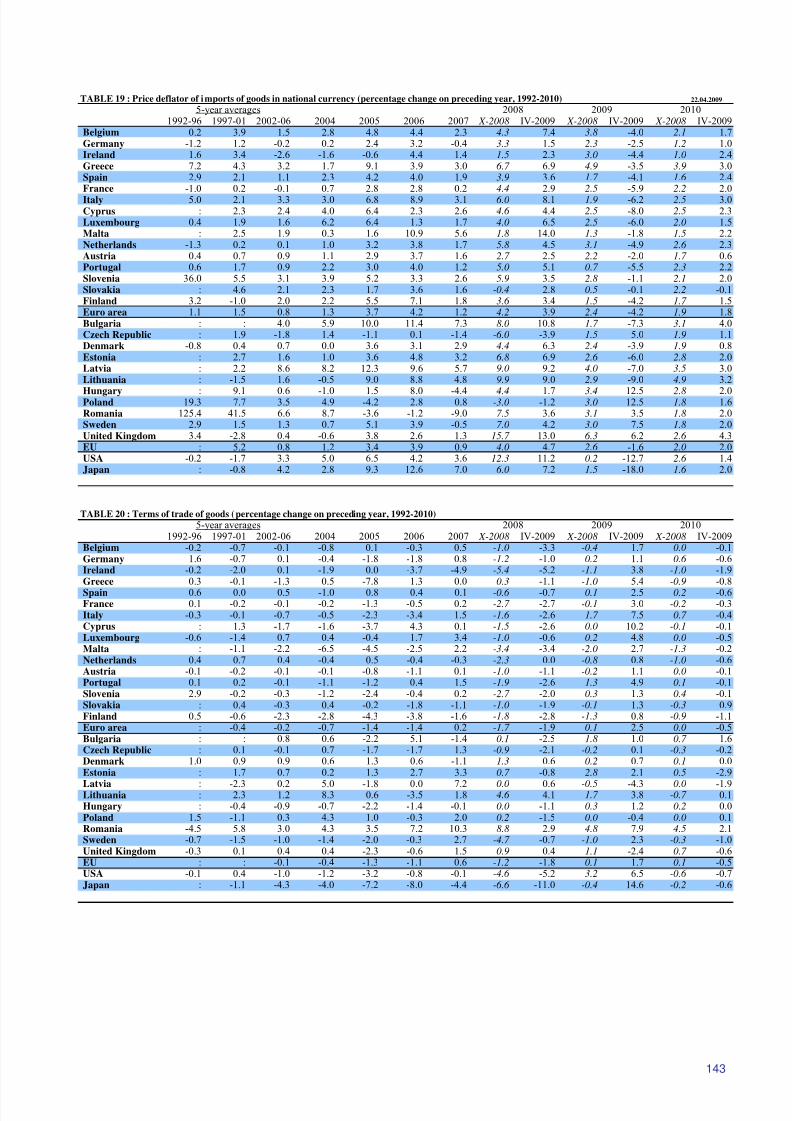
8/14/2019 Economic Forecast 2009
http://slidepdf.com/reader/full/economic-forecast-2009 149/172
143
TABLE 19 : Price deflator of imports of goods in national currency (percentage change on preceding year, 1992-2010) 22.04.2009
5-year averages 2008 2009 20101992-96 1997-01 2002-06 2004 2005 2006 2007 X-2008 IV-2009 X-2008 IV-2009 X-2008 IV-2009
Belgium 0.2 3.9 1.5 2.8 4.8 4.4 2.3 4.3 7.4 3.8 -4.0 2.1 1.7Germany -1.2 1.2 -0.2 0.2 2.4 3.2 -0.4 3.3 1.5 2.3 -2.5 1.2 1.0Ireland 1.6 3.4 -2.6 -1.6 -0.6 4.4 1.4 1.5 2.3 3.0 -4.4 1.0 2.4Greece 7.2 4.3 3.2 1.7 9.1 3.9 3.0 6.7 6.9 4.9 -3.5 3.9 3.0Spain 2.9 2.1 1.1 2.3 4.2 4.0 1.9 3.9 3.6 1.7 -4.1 1.6 2.4France -1.0 0.2 -0.1 0.7 2.8 2.8 0.2 4.4 2.9 2.5 -5.9 2.2 2.0Italy 5.0 2.1 3.3 3.0 6.8 8.9 3.1 6.0 8.1 1.9 -6.2 2.5 3.0Cyprus : 2.3 2.4 4.0 6.4 2.3 2.6 4.6 4.4 2.5 -8.0 2.5 2.3Luxembourg 0.4 1.9 1.6 6.2 6.4 1.3 1.7 4.0 6.5 2.5 -6.0 2.0 1.5Malta : 2.5 1.9 0.3 1.6 10.9 5.6 1.8 14.0 1.3 -1.8 1.5 2.2Netherlands -1.3 0.2 0.1 1.0 3.2 3.8 1.7 5.8 4.5 3.1 -4.9 2.6 2.3Austria 0.4 0.7 0.9 1.1 2.9 3.7 1.6 2.7 2.5 2.2 -2.0 1.7 0.6Portugal 0.6 1.7 0.9 2.2 3.0 4.0 1.2 5.0 5.1 0.7 -5.5 2.3 2.2Slovenia 36.0 5.5 3.1 3.9 5.2 3.3 2.6 5.9 3.5 2.8 -1.1 2.1 2.0Slovakia : 4.6 2.1 2.3 1.7 3.6 1.6 -0.4 2.8 0.5 -0.1 2.2 -0.1Finland 3.2 -1.0 2.0 2.2 5.5 7.1 1.8 3.6 3.4 1.5 -4.2 1.7 1.5Euro area 1.1 1.5 0.8 1.3 3.7 4.2 1.2 4.2 3.9 2.4 -4.2 1.9 1.8Bulgaria : : 4.0 5.9 10.0 11.4 7.3 8.0 10.8 1.7 -7.3 3.1 4.0Czech Republic : 1.9 -1.8 1.4 -1.1 0.1 -1.4 -6.0 -3.9 1.5 5.0 1.9 1.1Denmark -0.8 0.4 0.7 0.0 3.6 3.1 2.9 4.4 6.3 2.4 -3.9 1.9 0.8Estonia : 2.7 1.6 1.0 3.6 4.8 3.2 6.8 6.9 2.6 -6.0 2.8 2.0Latvia : 2.2 8.6 8.2 12.3 9.6 5.7 9.0 9.2 4.0 -7.0 3.5 3.0Lithuania : -1.5 1.6 -0.5 9.0 8.8 4.8 9.9 9.0 2.9 -9.0 4.9 3.2
Hungary : 9.1 0.6 -1.0 1.5 8.0 -4.4 4.4 1.7 3.4 12.5 2.8 2.0Poland 19.3 7.7 3.5 4.9 -4.2 2.8 0.8 -3.0 -1.2 3.0 12.5 1.8 1.6Romania 125.4 41.5 6.6 8.7 -3.6 -1.2 -9.0 7.5 3.6 3.1 3.5 1.8 2.0Sweden 2.9 1.5 1.3 0.7 5.1 3.9 -0.5 7.0 4.2 3.0 7.5 1.8 2.0United Kingdom 3.4 -2.8 0.4 -0.6 3.8 2.6 1.3 15.7 13.0 6.3 6.2 2.6 4.3EU : 5.2 0.8 1.2 3.4 3.9 0.9 4.0 4.7 2.6 -1.6 2.0 2.0USA -0.2 -1.7 3.3 5.0 6.5 4.2 3.6 12.3 11.2 0.2 -12.7 2.6 1.4Japan : -0.8 4.2 2.8 9.3 12.6 7.0 6.0 7.2 1.5 -18.0 1.6 2.0
TABLE 20 : Terms of trade of goods (percentage change on preceding year, 1992-2010)
5-year averages 2008 2009 20101992-96 1997-01 2002-06 2004 2005 2006 2007 X-2008 IV-2009 X-2008 IV-2009 X-2008 IV-2009
Belgium -0.2 -0.7 -0.1 -0.8 0.1 -0.3 0.5 -1.0 -3.3 -0.4 1.7 0.0 -0.1Germany 1.6 -0.7 0.1 -0.4 -1.8 -1.8 0.8 -1.2 -1.0 0.2 1.1 0.6 -0.6Ireland -0.2 -2.0 0.1 -1.9 0.0 -3.7 -4.9 -5.4 -5.2 -1.1 3.8 -1.0 -1.9Greece 0.3 -0.1 -1.3 0.5 -7.8 1.3 0.0 0.3 -1.1 -1.0 5.4 -0.9 -0.8Spain 0.6 0.0 0.5 -1.0 0.8 0.4 0.1 -0.6 -0.7 0.1 2.5 0.2 -0.6France 0.1 -0.2 -0.1 -0.2 -1.3 -0.5 0.2 -2.7 -2.7 -0.1 3.0 -0.2 -0.3Italy -0.3 -0.1 -0.7 -0.5 -2.3 -3.4 1.5 -1.6 -2.6 1.7 7.5 0.7 -0.4Cyprus : 1.3 -1.7 -1.6 -3.7 4.3 0.1 -1.5 -2.6 0.0 10.2 -0.1 -0.1Luxembourg -0.6 -1.4 0.7 0.4 -0.4 1.7 3.4 -1.0 -0.6 0.2 4.8 0.0 -0.5Malta : -1.1 -2.2 -6.5 -4.5 -2.5 2.2 -3.4 -3.4 -2.0 2.7 -1.3 -0.2Netherlands 0.4 0.7 0.4 -0.4 0.5 -0.4 -0.3 -2.3 0.0 -0.8 0.8 -1.0 -0.6Austria -0.1 -0.2 -0.1 -0.1 -0.8 -1.1 0.1 -1.0 -1.1 -0.2 1.1 0.0 -0.1Portugal 0.1 0.2 -0.1 -1.1 -1.2 0.4 1.5 -1.9 -2.6 1.3 4.9 0.1 -0.1Slovenia 2.9 -0.2 -0.3 -1.2 -2.4 -0.4 0.2 -2.7 -2.0 0.3 1.3 0.4 -0.1Slovakia : 0.4 -0.3 0.4 -0.2 -1.8 -1.1 -1.0 -1.9 -0.1 1.3 -0.3 0.9Finland 0.5 -0.6 -2.3 -2.8 -4.3 -3.8 -1.6 -1.8 -2.8 -1.3 0.8 -0.9 -1.1Euro area : -0.4 -0.2 -0.7 -1.4 -1.4 0.2 -1.7 -1.9 0.1 2.5 0.0 -0.5Bulgaria : : 0.8 0.6 -2.2 5.1 -1.4 0.1 -2.5 1.8 1.0 0.7 1.6Czech Republic : 0.1 -0.1 0.7 -1.7 -1.7 1.3 -0.9 -2.1 -0.2 0.1 -0.3 -0.2Denmark 1.0 0.9 0.9 0.6 1.3 0.6 -1.1 1.3 0.6 0.2 0.7 0.1 0.0Estonia : 1.7 0.7 0.2 1.3 2.7 3.3 0.7 -0.8 2.8 2.1 0.5 -2.9
Latvia : -2.3 0.2 5.0 -1.8 0.0 7.2 0.0 0.6 -0.5 -4.3 0.0 -1.9Lithuania : 2.3 1.2 8.3 0.6 -3.5 1.8 4.6 4.1 1.7 3.8 -0.7 0.1Hungary : -0.4 -0.9 -0.7 -2.2 -1.4 -0.1 0.0 -1.1 0.3 1.2 0.2 0.0Poland 1.5 -1.1 0.3 4.3 1.0 -0.3 2.0 0.2 -1.5 0.0 -0.4 0.0 0.1Romania -4.5 5.8 3.0 4.3 3.5 7.2 10.3 8.8 2.9 4.8 7.9 4.5 2.1Sweden -0.7 -1.5 -1.0 -1.4 -2.0 -0.3 2.7 -4.7 -0.7 -1.0 2.3 -0.3 -1.0United Kingdom -0.3 0.1 0.4 0.4 -2.3 -0.6 1.5 0.9 0.4 1.1 -2.4 0.7 -0.6EU : : -0.1 -0.4 -1.3 -1.1 0.6 -1.2 -1.8 0.1 1.7 0.1 -0.5USA -0.1 0.4 -1.0 -1.2 -3.2 -0.8 -0.1 -4.6 -5.2 3.2 6.5 -0.6 -0.7Japan : -1.1 -4.3 -4.0 -7.2 -8.0 -4.4 -6.6 -11.0 -0.4 14.6 -0.2 -0.6
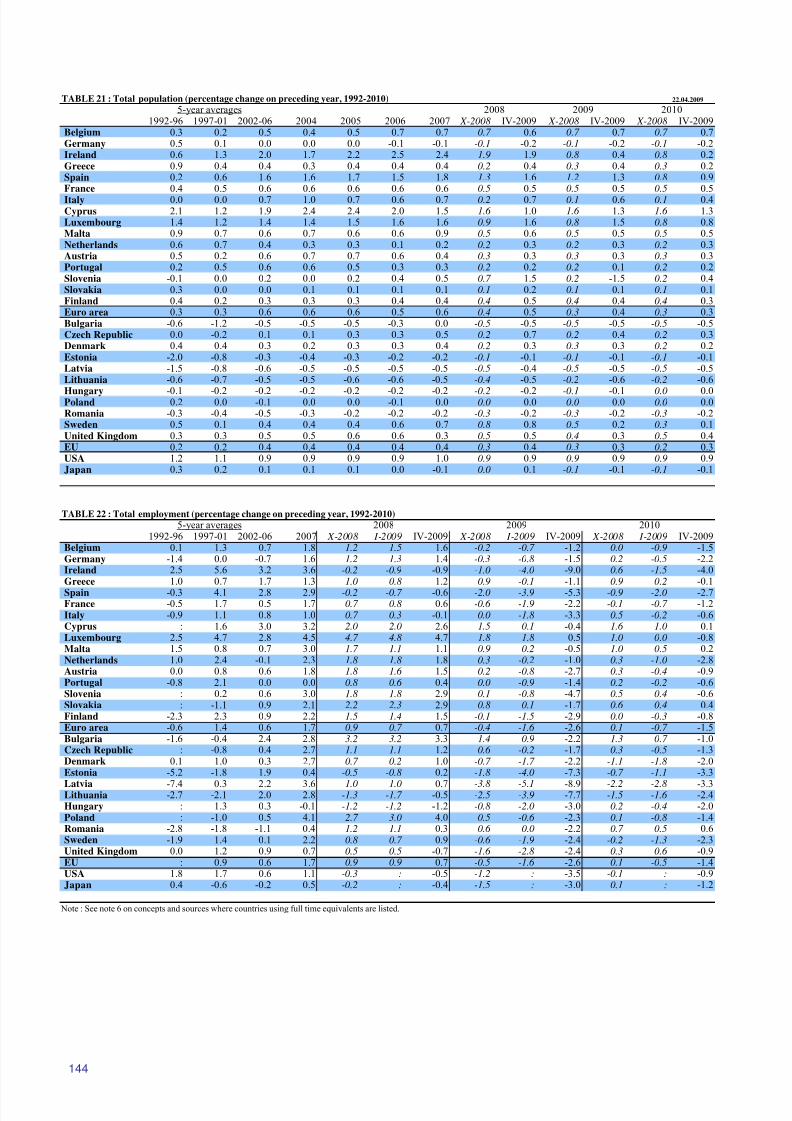
8/14/2019 Economic Forecast 2009
http://slidepdf.com/reader/full/economic-forecast-2009 150/172
144
TABLE 21 : Total population (percentage change on preceding year, 1992-2010) 22.04.2009
5-year averages 2008 2009 20101992-96 1997-01 2002-06 2004 2005 2006 2007 X-2008 IV-2009 X-2008 IV-2009 X-2008 IV-2009
Belgium 0.3 0.2 0.5 0.4 0.5 0.7 0.7 0.7 0.6 0.7 0.7 0.7 0.7Germany 0.5 0.1 0.0 0.0 0.0 -0.1 -0.1 -0.1 -0.2 -0.1 -0.2 -0.1 -0.2Ireland 0.6 1.3 2.0 1.7 2.2 2.5 2.4 1.9 1.9 0.8 0.4 0.8 0.2Greece 0.9 0.4 0.4 0.3 0.4 0.4 0.4 0.2 0.4 0.3 0.4 0.3 0.2Spain 0.2 0.6 1.6 1.6 1.7 1.5 1.8 1.3 1.6 1.2 1.3 0.8 0.9France 0.4 0.5 0.6 0.6 0.6 0.6 0.6 0.5 0.5 0.5 0.5 0.5 0.5Italy 0.0 0.0 0.7 1.0 0.7 0.6 0.7 0.2 0.7 0.1 0.6 0.1 0.4Cyprus 2.1 1.2 1.9 2.4 2.4 2.0 1.5 1.6 1.0 1.6 1.3 1.6 1.3Luxembourg 1.4 1.2 1.4 1.4 1.5 1.6 1.6 0.9 1.6 0.8 1.5 0.8 0.8Malta 0.9 0.7 0.6 0.7 0.6 0.6 0.9 0.5 0.6 0.5 0.5 0.5 0.5Netherlands 0.6 0.7 0.4 0.3 0.3 0.1 0.2 0.2 0.3 0.2 0.3 0.2 0.3Austria 0.5 0.2 0.6 0.7 0.7 0.6 0.4 0.3 0.3 0.3 0.3 0.3 0.3Portugal 0.2 0.5 0.6 0.6 0.5 0.3 0.3 0.2 0.2 0.2 0.1 0.2 0.2Slovenia -0.1 0.0 0.2 0.0 0.2 0.4 0.5 0.7 1.5 0.2 -1.5 0.2 0.4Slovakia 0.3 0.0 0.0 0.1 0.1 0.1 0.1 0.1 0.2 0.1 0.1 0.1 0.1Finland 0.4 0.2 0.3 0.3 0.3 0.4 0.4 0.4 0.5 0.4 0.4 0.4 0.3Euro area 0.3 0.3 0.6 0.6 0.6 0.5 0.6 0.4 0.5 0.3 0.4 0.3 0.3Bulgaria -0.6 -1.2 -0.5 -0.5 -0.5 -0.3 0.0 -0.5 -0.5 -0.5 -0.5 -0.5 -0.5Czech Republic 0.0 -0.2 0.1 0.1 0.3 0.3 0.5 0.2 0.7 0.2 0.4 0.2 0.3Denmark 0.4 0.4 0.3 0.2 0.3 0.3 0.4 0.2 0.3 0.3 0.3 0.2 0.2Estonia -2.0 -0.8 -0.3 -0.4 -0.3 -0.2 -0.2 -0.1 -0.1 -0.1 -0.1 -0.1 -0.1Latvia -1.5 -0.8 -0.6 -0.5 -0.5 -0.5 -0.5 -0.5 -0.4 -0.5 -0.5 -0.5 -0.5Lithuania -0.6 -0.7 -0.5 -0.5 -0.6 -0.6 -0.5 -0.4 -0.5 -0.2 -0.6 -0.2 -0.6
Hungary -0.1 -0.2 -0.2 -0.2 -0.2 -0.2 -0.2 -0.2 -0.2 -0.1 -0.1 0.0 0.0Poland 0.2 0.0 -0.1 0.0 0.0 -0.1 0.0 0.0 0.0 0.0 0.0 0.0 0.0Romania -0.3 -0.4 -0.5 -0.3 -0.2 -0.2 -0.2 -0.3 -0.2 -0.3 -0.2 -0.3 -0.2Sweden 0.5 0.1 0.4 0.4 0.4 0.6 0.7 0.8 0.8 0.5 0.2 0.3 0.1United Kingdom 0.3 0.3 0.5 0.5 0.6 0.6 0.3 0.5 0.5 0.4 0.3 0.5 0.4EU 0.2 0.2 0.4 0.4 0.4 0.4 0.4 0.3 0.4 0.3 0.3 0.2 0.3USA 1.2 1.1 0.9 0.9 0.9 0.9 1.0 0.9 0.9 0.9 0.9 0.9 0.9Japan 0.3 0.2 0.1 0.1 0.1 0.0 -0.1 0.0 0.1 -0.1 -0.1 -0.1 -0.1
TABLE 22 : Total employment (percentage change on preceding year, 1992-2010)
5-year averages 2008 2009 20101992-96 1997-01 2002-06 2007 X-2008 I-2009 IV-2009 X-2008 I-2009 IV-2009 X-2008 I-2009 IV-2009
Belgium 0.1 1.3 0.7 1.8 1.2 1.5 1.6 -0.2 -0.7 -1.2 0.0 -0.9 -1.5Germany -1.4 0.0 -0.7 1.6 1.2 1.3 1.4 -0.3 -0.8 -1.5 0.2 -0.5 -2.2Ireland 2.5 5.6 3.2 3.6 -0.2 -0.9 -0.9 -1.0 -4.0 -9.0 0.6 -1.5 -4.0Greece 1.0 0.7 1.7 1.3 1.0 0.8 1.2 0.9 -0.1 -1.1 0.9 0.2 -0.1Spain -0.3 4.1 2.8 2.9 -0.2 -0.7 -0.6 -2.0 -3.9 -5.3 -0.9 -2.0 -2.7France -0.5 1.7 0.5 1.7 0.7 0.8 0.6 -0.6 -1.9 -2.2 -0.1 -0.7 -1.2Italy -0.9 1.1 0.8 1.0 0.7 0.3 -0.1 0.0 -1.8 -3.3 0.5 -0.2 -0.6Cyprus : 1.6 3.0 3.2 2.0 2.0 2.6 1.5 0.1 -0.4 1.6 1.0 0.1Luxembourg 2.5 4.7 2.8 4.5 4.7 4.8 4.7 1.8 1.8 0.5 1.0 0.0 -0.8Malta 1.5 0.8 0.7 3.0 1.7 1.1 1.1 0.9 0.2 -0.5 1.0 0.5 0.2Netherlands 1.0 2.4 -0.1 2.3 1.8 1.8 1.8 0.3 -0.2 -1.0 0.3 -1.0 -2.8Austria 0.0 0.8 0.6 1.8 1.8 1.6 1.5 0.2 -0.8 -2.7 0.3 -0.4 -0.9Portugal -0.8 2.1 0.0 0.0 0.8 0.6 0.4 0.0 -0.9 -1.4 0.2 -0.2 -0.6Slovenia : 0.2 0.6 3.0 1.8 1.8 2.9 0.1 -0.8 -4.7 0.5 0.4 -0.6Slovakia : -1.1 0.9 2.1 2.2 2.3 2.9 0.8 0.1 -1.7 0.6 0.4 0.4Finland -2.3 2.3 0.9 2.2 1.5 1.4 1.5 -0.1 -1.5 -2.9 0.0 -0.3 -0.8Euro area -0.6 1.4 0.6 1.7 0.9 0.7 0.7 -0.4 -1.6 -2.6 0.1 -0.7 -1.5Bulgaria -1.6 -0.4 2.4 2.8 3.2 3.2 3.3 1.4 0.9 -2.2 1.3 0.7 -1.0Czech Republic : -0.8 0.4 2.7 1.1 1.1 1.2 0.6 -0.2 -1.7 0.3 -0.5 -1.3Denmark 0.1 1.0 0.3 2.7 0.7 0.2 1.0 -0.7 -1.7 -2.2 -1.1 -1.8 -2.0Estonia -5.2 -1.8 1.9 0.4 -0.5 -0.8 0.2 -1.8 -4.0 -7.3 -0.7 -1.1 -3.3
Latvia -7.4 0.3 2.2 3.6 1.0 1.0 0.7 -3.8 -5.1 -8.9 -2.2 -2.8 -3.3Lithuania -2.7 -2.1 2.0 2.8 -1.3 -1.7 -0.5 -2.5 -3.9 -7.7 -1.5 -1.6 -2.4Hungary : 1.3 0.3 -0.1 -1.2 -1.2 -1.2 -0.8 -2.0 -3.0 0.2 -0.4 -2.0Poland : -1.0 0.5 4.1 2.7 3.0 4.0 0.5 -0.6 -2.3 0.1 -0.8 -1.4Romania -2.8 -1.8 -1.1 0.4 1.2 1.1 0.3 0.6 0.0 -2.2 0.7 0.5 0.6Sweden -1.9 1.4 0.1 2.2 0.8 0.7 0.9 -0.6 -1.9 -2.4 -0.2 -1.3 -2.3United Kingdom 0.0 1.2 0.9 0.7 0.5 0.5 -0.7 -1.6 -2.8 -2.4 0.3 0.6 -0.9EU : 0.9 0.6 1.7 0.9 0.9 0.7 -0.5 -1.6 -2.6 0.1 -0.5 -1.4USA 1.8 1.7 0.6 1.1 -0.3 : -0.5 -1.2 : -3.5 -0.1 : -0.9Japan 0.4 -0.6 -0.2 0.5 -0.2 : -0.4 -1.5 : -3.0 0.1 : -1.2
Note : See note 6 on concepts and sources where countries using full time equivalents are listed.
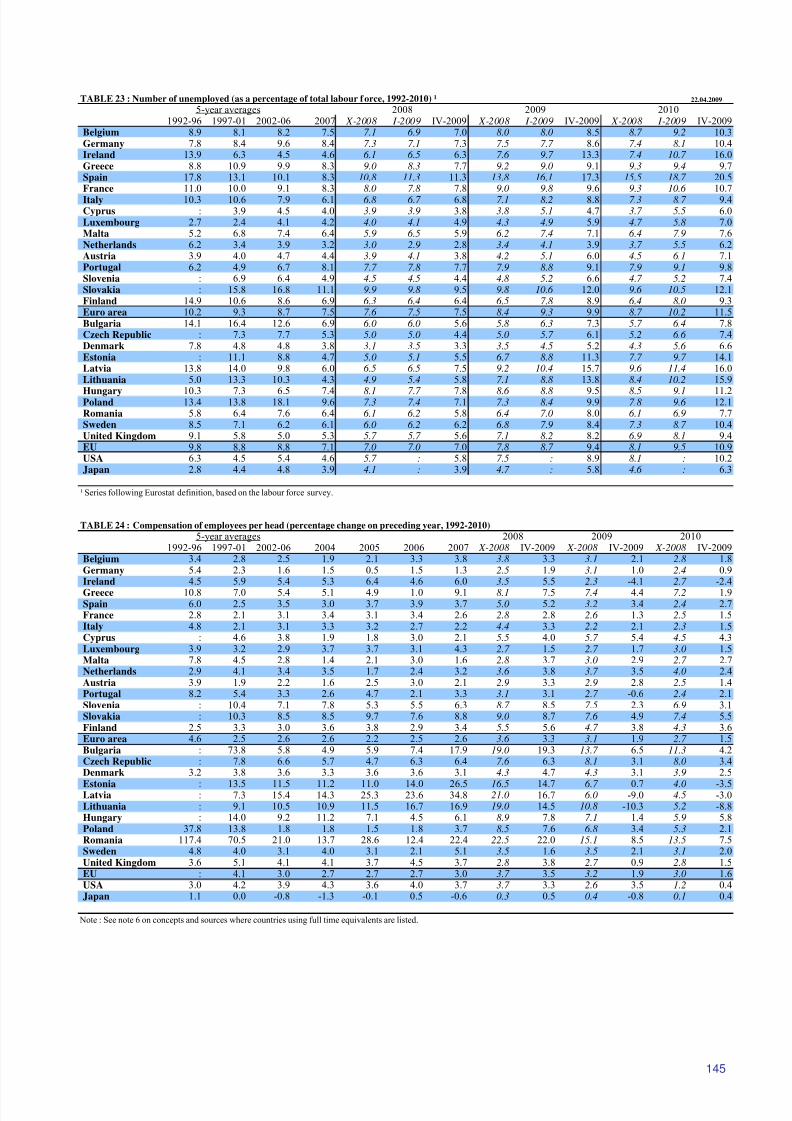
8/14/2019 Economic Forecast 2009
http://slidepdf.com/reader/full/economic-forecast-2009 151/172
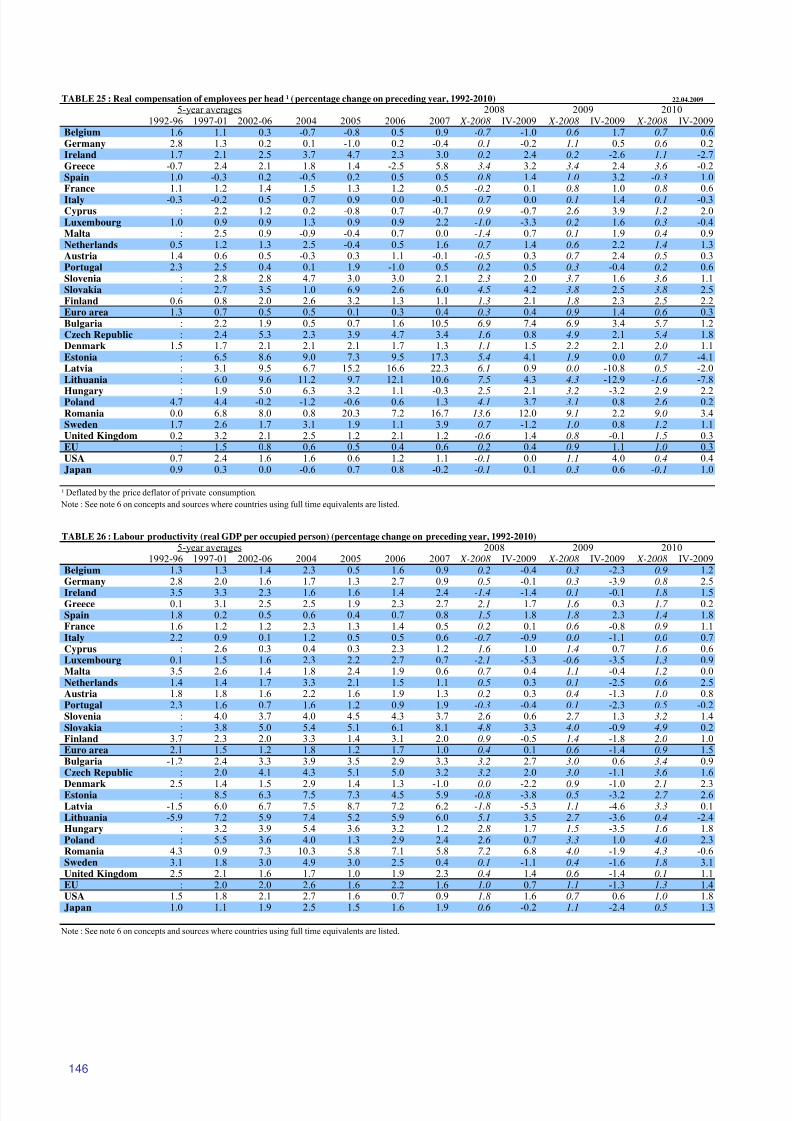
8/14/2019 Economic Forecast 2009
http://slidepdf.com/reader/full/economic-forecast-2009 152/172
146
TABLE 25 : Real compensation of employees per head ¹ (percentage change on preceding year, 1992-2010) 22.04.2009
5-year averages 2008 2009 20101992-96 1997-01 2002-06 2004 2005 2006 2007 X-2008 IV-2009 X-2008 IV-2009 X-2008 IV-2009
Belgium 1.6 1.1 0.3 -0.7 -0.8 0.5 0.9 -0.7 -1.0 0.6 1.7 0.7 0.6Germany 2.8 1.3 0.2 0.1 -1.0 0.2 -0.4 0.1 -0.2 1.1 0.5 0.6 0.2Ireland 1.7 2.1 2.5 3.7 4.7 2.3 3.0 0.2 2.4 0.2 -2.6 1.1 -2.7Greece -0.7 2.4 2.1 1.8 1.4 -2.5 5.8 3.4 3.2 3.4 2.4 3.6 -0.2Spain 1.0 -0.3 0.2 -0.5 0.2 0.5 0.5 0.8 1.4 1.0 3.2 -0.3 1.0France 1.1 1.2 1.4 1.5 1.3 1.2 0.5 -0.2 0.1 0.8 1.0 0.8 0.6Italy -0.3 -0.2 0.5 0.7 0.9 0.0 -0.1 0.7 0.0 0.1 1.4 0.1 -0.3Cyprus : 2.2 1.2 0.2 -0.8 0.7 -0.7 0.9 -0.7 2.6 3.9 1.2 2.0Luxembourg 1.0 0.9 0.9 1.3 0.9 0.9 2.2 -1.0 -3.3 0.2 1.6 0.3 -0.4Malta : 2.5 0.9 -0.9 -0.4 0.7 0.0 -1.4 0.7 0.1 1.9 0.4 0.9Netherlands 0.5 1.2 1.3 2.5 -0.4 0.5 1.6 0.7 1.4 0.6 2.2 1.4 1.3Austria 1.4 0.6 0.5 -0.3 0.3 1.1 -0.1 -0.5 0.3 0.7 2.4 0.5 0.3Portugal 2.3 2.5 0.4 0.1 1.9 -1.0 0.5 0.2 0.5 0.3 -0.4 0.2 0.6Slovenia : 2.8 2.8 4.7 3.0 3.0 2.1 2.3 2.0 3.7 1.6 3.6 1.1Slovakia : 2.7 3.5 1.0 6.9 2.6 6.0 4.5 4.2 3.8 2.5 3.8 2.5Finland 0.6 0.8 2.0 2.6 3.2 1.3 1.1 1.3 2.1 1.8 2.3 2.5 2.2Euro area 1.3 0.7 0.5 0.5 0.1 0.3 0.4 0.3 0.4 0.9 1.4 0.6 0.3Bulgaria : 2.2 1.9 0.5 0.7 1.6 10.5 6.9 7.4 6.9 3.4 5.7 1.2Czech Republic : 2.4 5.3 2.3 3.9 4.7 3.4 1.6 0.8 4.9 2.1 5.4 1.8Denmark 1.5 1.7 2.1 2.1 2.1 1.7 1.3 1.1 1.5 2.2 2.1 2.0 1.1Estonia : 6.5 8.6 9.0 7.3 9.5 17.3 5.4 4.1 1.9 0.0 0.7 -4.1Latvia : 3.1 9.5 6.7 15.2 16.6 22.3 6.1 0.9 0.0 -10.8 0.5 -2.0Lithuania : 6.0 9.6 11.2 9.7 12.1 10.6 7.5 4.3 4.3 -12.9 -1.6 -7.8
Hungary : 1.9 5.0 6.3 3.2 1.1 -0.3 2.5 2.1 3.2 -3.2 2.9 2.2Poland 4.7 4.4 -0.2 -1.2 -0.6 0.6 1.3 4.1 3.7 3.1 0.8 2.6 0.2Romania 0.0 6.8 8.0 0.8 20.3 7.2 16.7 13.6 12.0 9.1 2.2 9.0 3.4Sweden 1.7 2.6 1.7 3.1 1.9 1.1 3.9 0.7 -1.2 1.0 0.8 1.2 1.1United Kingdom 0.2 3.2 2.1 2.5 1.2 2.1 1.2 -0.6 1.4 0.8 -0.1 1.5 0.3EU : 1.5 0.8 0.6 0.5 0.4 0.6 0.2 0.4 0.9 1.1 1.0 0.3USA 0.7 2.4 1.6 1.6 0.6 1.2 1.1 -0.1 0.0 1.1 4.0 0.4 0.4Japan 0.9 0.3 0.0 -0.6 0.7 0.8 -0.2 -0.1 0.1 0.3 0.6 -0.1 1.0
¹ Deflated by the price deflator of private consumption.
Note : See note 6 on concepts and sources where countries using full time equivalents are listed.
TABLE 26 : Labour productivity (real GDP per occupied person) (percentage change on preceding year, 1992-2010)
5-year averages 2008 2009 20101992-96 1997-01 2002-06 2004 2005 2006 2007 X-2008 IV-2009 X-2008 IV-2009 X-2008 IV-2009
Belgium 1.3 1.3 1.4 2.3 0.5 1.6 0.9 0.2 -0.4 0.3 -2.3 0.9 1.2Germany 2.8 2.0 1.6 1.7 1.3 2.7 0.9 0.5 -0.1 0.3 -3.9 0.8 2.5Ireland 3.5 3.3 2.3 1.6 1.6 1.4 2.4 -1.4 -1.4 0.1 -0.1 1.8 1.5Greece 0.1 3.1 2.5 2.5 1.9 2.3 2.7 2.1 1.7 1.6 0.3 1.7 0.2Spain 1.8 0.2 0.5 0.6 0.4 0.7 0.8 1.5 1.8 1.8 2.3 1.4 1.8France 1.6 1.2 1.2 2.3 1.3 1.4 0.5 0.2 0.1 0.6 -0.8 0.9 1.1Italy 2.2 0.9 0.1 1.2 0.5 0.5 0.6 -0.7 -0.9 0.0 -1.1 0.0 0.7Cyprus : 2.6 0.3 0.4 0.3 2.3 1.2 1.6 1.0 1.4 0.7 1.6 0.6Luxembourg 0.1 1.5 1.6 2.3 2.2 2.7 0.7 -2.1 -5.3 -0.6 -3.5 1.3 0.9Malta 3.5 2.6 1.4 1.8 2.4 1.9 0.6 0.7 0.4 1.1 -0.4 1.2 0.0Netherlands 1.4 1.4 1.7 3.3 2.1 1.5 1.1 0.5 0.3 0.1 -2.5 0.6 2.5Austria 1.8 1.8 1.6 2.2 1.6 1.9 1.3 0.2 0.3 0.4 -1.3 1.0 0.8Portugal 2.3 1.6 0.7 1.6 1.2 0.9 1.9 -0.3 -0.4 0.1 -2.3 0.5 -0.2Slovenia : 4.0 3.7 4.0 4.5 4.3 3.7 2.6 0.6 2.7 1.3 3.2 1.4Slovakia : 3.8 5.0 5.4 5.1 6.1 8.1 4.8 3.3 4.0 -0.9 4.9 0.2Finland 3.7 2.3 2.0 3.3 1.4 3.1 2.0 0.9 -0.5 1.4 -1.8 2.0 1.0Euro area 2.1 1.5 1.2 1.8 1.2 1.7 1.0 0.4 0.1 0.6 -1.4 0.9 1.5Bulgaria -1.2 2.4 3.3 3.9 3.5 2.9 3.3 3.2 2.7 3.0 0.6 3.4 0.9Czech Republic : 2.0 4.1 4.3 5.1 5.0 3.2 3.2 2.0 3.0 -1.1 3.6 1.6
Denmark 2.5 1.4 1.5 2.9 1.4 1.3 -1.0 0.0 -2.2 0.9 -1.0 2.1 2.3Estonia : 8.5 6.3 7.5 7.3 4.5 5.9 -0.8 -3.8 0.5 -3.2 2.7 2.6Latvia -1.5 6.0 6.7 7.5 8.7 7.2 6.2 -1.8 -5.3 1.1 -4.6 3.3 0.1Lithuania -5.9 7.2 5.9 7.4 5.2 5.9 6.0 5.1 3.5 2.7 -3.6 0.4 -2.4Hungary : 3.2 3.9 5.4 3.6 3.2 1.2 2.8 1.7 1.5 -3.5 1.6 1.8Poland : 5.5 3.6 4.0 1.3 2.9 2.4 2.6 0.7 3.3 1.0 4.0 2.3Romania 4.3 0.9 7.3 10.3 5.8 7.1 5.8 7.2 6.8 4.0 -1.9 4.3 -0.6Sweden 3.1 1.8 3.0 4.9 3.0 2.5 0.4 0.1 -1.1 0.4 -1.6 1.8 3.1United Kingdom 2.5 2.1 1.6 1.7 1.0 1.9 2.3 0.4 1.4 0.6 -1.4 0.1 1.1EU : 2.0 2.0 2.6 1.6 2.2 1.6 1.0 0.7 1.1 -1.3 1.3 1.4USA 1.5 1.8 2.1 2.7 1.6 0.7 0.9 1.8 1.6 0.7 0.6 1.0 1.8Japan 1.0 1.1 1.9 2.5 1.5 1.6 1.9 0.6 -0.2 1.1 -2.4 0.5 1.3
Note : See note 6 on concepts and sources where countries using full time equivalents are listed.
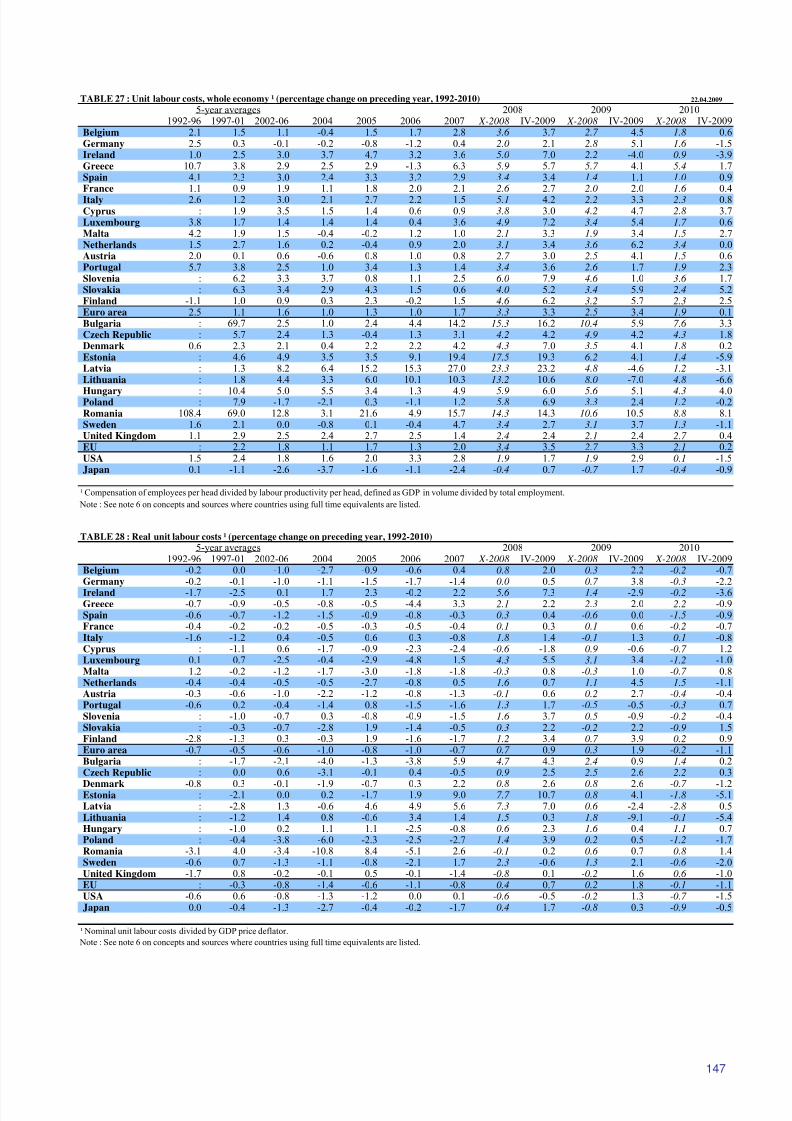
8/14/2019 Economic Forecast 2009
http://slidepdf.com/reader/full/economic-forecast-2009 153/172
147
TABLE 27 : Unit labour costs, whole economy ¹ (percentage change on preceding year, 1992-2010) 22.04.2009
5-year averages 2008 2009 20101992-96 1997-01 2002-06 2004 2005 2006 2007 X-2008 IV-2009 X-2008 IV-2009 X-2008 IV-2009
Belgium 2.1 1.5 1.1 -0.4 1.5 1.7 2.8 3.6 3.7 2.7 4.5 1.8 0.6Germany 2.5 0.3 -0.1 -0.2 -0.8 -1.2 0.4 2.0 2.1 2.8 5.1 1.6 -1.5Ireland 1.0 2.5 3.0 3.7 4.7 3.2 3.6 5.0 7.0 2.2 -4.0 0.9 -3.9Greece 10.7 3.8 2.9 2.5 2.9 -1.3 6.3 5.9 5.7 5.7 4.1 5.4 1.7Spain 4.1 2.3 3.0 2.4 3.3 3.2 2.9 3.4 3.4 1.4 1.1 1.0 0.9France 1.1 0.9 1.9 1.1 1.8 2.0 2.1 2.6 2.7 2.0 2.0 1.6 0.4Italy 2.6 1.2 3.0 2.1 2.7 2.2 1.5 5.1 4.2 2.2 3.3 2.3 0.8Cyprus : 1.9 3.5 1.5 1.4 0.6 0.9 3.8 3.0 4.2 4.7 2.8 3.7Luxembourg 3.8 1.7 1.4 1.4 1.4 0.4 3.6 4.9 7.2 3.4 5.4 1.7 0.6Malta 4.2 1.9 1.5 -0.4 -0.2 1.2 1.0 2.1 3.3 1.9 3.4 1.5 2.7Netherlands 1.5 2.7 1.6 0.2 -0.4 0.9 2.0 3.1 3.4 3.6 6.2 3.4 0.0Austria 2.0 0.1 0.6 -0.6 0.8 1.0 0.8 2.7 3.0 2.5 4.1 1.5 0.6Portugal 5.7 3.8 2.5 1.0 3.4 1.3 1.4 3.4 3.6 2.6 1.7 1.9 2.3Slovenia : 6.2 3.3 3.7 0.8 1.1 2.5 6.0 7.9 4.6 1.0 3.6 1.7Slovakia : 6.3 3.4 2.9 4.3 1.5 0.6 4.0 5.2 3.4 5.9 2.4 5.2Finland -1.1 1.0 0.9 0.3 2.3 -0.2 1.5 4.6 6.2 3.2 5.7 2.3 2.5Euro area 2.5 1.1 1.6 1.0 1.3 1.0 1.7 3.3 3.3 2.5 3.4 1.9 0.1Bulgaria : 69.7 2.5 1.0 2.4 4.4 14.2 15.3 16.2 10.4 5.9 7.6 3.3Czech Republic : 5.7 2.4 1.3 -0.4 1.3 3.1 4.2 4.2 4.9 4.2 4.3 1.8Denmark 0.6 2.3 2.1 0.4 2.2 2.2 4.2 4.3 7.0 3.5 4.1 1.8 0.2Estonia : 4.6 4.9 3.5 3.5 9.1 19.4 17.5 19.3 6.2 4.1 1.4 -5.9Latvia : 1.3 8.2 6.4 15.2 15.3 27.0 23.3 23.2 4.8 -4.6 1.2 -3.1Lithuania : 1.8 4.4 3.3 6.0 10.1 10.3 13.2 10.6 8.0 -7.0 4.8 -6.6
Hungary : 10.4 5.0 5.5 3.4 1.3 4.9 5.9 6.0 5.6 5.1 4.3 4.0Poland : 7.9 -1.7 -2.1 0.3 -1.1 1.2 5.8 6.9 3.3 2.4 1.2 -0.2Romania 108.4 69.0 12.8 3.1 21.6 4.9 15.7 14.3 14.3 10.6 10.5 8.8 8.1Sweden 1.6 2.1 0.0 -0.8 0.1 -0.4 4.7 3.4 2.7 3.1 3.7 1.3 -1.1United Kingdom 1.1 2.9 2.5 2.4 2.7 2.5 1.4 2.4 2.4 2.1 2.4 2.7 0.4EU : 2.2 1.8 1.1 1.7 1.3 2.0 3.4 3.5 2.7 3.3 2.1 0.2USA 1.5 2.4 1.8 1.6 2.0 3.3 2.8 1.9 1.7 1.9 2.9 0.1 -1.5Japan 0.1 -1.1 -2.6 -3.7 -1.6 -1.1 -2.4 -0.4 0.7 -0.7 1.7 -0.4 -0.9
¹ Compensation of employees per head divided by labour productivity per head, defined as GDP in volume divided by total employment.
Note : See note 6 on concepts and sources where countries using full time equivalents are listed.
TABLE 28 : Real unit labour costs ¹ (percentage change on preceding year, 1992-2010)
5-year averages 2008 2009 20101992-96 1997-01 2002-06 2004 2005 2006 2007 X-2008 IV-2009 X-2008 IV-2009 X-2008 IV-2009
Belgium -0.2 0.0 -1.0 -2.7 -0.9 -0.6 0.4 0.8 2.0 0.3 2.2 -0.2 -0.7Germany -0.2 -0.1 -1.0 -1.1 -1.5 -1.7 -1.4 0.0 0.5 0.7 3.8 -0.3 -2.2Ireland -1.7 -2.5 0.1 1.7 2.3 -0.2 2.2 5.6 7.3 1.4 -2.9 -0.2 -3.6Greece -0.7 -0.9 -0.5 -0.8 -0.5 -4.4 3.3 2.1 2.2 2.3 2.0 2.2 -0.9Spain -0.6 -0.7 -1.2 -1.5 -0.9 -0.8 -0.3 0.3 0.4 -0.6 0.0 -1.5 -0.9France -0.4 -0.2 -0.2 -0.5 -0.3 -0.5 -0.4 0.1 0.3 0.1 0.6 -0.2 -0.7Italy -1.6 -1.2 0.4 -0.5 0.6 0.3 -0.8 1.8 1.4 -0.1 1.3 0.1 -0.8Cyprus : -1.1 0.6 -1.7 -0.9 -2.3 -2.4 -0.6 -1.8 0.9 -0.6 -0.7 1.2Luxembourg 0.1 0.7 -2.5 -0.4 -2.9 -4.8 1.5 4.3 5.5 3.1 3.4 -1.2 -1.0Malta 1.2 -0.2 -1.2 -1.7 -3.0 -1.8 -1.8 -0.3 0.8 -0.3 1.0 -0.7 0.8Netherlands -0.4 -0.4 -0.5 -0.5 -2.7 -0.8 0.5 1.6 0.7 1.1 4.5 1.5 -1.1Austria -0.3 -0.6 -1.0 -2.2 -1.2 -0.8 -1.3 -0.1 0.6 0.2 2.7 -0.4 -0.4Portugal -0.6 0.2 -0.4 -1.4 0.8 -1.5 -1.6 1.3 1.7 -0.5 -0.5 -0.3 0.7Slovenia : -1.0 -0.7 0.3 -0.8 -0.9 -1.5 1.6 3.7 0.5 -0.9 -0.2 -0.4Slovakia : -0.3 -0.7 -2.8 1.9 -1.4 -0.5 0.3 2.2 -0.2 2.2 -0.9 1.5Finland -2.8 -1.3 0.3 -0.3 1.9 -1.6 -1.7 1.2 3.4 0.7 3.9 0.2 0.9Euro area -0.7 -0.5 -0.6 -1.0 -0.8 -1.0 -0.7 0.7 0.9 0.3 1.9 -0.2 -1.1Bulgaria : -1.7 -2.1 -4.0 -1.3 -3.8 5.9 4.7 4.3 2.4 0.9 1.4 0.2Czech Republic : 0.0 0.6 -3.1 -0.1 0.4 -0.5 0.9 2.5 2.5 2.6 2.2 0.3
Denmark -0.8 0.3 -0.1 -1.9 -0.7 0.3 2.2 0.8 2.6 0.8 2.6 -0.7 -1.2Estonia : -2.1 0.0 0.2 -1.7 1.9 9.0 7.7 10.7 0.8 4.1 -1.8 -5.1Latvia : -2.8 1.3 -0.6 4.6 4.9 5.6 7.3 7.0 0.6 -2.4 -2.8 0.5Lithuania : -1.2 1.4 0.8 -0.6 3.4 1.4 1.5 0.3 1.8 -9.1 -0.1 -5.4Hungary : -1.0 0.2 1.1 1.1 -2.5 -0.8 0.6 2.3 1.6 0.4 1.1 0.7Poland : -0.4 -3.8 -6.0 -2.3 -2.5 -2.7 1.4 3.9 0.2 0.5 -1.2 -1.7Romania -3.1 4.0 -3.4 -10.8 8.4 -5.1 2.6 -0.1 0.2 0.6 0.7 0.8 1.4Sweden -0.6 0.7 -1.3 -1.1 -0.8 -2.1 1.7 2.3 -0.6 1.3 2.1 -0.6 -2.0United Kingdom -1.7 0.8 -0.2 -0.1 0.5 -0.1 -1.4 -0.8 0.1 -0.2 1.6 0.6 -1.0EU : -0.3 -0.8 -1.4 -0.6 -1.1 -0.8 0.4 0.7 0.2 1.8 -0.1 -1.1USA -0.6 0.6 -0.8 -1.3 -1.2 0.0 0.1 -0.6 -0.5 -0.2 1.3 -0.7 -1.5Japan 0.0 -0.4 -1.3 -2.7 -0.4 -0.2 -1.7 0.4 1.7 -0.8 0.3 -0.9 -0.5
¹ Nominal unit labour costs divided by GDP price deflator.
Note : See note 6 on concepts and sources where countries using full time equivalents are listed.
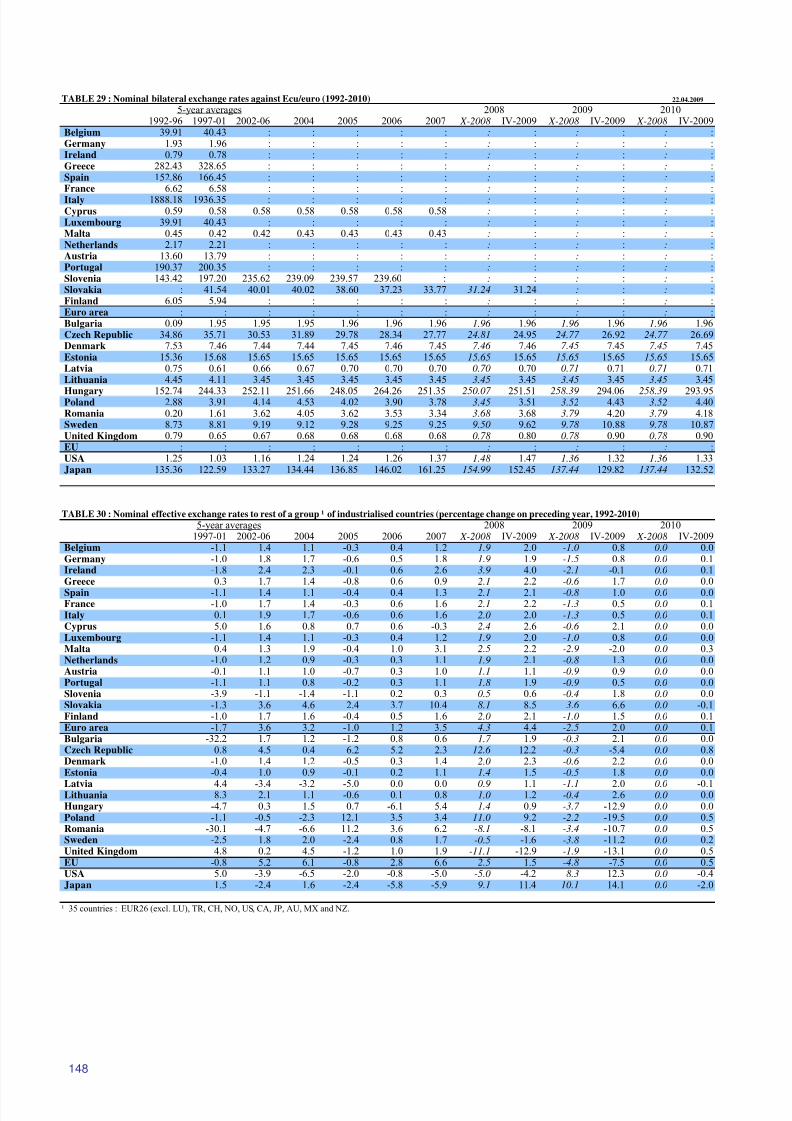
8/14/2019 Economic Forecast 2009
http://slidepdf.com/reader/full/economic-forecast-2009 154/172
148
TABLE 29 : Nominal bilateral exchange rates against Ecu/euro (1992-2010) 22.04.2009
5-year averages 2008 2009 20101992-96 1997-01 2002-06 2004 2005 2006 2007 X-2008 IV-2009 X-2008 IV-2009 X-2008 IV-2009
Belgium 39.91 40.43 : : : : : : : : : : :Germany 1.93 1.96 : : : : : : : : : : :Ireland 0.79 0.78 : : : : : : : : : : :Greece 282.43 328.65 : : : : : : : : : : :Spain 152.86 166.45 : : : : : : : : : : :France 6.62 6.58 : : : : : : : : : : :Italy 1888.18 1936.35 : : : : : : : : : : :Cyprus 0.59 0.58 0.58 0.58 0.58 0.58 0.58 : : : : : :Luxembourg 39.91 40.43 : : : : : : : : : : :Malta 0.45 0.42 0.42 0.43 0.43 0.43 0.43 : : : : : :Netherlands 2.17 2.21 : : : : : : : : : : :Austria 13.60 13.79 : : : : : : : : : : :Portugal 190.37 200.35 : : : : : : : : : : :Slovenia 143.42 197.20 235.62 239.09 239.57 239.60 : : : : : : :Slovakia : 41.54 40.01 40.02 38.60 37.23 33.77 31.24 31.24 : : : :Finland 6.05 5.94 : : : : : : : : : : :Euro area : : : : : : : : : : : : :Bulgaria 0.09 1.95 1.95 1.95 1.96 1.96 1.96 1.96 1.96 1.96 1.96 1.96 1.96Czech Republic 34.86 35.71 30.53 31.89 29.78 28.34 27.77 24.81 24.95 24.77 26.92 24.77 26.69Denmark 7.53 7.46 7.44 7.44 7.45 7.46 7.45 7.46 7.46 7.45 7.45 7.45 7.45Estonia 15.36 15.68 15.65 15.65 15.65 15.65 15.65 15.65 15.65 15.65 15.65 15.65 15.65Latvia 0.75 0.61 0.66 0.67 0.70 0.70 0.70 0.70 0.70 0.71 0.71 0.71 0.71Lithuania 4.45 4.11 3.45 3.45 3.45 3.45 3.45 3.45 3.45 3.45 3.45 3.45 3.45
Hungary 152.74 244.33 252.11 251.66 248.05 264.26 251.35 250.07 251.51 258.39 294.06 258.39 293.95Poland 2.88 3.91 4.14 4.53 4.02 3.90 3.78 3.45 3.51 3.52 4.43 3.52 4.40Romania 0.20 1.61 3.62 4.05 3.62 3.53 3.34 3.68 3.68 3.79 4.20 3.79 4.18Sweden 8.73 8.81 9.19 9.12 9.28 9.25 9.25 9.50 9.62 9.78 10.88 9.78 10.87United Kingdom 0.79 0.65 0.67 0.68 0.68 0.68 0.68 0.78 0.80 0.78 0.90 0.78 0.90EU : : : : : : : : : : : : :USA 1.25 1.03 1.16 1.24 1.24 1.26 1.37 1.48 1.47 1.36 1.32 1.36 1.33Japan 135.36 122.59 133.27 134.44 136.85 146.02 161.25 154.99 152.45 137.44 129.82 137.44 132.52
TABLE 30 : Nominal effective exchange rates to rest of a group ¹ of industrialised countries (percentage change on preceding year, 1992-2010)
5-year averages 2008 2009 20101997-01 2002-06 2004 2005 2006 2007 X-2008 IV-2009 X-2008 IV-2009 X-2008 IV-2009
Belgium -1.1 1.4 1.1 -0.3 0.4 1.2 1.9 2.0 -1.0 0.8 0.0 0.0Germany -1.0 1.8 1.7 -0.6 0.5 1.8 1.9 1.9 -1.5 0.8 0.0 0.1Ireland -1.8 2.4 2.3 -0.1 0.6 2.6 3.9 4.0 -2.1 -0.1 0.0 0.1Greece 0.3 1.7 1.4 -0.8 0.6 0.9 2.1 2.2 -0.6 1.7 0.0 0.0
Spain -1.1 1.4 1.1 -0.4 0.4 1.3 2.1 2.1 -0.8 1.0 0.0 0.0France -1.0 1.7 1.4 -0.3 0.6 1.6 2.1 2.2 -1.3 0.5 0.0 0.1Italy 0.1 1.9 1.7 -0.6 0.6 1.6 2.0 2.0 -1.3 0.5 0.0 0.1Cyprus 5.0 1.6 0.8 0.7 0.6 -0.3 2.4 2.6 -0.6 2.1 0.0 0.0Luxembourg -1.1 1.4 1.1 -0.3 0.4 1.2 1.9 2.0 -1.0 0.8 0.0 0.0Malta 0.4 1.3 1.9 -0.4 1.0 3.1 2.5 2.2 -2.9 -2.0 0.0 0.3Netherlands -1.0 1.2 0.9 -0.3 0.3 1.1 1.9 2.1 -0.8 1.3 0.0 0.0Austria -0.1 1.1 1.0 -0.7 0.3 1.0 1.1 1.1 -0.9 0.9 0.0 0.0Portugal -1.1 1.1 0.8 -0.2 0.3 1.1 1.8 1.9 -0.9 0.5 0.0 0.0Slovenia -3.9 -1.1 -1.4 -1.1 0.2 0.3 0.5 0.6 -0.4 1.8 0.0 0.0Slovakia -1.3 3.6 4.6 2.4 3.7 10.4 8.1 8.5 3.6 6.6 0.0 -0.1Finland -1.0 1.7 1.6 -0.4 0.5 1.6 2.0 2.1 -1.0 1.5 0.0 0.1Euro area -1.7 3.6 3.2 -1.0 1.2 3.5 4.3 4.4 -2.5 2.0 0.0 0.1Bulgaria -32.2 1.7 1.2 -1.2 0.8 0.6 1.7 1.9 -0.3 2.1 0.0 0.0Czech Republic 0.8 4.5 0.4 6.2 5.2 2.3 12.6 12.2 -0.3 -5.4 0.0 0.8Denmark -1.0 1.4 1.2 -0.5 0.3 1.4 2.0 2.3 -0.6 2.2 0.0 0.0Estonia -0.4 1.0 0.9 -0.1 0.2 1.1 1.4 1.5 -0.5 1.8 0.0 0.0
Latvia 4.4 -3.4 -3.2 -5.0 0.0 0.0 0.9 1.1 -1.1 2.0 0.0 -0.1Lithuania 8.3 2.1 1.1 -0.6 0.1 0.8 1.0 1.2 -0.4 2.6 0.0 0.0Hungary -4.7 0.3 1.5 0.7 -6.1 5.4 1.4 0.9 -3.7 -12.9 0.0 0.0Poland -1.1 -0.5 -2.3 12.1 3.5 3.4 11.0 9.2 -2.2 -19.5 0.0 0.5Romania -30.1 -4.7 -6.6 11.2 3.6 6.2 -8.1 -8.1 -3.4 -10.7 0.0 0.5Sweden -2.5 1.8 2.0 -2.4 0.8 1.7 -0.5 -1.6 -3.8 -11.2 0.0 0.2United Kingdom 4.8 0.2 4.5 -1.2 1.0 1.9 -11.1 -12.9 -1.9 -13.1 0.0 0.5EU -0.8 5.2 6.1 -0.8 2.8 6.6 2.5 1.5 -4.8 -7.5 0.0 0.5USA 5.0 -3.9 -6.5 -2.0 -0.8 -5.0 -5.0 -4.2 8.3 12.3 0.0 -0.4Japan 1.5 -2.4 1.6 -2.4 -5.8 -5.9 9.1 11.4 10.1 14.1 0.0 -2.0
¹ 35 countries : EUR26 (excl. LU), TR, CH, NO, US, CA, JP, AU, MX and NZ.
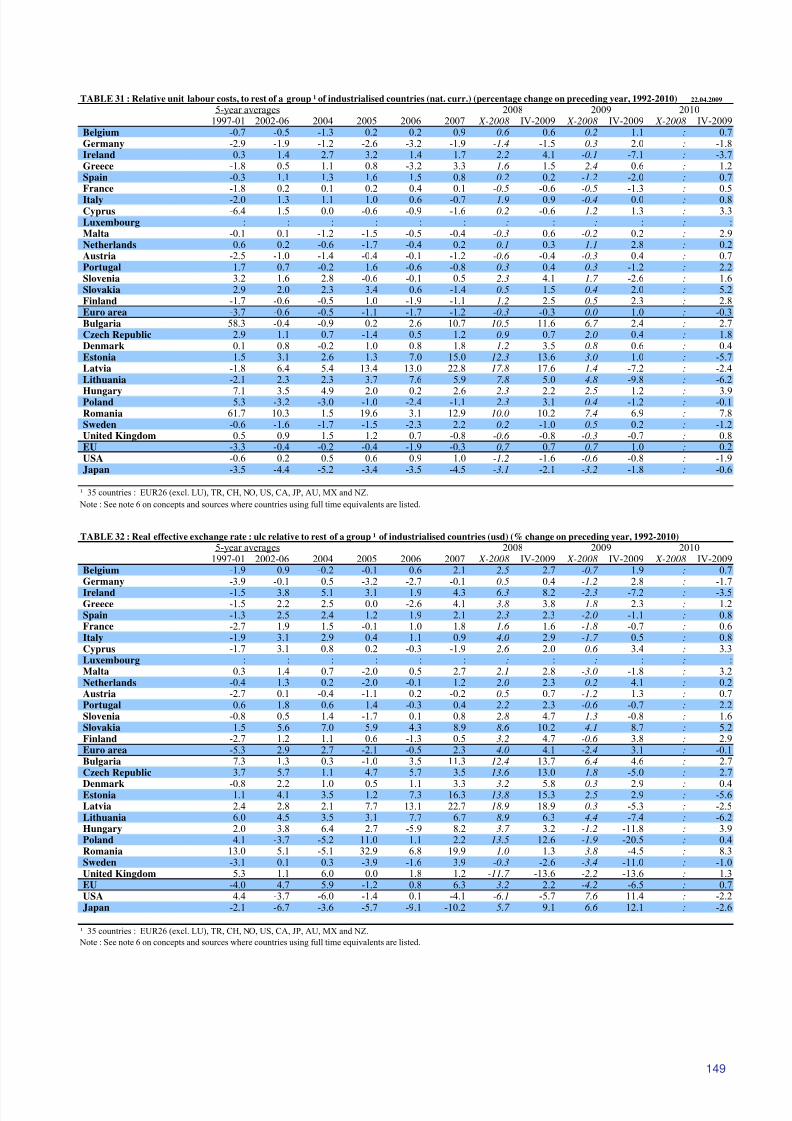
8/14/2019 Economic Forecast 2009
http://slidepdf.com/reader/full/economic-forecast-2009 155/172
149
TABLE 31 : Relative unit labour costs, to rest of a group ¹ of industrialised countries (nat. curr.) (percentage change on preceding year, 1992-2010) 22.04.2009
5-year averages 2008 2009 20101997-01 2002-06 2004 2005 2006 2007 X-2008 IV-2009 X-2008 IV-2009 X-2008 IV-2009
Belgium -0.7 -0.5 -1.3 0.2 0.2 0.9 0.6 0.6 0.2 1.1 : 0.7Germany -2.9 -1.9 -1.2 -2.6 -3.2 -1.9 -1.4 -1.5 0.3 2.0 : -1.8Ireland 0.3 1.4 2.7 3.2 1.4 1.7 2.2 4.1 -0.1 -7.1 : -3.7Greece -1.8 0.5 1.1 0.8 -3.2 3.3 1.6 1.5 2.4 0.6 : 1.2Spain -0.3 1.1 1.3 1.6 1.5 0.8 0.2 0.2 -1.2 -2.0 : 0.7France -1.8 0.2 0.1 0.2 0.4 0.1 -0.5 -0.6 -0.5 -1.3 : 0.5Italy -2.0 1.3 1.1 1.0 0.6 -0.7 1.9 0.9 -0.4 0.0 : 0.8Cyprus -6.4 1.5 0.0 -0.6 -0.9 -1.6 0.2 -0.6 1.2 1.3 : 3.3Luxembourg : : : : : : : : : : : :Malta -0.1 0.1 -1.2 -1.5 -0.5 -0.4 -0.3 0.6 -0.2 0.2 : 2.9Netherlands 0.6 0.2 -0.6 -1.7 -0.4 0.2 0.1 0.3 1.1 2.8 : 0.2Austria -2.5 -1.0 -1.4 -0.4 -0.1 -1.2 -0.6 -0.4 -0.3 0.4 : 0.7Portugal 1.7 0.7 -0.2 1.6 -0.6 -0.8 0.3 0.4 0.3 -1.2 : 2.2Slovenia 3.2 1.6 2.8 -0.6 -0.1 0.5 2.3 4.1 1.7 -2.6 : 1.6Slovakia 2.9 2.0 2.3 3.4 0.6 -1.4 0.5 1.5 0.4 2.0 : 5.2Finland -1.7 -0.6 -0.5 1.0 -1.9 -1.1 1.2 2.5 0.5 2.3 : 2.8Euro area -3.7 -0.6 -0.5 -1.1 -1.7 -1.2 -0.3 -0.3 0.0 1.0 : -0.3Bulgaria 58.3 -0.4 -0.9 0.2 2.6 10.7 10.5 11.6 6.7 2.4 : 2.7Czech Republic 2.9 1.1 0.7 -1.4 0.5 1.2 0.9 0.7 2.0 0.4 : 1.8Denmark 0.1 0.8 -0.2 1.0 0.8 1.8 1.2 3.5 0.8 0.6 : 0.4Estonia 1.5 3.1 2.6 1.3 7.0 15.0 12.3 13.6 3.0 1.0 : -5.7Latvia -1.8 6.4 5.4 13.4 13.0 22.8 17.8 17.6 1.4 -7.2 : -2.4Lithuania -2.1 2.3 2.3 3.7 7.6 5.9 7.8 5.0 4.8 -9.8 : -6.2
Hungary 7.1 3.5 4.9 2.0 0.2 2.6 2.3 2.2 2.5 1.2 : 3.9Poland 5.3 -3.2 -3.0 -1.0 -2.4 -1.1 2.3 3.1 0.4 -1.2 : -0.1Romania 61.7 10.3 1.5 19.6 3.1 12.9 10.0 10.2 7.4 6.9 : 7.8Sweden -0.6 -1.6 -1.7 -1.5 -2.3 2.2 0.2 -1.0 0.5 0.2 : -1.2United Kingdom 0.5 0.9 1.5 1.2 0.7 -0.8 -0.6 -0.8 -0.3 -0.7 : 0.8EU -3.3 -0.4 -0.2 -0.4 -1.9 -0.3 0.7 0.7 0.7 1.0 : 0.2USA -0.6 0.2 0.5 0.6 0.9 1.0 -1.2 -1.6 -0.6 -0.8 : -1.9Japan -3.5 -4.4 -5.2 -3.4 -3.5 -4.5 -3.1 -2.1 -3.2 -1.8 : -0.6
¹ 35 countries : EUR26 (excl. LU), TR, CH, NO, US, CA, JP, AU, MX and NZ.
Note : See note 6 on concepts and sources where countries using full time equivalents are listed.
TABLE 32 : Real effective exchange rate : ulc relative to rest of a group ¹ of industrialised countries (usd) (% change on preceding year, 1992-2010)
5-year averages 2008 2009 20101997-01 2002-06 2004 2005 2006 2007 X-2008 IV-2009 X-2008 IV-2009 X-2008 IV-2009
Belgium -1.9 0.9 -0.2 -0.1 0.6 2.1 2.5 2.7 -0.7 1.9 : 0.7Germany -3.9 -0.1 0.5 -3.2 -2.7 -0.1 0.5 0.4 -1.2 2.8 : -1.7Ireland -1.5 3.8 5.1 3.1 1.9 4.3 6.3 8.2 -2.3 -7.2 : -3.5Greece -1.5 2.2 2.5 0.0 -2.6 4.1 3.8 3.8 1.8 2.3 : 1.2Spain -1.3 2.5 2.4 1.2 1.9 2.1 2.3 2.3 -2.0 -1.1 : 0.8France -2.7 1.9 1.5 -0.1 1.0 1.8 1.6 1.6 -1.8 -0.7 : 0.6Italy -1.9 3.1 2.9 0.4 1.1 0.9 4.0 2.9 -1.7 0.5 : 0.8Cyprus -1.7 3.1 0.8 0.2 -0.3 -1.9 2.6 2.0 0.6 3.4 : 3.3Luxembourg : : : : : : : : : : : :Malta 0.3 1.4 0.7 -2.0 0.5 2.7 2.1 2.8 -3.0 -1.8 : 3.2Netherlands -0.4 1.3 0.2 -2.0 -0.1 1.2 2.0 2.3 0.2 4.1 : 0.2Austria -2.7 0.1 -0.4 -1.1 0.2 -0.2 0.5 0.7 -1.2 1.3 : 0.7Portugal 0.6 1.8 0.6 1.4 -0.3 0.4 2.2 2.3 -0.6 -0.7 : 2.2Slovenia -0.8 0.5 1.4 -1.7 0.1 0.8 2.8 4.7 1.3 -0.8 : 1.6Slovakia 1.5 5.6 7.0 5.9 4.3 8.9 8.6 10.2 4.1 8.7 : 5.2Finland -2.7 1.2 1.1 0.6 -1.3 0.5 3.2 4.7 -0.6 3.8 : 2.9Euro area -5.3 2.9 2.7 -2.1 -0.5 2.3 4.0 4.1 -2.4 3.1 : -0.1Bulgaria 7.3 1.3 0.3 -1.0 3.5 11.3 12.4 13.7 6.4 4.6 : 2.7Czech Republic 3.7 5.7 1.1 4.7 5.7 3.5 13.6 13.0 1.8 -5.0 : 2.7
Denmark -0.8 2.2 1.0 0.5 1.1 3.3 3.2 5.8 0.3 2.9 : 0.4Estonia 1.1 4.1 3.5 1.2 7.3 16.3 13.8 15.3 2.5 2.9 : -5.6Latvia 2.4 2.8 2.1 7.7 13.1 22.7 18.9 18.9 0.3 -5.3 : -2.5Lithuania 6.0 4.5 3.5 3.1 7.7 6.7 8.9 6.3 4.4 -7.4 : -6.2Hungary 2.0 3.8 6.4 2.7 -5.9 8.2 3.7 3.2 -1.2 -11.8 : 3.9Poland 4.1 -3.7 -5.2 11.0 1.1 2.2 13.5 12.6 -1.9 -20.5 : 0.4Romania 13.0 5.1 -5.1 32.9 6.8 19.9 1.0 1.3 3.8 -4.5 : 8.3Sweden -3.1 0.1 0.3 -3.9 -1.6 3.9 -0.3 -2.6 -3.4 -11.0 : -1.0United Kingdom 5.3 1.1 6.0 0.0 1.8 1.2 -11.7 -13.6 -2.2 -13.6 : 1.3EU -4.0 4.7 5.9 -1.2 0.8 6.3 3.2 2.2 -4.2 -6.5 : 0.7USA 4.4 -3.7 -6.0 -1.4 0.1 -4.1 -6.1 -5.7 7.6 11.4 : -2.2Japan -2.1 -6.7 -3.6 -5.7 -9.1 -10.2 5.7 9.1 6.6 12.1 : -2.6
¹ 35 countries : EUR26 (excl. LU), TR, CH, NO, US, CA, JP, AU, MX and NZ.
Note : See note 6 on concepts and sources where countries using full time equivalents are listed.
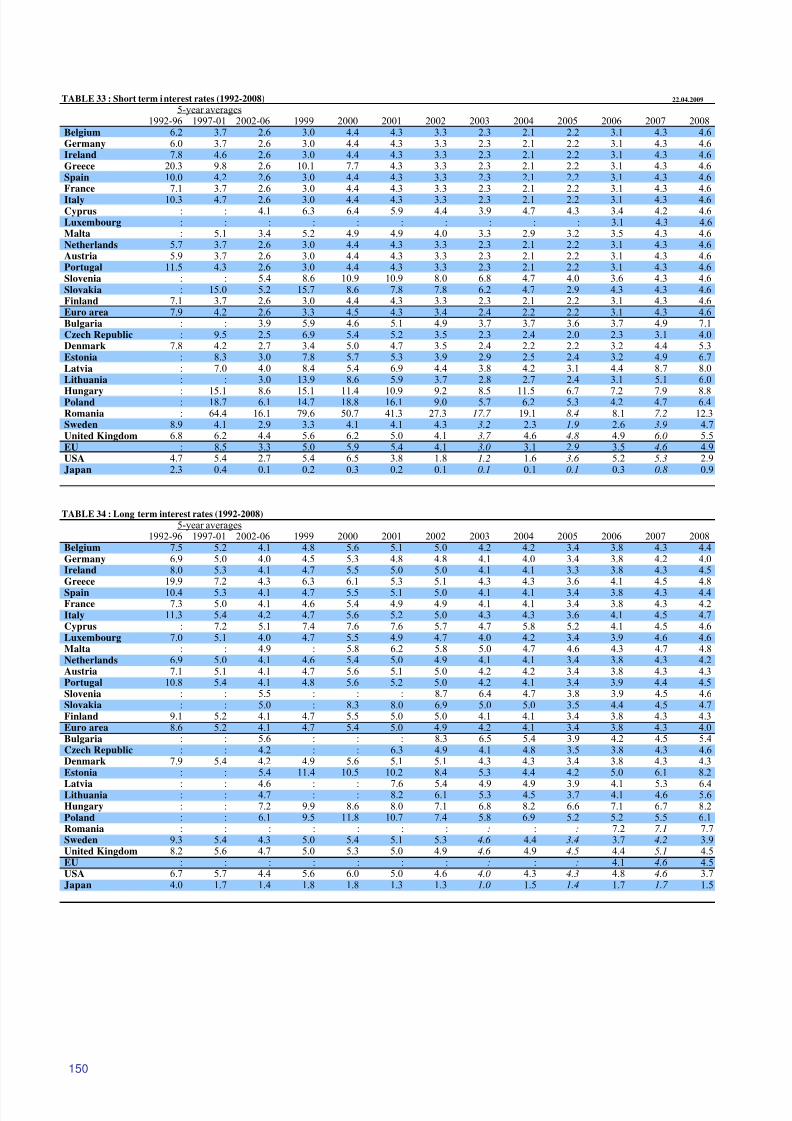
8/14/2019 Economic Forecast 2009
http://slidepdf.com/reader/full/economic-forecast-2009 156/172
150
TABLE 33 : Short term interest rates (1992-2008) 22.04.2009
5-year averages1992-96 1997-01 2002-06 1999 2000 2001 2002 2003 2004 2005 2006 2007 2008
Belgium 6.2 3.7 2.6 3.0 4.4 4.3 3.3 2.3 2.1 2.2 3.1 4.3 4.6Germany 6.0 3.7 2.6 3.0 4.4 4.3 3.3 2.3 2.1 2.2 3.1 4.3 4.6Ireland 7.8 4.6 2.6 3.0 4.4 4.3 3.3 2.3 2.1 2.2 3.1 4.3 4.6Greece 20.3 9.8 2.6 10.1 7.7 4.3 3.3 2.3 2.1 2.2 3.1 4.3 4.6Spain 10.0 4.2 2.6 3.0 4.4 4.3 3.3 2.3 2.1 2.2 3.1 4.3 4.6France 7.1 3.7 2.6 3.0 4.4 4.3 3.3 2.3 2.1 2.2 3.1 4.3 4.6Italy 10.3 4.7 2.6 3.0 4.4 4.3 3.3 2.3 2.1 2.2 3.1 4.3 4.6Cyprus : : 4.1 6.3 6.4 5.9 4.4 3.9 4.7 4.3 3.4 4.2 4.6Luxembourg : : : : : : : : : : 3.1 4.3 4.6Malta : 5.1 3.4 5.2 4.9 4.9 4.0 3.3 2.9 3.2 3.5 4.3 4.6Netherlands 5.7 3.7 2.6 3.0 4.4 4.3 3.3 2.3 2.1 2.2 3.1 4.3 4.6Austria 5.9 3.7 2.6 3.0 4.4 4.3 3.3 2.3 2.1 2.2 3.1 4.3 4.6Portugal 11.5 4.3 2.6 3.0 4.4 4.3 3.3 2.3 2.1 2.2 3.1 4.3 4.6Slovenia : : 5.4 8.6 10.9 10.9 8.0 6.8 4.7 4.0 3.6 4.3 4.6Slovakia : 15.0 5.2 15.7 8.6 7.8 7.8 6.2 4.7 2.9 4.3 4.3 4.6Finland 7.1 3.7 2.6 3.0 4.4 4.3 3.3 2.3 2.1 2.2 3.1 4.3 4.6Euro area 7.9 4.2 2.6 3.3 4.5 4.3 3.4 2.4 2.2 2.2 3.1 4.3 4.6Bulgaria : : 3.9 5.9 4.6 5.1 4.9 3.7 3.7 3.6 3.7 4.9 7.1Czech Republic : 9.5 2.5 6.9 5.4 5.2 3.5 2.3 2.4 2.0 2.3 3.1 4.0Denmark 7.8 4.2 2.7 3.4 5.0 4.7 3.5 2.4 2.2 2.2 3.2 4.4 5.3Estonia : 8.3 3.0 7.8 5.7 5.3 3.9 2.9 2.5 2.4 3.2 4.9 6.7Latvia : 7.0 4.0 8.4 5.4 6.9 4.4 3.8 4.2 3.1 4.4 8.7 8.0Lithuania : : 3.0 13.9 8.6 5.9 3.7 2.8 2.7 2.4 3.1 5.1 6.0
Hungary : 15.1 8.6 15.1 11.4 10.9 9.2 8.5 11.5 6.7 7.2 7.9 8.8Poland : 18.7 6.1 14.7 18.8 16.1 9.0 5.7 6.2 5.3 4.2 4.7 6.4Romania : 64.4 16.1 79.6 50.7 41.3 27.3 17.7 19.1 8.4 8.1 7.2 12.3Sweden 8.9 4.1 2.9 3.3 4.1 4.1 4.3 3.2 2.3 1.9 2.6 3.9 4.7United Kingdom 6.8 6.2 4.4 5.6 6.2 5.0 4.1 3.7 4.6 4.8 4.9 6.0 5.5EU : 8.5 3.3 5.0 5.9 5.4 4.1 3.0 3.1 2.9 3.5 4.6 4.9USA 4.7 5.4 2.7 5.4 6.5 3.8 1.8 1.2 1.6 3.6 5.2 5.3 2.9Japan 2.3 0.4 0.1 0.2 0.3 0.2 0.1 0.1 0.1 0.1 0.3 0.8 0.9
TABLE 34 : Long term interest rates (1992-2008)
5-year averages1992-96 1997-01 2002-06 1999 2000 2001 2002 2003 2004 2005 2006 2007 2008
Belgium 7.5 5.2 4.1 4.8 5.6 5.1 5.0 4.2 4.2 3.4 3.8 4.3 4.4Germany 6.9 5.0 4.0 4.5 5.3 4.8 4.8 4.1 4.0 3.4 3.8 4.2 4.0Ireland 8.0 5.3 4.1 4.7 5.5 5.0 5.0 4.1 4.1 3.3 3.8 4.3 4.5Greece 19.9 7.2 4.3 6.3 6.1 5.3 5.1 4.3 4.3 3.6 4.1 4.5 4.8
Spain 10.4 5.3 4.1 4.7 5.5 5.1 5.0 4.1 4.1 3.4 3.8 4.3 4.4France 7.3 5.0 4.1 4.6 5.4 4.9 4.9 4.1 4.1 3.4 3.8 4.3 4.2Italy 11.3 5.4 4.2 4.7 5.6 5.2 5.0 4.3 4.3 3.6 4.1 4.5 4.7Cyprus : 7.2 5.1 7.4 7.6 7.6 5.7 4.7 5.8 5.2 4.1 4.5 4.6Luxembourg 7.0 5.1 4.0 4.7 5.5 4.9 4.7 4.0 4.2 3.4 3.9 4.6 4.6Malta : : 4.9 : 5.8 6.2 5.8 5.0 4.7 4.6 4.3 4.7 4.8Netherlands 6.9 5.0 4.1 4.6 5.4 5.0 4.9 4.1 4.1 3.4 3.8 4.3 4.2Austria 7.1 5.1 4.1 4.7 5.6 5.1 5.0 4.2 4.2 3.4 3.8 4.3 4.3Portugal 10.8 5.4 4.1 4.8 5.6 5.2 5.0 4.2 4.1 3.4 3.9 4.4 4.5Slovenia : : 5.5 : : : 8.7 6.4 4.7 3.8 3.9 4.5 4.6Slovakia : : 5.0 : 8.3 8.0 6.9 5.0 5.0 3.5 4.4 4.5 4.7Finland 9.1 5.2 4.1 4.7 5.5 5.0 5.0 4.1 4.1 3.4 3.8 4.3 4.3Euro area 8.6 5.2 4.1 4.7 5.4 5.0 4.9 4.2 4.1 3.4 3.8 4.3 4.0Bulgaria : : 5.6 : : : 8.3 6.5 5.4 3.9 4.2 4.5 5.4Czech Republic : : 4.2 : : 6.3 4.9 4.1 4.8 3.5 3.8 4.3 4.6Denmark 7.9 5.4 4.2 4.9 5.6 5.1 5.1 4.3 4.3 3.4 3.8 4.3 4.3Estonia : : 5.4 11.4 10.5 10.2 8.4 5.3 4.4 4.2 5.0 6.1 8.2
Latvia : : 4.6 : : 7.6 5.4 4.9 4.9 3.9 4.1 5.3 6.4Lithuania : : 4.7 : : 8.2 6.1 5.3 4.5 3.7 4.1 4.6 5.6Hungary : : 7.2 9.9 8.6 8.0 7.1 6.8 8.2 6.6 7.1 6.7 8.2Poland : : 6.1 9.5 11.8 10.7 7.4 5.8 6.9 5.2 5.2 5.5 6.1Romania : : : : : : : : : : 7.2 7.1 7.7Sweden 9.3 5.4 4.3 5.0 5.4 5.1 5.3 4.6 4.4 3.4 3.7 4.2 3.9United Kingdom 8.2 5.6 4.7 5.0 5.3 5.0 4.9 4.6 4.9 4.5 4.4 5.1 4.5EU : : : : : : : : : : 4.1 4.6 4.5USA 6.7 5.7 4.4 5.6 6.0 5.0 4.6 4.0 4.3 4.3 4.8 4.6 3.7Japan 4.0 1.7 1.4 1.8 1.8 1.3 1.3 1.0 1.5 1.4 1.7 1.7 1.5
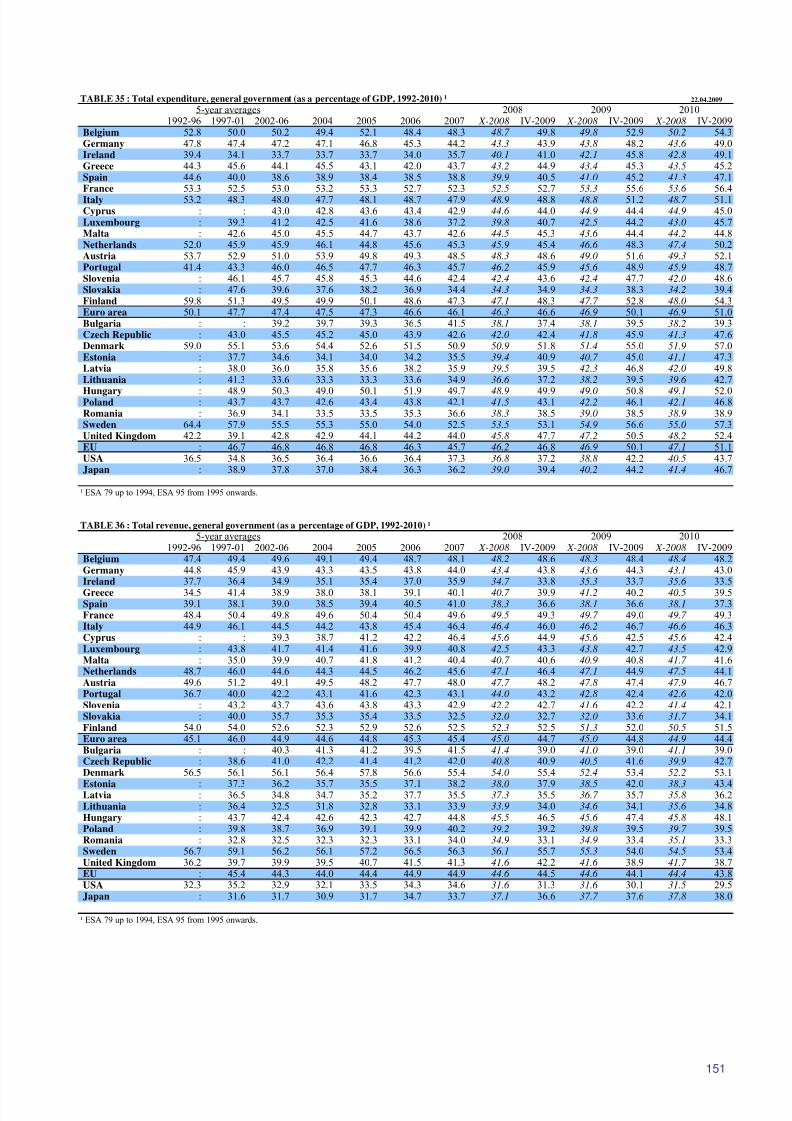
8/14/2019 Economic Forecast 2009
http://slidepdf.com/reader/full/economic-forecast-2009 157/172
151
TABLE 35 : Total expenditure, general government (as a percentage of GDP, 1992-2010) ¹ 22.04.2009
5-year averages 2008 2009 20101992-96 1997-01 2002-06 2004 2005 2006 2007 X-2008 IV-2009 X-2008 IV-2009 X-2008 IV-2009
Belgium 52.8 50.0 50.2 49.4 52.1 48.4 48.3 48.7 49.8 49.8 52.9 50.2 54.3Germany 47.8 47.4 47.2 47.1 46.8 45.3 44.2 43.3 43.9 43.8 48.2 43.6 49.0Ireland 39.4 34.1 33.7 33.7 33.7 34.0 35.7 40.1 41.0 42.1 45.8 42.8 49.1Greece 44.3 45.6 44.1 45.5 43.1 42.0 43.7 43.2 44.9 43.4 45.3 43.5 45.2Spain 44.6 40.0 38.6 38.9 38.4 38.5 38.8 39.9 40.5 41.0 45.2 41.3 47.1France 53.3 52.5 53.0 53.2 53.3 52.7 52.3 52.5 52.7 53.3 55.6 53.6 56.4Italy 53.2 48.3 48.0 47.7 48.1 48.7 47.9 48.9 48.8 48.8 51.2 48.7 51.1Cyprus : : 43.0 42.8 43.6 43.4 42.9 44.6 44.0 44.9 44.4 44.9 45.0Luxembourg : 39.3 41.2 42.5 41.6 38.6 37.2 39.8 40.7 42.5 44.2 43.0 45.7Malta : 42.6 45.0 45.5 44.7 43.7 42.6 44.5 45.3 43.6 44.4 44.2 44.8Netherlands 52.0 45.9 45.9 46.1 44.8 45.6 45.3 45.9 45.4 46.6 48.3 47.4 50.2Austria 53.7 52.9 51.0 53.9 49.8 49.3 48.5 48.3 48.6 49.0 51.6 49.3 52.1Portugal 41.4 43.3 46.0 46.5 47.7 46.3 45.7 46.2 45.9 45.6 48.9 45.9 48.7Slovenia : 46.1 45.7 45.8 45.3 44.6 42.4 42.4 43.6 42.4 47.7 42.0 48.6Slovakia : 47.6 39.6 37.6 38.2 36.9 34.4 34.3 34.9 34.3 38.3 34.2 39.4Finland 59.8 51.3 49.5 49.9 50.1 48.6 47.3 47.1 48.3 47.7 52.8 48.0 54.3Euro area 50.1 47.7 47.4 47.5 47.3 46.6 46.1 46.3 46.6 46.9 50.1 46.9 51.0Bulgaria : : 39.2 39.7 39.3 36.5 41.5 38.1 37.4 38.1 39.5 38.2 39.3Czech Republic : 43.0 45.5 45.2 45.0 43.9 42.6 42.0 42.4 41.8 45.9 41.3 47.6Denmark 59.0 55.1 53.6 54.4 52.6 51.5 50.9 50.9 51.8 51.4 55.0 51.9 57.0Estonia : 37.7 34.6 34.1 34.0 34.2 35.5 39.4 40.9 40.7 45.0 41.1 47.3Latvia : 38.0 36.0 35.8 35.6 38.2 35.9 39.5 39.5 42.3 46.8 42.0 49.8Lithuania : 41.3 33.6 33.3 33.3 33.6 34.9 36.6 37.2 38.2 39.5 39.6 42.7
Hungary : 48.9 50.3 49.0 50.1 51.9 49.7 48.9 49.9 49.0 50.8 49.1 52.0Poland : 43.7 43.7 42.6 43.4 43.8 42.1 41.5 43.1 42.2 46.1 42.1 46.8Romania : 36.9 34.1 33.5 33.5 35.3 36.6 38.3 38.5 39.0 38.5 38.9 38.9Sweden 64.4 57.9 55.5 55.3 55.0 54.0 52.5 53.5 53.1 54.9 56.6 55.0 57.3United Kingdom 42.2 39.1 42.8 42.9 44.1 44.2 44.0 45.8 47.7 47.2 50.5 48.2 52.4EU : 46.7 46.8 46.8 46.8 46.3 45.7 46.2 46.8 46.9 50.1 47.1 51.1USA 36.5 34.8 36.5 36.4 36.6 36.4 37.3 36.8 37.2 38.8 42.2 40.5 43.7Japan : 38.9 37.8 37.0 38.4 36.3 36.2 39.0 39.4 40.2 44.2 41.4 46.7
¹ ESA 79 up to 1994, ESA 95 from 1995 onwards.
TABLE 36 : Total revenue, general government (as a percentage of GDP, 1992-2010) ¹
5-year averages 2008 2009 20101992-96 1997-01 2002-06 2004 2005 2006 2007 X-2008 IV-2009 X-2008 IV-2009 X-2008 IV-2009
Belgium 47.4 49.4 49.6 49.1 49.4 48.7 48.1 48.2 48.6 48.3 48.4 48.4 48.2Germany 44.8 45.9 43.9 43.3 43.5 43.8 44.0 43.4 43.8 43.6 44.3 43.1 43.0Ireland 37.7 36.4 34.9 35.1 35.4 37.0 35.9 34.7 33.8 35.3 33.7 35.6 33.5
Greece 34.5 41.4 38.9 38.0 38.1 39.1 40.1 40.7 39.9 41.2 40.2 40.5 39.5Spain 39.1 38.1 39.0 38.5 39.4 40.5 41.0 38.3 36.6 38.1 36.6 38.1 37.3France 48.4 50.4 49.8 49.6 50.4 50.4 49.6 49.5 49.3 49.7 49.0 49.7 49.3Italy 44.9 46.1 44.5 44.2 43.8 45.4 46.4 46.4 46.0 46.2 46.7 46.6 46.3Cyprus : : 39.3 38.7 41.2 42.2 46.4 45.6 44.9 45.6 42.5 45.6 42.4Luxembourg : 43.8 41.7 41.4 41.6 39.9 40.8 42.5 43.3 43.8 42.7 43.5 42.9Malta : 35.0 39.9 40.7 41.8 41.2 40.4 40.7 40.6 40.9 40.8 41.7 41.6Netherlands 48.7 46.0 44.6 44.3 44.5 46.2 45.6 47.1 46.4 47.1 44.9 47.5 44.1Austria 49.6 51.2 49.1 49.5 48.2 47.7 48.0 47.7 48.2 47.8 47.4 47.9 46.7Portugal 36.7 40.0 42.2 43.1 41.6 42.3 43.1 44.0 43.2 42.8 42.4 42.6 42.0Slovenia : 43.2 43.7 43.6 43.8 43.3 42.9 42.2 42.7 41.6 42.2 41.4 42.1Slovakia : 40.0 35.7 35.3 35.4 33.5 32.5 32.0 32.7 32.0 33.6 31.7 34.1Finland 54.0 54.0 52.6 52.3 52.9 52.6 52.5 52.3 52.5 51.3 52.0 50.5 51.5Euro area 45.1 46.0 44.9 44.6 44.8 45.3 45.4 45.0 44.7 45.0 44.8 44.9 44.4Bulgaria : : 40.3 41.3 41.2 39.5 41.5 41.4 39.0 41.0 39.0 41.1 39.0Czech Republic : 38.6 41.0 42.2 41.4 41.2 42.0 40.8 40.9 40.5 41.6 39.9 42.7Denmark 56.5 56.1 56.1 56.4 57.8 56.6 55.4 54.0 55.4 52.4 53.4 52.2 53.1
Estonia : 37.3 36.2 35.7 35.5 37.1 38.2 38.0 37.9 38.5 42.0 38.3 43.4Latvia : 36.5 34.8 34.7 35.2 37.7 35.5 37.3 35.5 36.7 35.7 35.8 36.2Lithuania : 36.4 32.5 31.8 32.8 33.1 33.9 33.9 34.0 34.6 34.1 35.6 34.8Hungary : 43.7 42.4 42.6 42.3 42.7 44.8 45.5 46.5 45.6 47.4 45.8 48.1Poland : 39.8 38.7 36.9 39.1 39.9 40.2 39.2 39.2 39.8 39.5 39.7 39.5Romania : 32.8 32.5 32.3 32.3 33.1 34.0 34.9 33.1 34.9 33.4 35.1 33.3Sweden 56.7 59.1 56.2 56.1 57.2 56.5 56.3 56.1 55.7 55.3 54.0 54.5 53.4United Kingdom 36.2 39.7 39.9 39.5 40.7 41.5 41.3 41.6 42.2 41.6 38.9 41.7 38.7EU : 45.4 44.3 44.0 44.4 44.9 44.9 44.6 44.5 44.6 44.1 44.4 43.8USA 32.3 35.2 32.9 32.1 33.5 34.3 34.6 31.6 31.3 31.6 30.1 31.5 29.5Japan : 31.6 31.7 30.9 31.7 34.7 33.7 37.1 36.6 37.7 37.6 37.8 38.0
¹ ESA 79 up to 1994, ESA 95 from 1995 onwards.
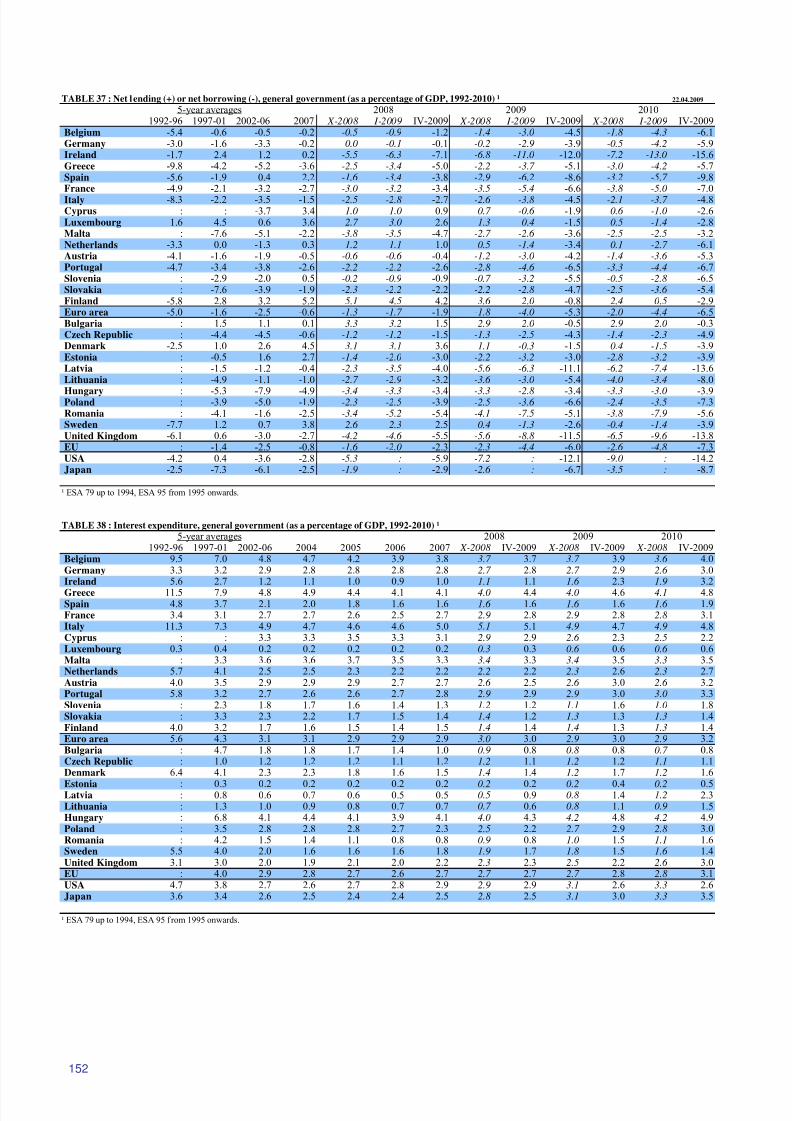
8/14/2019 Economic Forecast 2009
http://slidepdf.com/reader/full/economic-forecast-2009 158/172
152
TABLE 37 : Net lending (+) or net borrowing (-), general government (as a percentage of GDP, 1992-2010) ¹ 22.04.2009
5-year averages 2008 2009 20101992-96 1997-01 2002-06 2007 X-2008 I-2009 IV-2009 X-2008 I-2009 IV-2009 X-2008 I-2009 IV-2009
Belgium -5.4 -0.6 -0.5 -0.2 -0.5 -0.9 -1.2 -1.4 -3.0 -4.5 -1.8 -4.3 -6.1Germany -3.0 -1.6 -3.3 -0.2 0.0 -0.1 -0.1 -0.2 -2.9 -3.9 -0.5 -4.2 -5.9Ireland -1.7 2.4 1.2 0.2 -5.5 -6.3 -7.1 -6.8 -11.0 -12.0 -7.2 -13.0 -15.6Greece -9.8 -4.2 -5.2 -3.6 -2.5 -3.4 -5.0 -2.2 -3.7 -5.1 -3.0 -4.2 -5.7Spain -5.6 -1.9 0.4 2.2 -1.6 -3.4 -3.8 -2.9 -6.2 -8.6 -3.2 -5.7 -9.8France -4.9 -2.1 -3.2 -2.7 -3.0 -3.2 -3.4 -3.5 -5.4 -6.6 -3.8 -5.0 -7.0Italy -8.3 -2.2 -3.5 -1.5 -2.5 -2.8 -2.7 -2.6 -3.8 -4.5 -2.1 -3.7 -4.8Cyprus : : -3.7 3.4 1.0 1.0 0.9 0.7 -0.6 -1.9 0.6 -1.0 -2.6Luxembourg 1.6 4.5 0.6 3.6 2.7 3.0 2.6 1.3 0.4 -1.5 0.5 -1.4 -2.8Malta : -7.6 -5.1 -2.2 -3.8 -3.5 -4.7 -2.7 -2.6 -3.6 -2.5 -2.5 -3.2Netherlands -3.3 0.0 -1.3 0.3 1.2 1.1 1.0 0.5 -1.4 -3.4 0.1 -2.7 -6.1Austria -4.1 -1.6 -1.9 -0.5 -0.6 -0.6 -0.4 -1.2 -3.0 -4.2 -1.4 -3.6 -5.3Portugal -4.7 -3.4 -3.8 -2.6 -2.2 -2.2 -2.6 -2.8 -4.6 -6.5 -3.3 -4.4 -6.7Slovenia : -2.9 -2.0 0.5 -0.2 -0.9 -0.9 -0.7 -3.2 -5.5 -0.5 -2.8 -6.5Slovakia : -7.6 -3.9 -1.9 -2.3 -2.2 -2.2 -2.2 -2.8 -4.7 -2.5 -3.6 -5.4Finland -5.8 2.8 3.2 5.2 5.1 4.5 4.2 3.6 2.0 -0.8 2.4 0.5 -2.9Euro area -5.0 -1.6 -2.5 -0.6 -1.3 -1.7 -1.9 -1.8 -4.0 -5.3 -2.0 -4.4 -6.5Bulgaria : 1.5 1.1 0.1 3.3 3.2 1.5 2.9 2.0 -0.5 2.9 2.0 -0.3Czech Republic : -4.4 -4.5 -0.6 -1.2 -1.2 -1.5 -1.3 -2.5 -4.3 -1.4 -2.3 -4.9Denmark -2.5 1.0 2.6 4.5 3.1 3.1 3.6 1.1 -0.3 -1.5 0.4 -1.5 -3.9Estonia : -0.5 1.6 2.7 -1.4 -2.0 -3.0 -2.2 -3.2 -3.0 -2.8 -3.2 -3.9Latvia : -1.5 -1.2 -0.4 -2.3 -3.5 -4.0 -5.6 -6.3 -11.1 -6.2 -7.4 -13.6Lithuania : -4.9 -1.1 -1.0 -2.7 -2.9 -3.2 -3.6 -3.0 -5.4 -4.0 -3.4 -8.0
Hungary : -5.3 -7.9 -4.9 -3.4 -3.3 -3.4 -3.3 -2.8 -3.4 -3.3 -3.0 -3.9Poland : -3.9 -5.0 -1.9 -2.3 -2.5 -3.9 -2.5 -3.6 -6.6 -2.4 -3.5 -7.3Romania : -4.1 -1.6 -2.5 -3.4 -5.2 -5.4 -4.1 -7.5 -5.1 -3.8 -7.9 -5.6Sweden -7.7 1.2 0.7 3.8 2.6 2.3 2.5 0.4 -1.3 -2.6 -0.4 -1.4 -3.9United Kingdom -6.1 0.6 -3.0 -2.7 -4.2 -4.6 -5.5 -5.6 -8.8 -11.5 -6.5 -9.6 -13.8EU : -1.4 -2.5 -0.8 -1.6 -2.0 -2.3 -2.3 -4.4 -6.0 -2.6 -4.8 -7.3USA -4.2 0.4 -3.6 -2.8 -5.3 : -5.9 -7.2 : -12.1 -9.0 : -14.2Japan -2.5 -7.3 -6.1 -2.5 -1.9 : -2.9 -2.6 : -6.7 -3.5 : -8.7
¹ ESA 79 up to 1994, ESA 95 from 1995 onwards.
TABLE 38 : Interest expenditure, general government (as a percentage of GDP, 1992-2010) ¹
5-year averages 2008 2009 20101992-96 1997-01 2002-06 2004 2005 2006 2007 X-2008 IV-2009 X-2008 IV-2009 X-2008 IV-2009
Belgium 9.5 7.0 4.8 4.7 4.2 3.9 3.8 3.7 3.7 3.7 3.9 3.6 4.0Germany 3.3 3.2 2.9 2.8 2.8 2.8 2.8 2.7 2.8 2.7 2.9 2.6 3.0Ireland 5.6 2.7 1.2 1.1 1.0 0.9 1.0 1.1 1.1 1.6 2.3 1.9 3.2Greece 11.5 7.9 4.8 4.9 4.4 4.1 4.1 4.0 4.4 4.0 4.6 4.1 4.8Spain 4.8 3.7 2.1 2.0 1.8 1.6 1.6 1.6 1.6 1.6 1.6 1.6 1.9France 3.4 3.1 2.7 2.7 2.6 2.5 2.7 2.9 2.8 2.9 2.8 2.8 3.1Italy 11.3 7.3 4.9 4.7 4.6 4.6 5.0 5.1 5.1 4.9 4.7 4.9 4.8Cyprus : : 3.3 3.3 3.5 3.3 3.1 2.9 2.9 2.6 2.3 2.5 2.2Luxembourg 0.3 0.4 0.2 0.2 0.2 0.2 0.2 0.3 0.3 0.6 0.6 0.6 0.6Malta : 3.3 3.6 3.6 3.7 3.5 3.3 3.4 3.3 3.4 3.5 3.3 3.5Netherlands 5.7 4.1 2.5 2.5 2.3 2.2 2.2 2.2 2.2 2.3 2.6 2.3 2.7Austria 4.0 3.5 2.9 2.9 2.9 2.7 2.7 2.6 2.5 2.6 3.0 2.6 3.2Portugal 5.8 3.2 2.7 2.6 2.6 2.7 2.8 2.9 2.9 2.9 3.0 3.0 3.3Slovenia : 2.3 1.8 1.7 1.6 1.4 1.3 1.2 1.2 1.1 1.6 1.0 1.8Slovakia : 3.3 2.3 2.2 1.7 1.5 1.4 1.4 1.2 1.3 1.3 1.3 1.4Finland 4.0 3.2 1.7 1.6 1.5 1.4 1.5 1.4 1.4 1.4 1.3 1.3 1.4Euro area 5.6 4.3 3.1 3.1 2.9 2.9 2.9 3.0 3.0 2.9 3.0 2.9 3.2Bulgaria : 4.7 1.8 1.8 1.7 1.4 1.0 0.9 0.8 0.8 0.8 0.7 0.8Czech Republic : 1.0 1.2 1.2 1.2 1.1 1.2 1.2 1.1 1.2 1.2 1.1 1.1Denmark 6.4 4.1 2.3 2.3 1.8 1.6 1.5 1.4 1.4 1.2 1.7 1.2 1.6
Estonia : 0.3 0.2 0.2 0.2 0.2 0.2 0.2 0.2 0.2 0.4 0.2 0.5Latvia : 0.8 0.6 0.7 0.6 0.5 0.5 0.5 0.9 0.8 1.4 1.2 2.3Lithuania : 1.3 1.0 0.9 0.8 0.7 0.7 0.7 0.6 0.8 1.1 0.9 1.5Hungary : 6.8 4.1 4.4 4.1 3.9 4.1 4.0 4.3 4.2 4.8 4.2 4.9Poland : 3.5 2.8 2.8 2.8 2.7 2.3 2.5 2.2 2.7 2.9 2.8 3.0Romania : 4.2 1.5 1.4 1.1 0.8 0.8 0.9 0.8 1.0 1.5 1.1 1.6Sweden 5.5 4.0 2.0 1.6 1.6 1.6 1.8 1.9 1.7 1.8 1.5 1.6 1.4United Kingdom 3.1 3.0 2.0 1.9 2.1 2.0 2.2 2.3 2.3 2.5 2.2 2.6 3.0EU : 4.0 2.9 2.8 2.7 2.6 2.7 2.7 2.7 2.7 2.8 2.8 3.1USA 4.7 3.8 2.7 2.6 2.7 2.8 2.9 2.9 2.9 3.1 2.6 3.3 2.6Japan 3.6 3.4 2.6 2.5 2.4 2.4 2.5 2.8 2.5 3.1 3.0 3.3 3.5
¹ ESA 79 up to 1994, ESA 95 f rom 1995 onwards.
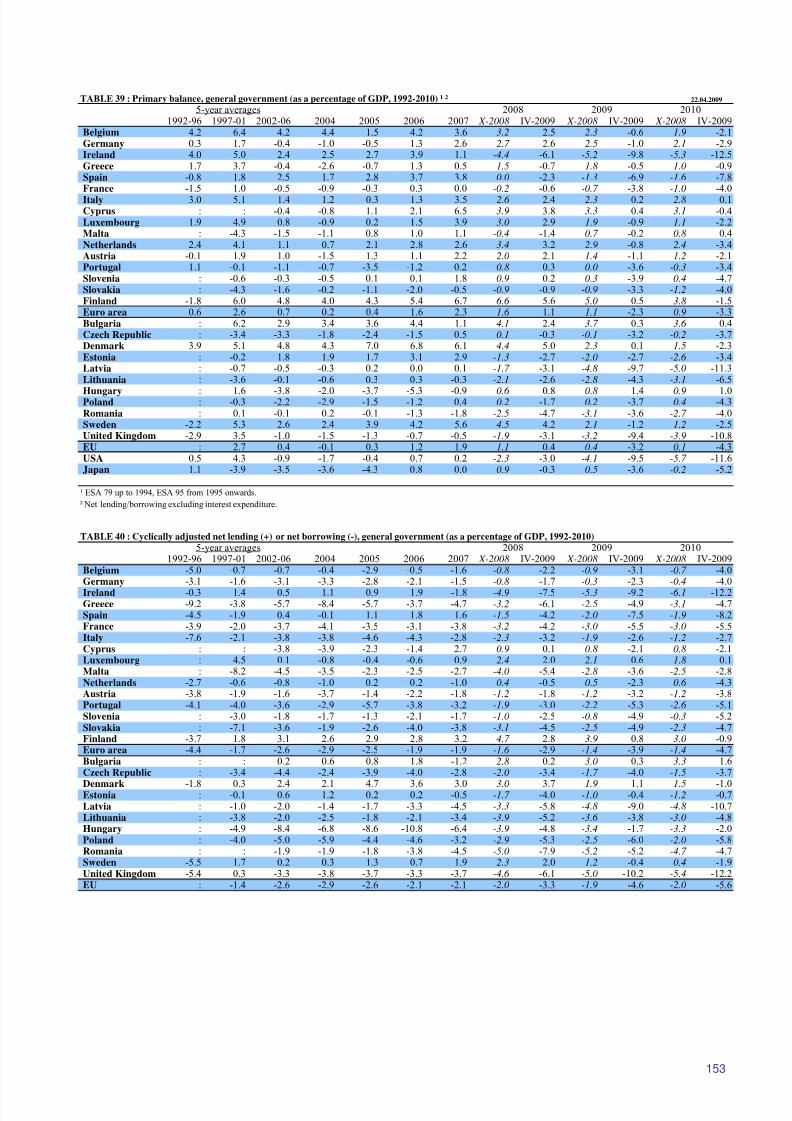
8/14/2019 Economic Forecast 2009
http://slidepdf.com/reader/full/economic-forecast-2009 159/172
153
TABLE 39 : Primary balance, general government (as a percentage of GDP, 1992-2010) ¹ ² 22.04.2009
5-year averages 2008 2009 20101992-96 1997-01 2002-06 2004 2005 2006 2007 X-2008 IV-2009 X-2008 IV-2009 X-2008 IV-2009
Belgium 4.2 6.4 4.2 4.4 1.5 4.2 3.6 3.2 2.5 2.3 -0.6 1.9 -2.1Germany 0.3 1.7 -0.4 -1.0 -0.5 1.3 2.6 2.7 2.6 2.5 -1.0 2.1 -2.9Ireland 4.0 5.0 2.4 2.5 2.7 3.9 1.1 -4.4 -6.1 -5.2 -9.8 -5.3 -12.5Greece 1.7 3.7 -0.4 -2.6 -0.7 1.3 0.5 1.5 -0.7 1.8 -0.5 1.0 -0.9Spain -0.8 1.8 2.5 1.7 2.8 3.7 3.8 0.0 -2.3 -1.3 -6.9 -1.6 -7.8France -1.5 1.0 -0.5 -0.9 -0.3 0.3 0.0 -0.2 -0.6 -0.7 -3.8 -1.0 -4.0Italy 3.0 5.1 1.4 1.2 0.3 1.3 3.5 2.6 2.4 2.3 0.2 2.8 0.1Cyprus : : -0.4 -0.8 1.1 2.1 6.5 3.9 3.8 3.3 0.4 3.1 -0.4Luxembourg 1.9 4.9 0.8 -0.9 0.2 1.5 3.9 3.0 2.9 1.9 -0.9 1.1 -2.2Malta : -4.3 -1.5 -1.1 0.8 1.0 1.1 -0.4 -1.4 0.7 -0.2 0.8 0.4Netherlands 2.4 4.1 1.1 0.7 2.1 2.8 2.6 3.4 3.2 2.9 -0.8 2.4 -3.4Austria -0.1 1.9 1.0 -1.5 1.3 1.1 2.2 2.0 2.1 1.4 -1.1 1.2 -2.1Portugal 1.1 -0.1 -1.1 -0.7 -3.5 -1.2 0.2 0.8 0.3 0.0 -3.6 -0.3 -3.4Slovenia : -0.6 -0.3 -0.5 0.1 0.1 1.8 0.9 0.2 0.3 -3.9 0.4 -4.7Slovakia : -4.3 -1.6 -0.2 -1.1 -2.0 -0.5 -0.9 -0.9 -0.9 -3.3 -1.2 -4.0Finland -1.8 6.0 4.8 4.0 4.3 5.4 6.7 6.6 5.6 5.0 0.5 3.8 -1.5Euro area 0.6 2.6 0.7 0.2 0.4 1.6 2.3 1.6 1.1 1.1 -2.3 0.9 -3.3Bulgaria : 6.2 2.9 3.4 3.6 4.4 1.1 4.1 2.4 3.7 0.3 3.6 0.4Czech Republic : -3.4 -3.3 -1.8 -2.4 -1.5 0.5 0.1 -0.3 -0.1 -3.2 -0.2 -3.7Denmark 3.9 5.1 4.8 4.3 7.0 6.8 6.1 4.4 5.0 2.3 0.1 1.5 -2.3Estonia : -0.2 1.8 1.9 1.7 3.1 2.9 -1.3 -2.7 -2.0 -2.7 -2.6 -3.4Latvia : -0.7 -0.5 -0.3 0.2 0.0 0.1 -1.7 -3.1 -4.8 -9.7 -5.0 -11.3Lithuania : -3.6 -0.1 -0.6 0.3 0.3 -0.3 -2.1 -2.6 -2.8 -4.3 -3.1 -6.5
Hungary : 1.6 -3.8 -2.0 -3.7 -5.3 -0.9 0.6 0.8 0.8 1.4 0.9 1.0Poland : -0.3 -2.2 -2.9 -1.5 -1.2 0.4 0.2 -1.7 0.2 -3.7 0.4 -4.3Romania : 0.1 -0.1 0.2 -0.1 -1.3 -1.8 -2.5 -4.7 -3.1 -3.6 -2.7 -4.0Sweden -2.2 5.3 2.6 2.4 3.9 4.2 5.6 4.5 4.2 2.1 -1.2 1.2 -2.5United Kingdom -2.9 3.5 -1.0 -1.5 -1.3 -0.7 -0.5 -1.9 -3.1 -3.2 -9.4 -3.9 -10.8EU : 2.7 0.4 -0.1 0.3 1.2 1.9 1.1 0.4 0.4 -3.2 0.1 -4.3USA 0.5 4.3 -0.9 -1.7 -0.4 0.7 0.2 -2.3 -3.0 -4.1 -9.5 -5.7 -11.6Japan 1.1 -3.9 -3.5 -3.6 -4.3 0.8 0.0 0.9 -0.3 0.5 -3.6 -0.2 -5.2
¹ ESA 79 up to 1994, ESA 95 from 1995 onwards.
² Net lending/borrowing excluding interest expenditure.
TABLE 40 : Cyclically adjusted net lending (+) or net borrowing (-), general government (as a percentage of GDP, 1992-2010)
5-year averages 2008 2009 20101992-96 1997-01 2002-06 2004 2005 2006 2007 X-2008 IV-2009 X-2008 IV-2009 X-2008 IV-2009
Belgium -5.0 -0.7 -0.7 -0.4 -2.9 -0.5 -1.6 -0.8 -2.2 -0.9 -3.1 -0.7 -4.0Germany -3.1 -1.6 -3.1 -3.3 -2.8 -2.1 -1.5 -0.8 -1.7 -0.3 -2.3 -0.4 -4.0Ireland -0.3 1.4 0.5 1.1 0.9 1.9 -1.8 -4.9 -7.5 -5.3 -9.2 -6.1 -12.2Greece -9.2 -3.8 -5.7 -8.4 -5.7 -3.7 -4.7 -3.2 -6.1 -2.5 -4.9 -3.1 -4.7Spain -4.5 -1.9 0.4 -0.1 1.1 1.8 1.6 -1.5 -4.2 -2.0 -7.5 -1.9 -8.2France -3.9 -2.0 -3.7 -4.1 -3.5 -3.1 -3.8 -3.2 -4.2 -3.0 -5.5 -3.0 -5.5Italy -7.6 -2.1 -3.8 -3.8 -4.6 -4.3 -2.8 -2.3 -3.2 -1.9 -2.6 -1.2 -2.7Cyprus : : -3.8 -3.9 -2.3 -1.4 2.7 0.9 0.1 0.8 -2.1 0.8 -2.1Luxembourg : 4.5 0.1 -0.8 -0.4 -0.6 0.9 2.4 2.0 2.1 0.6 1.8 0.1Malta : -8.2 -4.5 -3.5 -2.3 -2.5 -2.7 -4.0 -5.4 -2.8 -3.6 -2.5 -2.8Netherlands -2.7 -0.6 -0.8 -1.0 0.2 0.2 -1.0 0.4 -0.5 0.5 -2.3 0.6 -4.3Austria -3.8 -1.9 -1.6 -3.7 -1.4 -2.2 -1.8 -1.2 -1.8 -1.2 -3.2 -1.2 -3.8Portugal -4.1 -4.0 -3.6 -2.9 -5.7 -3.8 -3.2 -1.9 -3.0 -2.2 -5.3 -2.6 -5.1Slovenia : -3.0 -1.8 -1.7 -1.3 -2.1 -1.7 -1.0 -2.5 -0.8 -4.9 -0.3 -5.2Slovakia : -7.1 -3.6 -1.9 -2.6 -4.0 -3.8 -3.1 -4.5 -2.5 -4.9 -2.3 -4.7Finland -3.7 1.8 3.1 2.6 2.9 2.8 3.2 4.7 2.8 3.9 0.8 3.0 -0.9Euro area -4.4 -1.7 -2.6 -2.9 -2.5 -1.9 -1.9 -1.6 -2.9 -1.4 -3.9 -1.4 -4.7Bulgaria : : 0.2 0.6 0.8 1.8 -1.2 2.8 0.2 3.0 0.3 3.3 1.6Czech Republic : -3.4 -4.4 -2.4 -3.9 -4.0 -2.8 -2.0 -3.4 -1.7 -4.0 -1.5 -3.7
Denmark -1.8 0.3 2.4 2.1 4.7 3.6 3.0 3.0 3.7 1.9 1.1 1.5 -1.0Estonia : -0.1 0.6 1.2 0.2 0.2 -0.5 -1.7 -4.0 -1.0 -0.4 -1.2 -0.7Latvia : -1.0 -2.0 -1.4 -1.7 -3.3 -4.5 -3.3 -5.8 -4.8 -9.0 -4.8 -10.7Lithuania : -3.8 -2.0 -2.5 -1.8 -2.1 -3.4 -3.9 -5.2 -3.6 -3.8 -3.0 -4.8Hungary : -4.9 -8.4 -6.8 -8.6 -10.8 -6.4 -3.9 -4.8 -3.4 -1.7 -3.3 -2.0Poland : -4.0 -5.0 -5.9 -4.4 -4.6 -3.2 -2.9 -5.3 -2.5 -6.0 -2.0 -5.8Romania : : -1.9 -1.9 -1.8 -3.8 -4.5 -5.0 -7.9 -5.2 -5.2 -4.7 -4.7Sweden -5.5 1.7 0.2 0.3 1.3 0.7 1.9 2.3 2.0 1.2 -0.4 0.4 -1.9United Kingdom -5.4 0.3 -3.3 -3.8 -3.7 -3.3 -3.7 -4.6 -6.1 -5.0 -10.2 -5.4 -12.2EU : -1.4 -2.6 -2.9 -2.6 -2.1 -2.1 -2.0 -3.3 -1.9 -4.6 -2.0 -5.6
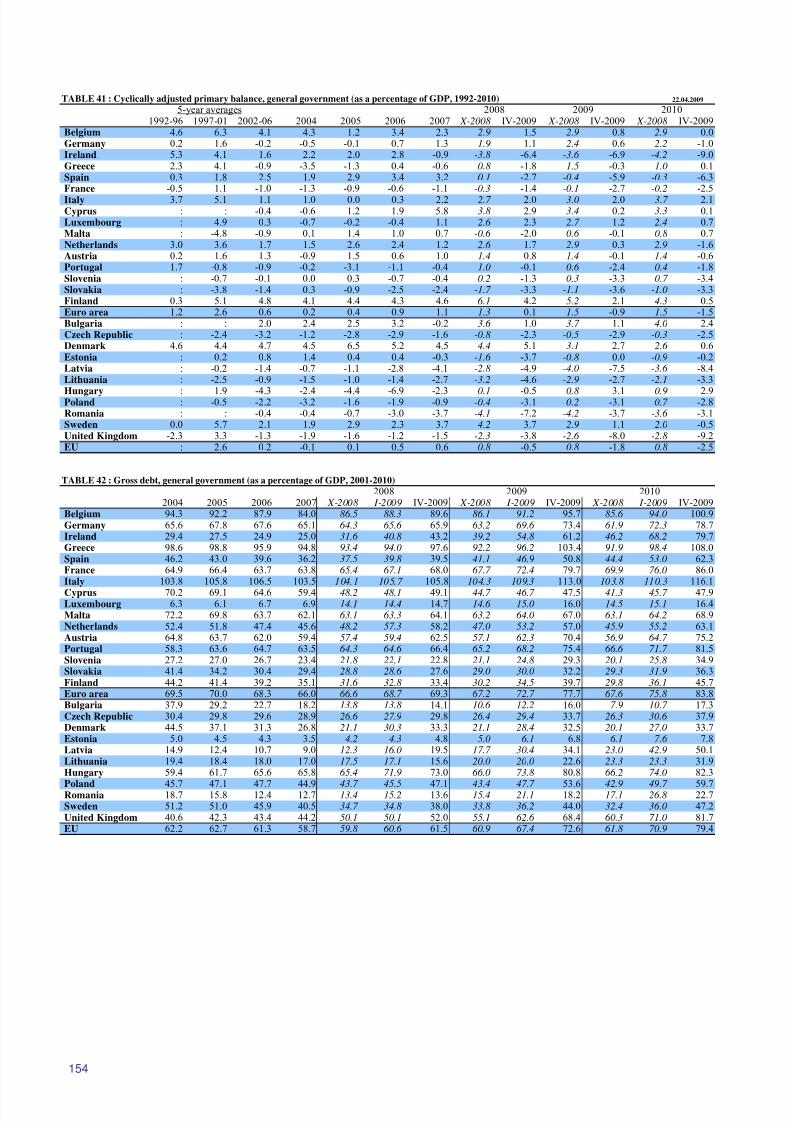
8/14/2019 Economic Forecast 2009
http://slidepdf.com/reader/full/economic-forecast-2009 160/172
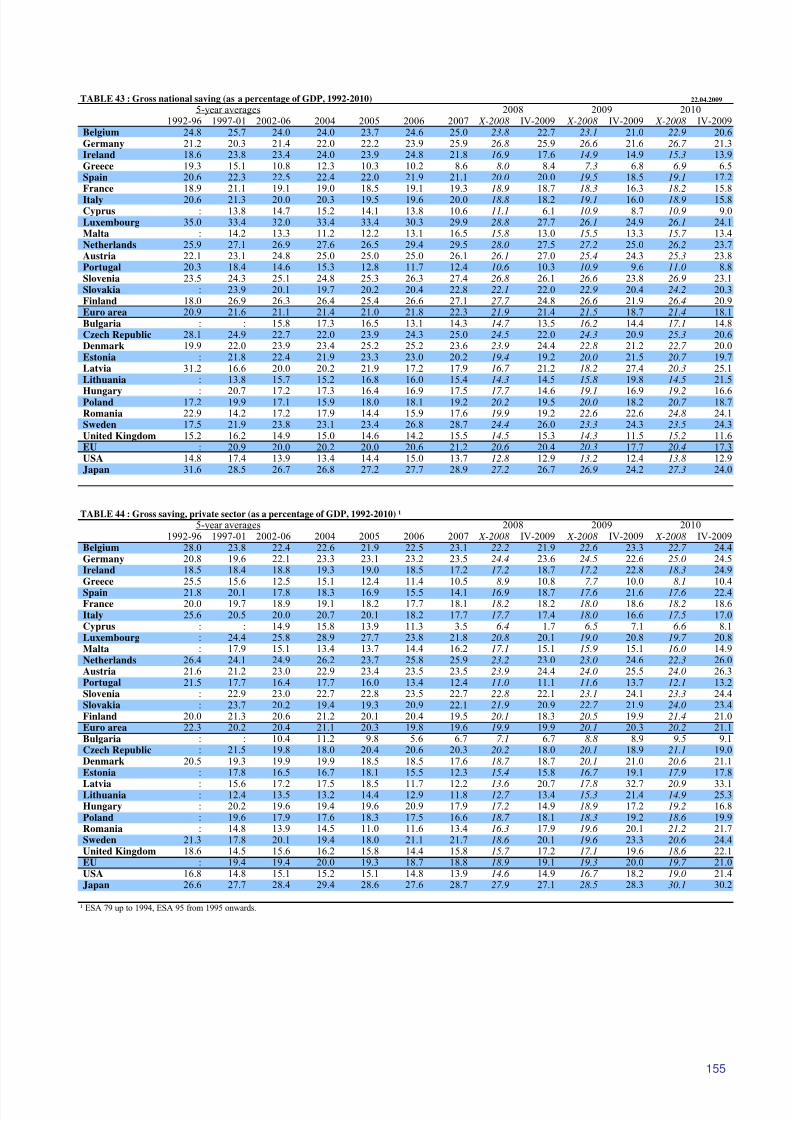
8/14/2019 Economic Forecast 2009
http://slidepdf.com/reader/full/economic-forecast-2009 161/172
155
TABLE 43 : Gross national saving (as a percentage of GDP, 1992-2010) 22.04.2009
5-year averages 2008 2009 20101992-96 1997-01 2002-06 2004 2005 2006 2007 X-2008 IV-2009 X-2008 IV-2009 X-2008 IV-2009
Belgium 24.8 25.7 24.0 24.0 23.7 24.6 25.0 23.8 22.7 23.1 21.0 22.9 20.6Germany 21.2 20.3 21.4 22.0 22.2 23.9 25.9 26.8 25.9 26.6 21.6 26.7 21.3Ireland 18.6 23.8 23.4 24.0 23.9 24.8 21.8 16.9 17.6 14.9 14.9 15.3 13.9Greece 19.3 15.1 10.8 12.3 10.3 10.2 8.6 8.0 8.4 7.3 6.8 6.9 6.5Spain 20.6 22.3 22.5 22.4 22.0 21.9 21.1 20.0 20.0 19.5 18.5 19.1 17.2France 18.9 21.1 19.1 19.0 18.5 19.1 19.3 18.9 18.7 18.3 16.3 18.2 15.8Italy 20.6 21.3 20.0 20.3 19.5 19.6 20.0 18.8 18.2 19.1 16.0 18.9 15.8Cyprus : 13.8 14.7 15.2 14.1 13.8 10.6 11.1 6.1 10.9 8.7 10.9 9.0Luxembourg 35.0 33.4 32.0 33.4 33.4 30.3 29.9 28.8 27.7 26.1 24.9 26.1 24.1Malta : 14.2 13.3 11.2 12.2 13.1 16.5 15.8 13.0 15.5 13.3 15.7 13.4Netherlands 25.9 27.1 26.9 27.6 26.5 29.4 29.5 28.0 27.5 27.2 25.0 26.2 23.7Austria 22.1 23.1 24.8 25.0 25.0 25.0 26.1 26.1 27.0 25.4 24.3 25.3 23.8Portugal 20.3 18.4 14.6 15.3 12.8 11.7 12.4 10.6 10.3 10.9 9.6 11.0 8.8Slovenia 23.5 24.3 25.1 24.8 25.3 26.3 27.4 26.8 26.1 26.6 23.8 26.9 23.1Slovakia : 23.9 20.1 19.7 20.2 20.4 22.8 22.1 22.0 22.9 20.4 24.2 20.3Finland 18.0 26.9 26.3 26.4 25.4 26.6 27.1 27.7 24.8 26.6 21.9 26.4 20.9Euro area 20.9 21.6 21.1 21.4 21.0 21.8 22.3 21.9 21.4 21.5 18.7 21.4 18.1Bulgaria : : 15.8 17.3 16.5 13.1 14.3 14.7 13.5 16.2 14.4 17.1 14.8Czech Republic 28.1 24.9 22.7 22.0 23.9 24.3 25.0 24.5 22.0 24.3 20.9 25.3 20.6Denmark 19.9 22.0 23.9 23.4 25.2 25.2 23.6 23.9 24.4 22.8 21.2 22.7 20.0Estonia : 21.8 22.4 21.9 23.3 23.0 20.2 19.4 19.2 20.0 21.5 20.7 19.7Latvia 31.2 16.6 20.0 20.2 21.9 17.2 17.9 16.7 21.2 18.2 27.4 20.3 25.1Lithuania : 13.8 15.7 15.2 16.8 16.0 15.4 14.3 14.5 15.8 19.8 14.5 21.5
Hungary : 20.7 17.2 17.3 16.4 16.9 17.5 17.7 14.6 19.1 16.9 19.2 16.6Poland 17.2 19.9 17.1 15.9 18.0 18.1 19.2 20.2 19.5 20.0 18.2 20.7 18.7Romania 22.9 14.2 17.2 17.9 14.4 15.9 17.6 19.9 19.2 22.6 22.6 24.8 24.1Sweden 17.5 21.9 23.8 23.1 23.4 26.8 28.7 24.4 26.0 23.3 24.3 23.5 24.3United Kingdom 15.2 16.2 14.9 15.0 14.6 14.2 15.5 14.5 15.3 14.3 11.5 15.2 11.6EU : 20.9 20.0 20.2 20.0 20.6 21.2 20.6 20.4 20.3 17.7 20.4 17.3USA 14.8 17.4 13.9 13.4 14.4 15.0 13.7 12.8 12.9 13.2 12.4 13.8 12.9Japan 31.6 28.5 26.7 26.8 27.2 27.7 28.9 27.2 26.7 26.9 24.2 27.3 24.0
TABLE 44 : Gross saving, private sector (as a percentage of GDP, 1992-2010) ¹
5-year averages 2008 2009 20101992-96 1997-01 2002-06 2004 2005 2006 2007 X-2008 IV-2009 X-2008 IV-2009 X-2008 IV-2009
Belgium 28.0 23.8 22.4 22.6 21.9 22.5 23.1 22.2 21.9 22.6 23.3 22.7 24.4Germany 20.8 19.6 22.1 23.3 23.1 23.2 23.5 24.4 23.6 24.5 22.6 25.0 24.5Ireland 18.5 18.4 18.8 19.3 19.0 18.5 17.2 17.2 18.7 17.2 22.8 18.3 24.9Greece 25.5 15.6 12.5 15.1 12.4 11.4 10.5 8.9 10.8 7.7 10.0 8.1 10.4Spain 21.8 20.1 17.8 18.3 16.9 15.5 14.1 16.9 18.7 17.6 21.6 17.6 22.4France 20.0 19.7 18.9 19.1 18.2 17.7 18.1 18.2 18.2 18.0 18.6 18.2 18.6Italy 25.6 20.5 20.0 20.7 20.1 18.2 17.7 17.7 17.4 18.0 16.6 17.5 17.0Cyprus : : 14.9 15.8 13.9 11.3 3.5 6.4 1.7 6.5 7.1 6.6 8.1Luxembourg : 24.4 25.8 28.9 27.7 23.8 21.8 20.8 20.1 19.0 20.8 19.7 20.8Malta : 17.9 15.1 13.4 13.7 14.4 16.2 17.1 15.1 15.9 15.1 16.0 14.9Netherlands 26.4 24.1 24.9 26.2 23.7 25.8 25.9 23.2 23.0 23.0 24.6 22.3 26.0Austria 21.6 21.2 23.0 22.9 23.4 23.5 23.5 23.9 24.4 24.0 25.5 24.0 26.3Portugal 21.5 17.7 16.4 17.7 16.0 13.4 12.4 11.0 11.1 11.6 13.7 12.1 13.2Slovenia : 22.9 23.0 22.7 22.8 23.5 22.7 22.8 22.1 23.1 24.1 23.3 24.4Slovakia : 23.7 20.2 19.4 19.3 20.9 22.1 21.9 20.9 22.7 21.9 24.0 23.4Finland 20.0 21.3 20.6 21.2 20.1 20.4 19.5 20.1 18.3 20.5 19.9 21.4 21.0Euro area 22.3 20.2 20.4 21.1 20.3 19.8 19.6 19.9 19.9 20.1 20.3 20.2 21.1Bulgaria : : 10.4 11.2 9.8 5.6 6.7 7.1 6.7 8.8 8.9 9.5 9.1Czech Republic : 21.5 19.8 18.0 20.4 20.6 20.3 20.2 18.0 20.1 18.9 21.1 19.0Denmark 20.5 19.3 19.9 19.9 18.5 18.5 17.6 18.7 18.7 20.1 21.0 20.6 21.1Estonia : 17.8 16.5 16.7 18.1 15.5 12.3 15.4 15.8 16.7 19.1 17.9 17.8
Latvia : 15.6 17.2 17.5 18.5 11.7 12.2 13.6 20.7 17.8 32.7 20.9 33.1Lithuania : 12.4 13.5 13.2 14.4 12.9 11.8 12.7 13.4 15.3 21.4 14.9 25.3Hungary : 20.2 19.6 19.4 19.6 20.9 17.9 17.2 14.9 18.9 17.2 19.2 16.8Poland : 19.6 17.9 17.6 18.3 17.5 16.6 18.7 18.1 18.3 19.2 18.6 19.9Romania : 14.8 13.9 14.5 11.0 11.6 13.4 16.3 17.9 19.6 20.1 21.2 21.7Sweden 21.3 17.8 20.1 19.4 18.0 21.1 21.7 18.6 20.1 19.6 23.3 20.6 24.4United Kingdom 18.6 14.5 15.6 16.2 15.8 14.4 15.8 15.7 17.2 17.1 19.6 18.6 22.1EU : 19.4 19.4 20.0 19.3 18.7 18.8 18.9 19.1 19.3 20.0 19.7 21.0USA 16.8 14.8 15.1 15.2 15.1 14.8 13.9 14.6 14.9 16.7 18.2 19.0 21.4Japan 26.6 27.7 28.4 29.4 28.6 27.6 28.7 27.9 27.1 28.5 28.3 30.1 30.2
¹ ESA 79 up to 1994, ESA 95 from 1995 onwards.
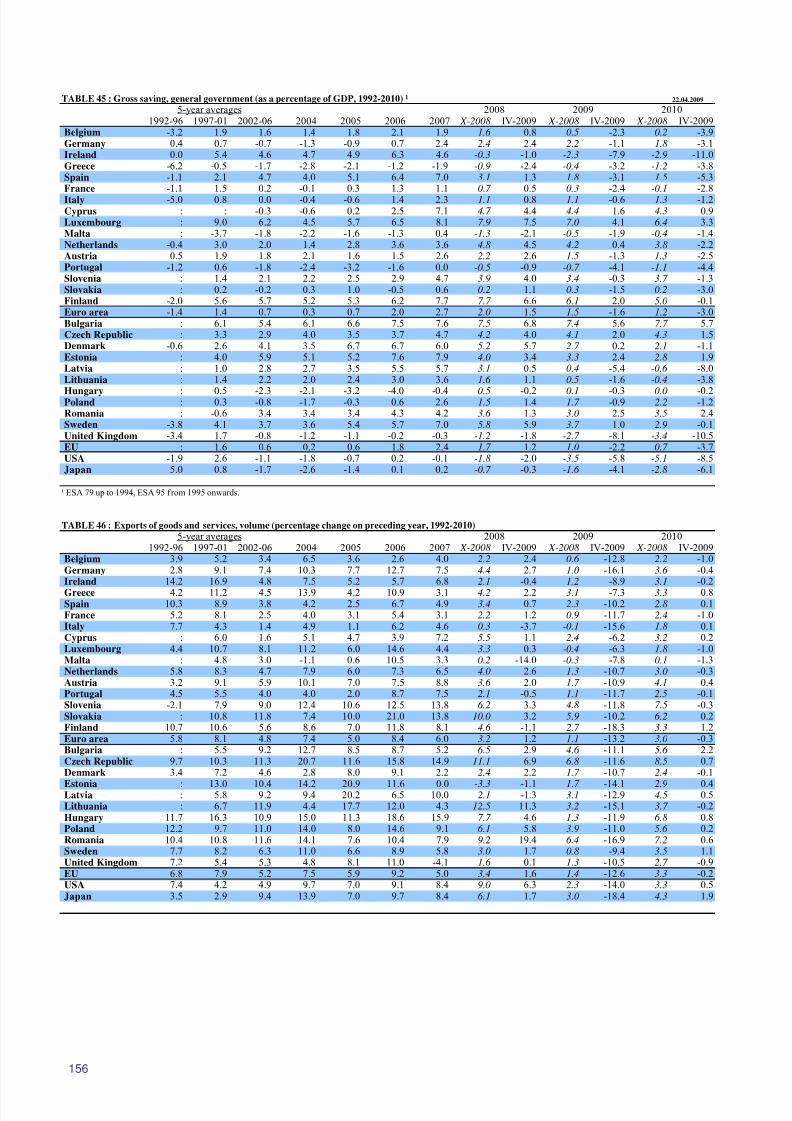
8/14/2019 Economic Forecast 2009
http://slidepdf.com/reader/full/economic-forecast-2009 162/172
156
TABLE 45 : Gross saving, general government (as a percentage of GDP, 1992-2010) ¹ 22.04.2009
5-year averages 2008 2009 20101992-96 1997-01 2002-06 2004 2005 2006 2007 X-2008 IV-2009 X-2008 IV-2009 X-2008 IV-2009
Belgium -3.2 1.9 1.6 1.4 1.8 2.1 1.9 1.6 0.8 0.5 -2.3 0.2 -3.9Germany 0.4 0.7 -0.7 -1.3 -0.9 0.7 2.4 2.4 2.4 2.2 -1.1 1.8 -3.1Ireland 0.0 5.4 4.6 4.7 4.9 6.3 4.6 -0.3 -1.0 -2.3 -7.9 -2.9 -11.0Greece -6.2 -0.5 -1.7 -2.8 -2.1 -1.2 -1.9 -0.9 -2.4 -0.4 -3.2 -1.2 -3.8Spain -1.1 2.1 4.7 4.0 5.1 6.4 7.0 3.1 1.3 1.8 -3.1 1.5 -5.3France -1.1 1.5 0.2 -0.1 0.3 1.3 1.1 0.7 0.5 0.3 -2.4 -0.1 -2.8Italy -5.0 0.8 0.0 -0.4 -0.6 1.4 2.3 1.1 0.8 1.1 -0.6 1.3 -1.2Cyprus : : -0.3 -0.6 0.2 2.5 7.1 4.7 4.4 4.4 1.6 4.3 0.9Luxembourg : 9.0 6.2 4.5 5.7 6.5 8.1 7.9 7.5 7.0 4.1 6.4 3.3Malta : -3.7 -1.8 -2.2 -1.6 -1.3 0.4 -1.3 -2.1 -0.5 -1.9 -0.4 -1.4Netherlands -0.4 3.0 2.0 1.4 2.8 3.6 3.6 4.8 4.5 4.2 0.4 3.8 -2.2Austria 0.5 1.9 1.8 2.1 1.6 1.5 2.6 2.2 2.6 1.5 -1.3 1.3 -2.5Portugal -1.2 0.6 -1.8 -2.4 -3.2 -1.6 0.0 -0.5 -0.9 -0.7 -4.1 -1.1 -4.4Slovenia : 1.4 2.1 2.2 2.5 2.9 4.7 3.9 4.0 3.4 -0.3 3.7 -1.3Slovakia : 0.2 -0.2 0.3 1.0 -0.5 0.6 0.2 1.1 0.3 -1.5 0.2 -3.0Finland -2.0 5.6 5.7 5.2 5.3 6.2 7.7 7.7 6.6 6.1 2.0 5.0 -0.1Euro area -1.4 1.4 0.7 0.3 0.7 2.0 2.7 2.0 1.5 1.5 -1.6 1.2 -3.0Bulgaria : 6.1 5.4 6.1 6.6 7.5 7.6 7.5 6.8 7.4 5.6 7.7 5.7Czech Republic : 3.3 2.9 4.0 3.5 3.7 4.7 4.2 4.0 4.1 2.0 4.3 1.5Denmark -0.6 2.6 4.1 3.5 6.7 6.7 6.0 5.2 5.7 2.7 0.2 2.1 -1.1Estonia : 4.0 5.9 5.1 5.2 7.6 7.9 4.0 3.4 3.3 2.4 2.8 1.9Latvia : 1.0 2.8 2.7 3.5 5.5 5.7 3.1 0.5 0.4 -5.4 -0.6 -8.0Lithuania : 1.4 2.2 2.0 2.4 3.0 3.6 1.6 1.1 0.5 -1.6 -0.4 -3.8
Hungary : 0.5 -2.3 -2.1 -3.2 -4.0 -0.4 0.5 -0.2 0.1 -0.3 0.0 -0.2Poland : 0.3 -0.8 -1.7 -0.3 0.6 2.6 1.5 1.4 1.7 -0.9 2.2 -1.2Romania : -0.6 3.4 3.4 3.4 4.3 4.2 3.6 1.3 3.0 2.5 3.5 2.4Sweden -3.8 4.1 3.7 3.6 5.4 5.7 7.0 5.8 5.9 3.7 1.0 2.9 -0.1United Kingdom -3.4 1.7 -0.8 -1.2 -1.1 -0.2 -0.3 -1.2 -1.8 -2.7 -8.1 -3.4 -10.5EU : 1.6 0.6 0.2 0.6 1.8 2.4 1.7 1.2 1.0 -2.2 0.7 -3.7USA -1.9 2.6 -1.1 -1.8 -0.7 0.2 -0.1 -1.8 -2.0 -3.5 -5.8 -5.1 -8.5Japan 5.0 0.8 -1.7 -2.6 -1.4 0.1 0.2 -0.7 -0.3 -1.6 -4.1 -2.8 -6.1
¹ ESA 79 up to 1994, ESA 95 f rom 1995 onwards.
TABLE 46 : Exports of goods and services, volume (percentage change on preceding year, 1992-2010)
5-year averages 2008 2009 20101992-96 1997-01 2002-06 2004 2005 2006 2007 X-2008 IV-2009 X-2008 IV-2009 X-2008 IV-2009
Belgium 3.9 5.2 3.4 6.5 3.6 2.6 4.0 2.2 2.4 0.6 -12.8 2.2 -1.0Germany 2.8 9.1 7.4 10.3 7.7 12.7 7.5 4.4 2.7 1.0 -16.1 3.6 -0.4Ireland 14.2 16.9 4.8 7.5 5.2 5.7 6.8 2.1 -0.4 1.2 -8.9 3.1 -0.2Greece 4.2 11.2 4.5 13.9 4.2 10.9 3.1 4.2 2.2 3.1 -7.3 3.3 0.8Spain 10.3 8.9 3.8 4.2 2.5 6.7 4.9 3.4 0.7 2.3 -10.2 2.8 0.1France 5.2 8.1 2.5 4.0 3.1 5.4 3.1 2.2 1.2 0.9 -11.7 2.4 -1.0Italy 7.7 4.3 1.4 4.9 1.1 6.2 4.6 0.3 -3.7 -0.1 -15.6 1.8 0.1Cyprus : 6.0 1.6 5.1 4.7 3.9 7.2 5.5 1.1 2.4 -6.2 3.2 0.2Luxembourg 4.4 10.7 8.1 11.2 6.0 14.6 4.4 3.3 0.3 -0.4 -6.3 1.8 -1.0Malta : 4.8 3.0 -1.1 0.6 10.5 3.3 0.2 -14.0 -0.3 -7.8 0.1 -1.3Netherlands 5.8 8.3 4.7 7.9 6.0 7.3 6.5 4.0 2.6 1.3 -10.7 3.0 -0.3Austria 3.2 9.1 5.9 10.1 7.0 7.5 8.8 3.6 2.0 1.7 -10.9 4.1 0.4Portugal 4.5 5.5 4.0 4.0 2.0 8.7 7.5 2.1 -0.5 1.1 -11.7 2.5 -0.1Slovenia -2.1 7.9 9.0 12.4 10.6 12.5 13.8 6.2 3.3 4.8 -11.8 7.5 -0.3Slovakia : 10.8 11.8 7.4 10.0 21.0 13.8 10.0 3.2 5.9 -10.2 6.2 0.2Finland 10.7 10.6 5.6 8.6 7.0 11.8 8.1 4.6 -1.1 2.7 -18.3 3.3 1.2Euro area 5.8 8.1 4.8 7.4 5.0 8.4 6.0 3.2 1.2 1.1 -13.2 3.0 -0.3Bulgaria : 5.5 9.2 12.7 8.5 8.7 5.2 6.5 2.9 4.6 -11.1 5.6 2.2Czech Republic 9.7 10.3 11.3 20.7 11.6 15.8 14.9 11.1 6.9 6.8 -11.6 8.5 0.7Denmark 3.4 7.2 4.6 2.8 8.0 9.1 2.2 2.4 2.2 1.7 -10.7 2.4 -0.1
Estonia : 13.0 10.4 14.2 20.9 11.6 0.0 -3.3 -1.1 1.7 -14.1 2.9 0.4Latvia : 5.8 9.2 9.4 20.2 6.5 10.0 2.1 -1.3 3.1 -12.9 4.5 0.5Lithuania : 6.7 11.9 4.4 17.7 12.0 4.3 12.5 11.3 3.2 -15.1 3.7 -0.2Hungary 11.7 16.3 10.9 15.0 11.3 18.6 15.9 7.7 4.6 1.3 -11.9 6.8 0.8Poland 12.2 9.7 11.0 14.0 8.0 14.6 9.1 6.1 5.8 3.9 -11.0 5.6 0.2Romania 10.4 10.8 11.6 14.1 7.6 10.4 7.9 9.2 19.4 6.4 -16.9 7.2 0.6Sweden 7.7 8.2 6.3 11.0 6.6 8.9 5.8 3.0 1.7 0.8 -9.4 3.5 1.1United Kingdom 7.2 5.4 5.3 4.8 8.1 11.0 -4.1 1.6 0.1 1.3 -10.5 2.7 -0.9EU 6.8 7.9 5.2 7.5 5.9 9.2 5.0 3.4 1.6 1.4 -12.6 3.3 -0.2USA 7.4 4.2 4.9 9.7 7.0 9.1 8.4 9.0 6.3 2.3 -14.0 3.3 0.5Japan 3.5 2.9 9.4 13.9 7.0 9.7 8.4 6.1 1.7 3.0 -18.4 4.3 1.9
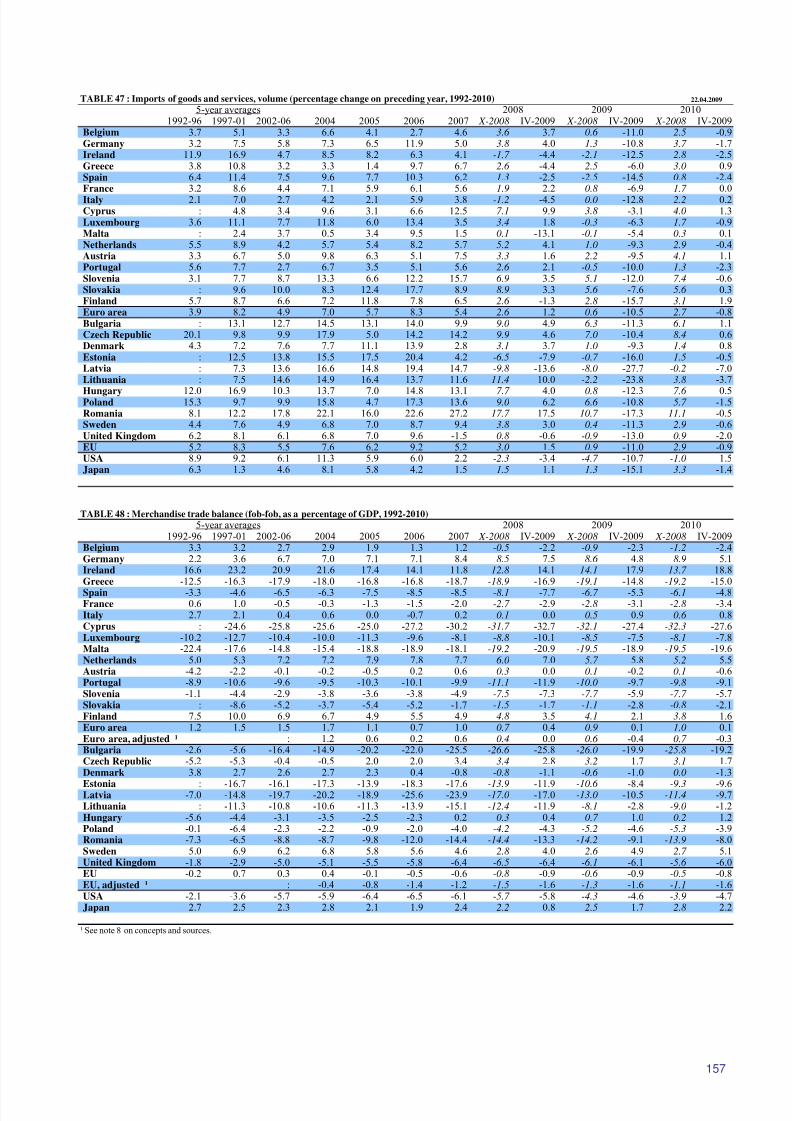
8/14/2019 Economic Forecast 2009
http://slidepdf.com/reader/full/economic-forecast-2009 163/172
157
TABLE 47 : Imports of goods and services, volume (percentage change on preceding year, 1992-2010) 22.04.2009
5-year averages 2008 2009 20101992-96 1997-01 2002-06 2004 2005 2006 2007 X-2008 IV-2009 X-2008 IV-2009 X-2008 IV-2009
Belgium 3.7 5.1 3.3 6.6 4.1 2.7 4.6 3.6 3.7 0.6 -11.0 2.5 -0.9Germany 3.2 7.5 5.8 7.3 6.5 11.9 5.0 3.8 4.0 1.3 -10.8 3.7 -1.7Ireland 11.9 16.9 4.7 8.5 8.2 6.3 4.1 -1.7 -4.4 -2.1 -12.5 2.8 -2.5Greece 3.8 10.8 3.2 3.3 1.4 9.7 6.7 2.6 -4.4 2.5 -6.0 3.0 0.9Spain 6.4 11.4 7.5 9.6 7.7 10.3 6.2 1.3 -2.5 -2.5 -14.5 0.8 -2.4France 3.2 8.6 4.4 7.1 5.9 6.1 5.6 1.9 2.2 0.8 -6.9 1.7 0.0Italy 2.1 7.0 2.7 4.2 2.1 5.9 3.8 -1.2 -4.5 0.0 -12.8 2.2 0.2Cyprus : 4.8 3.4 9.6 3.1 6.6 12.5 7.1 9.9 3.8 -3.1 4.0 1.3Luxembourg 3.6 11.1 7.7 11.8 6.0 13.4 3.5 3.4 1.8 -0.3 -6.3 1.7 -0.9Malta : 2.4 3.7 0.5 3.4 9.5 1.5 0.1 -13.1 -0.1 -5.4 0.3 0.1Netherlands 5.5 8.9 4.2 5.7 5.4 8.2 5.7 5.2 4.1 1.0 -9.3 2.9 -0.4Austria 3.3 6.7 5.0 9.8 6.3 5.1 7.5 3.3 1.6 2.2 -9.5 4.1 1.1Portugal 5.6 7.7 2.7 6.7 3.5 5.1 5.6 2.6 2.1 -0.5 -10.0 1.3 -2.3Slovenia 3.1 7.7 8.7 13.3 6.6 12.2 15.7 6.9 3.5 5.1 -12.0 7.4 -0.6Slovakia : 9.6 10.0 8.3 12.4 17.7 8.9 8.9 3.3 5.6 -7.6 5.6 0.3Finland 5.7 8.7 6.6 7.2 11.8 7.8 6.5 2.6 -1.3 2.8 -15.7 3.1 1.9Euro area 3.9 8.2 4.9 7.0 5.7 8.3 5.4 2.6 1.2 0.6 -10.5 2.7 -0.8Bulgaria : 13.1 12.7 14.5 13.1 14.0 9.9 9.0 4.9 6.3 -11.3 6.1 1.1Czech Republic 20.1 9.8 9.9 17.9 5.0 14.2 14.2 9.9 4.6 7.0 -10.4 8.4 0.6Denmark 4.3 7.2 7.6 7.7 11.1 13.9 2.8 3.1 3.7 1.0 -9.3 1.4 0.8Estonia : 12.5 13.8 15.5 17.5 20.4 4.2 -6.5 -7.9 -0.7 -16.0 1.5 -0.5Latvia : 7.3 13.6 16.6 14.8 19.4 14.7 -9.8 -13.6 -8.0 -27.7 -0.2 -7.0Lithuania : 7.5 14.6 14.9 16.4 13.7 11.6 11.4 10.0 -2.2 -23.8 3.8 -3.7
Hungary 12.0 16.9 10.3 13.7 7.0 14.8 13.1 7.7 4.0 0.8 -12.3 7.6 0.5Poland 15.3 9.7 9.9 15.8 4.7 17.3 13.6 9.0 6.2 6.6 -10.8 5.7 -1.5Romania 8.1 12.2 17.8 22.1 16.0 22.6 27.2 17.7 17.5 10.7 -17.3 11.1 -0.5Sweden 4.4 7.6 4.9 6.8 7.0 8.7 9.4 3.8 3.0 0.4 -11.3 2.9 -0.6United Kingdom 6.2 8.1 6.1 6.8 7.0 9.6 -1.5 0.8 -0.6 -0.9 -13.0 0.9 -2.0EU 5.2 8.3 5.5 7.6 6.2 9.2 5.2 3.0 1.5 0.9 -11.0 2.9 -0.9USA 8.9 9.2 6.1 11.3 5.9 6.0 2.2 -2.3 -3.4 -4.7 -10.7 -1.0 1.5Japan 6.3 1.3 4.6 8.1 5.8 4.2 1.5 1.5 1.1 1.3 -15.1 3.3 -1.4
TABLE 48 : Merchandise trade balance (fob-fob, as a percentage of GDP, 1992-2010)
5-year averages 2008 2009 20101992-96 1997-01 2002-06 2004 2005 2006 2007 X-2008 IV-2009 X-2008 IV-2009 X-2008 IV-2009
Belgium 3.3 3.2 2.7 2.9 1.9 1.3 1.2 -0.5 -2.2 -0.9 -2.3 -1.2 -2.4Germany 2.2 3.6 6.7 7.0 7.1 7.1 8.4 8.5 7.5 8.6 4.8 8.9 5.1Ireland 16.6 23.2 20.9 21.6 17.4 14.1 11.8 12.8 14.1 14.1 17.9 13.7 18.8Greece -12.5 -16.3 -17.9 -18.0 -16.8 -16.8 -18.7 -18.9 -16.9 -19.1 -14.8 -19.2 -15.0Spain -3.3 -4.6 -6.5 -6.3 -7.5 -8.5 -8.5 -8.1 -7.7 -6.7 -5.3 -6.1 -4.8France 0.6 1.0 -0.5 -0.3 -1.3 -1.5 -2.0 -2.7 -2.9 -2.8 -3.1 -2.8 -3.4Italy 2.7 2.1 0.4 0.6 0.0 -0.7 0.2 0.1 0.0 0.5 0.9 0.6 0.8Cyprus : -24.6 -25.8 -25.6 -25.0 -27.2 -30.2 -31.7 -32.7 -32.1 -27.4 -32.3 -27.6Luxembourg -10.2 -12.7 -10.4 -10.0 -11.3 -9.6 -8.1 -8.8 -10.1 -8.5 -7.5 -8.1 -7.8Malta -22.4 -17.6 -14.8 -15.4 -18.8 -18.9 -18.1 -19.2 -20.9 -19.5 -18.9 -19.5 -19.6Netherlands 5.0 5.3 7.2 7.2 7.9 7.8 7.7 6.0 7.0 5.7 5.8 5.2 5.5Austria -4.2 -2.2 -0.1 -0.2 -0.5 0.2 0.6 0.3 0.0 0.1 -0.2 0.1 -0.6Portugal -8.9 -10.6 -9.6 -9.5 -10.3 -10.1 -9.9 -11.1 -11.9 -10.0 -9.7 -9.8 -9.1Slovenia -1.1 -4.4 -2.9 -3.8 -3.6 -3.8 -4.9 -7.5 -7.3 -7.7 -5.9 -7.7 -5.7Slovakia : -8.6 -5.2 -3.7 -5.4 -5.2 -1.7 -1.5 -1.7 -1.1 -2.8 -0.8 -2.1Finland 7.5 10.0 6.9 6.7 4.9 5.5 4.9 4.8 3.5 4.1 2.1 3.8 1.6Euro area 1.2 1.5 1.5 1.7 1.1 0.7 1.0 0.7 0.4 0.9 0.1 1.0 0.1Euro area, adjusted ¹ : 1.2 0.6 0.2 0.6 0.4 0.0 0.6 -0.4 0.7 -0.3Bulgaria -2.6 -5.6 -16.4 -14.9 -20.2 -22.0 -25.5 -26.6 -25.8 -26.0 -19.9 -25.8 -19.2Czech Republic -5.2 -5.3 -0.4 -0.5 2.0 2.0 3.4 3.4 2.8 3.2 1.7 3.1 1.7Denmark 3.8 2.7 2.6 2.7 2.3 0.4 -0.8 -0.8 -1.1 -0.6 -1.0 0.0 -1.3
Estonia : -16.7 -16.1 -17.3 -13.9 -18.3 -17.6 -13.9 -11.9 -10.6 -8.4 -9.3 -9.6Latvia -7.0 -14.8 -19.7 -20.2 -18.9 -25.6 -23.9 -17.0 -17.0 -13.0 -10.5 -11.4 -9.7Lithuania : -11.3 -10.8 -10.6 -11.3 -13.9 -15.1 -12.4 -11.9 -8.1 -2.8 -9.0 -1.2Hungary -5.6 -4.4 -3.1 -3.5 -2.5 -2.3 0.2 0.3 0.4 0.7 1.0 0.2 1.2Poland -0.1 -6.4 -2.3 -2.2 -0.9 -2.0 -4.0 -4.2 -4.3 -5.2 -4.6 -5.3 -3.9Romania -7.3 -6.5 -8.8 -8.7 -9.8 -12.0 -14.4 -14.4 -13.3 -14.2 -9.1 -13.9 -8.0Sweden 5.0 6.9 6.2 6.8 5.8 5.6 4.6 2.8 4.0 2.6 4.9 2.7 5.1United Kingdom -1.8 -2.9 -5.0 -5.1 -5.5 -5.8 -6.4 -6.5 -6.4 -6.1 -6.1 -5.6 -6.0EU -0.2 0.7 0.3 0.4 -0.1 -0.5 -0.6 -0.8 -0.9 -0.6 -0.9 -0.5 -0.8EU, adjusted ¹ : -0.4 -0.8 -1.4 -1.2 -1.5 -1.6 -1.3 -1.6 -1.1 -1.6USA -2.1 -3.6 -5.7 -5.9 -6.4 -6.5 -6.1 -5.7 -5.8 -4.3 -4.6 -3.9 -4.7Japan 2.7 2.5 2.3 2.8 2.1 1.9 2.4 2.2 0.8 2.5 1.7 2.8 2.2
¹ See note 8 on concepts and sources.
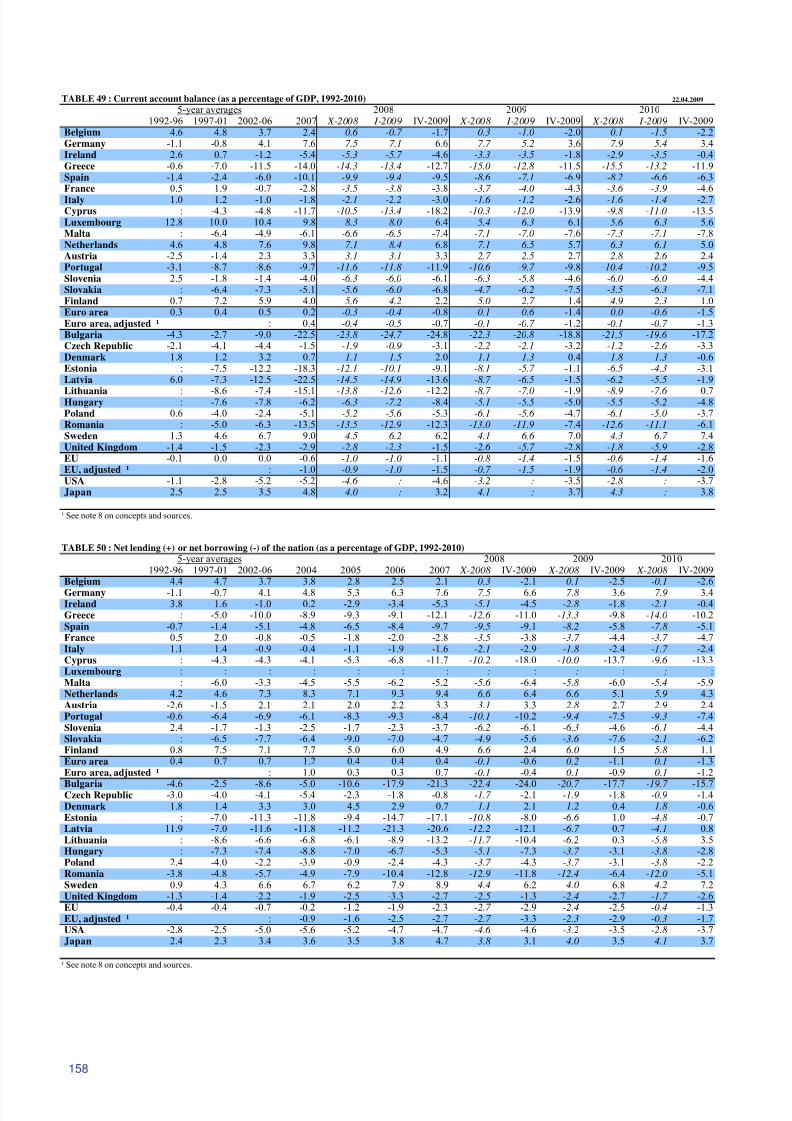
8/14/2019 Economic Forecast 2009
http://slidepdf.com/reader/full/economic-forecast-2009 164/172
158
TABLE 49 : Current account balance (as a percentage of GDP, 1992-2010) 22.04.2009
5-year averages 2008 2009 20101992-96 1997-01 2002-06 2007 X-2008 I-2009 IV-2009 X-2008 I-2009 IV-2009 X-2008 I-2009 IV-2009
Belgium 4.6 4.8 3.7 2.4 0.6 -0.7 -1.7 0.3 -1.0 -2.0 0.1 -1.5 -2.2Germany -1.1 -0.8 4.1 7.6 7.5 7.1 6.6 7.7 5.2 3.6 7.9 5.4 3.4Ireland 2.6 0.7 -1.2 -5.4 -5.3 -5.7 -4.6 -3.3 -3.5 -1.8 -2.9 -3.5 -0.4Greece -0.6 -7.0 -11.5 -14.0 -14.3 -13.4 -12.7 -15.0 -12.8 -11.5 -15.5 -13.2 -11.9Spain -1.4 -2.4 -6.0 -10.1 -9.9 -9.4 -9.5 -8.6 -7.1 -6.9 -8.2 -6.6 -6.3France 0.5 1.9 -0.7 -2.8 -3.5 -3.8 -3.8 -3.7 -4.0 -4.3 -3.6 -3.9 -4.6Italy 1.0 1.2 -1.0 -1.8 -2.1 -2.2 -3.0 -1.6 -1.2 -2.6 -1.6 -1.4 -2.7Cyprus : -4.3 -4.8 -11.7 -10.5 -13.4 -18.2 -10.3 -12.0 -13.9 -9.8 -11.0 -13.5Luxembourg 12.8 10.0 10.4 9.8 8.3 8.0 6.4 5.4 6.3 6.1 5.6 6.3 5.6Malta : -6.4 -4.9 -6.1 -6.6 -6.5 -7.4 -7.1 -7.0 -7.6 -7.3 -7.1 -7.8Netherlands 4.6 4.8 7.6 9.8 7.1 8.4 6.8 7.1 6.5 5.7 6.3 6.1 5.0Austria -2.5 -1.4 2.3 3.3 3.1 3.1 3.3 2.7 2.5 2.7 2.8 2.6 2.4Portugal -3.1 -8.7 -8.6 -9.7 -11.6 -11.8 -11.9 -10.6 -9.7 -9.8 -10.4 -10.2 -9.5Slovenia 2.5 -1.8 -1.4 -4.0 -6.3 -6.0 -6.1 -6.3 -5.8 -4.6 -6.0 -6.0 -4.4Slovakia : -6.4 -7.3 -5.1 -5.6 -6.0 -6.8 -4.7 -6.2 -7.5 -3.5 -6.3 -7.1Finland 0.7 7.2 5.9 4.0 5.6 4.2 2.2 5.0 2.7 1.4 4.9 2.3 1.0Euro area 0.3 0.4 0.5 0.2 -0.3 -0.4 -0.8 -0.1 -0.6 -1.4 0.0 -0.6 -1.5Euro area, adjusted ¹ : 0.4 -0.4 -0.5 -0.7 -0.1 -0.7 -1.2 -0.1 -0.7 -1.3Bulgaria -4.3 -2.7 -9.0 -22.5 -23.8 -24.7 -24.8 -22.3 -20.8 -18.8 -21.5 -19.6 -17.2Czech Republic -2.1 -4.1 -4.4 -1.5 -1.9 -0.9 -3.1 -2.2 -2.1 -3.2 -1.2 -2.6 -3.3Denmark 1.8 1.2 3.2 0.7 1.1 1.5 2.0 1.1 1.3 0.4 1.8 1.3 -0.6Estonia : -7.5 -12.2 -18.3 -12.1 -10.1 -9.1 -8.1 -5.7 -1.1 -6.5 -4.3 -3.1Latvia 6.0 -7.3 -12.5 -22.5 -14.5 -14.9 -13.6 -8.7 -6.5 -1.5 -6.2 -5.5 -1.9
Lithuania : -8.6 -7.4 -15.1 -13.8 -12.6 -12.2 -8.7 -7.0 -1.9 -8.9 -7.6 0.7Hungary : -7.6 -7.8 -6.2 -6.3 -7.2 -8.4 -5.1 -5.5 -5.0 -5.5 -5.2 -4.8Poland 0.6 -4.0 -2.4 -5.1 -5.2 -5.6 -5.3 -6.1 -5.6 -4.7 -6.1 -5.0 -3.7Romania : -5.0 -6.3 -13.5 -13.5 -12.9 -12.3 -13.0 -11.9 -7.4 -12.6 -11.1 -6.1Sweden 1.3 4.6 6.7 9.0 4.5 6.2 6.2 4.1 6.6 7.0 4.3 6.7 7.4United Kingdom -1.4 -1.5 -2.3 -2.9 -2.8 -2.3 -1.5 -2.6 -5.7 -2.8 -1.8 -5.9 -2.8EU -0.1 0.0 0.0 -0.6 -1.0 -1.0 -1.1 -0.8 -1.4 -1.5 -0.6 -1.4 -1.6EU, adjusted ¹ : -1.0 -0.9 -1.0 -1.5 -0.7 -1.5 -1.9 -0.6 -1.4 -2.0USA -1.1 -2.8 -5.2 -5.2 -4.6 : -4.6 -3.2 : -3.5 -2.8 : -3.7Japan 2.5 2.5 3.5 4.8 4.0 : 3.2 4.1 : 3.7 4.3 : 3.8
¹ See note 8 on concepts and sources.
TABLE 50 : Net lending (+) or net borrowing (-) of the nation (as a percentage of GDP, 1992-2010)
5-year averages 2008 2009 20101992-96 1997-01 2002-06 2004 2005 2006 2007 X-2008 IV-2009 X-2008 IV-2009 X-2008 IV-2009
Belgium 4.4 4.7 3.7 3.8 2.8 2.5 2.1 0.3 -2.1 0.1 -2.5 -0.1 -2.6Germany -1.1 -0.7 4.1 4.8 5.3 6.3 7.6 7.5 6.6 7.8 3.6 7.9 3.4Ireland 3.8 1.6 -1.0 0.2 -2.9 -3.4 -5.3 -5.1 -4.5 -2.8 -1.8 -2.1 -0.4Greece : -5.0 -10.0 -8.9 -9.3 -9.1 -12.1 -12.6 -11.0 -13.3 -9.8 -14.0 -10.2Spain -0.7 -1.4 -5.1 -4.8 -6.5 -8.4 -9.7 -9.5 -9.1 -8.2 -5.8 -7.8 -5.1France 0.5 2.0 -0.8 -0.5 -1.8 -2.0 -2.8 -3.5 -3.8 -3.7 -4.4 -3.7 -4.7Italy 1.1 1.4 -0.9 -0.4 -1.1 -1.9 -1.6 -2.1 -2.9 -1.8 -2.4 -1.7 -2.4Cyprus : -4.3 -4.3 -4.1 -5.3 -6.8 -11.7 -10.2 -18.0 -10.0 -13.7 -9.6 -13.3Luxembourg : : : : : : : : : : : : :Malta : -6.0 -3.3 -4.5 -5.5 -6.2 -5.2 -5.6 -6.4 -5.8 -6.0 -5.4 -5.9Netherlands 4.2 4.6 7.3 8.3 7.1 9.3 9.4 6.6 6.4 6.6 5.1 5.9 4.3Austria -2.6 -1.5 2.1 2.1 2.0 2.2 3.3 3.1 3.3 2.8 2.7 2.9 2.4Portugal -0.6 -6.4 -6.9 -6.1 -8.3 -9.3 -8.4 -10.1 -10.2 -9.4 -7.5 -9.3 -7.4Slovenia 2.4 -1.7 -1.3 -2.5 -1.7 -2.3 -3.7 -6.2 -6.1 -6.3 -4.6 -6.1 -4.4Slovakia : -6.5 -7.7 -6.4 -9.0 -7.0 -4.7 -4.9 -5.6 -3.6 -7.6 -2.1 -6.2Finland 0.8 7.5 7.1 7.7 5.0 6.0 4.9 6.6 2.4 6.0 1.5 5.8 1.1Euro area 0.4 0.7 0.7 1.2 0.4 0.4 0.4 -0.1 -0.6 0.2 -1.1 0.1 -1.3Euro area, adjusted ¹ : 1.0 0.3 0.3 0.7 -0.1 -0.4 0.1 -0.9 0.1 -1.2
Bulgaria -4.6 -2.5 -8.6 -5.0 -10.6 -17.9 -21.3 -22.4 -24.0 -20.7 -17.7 -19.7 -15.7Czech Republic -3.0 -4.0 -4.1 -5.4 -2.3 -1.8 -0.8 -1.7 -2.1 -1.9 -1.8 -0.9 -1.4Denmark 1.8 1.4 3.3 3.0 4.5 2.9 0.7 1.1 2.1 1.2 0.4 1.8 -0.6Estonia : -7.0 -11.3 -11.8 -9.4 -14.7 -17.1 -10.8 -8.0 -6.6 1.0 -4.8 -0.7Latvia 11.9 -7.0 -11.6 -11.8 -11.2 -21.3 -20.6 -12.2 -12.1 -6.7 0.7 -4.1 0.8Lithuania : -8.6 -6.6 -6.8 -6.1 -8.9 -13.2 -11.7 -10.4 -6.2 0.3 -5.8 3.5Hungary : -7.3 -7.4 -8.8 -7.0 -6.7 -5.3 -5.1 -7.3 -3.7 -3.1 -3.8 -2.8Poland 2.4 -4.0 -2.2 -3.9 -0.9 -2.4 -4.3 -3.7 -4.3 -3.7 -3.1 -3.8 -2.2Romania -3.8 -4.8 -5.7 -4.9 -7.9 -10.4 -12.8 -12.9 -11.8 -12.4 -6.4 -12.0 -5.1Sweden 0.9 4.3 6.6 6.7 6.2 7.9 8.9 4.4 6.2 4.0 6.8 4.2 7.2United Kingdom -1.3 -1.4 -2.2 -1.9 -2.5 -3.3 -2.7 -2.5 -1.3 -2.4 -2.7 -1.7 -2.6EU -0.4 -0.4 -0.7 -0.2 -1.2 -1.9 -2.3 -2.7 -2.9 -2.4 -2.5 -0.4 -1.3EU, adjusted ¹ : -0.9 -1.6 -2.5 -2.7 -2.7 -3.3 -2.3 -2.9 -0.3 -1.7USA -2.8 -2.5 -5.0 -5.6 -5.2 -4.7 -4.7 -4.6 -4.6 -3.2 -3.5 -2.8 -3.7Japan 2.4 2.3 3.4 3.6 3.5 3.8 4.7 3.8 3.1 4.0 3.5 4.1 3.7
¹ See note 8 on concepts and sources.
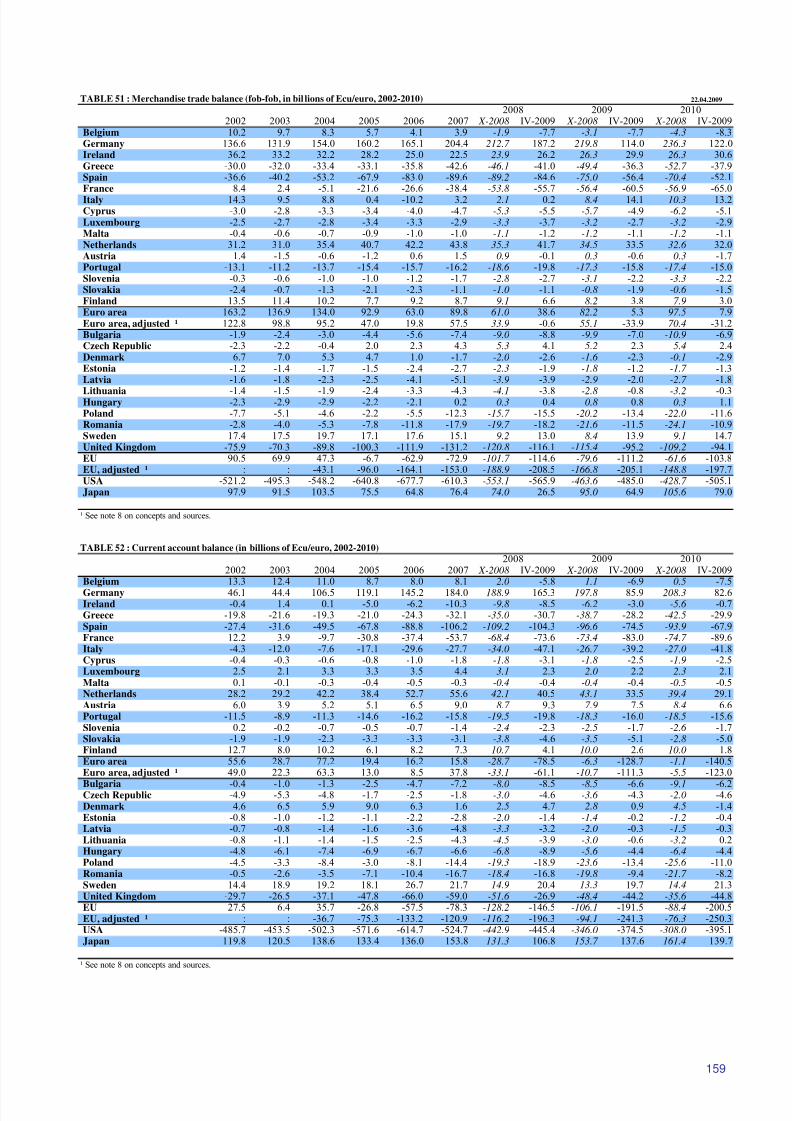
8/14/2019 Economic Forecast 2009
http://slidepdf.com/reader/full/economic-forecast-2009 165/172
159
TABLE 51 : Merchandise trade balance (fob-fob, in bil lions of Ecu/euro, 2002-2010) 22.04.2009
2008 2009 20102002 2003 2004 2005 2006 2007 X-2008 IV-2009 X-2008 IV-2009 X-2008 IV-2009
Belgium 10.2 9.7 8.3 5.7 4.1 3.9 -1.9 -7.7 -3.1 -7.7 -4.3 -8.3Germany 136.6 131.9 154.0 160.2 165.1 204.4 212.7 187.2 219.8 114.0 236.3 122.0Ireland 36.2 33.2 32.2 28.2 25.0 22.5 23.9 26.2 26.3 29.9 26.3 30.6Greece -30.0 -32.0 -33.4 -33.1 -35.8 -42.6 -46.1 -41.0 -49.4 -36.3 -52.7 -37.9Spain -36.6 -40.2 -53.2 -67.9 -83.0 -89.6 -89.2 -84.6 -75.0 -56.4 -70.4 -52.1France 8.4 2.4 -5.1 -21.6 -26.6 -38.4 -53.8 -55.7 -56.4 -60.5 -56.9 -65.0Italy 14.3 9.5 8.8 0.4 -10.2 3.2 2.1 0.2 8.4 14.1 10.3 13.2Cyprus -3.0 -2.8 -3.3 -3.4 -4.0 -4.7 -5.3 -5.5 -5.7 -4.9 -6.2 -5.1Luxembourg -2.5 -2.7 -2.8 -3.4 -3.3 -2.9 -3.3 -3.7 -3.2 -2.7 -3.2 -2.9Malta -0.4 -0.6 -0.7 -0.9 -1.0 -1.0 -1.1 -1.2 -1.2 -1.1 -1.2 -1.1Netherlands 31.2 31.0 35.4 40.7 42.2 43.8 35.3 41.7 34.5 33.5 32.6 32.0Austria 1.4 -1.5 -0.6 -1.2 0.6 1.5 0.9 -0.1 0.3 -0.6 0.3 -1.7Portugal -13.1 -11.2 -13.7 -15.4 -15.7 -16.2 -18.6 -19.8 -17.3 -15.8 -17.4 -15.0Slovenia -0.3 -0.6 -1.0 -1.0 -1.2 -1.7 -2.8 -2.7 -3.1 -2.2 -3.3 -2.2Slovakia -2.4 -0.7 -1.3 -2.1 -2.3 -1.1 -1.0 -1.1 -0.8 -1.9 -0.6 -1.5Finland 13.5 11.4 10.2 7.7 9.2 8.7 9.1 6.6 8.2 3.8 7.9 3.0Euro area 163.2 136.9 134.0 92.9 63.0 89.8 61.0 38.6 82.2 5.3 97.5 7.9Euro area, adjusted ¹ 122.8 98.8 95.2 47.0 19.8 57.5 33.9 -0.6 55.1 -33.9 70.4 -31.2Bulgaria -1.9 -2.4 -3.0 -4.4 -5.6 -7.4 -9.0 -8.8 -9.9 -7.0 -10.9 -6.9Czech Republic -2.3 -2.2 -0.4 2.0 2.3 4.3 5.3 4.1 5.2 2.3 5.4 2.4Denmark 6.7 7.0 5.3 4.7 1.0 -1.7 -2.0 -2.6 -1.6 -2.3 -0.1 -2.9Estonia -1.2 -1.4 -1.7 -1.5 -2.4 -2.7 -2.3 -1.9 -1.8 -1.2 -1.7 -1.3Latvia -1.6 -1.8 -2.3 -2.5 -4.1 -5.1 -3.9 -3.9 -2.9 -2.0 -2.7 -1.8
Lithuania -1.4 -1.5 -1.9 -2.4 -3.3 -4.3 -4.1 -3.8 -2.8 -0.8 -3.2 -0.3Hungary -2.3 -2.9 -2.9 -2.2 -2.1 0.2 0.3 0.4 0.8 0.8 0.3 1.1Poland -7.7 -5.1 -4.6 -2.2 -5.5 -12.3 -15.7 -15.5 -20.2 -13.4 -22.0 -11.6Romania -2.8 -4.0 -5.3 -7.8 -11.8 -17.9 -19.7 -18.2 -21.6 -11.5 -24.1 -10.9Sweden 17.4 17.5 19.7 17.1 17.6 15.1 9.2 13.0 8.4 13.9 9.1 14.7United Kingdom -75.9 -70.3 -89.8 -100.3 -111.9 -131.2 -120.8 -116.1 -115.4 -95.2 -109.2 -94.1EU 90.5 69.9 47.3 -6.7 -62.9 -72.9 -101.7 -114.6 -79.6 -111.2 -61.6 -103.8EU, adjusted ¹ : : -43.1 -96.0 -164.1 -153.0 -188.9 -208.5 -166.8 -205.1 -148.8 -197.7USA -521.2 -495.3 -548.2 -640.8 -677.7 -610.3 -553.1 -565.9 -463.6 -485.0 -428.7 -505.1Japan 97.9 91.5 103.5 75.5 64.8 76.4 74.0 26.5 95.0 64.9 105.6 79.0
¹ See note 8 on concepts and sources.
TABLE 52 : Current account balance (in billions of Ecu/euro, 2002-2010)
2008 2009 20102002 2003 2004 2005 2006 2007 X-2008 IV-2009 X-2008 IV-2009 X-2008 IV-2009
Belgium 13.3 12.4 11.0 8.7 8.0 8.1 2.0 -5.8 1.1 -6.9 0.5 -7.5Germany 46.1 44.4 106.5 119.1 145.2 184.0 188.9 165.3 197.8 85.9 208.3 82.6Ireland -0.4 1.4 0.1 -5.0 -6.2 -10.3 -9.8 -8.5 -6.2 -3.0 -5.6 -0.7Greece -19.8 -21.6 -19.3 -21.0 -24.3 -32.1 -35.0 -30.7 -38.7 -28.2 -42.5 -29.9Spain -27.4 -31.6 -49.5 -67.8 -88.8 -106.2 -109.2 -104.3 -96.6 -74.5 -93.9 -67.9France 12.2 3.9 -9.7 -30.8 -37.4 -53.7 -68.4 -73.6 -73.4 -83.0 -74.7 -89.6Italy -4.3 -12.0 -7.6 -17.1 -29.6 -27.7 -34.0 -47.1 -26.7 -39.2 -27.0 -41.8Cyprus -0.4 -0.3 -0.6 -0.8 -1.0 -1.8 -1.8 -3.1 -1.8 -2.5 -1.9 -2.5Luxembourg 2.5 2.1 3.3 3.3 3.5 4.4 3.1 2.3 2.0 2.2 2.3 2.1Malta 0.1 -0.1 -0.3 -0.4 -0.5 -0.3 -0.4 -0.4 -0.4 -0.4 -0.5 -0.5Netherlands 28.2 29.2 42.2 38.4 52.7 55.6 42.1 40.5 43.1 33.5 39.4 29.1Austria 6.0 3.9 5.2 5.1 6.5 9.0 8.7 9.3 7.9 7.5 8.4 6.6Portugal -11.5 -8.9 -11.3 -14.6 -16.2 -15.8 -19.5 -19.8 -18.3 -16.0 -18.5 -15.6Slovenia 0.2 -0.2 -0.7 -0.5 -0.7 -1.4 -2.4 -2.3 -2.5 -1.7 -2.6 -1.7Slovakia -1.9 -1.9 -2.3 -3.3 -3.3 -3.1 -3.8 -4.6 -3.5 -5.1 -2.8 -5.0Finland 12.7 8.0 10.2 6.1 8.2 7.3 10.7 4.1 10.0 2.6 10.0 1.8Euro area 55.6 28.7 77.2 19.4 16.2 15.8 -28.7 -78.5 -6.3 -128.7 -1.1 -140.5Euro area, adjusted ¹ 49.0 22.3 63.3 13.0 8.5 37.8 -33.1 -61.1 -10.7 -111.3 -5.5 -123.0
Bulgaria -0.4 -1.0 -1.3 -2.5 -4.7 -7.2 -8.0 -8.5 -8.5 -6.6 -9.1 -6.2Czech Republic -4.9 -5.3 -4.8 -1.7 -2.5 -1.8 -3.0 -4.6 -3.6 -4.3 -2.0 -4.6Denmark 4.6 6.5 5.9 9.0 6.3 1.6 2.5 4.7 2.8 0.9 4.5 -1.4Estonia -0.8 -1.0 -1.2 -1.1 -2.2 -2.8 -2.0 -1.4 -1.4 -0.2 -1.2 -0.4Latvia -0.7 -0.8 -1.4 -1.6 -3.6 -4.8 -3.3 -3.2 -2.0 -0.3 -1.5 -0.3Lithuania -0.8 -1.1 -1.4 -1.5 -2.5 -4.3 -4.5 -3.9 -3.0 -0.6 -3.2 0.2Hungary -4.8 -6.1 -7.4 -6.9 -6.7 -6.6 -6.8 -8.9 -5.6 -4.4 -6.4 -4.4Poland -4.5 -3.3 -8.4 -3.0 -8.1 -14.4 -19.3 -18.9 -23.6 -13.4 -25.6 -11.0Romania -0.5 -2.6 -3.5 -7.1 -10.4 -16.7 -18.4 -16.8 -19.8 -9.4 -21.7 -8.2Sweden 14.4 18.9 19.2 18.1 26.7 21.7 14.9 20.4 13.3 19.7 14.4 21.3United Kingdom -29.7 -26.5 -37.1 -47.8 -66.0 -59.0 -51.6 -26.9 -48.4 -44.2 -35.6 -44.8EU 27.5 6.4 35.7 -26.8 -57.5 -78.3 -128.2 -146.5 -106.1 -191.5 -88.4 -200.5EU, adjusted ¹ : : -36.7 -75.3 -133.2 -120.9 -116.2 -196.3 -94.1 -241.3 -76.3 -250.3USA -485.7 -453.5 -502.3 -571.6 -614.7 -524.7 -442.9 -445.4 -346.0 -374.5 -308.0 -395.1Japan 119.8 120.5 138.6 133.4 136.0 153.8 131.3 106.8 153.7 137.6 161.4 139.7
¹ See note 8 on concepts and sources.
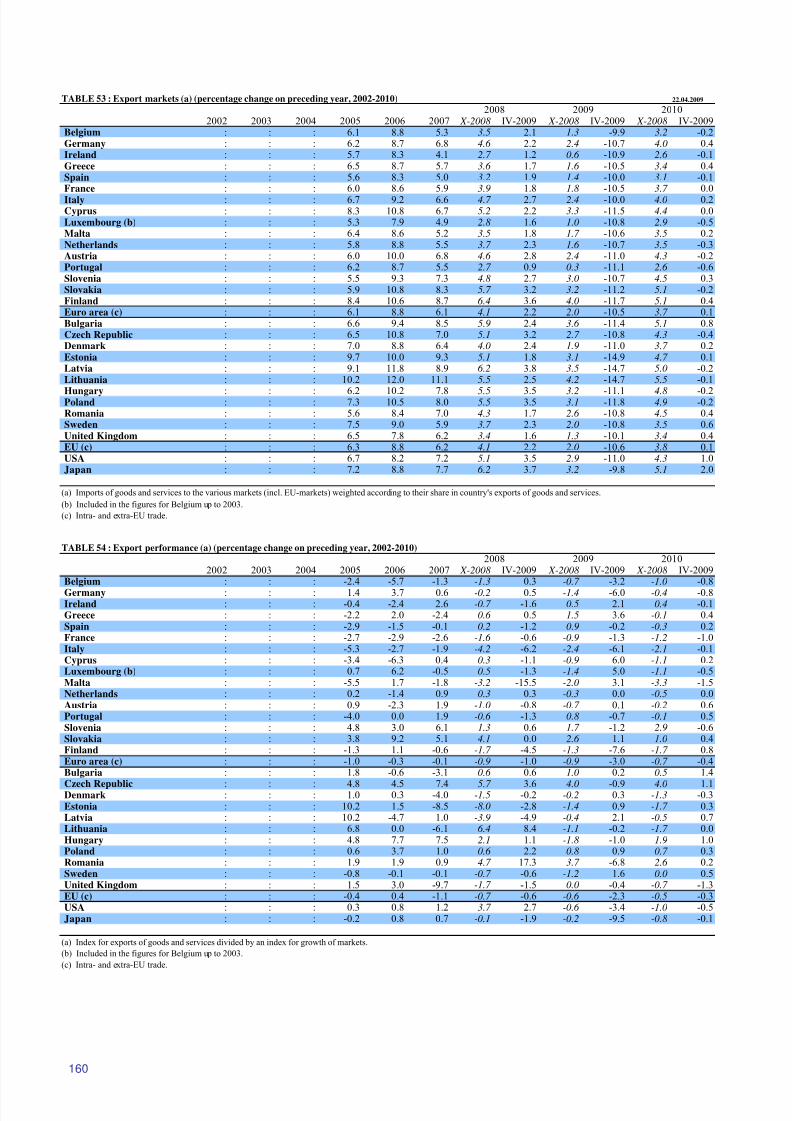
8/14/2019 Economic Forecast 2009
http://slidepdf.com/reader/full/economic-forecast-2009 166/172
160
TABLE 53 : Export markets (a) (percentage change on preceding year, 2002-2010) 22.04.2009
2008 2009 20102002 2003 2004 2005 2006 2007 X-2008 IV-2009 X-2008 IV-2009 X-2008 IV-2009
Belgium : : : 6.1 8.8 5.3 3.5 2.1 1.3 -9.9 3.2 -0.2Germany : : : 6.2 8.7 6.8 4.6 2.2 2.4 -10.7 4.0 0.4Ireland : : : 5.7 8.3 4.1 2.7 1.2 0.6 -10.9 2.6 -0.1Greece : : : 6.5 8.7 5.7 3.6 1.7 1.6 -10.5 3.4 0.4Spain : : : 5.6 8.3 5.0 3.2 1.9 1.4 -10.0 3.1 -0.1France : : : 6.0 8.6 5.9 3.9 1.8 1.8 -10.5 3.7 0.0Italy : : : 6.7 9.2 6.6 4.7 2.7 2.4 -10.0 4.0 0.2Cyprus : : : 8.3 10.8 6.7 5.2 2.2 3.3 -11.5 4.4 0.0Luxembourg (b) : : : 5.3 7.9 4.9 2.8 1.6 1.0 -10.8 2.9 -0.5Malta : : : 6.4 8.6 5.2 3.5 1.8 1.7 -10.6 3.5 0.2Netherlands : : : 5.8 8.8 5.5 3.7 2.3 1.6 -10.7 3.5 -0.3Austria : : : 6.0 10.0 6.8 4.6 2.8 2.4 -11.0 4.3 -0.2Portugal : : : 6.2 8.7 5.5 2.7 0.9 0.3 -11.1 2.6 -0.6Slovenia : : : 5.5 9.3 7.3 4.8 2.7 3.0 -10.7 4.5 0.3Slovakia : : : 5.9 10.8 8.3 5.7 3.2 3.2 -11.2 5.1 -0.2Finland : : : 8.4 10.6 8.7 6.4 3.6 4.0 -11.7 5.1 0.4Euro area (c) : : : 6.1 8.8 6.1 4.1 2.2 2.0 -10.5 3.7 0.1Bulgaria : : : 6.6 9.4 8.5 5.9 2.4 3.6 -11.4 5.1 0.8Czech Republic : : : 6.5 10.8 7.0 5.1 3.2 2.7 -10.8 4.3 -0.4Denmark : : : 7.0 8.8 6.4 4.0 2.4 1.9 -11.0 3.7 0.2Estonia : : : 9.7 10.0 9.3 5.1 1.8 3.1 -14.9 4.7 0.1Latvia : : : 9.1 11.8 8.9 6.2 3.8 3.5 -14.7 5.0 -0.2Lithuania : : : 10.2 12.0 11.1 5.5 2.5 4.2 -14.7 5.5 -0.1
Hungary : : : 6.2 10.2 7.8 5.5 3.5 3.2 -11.1 4.8 -0.2Poland : : : 7.3 10.5 8.0 5.5 3.5 3.1 -11.8 4.9 -0.2Romania : : : 5.6 8.4 7.0 4.3 1.7 2.6 -10.8 4.5 0.4Sweden : : : 7.5 9.0 5.9 3.7 2.3 2.0 -10.8 3.5 0.6United Kingdom : : : 6.5 7.8 6.2 3.4 1.6 1.3 -10.1 3.4 0.4EU (c) : : : 6.3 8.8 6.2 4.1 2.2 2.0 -10.6 3.8 0.1USA : : : 6.7 8.2 7.2 5.1 3.5 2.9 -11.0 4.3 1.0Japan : : : 7.2 8.8 7.7 6.2 3.7 3.2 -9.8 5.1 2.0
(a) Imports of goods and services to the various markets (incl. EU-markets) weighted according to their share in country's exports of goods and services.
(b) Included in the figures for Belgium up to 2003.
(c) Intra- and extra-EU trade.
TABLE 54 : Export performance (a) (percentage change on preceding year, 2002-2010)
2008 2009 20102002 2003 2004 2005 2006 2007 X-2008 IV-2009 X-2008 IV-2009 X-2008 IV-2009
Belgium : : : -2.4 -5.7 -1.3 -1.3 0.3 -0.7 -3.2 -1.0 -0.8Germany : : : 1.4 3.7 0.6 -0.2 0.5 -1.4 -6.0 -0.4 -0.8Ireland : : : -0.4 -2.4 2.6 -0.7 -1.6 0.5 2.1 0.4 -0.1Greece : : : -2.2 2.0 -2.4 0.6 0.5 1.5 3.6 -0.1 0.4Spain : : : -2.9 -1.5 -0.1 0.2 -1.2 0.9 -0.2 -0.3 0.2France : : : -2.7 -2.9 -2.6 -1.6 -0.6 -0.9 -1.3 -1.2 -1.0Italy : : : -5.3 -2.7 -1.9 -4.2 -6.2 -2.4 -6.1 -2.1 -0.1Cyprus : : : -3.4 -6.3 0.4 0.3 -1.1 -0.9 6.0 -1.1 0.2Luxembourg (b) : : : 0.7 6.2 -0.5 0.5 -1.3 -1.4 5.0 -1.1 -0.5Malta : : : -5.5 1.7 -1.8 -3.2 -15.5 -2.0 3.1 -3.3 -1.5Netherlands : : : 0.2 -1.4 0.9 0.3 0.3 -0.3 0.0 -0.5 0.0Austria : : : 0.9 -2.3 1.9 -1.0 -0.8 -0.7 0.1 -0.2 0.6Portugal : : : -4.0 0.0 1.9 -0.6 -1.3 0.8 -0.7 -0.1 0.5Slovenia : : : 4.8 3.0 6.1 1.3 0.6 1.7 -1.2 2.9 -0.6Slovakia : : : 3.8 9.2 5.1 4.1 0.0 2.6 1.1 1.0 0.4Finland : : : -1.3 1.1 -0.6 -1.7 -4.5 -1.3 -7.6 -1.7 0.8Euro area (c) : : : -1.0 -0.3 -0.1 -0.9 -1.0 -0.9 -3.0 -0.7 -0.4Bulgaria : : : 1.8 -0.6 -3.1 0.6 0.6 1.0 0.2 0.5 1.4
Czech Republic : : : 4.8 4.5 7.4 5.7 3.6 4.0 -0.9 4.0 1.1Denmark : : : 1.0 0.3 -4.0 -1.5 -0.2 -0.2 0.3 -1.3 -0.3Estonia : : : 10.2 1.5 -8.5 -8.0 -2.8 -1.4 0.9 -1.7 0.3Latvia : : : 10.2 -4.7 1.0 -3.9 -4.9 -0.4 2.1 -0.5 0.7Lithuania : : : 6.8 0.0 -6.1 6.4 8.4 -1.1 -0.2 -1.7 0.0Hungary : : : 4.8 7.7 7.5 2.1 1.1 -1.8 -1.0 1.9 1.0Poland : : : 0.6 3.7 1.0 0.6 2.2 0.8 0.9 0.7 0.3Romania : : : 1.9 1.9 0.9 4.7 17.3 3.7 -6.8 2.6 0.2Sweden : : : -0.8 -0.1 -0.1 -0.7 -0.6 -1.2 1.6 0.0 0.5United Kingdom : : : 1.5 3.0 -9.7 -1.7 -1.5 0.0 -0.4 -0.7 -1.3EU (c) : : : -0.4 0.4 -1.1 -0.7 -0.6 -0.6 -2.3 -0.5 -0.3USA : : : 0.3 0.8 1.2 3.7 2.7 -0.6 -3.4 -1.0 -0.5Japan : : : -0.2 0.8 0.7 -0.1 -1.9 -0.2 -9.5 -0.8 -0.1
(a) Index for exports of goods and services divided by an index for growth of markets.
(b) Included in the figures for Belgium up to 2003.
(c) Intra- and extra-EU trade.
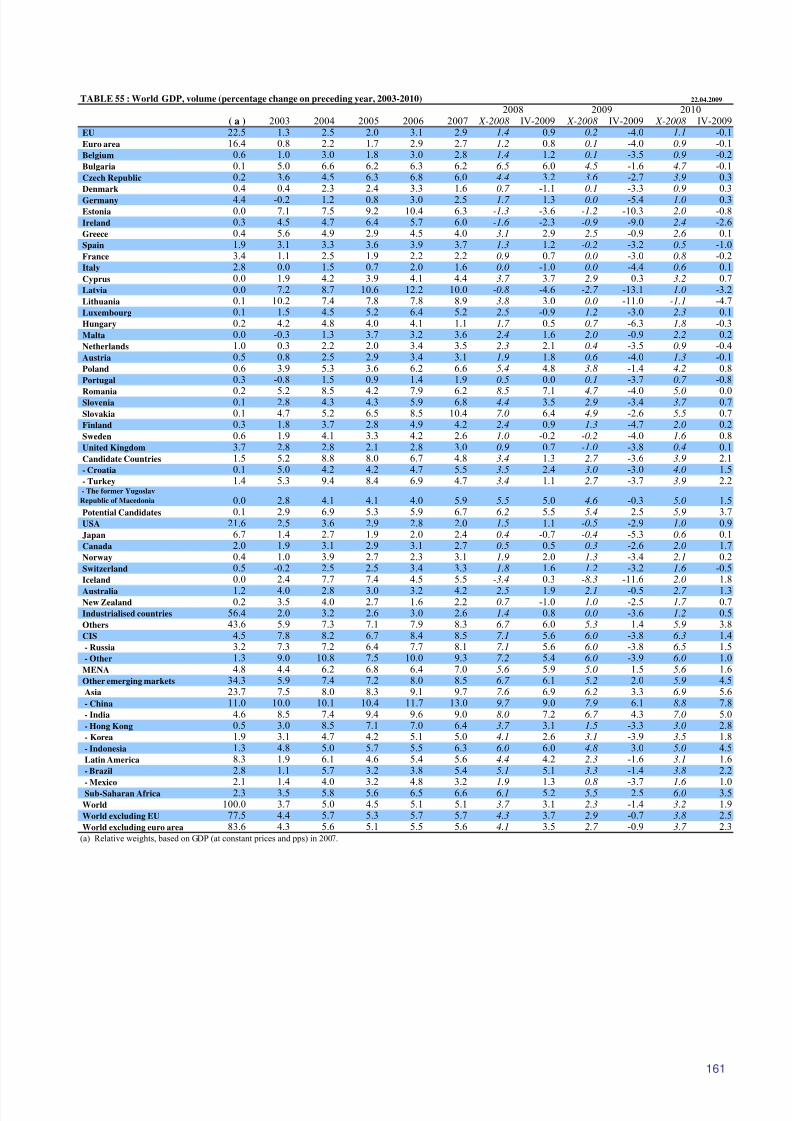
8/14/2019 Economic Forecast 2009
http://slidepdf.com/reader/full/economic-forecast-2009 167/172
161
TABLE 55 : World GDP, volume (percentage change on preceding year, 2003-2010) 22.04.2009
2008 2009 2010 ( a ) 2003 2004 2005 2006 2007 X-2008 IV-2009 X-2008 IV-2009 X-2008 IV-2009
EU 22.5 1.3 2.5 2.0 3.1 2.9 1.4 0.9 0.2 -4.0 1.1 -0.1Euro area 16.4 0.8 2.2 1.7 2.9 2.7 1.2 0.8 0.1 -4.0 0.9 -0.1Belgium 0.6 1.0 3.0 1.8 3.0 2.8 1.4 1.2 0.1 -3.5 0.9 -0.2Bulgaria 0.1 5.0 6.6 6.2 6.3 6.2 6.5 6.0 4.5 -1.6 4.7 -0.1Czech Republic 0.2 3.6 4.5 6.3 6.8 6.0 4.4 3.2 3.6 -2.7 3.9 0.3Denmark 0.4 0.4 2.3 2.4 3.3 1.6 0.7 -1.1 0.1 -3.3 0.9 0.3Germany 4.4 -0.2 1.2 0.8 3.0 2.5 1.7 1.3 0.0 -5.4 1.0 0.3Estonia 0.0 7.1 7.5 9.2 10.4 6.3 -1.3 -3.6 -1.2 -10.3 2.0 -0.8Ireland 0.3 4.5 4.7 6.4 5.7 6.0 -1.6 -2.3 -0.9 -9.0 2.4 -2.6Greece 0.4 5.6 4.9 2.9 4.5 4.0 3.1 2.9 2.5 -0.9 2.6 0.1Spain 1.9 3.1 3.3 3.6 3.9 3.7 1.3 1.2 -0.2 -3.2 0.5 -1.0France 3.4 1.1 2.5 1.9 2.2 2.2 0.9 0.7 0.0 -3.0 0.8 -0.2Italy 2.8 0.0 1.5 0.7 2.0 1.6 0.0 -1.0 0.0 -4.4 0.6 0.1Cyprus 0.0 1.9 4.2 3.9 4.1 4.4 3.7 3.7 2.9 0.3 3.2 0.7Latvia 0.0 7.2 8.7 10.6 12.2 10.0 -0.8 -4.6 -2.7 -13.1 1.0 -3.2Lithuania 0.1 10.2 7.4 7.8 7.8 8.9 3.8 3.0 0.0 -11.0 -1.1 -4.7Luxembourg 0.1 1.5 4.5 5.2 6.4 5.2 2.5 -0.9 1.2 -3.0 2.3 0.1Hungary 0.2 4.2 4.8 4.0 4.1 1.1 1.7 0.5 0.7 -6.3 1.8 -0.3Malta 0.0 -0.3 1.3 3.7 3.2 3.6 2.4 1.6 2.0 -0.9 2.2 0.2Netherlands 1.0 0.3 2.2 2.0 3.4 3.5 2.3 2.1 0.4 -3.5 0.9 -0.4Austria 0.5 0.8 2.5 2.9 3.4 3.1 1.9 1.8 0.6 -4.0 1.3 -0.1Poland 0.6 3.9 5.3 3.6 6.2 6.6 5.4 4.8 3.8 -1.4 4.2 0.8Portugal 0.3 -0.8 1.5 0.9 1.4 1.9 0.5 0.0 0.1 -3.7 0.7 -0.8
Romania 0.2 5.2 8.5 4.2 7.9 6.2 8.5 7.1 4.7 -4.0 5.0 0.0Slovenia 0.1 2.8 4.3 4.3 5.9 6.8 4.4 3.5 2.9 -3.4 3.7 0.7Slovakia 0.1 4.7 5.2 6.5 8.5 10.4 7.0 6.4 4.9 -2.6 5.5 0.7Finland 0.3 1.8 3.7 2.8 4.9 4.2 2.4 0.9 1.3 -4.7 2.0 0.2Sweden 0.6 1.9 4.1 3.3 4.2 2.6 1.0 -0.2 -0.2 -4.0 1.6 0.8United Kingdom 3.7 2.8 2.8 2.1 2.8 3.0 0.9 0.7 -1.0 -3.8 0.4 0.1Candidate Countries 1.5 5.2 8.8 8.0 6.7 4.8 3.4 1.3 2.7 -3.6 3.9 2.1- Croatia 0.1 5.0 4.2 4.2 4.7 5.5 3.5 2.4 3.0 -3.0 4.0 1.5- Turkey 1.4 5.3 9.4 8.4 6.9 4.7 3.4 1.1 2.7 -3.7 3.9 2.2- The former Yugoslav
Republic of Macedonia 0.0 2.8 4.1 4.1 4.0 5.9 5.5 5.0 4.6 -0.3 5.0 1.5Potential Candidates 0.1 2.9 6.9 5.3 5.9 6.7 6.2 5.5 5.4 2.5 5.9 3.7USA 21.6 2.5 3.6 2.9 2.8 2.0 1.5 1.1 -0.5 -2.9 1.0 0.9Japan 6.7 1.4 2.7 1.9 2.0 2.4 0.4 -0.7 -0.4 -5.3 0.6 0.1Canada 2.0 1.9 3.1 2.9 3.1 2.7 0.5 0.5 0.3 -2.6 2.0 1.7Norway 0.4 1.0 3.9 2.7 2.3 3.1 1.9 2.0 1.3 -3.4 2.1 0.2Switzerland 0.5 -0.2 2.5 2.5 3.4 3.3 1.8 1.6 1.2 -3.2 1.6 -0.5Iceland 0.0 2.4 7.7 7.4 4.5 5.5 -3.4 0.3 -8.3 -11.6 2.0 1.8
Australia 1.2 4.0 2.8 3.0 3.2 4.2 2.5 1.9 2.1 -0.5 2.7 1.3New Zealand 0.2 3.5 4.0 2.7 1.6 2.2 0.7 -1.0 1.0 -2.5 1.7 0.7Industrialised countries 56.4 2.0 3.2 2.6 3.0 2.6 1.4 0.8 0.0 -3.6 1.2 0.5Others 43.6 5.9 7.3 7.1 7.9 8.3 6.7 6.0 5.3 1.4 5.9 3.8CIS 4.5 7.8 8.2 6.7 8.4 8.5 7.1 5.6 6.0 -3.8 6.3 1.4- Russia 3.2 7.3 7.2 6.4 7.7 8.1 7.1 5.6 6.0 -3.8 6.5 1.5- Other 1.3 9.0 10.8 7.5 10.0 9.3 7.2 5.4 6.0 -3.9 6.0 1.0
MENA 4.8 4.4 6.2 6.8 6.4 7.0 5.6 5.9 5.0 1.5 5.6 1.6Other emerging markets 34.3 5.9 7.4 7.2 8.0 8.5 6.7 6.1 5.2 2.0 5.9 4.5Asia 23.7 7.5 8.0 8.3 9.1 9.7 7.6 6.9 6.2 3.3 6.9 5.6- China 11.0 10.0 10.1 10.4 11.7 13.0 9.7 9.0 7.9 6.1 8.8 7.8- India 4.6 8.5 7.4 9.4 9.6 9.0 8.0 7.2 6.7 4.3 7.0 5.0- Hong Kong 0.5 3.0 8.5 7.1 7.0 6.4 3.7 3.1 1.5 -3.3 3.0 2.8- Korea 1.9 3.1 4.7 4.2 5.1 5.0 4.1 2.6 3.1 -3.9 3.5 1.8- Indonesia 1.3 4.8 5.0 5.7 5.5 6.3 6.0 6.0 4.8 3.0 5.0 4.5Latin America 8.3 1.9 6.1 4.6 5.4 5.6 4.4 4.2 2.3 -1.6 3.1 1.6- Brazil 2.8 1.1 5.7 3.2 3.8 5.4 5.1 5.1 3.3 -1.4 3.8 2.2
- Mexico 2.1 1.4 4.0 3.2 4.8 3.2 1.9 1.3 0.8 -3.7 1.6 1.0Sub-Saharan Africa 2.3 3.5 5.8 5.6 6.5 6.6 6.1 5.2 5.5 2.5 6.0 3.5World 100.0 3.7 5.0 4.5 5.1 5.1 3.7 3.1 2.3 -1.4 3.2 1.9World excluding EU 77.5 4.4 5.7 5.3 5.7 5.7 4.3 3.7 2.9 -0.7 3.8 2.5World excluding euro area 83.6 4.3 5.6 5.1 5.5 5.6 4.1 3.5 2.7 -0.9 3.7 2.3
(a) Relative weights, based on GDP (at constant prices and pps) in 2007.
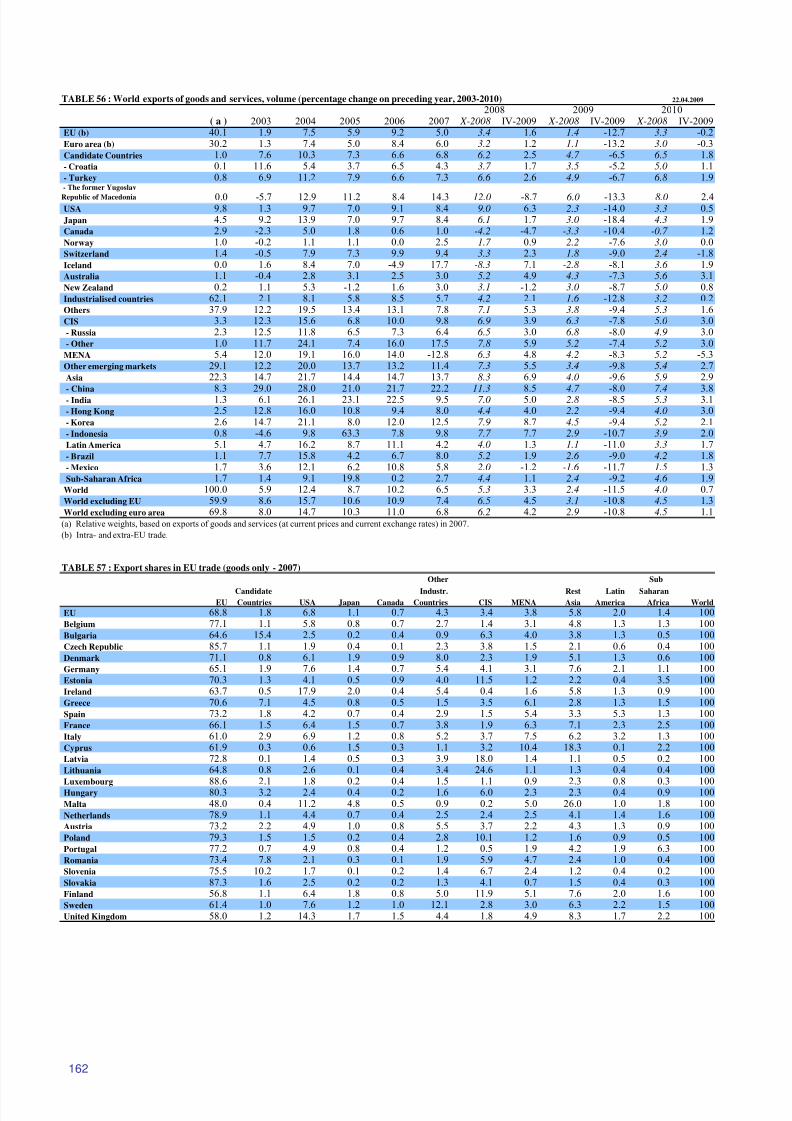
8/14/2019 Economic Forecast 2009
http://slidepdf.com/reader/full/economic-forecast-2009 168/172
162
TABLE 56 : World exports of goods and services, volume (percentage change on preceding year, 2003-2010) 22.04.2009
2008 2009 2010 ( a ) 2003 2004 2005 2006 2007 X-2008 IV-2009 X-2008 IV-2009 X-2008 IV-2009
EU (b) 40.1 1.9 7.5 5.9 9.2 5.0 3.4 1.6 1.4 -12.7 3.3 -0.2Euro area (b) 30.2 1.3 7.4 5.0 8.4 6.0 3.2 1.2 1.1 -13.2 3.0 -0.3Candidate Countries 1.0 7.6 10.3 7.3 6.6 6.8 6.2 2.5 4.7 -6.5 6.5 1.8- Croatia 0.1 11.6 5.4 3.7 6.5 4.3 3.7 1.7 3.5 -5.2 5.0 1.1- Turkey 0.8 6.9 11.2 7.9 6.6 7.3 6.6 2.6 4.9 -6.7 6.8 1.9- The former Yugoslav
Republic of Macedonia 0.0 -5.7 12.9 11.2 8.4 14.3 12.0 -8.7 6.0 -13.3 8.0 2.4USA 9.8 1.3 9.7 7.0 9.1 8.4 9.0 6.3 2.3 -14.0 3.3 0.5Japan 4.5 9.2 13.9 7.0 9.7 8.4 6.1 1.7 3.0 -18.4 4.3 1.9Canada 2.9 -2.3 5.0 1.8 0.6 1.0 -4.2 -4.7 -3.3 -10.4 -0.7 1.2Norway 1.0 -0.2 1.1 1.1 0.0 2.5 1.7 0.9 2.2 -7.6 3.0 0.0Switzerland 1.4 -0.5 7.9 7.3 9.9 9.4 3.3 2.3 1.8 -9.0 2.4 -1.8Iceland 0.0 1.6 8.4 7.0 -4.9 17.7 -8.3 7.1 -2.8 -8.1 3.6 1.9Australia 1.1 -0.4 2.8 3.1 2.5 3.0 5.2 4.9 4.3 -7.3 5.6 3.1New Zealand 0.2 1.1 5.3 -1.2 1.6 3.0 3.1 -1.2 3.0 -8.7 5.0 0.8Industrialised countries 62.1 2.1 8.1 5.8 8.5 5.7 4.2 2.1 1.6 -12.8 3.2 0.2Others 37.9 12.2 19.5 13.4 13.1 7.8 7.1 5.3 3.8 -9.4 5.3 1.6CIS 3.3 12.3 15.6 6.8 10.0 9.8 6.9 3.9 6.3 -7.8 5.0 3.0- Russia 2.3 12.5 11.8 6.5 7.3 6.4 6.5 3.0 6.8 -8.0 4.9 3.0- Other 1.0 11.7 24.1 7.4 16.0 17.5 7.8 5.9 5.2 -7.4 5.2 3.0
MENA 5.4 12.0 19.1 16.0 14.0 -12.8 6.3 4.8 4.2 -8.3 5.2 -5.3Other emerging markets 29.1 12.2 20.0 13.7 13.2 11.4 7.3 5.5 3.4 -9.8 5.4 2.7Asia 22.3 14.7 21.7 14.4 14.7 13.7 8.3 6.9 4.0 -9.6 5.9 2.9
- China 8.3 29.0 28.0 21.0 21.7 22.2 11.3 8.5 4.7 -8.0 7.4 3.8- India 1.3 6.1 26.1 23.1 22.5 9.5 7.0 5.0 2.8 -8.5 5.3 3.1- Hong Kong 2.5 12.8 16.0 10.8 9.4 8.0 4.4 4.0 2.2 -9.4 4.0 3.0- Korea 2.6 14.7 21.1 8.0 12.0 12.5 7.9 8.7 4.5 -9.4 5.2 2.1- Indonesia 0.8 -4.6 9.8 63.3 7.8 9.8 7.7 7.7 2.9 -10.7 3.9 2.0Latin America 5.1 4.7 16.2 8.7 11.1 4.2 4.0 1.3 1.1 -11.0 3.3 1.7- Brazil 1.1 7.7 15.8 4.2 6.7 8.0 5.2 1.9 2.6 -9.0 4.2 1.8- Mexico 1.7 3.6 12.1 6.2 10.8 5.8 2.0 -1.2 -1.6 -11.7 1.5 1.3Sub-Saharan Africa 1.7 1.4 9.1 19.8 0.2 2.7 4.4 1.1 2.4 -9.2 4.6 1.9
World 100.0 5.9 12.4 8.7 10.2 6.5 5.3 3.3 2.4 -11.5 4.0 0.7World excluding EU 59.9 8.6 15.7 10.6 10.9 7.4 6.5 4.5 3.1 -10.8 4.5 1.3World excluding euro area 69.8 8.0 14.7 10.3 11.0 6.8 6.2 4.2 2.9 -10.8 4.5 1.1
(a) Relative weights, based on exports of goods and services (at current prices and current exchange rates) in 2007.
(b) Intra- and extra-EU trade.
TABLE 57 : Export shares in EU trade (goods only - 2007)
Other Sub
Candidate Industr. Rest Latin Saharan
EU Countries USA Japan Canada Countries CIS MENA Asia America Africa World
EU 68.8 1.8 6.8 1.1 0.7 4.3 3.4 3.8 5.8 2.0 1.4 100Belgium 77.1 1.1 5.8 0.8 0.7 2.7 1.4 3.1 4.8 1.3 1.3 100Bulgaria 64.6 15.4 2.5 0.2 0.4 0.9 6.3 4.0 3.8 1.3 0.5 100Czech Republic 85.7 1.1 1.9 0.4 0.1 2.3 3.8 1.5 2.1 0.6 0.4 100Denmark 71.1 0.8 6.1 1.9 0.9 8.0 2.3 1.9 5.1 1.3 0.6 100Germany 65.1 1.9 7.6 1.4 0.7 5.4 4.1 3.1 7.6 2.1 1.1 100Estonia 70.3 1.3 4.1 0.5 0.9 4.0 11.5 1.2 2.2 0.4 3.5 100Ireland 63.7 0.5 17.9 2.0 0.4 5.4 0.4 1.6 5.8 1.3 0.9 100Greece 70.6 7.1 4.5 0.8 0.5 1.5 3.5 6.1 2.8 1.3 1.5 100Spain 73.2 1.8 4.2 0.7 0.4 2.9 1.5 5.4 3.3 5.3 1.3 100France 66.1 1.5 6.4 1.5 0.7 3.8 1.9 6.3 7.1 2.3 2.5 100Italy 61.0 2.9 6.9 1.2 0.8 5.2 3.7 7.5 6.2 3.2 1.3 100Cyprus 61.9 0.3 0.6 1.5 0.3 1.1 3.2 10.4 18.3 0.1 2.2 100Latvia 72.8 0.1 1.4 0.5 0.3 3.9 18.0 1.4 1.1 0.5 0.2 100Lithuania 64.8 0.8 2.6 0.1 0.4 3.4 24.6 1.1 1.3 0.4 0.4 100
Luxembourg 88.6 2.1 1.8 0.2 0.4 1.5 1.1 0.9 2.3 0.8 0.3 100Hungary 80.3 3.2 2.4 0.4 0.2 1.6 6.0 2.3 2.3 0.4 0.9 100Malta 48.0 0.4 11.2 4.8 0.5 0.9 0.2 5.0 26.0 1.0 1.8 100Netherlands 78.9 1.1 4.4 0.7 0.4 2.5 2.4 2.5 4.1 1.4 1.6 100Austria 73.2 2.2 4.9 1.0 0.8 5.5 3.7 2.2 4.3 1.3 0.9 100Poland 79.3 1.5 1.5 0.2 0.4 2.8 10.1 1.2 1.6 0.9 0.5 100Portugal 77.2 0.7 4.9 0.8 0.4 1.2 0.5 1.9 4.2 1.9 6.3 100Romania 73.4 7.8 2.1 0.3 0.1 1.9 5.9 4.7 2.4 1.0 0.4 100Slovenia 75.5 10.2 1.7 0.1 0.2 1.4 6.7 2.4 1.2 0.4 0.2 100Slovakia 87.3 1.6 2.5 0.2 0.2 1.3 4.1 0.7 1.5 0.4 0.3 100Finland 56.8 1.1 6.4 1.8 0.8 5.0 11.9 5.1 7.6 2.0 1.6 100Sweden 61.4 1.0 7.6 1.2 1.0 12.1 2.8 3.0 6.3 2.2 1.5 100United Kingdom 58.0 1.2 14.3 1.7 1.5 4.4 1.8 4.9 8.3 1.7 2.2 100
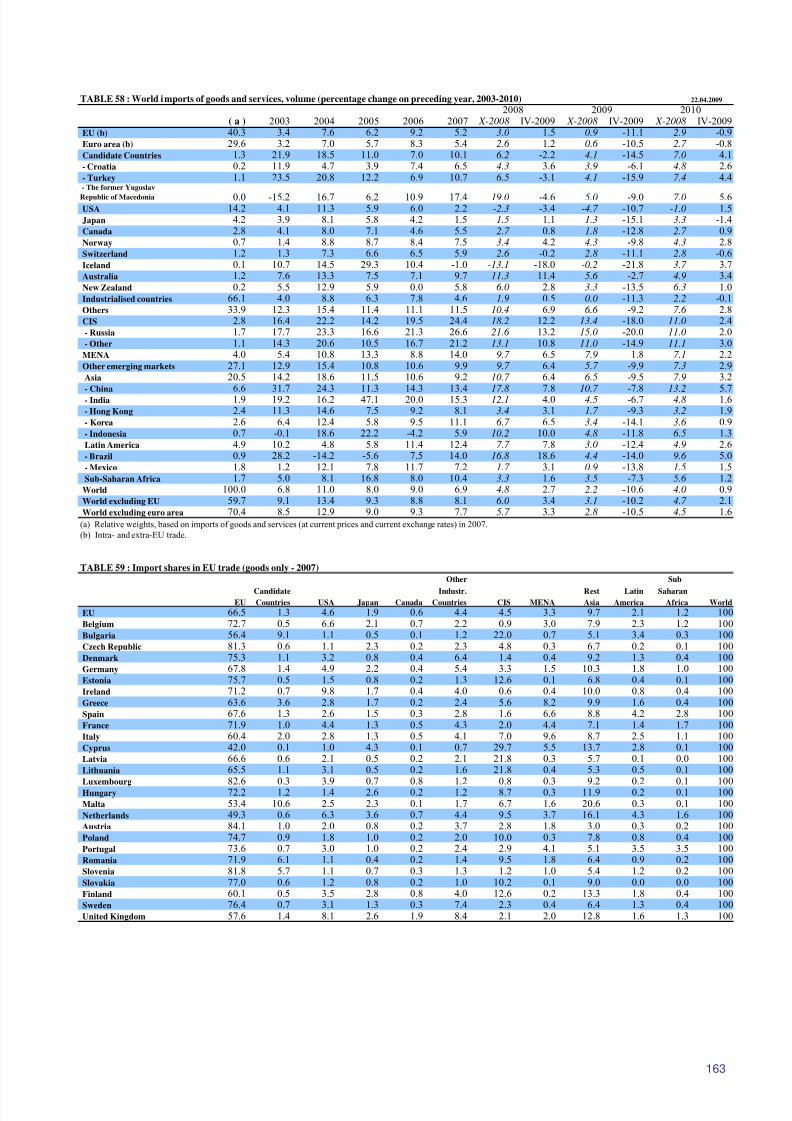
8/14/2019 Economic Forecast 2009
http://slidepdf.com/reader/full/economic-forecast-2009 169/172
163
TABLE 58 : World imports of goods and services, volume (percentage change on preceding year, 2003-2010) 22.04.2009
2008 2009 2010 ( a ) 2003 2004 2005 2006 2007 X-2008 IV-2009 X-2008 IV-2009 X-2008 IV-2009
EU (b) 40.3 3.4 7.6 6.2 9.2 5.2 3.0 1.5 0.9 -11.1 2.9 -0.9Euro area (b) 29.6 3.2 7.0 5.7 8.3 5.4 2.6 1.2 0.6 -10.5 2.7 -0.8Candidate Countries 1.3 21.9 18.5 11.0 7.0 10.1 6.2 -2.2 4.1 -14.5 7.0 4.1- Croatia 0.2 11.9 4.7 3.9 7.4 6.5 4.3 3.6 3.9 -6.1 4.8 2.6- Turkey 1.1 23.5 20.8 12.2 6.9 10.7 6.5 -3.1 4.1 -15.9 7.4 4.4- The former Yugoslav
Republic of Macedonia 0.0 -15.2 16.7 6.2 10.9 17.4 19.0 -4.6 5.0 -9.0 7.0 5.6USA 14.2 4.1 11.3 5.9 6.0 2.2 -2.3 -3.4 -4.7 -10.7 -1.0 1.5Japan 4.2 3.9 8.1 5.8 4.2 1.5 1.5 1.1 1.3 -15.1 3.3 -1.4Canada 2.8 4.1 8.0 7.1 4.6 5.5 2.7 0.8 1.8 -12.8 2.7 0.9Norway 0.7 1.4 8.8 8.7 8.4 7.5 3.4 4.2 4.3 -9.8 4.3 2.8Switzerland 1.2 1.3 7.3 6.6 6.5 5.9 2.6 -0.2 2.8 -11.1 2.8 -0.6Iceland 0.1 10.7 14.5 29.3 10.4 -1.0 -13.1 -18.0 -0.2 -21.8 3.7 3.7Australia 1.2 7.6 13.3 7.5 7.1 9.7 11.3 11.4 5.6 -2.7 4.9 3.4New Zealand 0.2 5.5 12.9 5.9 0.0 5.8 6.0 2.8 3.3 -13.5 6.3 1.0Industrialised countries 66.1 4.0 8.8 6.3 7.8 4.6 1.9 0.5 0.0 -11.3 2.2 -0.1Others 33.9 12.3 15.4 11.4 11.1 11.5 10.4 6.9 6.6 -9.2 7.6 2.8CIS 2.8 16.4 22.2 14.2 19.5 24.4 18.2 12.2 13.4 -18.0 11.0 2.4- Russia 1.7 17.7 23.3 16.6 21.3 26.6 21.6 13.2 15.0 -20.0 11.0 2.0- Other 1.1 14.3 20.6 10.5 16.7 21.2 13.1 10.8 11.0 -14.9 11.1 3.0
MENA 4.0 5.4 10.8 13.3 8.8 14.0 9.7 6.5 7.9 1.8 7.1 2.2Other emerging markets 27.1 12.9 15.4 10.8 10.6 9.9 9.7 6.4 5.7 -9.9 7.3 2.9Asia 20.5 14.2 18.6 11.5 10.6 9.2 10.7 6.4 6.5 -9.5 7.9 3.2
- China 6.6 31.7 24.3 11.3 14.3 13.4 17.8 7.8 10.7 -7.8 13.2 5.7- India 1.9 19.2 16.2 47.1 20.0 15.3 12.1 4.0 4.5 -6.7 4.8 1.6- Hong Kong 2.4 11.3 14.6 7.5 9.2 8.1 3.4 3.1 1.7 -9.3 3.2 1.9- Korea 2.6 6.4 12.4 5.8 9.5 11.1 6.7 6.5 3.4 -14.1 3.6 0.9- Indonesia 0.7 -0.1 18.6 22.2 -4.2 5.9 10.2 10.0 4.8 -11.8 6.5 1.3Latin America 4.9 10.2 4.8 5.8 11.4 12.4 7.7 7.8 3.0 -12.4 4.9 2.6- Brazil 0.9 28.2 -14.2 -5.6 7.5 14.0 16.8 18.6 4.4 -14.0 9.6 5.0- Mexico 1.8 1.2 12.1 7.8 11.7 7.2 1.7 3.1 0.9 -13.8 1.5 1.5Sub-Saharan Africa 1.7 5.0 8.1 16.8 8.0 10.4 3.3 1.6 3.5 -7.3 5.6 1.2
World 100.0 6.8 11.0 8.0 9.0 6.9 4.8 2.7 2.2 -10.6 4.0 0.9World excluding EU 59.7 9.1 13.4 9.3 8.8 8.1 6.0 3.4 3.1 -10.2 4.7 2.1World excluding euro area 70.4 8.5 12.9 9.0 9.3 7.7 5.7 3.3 2.8 -10.5 4.5 1.6
(a) Relative weights, based on imports of goods and services (at current prices and current exchange rates) in 2007.
(b) Intra- and extra-EU trade.
TABLE 59 : Import shares in EU trade (goods only - 2007)
Other Sub
Candidate Industr. Rest Latin Saharan
EU Countries USA Japan Canada Countries CIS MENA Asia America Africa World
EU 66.5 1.3 4.6 1.9 0.6 4.4 4.5 3.3 9.7 2.1 1.2 100Belgium 72.7 0.5 6.6 2.1 0.7 2.2 0.9 3.0 7.9 2.3 1.2 100Bulgaria 56.4 9.1 1.1 0.5 0.1 1.2 22.0 0.7 5.1 3.4 0.3 100Czech Republic 81.3 0.6 1.1 2.3 0.2 2.3 4.8 0.3 6.7 0.2 0.1 100Denmark 75.3 1.1 3.2 0.8 0.4 6.4 1.4 0.4 9.2 1.3 0.4 100Germany 67.8 1.4 4.9 2.2 0.4 5.4 3.3 1.5 10.3 1.8 1.0 100Estonia 75.7 0.5 1.5 0.8 0.2 1.3 12.6 0.1 6.8 0.4 0.1 100Ireland 71.2 0.7 9.8 1.7 0.4 4.0 0.6 0.4 10.0 0.8 0.4 100Greece 63.6 3.6 2.8 1.7 0.2 2.4 5.6 8.2 9.9 1.6 0.4 100Spain 67.6 1.3 2.6 1.5 0.3 2.8 1.6 6.6 8.8 4.2 2.8 100France 71.9 1.0 4.4 1.3 0.5 4.3 2.0 4.4 7.1 1.4 1.7 100Italy 60.4 2.0 2.8 1.3 0.5 4.1 7.0 9.6 8.7 2.5 1.1 100Cyprus 42.0 0.1 1.0 4.3 0.1 0.7 29.7 5.5 13.7 2.8 0.1 100Latvia 66.6 0.6 2.1 0.5 0.2 2.1 21.8 0.3 5.7 0.1 0.0 100Lithuania 65.5 1.1 3.1 0.5 0.2 1.6 21.8 0.4 5.3 0.5 0.1 100
Luxembourg 82.6 0.3 3.9 0.7 0.8 1.2 0.8 0.3 9.2 0.2 0.1 100Hungary 72.2 1.2 1.4 2.6 0.2 1.2 8.7 0.3 11.9 0.2 0.1 100Malta 53.4 10.6 2.5 2.3 0.1 1.7 6.7 1.6 20.6 0.3 0.1 100Netherlands 49.3 0.6 6.3 3.6 0.7 4.4 9.5 3.7 16.1 4.3 1.6 100Austria 84.1 1.0 2.0 0.8 0.2 3.7 2.8 1.8 3.0 0.3 0.2 100Poland 74.7 0.9 1.8 1.0 0.2 2.0 10.0 0.3 7.8 0.8 0.4 100Portugal 73.6 0.7 3.0 1.0 0.2 2.4 2.9 4.1 5.1 3.5 3.5 100Romania 71.9 6.1 1.1 0.4 0.2 1.4 9.5 1.8 6.4 0.9 0.2 100Slovenia 81.8 5.7 1.1 0.7 0.3 1.3 1.2 1.0 5.4 1.2 0.2 100Slovakia 77.0 0.6 1.2 0.8 0.2 1.0 10.2 0.1 9.0 0.0 0.0 100Finland 60.1 0.5 3.5 2.8 0.8 4.0 12.6 0.2 13.3 1.8 0.4 100Sweden 76.4 0.7 3.1 1.3 0.3 7.4 2.3 0.4 6.4 1.3 0.4 100United Kingdom 57.6 1.4 8.1 2.6 1.9 8.4 2.1 2.0 12.8 1.6 1.3 100
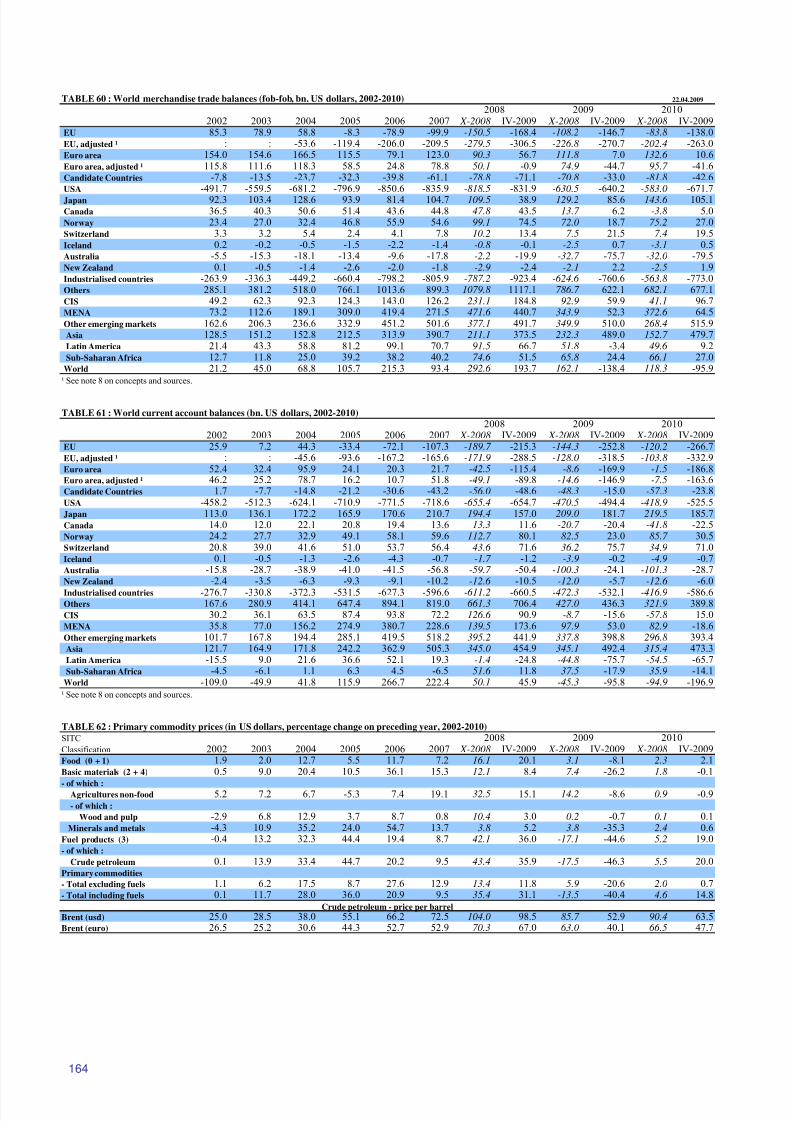
8/14/2019 Economic Forecast 2009
http://slidepdf.com/reader/full/economic-forecast-2009 170/172
8/14/2019 Economic Forecast 2009
http://slidepdf.com/reader/full/economic-forecast-2009 171/172
165
Note on concepts and sources
1. The directorate general for economic and financial affairs (DG 8. EU and euro-area data are aggregated using exchange rates.
ECFIN) produces, under its own responsibility, short-term fully- World GDP is aggregated using Purchasing Power Standards (PPS).
fledged economic forecasts twice a year : in the spring and in In the tables on world trade and international payments, the
the autumn. These forecasts cover the principal macroeconomic aggregation is carried out on the basis of current exchange rates.
aggregates for the Member States, the Candidate Countr ies, Tables 48 - 52, 60 and 61 show also EU and euro-area "adjusted"
the European Union as a whole, the euro area and the balances. Theoretically, balances of EU and euro area vis-à-vis
international environment. Interim forecasts, updating the outlook third countries should be identical to the sum of the balances of the
for the seven largest Member States, EU and the euro area, individual countries in the EU or the euro area. However, intra-EU
are presented in between the fully-fledged forecasts. or intra-euro-area balances are non-zero because of reporting errors.
The creation of the internal market in 1993 reduced border controls
2. Data for 2008, 2009 and 2010 are forecasts. and formalities, and accordingly the scope and precision of intra-EU
The sources for all tables are the Commission services, trade coverage. Typically, intra-EU imports are underestimated
unless otherwise stated. compared to intra-EU exports, leading to an overestimation of the
Historical data for the Member States are based on the European surplus. For the past the "adjusted" balances are Eurostat estimates
System of Accounting (ESA 1995). Most Member States have for EU and ECB estimates for the euro area. For the future, they
now introduced chain-linking in their national accounts to measure are ECFIN's forecasts based on the extrapolation of the discrepancies
the development of economic aggregates in volume terms. observed in 2006.
For the USA and Japan the definitions are as in the SNA.
9. With respect to the 12 RAMS (recently-acceded Member States),
3. Tables 5 and 6 on domestic demand and final demand respectively, which are currently in a transition phase, the quality of statistical
present data including inventories. data may not always be directly comparable to most EU15 Member
States.
4. In Tables 16 and 17, the data are based on the national index for USA
and Japan, and for EU Member States and aggregates prior to 1996. 10. Geographical zones are defined as follows :
Euro area :
5. The potential output gap is calculated with reference to potential EA16 (BE,DE,IE,EL,ES,FR,IT,CY,LU,MT,NL,AT,PT,SI,SK,FI)
output as estimated via a production function, where the increase in
the capital stock and the difference between actual unemployment Candidate countr ies :
and the NAWRU play a key role. Croatia, Turkey and former Yugoslav Republic of Macedonia.
6. Employment data used in tables 21-25, 27 and 31-32 are based on Potential Candidates :
full-time-equivalents (FTEs), where available. Currently, Germany, Albania, Bosnia-Herzegovina, Kosovo, Montenegro and Serbia.
Estonia, Spain, France, Italy, Hungary, the Netherlands and
Austria report FTE data (taken together, these countries Industrialised Countries :
represent 90% of euro-area GDP and 65% of EU GDP). In the EU, Candidate Countries, USA, Japan, Canada, Norway,
absence of FTE data, employment is based on numbers of persons. Switzerland, Iceland, Australia and New Zealand.
In the calculation of EU and euro-area aggregates, priority is given to
FTE data, as this is regarded as more representative of diverse MENA (Middle East and Northern Afr ica) :
patterns of working time. Algeria, Bahrain, Egypt, Iran, Iraq, Israel, Jordan, Kuwait,
Lebanon, Libya, Morocco, Oman, Qatar, Saudi Arabia, Syria,
7. The nominal short term interest rates are defined as the 3-month Tunisia, and the United Arab Emirates.
inter-bank rates. The nominal long term interest rates are defined
as the yield on the central government benchmark 10-year bond. Asia :
For Estonia, where no appropriate benchmark government bond is All countries except Japan and the Asian MENA countries.
available, the indicator provided in Table 34 is a weighted average
of MFI interest rates for new EEK-denominated loans to households Lat in America :
and non-financial businesses. All countries.
Sub-Saharan Africa :
All countries except the African MENA countries.

8/14/2019 Economic Forecast 2009
http://slidepdf.com/reader/full/economic-forecast-2009 172/172