Embed Size (px)
Citation preview
Southern California Regional
Economic ForecastLisa M. Grobar, Ph.D.
Director, CSULB Economic Forecast Project
Office of Economic Research
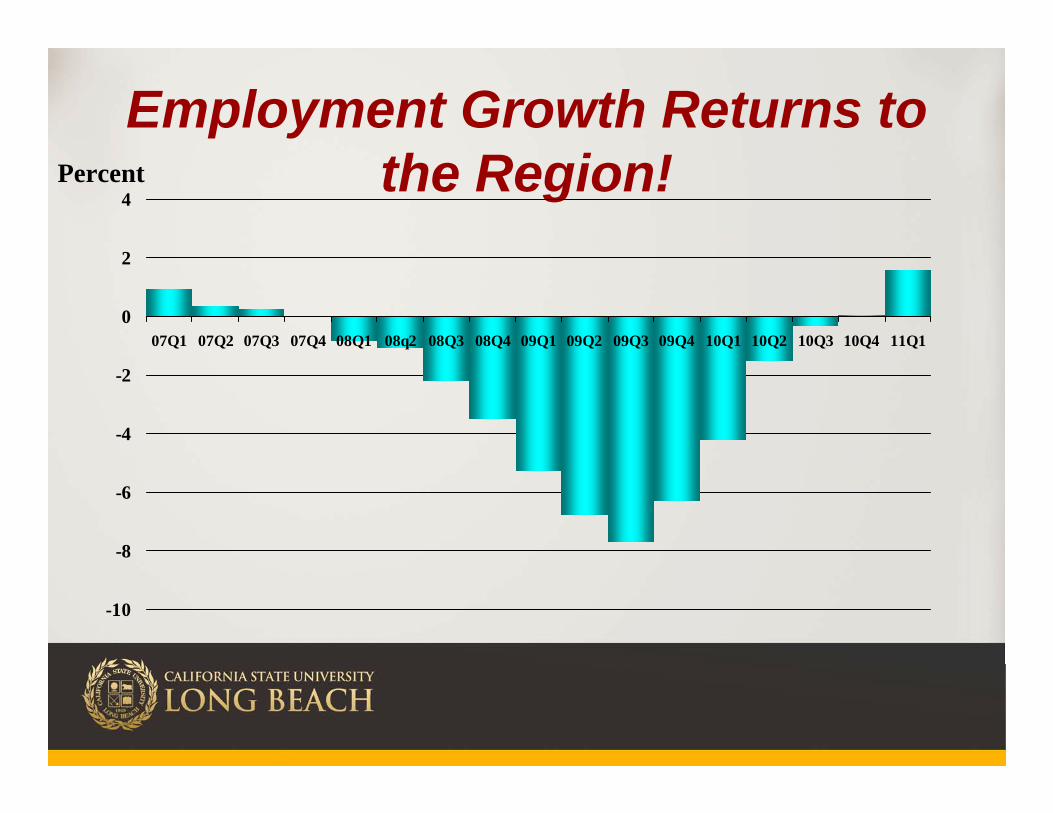
Employment Growth Returns to the Region!
-10
-8
-6
-4
-2
0
2
4
07Q1 07Q2 07Q3 07Q4 08Q1 08q2 08Q3 08Q4 09Q1 09Q2 09Q3 09Q4 10Q1 10Q2 10Q3 10Q4 11Q1
Percent
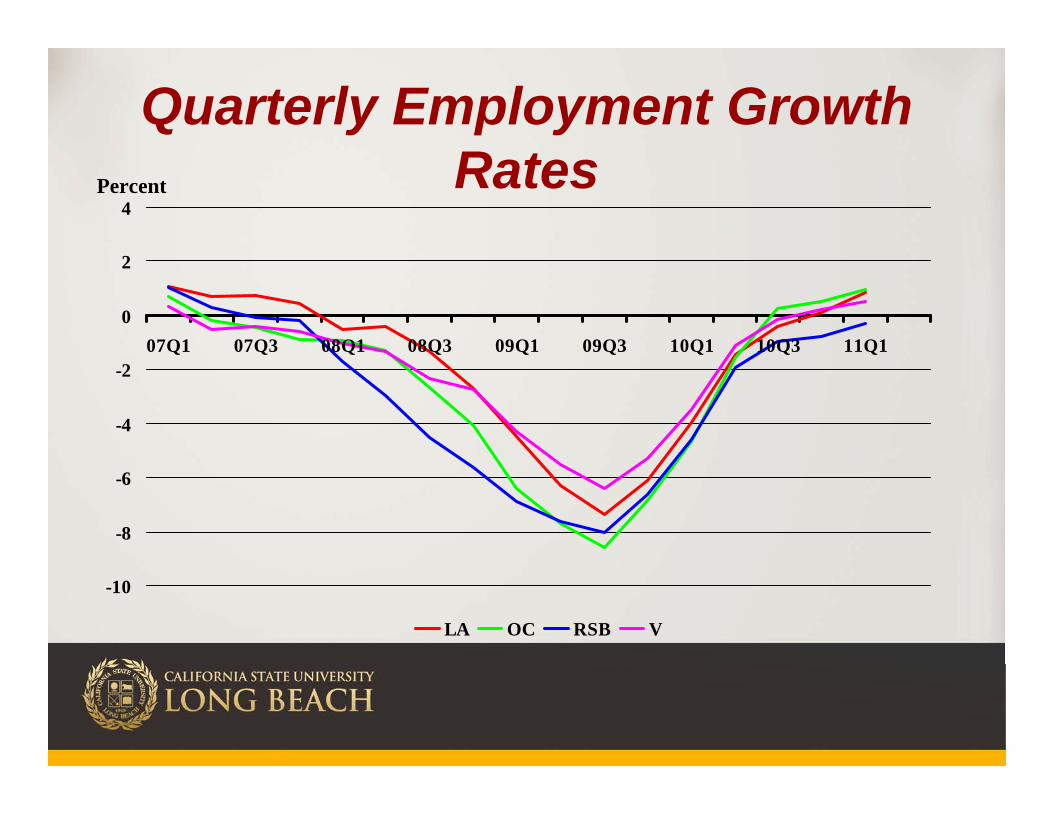
Quarterly Employment Growth Rates
-10
-8
-6
-4
-2
0
2
4
07Q1 07Q3 08Q1 08Q3 09Q1 09Q3 10Q1 10Q3 11Q1
LA OC RSB V
Percent
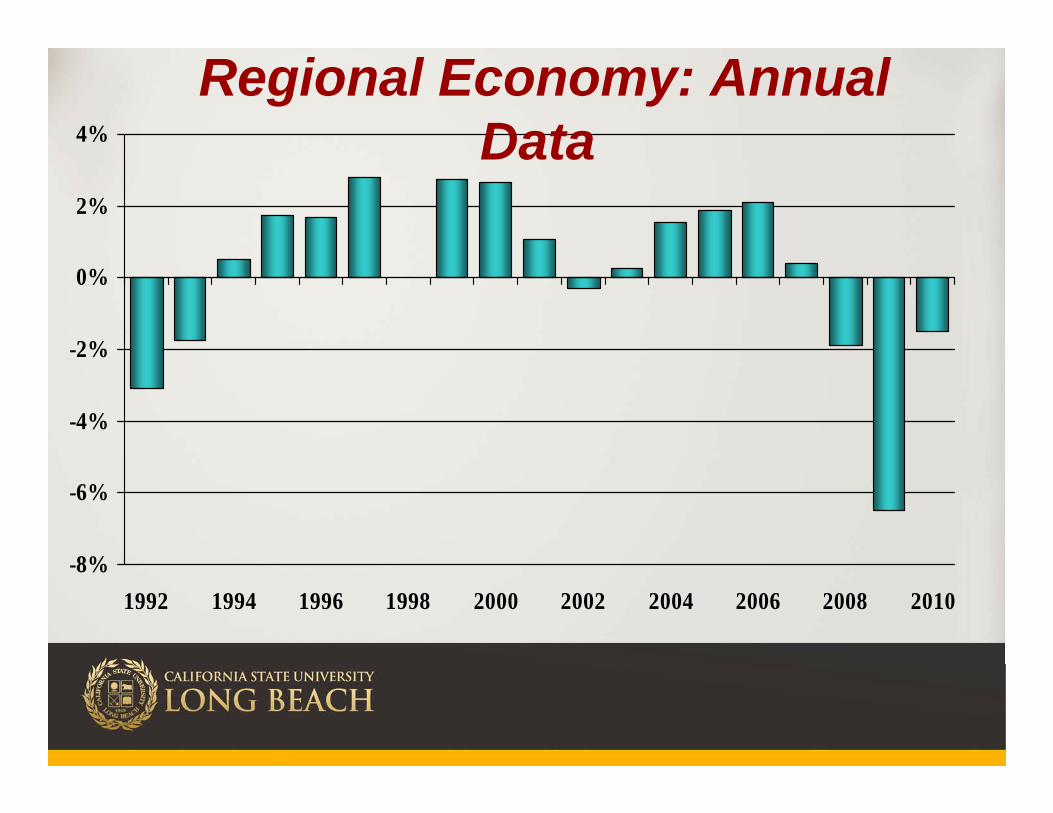
-8%
-6%
-4%
-2%
0%
2%
4%
1992 1994 1996 1998 2000 2002 2004 2006 2008 2010
Regional Economy: Annual Data
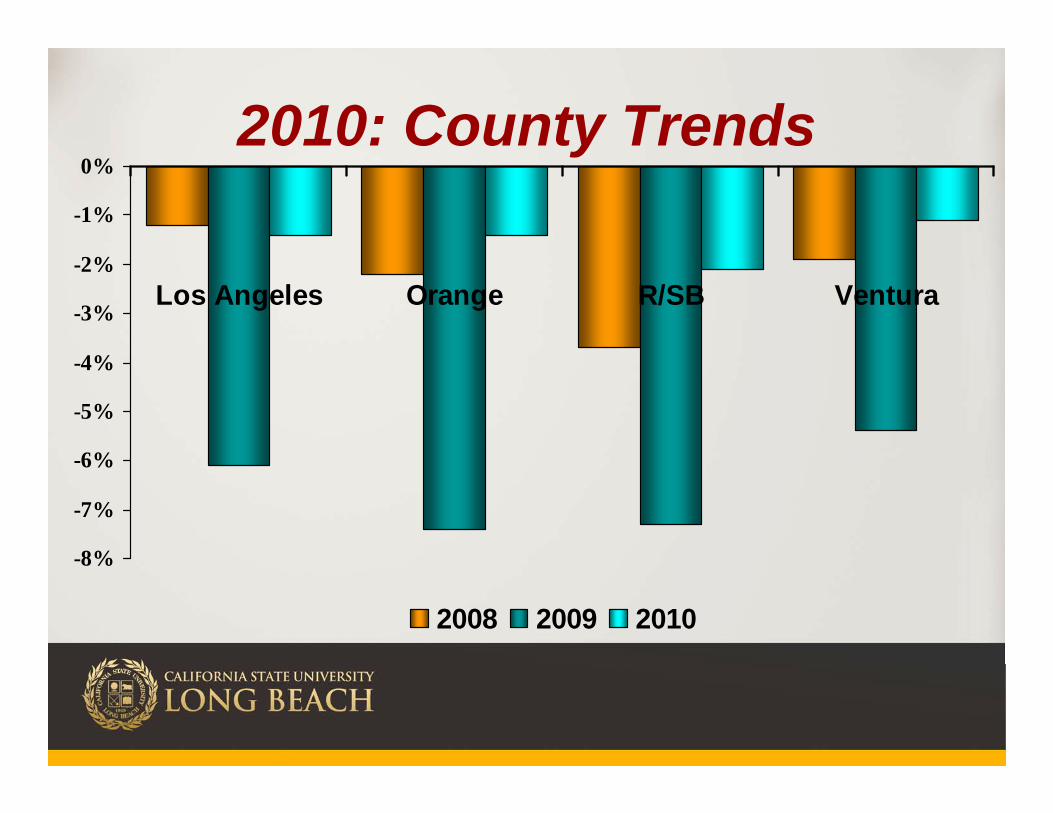
2010: County Trends
-8%
-7%
-6%
-5%
-4%
-3%
-2%
-1%
0%
Los Angeles Orange R/SB Ventura
2008 2009 2010
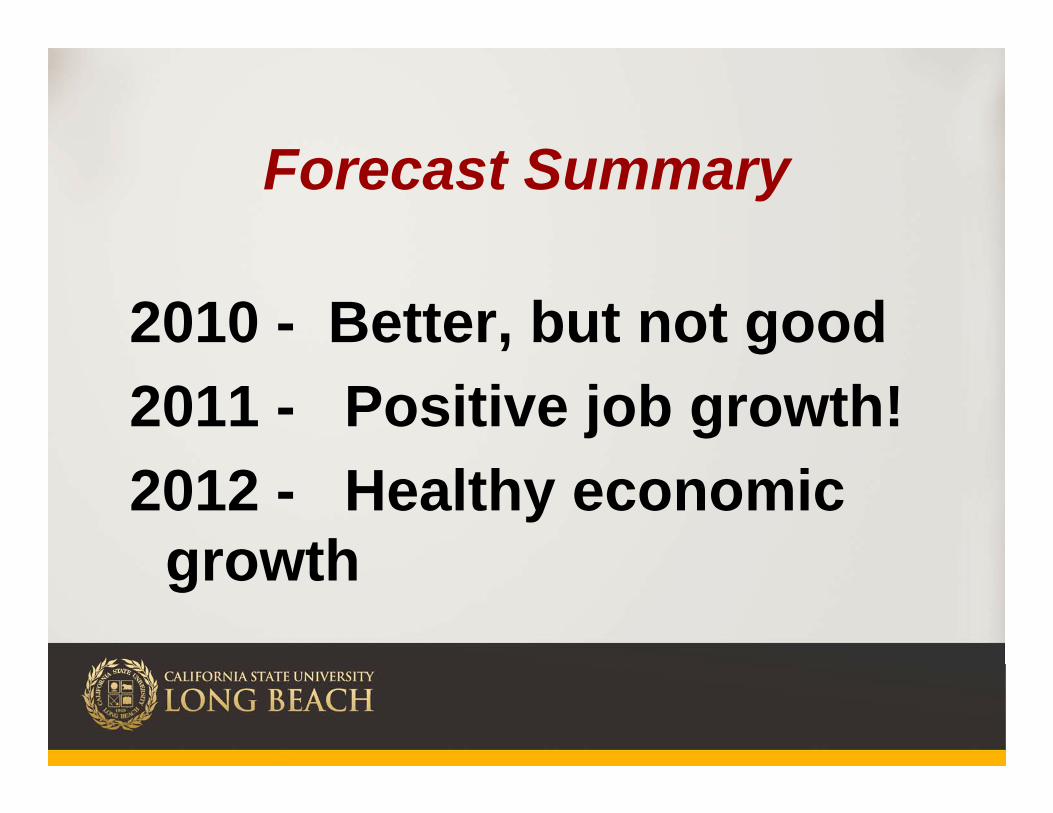
Forecast Summary
2010 - Better, but not good2011 - Positive job growth!2012 - Healthy economic
growth
-7%
-6%
-5%
-4%
-3%
-2%
-1%
0%
1%
2%
3%
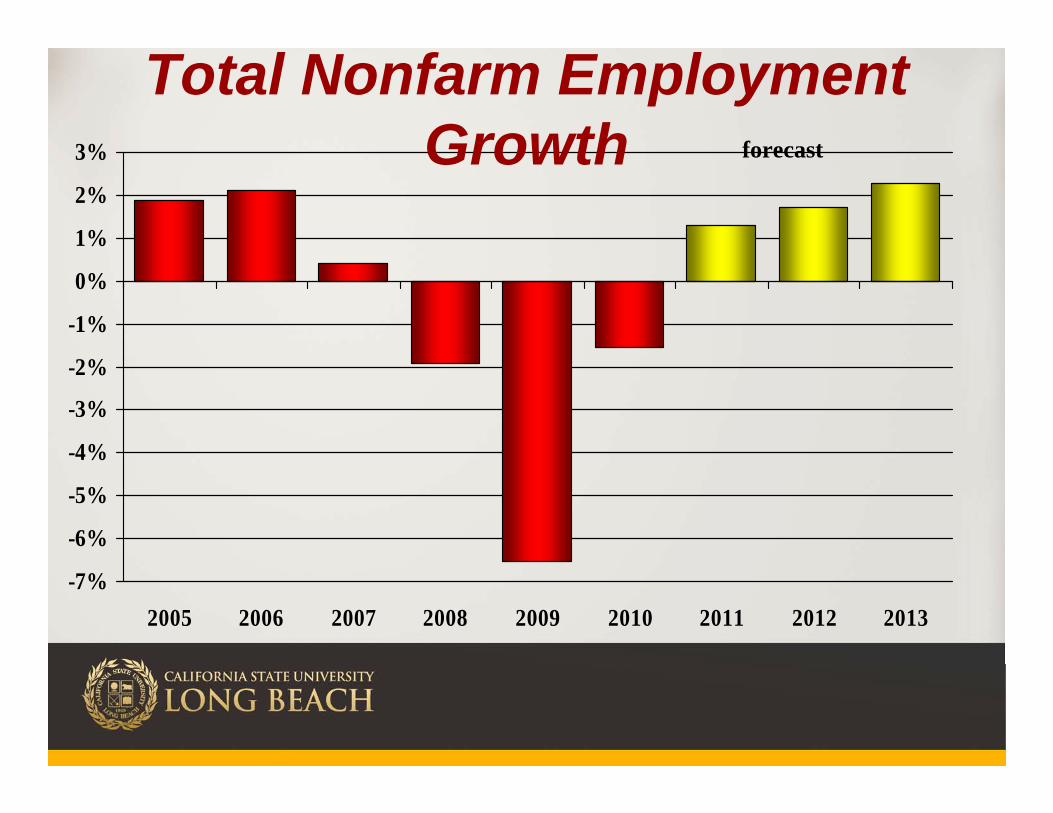
2005 2006 2007 2008 2009 2010 2011 2012 2013
Total Nonfarm Employment Growth forecast
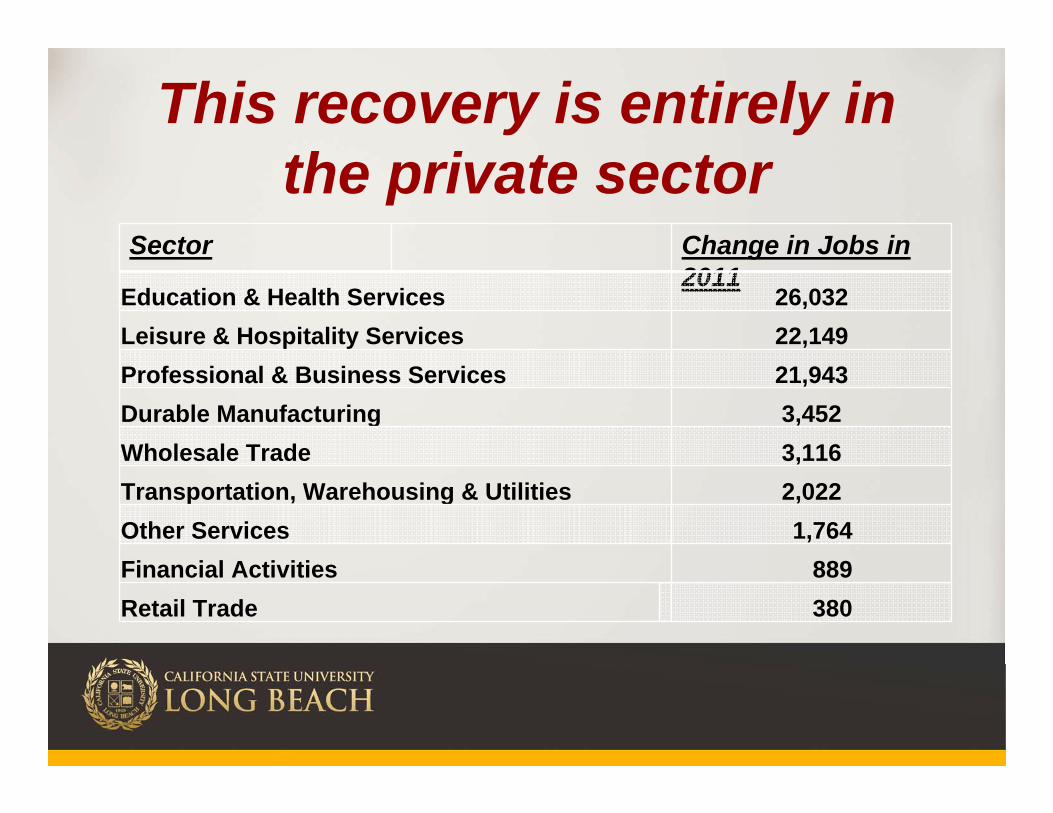
This recovery is entirely in the private sector
Sector Change in Jobs in 2011
Education & Health Services 26,032Leisure & Hospitality Services 22,149Professional & Business Services 21,943Durable Manufacturing 3,452Wholesale Trade 3,116Transportation, Warehousing & Utilities 2,022Other Services 1,764 Financial Activities 889 Retail Trade 380
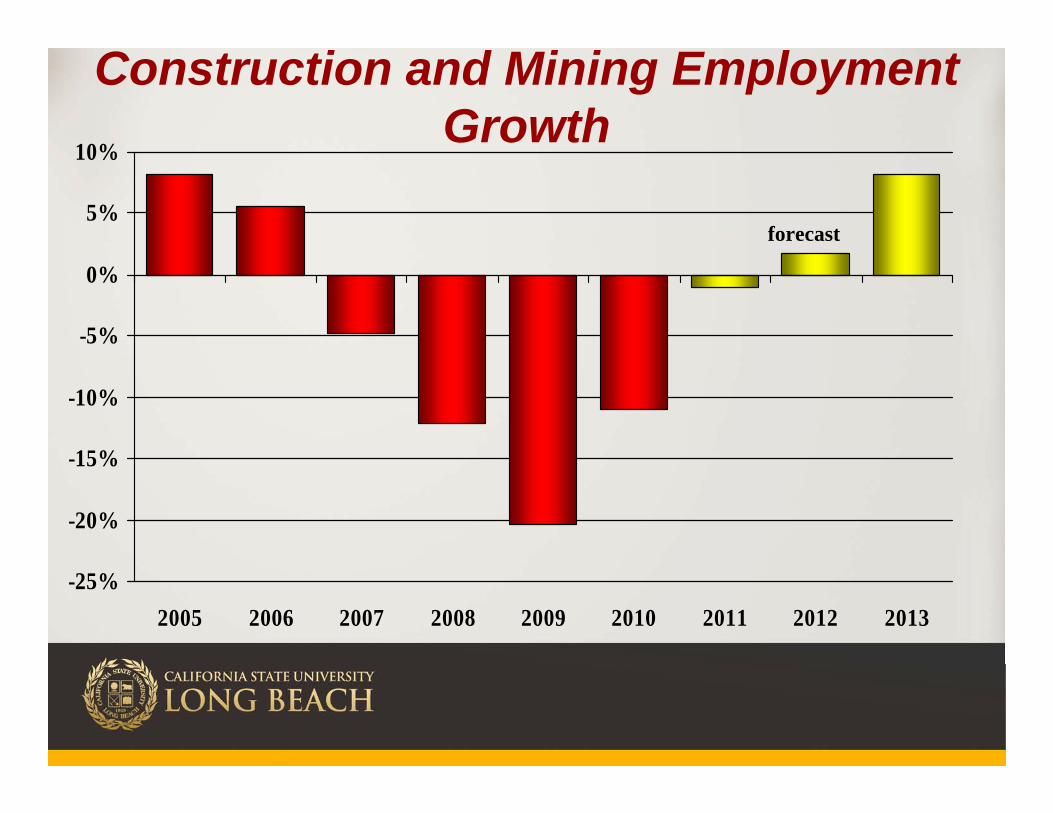
-25%
-20%
-15%
-10%
-5%
0%
5%
10%
2005 2006 2007 2008 2009 2010 2011 2012 2013
Construction and Mining Employment Growth
forecast
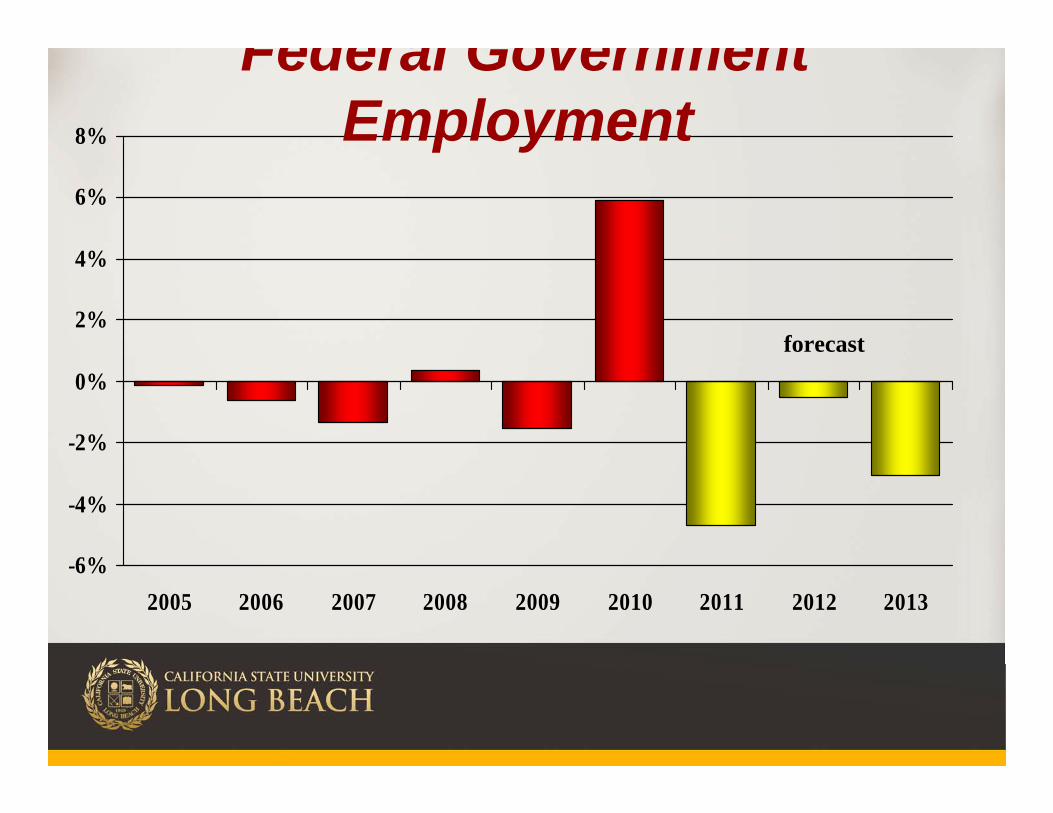
-6%
-4%
-2%
0%
2%
4%
6%
8%
2005 2006 2007 2008 2009 2010 2011 2012 2013
Federal Government Employment
forecast
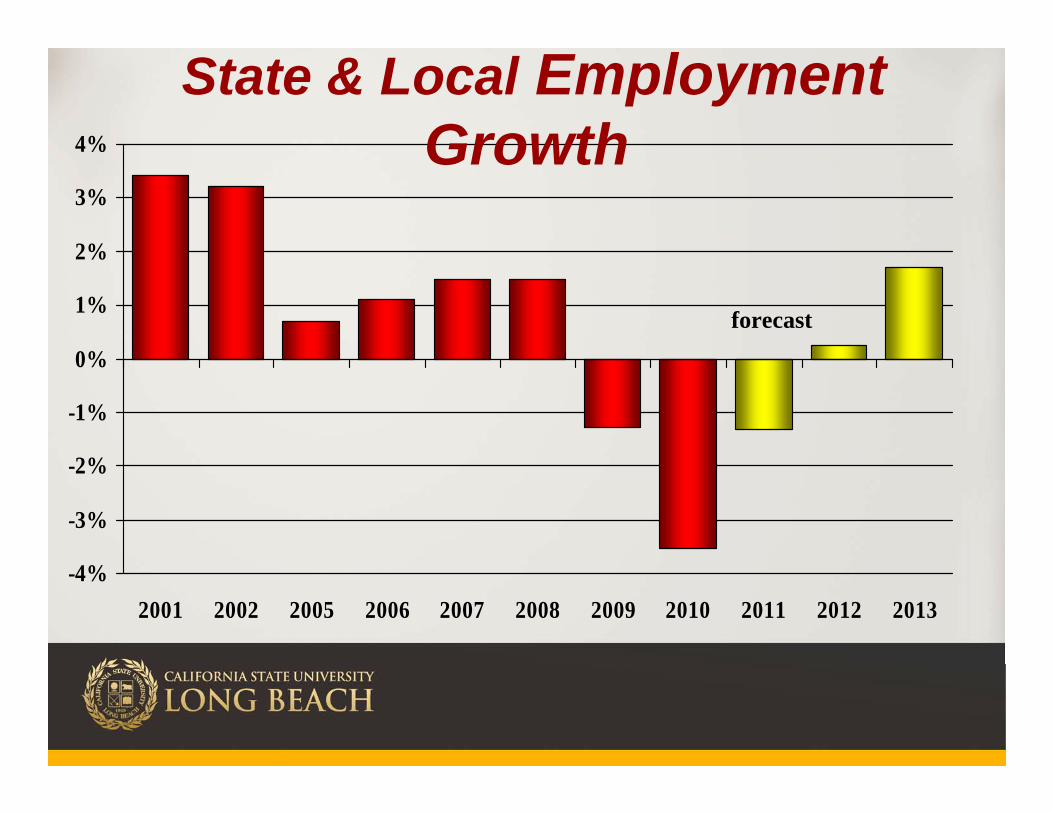
-4%
-3%
-2%
-1%
0%
1%
2%
3%
4%
2001 2002 2005 2006 2007 2008 2009 2010 2011 2012 2013
State & Local Employment Growth
forecast
-10%
-8%
-6%
-4%
-2%
0%
2%
4%
6%
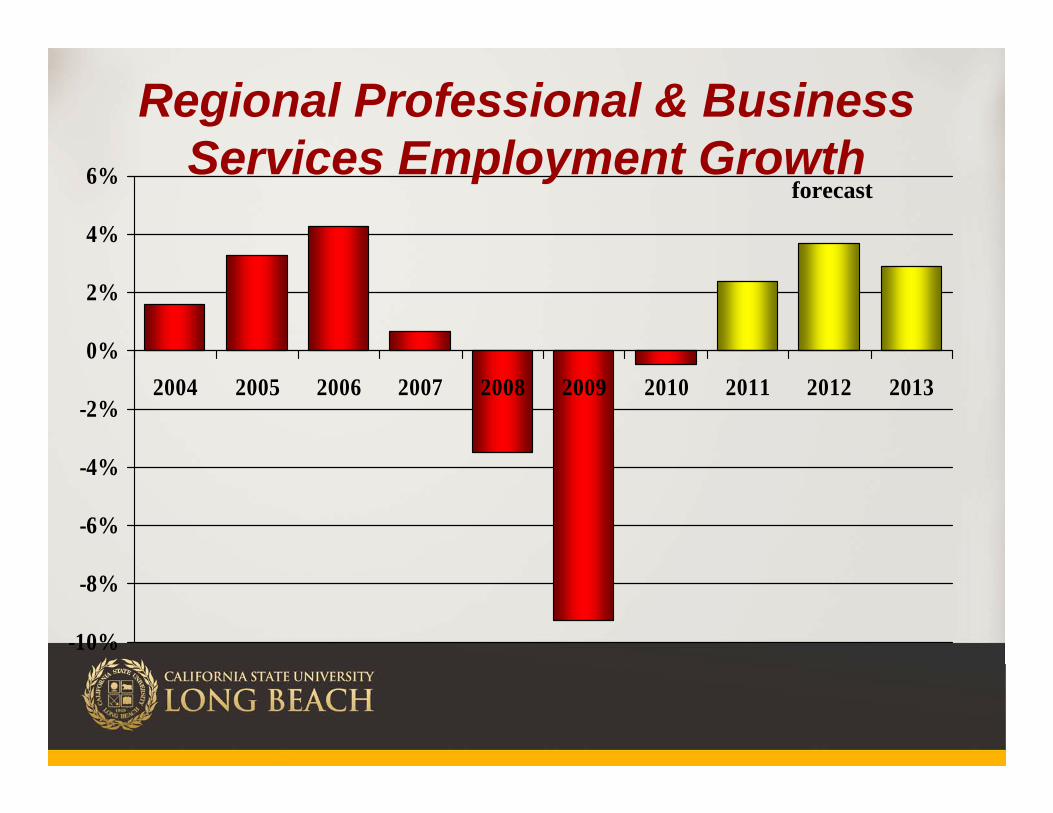
2004 2005 2006 2007 2008 2009 2010 2011 2012 2013
Regional Professional & Business Services Employment Growth
forecast
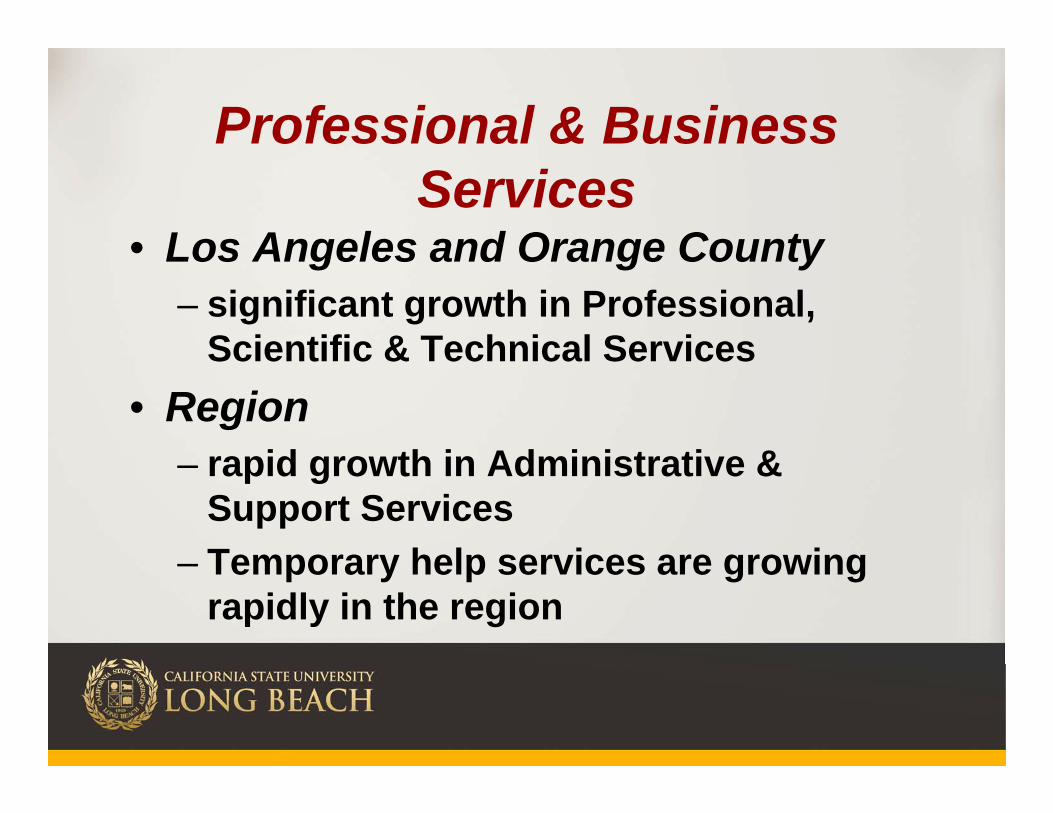
Professional & Business Services
• Los Angeles and Orange County– significant growth in Professional,
Scientific & Technical Services• Region
– rapid growth in Administrative & Support Services
– Temporary help services are growing rapidly in the region
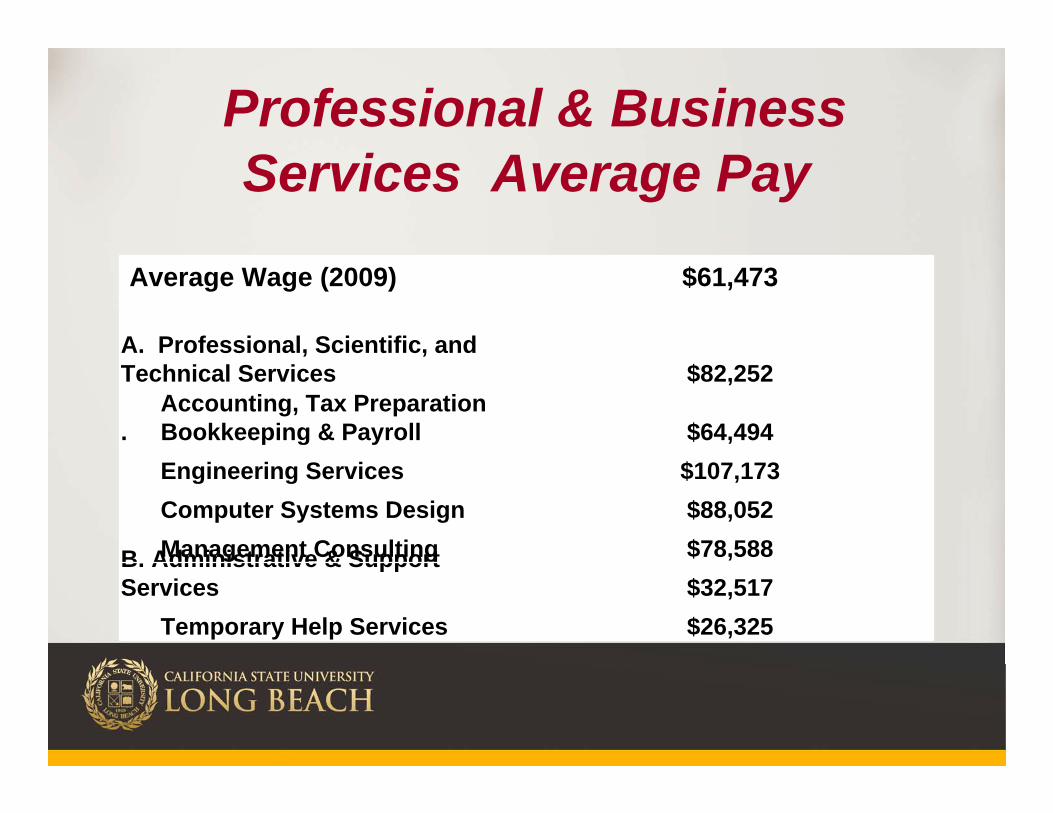
Professional & Business Services Average Pay
Average Wage (2009) $61,473
A. Professional, Scientific, and Technical Services $82,252
Accounting, Tax Preparation . Bookkeeping & Payroll $64,494
Engineering Services $107,173Computer Systems Design $88,052Management Consulting $78,588B. Administrative & Support
Services $32,517Temporary Help Services $26,325
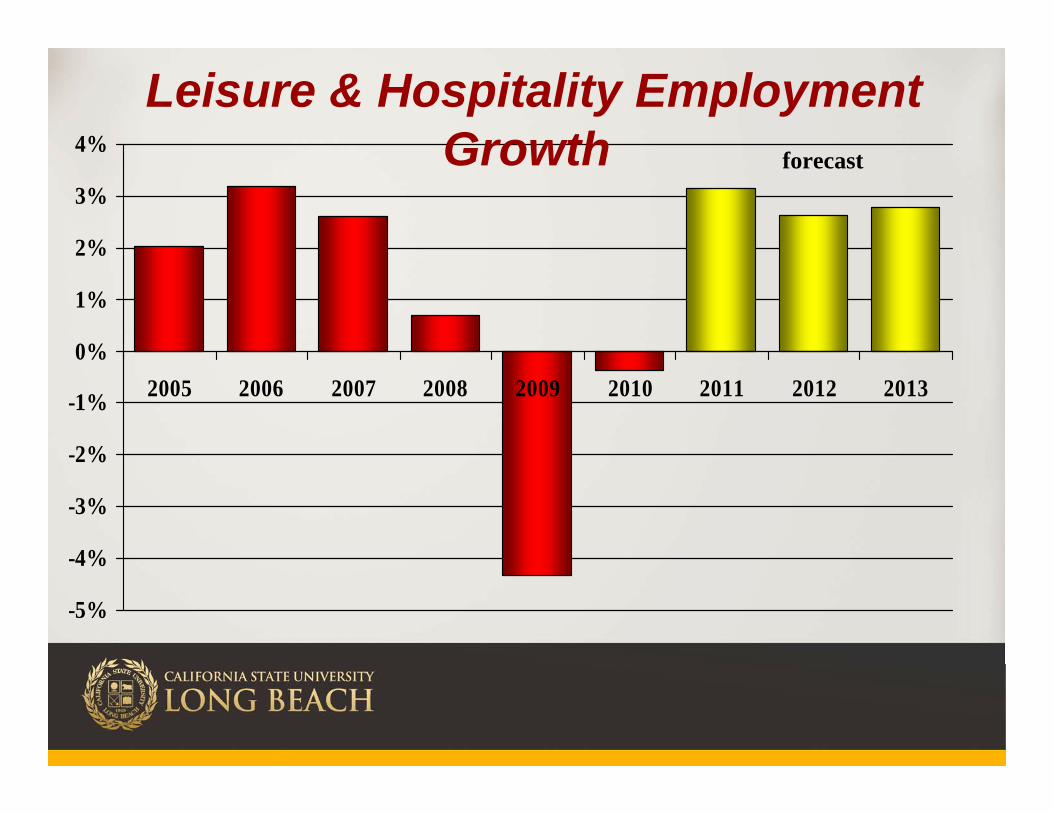
-5%
-4%
-3%
-2%
-1%
0%
1%
2%
3%
4%
2005 2006 2007 2008 2009 2010 2011 2012 2013
Leisure & Hospitality Employment Growth forecast
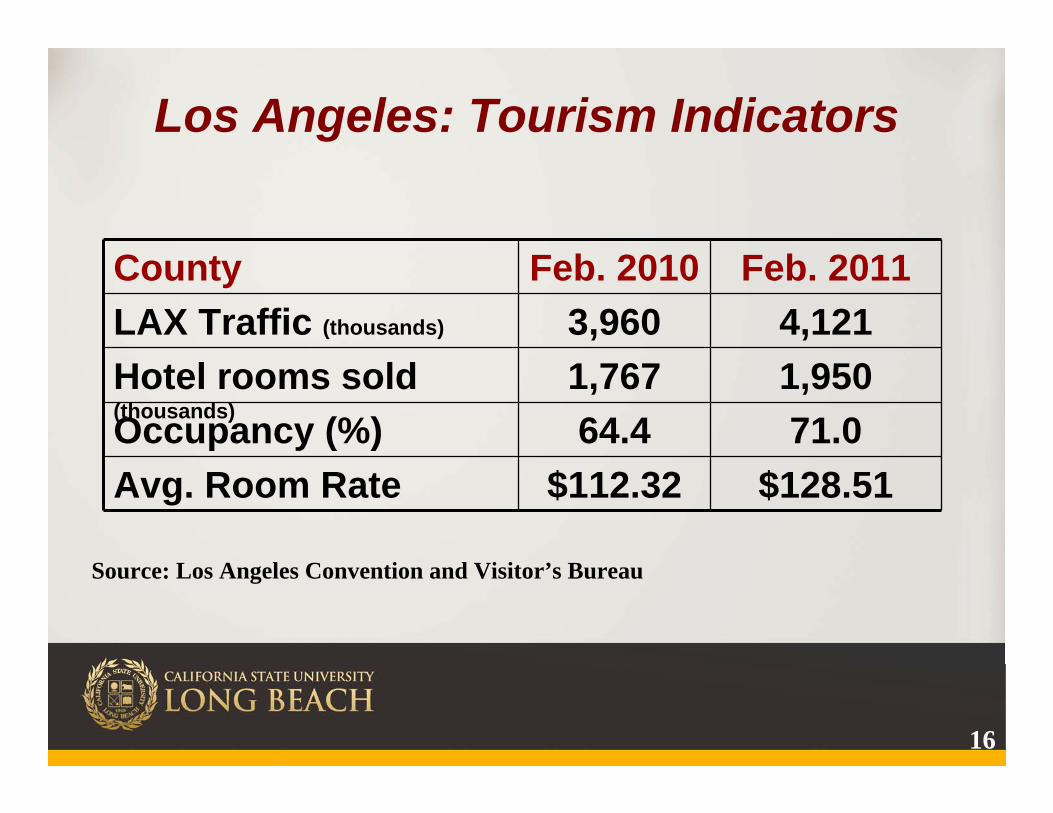
Los Angeles: Tourism Indicators
County Feb. 2010 Feb. 2011LAX Traffic (thousands) 3,960 4,121Hotel rooms sold (thousands)
1,767 1,950Occupancy (%) 64.4 71.0Avg. Room Rate $112.32 $128.51
16
Source: Los Angeles Convention and Visitor’s Bureau
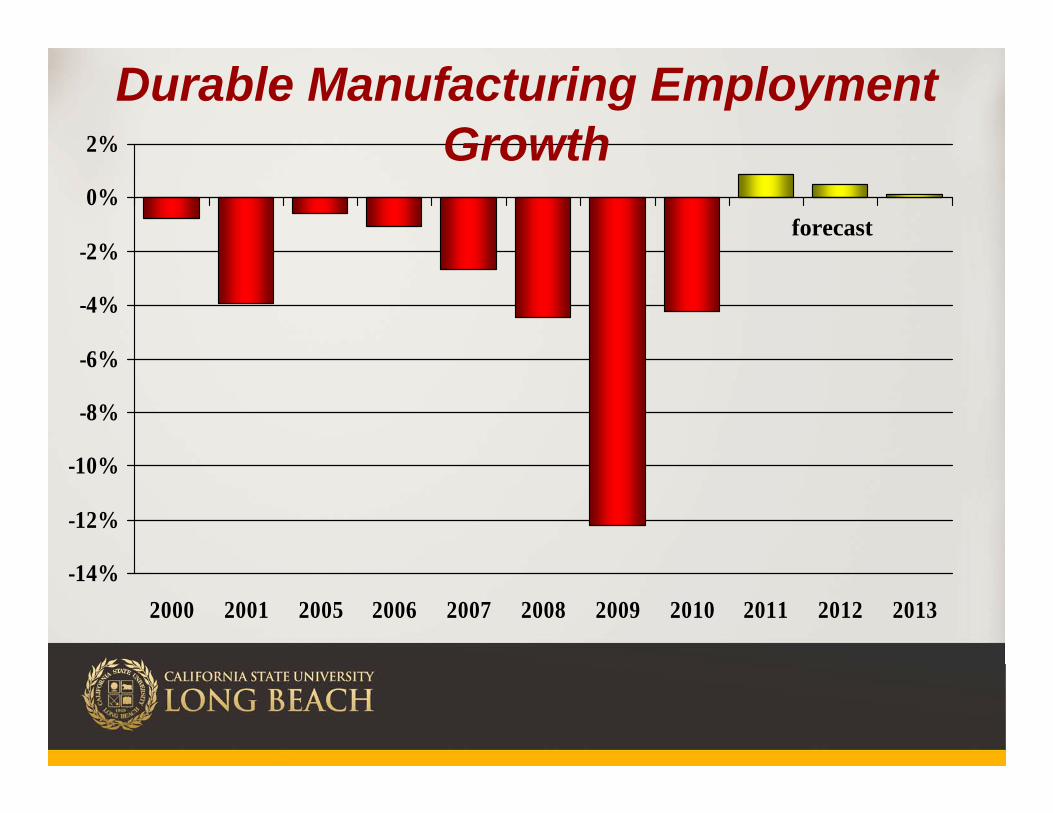
-14%
-12%
-10%
-8%
-6%
-4%
-2%
0%
2%
2000 2001 2005 2006 2007 2008 2009 2010 2011 2012 2013
Durable Manufacturing EmploymentGrowth
forecast
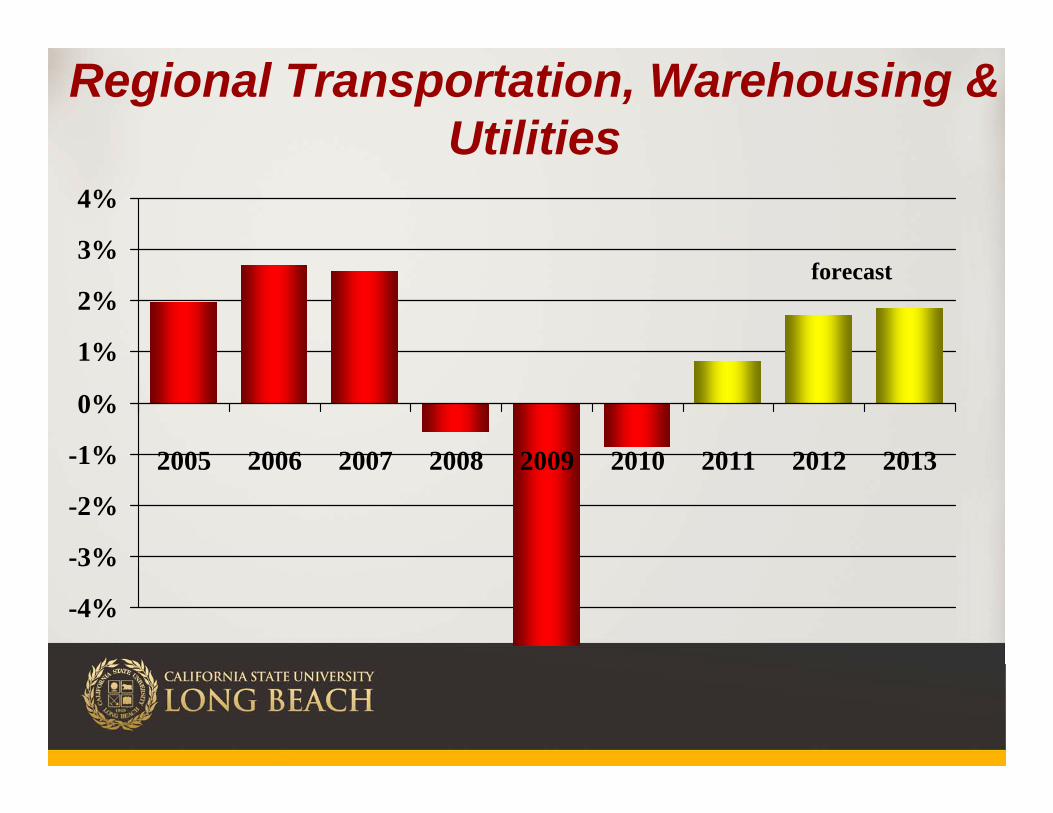
-4%
-3%
-2%
-1%
0%
1%
2%
3%
4%
2005 2006 2007 2008 2009 2010 2011 2012 2013
Regional Transportation, Warehousing & Utilities
forecast
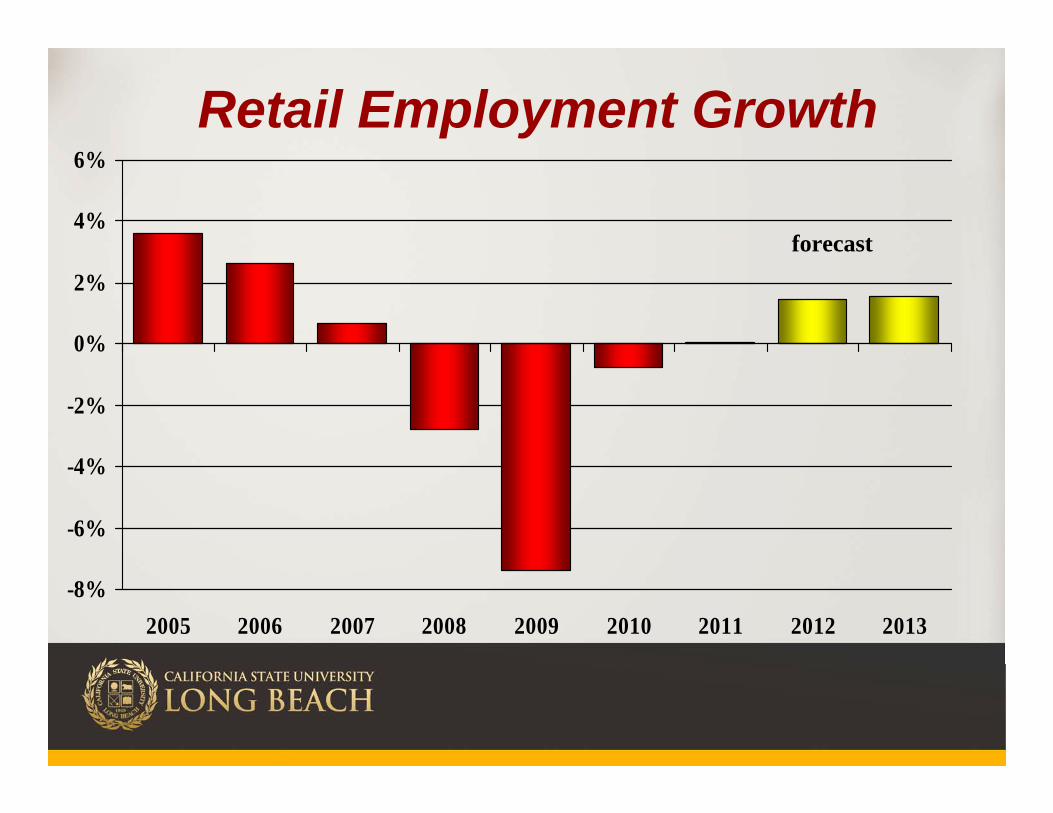
-8%
-6%
-4%
-2%
0%
2%
4%
6%
2005 2006 2007 2008 2009 2010 2011 2012 2013
Retail Employment Growth
forecast

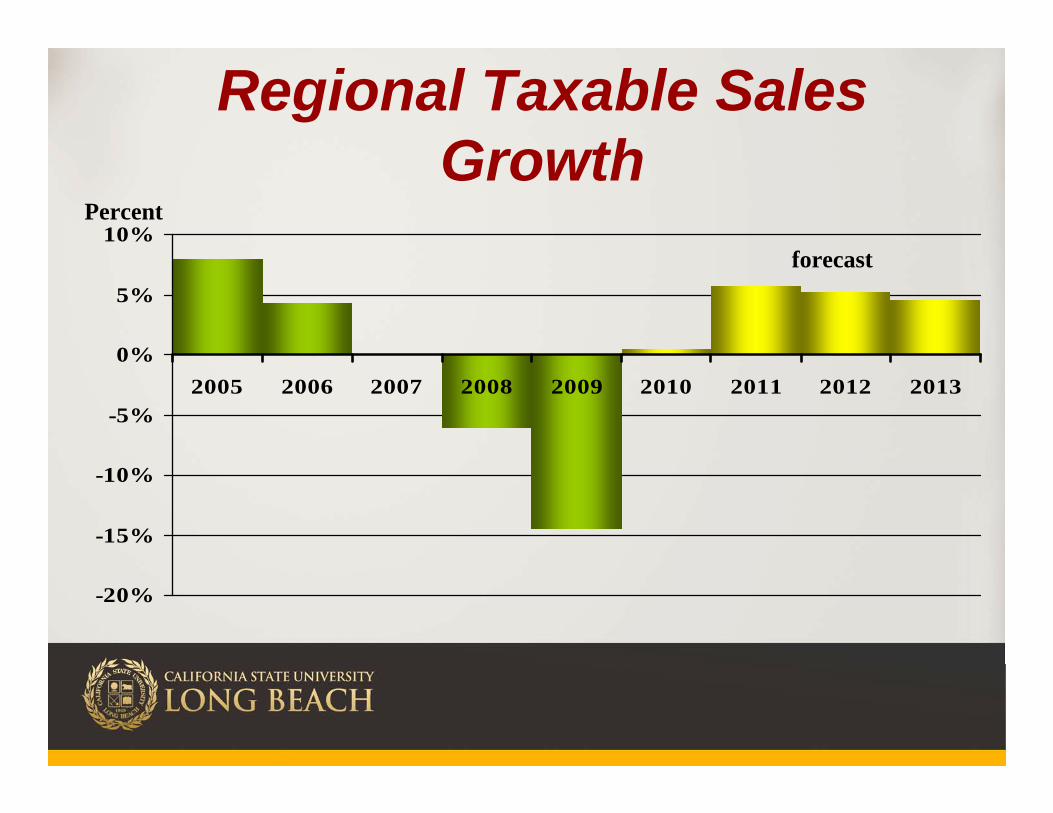
Regional Taxable Sales Growth
-20%
-15%
-10%
-5%
0%
5%
10%
2005 2006 2007 2008 2009 2010 2011 2012 2013
Percent
forecast
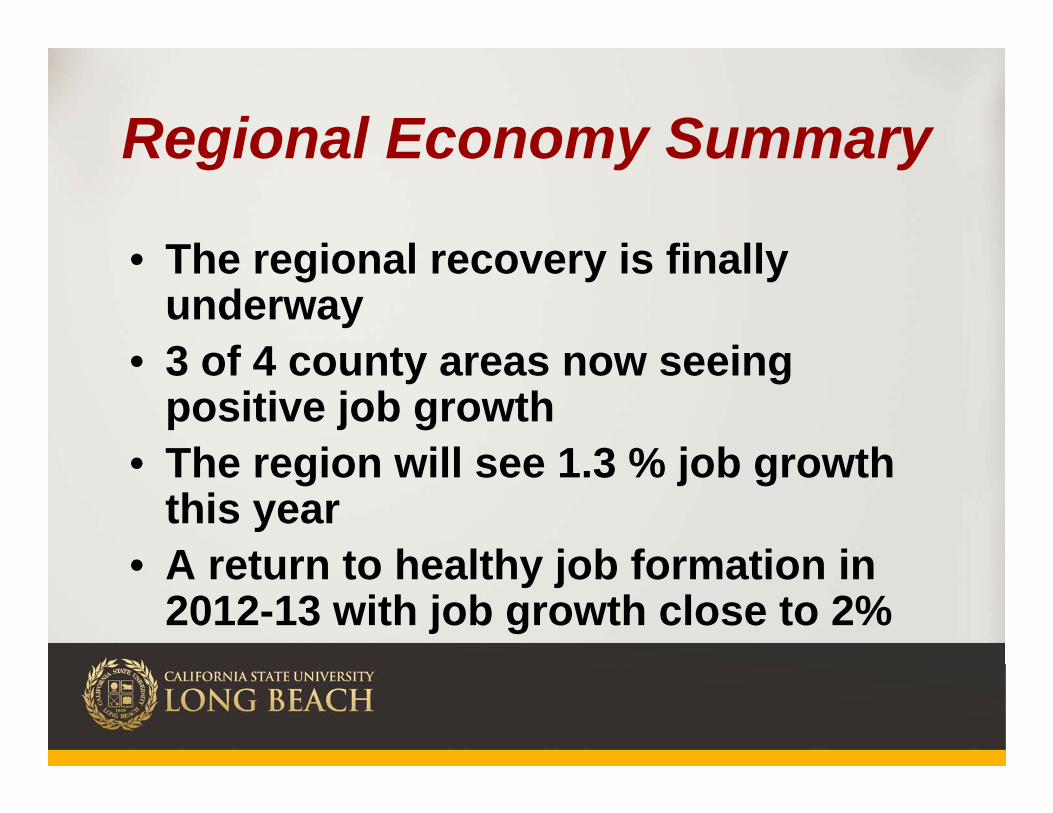
Regional Economy Summary
• The regional recovery is finally underway
• 3 of 4 county areas now seeing positive job growth
• The region will see 1.3 % job growth this year
• A return to healthy job formation in 2012-13 with job growth close to 2%

Economic OutlookLos Angeles County
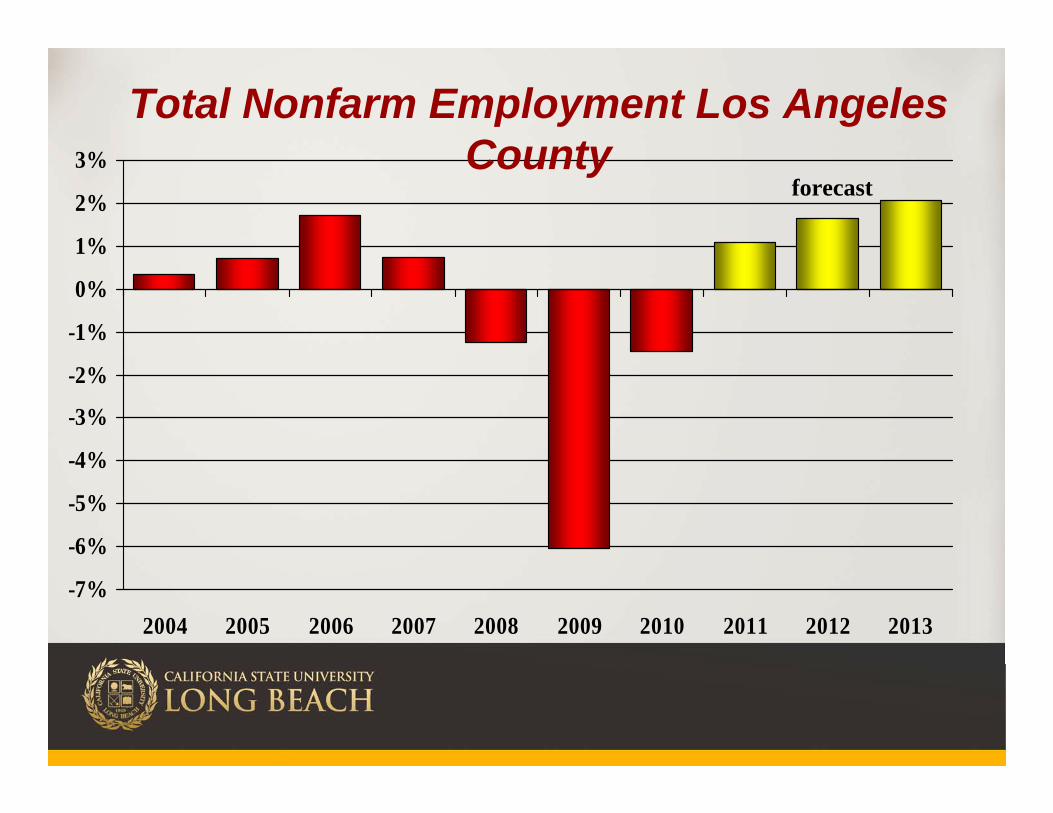
-7%
-6%
-5%
-4%
-3%
-2%
-1%
0%
1%
2%
3%
2004 2005 2006 2007 2008 2009 2010 2011 2012 2013
Total Nonfarm Employment Los Angeles County
forecast
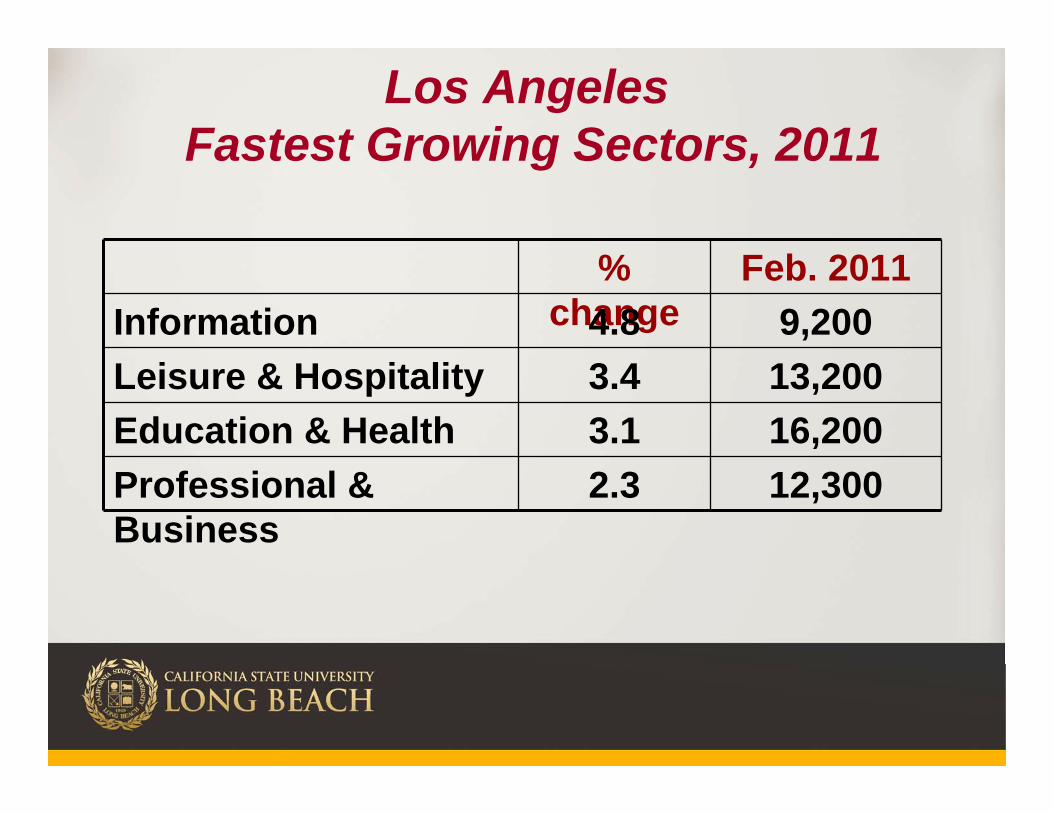
Los AngelesFastest Growing Sectors, 2011
% change
Feb. 2011Information 4.8 9,200Leisure & Hospitality 3.4 13,200Education & Health 3.1 16,200Professional & Business
2.3 12,300
-10%
-8%
-6%
-4%
-2%
0%
2%
4%
6%
2004 2005 2006 2007 2008 2009 2010 2011 2012 2013
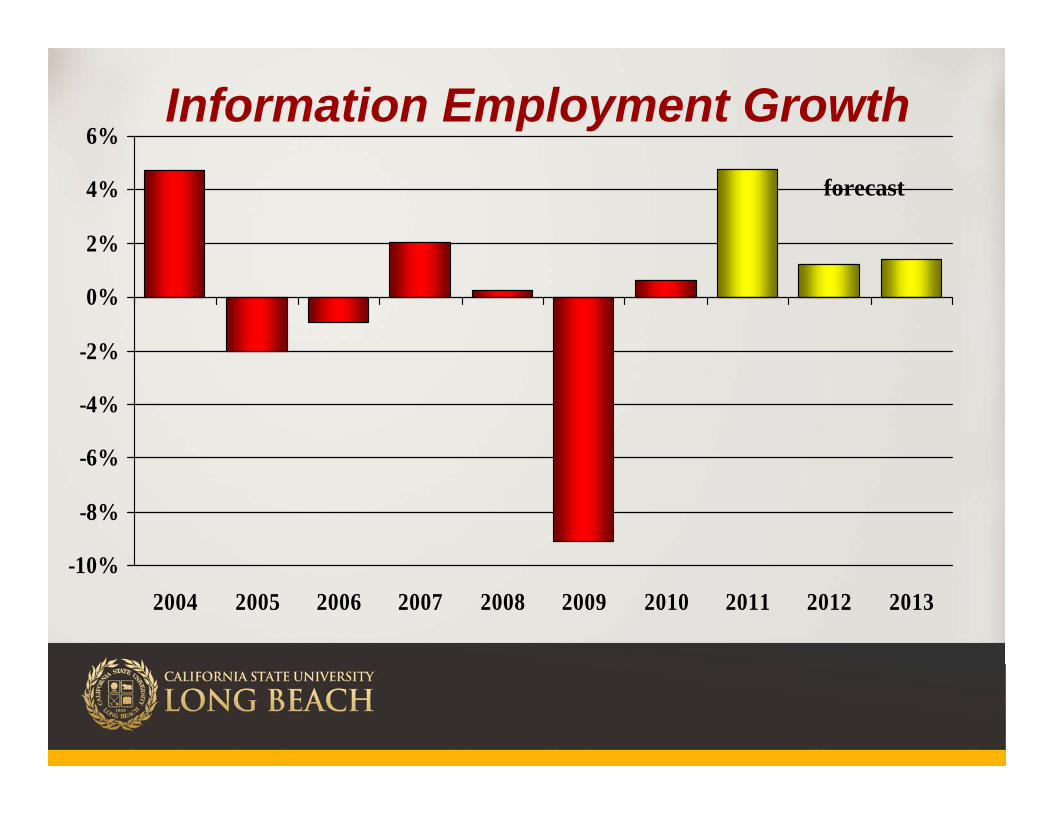
Information Employment Growthforecast
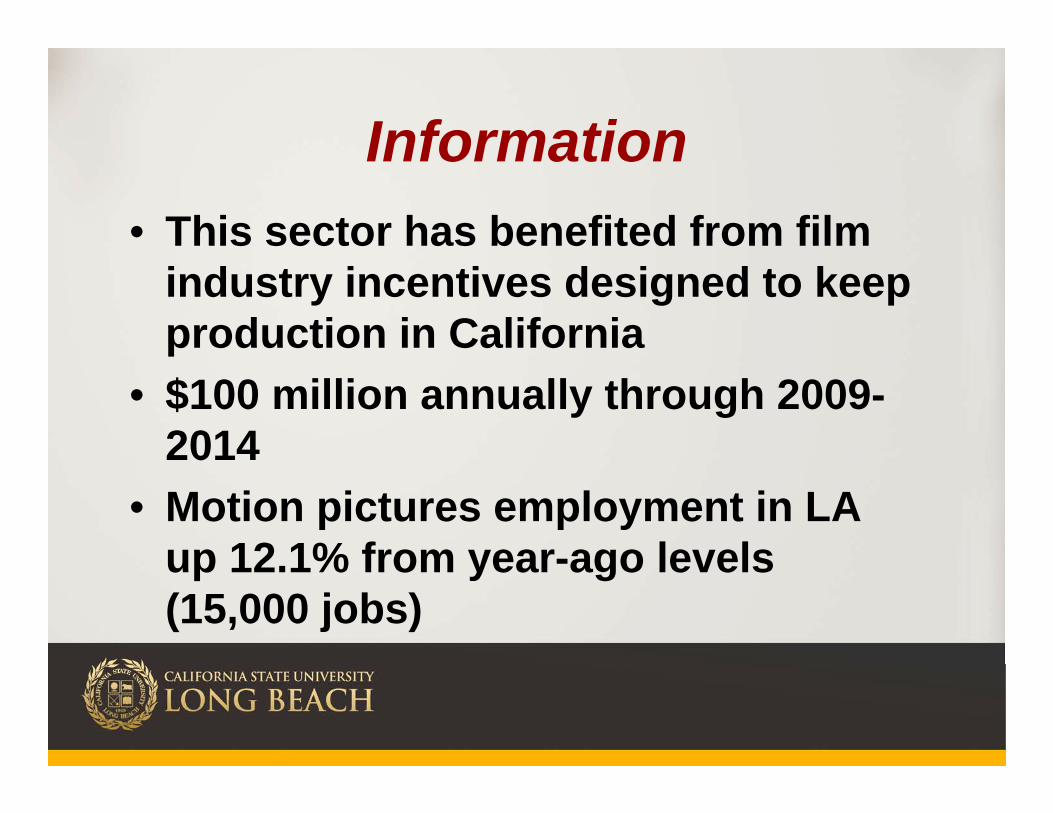
Information• This sector has benefited from film
industry incentives designed to keep production in California
• $100 million annually through 2009-2014
• Motion pictures employment in LA up 12.1% from year-ago levels (15,000 jobs)

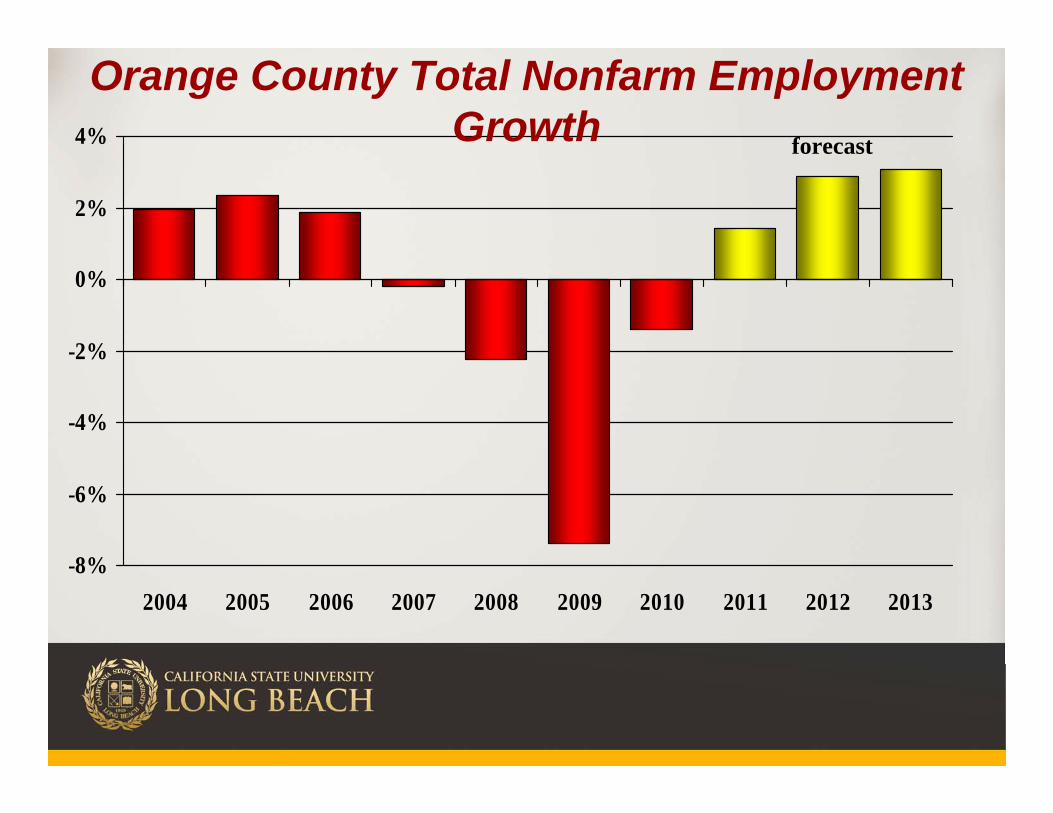
Economic Outlook Orange County
-8%
-6%
-4%
-2%
0%
2%
4%
2004 2005 2006 2007 2008 2009 2010 2011 2012 2013
Orange County Total Nonfarm Employment Growth forecast
-25%
-20%
-15%
-10%
-5%
0%
5%
10%
15%
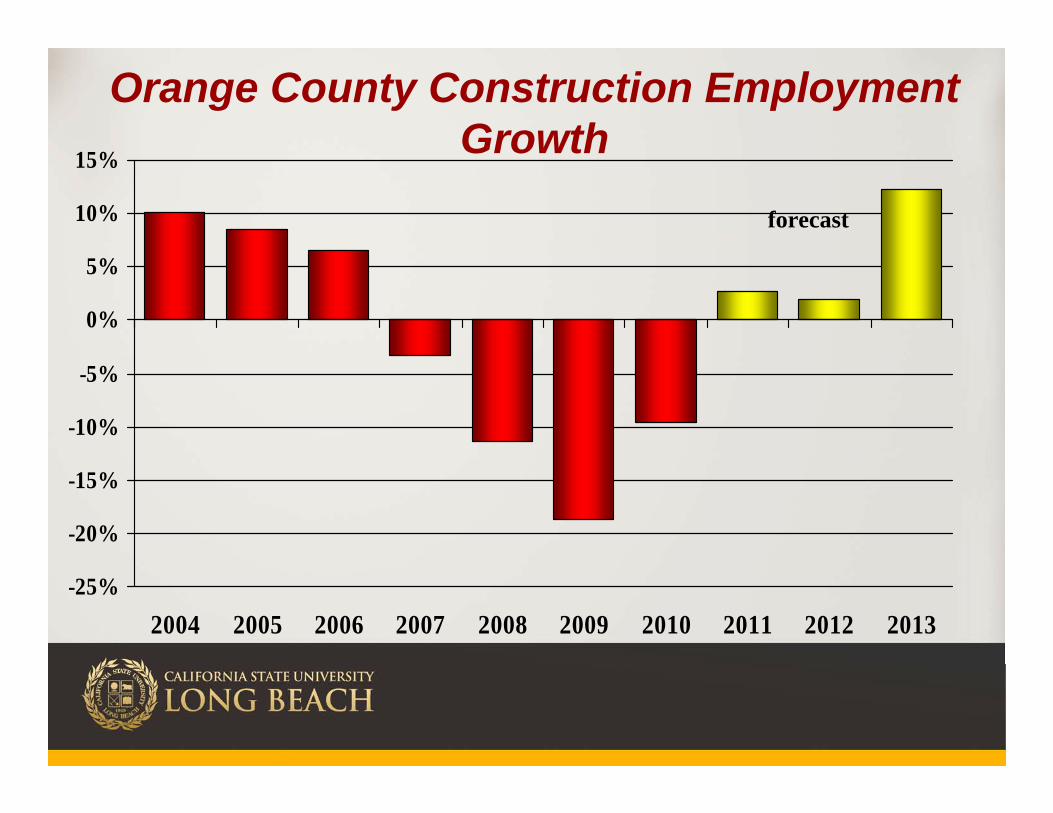
2004 2005 2006 2007 2008 2009 2010 2011 2012 2013
Orange County Construction Employment Growth
forecast
-15%
-10%
-5%
0%
5%
10%
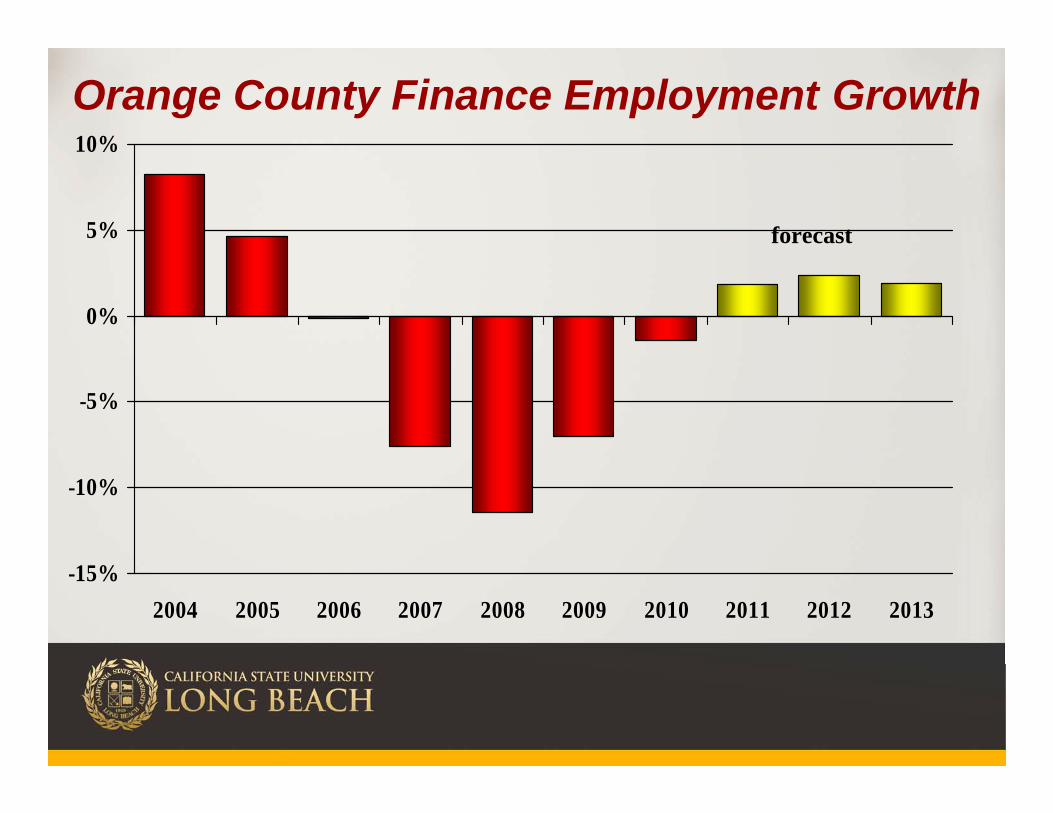
2004 2005 2006 2007 2008 2009 2010 2011 2012 2013
Orange County Finance Employment Growth
forecast

Economic Outlook Riverside/San Bernardino
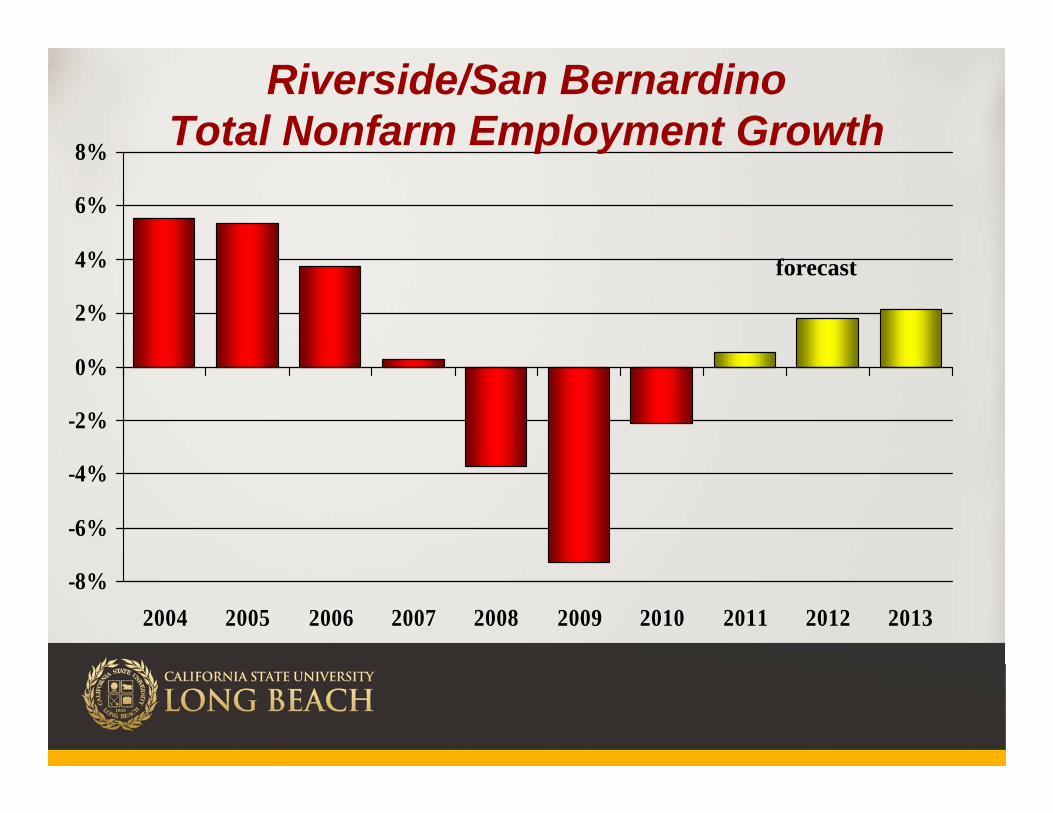
-8%
-6%
-4%
-2%
0%
2%
4%
6%
8%
2004 2005 2006 2007 2008 2009 2010 2011 2012 2013
Riverside/San BernardinoTotal Nonfarm Employment Growth
forecast

Riverside/San Bernardino• This area’s recovery will be aided by
strong growth in the wholesale and transportation, warehousing & utilities sectors
• In 2011 these 2 sectors alone will add over 3,000 jobs
• Other areas of strength will include health and professional & business services
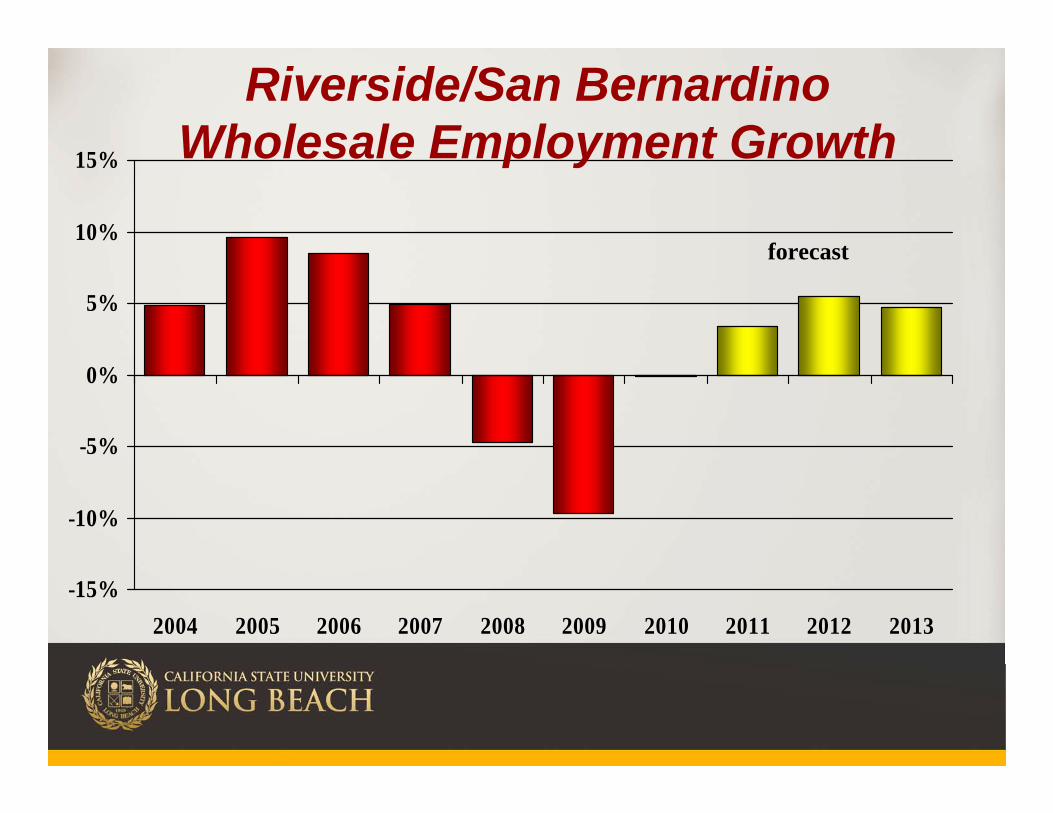
-15%
-10%
-5%
0%
5%
10%
15%
2004 2005 2006 2007 2008 2009 2010 2011 2012 2013
Riverside/San BernardinoWholesale Employment Growth
forecast
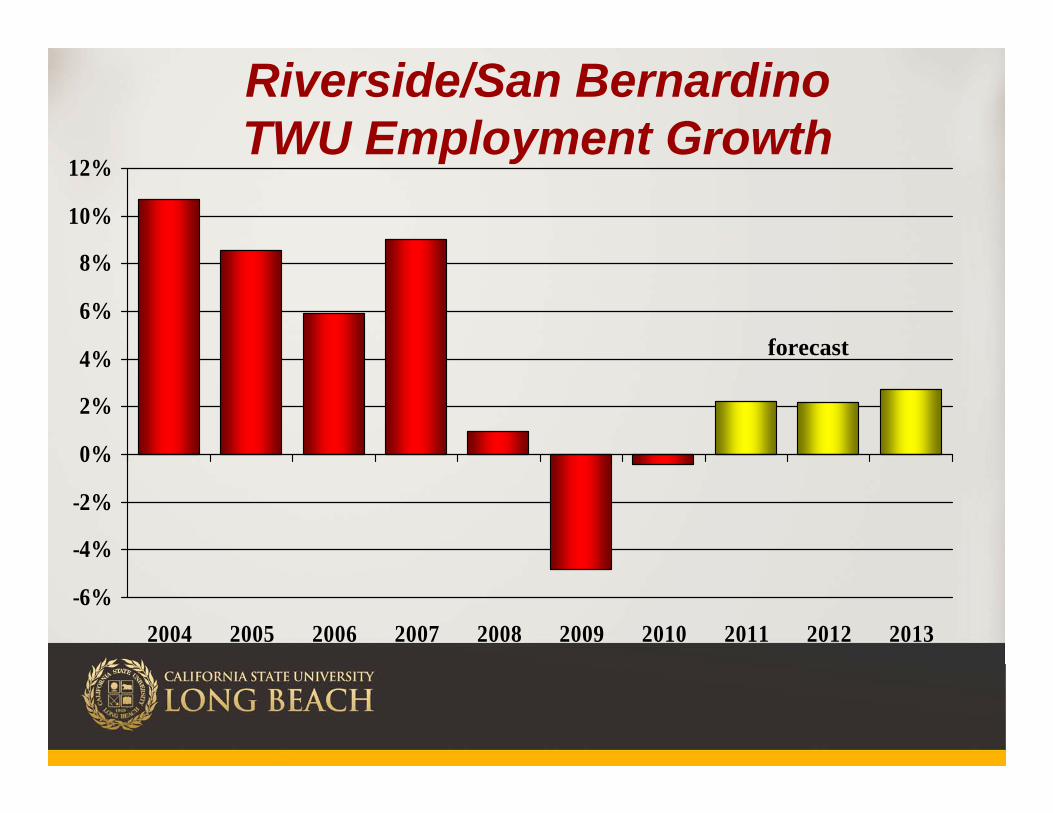
-6%
-4%
-2%
0%
2%
4%
6%
8%
10%
12%
2004 2005 2006 2007 2008 2009 2010 2011 2012 2013
Riverside/San BernardinoTWU Employment Growth
forecast

Economic Outlook Ventura County
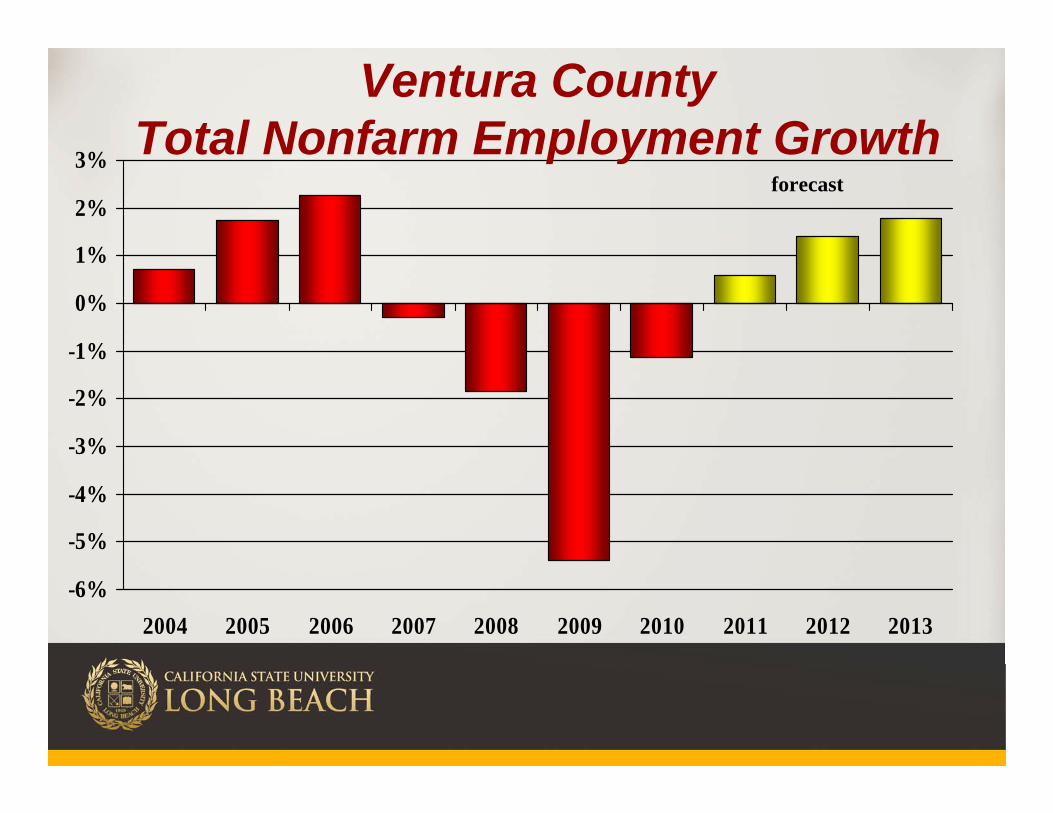
-6%
-5%
-4%
-3%
-2%
-1%
0%
1%
2%
3%
2004 2005 2006 2007 2008 2009 2010 2011 2012 2013
Ventura CountyTotal Nonfarm Employment Growth
forecast

The Housing Market
The Regional Housing Market
• Starting this year we will present data using the “Case-Shiller index.”
• This index is based on a “repeat-sales” methodology
• Index gives a more accurate read on price appreciation/depreciation than median home price
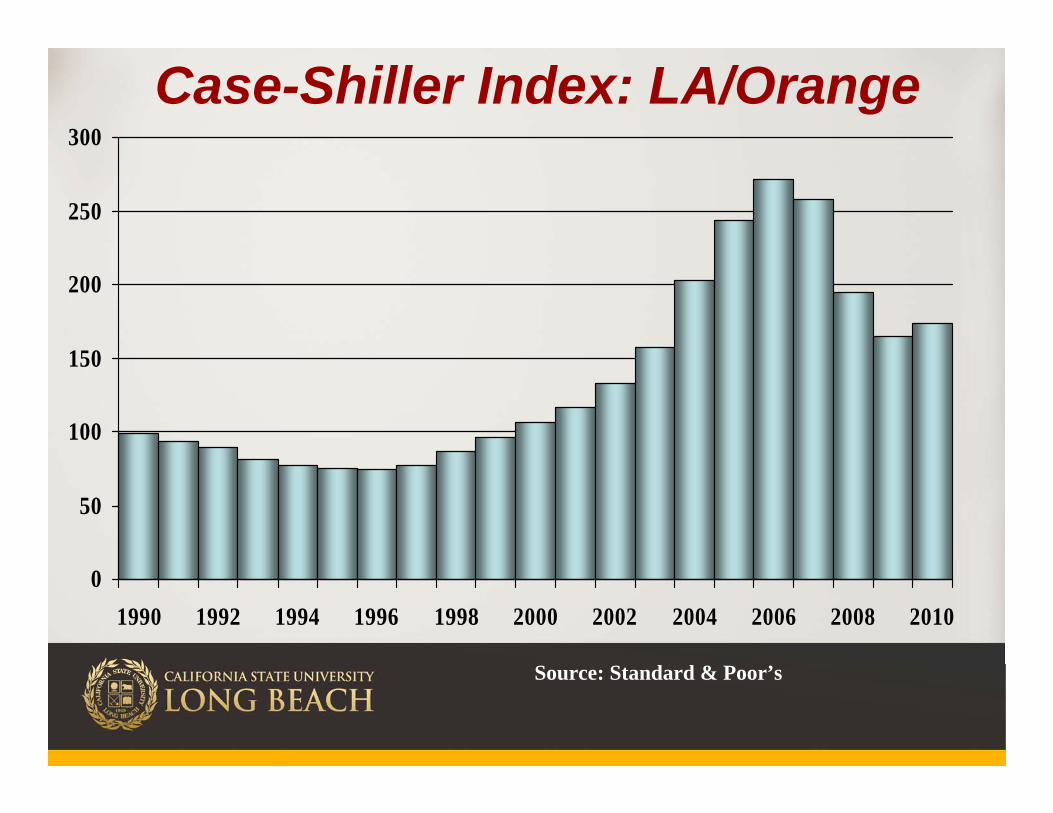
0
50
100
150
200
250
300
1990 1992 1994 1996 1998 2000 2002 2004 2006 2008 2010
Case-Shiller Index: LA/Orange
Source: Standard & Poor’s
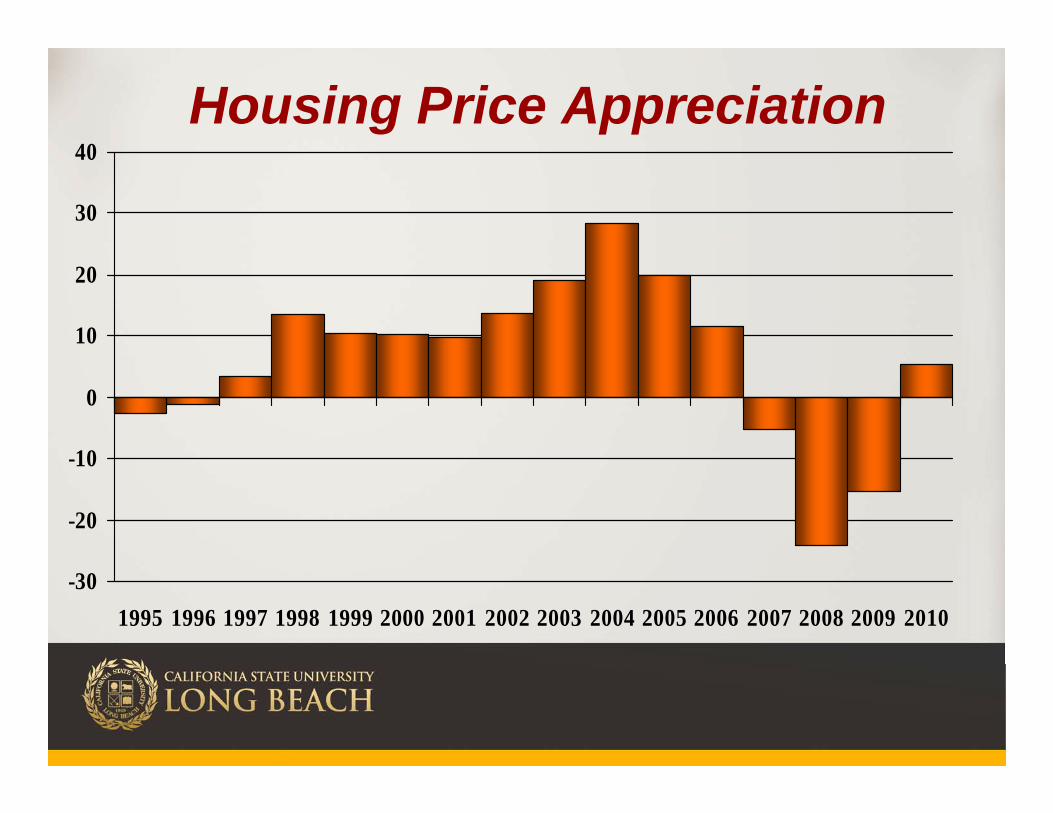
-30
-20
-10
0
10
20
30
40
1995 1996 1997 1998 1999 2000 2001 2002 2003 2004 2005 2006 2007 2008 2009 2010
Housing Price Appreciation
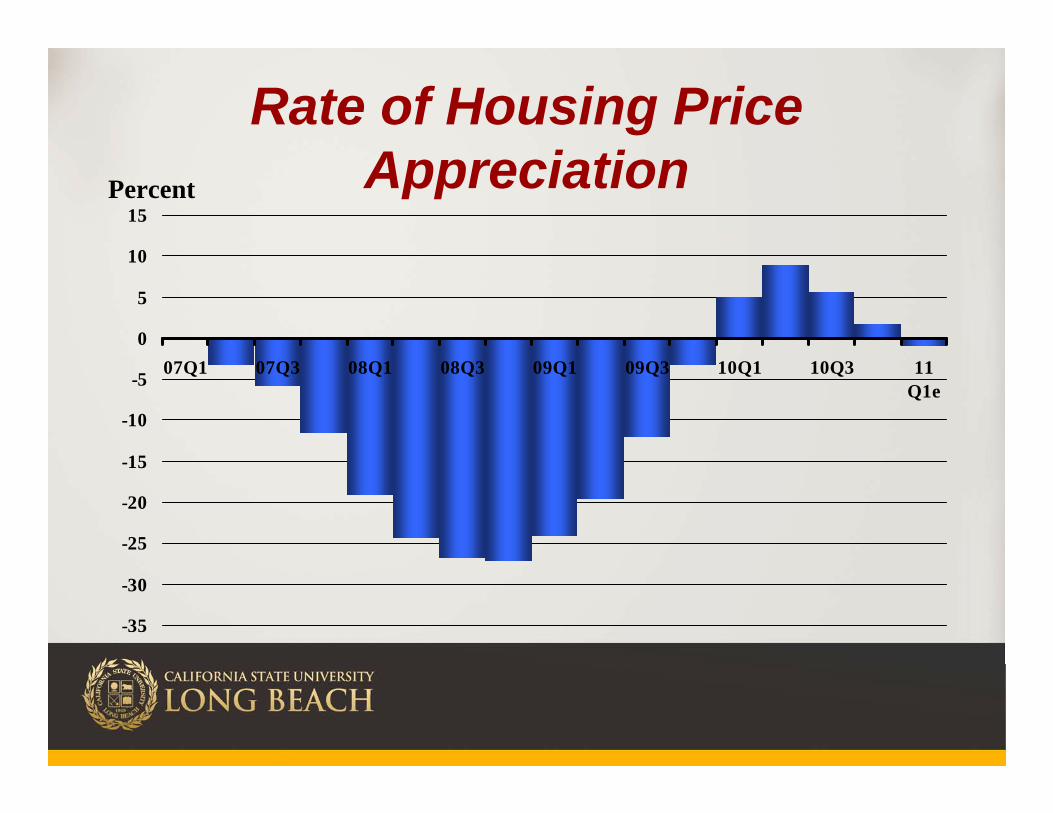
Rate of Housing Price Appreciation
-35
-30
-25
-20
-15
-10
-5
0
5
10
15
07Q1 07Q3 08Q1 08Q3 09Q1 09Q3 10Q1 10Q3 11Q1e
Percent
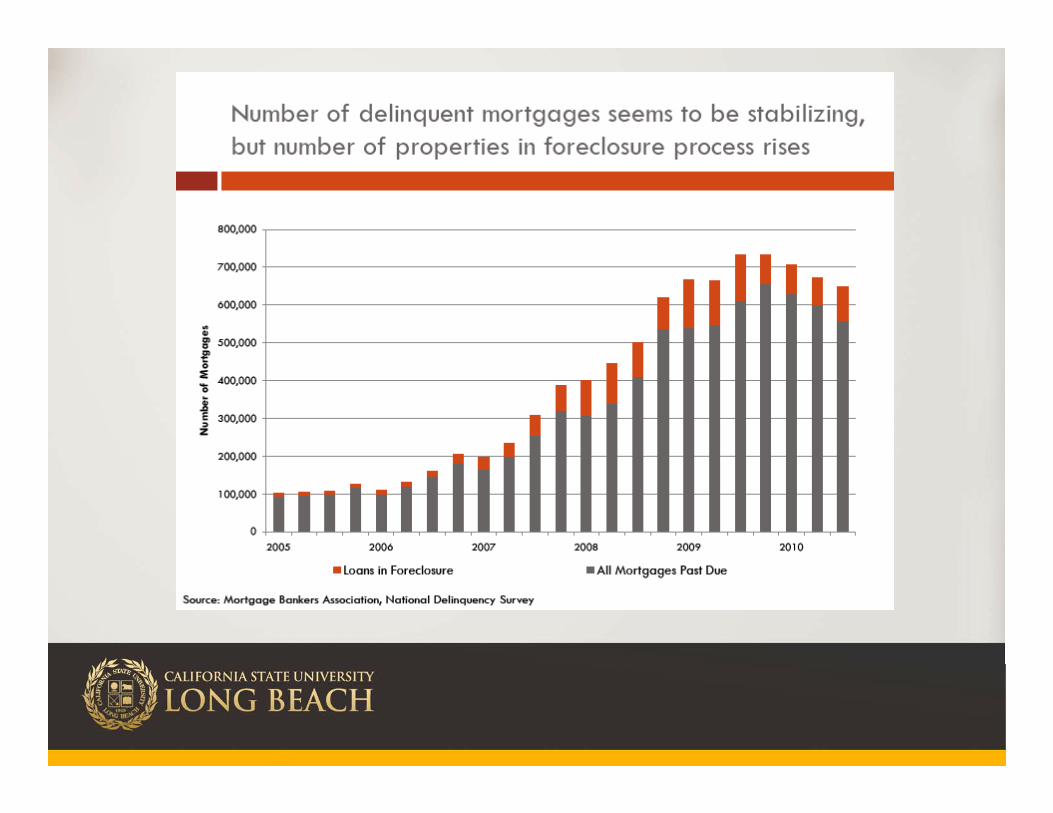
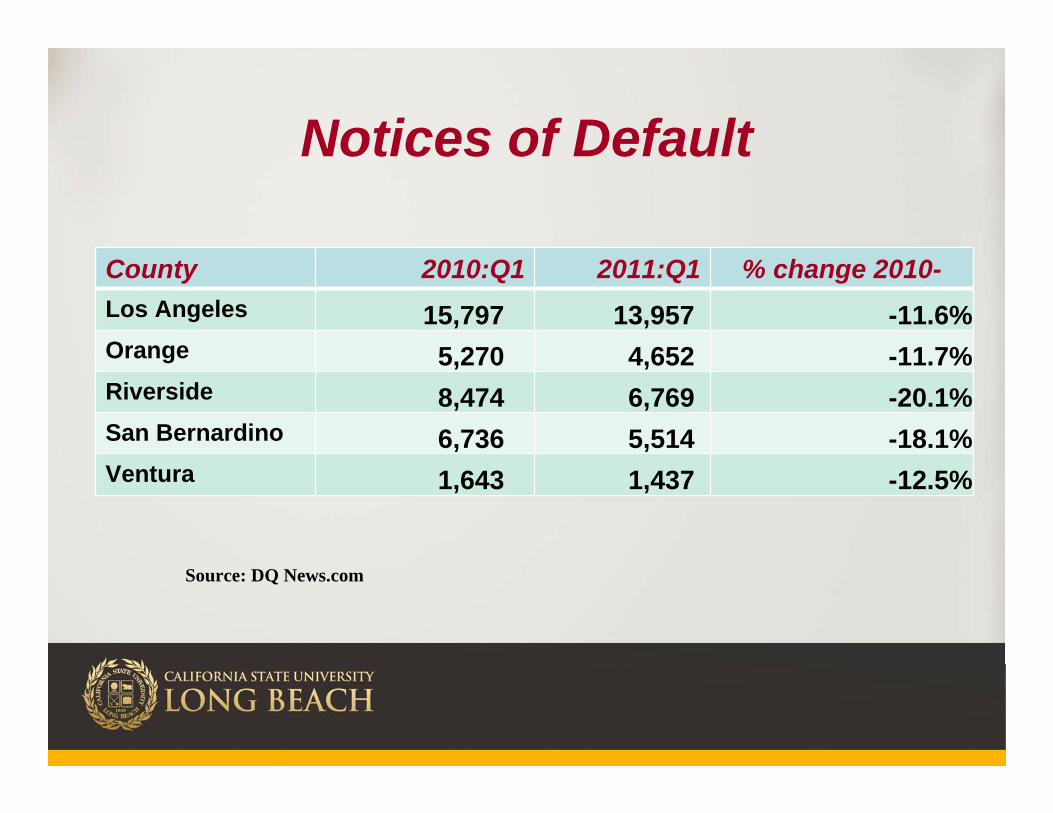
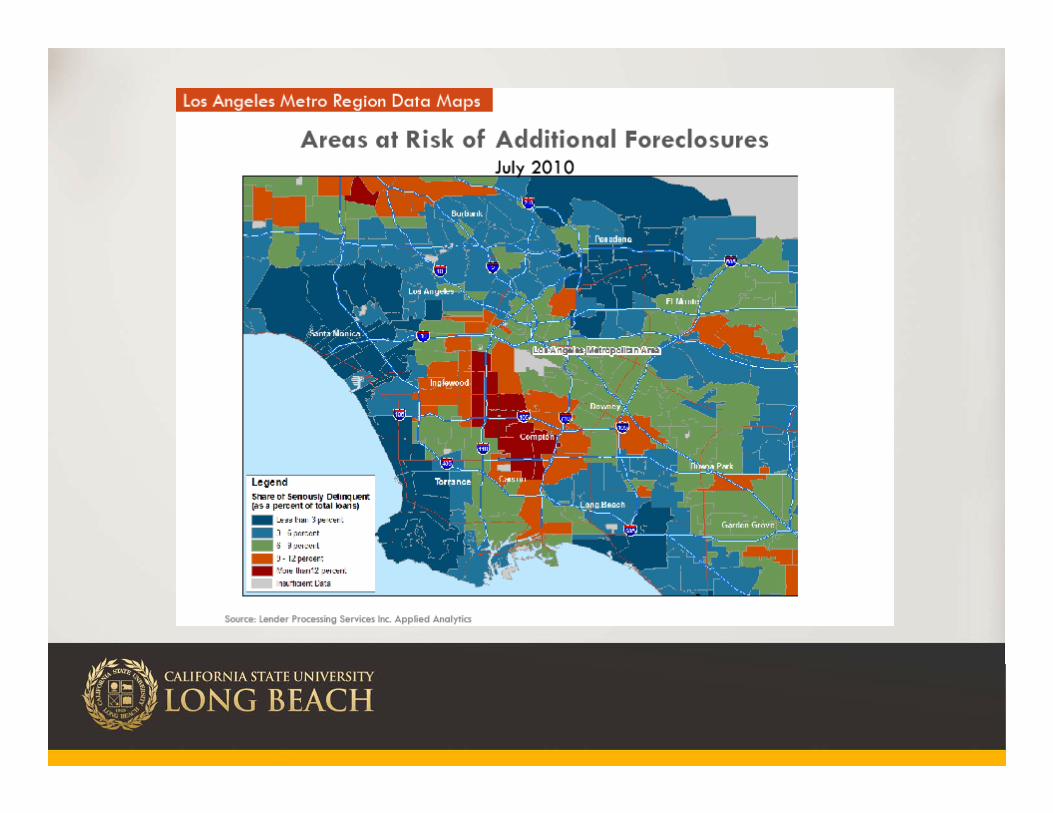
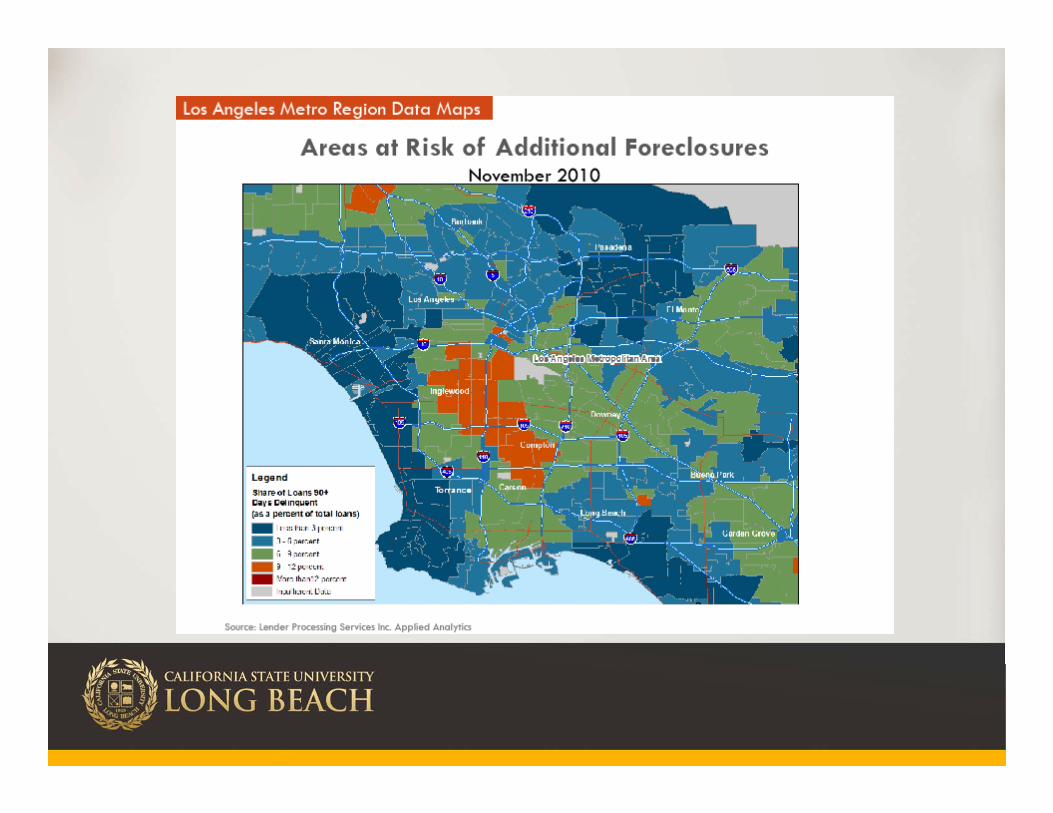
Notices of Default
County 2010:Q1 2011:Q1 % change 2010-2011Los Angeles 15,797 13,957 -11.6%
Orange 5,270 4,652 -11.7%Riverside 8,474 6,769 -20.1%San Bernardino 6,736 5,514 -18.1%Ventura 1,643 1,437 -12.5%
Source: DQ News.com
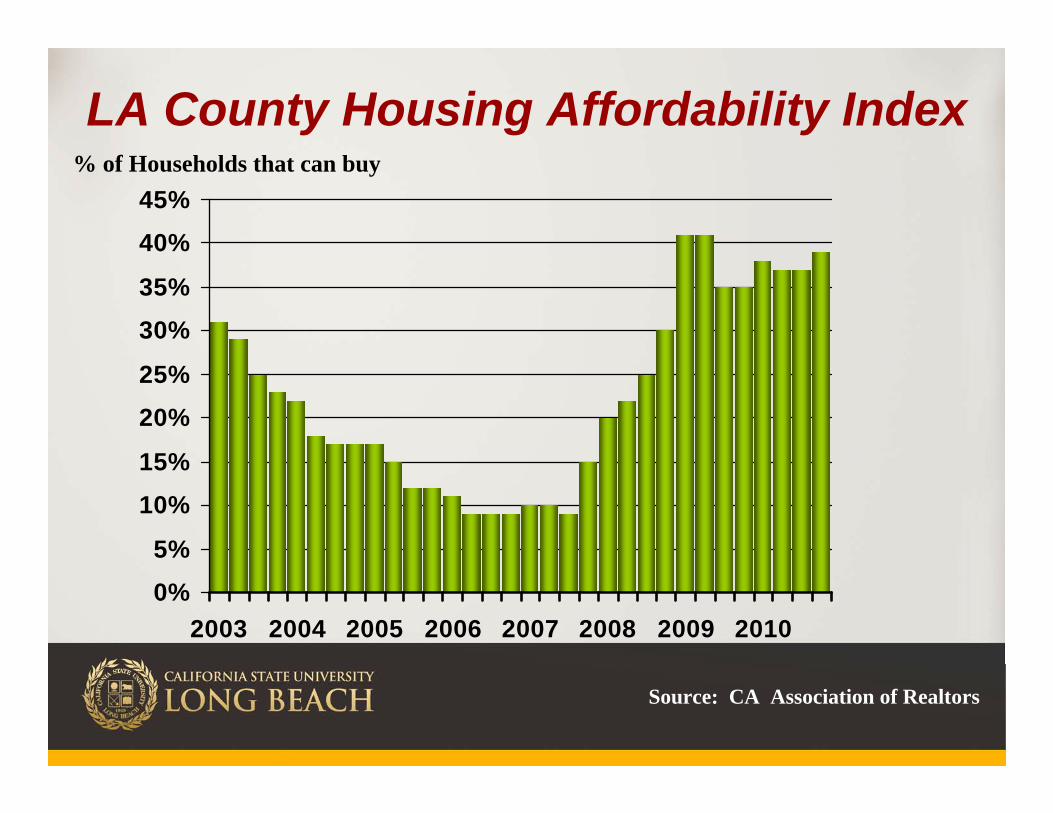
LA County Housing Affordability Index
0%5%
10%15%
20%25%
30%35%
40%45%
2003 2004 2005 2006 2007 2008 2009 2010
Source: CA Association of Realtors
% of Households that can buy
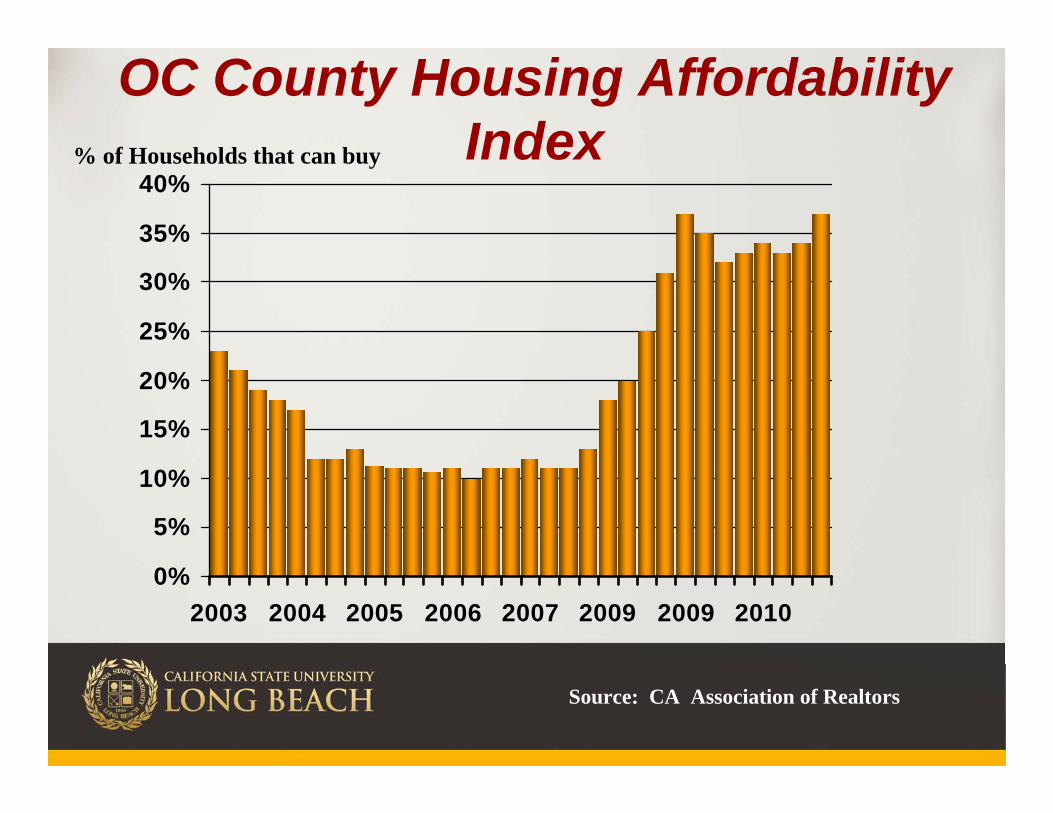
OC County Housing Affordability Index
0%
5%
10%
15%
20%
25%
30%
35%
40%
2003 2004 2005 2006 2007 2009 2009 2010
Source: CA Association of Realtors
% of Households that can buy
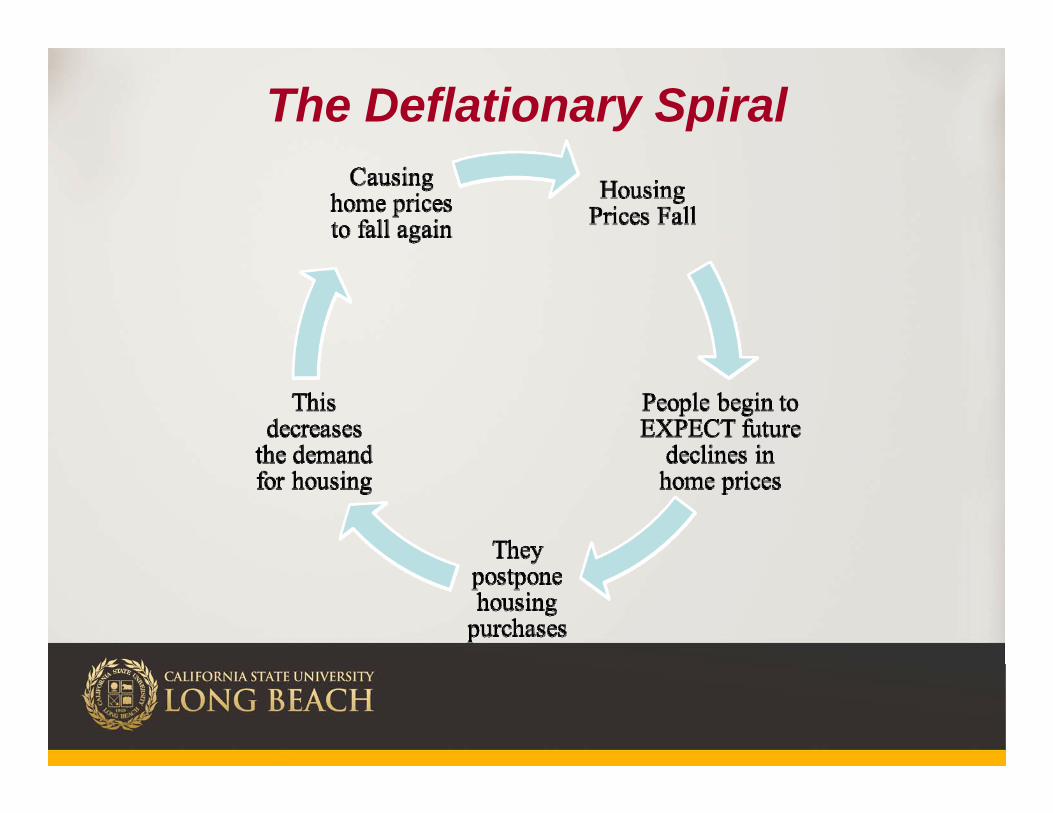
The Deflationary Spiral
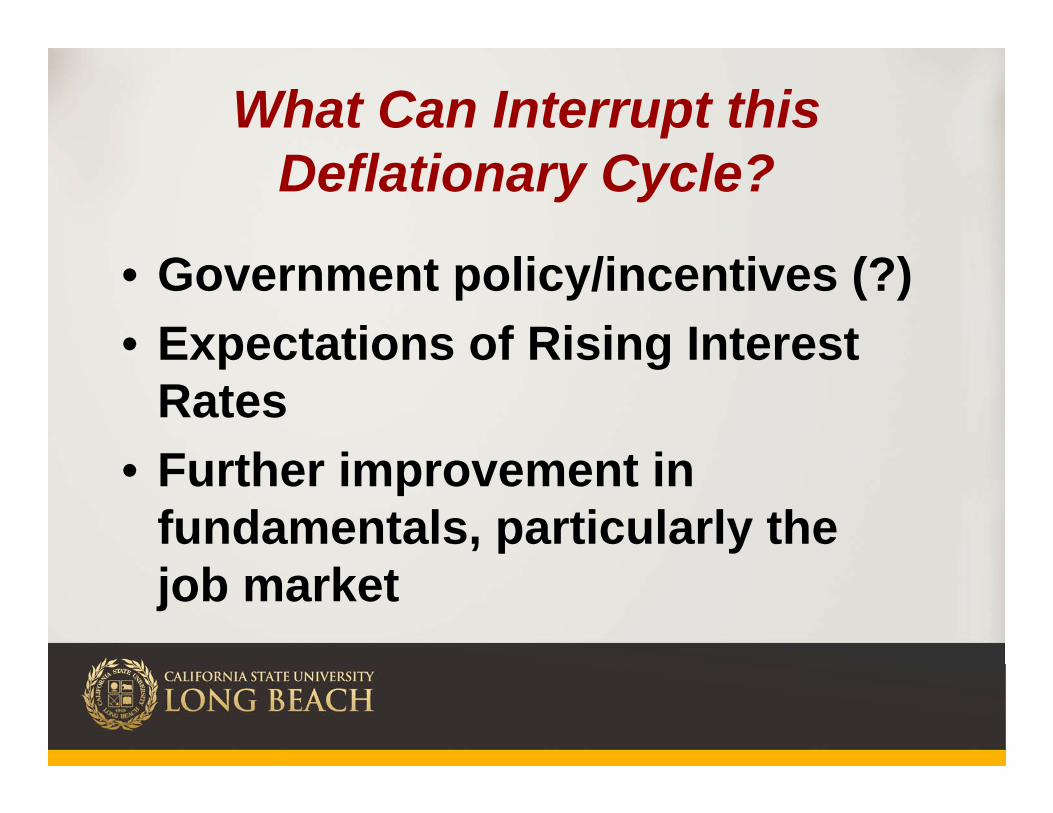
What Can Interrupt this Deflationary Cycle?
• Government policy/incentives (?)• Expectations of Rising Interest
Rates• Further improvement in
fundamentals, particularly the job market
Housing Market in Near Term• The end of a deflationary cycle is hard
to predict because it depends on a shift in expectations
• Anticipated rate increases by Fed in early 2012 may also help potential buyers to “get off the fence.”
• Most likely result is that we will continue to “bump along the bottom”for some time
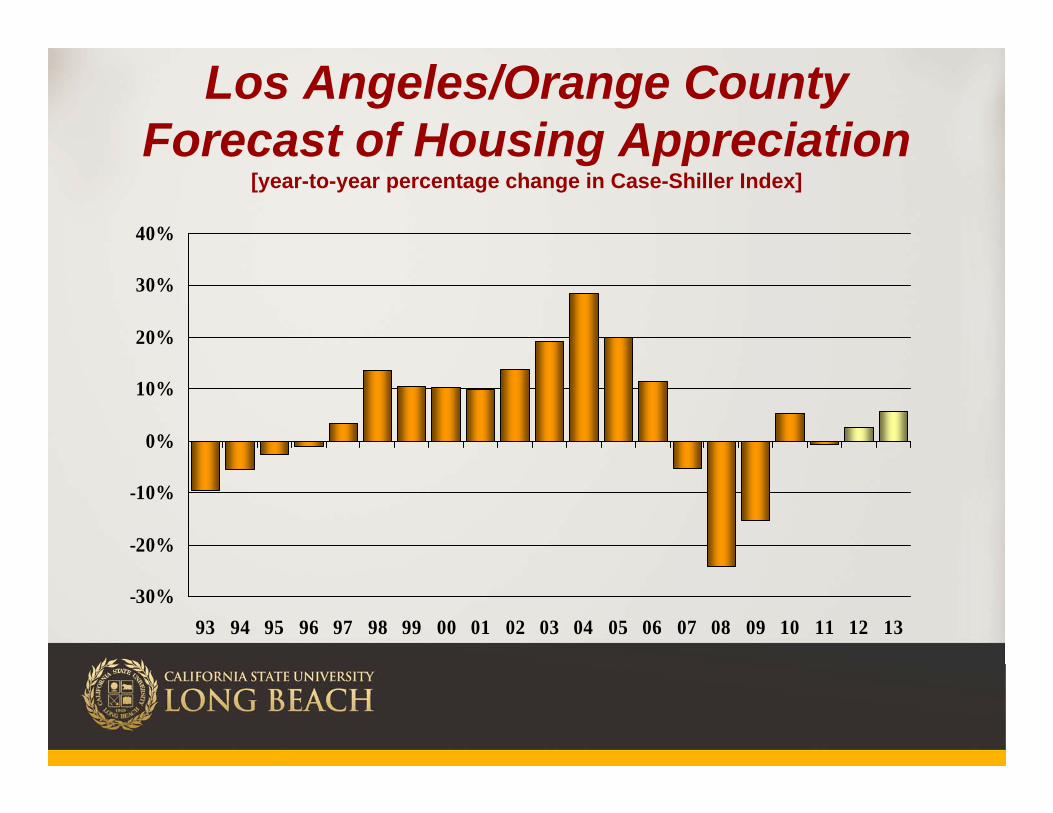
Los Angeles/Orange CountyForecast of Housing Appreciation
[year-to-year percentage change in Case-Shiller Index]
-30%
-20%
-10%
0%
10%
20%
30%
40%
93 94 95 96 97 98 99 00 01 02 03 04 05 06 07 08 09 10 11 12 13