Embed Size (px)
Citation preview
2016
Economic effects of ridesharing in AustraliaUber
General use restrictionThis report is prepared solely for the use of Uber BV. This report is not intended to and should not be used or relied upon by anyone else and we accept no duty of care to any other person or entity. The report has been prepared for the purpose of providing an analysis of the economic effects of ridesharing in Australia. You should not refer to or use our name or the advice for any other purpose.
Contents
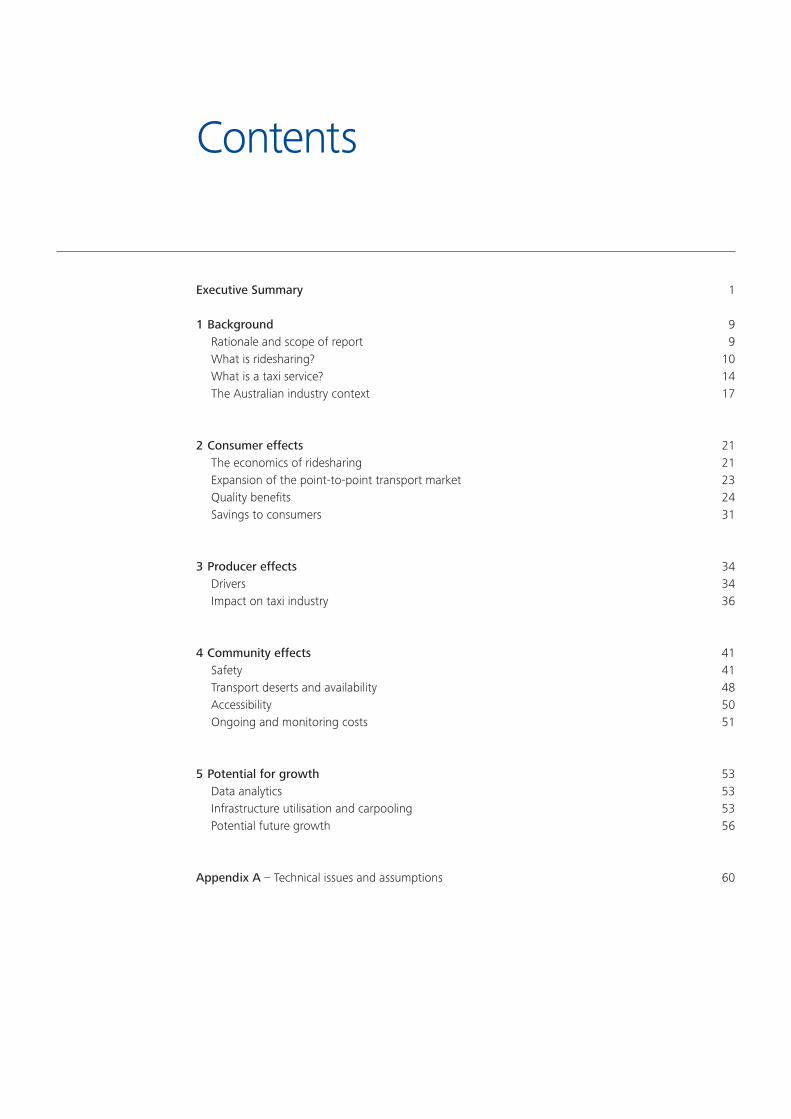
Executive Summary 1
1 Background 9Rationale and scope of report 9What is ridesharing? 10What is a taxi service? 14The Australian industry context 17
2 Consumer effects 21The economics of ridesharing 21Expansion of the point-to-point transport market 23Quality benefits 24Savings to consumers 31
3 Producer effects 34Drivers 34Impact on taxi industry 36
4 Community effects 41Safety 41Transport deserts and availability 48Accessibility 50Ongoing and monitoring costs 51
5 Potential for growth 53Data analytics 53Infrastructure utilisation and carpooling 53Potential future growth 56
Appendix A – Technical issues and assumptions 60
1 Economic effects of ridesharing in Australia
Executive summary
Ridesharing is a relatively new class of point to point transport. Businesses like Uber, as well as its competitors including Lyft and DiDi Kuaidi, operate dynamic platforms through which driver partners who offer their own vehicles are matched with passengers who are seeking to reach a destination. It is distinct from traditional taxi services in that ridesharing services only collect passengers who book through their platform, that payments are generally only permitted through the platform and that the cars are not registered as taxis.
The impacts of ridesharing have been all the starker because they have occurred in such a short period. Uber launched in Australia in 2012 offering its UberBLACK service which only uses licensed hire cars. Uber’s ridesharing service, uberX, commenced operations in Sydney and Melbourne from April 2014. Since then, uberX has expanded to operate in Brisbane, Perth, Canberra, Geelong and the Gold Coast.
This report provides an initial assessment of the economic effects of ridesharing for Australia – what it means for drivers on the Uber platform, regulators, traditional businesses, and most importantly: consumers. It is intended for the report to be broad in scope, but the sheer newness of the services means that in some areas like price impacts, safety issues and growth of service, the analysis is indicative, or qualitative, where data is not available. Further, while this report discusses some regulatory issues in passing, it does not examine or propose recommendations for the regulatory framework for ridesharing in areas like tax, industrial relations, or transport specific laws.
Key points
• Uber’s different service offering includes availability at different times and locations than taxis, an entirely booked system, a rating system for driver partners and riders that may contribute to improved reliability and safety and an integrated payment system.
• Uber’s services are, on average, just under 20 per cent cheaper than the equivalent taxi fare, including dynamic pricing.
• Ridesharing creates benefits for consumers in the order of $81 million per year operating at its current levels.
• Ridesharing is growing the point-to-point transport market, with many consumers induced by either uberX’s differentiated service offering or by its lower price point.
• Uber deals with the issue of safety differently to the taxi industry and there are potential benefits, particularly with relation to reduced fare evasion and drink driving at night.
Ridesharing is one part of the growing ‘sharing economy’ which, enabled by digital tools, is transforming the Australian economy. The agility of new businesses and their widespread impacts have captured the attention and imagination of the public, industry, and the government – right up to the Prime Minister.
2Economic effects of ridesharing in Australia
Australian contextRidesharing is new to the Australian point-to-point transport market. Uber’s ridesharing product uberX delivers a relatively small proportion of services compared to the taxi industry – approximately 6 per cent of the total rides in the point-to-point transport market, based on annualised data from the month of August 2015.
uberX has experienced substantial growth in the past 12 months. While nearly 10 million rides have been facilitated since its inception, over 1.2 million uberX rides were delivered in August 2015 alone in Melbourne, Sydney, Brisbane and Perth. For the purposes of this study, we have annualised the data for the month of August 2015 and assumed that approximately 14.5 million rides will be delivered per year. Given uberX’s current rate of growth, this is a conservative assumption.
The Australian taxi industry is in a period of transition, with regulatory reform either occurring or being reviewed all mainland states and territories. In addition, taxis are increasingly using mobile booking applications (including Ingogo and goCatch) as opposed to traditional methods of attracting customers, including street hails, taxi ranks and traditional taxi networks.
In 2015, the New South Wales and Australian Capital Territory Government moved to regulate ridesharing. The Western Australia and the Tasmanian Governments have also signalled that they will change their regulations in 2016.
The economics of ridesharingThis report analyses the impacts of ridesharing on consumers, businesses and the public. While there are many social aspects of the change, this report focuses on economic impacts and therefore we begin by highlighting some of the key economic concepts that help explain the economics of ridesharing.
• Ridesharing uses a digital platform to connect driver partners and riders. This lowers transaction costs between buyers and sellers and helps explain why it is a cost effective method of point to point transport.
• Ridesharing has added supply to the point to point transport market; but it does not simply replicate existing market offerings. Hence it has added to competition and provides a differentiated service to traditional players in a regulated market.
• Ridesharing riders do not pay rents for restrictive licences which add to production costs.
• The bidirectional rating system reduces information
asymmetries which may provide more efficient decision making by buyers and sellers. This is a different and complementary measure to other ways in which consumers can identify who to buy services from.
• Ridesharing may improve the ability of the point-to-point transport market to efficiently match buyers and sellers. Unlike most markets where price plays a central role in businesses competition, in point to point transport, prices (either in taxis or in ridesharing) are largely set and hence it is connecting people at the right time in the right place that is where competitive forces take shape.
These concepts are used in the analysis following in the impact of ridesharing on consumers, producers and the community.
3 Economic effects of ridesharing in Australia
Benefits for consumersRidesharing provides a variety of benefits to consumers who use the service. These benefits primarily arise from the differentiated services, and the average lower cost of ridesharing rides.
These benefits have two primary effects. Firstly, they encourage consumers to use more services in the point-to-point transport market. These rides grow the size of the point-to-point transport market in Australia because consumers are attracted to enter the market by either the lower price or the different features which ridesharing offers.
Secondly, price and service differences have seen consumers switch to ridesharing from other point-to-point transport services (such as taxis), in which case the overall size of the market remains the same, but there may be net benefits to society because of strong consumer gains.
Overall, Deloitte Access Economics estimates that the net benefits for consumers created by the operation of uberX in Sydney, Melbourne, Brisbane and Perth are worth in the order of $81 million per year at current levels.
Our methodologyTo calculate these effects, Deloitte Access Economics studied a price increase in the primary ridesharing platform available in Australia, Uber’s ridesharing service uberX, to understand the responsiveness of consumers to a price change, termed the price elasticity of demand. Following a 10 per cent increase in the price of rides, it was found that the total number of rides demanded in the subsequent fortnight decreased by 0.1 per cent. Once Uber’s growth in previous fortnights is taken into account, the demand for uberX rides is estimated to be 12.7 per cent below what it would have been but for the price increase.
Based on this methodology, Deloitte Access Economics developed an economic model for Uber’s demand and supply in Australia.
Our analysis finds that 61 per cent of uberX rides are new in the point-to-point transport market, induced by either uberX’s differentiated service offering (36 per cent) or price point (25 per cent).
These increases in the size of the point-to-point transport market comes from a range of other sources, including people using ridesharing instead of driving their own cars, people who previously used active transport or public transport and people who would not previously travelled at all. A differentiated market offering by location, time or services may meet the needs of new market segments.
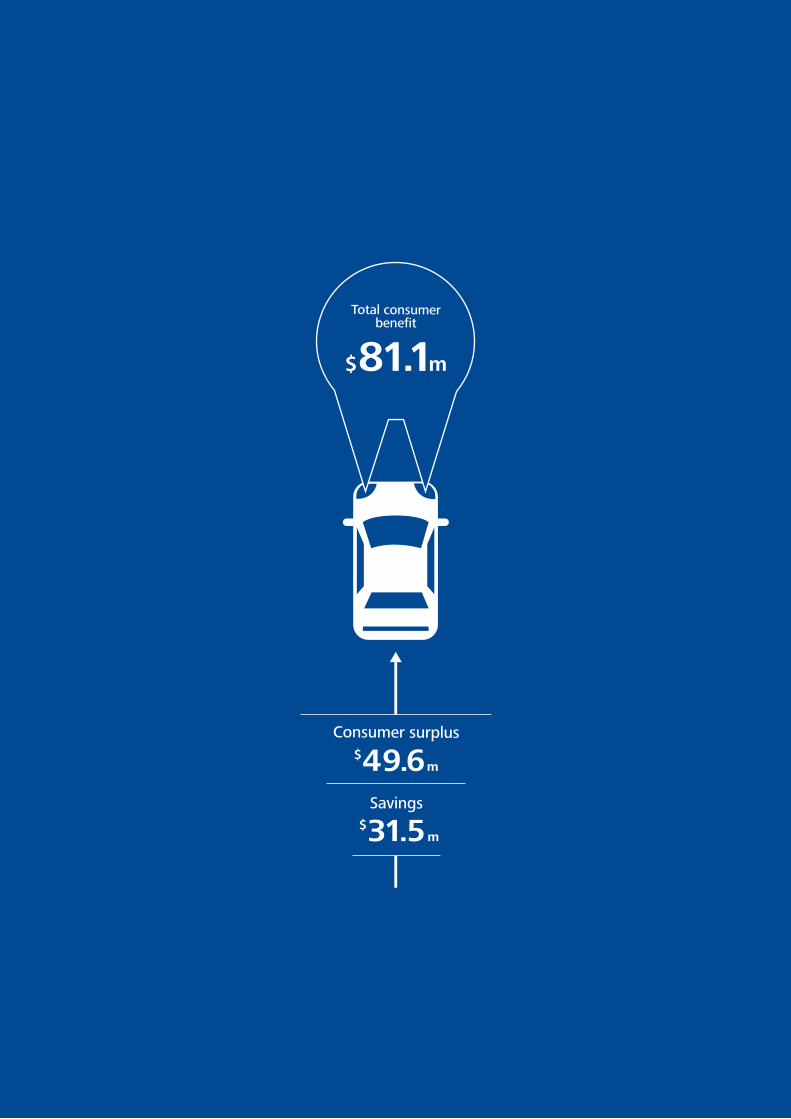
The rides undertaken on uberX provide additional consumer surplus to those consumers who engage uberX services, as well as savings due to its average cheaper fare. Consumer surplus is the additional amount that a consumer would have paid above the price charged and it is created by perceived differences or higher quality. The total gains to consumer welfare are shown right in Table i.
4Economic effects of ridesharing in Australia
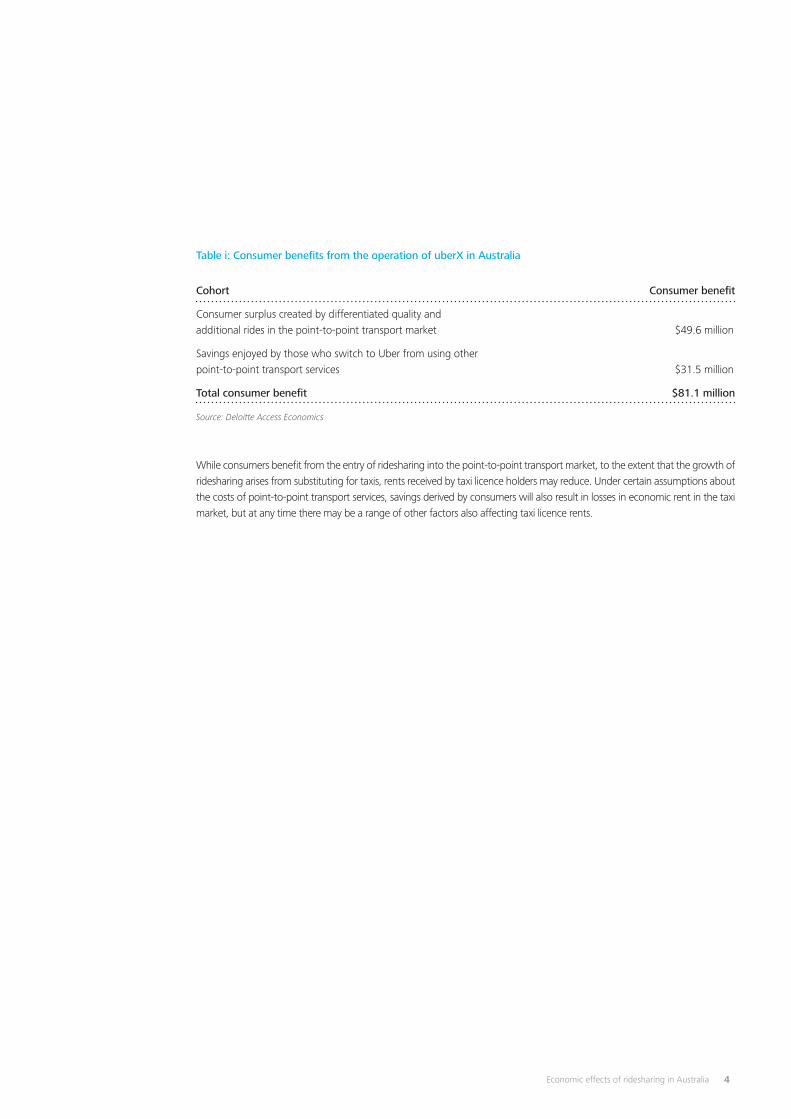
While consumers benefit from the entry of ridesharing into the point-to-point transport market, to the extent that the growth of ridesharing arises from substituting for taxis, rents received by taxi licence holders may reduce. Under certain assumptions about the costs of point-to-point transport services, savings derived by consumers will also result in losses in economic rent in the taxi market, but at any time there may be a range of other factors also affecting taxi licence rents.
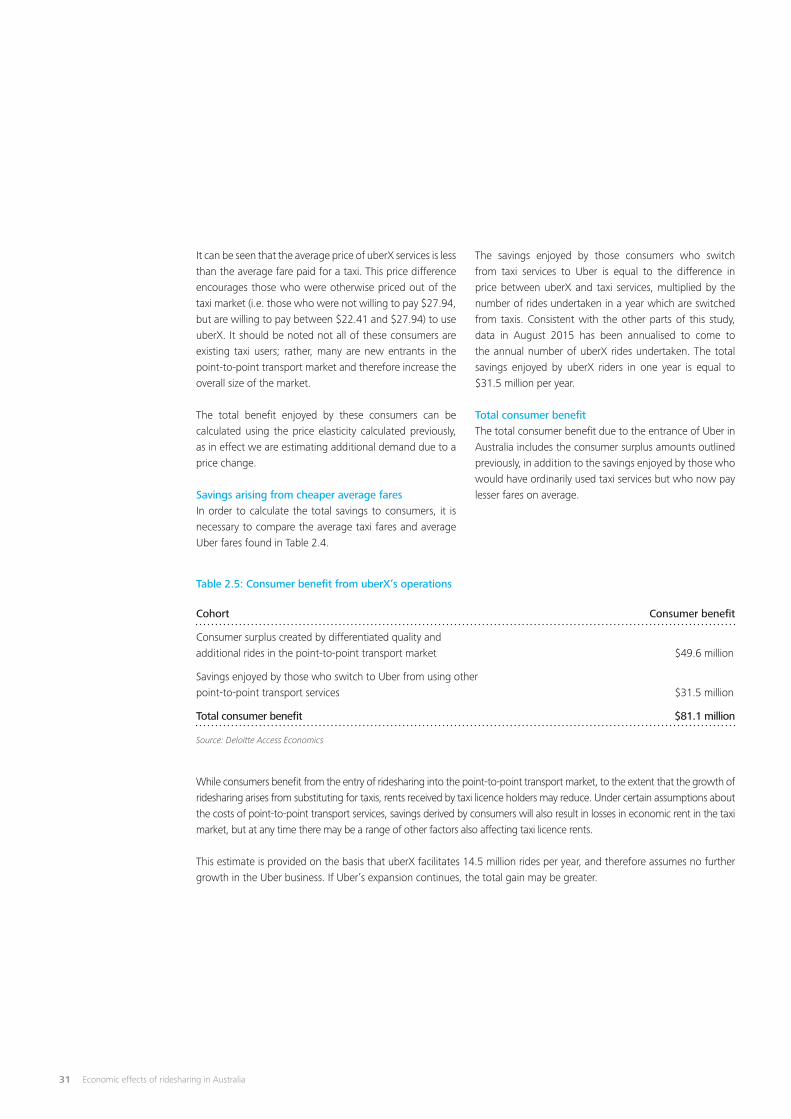
Cohort Consumer benefit
Consumer surplus created by differentiated quality and additional rides in the point-to-point transport market $49.6 million
Savings enjoyed by those who switch to Uber from using other point-to-point transport services $31.5 million
Total consumer benefit $81.1 million
Source: Deloitte Access Economics
Table i: Consumer benefits from the operation of uberX in Australia
5 Economic effects of ridesharing in Australia
Availability
Integrated payment system
Bi-directional rating system
Reliability
Technology
Peer to peer service
Uber riders are available in locations which are generally less serviced and at different times of
the day.
The Uber platform requires all payments
to be completed through its app using
stored payment details.
Uber riders and drivers are invited to rate their counterpart
following a ride, encouraging good
service.
Uber riders face less waiting time
for a ride.
Uber application allows easy ride
requests and ability to track approach of
driver.
Consumer preference for
sharing economy services.
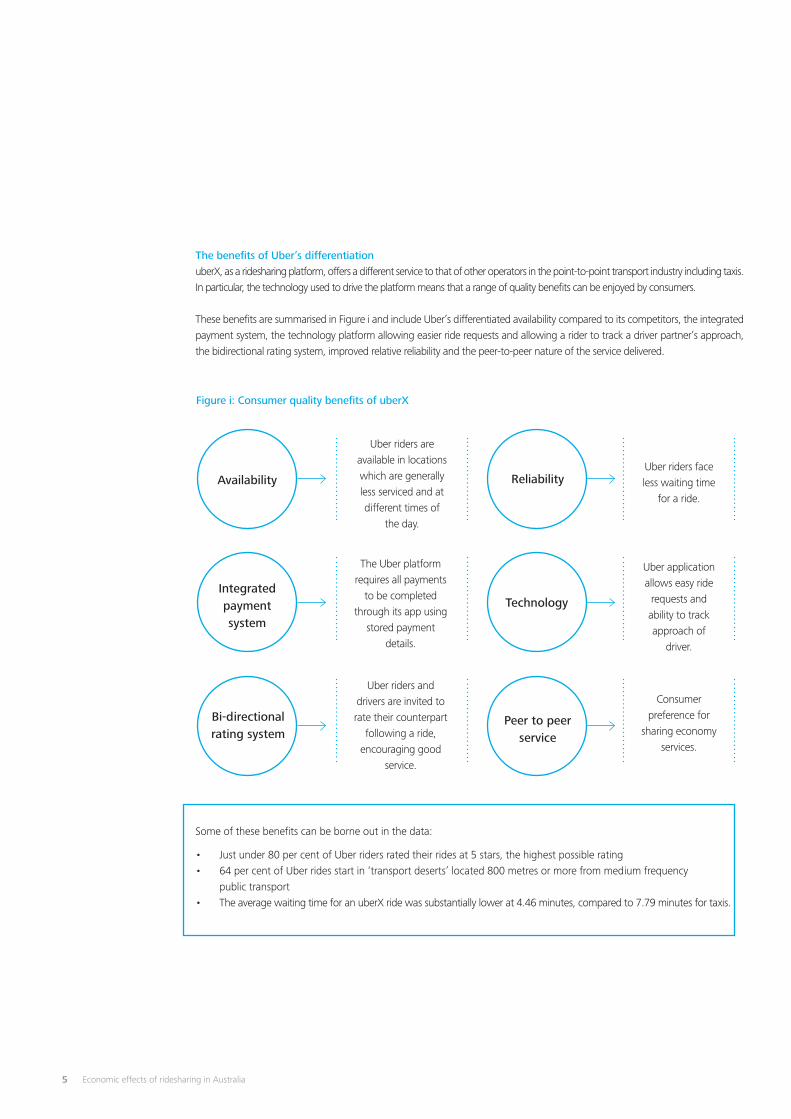
Figure i: Consumer quality benefits of uberX
Some of these benefits can be borne out in the data:
• Just under 80 per cent of Uber riders rated their rides at 5 stars, the highest possible rating• 64 per cent of Uber rides start in ‘transport deserts’ located 800 metres or more from medium frequency
public transport• The average waiting time for an uberX ride was substantially lower at 4.46 minutes, compared to 7.79 minutes for taxis.
The benefits of Uber’s differentiationuberX, as a ridesharing platform, offers a different service to that of other operators in the point-to-point transport industry including taxis. In particular, the technology used to drive the platform means that a range of quality benefits can be enjoyed by consumers.
These benefits are summarised in Figure i and include Uber’s differentiated availability compared to its competitors, the integrated payment system, the technology platform allowing easier ride requests and allowing a rider to track a driver partner’s approach, the bidirectional rating system, improved relative reliability and the peer-to-peer nature of the service delivered.
6Economic effects of ridesharing in Australia
Another potential impact of the entry of ridesharing to the Australian market is a rethink by governments around regulatory reform of the taxi industry. Regulatory reform to improve outcomes in this market has been urged by a number of significant reviews including the Harper Competition Review and the Fels review of the Victorian taxi industry. This outcome has already occurred in the NSW and ACT market, with the regulated entry of uberX occurring at the same time as reform in the taxi sector. Deloitte Access Economics has not sought to quantify these benefits as they are not directly attributable to the entry of uberX.
Cost benefitsConsumers also benefit from the lower price of uberX rides. Based on Uber’s trip data, uberX rides taken in August 2015 were on average 19.8 per cent cheaper than if the equivalent rides were taken in taxis. These lower prices both incentivise consumers to enter the point-to-point transport market – thus gaining consumer welfare – as well as providing savings benefits to consumers who would ordinarily use taxis, but switch to uberX due to its enhanced service offering. As noted in Table i, the total savings for Australian consumers who switch from taxis are worth $31 million per year based on uberX’s current level of operation.
Dynamic pricing is distinctive to uberX. Dynamic pricing works by dynamically increasing prices for consumers by a stated multiple (e.g. 1.4x means that the price of a ride is increased 40 per cent above the standard price) based on the level of demand for rides relative to the supply of driver partners available in a local area. An example of the operation of dynamic pricing is on New Years’ Day after the midnight countdown – there are usually many more people seeking to go home than there are cars available. During the normal operation of the market, dynamic pricing is welfare enhancing by definition. Consumers are able to reliably gain access to rides which would have been difficult to obtain and it is demonstrable that they value these rides well above the regular price of Uber (i.e. because they are agreeing to pay the higher price rather than selecting an alternative). Uber has also put a process in place to prevent dynamic pricing during an emergency or crises.
Producer effectsAs at August 2015, uberX had 12,680 active driver partners in the cities of Sydney, Melbourne, Brisbane and Perth. Uber provides a flexible working option, with driver partners choosing the number of hours logged in to the platform each day. Drivers on the Uber platform in Sydney, Melbourne, Brisbane and Perth remit a 20 per cent licence fee on each fare paid for the use of the platform, but retain the remainder of the fare. Driver partners are responsible for maintaining their vehicle and complying with taxation requirements.
Based on the level of uberX’s operations in August 2015, drivers on the uberX platform in Sydney, Melbourne, Brisbane and Perth will receive around $260 million in fares per year, net of the licensing fee paid to Uber. It is important to note that driver partners are responsible for the cost of fuel and maintaining the vehicle, taxation which falls due and for the fixed cost of owning the vehicle.
There may be corresponding effects on other producers within the point-to-point transport market, including taxi drivers. Although current statistics show continued growth in the number of taxi rides undertaken, it is possible that taxi growth will be affected in the future. In addition, the price of taxi licences may decrease, especially following regulatory changes in some states and territories. This would result in decreased rents earned from taxi licences.
Community effectsRidesharing may have a number of effects on the wider community. The primary benefits relate to safety and ease of transportation, while other potential effects include the expense of ongoing monitoring costs.
7 Economic effects of ridesharing in Australia
SafetyuberX delivers safety outcomes differently to other point-to-point transport providers due to the features of its online platform. Safety is an issue in the point-to-point transport industry, with a number of surveys and reports showing the level of concern in the community. The features of the Uber platform mitigate some of the risks associated with the point-to-point transport industry for both driver partners and riders.
Facilitating the match between driver partners and riders on the Uber application may remove anonymity, thus reducing an incentive to commit crime and allowing ease of reporting of any incidents.
A related safety feature of the Uber application is ‘Share My ETA’, which allows riders to share their journey in real time with friends and family. This feature not only provides more information to consumers, but it enables quick action in the event of an emergency.
Fare evasion is reported as a significant issue in the point-to-point industry; a survey conducted in 2010 in South Australia found that 81 per cent of taxi drivers surveyed had experienced fare evasion, with 60 per cent of those respondents having experienced fare evasion twice or more in the prior 12 months. The online automatic payments system used by Uber ensures that no cash changes hands, thus reducing the potential for fare evasion, overcharging and misreporting.
According to Uber, Uber enforces stringent requirements for drivers on the platform. Applicants must satisfy a series of requirements relating to their vehicle and personal history. These requirements aim to enhance the safety of Uber services by setting a high minimum standard of driver and vehicle quality on the platform.
It is also possible that ridesharing may result in reduced levels of intoxicated driving. Studies undertaken in other cities (by Uber and independent academics) have shown a reduction in intoxicated driving following the introduction of ridesharing platforms. One such study found a significant negative impact on the number of alcohol influenced motor vehicle deaths in each city studied between 3.6
and 5.6 percent. If ridesharing had a 3.6 per cent negative impact on alcohol related driving fatalities, approximately 8 fatalities could be prevented each year. This is an indicative figure and is not based on detailed analysis in Australia.
Ongoing monitoring and regulatory costsRidesharing services currently operate without regulations in all jurisdictions in Australia except NSW and the ACT. The ACT was the first region to regulate ridesharing, thus imposing a range of costs on drivers on ridesharing platforms. Based on the current number of Uber driver partners, it is estimated that if the ACT regulation were rolled out nationwide, the cost to driver partners will be approximately $3.6 million.
Potential for growthGiven trends in other cities in which uberX operates, it is likely that ridesharing will continue to grow its market share over time. If this is so, the benefits outlined in this report may be greater in the future.
This report also only considers the scale of uberX operations in the four capital cities selected. uberX already operates in Geelong and the Gold Coast, and has commenced operations in Canberra. Uber has indicated publicly that it intends to expand its operations across the country, including to Adelaide, Hobart and Darwin, as well as regional areas.
The growth of ridesharing may also have other related benefits. For example, Uber has shown a willingness to provide anonymised data to government bodies, which may assist urban planners to identify priorities in development (such as public transport) based on commute patterns. In the longer term, data may be used to identify, for example, the location of new roads or road upgrades.
Additional benefits may be experienced if Uber’s carpooling feature, UberPOOL, were to be introduced in Australia. Based on previous studies, UberPOOL may also deliver benefits arising from increased infrastructure utilisation and decreased congestion.
8Economic effects of ridesharing in Australia
$81.1m
Total consumer benefit
$31.5m
Savings
$49.6m
Consumer surplus
9 Economic effects of ridesharing in Australia
1 Background
Rationale and scope of report
Uber engaged Deloitte Access Economics to study the economic benefits of ridesharing in Australia. The report aims to quantify the economic effects of ridesharing for consumers, producers and the wider community.
Since launching in Australia in October 2012, Uber has offered an additional transportation option and choice for consumers in the point-to-point transportation market. Over 10 million rides have been completed across Australia on its low-cost ridesharing option, uberX, leading to a range of benefits for its users.
The scope of our report considers the uberX platform using data supplied by Uber relating to the period between April 2014 and August 2015 in the cities of Melbourne, Sydney, Brisbane and Perth. Due to data availability (especially for comparator taxi data), this report has focused on uberX’s operations in Melbourne, Sydney and Brisbane.
Consumers also engage in transactions with other Uber services including UberTaxi, UberSUV, UberLUX and UberBLACK, although the benefits relating to these options will not be quantified within this report.
For the purposes of this report, we will take uberX to be the extent of the ridesharing industry in Australia. Ridesharing is a competitive market globally, and it is likely that there will be new entrants other than uberX over time.
This report will outline a definition of two key point-to-point transport services – ridesharing and taxi services – before providing a contextual background of these industries in Australia.
This study will outline the key economic impacts of ridesharing in four main sections:
• Benefits to the consumer, described in Chapter 2• Impacts on producers, described in Chapter 3• Impacts to the wider community, described in Chapter 4• Potential for future growth, described in Chapter 5.
Each of these sections will also outline the impacts in a qualitative fashion.
10Economic effects of ridesharing in Australia
What is ridesharing?
History and definitionWhile Uber and ridesharing are often considered synonymous in Australia, the concept of ridesharing far predates the foundation of Uber in 2009 and its subsequent introduction to Australia in 2012.
The earliest reports of ridesharing arise in early 20th century America. With mass-produced automobiles flooding the market and the early stages of a recession coming into play, enterprising car owners in 1914 began offering rides in their vehicles for a ‘jitney’ – a five cent streetcar fare. The idea spread from Los Angeles across America in less than 12 months, with an estimated 1,400 jitneys operating in San Francisco alone.1
However, streetcar operators suffered losses as passengers flocked to the more convenient, equally priced jitney service. With tax revenues declining, local governments implemented regulatory burdens for jitney operators, including licensing requirements and liability insurance. By 1919, jitneys in operation had decreased by 90%.2
Subsequent ridesharing booms in the United States occurred during World War II and the 1970s oil crisis, with governments encouraging drivers to rideshare in order to conserve energy resources. Rides in this period were often not motivated by profit, but rather by resource conservation. However, the popularity of ridesharing waned as oil prices fell and incomes rose, removing the incentives which previously existed.3
Ridesharing has experienced a resurgence in the past six years, with technology enabling a different service to that seen previously. Although there is no academic consensus as to the definition of the concept, it is possible to discern some common characteristics.
Ridesharing today is commonly understood as the service Uber and similar companies provide – a dynamic platform on which driver partners and passengers are matched in order to reach a destination. The concept retains similarities to the early jitney service, although it now features the benefits of location-sharing technology and hence a greater ability to facilitate the match of supply and demand. Nobel Laureate Alvin Roth explains Uber as a marketplace that connects riders with drivers through a private matching algorithm.4
1 Massachusetts Institute of Technology, Rideshare History & Statistics (January 24 2009) MIT “Real-Time” Rideshare Research < http://ridesharechoices.scripts.mit.edu/home/histstats/>.
2 Ross D. Eckert and George W. Hilton, ‘The Jitneys’ (1972) 15(2) Journal of Law and Economics 293, 307-22.
3 Massachusetts Institute of Technology, Rideshare History & Statistics (24 January 2009) MIT “Real-Time” Rideshare Research <http://ridesharechoices.scripts.mit.edu/home/histstats/>.
4 EconTalk, Alvin Roth on Matching Markets (6 July 2015) Library of Economics and Liberty <http://www.econtalk.org/archives/2015/07/alvin_roth_on_m.html>.
11 Economic effects of ridesharing in Australia
Providers of ridesharing servicesA number of companies operate in the ridesharing space worldwide.
Uber, founded in 2009, was the first player to enter the market. Initially launching in San Francisco in 2010, the company expanded across American cities and then internationally in the following years. Today, Uber operates in 68 countries and 371 cities worldwide.5
While Uber does not have currently have major competitors in Australia, it competes internationally with other ridesharing companies including Lyft, DiDi Kuaidi and BlaBlaCar. Lyft operates in a similar manner to Uber, though it is known for its informality in approach.
Lyft cars are adorned with a pink moustache and drivers are encouraged to ‘fist bump’ passengers upon entering the vehicle. Didi Kuaidi principally operates in China and it states that it facilitates three million trips per day, which it claims is 80 per cent of the private-car market.6
In Australia, Uber is the main provider of ridesharing services, primarily operating its uberX and UberBLACK services in Australian cities. However, recent times have seen competitors more closely aligned with Uber’s premium hire car service, UberBLACK, enter the market. RideBoom, an Australian application, began offering hire car services as of 10 September 2015.7
How does Uber work?Uber operates a variety of its services in Australia, including uberX, UberBLACK, UberSUV, UberLUX and UberTAXI. Each varies in price and standard of delivery, although the basic premise of booking a ride through their smartphone application remains the same.
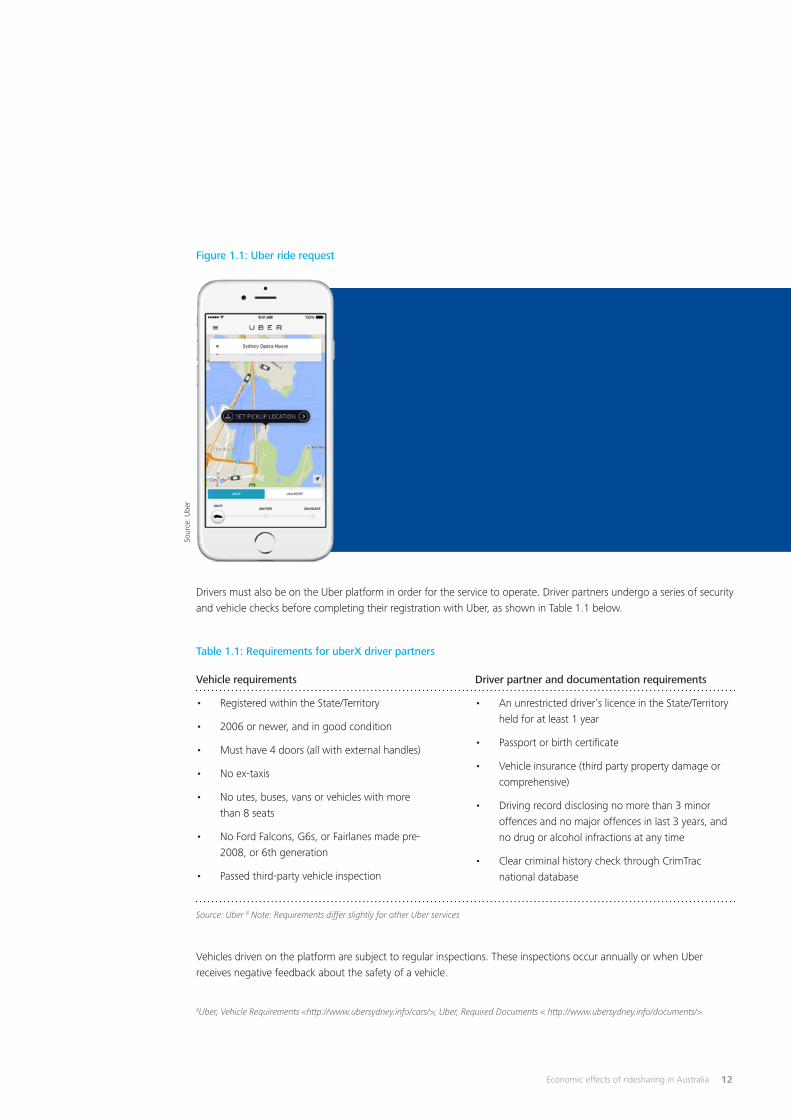
In order to use Uber, a passenger must download the Uber application onto their location-enabled smart phone device. Once downloaded, a rider sets up their Uber profile, scans or enters their payment details, and can request a ride using the application. The application uses the location function of the mobile device to locate the rider and pair them with a nearby driver partner, who can then accept or decline the ride (as shown in Figure 1.1).
For convenience, riders can set their specific pick-up location. The destination of the trip is not revealed to the driver partner until after pick-up, with the route instructions provided through Global Positioning Systems (GPS).
5 Uber, Cities, https://www.uber.com/cities. As at 19 January 2016.
6 TechInAsia, Didi Kuaidi partners with Lyft and invests $100M to take on Uber (17 September 2015), https://www.techinasia.com/didi-kuaidi-partners-lyft-uber/.
7 RideBoom, Media Release: Rideboom Up and Running at Pace (10 September 2015) https://www.rideboom.com/press.php.
12Economic effects of ridesharing in Australia
Drivers must also be on the Uber platform in order for the service to operate. Driver partners undergo a series of security and vehicle checks before completing their registration with Uber, as shown in Table 1.1 below.
Vehicles driven on the platform are subject to regular inspections. These inspections occur annually or when Uber receives negative feedback about the safety of a vehicle.
Sour
ce: U
ber
Vehicle requirements
• Registered within the State/Territory
• 2006 or newer, and in good condition
• Must have 4 doors (all with external handles)
• No ex-taxis
• No utes, buses, vans or vehicles with more than 8 seats
• No Ford Falcons, G6s, or Fairlanes made pre-2008, or 6th generation
• Passed third-party vehicle inspection
Driver partner and documentation requirements
• An unrestricted driver’s licence in the State/Territory held for at least 1 year
• Passport or birth certificate
• Vehicle insurance (third party property damage or comprehensive)
• Driving record disclosing no more than 3 minor offences and no major offences in last 3 years, and no drug or alcohol infractions at any time
• Clear criminal history check through CrimTrac national database
Table 1.1: Requirements for uberX driver partners
Figure 1.1: Uber ride request
8Uber, Vehicle Requirements <http://www.ubersydney.info/cars/>; Uber, Required Documents < http://www.ubersydney.info/documents/>.
Source: Uber 8 Note: Requirements differ slightly for other Uber services
13 Economic effects of ridesharing in Australia
Once a driver partner accepts a ride, the rider is shown the details of their driver partner, including their name, photograph, rating, vehicle make and licence plate number. Following completion of the ride, the driver partner and passenger are able to rate each other through the Uber application. Uber driver partners who receive low ratings (typically less than 4.7/5 on average) risk deactivation and may be given a probationary period in which their ratings must improve. Riders who receive low ratings face similar risks, with a reduced chance of driver partners accepting requested rides, and the possibility of deactivation in certain circumstances.
All payments are completed electronically via banking details stored in the application, enabling a cash-free system.
All rides arranged using the Uber app in Australia are covered by insurance. uberX rides in Australia are backed by vehicle liability insurance issued by CGU, which provides coverage of $20 million for third party bodily injury and property damage each trip. This is in addition to insurance coverage held by the driver partner. This insurance covers riders and third parties.
As with many sharing economy businesses, network effects can play an important role in establishing a high quality, low cost and convenient platform for users. For example, in order to keep waiting times for riders on the lower end of the scale, a significant number of driver partners need to be actively offering rides at different times and geographies on the platform. The Uber platform engages dynamic pricing during periods of peak demand to assist in addressing market inefficiencies that can occur with short term fixed supply and prices, as occurs in the taxi industry.
The majority of uberX trips (91 per cent) are charged based on its baseline fare structure in each state. However, if there is a shortage of driver partners at a particular time and location, a dynamic multiplier is added to the cost of the fare. This helps to ensure that there is an efficient flow of driver partners on the platform, by compensating driver partners during less convenient driving times and locations.These transactions are typically welfare enhancing, as
additional activity is generated by adjusting the supplier’s (driver partner’s) reservation price above their cost. Although consumer surplus is reduced through higher prices, many consumers are willing to engage in these transactions as there are still greater benefits than other transportation options, which may include long wait times. To date, there have been over 580,000 dynamic priced uberX trips completed on the Uber platform.
What is a taxi service?A taxi is defined as ‘a motor vehicle licensed to transport passengers in return for payment of a fare and typically fitted with a taximeter’.9 A taxi may source rides using a range of different methods including street hails, taxi ranks, and phone and digital bookings.
Taxi services have traditionally dominated the private door-to-door transportation market, and are responsible for almost 80 per cent of services in the taxi and limousine transport industry in Australia.10 Taxi services are heavily regulated in Australia and around the world. In Australia, each State and Territory implements its own licensing and regulatory scheme, although the particulars of each scheme are generally similar across jurisdictions.
A taxi must be licensed under a State or Territory taxi licensing scheme in order to operate. A central authority in each State and Territory (generally a transport department or equivalent) determines the number of licenses available at any one time, with licenses either being sold for a fixed term or leased for an annual fee depending on the scheme in operation. In this way, the State or Territory authority controls the number of taxis on the road at any one time. Different classes of licence (e.g. peak, metro, regional etc.) may also control the timing and service location of those taxis.
However, taxi drivers themselves need not hold the taxi licence, although they must be registered under the relevant driver registration scheme in each jurisdiction. Commonly, an accredited operator owns a taxi licence, or leases a licence from a taxi licence owner. The operator is responsible for the day-to-day management of the taxi,
9 Oxford University Press, Oxford Dictionaries <http://www.oxforddictionaries.com/definition/english/taxi>.10 Stephen Gargano, IBISWorld Industry Report I4626: Taxi and Limousine Transport in Australia (IBISWorld, 2015) 15.
14Economic effects of ridesharing in Australia
including insurance and maintenance costs. A taxi driver arranges with an operator to drive the taxi, and either taxi fares are apportioned between them or a fixed amount is paid by the taxi driver to the operator. This arrangement is known as a bailment agreement.
A taxi must also be affiliated with an authorised taxi network, which facilitates a range of functions including taxi fit out, booking services, safety monitoring and other compliance activities. Safety and service requirements are determined by the relevant government authority. A taxi network may also own taxi licences and function as an operator.
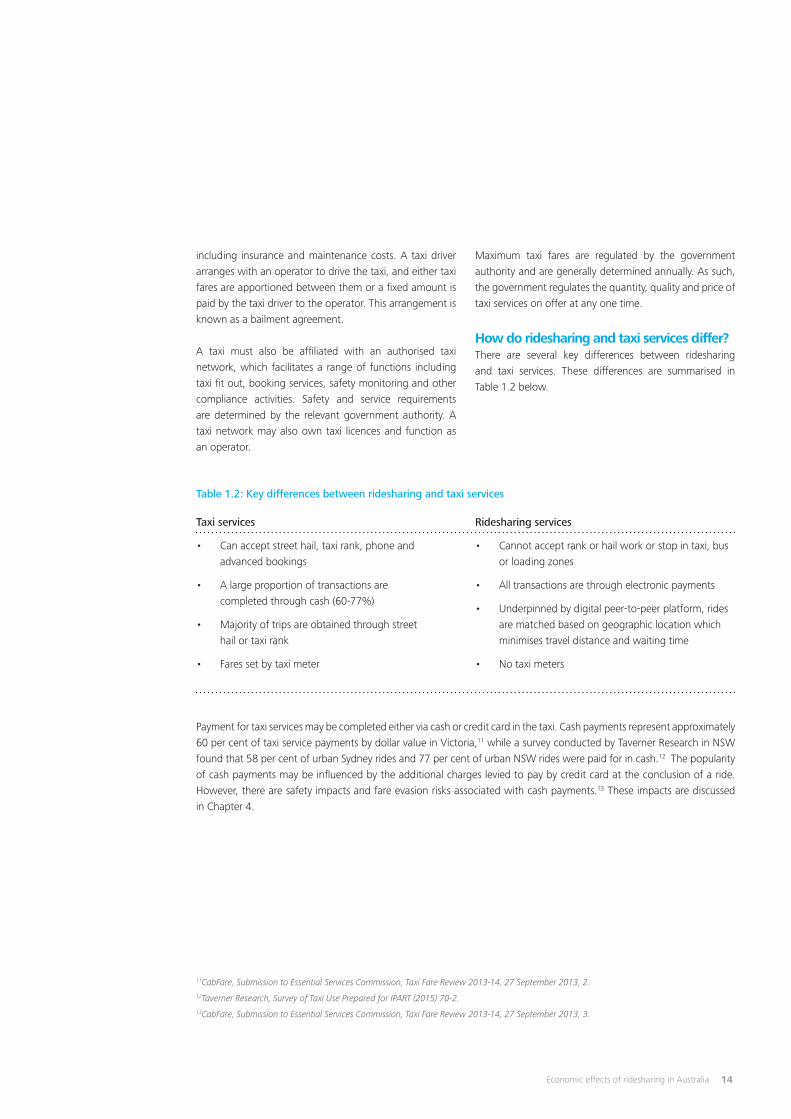
Payment for taxi services may be completed either via cash or credit card in the taxi. Cash payments represent approximately 60 per cent of taxi service payments by dollar value in Victoria,11 while a survey conducted by Taverner Research in NSW found that 58 per cent of urban Sydney rides and 77 per cent of urban NSW rides were paid for in cash.12 The popularity of cash payments may be influenced by the additional charges levied to pay by credit card at the conclusion of a ride. However, there are safety impacts and fare evasion risks associated with cash payments.13 These impacts are discussed in Chapter 4.
Maximum taxi fares are regulated by the government authority and are generally determined annually. As such, the government regulates the quantity, quality and price of taxi services on offer at any one time.
How do ridesharing and taxi services differ?There are several key differences between ridesharing and taxi services. These differences are summarised in Table 1.2 below.
Taxi services
• Can accept street hail, taxi rank, phone and advanced bookings
• A large proportion of transactions are completed through cash (60-77%)
• Majority of trips are obtained through street hail or taxi rank
• Fares set by taxi meter
Ridesharing services
• Cannot accept rank or hail work or stop in taxi, bus or loading zones
• All transactions are through electronic payments
• Underpinned by digital peer-to-peer platform, rides are matched based on geographic location which minimises travel distance and waiting time
• No taxi meters
Table 1.2: Key differences between ridesharing and taxi services
11CabFare, Submission to Essential Services Commission, Taxi Fare Review 2013-14, 27 September 2013, 2.12Taverner Research, Survey of Taxi Use Prepared for IPART (2015) 70-2.13CabFare, Submission to Essential Services Commission, Taxi Fare Review 2013-14, 27 September 2013, 3.
15 Economic effects of ridesharing in Australia
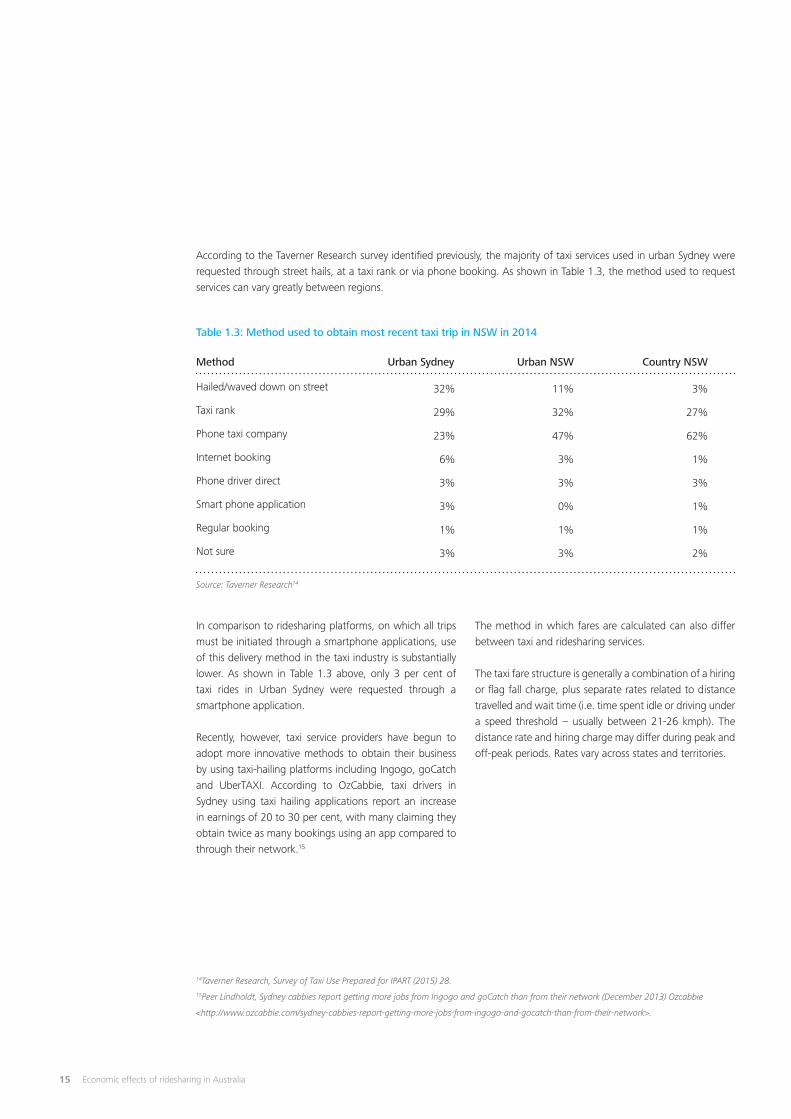
According to the Taverner Research survey identified previously, the majority of taxi services used in urban Sydney were requested through street hails, at a taxi rank or via phone booking. As shown in Table 1.3, the method used to request services can vary greatly between regions.
Hailed/waved down on street
Taxi rank
Phone taxi company
Internet booking
Phone driver direct
Smart phone application
Regular booking
Not sure
32%
29%
23%
6%
3%
3%
1%
3%
11%
32%
47%
3%
3%
0%
1%
3%
3%
27%
62%
1%
3%
1%
1%
2%
Table 1.3: Method used to obtain most recent taxi trip in NSW in 2014
Method Urban Sydney Urban NSW Country NSW
14Taverner Research, Survey of Taxi Use Prepared for IPART (2015) 28.15Peer Lindholdt, Sydney cabbies report getting more jobs from Ingogo and goCatch than from their network (December 2013) Ozcabbie
<http://www.ozcabbie.com/sydney-cabbies-report-getting-more-jobs-from-ingogo-and-gocatch-than-from-their-network>.
In comparison to ridesharing platforms, on which all trips must be initiated through a smartphone applications, use of this delivery method in the taxi industry is substantially lower. As shown in Table 1.3 above, only 3 per cent of taxi rides in Urban Sydney were requested through a smartphone application.
Recently, however, taxi service providers have begun to adopt more innovative methods to obtain their business by using taxi-hailing platforms including Ingogo, goCatch and UberTAXI. According to OzCabbie, taxi drivers in Sydney using taxi hailing applications report an increase in earnings of 20 to 30 per cent, with many claiming they obtain twice as many bookings using an app compared to through their network.15
The method in which fares are calculated can also differ between taxi and ridesharing services.
The taxi fare structure is generally a combination of a hiring or flag fall charge, plus separate rates related to distance travelled and wait time (i.e. time spent idle or driving under a speed threshold – usually between 21-26 kmph). The distance rate and hiring charge may differ during peak and off-peak periods. Rates vary across states and territories.
Source: Taverner Research14
16Economic effects of ridesharing in Australia
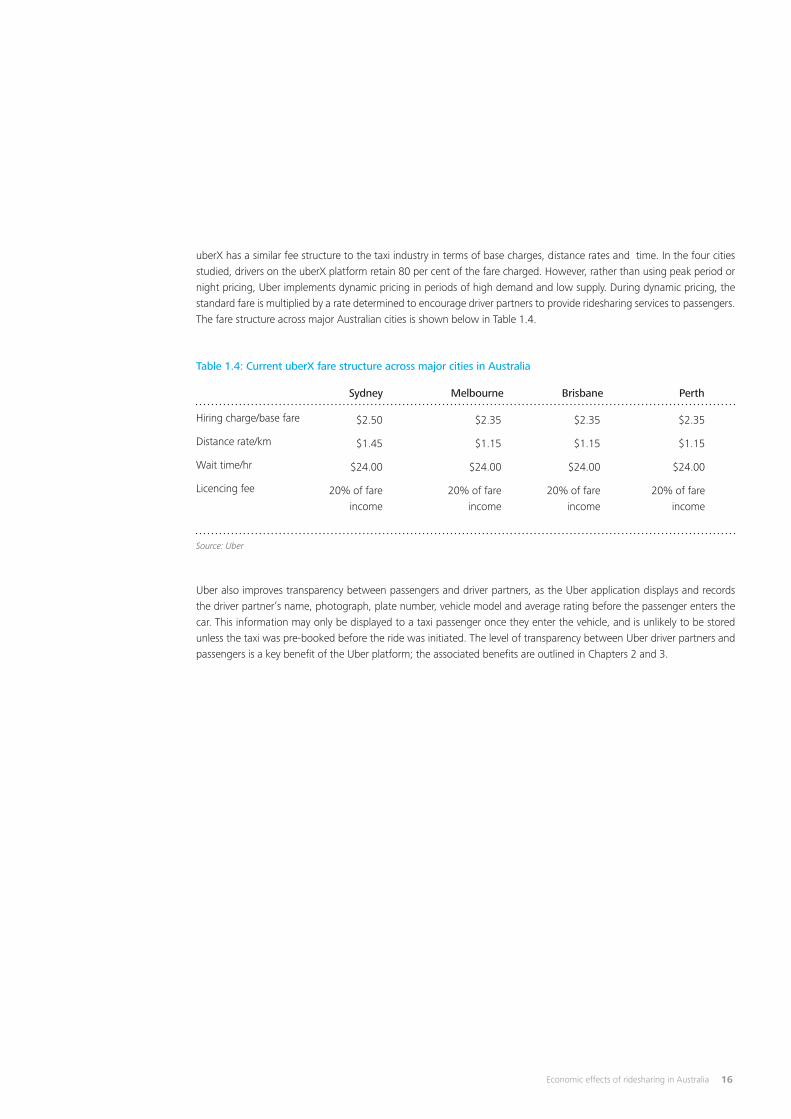
uberX has a similar fee structure to the taxi industry in terms of base charges, distance rates and time. In the four cities studied, drivers on the uberX platform retain 80 per cent of the fare charged. However, rather than using peak period or night pricing, Uber implements dynamic pricing in periods of high demand and low supply. During dynamic pricing, the standard fare is multiplied by a rate determined to encourage driver partners to provide ridesharing services to passengers. The fare structure across major Australian cities is shown below in Table 1.4.
Hiring charge/base fare
Distance rate/km
Wait time/hr
Licencing fee
$2.50
$1.45
$24.00
20% of fare income
$2.35
$1.15
$24.00
20% of fare income
$2.35
$1.15
$24.00
20% of fare income
$2.35
$1.15
$24.00
20% of fare income
Table 1.4: Current uberX fare structure across major cities in Australia
Sydney Melbourne Brisbane Perth
Source: Uber
Uber also improves transparency between passengers and driver partners, as the Uber application displays and records the driver partner’s name, photograph, plate number, vehicle model and average rating before the passenger enters the car. This information may only be displayed to a taxi passenger once they enter the vehicle, and is unlikely to be stored unless the taxi was pre-booked before the ride was initiated. The level of transparency between Uber driver partners and passengers is a key benefit of the Uber platform; the associated benefits are outlined in Chapters 2 and 3.
17 Economic effects of ridesharing in Australia
The Australian industry contextThis section summarises the Australian industry context with respect to point-to-point transport services.
The taxi and limousine industry The taxi and limousine transport industry is forecast to generate $5.5 billion in revenue in Australia in 2014-15, with revenue predicted to rise at a compound annual rate of 2.1 per cent over the next 5 years. 16
Taxi services (booked and non-booked) represent almost 80 per cent of the industry, with the remainder being comprised of wheelchair-accessible taxi services, luxury sedan services and limousine and wedding car services.17
Taxis are generally seen as an alternative to other methods of transport, including private transportation (using a car, bicycle etc.) or public transport.
Consumer demand for discretionary items such as taxis has slowed given the current economic climate. It is suggested by IBISWorld that the high levels of regulatory control in the taxi industry have prevented the adjustment of fare prices to suit lower demand, while the lesser-regulated hire car industry has been able to lower prices in response to changing conditions.18
There were 21,344 taxi licences and approximately 68,152 taxi drivers in Australia as at 31 December 2014 according to the Australian Taxi Industry Association.19 IBISWorld predicts a 2.0 per cent compound annual growth rate in taxi licences over the next five years.20
There are competing factors influencing the number of licences to be issued annually, including population growth, lobbying by licence-owners and the popularity of competing services such as ridesharing. 21
Reviews and inquiries concerning the point-to-point transportation market and taxi industry have frequently led to changes in regulation and market structure.
For example, the 2012 Victorian taxi industry review led by Professor Allan Fels22 resulted in:
• Deregulation of licence numbers
• Adjustment of taxi licence fees to levels that promote an increase in taxi and hire car numbers
• Reduction in service fees through electronic payment of fares (such as Cabcharge) from 10% to 5%
• Removal of restrictions and red tape on pre-booked hire car services, allowing them to provide a broader range of services
• An enhanced, independent and comprehensive exam for new taxi drivers (“The Knowledge”). 23
These outcomes led to changes in other states and territories, with some states capping their electronic payment surcharge at 5 per cent.24 Recently, it was announced by the ACT Government in the 2015 Taxi Industry Innovation Reforms that there would be several changes in the regulation of the taxi industry, including a reduction in licence fees from $20,000 to $10,000 from 30 October 2015, with a further reduction to $5,000 in the following year.25
Reforms were also announced by the NSW Government, which include the removal of regulation for booked services, removing existing perpetual hire car licenses, and implementing an industry adjustment assistance package for taxi license holders.
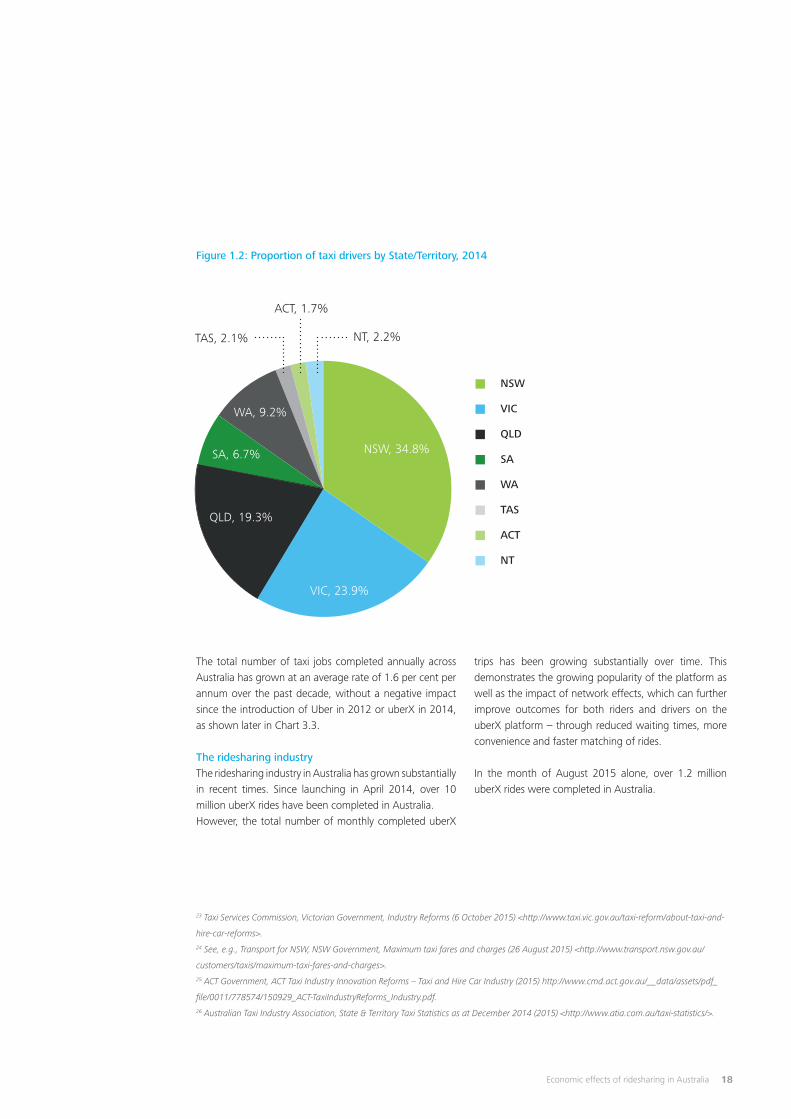
The majority of taxi drivers are based in NSW (23,750) followed by VIC (16,292), QLD (13,158) and WA (6,250), as seen in Figure 1.2.
16 Stephen Gargano, IBISWorld Industry Report I4626: Taxi and Limousine Transport in Australia (IBISWorld, 2015) 5.17 Stephen Gargano, IBISWorld Industry Report I4626: Taxi and Limousine Transport in Australia (IBISWorld, 2015) 12.18 Stephen Gargano, IBISWorld Industry Report I4626: Taxi and Limousine Transport in Australia (IBISWorld, 2015) 4.19 Australian Taxi Industry Association, State & Territory Taxi Statistics as at December 2014 (2015) <http://www.atia.com.au/taxi-statistics/>.20 IBISWorld, IBISWorld Business Environment Report: Taxi licensing (2015) 1.21 IBISWorld, IBISWorld Business Environment Report: Taxi licensing (2015) 2.22 Allan Fels, Final Report – Customers First – Service, Safety, Choice (September 2012) Taxi Services Commission <http://www.taxi.vic.gov.au/__
data/assets/pdf_file/0009/118629/Taxi-Industry-Inquiry-Final-Report.PDF>.
18Economic effects of ridesharing in Australia
TAS, 2.1% NT, 2.2%
NSW
VIC
QLD
SA
WA
TAS
ACT
NT
ACT, 1.7%
VIC, 23.9%
NSW, 34.8%
QLD, 19.3%
SA, 6.7%
WA, 9.2%
Figure 1.2: Proportion of taxi drivers by State/Territory, 2014
The total number of taxi jobs completed annually across Australia has grown at an average rate of 1.6 per cent per annum over the past decade, without a negative impact since the introduction of Uber in 2012 or uberX in 2014, as shown later in Chart 3.3.
The ridesharing industry The ridesharing industry in Australia has grown substantially in recent times. Since launching in April 2014, over 10 million uberX rides have been completed in Australia.However, the total number of monthly completed uberX
23 Taxi Services Commission, Victorian Government, Industry Reforms (6 October 2015) <http://www.taxi.vic.gov.au/taxi-reform/about-taxi-and-
hire-car-reforms>.24 See, e.g., Transport for NSW, NSW Government, Maximum taxi fares and charges (26 August 2015) <http://www.transport.nsw.gov.au/
customers/taxis/maximum-taxi-fares-and-charges>.25 ACT Government, ACT Taxi Industry Innovation Reforms – Taxi and Hire Car Industry (2015) http://www.cmd.act.gov.au/__data/assets/pdf_
file/0011/778574/150929_ACT-TaxiIndustryReforms_Industry.pdf.26 Australian Taxi Industry Association, State & Territory Taxi Statistics as at December 2014 (2015) <http://www.atia.com.au/taxi-statistics/>.
trips has been growing substantially over time. This demonstrates the growing popularity of the platform as well as the impact of network effects, which can further improve outcomes for both riders and drivers on the uberX platform – through reduced waiting times, more convenience and faster matching of rides.
In the month of August 2015 alone, over 1.2 million uberX rides were completed in Australia.
19 Economic effects of ridesharing in Australia
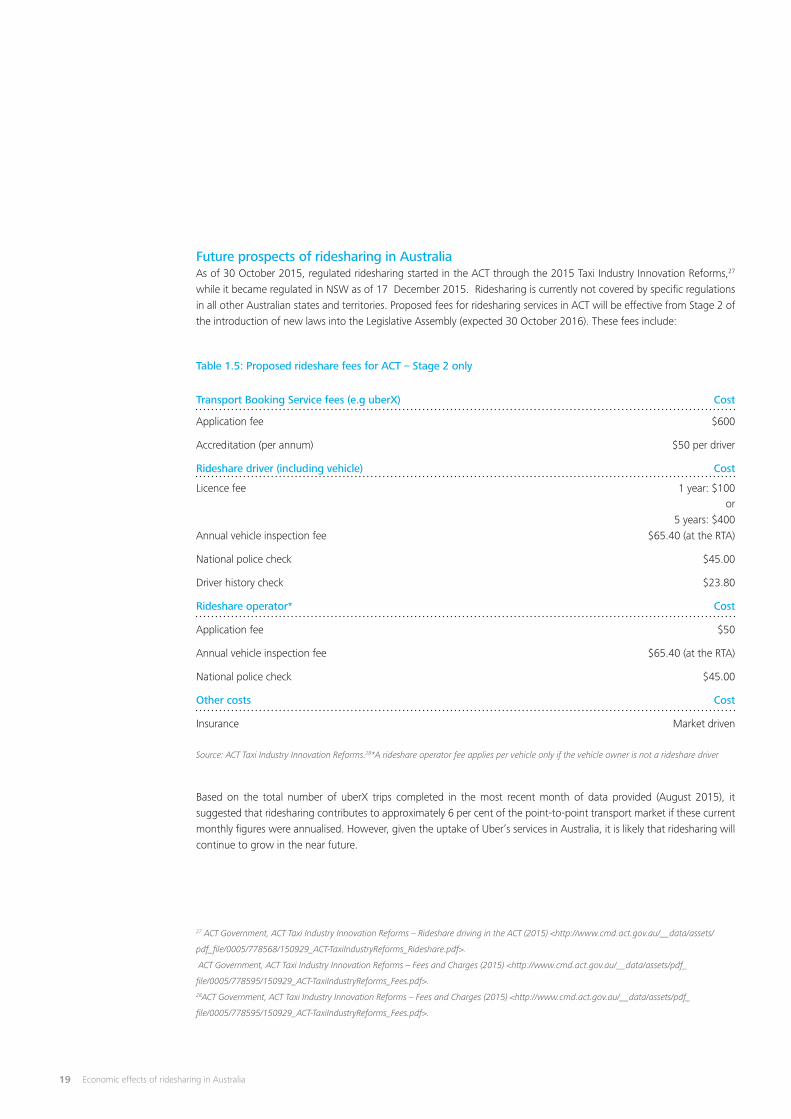
Future prospects of ridesharing in AustraliaAs of 30 October 2015, regulated ridesharing started in the ACT through the 2015 Taxi Industry Innovation Reforms,27 while it became regulated in NSW as of 17 December 2015. Ridesharing is currently not covered by specific regulations in all other Australian states and territories. Proposed fees for ridesharing services in ACT will be effective from Stage 2 of the introduction of new laws into the Legislative Assembly (expected 30 October 2016). These fees include:
27 ACT Government, ACT Taxi Industry Innovation Reforms – Rideshare driving in the ACT (2015) <http://www.cmd.act.gov.au/__data/assets/
pdf_file/0005/778568/150929_ACT-TaxiIndustryReforms_Rideshare.pdf>.
ACT Government, ACT Taxi Industry Innovation Reforms – Fees and Charges (2015) <http://www.cmd.act.gov.au/__data/assets/pdf_
file/0005/778595/150929_ACT-TaxiIndustryReforms_Fees.pdf>.28ACT Government, ACT Taxi Industry Innovation Reforms – Fees and Charges (2015) <http://www.cmd.act.gov.au/__data/assets/pdf_
file/0005/778595/150929_ACT-TaxiIndustryReforms_Fees.pdf>.
Source: ACT Taxi Industry Innovation Reforms.28*A rideshare operator fee applies per vehicle only if the vehicle owner is not a rideshare driver
Application fee $600
Accreditation (per annum) $50 per driver
Rideshare driver (including vehicle) Cost
Licence fee 1 year: $100 or
5 years: $400Annual vehicle inspection fee $65.40 (at the RTA)
National police check $45.00
Driver history check $23.80
Rideshare operator* Cost
Application fee $50
Annual vehicle inspection fee $65.40 (at the RTA)
National police check $45.00
Other costs Cost
Insurance Market driven
Transport Booking Service fees (e.g uberX) Cost
Table 1.5: Proposed rideshare fees for ACT – Stage 2 only
Based on the total number of uberX trips completed in the most recent month of data provided (August 2015), it suggested that ridesharing contributes to approximately 6 per cent of the point-to-point transport market if these current monthly figures were annualised. However, given the uptake of Uber’s services in Australia, it is likely that ridesharing will continue to grow in the near future.
20Economic effects of ridesharing in Australia
Just under 80 per
cent of Uber riders
rated their rides at
5 stars, the highest
possible rating
21 Economic effects of ridesharing in Australia
2 Consumer effects
Ridesharing provides a variety of benefits to consumers who use the service. These benefits primarily arise from the differentiated services, and the average lower cost of ridesharing rides.
Consumer benefits have two primary effects:
Firstly, they encourage consumers to take more rides in the point-to-point transport market than they have previously. These rides grow the size of the point-to-point transport market in Australia because consumers are attracted to enter the market by either the lower price or the different features which ridesharing offers.
Secondly, price and service differences have seen consumers switch to ridesharing from other point-to-point transport services (such as taxis), in which case the overall size of the market remains the same, but there may be net benefits to society because of strong consumer gains.
Overall, Deloitte Access Economics estimates that the net benefits for consumers created by the operation of uberX in Sydney, Melbourne, Brisbane and Perth are worth in the order of $81 million per year at current levels.
This chapter outlines the benefits experienced by consumers arising from the introduction of ridesharing services in Australia. In particular, it quantifies the degree to which Uber has expanded the point-to-point transport market as a whole, and the savings enjoyed by riders due to uberX’s lower average fare.
The economics of ridesharingThis report analyses the impacts of ridesharing on consumers, businesses and the public. While there are many social aspects of the change, this report focuses on economic impacts and therefore we begin by highlighting some of the key economic concepts that help explain the economics of ridesharing.
• Ridesharing uses a digital platform to connect drivers and riders. This lowers transaction costs between buyers and sellers and helps explain why it is a cost effective method of point to point transport.
• Ridesharing has added supply to the point to point transport market; but it does not simply replicate existing market offerings. Hence it has added to competition and provides a differentiated service to traditional players in a regulated market.
• Ridesharing riders do not pay rents for restrictive licences which add to production costs.
• The bidirectional rating system reduces information asymmetries which may provide more efficient decision making by buyers and sellers. This is a different and complementary measure to other ways in which consumers can identify who to buy services from.
• Ridesharing may improve the ability of the point-to-point transport market to efficiently match buyers and sellers. Unlike most markets where price plays a central role in businesses competition, in point to point transport, prices (either in taxis or in ridesharing) are largely set and hence it is connecting people at the right time in the right place that is where competitive forces take shape.
These concepts are used in the analysis below in the impact of ridesharing on consumers, producers and the community.
22Economic effects of ridesharing in Australia
Analysing the effect of the introduction of uberX into the point-to-point transport market requires an estimate of the relative consumer demand of uberX and taxi services. In order to calculate the change in demand resulting from the introduction of Uber, a demand curve for Uber services must be constructed. The construction of a demand curve requires insight into how consumers respond to price changes of a product - also known as price elasticity. Price elasticity reports the change in quantity demanded in response to a unit change in price. For the purposes of this report, we have an elasticity of -2 as our central elasticity based on a range of -1.27 to -3.00. This assumption is considered further in the Appendix.
Expansion of the point-to-point transport marketThe point-to-point transport market in Australia remains dominated by the taxi industry. In 2014, taxis performed a total of 227.2 million rides.29 As seen in Chart 3.3, this figure has continued to increase since the introduction of Uber in Australia.
In contrast, uberX has facilitated approximately 10 million uberX rides in Melbourne, Sydney, Brisbane and Perth since its inception in April 2014. uberX facilitated approximately 1.2 million uberX rides in the month of August 2015 alone, and estimates based on annualising this data suggest that Uber now facilitates 14.5 million rides per year in these four cities. Nevertheless, Uber represents a small portion of the overall market, with an approximate 6 per cent market share in the national point-to-point transport market.
In order to assess the overall impact of Uber on the point-to-point transport market, two effects need to be calculated. The first effect is the attraction of passengers to Uber who would not otherwise have engaged modes of point-to-point transport, while the second effect relates to those users of taxi services who are induced to switch to Uber. The first effect expands the overall size of the market, while the second is a transfer between operators within the market.
Our analysis finds that 61 per cent of uberX rides are new in the point-to-point transport market, induced by either uberX’s differentiated service offering (36 per cent) or price point (25 per cent).
In the sections below, the methodology behind the Deloitte Access Economics analysis is described, in addition to the consumer surplus arising from uberX’s entrance in the Australian point-to-point transport market. Our analysis finds that the total consumer benefit due to Uber in Australia is $81.1 million per year, as explained below.
Quality benefitsUber provides a range of quality benefits due to the differentiated service it provides compared to taxis. In the sections below, the additional consumer surplus enjoyed arising from Uber’s quality benefits is quantified. In addition, the quality benefits which uberX brings to the point-to-point transport market are described in some detail.
Consumer surplusRidesharing services can add social value by offering services which have different characteristics from other players in the point to point transport market which are valued by some customers. If these consumers place a value on these benefits which exceeds the price charged, then a consumer surplus is created well beyond the price paid.
Consumer surplus is measured as the difference between what individuals would be willing to pay for a taxi, an uberX ride or any other good or service, and what they actually paid. If consumers would be willing to pay more than the taxi fare, then they are getting more benefit from the service than they spent to buy it.
29 Excluding Western Australia and Tasmania, for which total rides were not reported.
Australian Taxi Industry Association, State & Territory Taxi Statistics as at December 2014 (2015) <http://www.atia.com.au/taxi-statistics/>.
23 Economic effects of ridesharing in Australia
As Deloitte Access Economics has noted previously in reports on the taxi industry, different segments of the community will have different willingness to pay, depending on the next best available option:
Taxi services are likely to have a relatively high consumer surplus, because in many instances, there are no close substitutes. Many people with mobility restrictions or vision impairment, for example, find it is much more difficult to access other transport alternatives. Likewise, someone hailing a taxi in the rain, or with luggage, may have a higher willingness to pay for a taxi than they would during the day when other transport options are available. For business people, the benefits of the ubiquitous door-to-door taxi services are likely to far outweigh the cost.30
Assuming a linear demand curve, the price elasticity of demand reveals the willingness of consumers to pay for a given good or service at a higher price point. The difference between this willingness to pay and the price charged for a good or service reveals the consumer surplus which is created.
In the case of ridesharing services, some of this consumer surplus can be attributed to the lower price charged for ridesharing compared to taxi services. However, the remaining consumer surplus results from the value which consumers attribute to the differentiated qualities of Uber services compared to other suppliers in the point to point transport market.
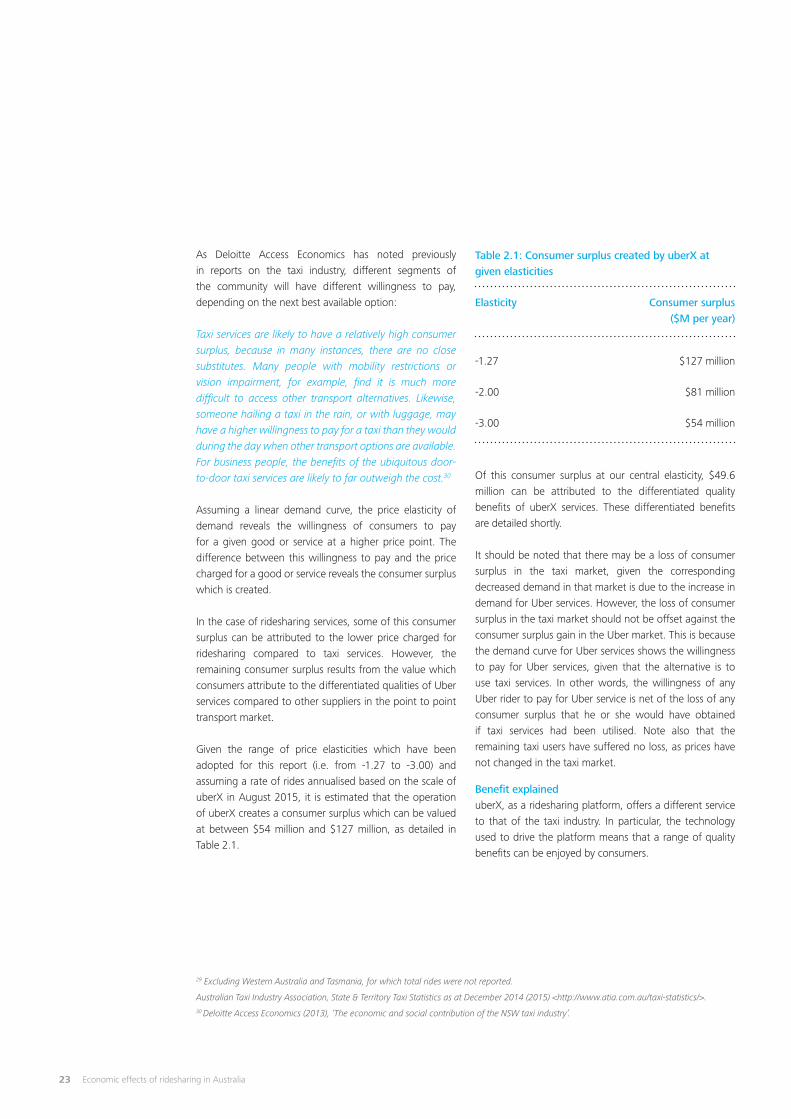
Given the range of price elasticities which have been adopted for this report (i.e. from -1.27 to -3.00) and assuming a rate of rides annualised based on the scale of uberX in August 2015, it is estimated that the operation of uberX creates a consumer surplus which can be valued at between $54 million and $127 million, as detailed in Table 2.1.
Of this consumer surplus at our central elasticity, $49.6 million can be attributed to the differentiated quality benefits of uberX services. These differentiated benefits are detailed shortly.
It should be noted that there may be a loss of consumer surplus in the taxi market, given the corresponding decreased demand in that market is due to the increase in demand for Uber services. However, the loss of consumer surplus in the taxi market should not be offset against the consumer surplus gain in the Uber market. This is because the demand curve for Uber services shows the willingness to pay for Uber services, given that the alternative is to use taxi services. In other words, the willingness of any Uber rider to pay for Uber service is net of the loss of any consumer surplus that he or she would have obtained if taxi services had been utilised. Note also that the remaining taxi users have suffered no loss, as prices have not changed in the taxi market.
Benefit explaineduberX, as a ridesharing platform, offers a different service to that of the taxi industry. In particular, the technology used to drive the platform means that a range of quality benefits can be enjoyed by consumers.
29 Excluding Western Australia and Tasmania, for which total rides were not reported.
Australian Taxi Industry Association, State & Territory Taxi Statistics as at December 2014 (2015) <http://www.atia.com.au/taxi-statistics/>.30 Deloitte Access Economics (2013), ‘The economic and social contribution of the NSW taxi industry’.
Table 2.1: Consumer surplus created by uberX at given elasticities
-1.27 $127 million
-2.00 $81 million
-3.00 $54 million
Elasticity Consumer surplus ($M per year)
24Economic effects of ridesharing in Australia
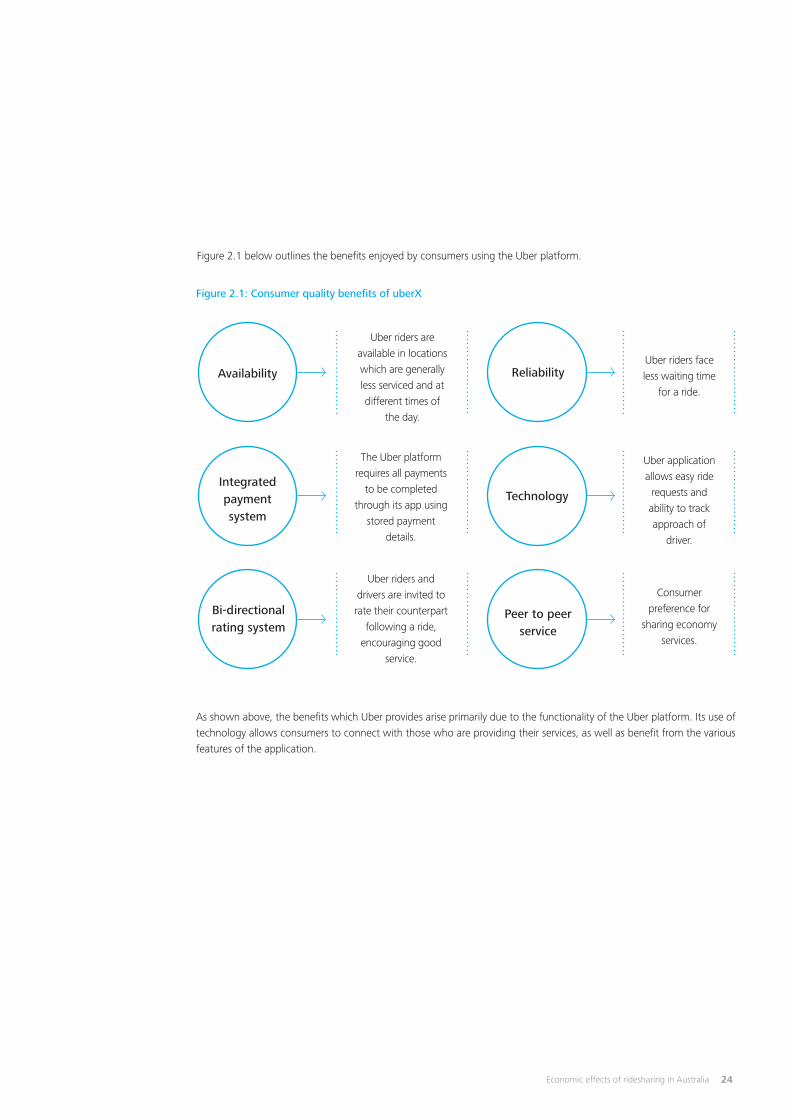
Figure 2.1 below outlines the benefits enjoyed by consumers using the Uber platform.
As shown above, the benefits which Uber provides arise primarily due to the functionality of the Uber platform. Its use of technology allows consumers to connect with those who are providing their services, as well as benefit from the various features of the application.
Figure 2.1: Consumer quality benefits of uberX
Availability
Integrated payment system
Bi-directional rating system
Reliability
Technology
Peer to peer service
Uber riders are available in locations which are generally less serviced and at different times of
the day.
The Uber platform requires all payments
to be completed through its app using
stored payment details.
Uber riders and drivers are invited to rate their counterpart
following a ride, encouraging good
service.
Uber riders face less waiting time
for a ride.
Uber application allows easy ride
requests and ability to track approach of
driver.
Consumer preference for
sharing economy services.
25 Economic effects of ridesharing in Australia
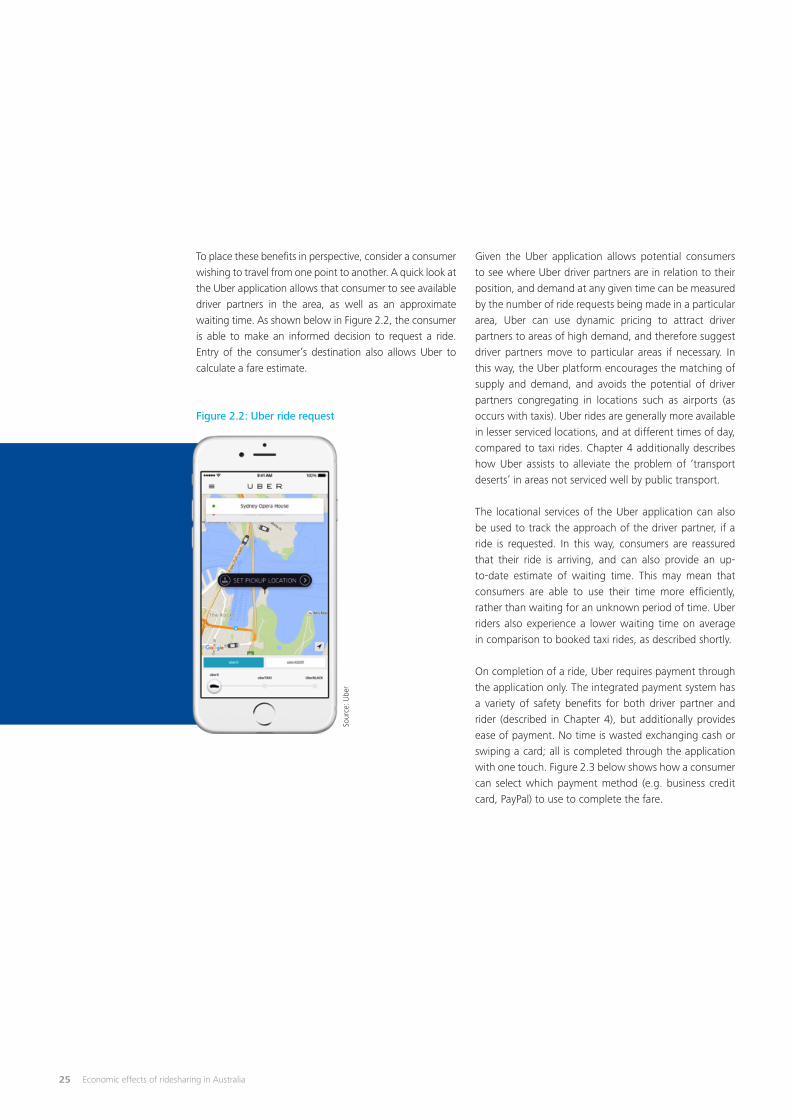
To place these benefits in perspective, consider a consumer wishing to travel from one point to another. A quick look at the Uber application allows that consumer to see available driver partners in the area, as well as an approximate waiting time. As shown below in Figure 2.2, the consumer is able to make an informed decision to request a ride. Entry of the consumer’s destination also allows Uber to calculate a fare estimate.
Figure 2.2: Uber ride request
Sour
ce: U
ber
Given the Uber application allows potential consumers to see where Uber driver partners are in relation to their position, and demand at any given time can be measured by the number of ride requests being made in a particular area, Uber can use dynamic pricing to attract driver partners to areas of high demand, and therefore suggest driver partners move to particular areas if necessary. In this way, the Uber platform encourages the matching of supply and demand, and avoids the potential of driver partners congregating in locations such as airports (as occurs with taxis). Uber rides are generally more available in lesser serviced locations, and at different times of day, compared to taxi rides. Chapter 4 additionally describes how Uber assists to alleviate the problem of ‘transport deserts’ in areas not serviced well by public transport.
The locational services of the Uber application can also be used to track the approach of the driver partner, if a ride is requested. In this way, consumers are reassured that their ride is arriving, and can also provide an up-to-date estimate of waiting time. This may mean that consumers are able to use their time more efficiently, rather than waiting for an unknown period of time. Uber riders also experience a lower waiting time on average in comparison to booked taxi rides, as described shortly.
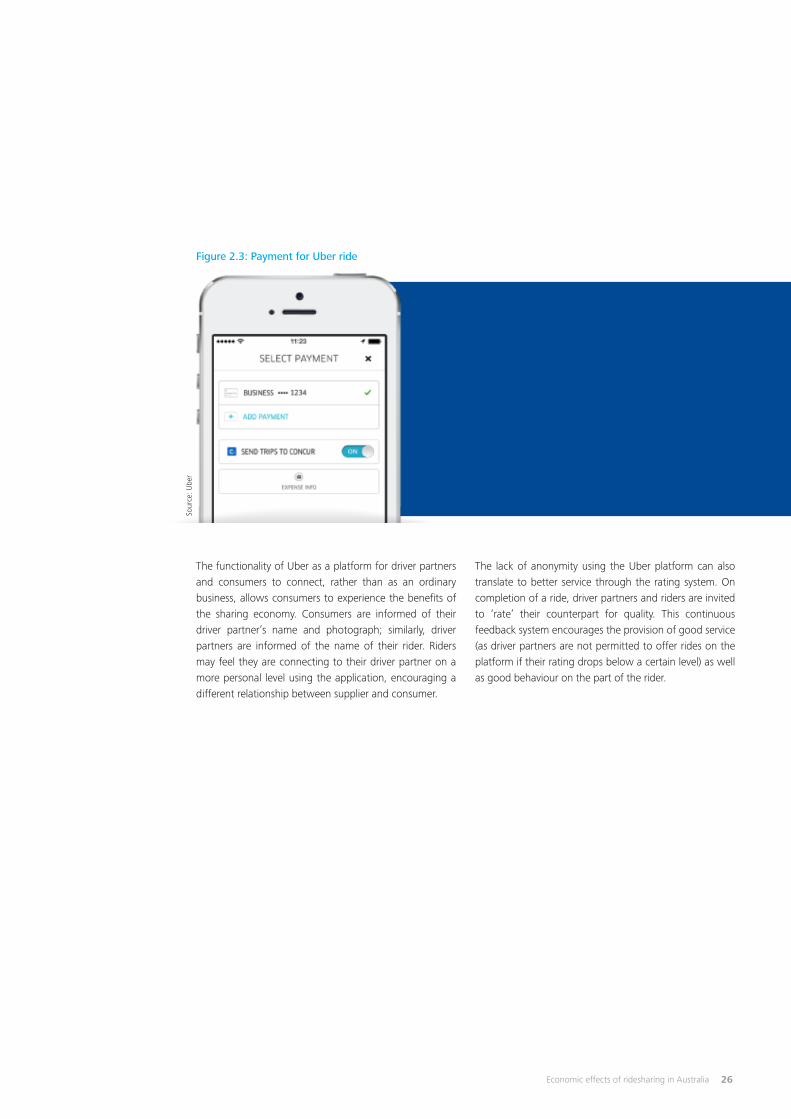
On completion of a ride, Uber requires payment through the application only. The integrated payment system has a variety of safety benefits for both driver partner and rider (described in Chapter 4), but additionally provides ease of payment. No time is wasted exchanging cash or swiping a card; all is completed through the application with one touch. Figure 2.3 below shows how a consumer can select which payment method (e.g. business credit card, PayPal) to use to complete the fare.
26Economic effects of ridesharing in Australia
Figure 2.3: Payment for Uber ride
Sour
ce: U
ber
The functionality of Uber as a platform for driver partners and consumers to connect, rather than as an ordinary business, allows consumers to experience the benefits of the sharing economy. Consumers are informed of their driver partner’s name and photograph; similarly, driver partners are informed of the name of their rider. Riders may feel they are connecting to their driver partner on a more personal level using the application, encouraging a different relationship between supplier and consumer.
The lack of anonymity using the Uber platform can also translate to better service through the rating system. On completion of a ride, driver partners and riders are invited to ‘rate’ their counterpart for quality. This continuous feedback system encourages the provision of good service (as driver partners are not permitted to offer rides on the platform if their rating drops below a certain level) as well as good behaviour on the part of the rider.
27 Economic effects of ridesharing in Australia
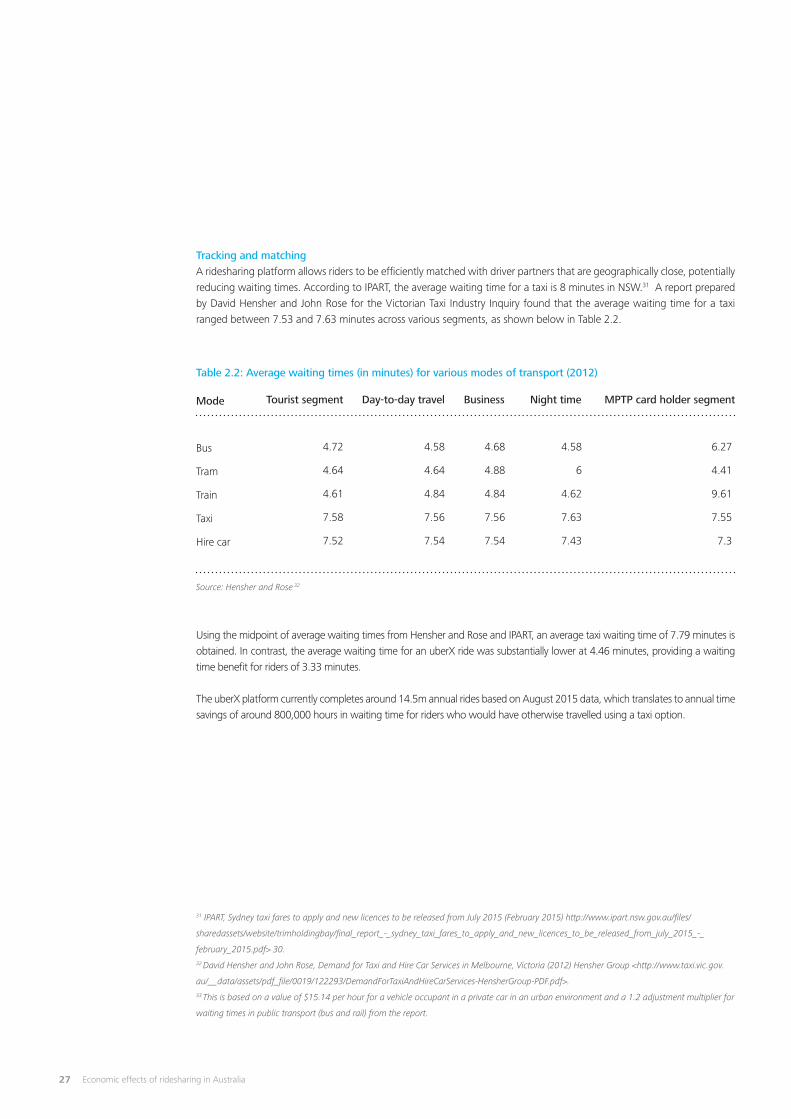
Tracking and matchingA ridesharing platform allows riders to be efficiently matched with driver partners that are geographically close, potentially reducing waiting times. According to IPART, the average waiting time for a taxi is 8 minutes in NSW.31 A report prepared by David Hensher and John Rose for the Victorian Taxi Industry Inquiry found that the average waiting time for a taxi ranged between 7.53 and 7.63 minutes across various segments, as shown below in Table 2.2.
Mode
Bus
Tram
Train
Taxi
Hire car
4.72
4.64
4.61
7.58
7.52
4.58
4.64
4.84
7.56
7.54
4.68
4.88
4.84
7.56
7.54
4.58
6
4.62
7.63
7.43
6.27
4.41
9.61
7.55
7.3
Table 2.2: Average waiting times (in minutes) for various modes of transport (2012)
Tourist segment Day-to-day travel Business Night time MPTP card holder segment
Source: Hensher and Rose 32
Using the midpoint of average waiting times from Hensher and Rose and IPART, an average taxi waiting time of 7.79 minutes is obtained. In contrast, the average waiting time for an uberX ride was substantially lower at 4.46 minutes, providing a waiting time benefit for riders of 3.33 minutes.
The uberX platform currently completes around 14.5m annual rides based on August 2015 data, which translates to annual time savings of around 800,000 hours in waiting time for riders who would have otherwise travelled using a taxi option.
31 IPART, Sydney taxi fares to apply and new licences to be released from July 2015 (February 2015) http://www.ipart.nsw.gov.au/files/
sharedassets/website/trimholdingbay/final_report_-_sydney_taxi_fares_to_apply_and_new_licences_to_be_released_from_july_2015_-_
february_2015.pdf> 30.32 David Hensher and John Rose, Demand for Taxi and Hire Car Services in Melbourne, Victoria (2012) Hensher Group <http://www.taxi.vic.gov.
au/__data/assets/pdf_file/0019/122293/DemandForTaxiAndHireCarServices-HensherGroup-PDF.pdf>.33 This is based on a value of $15.14 per hour for a vehicle occupant in a private car in an urban environment and a 1.2 adjustment multiplier for
waiting times in public transport (bus and rail) from the report.
28Economic effects of ridesharing in Australia
Using a value of waiting time in private cars of $18.17 per hour based on the 2013 “Principles and Guidelines for Economic Appraisal of Transport Investment and Initiatives” document from Transport for NSW, 33 we obtain an annual benefit of $14.6 million and a lifetime net present value benefit of $208.2 million using a 7% discount rate.
There is additionally a lower cancellation rate for ridesharing than occurs in the taxi industry. Based on all uberX trips between April 2014 and August 2015, only 1.51 per cent of total rides were cancelled. Approximately 0.78 per cent and 0.73 per cent of rides were cancelled by driver partners and riders respectively.
There is a cost attached to both riders and driver partners to discourage cancellations and ‘no shows’ on the uberX platform. If a driver partner’s acceptance rate drops below an acceptable level, Uber may de-activate the driver partner from the platform. For riders, any cancellation 5 minutes after a ride has been matched leads to a $5 cancellation penalty ($10 on UberBLACK).
Other taxi-hailing apps, including Ingogo, also attach a cancellation penalty. If a taxi driver has accepted a hail job or advanced booking from Ingogo, a cancellation fee of $10 will be charged and payable to the next driver who accepts the job as a bonus.
34 Taverner Research, Survey of Taxi Use Prepared for IPART (2015) 61.35 Allan Fels, Final Report – Customers First – Service, Safety, Choice (September 2012) Taxi Services Commission <http://www.taxi.vic.gov.au/__
data/assets/pdf_file/0009/118629/Taxi-Industry-Inquiry-Final-Report.PDF> 122.
Another issue commonly identified in the taxi industry is refusal to take passengers to their destination if it is not convenient or lucrative. In a survey conducted by Taverner Research, 16 per cent of urban Sydney respondents who reported a problem with taxi use in the past 12 months said the driver refused to take them to their destination once notified.34 This issue was also identified in the Victorian Taxi Industry Inquiry, where concerns were raised in submissions that independent permit holders (who may not be subject to the same regulatory overheads) may ‘cherry pick’ lucrative work.35
In contrast, drivers on the Uber platform are not shown the destination of ride requests before acceptance, making it difficult to ‘cherry pick’ rides. In addition, cancellation once a ride is accepted may lead to negative ratings, which can eventually lead to removal from the platform.
29 Economic effects of ridesharing in Australia
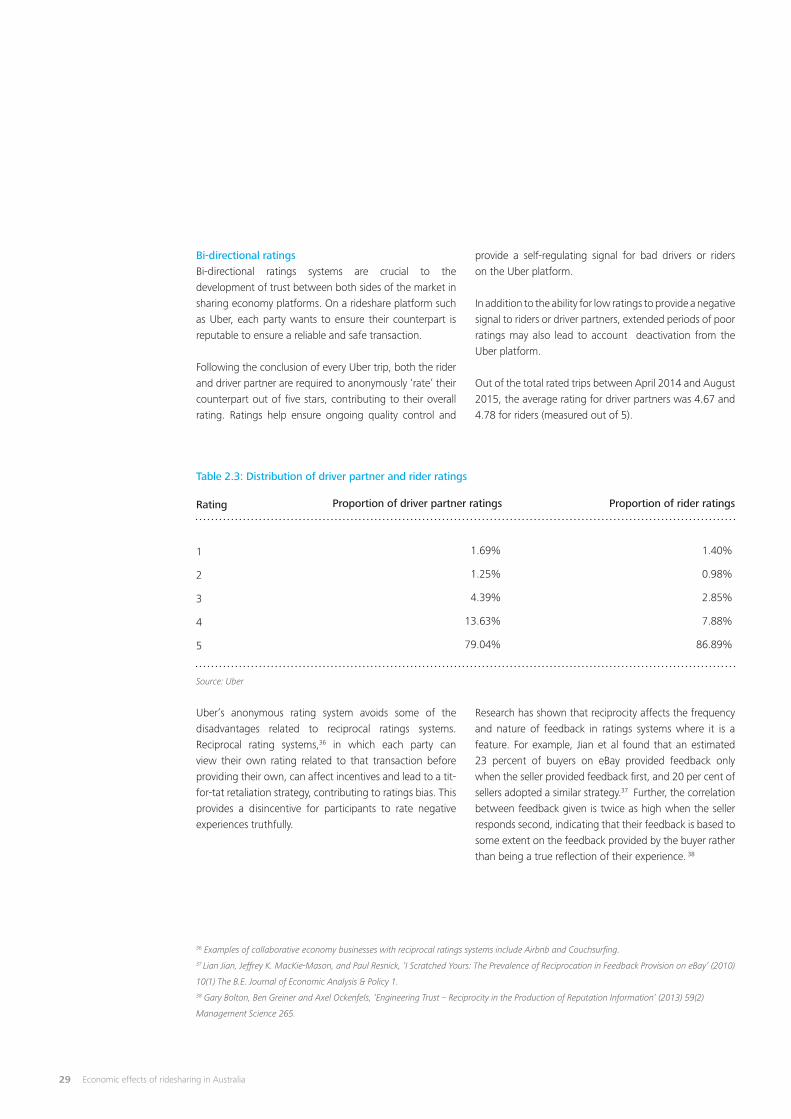
Bi-directional ratingsBi-directional ratings systems are crucial to the development of trust between both sides of the market in sharing economy platforms. On a rideshare platform such as Uber, each party wants to ensure their counterpart is reputable to ensure a reliable and safe transaction.
Following the conclusion of every Uber trip, both the rider and driver partner are required to anonymously ‘rate’ their counterpart out of five stars, contributing to their overall rating. Ratings help ensure ongoing quality control and
Rating
1
2
3
4
5
1.69%
1.25%
4.39%
13.63%
79.04%
1.40%
0.98%
2.85%
7.88%
86.89%
Table 2.3: Distribution of driver partner and rider ratings
Proportion of driver partner ratings Proportion of rider ratings
Source: Uber
provide a self-regulating signal for bad drivers or riders on the Uber platform.
In addition to the ability for low ratings to provide a negative signal to riders or driver partners, extended periods of poor ratings may also lead to account deactivation from the Uber platform.
Out of the total rated trips between April 2014 and August 2015, the average rating for driver partners was 4.67 and 4.78 for riders (measured out of 5).
Uber’s anonymous rating system avoids some of the disadvantages related to reciprocal ratings systems. Reciprocal rating systems,36 in which each party can view their own rating related to that transaction before providing their own, can affect incentives and lead to a tit-for-tat retaliation strategy, contributing to ratings bias. This provides a disincentive for participants to rate negative experiences truthfully.
Research has shown that reciprocity affects the frequency and nature of feedback in ratings systems where it is a feature. For example, Jian et al found that an estimated 23 percent of buyers on eBay provided feedback only when the seller provided feedback first, and 20 per cent of sellers adopted a similar strategy.37 Further, the correlation between feedback given is twice as high when the seller responds second, indicating that their feedback is based to some extent on the feedback provided by the buyer rather than being a true reflection of their experience. 38
36 Examples of collaborative economy businesses with reciprocal ratings systems include Airbnb and Couchsurfing.37 Lian Jian, Jeffrey K. MacKie-Mason, and Paul Resnick, ‘I Scratched Yours: The Prevalence of Reciprocation in Feedback Provision on eBay’ (2010)
10(1) The B.E. Journal of Economic Analysis & Policy 1.38 Gary Bolton, Ben Greiner and Axel Ockenfels, ‘Engineering Trust – Reciprocity in the Production of Reputation Information’ (2013) 59(2)
Management Science 265.
30Economic effects of ridesharing in Australia
City
Sydney 22.44
Melbourne 23.10
Brisbane 21.11
Perth 22.64
Weighted average 22.41
28.38
27.18
28.56
27.98
27.94
20.93%
15.01%
26.09%
19.09%
19.77%
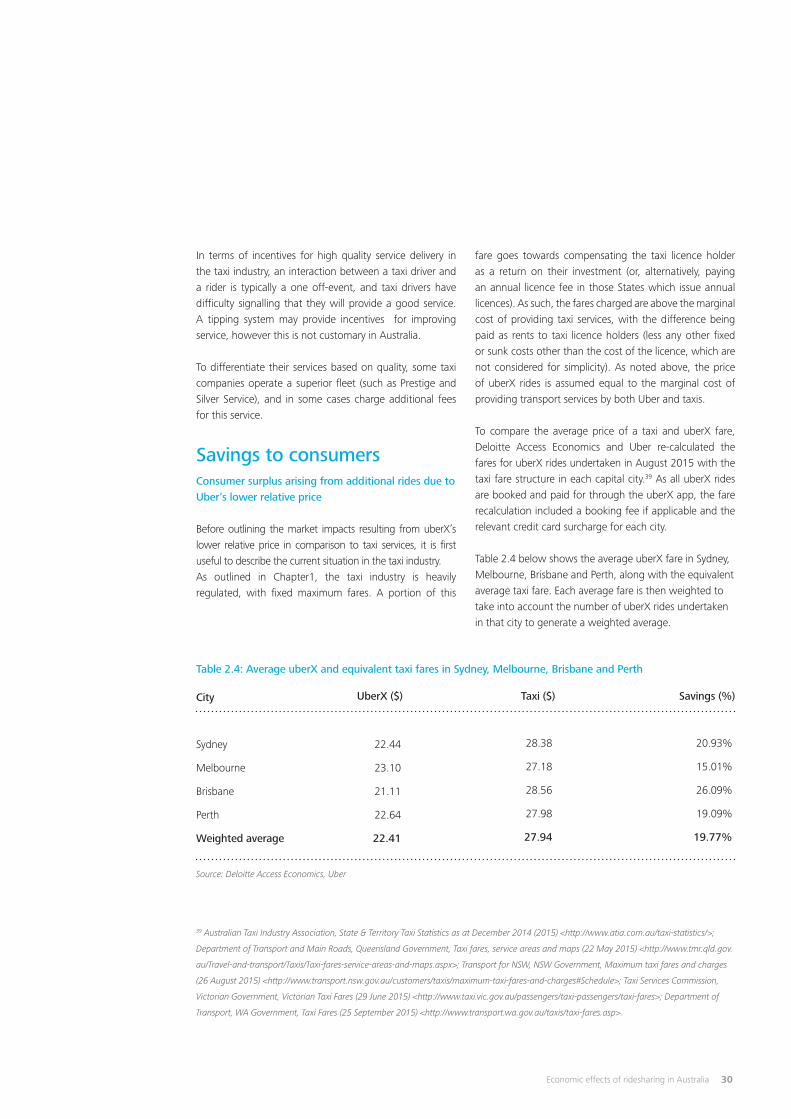
Table 2.4: Average uberX and equivalent taxi fares in Sydney, Melbourne, Brisbane and Perth
UberX ($) Taxi ($) Savings (%)
Source: Deloitte Access Economics, Uber
In terms of incentives for high quality service delivery in the taxi industry, an interaction between a taxi driver and a rider is typically a one off-event, and taxi drivers have difficulty signalling that they will provide a good service. A tipping system may provide incentives for improving service, however this is not customary in Australia. To differentiate their services based on quality, some taxi companies operate a superior fleet (such as Prestige and Silver Service), and in some cases charge additional fees for this service.
Savings to consumersConsumer surplus arising from additional rides due to Uber’s lower relative price
Before outlining the market impacts resulting from uberX’s lower relative price in comparison to taxi services, it is first useful to describe the current situation in the taxi industry.As outlined in Chapter1, the taxi industry is heavily regulated, with fixed maximum fares. A portion of this
39 Australian Taxi Industry Association, State & Territory Taxi Statistics as at December 2014 (2015) <http://www.atia.com.au/taxi-statistics/>;
Department of Transport and Main Roads, Queensland Government, Taxi fares, service areas and maps (22 May 2015) <http://www.tmr.qld.gov.
au/Travel-and-transport/Taxis/Taxi-fares-service-areas-and-maps.aspx>; Transport for NSW, NSW Government, Maximum taxi fares and charges
(26 August 2015) <http://www.transport.nsw.gov.au/customers/taxis/maximum-taxi-fares-and-charges#Schedule>; Taxi Services Commission,
Victorian Government, Victorian Taxi Fares (29 June 2015) <http://www.taxi.vic.gov.au/passengers/taxi-passengers/taxi-fares>; Department of
Transport, WA Government, Taxi Fares (25 September 2015) <http://www.transport.wa.gov.au/taxis/taxi-fares.asp>.
fare goes towards compensating the taxi licence holder as a return on their investment (or, alternatively, paying an annual licence fee in those States which issue annual licences). As such, the fares charged are above the marginal cost of providing taxi services, with the difference being paid as rents to taxi licence holders (less any other fixed or sunk costs other than the cost of the licence, which are not considered for simplicity). As noted above, the price of uberX rides is assumed equal to the marginal cost of providing transport services by both Uber and taxis.
To compare the average price of a taxi and uberX fare, Deloitte Access Economics and Uber re-calculated the fares for uberX rides undertaken in August 2015 with the taxi fare structure in each capital city.39 As all uberX rides are booked and paid for through the uberX app, the fare recalculation included a booking fee if applicable and the relevant credit card surcharge for each city.
Table 2.4 below shows the average uberX fare in Sydney, Melbourne, Brisbane and Perth, along with the equivalent average taxi fare. Each average fare is then weighted to take into account the number of uberX rides undertaken in that city to generate a weighted average.
31 Economic effects of ridesharing in Australia
It can be seen that the average price of uberX services is less than the average fare paid for a taxi. This price difference encourages those who were otherwise priced out of the taxi market (i.e. those who were not willing to pay $27.94, but are willing to pay between $22.41 and $27.94) to use uberX. It should be noted not all of these consumers are existing taxi users; rather, many are new entrants in the point-to-point transport market and therefore increase the overall size of the market.
The total benefit enjoyed by these consumers can be calculated using the price elasticity calculated previously, as in effect we are estimating additional demand due to a price change.
Savings arising from cheaper average faresIn order to calculate the total savings to consumers, it is necessary to compare the average taxi fares and average Uber fares found in Table 2.4.
The savings enjoyed by those consumers who switch from taxi services to Uber is equal to the difference in price between uberX and taxi services, multiplied by the number of rides undertaken in a year which are switched from taxis. Consistent with the other parts of this study, data in August 2015 has been annualised to come to the annual number of uberX rides undertaken. The total savings enjoyed by uberX riders in one year is equal to $31.5 million per year.
Total consumer benefitThe total consumer benefit due to the entrance of Uber in Australia includes the consumer surplus amounts outlined previously, in addition to the savings enjoyed by those who would have ordinarily used taxi services but who now pay lesser fares on average.
Table 2.5: Consumer benefit from uberX’s operations
Cohort Consumer benefit
Consumer surplus created by differentiated quality and additional rides in the point-to-point transport market $49.6 million
Savings enjoyed by those who switch to Uber from using other point-to-point transport services $31.5 million
Total consumer benefit $81.1 million
Source: Deloitte Access Economics
While consumers benefit from the entry of ridesharing into the point-to-point transport market, to the extent that the growth of ridesharing arises from substituting for taxis, rents received by taxi licence holders may reduce. Under certain assumptions about the costs of point-to-point transport services, savings derived by consumers will also result in losses in economic rent in the taxi market, but at any time there may be a range of other factors also affecting taxi licence rents.
This estimate is provided on the basis that uberX facilitates 14.5 million rides per year, and therefore assumes no further growth in the Uber business. If Uber’s expansion continues, the total gain may be greater.
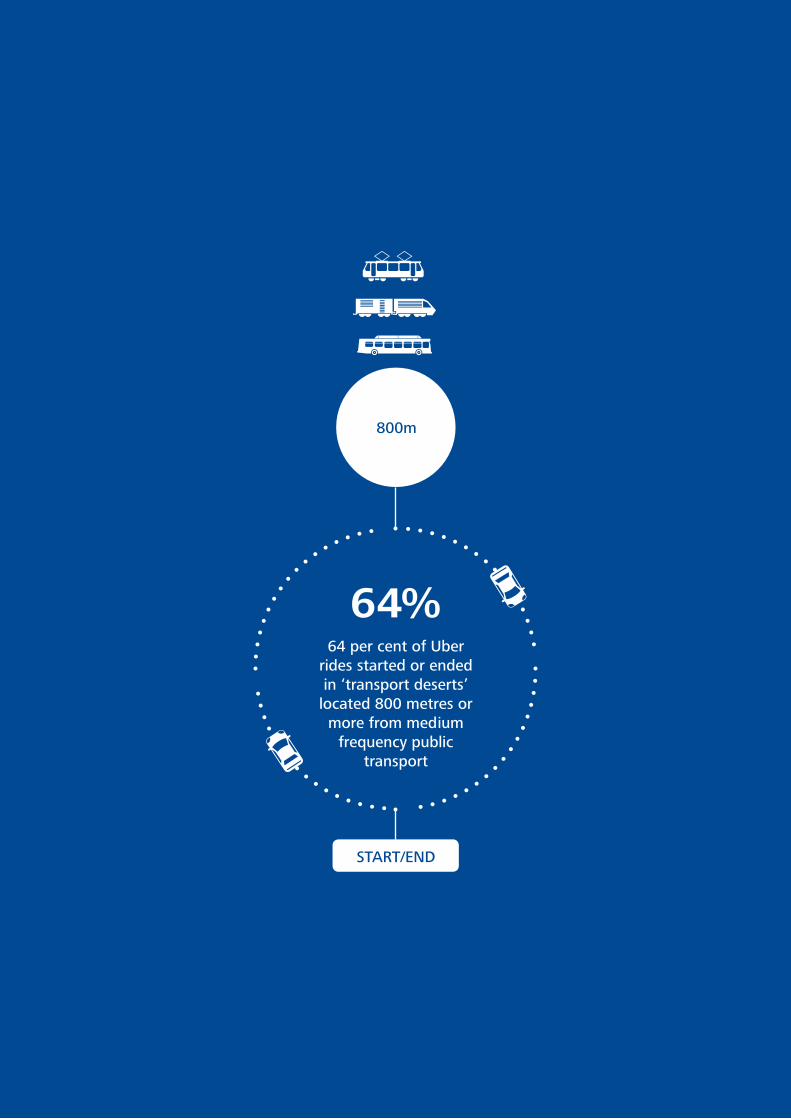
32Economic effects of ridesharing in Australia
64 per cent of Uber rides started or ended in ‘transport deserts’
located 800 metres or more from medium
frequency public transport
64%
800m
START/END
33 Economic effects of ridesharing in Australia
Drivers on the Uber platformRegulation may result in a less competitive taxi market. In regions where a fixed number of taxi licences are available, capacity is limited and shortages may occur. High licensing and administrative fees can affect drivers in the form of lower real wages. Additionally, bailment fees (between 50-55 per cent in various states) and rigid taxi shifts affect a driver’s ability to engage in a second job to supplement their income. In contrast, the flexible working hours and lower fees (20 per cent) on the Uber platform can attract additional workers to enter the point-to-point transport industry through an upwards shift in the labour supply curve. On the other hand, drivers on the uberX platform must provide an asset to fund their driving and pay for their own fuel and maintenance.
Uber can assist members of society who are not able to enter the job market, are underemployed, or have transitioned from another industry to a more favourable labour role.
Driver partner earningsAs at the end of August 2015, the uberX platform had 12,680 active drivers in the cities of Sydney, Melbourne, Perth and Brisbane. This is in contrast to 68,152 taxi drivers at the end of 2014.40
Based on the level of uberX’s operations in August 2015, drivers on the uberX platform in Sydney, Melbourne, Brisbane and Perth will receive around $260 million in fares per year, net of the licensing fee paid to Uber. It is important to note that driver partners are responsible for the cost of fuel and maintaining the vehicle, taxation which falls due and for the fixed cost of owning the vehicle.
Flexibility benefitsAlthough the number of drivers on the Uber platform is substantial compared to the taxi industry, their average weekly commitment in hours is much lower than the typical taxi driver. The average driver on the uberX platform works for 19 hours per week, compared to an average 45.6 hours for taxi drivers.41 As the uberX platform permits flexible work hours, drivers may use uberX to supplement their income and avoid underemployment, or have a larger weekly commitment if unemployed. More than $4 million in driver partner earnings went to the 30 postcodes with Sydney’s highest unemployment in uberX’s first 12 months of operation.42
40 ATIA Taxi Statistics are released as of the end of each calendar year. Taxi statistics do not fluctuate significantly from year to year as it is a
mature market.
Australian Taxi Industry Association, State & Territory Taxi Statistics as at December 2014 (2015) <http://www.atia.com.au/taxi-statistics/>.41 Open Universities Australia, Career Advice – Taxi Drivers <https://www.open.edu.au/careers/transport/taxi-drivers>.42 Uber, One Year, One Million Rides (7 May 2015) <https://newsroom.uber.com/sydney/2015/05/one-year-one-million-rides-2/>.
3 Producer effects
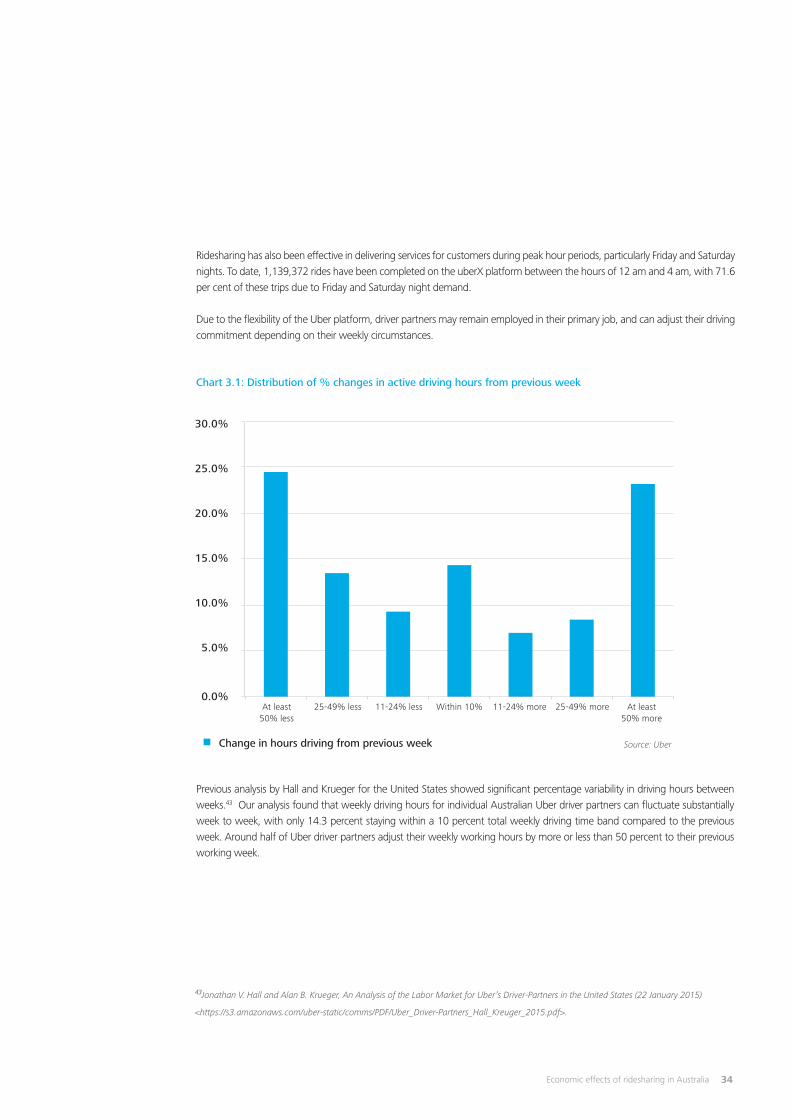
34Economic effects of ridesharing in Australia
43Jonathan V. Hall and Alan B. Krueger, An Analysis of the Labor Market for Uber’s Driver-Partners in the United States (22 January 2015)
<https://s3.amazonaws.com/uber-static/comms/PDF/Uber_Driver-Partners_Hall_Kreuger_2015.pdf>.
Ridesharing has also been effective in delivering services for customers during peak hour periods, particularly Friday and Saturday nights. To date, 1,139,372 rides have been completed on the uberX platform between the hours of 12 am and 4 am, with 71.6 per cent of these trips due to Friday and Saturday night demand.
Due to the flexibility of the Uber platform, driver partners may remain employed in their primary job, and can adjust their driving commitment depending on their weekly circumstances.
Chart 3.1: Distribution of % changes in active driving hours from previous week
Change in hours driving from previous week Source: Uber
Previous analysis by Hall and Krueger for the United States showed significant percentage variability in driving hours between weeks.43 Our analysis found that weekly driving hours for individual Australian Uber driver partners can fluctuate substantially week to week, with only 14.3 percent staying within a 10 percent total weekly driving time band compared to the previous week. Around half of Uber driver partners adjust their weekly working hours by more or less than 50 percent to their previous working week.
30.0%
25.0%
20.0%
15.0%
10.0%
5.0%
0.0%At least
50% lessAt least
50% more25-49% less 11-24% less Within 10% 11-24% more 25-49% more
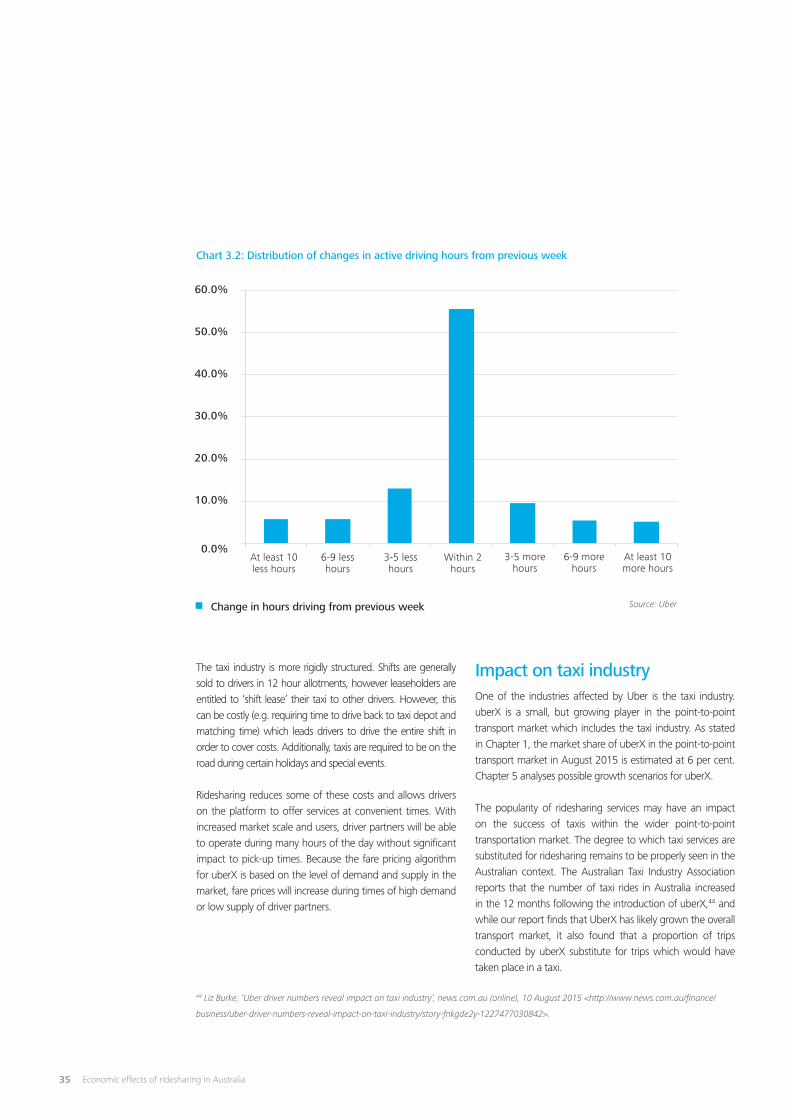
35 Economic effects of ridesharing in Australia
Chart 3.2: Distribution of changes in active driving hours from previous week
The taxi industry is more rigidly structured. Shifts are generally sold to drivers in 12 hour allotments, however leaseholders are entitled to ‘shift lease’ their taxi to other drivers. However, this can be costly (e.g. requiring time to drive back to taxi depot and matching time) which leads drivers to drive the entire shift in order to cover costs. Additionally, taxis are required to be on the road during certain holidays and special events.
Ridesharing reduces some of these costs and allows drivers on the platform to offer services at convenient times. With increased market scale and users, driver partners will be able to operate during many hours of the day without significant impact to pick-up times. Because the fare pricing algorithm for uberX is based on the level of demand and supply in the market, fare prices will increase during times of high demand or low supply of driver partners.
Change in hours driving from previous week Source: Uber
Impact on taxi industryOne of the industries affected by Uber is the taxi industry. uberX is a small, but growing player in the point-to-point transport market which includes the taxi industry. As stated in Chapter 1, the market share of uberX in the point-to-point transport market in August 2015 is estimated at 6 per cent. Chapter 5 analyses possible growth scenarios for uberX.
The popularity of ridesharing services may have an impact on the success of taxis within the wider point-to-point transportation market. The degree to which taxi services are substituted for ridesharing remains to be properly seen in the Australian context. The Australian Taxi Industry Association reports that the number of taxi rides in Australia increased in the 12 months following the introduction of uberX,44 and while our report finds that UberX has likely grown the overall transport market, it also found that a proportion of trips conducted by uberX substitute for trips which would have taken place in a taxi.
44 Liz Burke, ‘Uber driver numbers reveal impact on taxi industry’, news.com.au (online), 10 August 2015 <http://www.news.com.au/finance/
business/uber-driver-numbers-reveal-impact-on-taxi-industry/story-fnkgde2y-1227477030842>.
60.0%
50.0%
40.0%
30.0%
20.0%
10.0%
0.0%At least 10less hours
6-9 less hours
3-5 less hours
Within 2 hours
3-5 morehours
6-9 morehours
At least 10 more hours
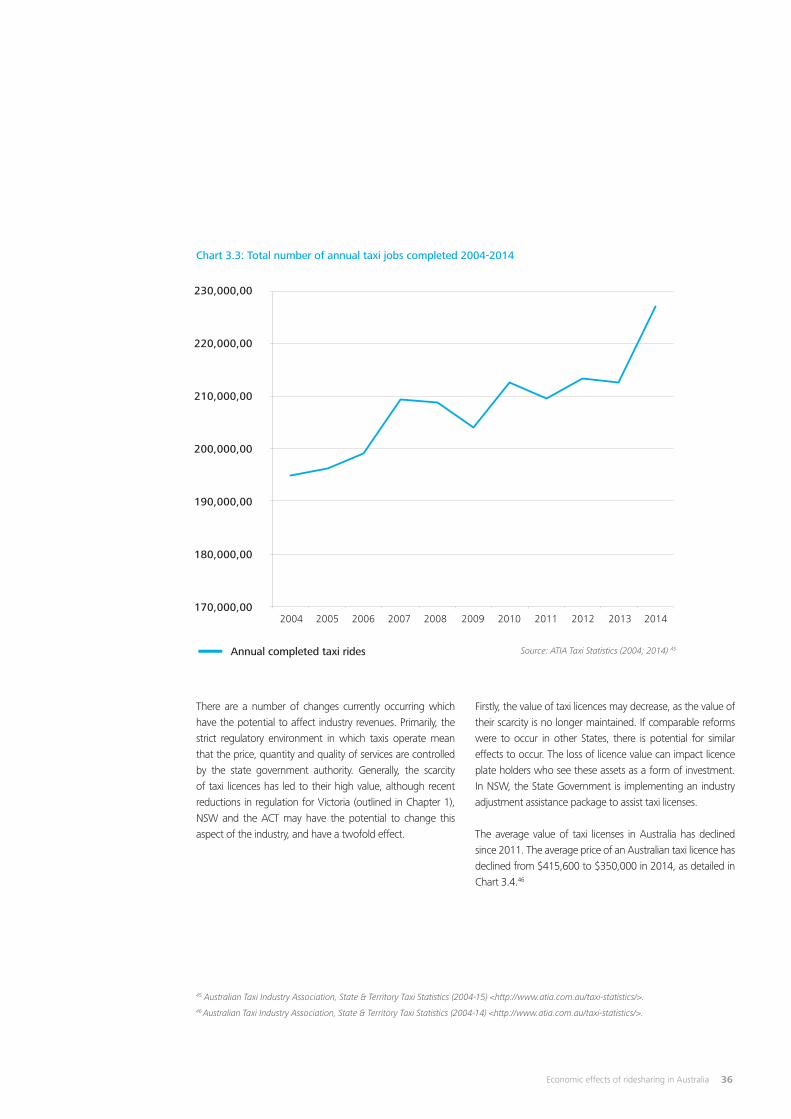
36Economic effects of ridesharing in Australia
Chart 3.3: Total number of annual taxi jobs completed 2004-2014
45 Australian Taxi Industry Association, State & Territory Taxi Statistics (2004-15) <http://www.atia.com.au/taxi-statistics/>.46 Australian Taxi Industry Association, State & Territory Taxi Statistics (2004-14) <http://www.atia.com.au/taxi-statistics/>.
There are a number of changes currently occurring which have the potential to affect industry revenues. Primarily, the strict regulatory environment in which taxis operate mean that the price, quantity and quality of services are controlled by the state government authority. Generally, the scarcity of taxi licences has led to their high value, although recent reductions in regulation for Victoria (outlined in Chapter 1), NSW and the ACT may have the potential to change this aspect of the industry, and have a twofold effect.
Annual completed taxi rides Source: ATIA Taxi Statistics (2004; 2014) 45
Firstly, the value of taxi licences may decrease, as the value of their scarcity is no longer maintained. If comparable reforms were to occur in other States, there is potential for similar effects to occur. The loss of licence value can impact licence plate holders who see these assets as a form of investment. In NSW, the State Government is implementing an industry adjustment assistance package to assist taxi licenses.
The average value of taxi licenses in Australia has declined since 2011. The average price of an Australian taxi licence has declined from $415,600 to $350,000 in 2014, as detailed in Chart 3.4.46
2004 2005 2006 2007 2008 2009 2010 2011 2012 2013 2014
230,000,00
220,000,00
210,000,00
200,000,00
190,000,00
180,000,00
170,000,00
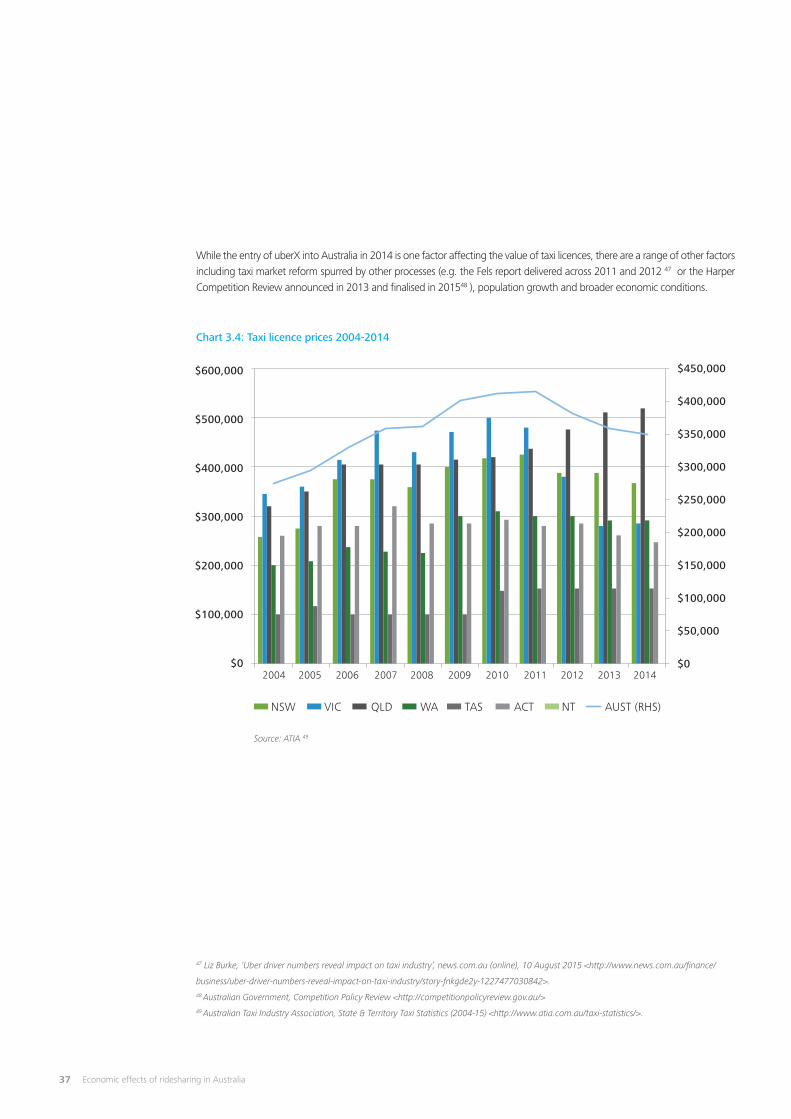
37 Economic effects of ridesharing in Australia
While the entry of uberX into Australia in 2014 is one factor affecting the value of taxi licences, there are a range of other factors including taxi market reform spurred by other processes (e.g. the Fels report delivered across 2011 and 2012 47 or the Harper Competition Review announced in 2013 and finalised in 201548 ), population growth and broader economic conditions.
47 Liz Burke, ‘Uber driver numbers reveal impact on taxi industry’, news.com.au (online), 10 August 2015 <http://www.news.com.au/finance/
business/uber-driver-numbers-reveal-impact-on-taxi-industry/story-fnkgde2y-1227477030842>.48 Australian Government, Competition Policy Review <http://competitionpolicyreview.gov.au/>49 Australian Taxi Industry Association, State & Territory Taxi Statistics (2004-15) <http://www.atia.com.au/taxi-statistics/>.
Chart 3.4: Taxi licence prices 2004-2014
Source: ATIA 49
$600,000
$500,000
$400,000
$300,000
$200,000
$100,000
$0
$450,000
$400,000
$350,000
$300,000
$250,000
$200,000
$150,000
$100,000
$50,000
$0
2004
NSW VIC QLD WA TAS ACT NT AUST (RHS)
2005 2006 2007 2008 2009 2010 2011 2012 2013 2014
38Economic effects of ridesharing in Australia
50 Point to Point Transport Taskforce, NSW Government, Discussion Paper (2015) <https://p2p-prod-assets.s3.amazonaws.com/p2p/s3fs-public/
discussion-paper.pdf>.51 Peer Lindholdt, Sydney cabbies report getting more jobs from Ingogo and goCatch than from their network (December 2013) Ozcabbie <http://
www.ozcabbie.com/sydney-cabbies-report-getting-more-jobs-from-ingogo-and-gocatch-than-from-their-network>; Tim Whitehead, Uber vs
goCatch: We Put Taxi-Tech to the Test (12 March 2015) The Hip Pocket <http://www.thehippocket.com.au/uber-gocatch/>.52 Kye White, Ingogo valued at $100 million after the biggest ever Australian equity crowdfunding raise (May 2015) SmartCompany <http://www.
smartcompany.com.au/growth/47119-ingogo-valued-at-100-million-after-the-biggest-ever-australian-equity-crowdfunding-raise.html>.
A discussion paper, released as part of the NSW Point to Point Transport Taskforce led by Professor Gary Sturgess, has argued that the current regulatory framework is prescriptive, difficult to enforce, and could be improved. Broadly, it raised concerns over:
• Ensuring that taxi drivers’ income could be made more sustainable;
• The inconsistencies and lack of necessity for the application of network authorisation requirements;
• How to improve the quality, satisfaction, clarity, safety and accessibility of services for customers;
• How ridesharing services should be regulated;• The inconsistencies in rules for different types of point
to point transport drivers and how to better enforce compliance in the taxi industry;
• Complexities and differences in requirements placed on operators of different service types; and
• The management of the supply of taxi services by
government.50
The NSW Government has since responded to the
taskforce report and is in the process of implementing
a number of recommended changes, including the
regulation of ridesharing and the removal of fare
regulation for booked services, including taxis and
ridesharing.
Whilst the potential reduction in licence prices would be a
loss for licence holders, the entry of Uber has resulted in a
strong competitive effect. For example, the entry of uberX
has induced the ACT government to place caps on electronic
surcharges which will reduce prices for taxi users.
The entry of Uber has also spurred innovation within the
taxi industry. Applications such as goCatch and Ingogo
can be used to hail and pre-book taxis. Notably, these
applications entered the market at approximately the
same time as Uber was introduced to Australia.
Today, goCatch has 30,000 drivers registered and
3,100,000 passenger downloads. Ingogo claims that
15 per cent of Sydney taxi drivers have signed up to its
application.51 Ingogo had a marketshare of 11 per cent
at February 2015 in the taxi mobile payment space, up
from 8.5 per cent in October 2014.52
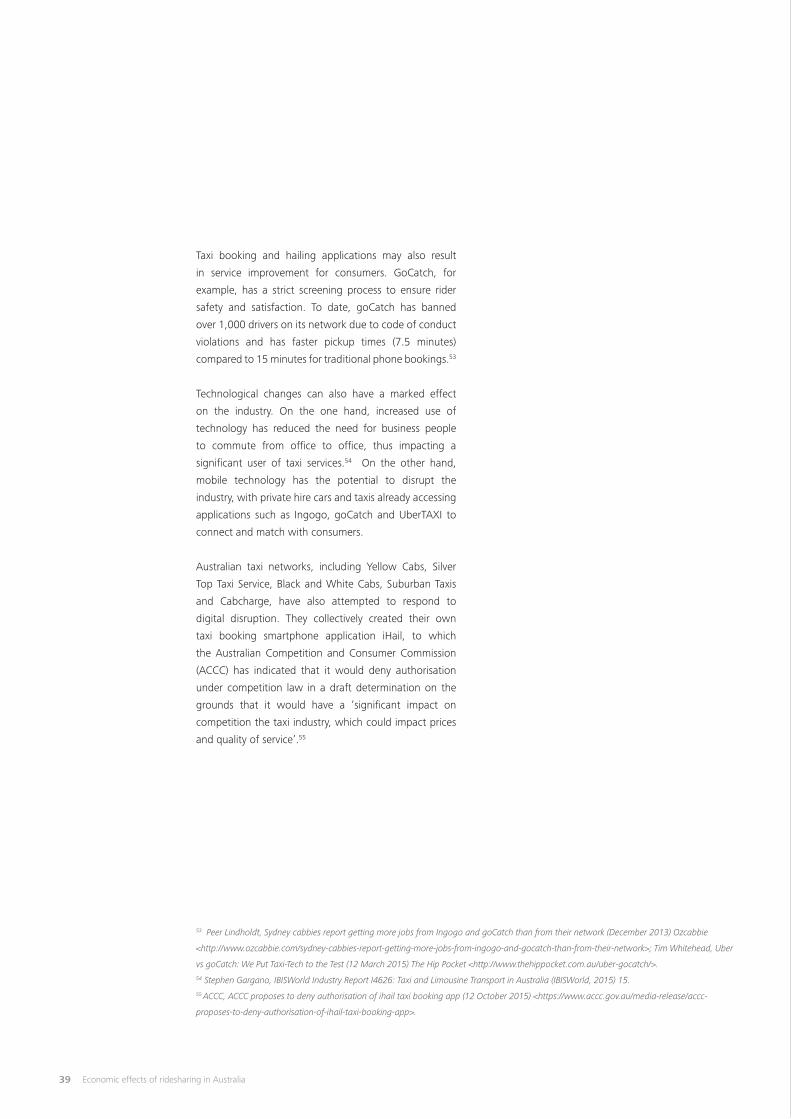
39 Economic effects of ridesharing in Australia
Taxi booking and hailing applications may also result
in service improvement for consumers. GoCatch, for
example, has a strict screening process to ensure rider
safety and satisfaction. To date, goCatch has banned
over 1,000 drivers on its network due to code of conduct
violations and has faster pickup times (7.5 minutes)
compared to 15 minutes for traditional phone bookings.53
Technological changes can also have a marked effect
on the industry. On the one hand, increased use of
technology has reduced the need for business people
to commute from office to office, thus impacting a
significant user of taxi services.54 On the other hand,
mobile technology has the potential to disrupt the
industry, with private hire cars and taxis already accessing
applications such as Ingogo, goCatch and UberTAXI to
connect and match with consumers.
Australian taxi networks, including Yellow Cabs, Silver
Top Taxi Service, Black and White Cabs, Suburban Taxis
and Cabcharge, have also attempted to respond to
digital disruption. They collectively created their own
taxi booking smartphone application iHail, to which
the Australian Competition and Consumer Commission
(ACCC) has indicated that it would deny authorisation
under competition law in a draft determination on the
grounds that it would have a ‘significant impact on
competition the taxi industry, which could impact prices
and quality of service’.55
53 Peer Lindholdt, Sydney cabbies report getting more jobs from Ingogo and goCatch than from their network (December 2013) Ozcabbie
<http://www.ozcabbie.com/sydney-cabbies-report-getting-more-jobs-from-ingogo-and-gocatch-than-from-their-network>; Tim Whitehead, Uber
vs goCatch: We Put Taxi-Tech to the Test (12 March 2015) The Hip Pocket <http://www.thehippocket.com.au/uber-gocatch/>.54 Stephen Gargano, IBISWorld Industry Report I4626: Taxi and Limousine Transport in Australia (IBISWorld, 2015) 15.55 ACCC, ACCC proposes to deny authorisation of ihail taxi booking app (12 October 2015) <https://www.accc.gov.au/media-release/accc-
proposes-to-deny-authorisation-of-ihail-taxi-booking-app>.
40Economic effects of ridesharing in Australia
7.47minutes
4.28minutes
Average waiting time
Average waiting time
Taxi
uberX
41 Economic effects of ridesharing in Australia
SafetySafety for both riders and driver partners is an important issue for all operators in the point-to-point transport market. The sections below discuss how the Uber platform functionality and driver partner requirements assist in safety outcomes, followed by an assessment of the safety impacts of ridesharing in existing areas including fare evasion, assault, drink driving and fatigue driving.
Uber platform functionality and driver partner requirements
Real time tracking and reduced anonymityA key element and advantage of the Uber platform is its use of technology. The Uber smartphone application allows both passengers and driver partners the benefits of real-time GPS tracking, enhancing safety and transparency.
Riders are able to use the Uber application to track the route of their ride before pickup as well as in-journey. Moreover, this information is stored in the application, and is provided to both driver partner and passenger on the payment receipt. The storage of GPS information can, for example, provide recourse to passengers who believe their driver partner took an unnecessary detour, and claim a refund from Uber if this has occurred. In the event that an item is left in the vehicle following a ride, passengers may contact the driver partner to retrieve the item.
The facilitation of pairings between drivers and passengers via the Uber platform has the benefit of reducing anonymity which can frequently contribute to crime. Driver partners and riders are displayed their prospective match before the ride has begun, and the availability and storage of this information in the Uber application may also have a safety impact.
A related safety feature of the Uber application is ‘Share My ETA’, which allows riders to share their journey in real time with friends and family. This feature not only provides peace of mind, but enables quick action in the event of an emergency.
Ratings systemAlthough state transport authorities impose rights and responsibilities for taxi passengers,56 a lack of ratings system similarly affects taxi customers as they are only obligated to behave in a manner that avoids additional costs (such as a charge of one hours waiting time for the cost of cleaning).
For ridesharing, both the driver partner and rider are asked to provide each other a rating out of 5 at the end of each trip. When rides are matched, there is visibility for both the driver partner and rider to the overall rating for the respective counterparty (across all trips).
Low overall ratings can affect the likelihood for driver partners and riders to match rides which could directly impact the driver partner’s ability to earn fares as well as the level of convenience for riders in the future (through less ride requests being accepted). As a result, the ratings system helps self-regulate good behaviour on the Uber platform.
56 See e.g. Transport for NSW, Rights and responsibilities of taxi passengers (7 July 2015) <http://www.transport.nsw.gov.au/customers/taxis/
rights-and-responsibilities-taxi-passengers>.
4 Community effects
42Economic effects of ridesharing in Australia
57 Melanie Przbilla, Taxi Driver Survey July 2010 (2010) Victim Support Service SA <http://archive.victimsa.org/files/home/taxi-driver-survey-report-
july-2010.pdf> 15-6.58 Taverner Research, Taxi Driver Security Survey Prepared for Ministry of Transport (2007) <http://www.taxi-library.org/nsw-2007-taskforce-
appendix.pdf> 17-8.59 CabFare, Submission to Essential Services Commission – Taxi Fare Review 2013-2014 (27 September 2013) Essential Services Commission
Victoria < http://www.esc.vic.gov.au/getattachment/8639a2c0-c1b9-4de8-ab97-d527a480b6c0/Cabfare.pdf>.60 Taverner Research, Survey of Taxi Use Prepared for IPART (2015) 61.
Payment systemAll payments for Uber services are cashless and facilitated via the Uber application. Payment details of passengers are stored on the application and payment occurs automatically at the completion of a ride, based on the fare amount determined by the Uber system. This eliminates potential for fraudulent activity, such as fare evasion, overcharging or misreporting of fares received.
The taxi industry has previously identified that fare evasion is a problem, with surveys indicating the extent of the issue. A survey conducted in 2010 in South Australia found that 81 per cent of drivers surveyed had experienced fare evasion, with more than 60 per cent of those respondents having experienced fare evasion twice or more in the prior 12 months.57 Similarly, a survey conducted in 2007 found that only 9 per cent of NSW drivers thought that fare evasion was not a problem, with 42 per cent saying fare evasion is a major problem and 49 per cent saying it is a minor problem. The same survey found that drivers reported an average of 8 fare evasion incidents in the prior year. 58
Anonymity may allow passengers to evade fares more easily, in comparison to a tracked service such as Uber in which passenger details are stored and payment is cashless. In addition, a high proportion of payments are paid for in cash, with CabFare estimating that approximately 60 per cent of taxi fares by dollar value are paid for in cash. 59
Other fraudulent activity, such as overcharging, is also mitigated with the Uber system. A survey conducted by Taverner Research for IPART in 2014 found that of those urban Sydney users who reported a problem with a taxi in a 12 month period, 30 per cent identified at least one of those problems as being overcharged, and 44 per cent claimed drivers did not take the most direct route.60 In contrast, it is not possible for Uber driver partners to alter the fare determined by the Uber system, and a passenger can notify Uber of an indirect route taken (using GPS data) and receive a refund for that part of the journey.
The lack of ability to misreport fare earnings is also a key benefit of Uber, and impacts other amounts based on reports such as taxation.
43 Economic effects of ridesharing in Australia
Driver partner and vehicle requirementsIn order to register as a driver partner with Uber, applicants must satisfy a series of requirements relating to their vehicle and personal history.
All driver partners are required to have a clear criminal record. On applying to become a driver partner, Uber screens applicants through the Australian Federal Police CrimTrac National Database, under the category of working with health care and vulnerable people. Potential driver partners which are found to have a criminal record are rejected.
In addition, Uber requires all driver partners to have an exemplary driving record. Different mechanisms in each State and Territory monitor driver history (for example, VicRoads in Victoria and the RTA in NSW), although the requirements remain the same. Uber will not accept driver partners who have:
• More than 3 minor (1-4 demerit point) offences in the last 3 years
• Any major (5+ demerit point) offences in the last 3 years• Any demerit point licence suspensions in the last 3 years• Incurred any drug or alcohol infractions at any time.
In addition, all driver partners must have held an unrestricted licence for at least one year. In some jurisdictions, driver partners are also accredited through the relevant state regulatory body.
With regard to vehicle requirements, vehicles of uberX driver partners must satisfy the following conditions:
• Registered in relevant State or Territory• 2006 or newer, and in good condition• Must have four doors (all with external handles)• No ex-taxis• No utes, buses, vans or vehicles with more than 8 seats• No Ford Falcons, Fairmonts, G6s or Fairlanes made pre-
2008, or 6th generation.
All Uber driver partners are required to have third party property damage or comprehensive insurance for their vehicle. Vehicles must also pass a vehicle inspection conducted by a third party inspector prior to drivers being granted access to the Uber platform.
All rides arranged using the Uber app in Australia are covered by insurance. uberX rides in Australia are backed by vehicle liability insurance issued by CGU, which provides coverage of $20 million for third party bodily injury and property damage each trip. This is in addition to insurance coverage held by the driver partner. This insurance covers riders and third parties.
These requirements aim to enhance the safety of Uber services by setting a high minimum standard of driver partner and vehicle quality.
Potential safety impacts in AustraliaDetailed analysis and studies on the safety impacts of ridesharing have not previously been undertaken in Australia. This section focuses on the potential impacts of ridesharing on reducing fare evasion, motor vehicle accidents and creating safer working conditions for driver partners and riders based on a range of international and domestic studies in the ridesharing and point-to-point transportation market.
Reduced risk of fare evasionFare evasion is an existing problem in the taxi industry. This is especially so given the tendency of taxi drivers to under-report incidences of fare evasion; 77 per cent of drivers who reported experiencing at least one fare evasion in the 2007 NSW survey did not report the incident to police.61 Recently, there have been actions by government to improve the fare evasion reporting process and encourage transparency, with some authorities allowing taxi drivers to report their incidents online.62 However, criminal charges for taxi fare evasion are likely to be uncommon as riders are not required to provide personal details before a ride, which can make accurate identification and prosecution difficult and administratively costly for the value of the fare.
61 Taverner Research, Taxi Driver Security Survey Prepared for Ministry of Transport (2007) <http://www.taxi-library.org/nsw-2007-taskforce-
appendix.pdf> 19.62 An electronic breath testing device connected to the ignition of a motor vehicle that prevents the vehicle from starting if alcohol is detected.
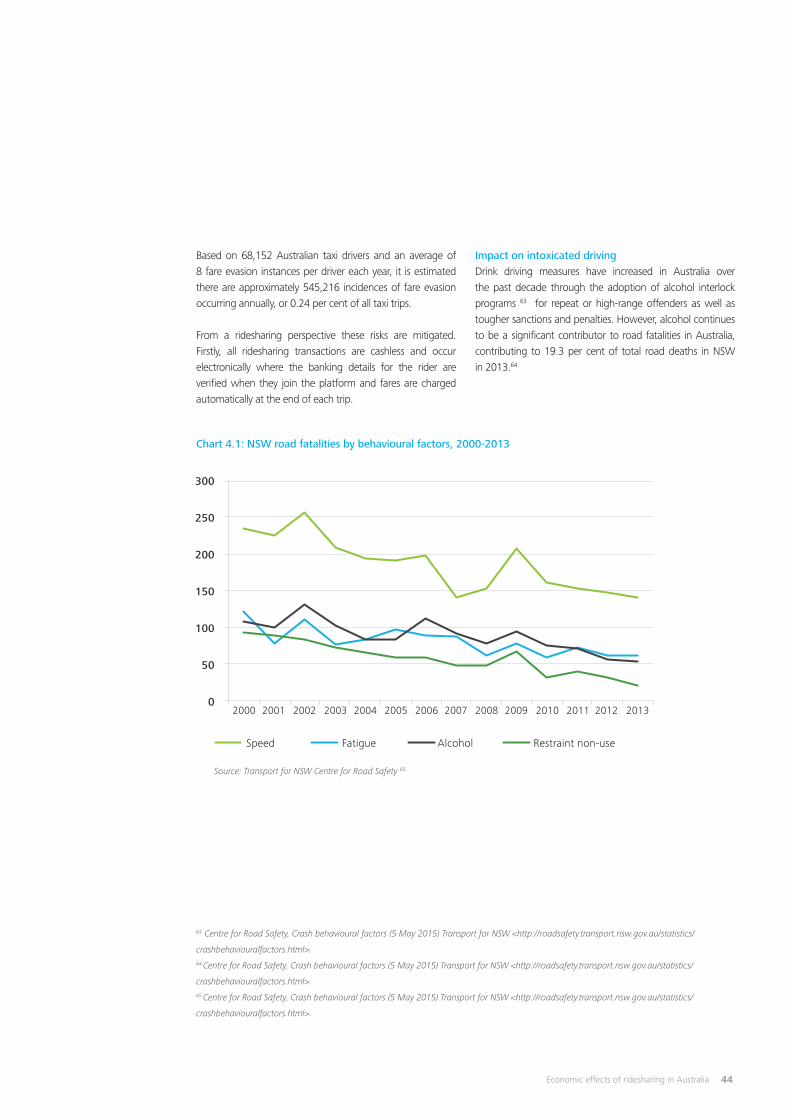
44Economic effects of ridesharing in Australia
Speed Fatigue Alcohol Restraint non-use
Based on 68,152 Australian taxi drivers and an average of 8 fare evasion instances per driver each year, it is estimated there are approximately 545,216 incidences of fare evasion occurring annually, or 0.24 per cent of all taxi trips.
From a ridesharing perspective these risks are mitigated. Firstly, all ridesharing transactions are cashless and occur electronically where the banking details for the rider are verified when they join the platform and fares are charged automatically at the end of each trip.
63 Centre for Road Safety, Crash behavioural factors (5 May 2015) Transport for NSW <http://roadsafety.transport.nsw.gov.au/statistics/
crashbehaviouralfactors.html>.64 Centre for Road Safety, Crash behavioural factors (5 May 2015) Transport for NSW <http://roadsafety.transport.nsw.gov.au/statistics/
crashbehaviouralfactors.html>.65 Centre for Road Safety, Crash behavioural factors (5 May 2015) Transport for NSW <http://roadsafety.transport.nsw.gov.au/statistics/
crashbehaviouralfactors.html>.
Impact on intoxicated drivingDrink driving measures have increased in Australia over the past decade through the adoption of alcohol interlock programs 63 for repeat or high-range offenders as well as tougher sanctions and penalties. However, alcohol continues to be a significant contributor to road fatalities in Australia, contributing to 19.3 per cent of total road deaths in NSW in 2013.64
Chart 4.1: NSW road fatalities by behavioural factors, 2000-2013
Source: Transport for NSW Centre for Road Safety 65
300
250
200
150
100
50
020042003200220012000 2005 2006 2007 2008 2009 2010 2011 2012 2013
45 Economic effects of ridesharing in Australia
According to Grove, the absence of sufficient taxis can lead to citizens operating motor vehicles under the influence of alcohol.66 Studies have been conducted in other countries which comment on the potential safety impacts of Uber. Ridesharing has been argued to have a negative influence on drink driving due to its cost advantages and impact on increasing availability through the electronic platform.
In particular, a study conducted by Greenwood and Wattal in California found that drink driving deaths declined following the introduction of Uber to Californian cities. 67 Using a difference-in-difference estimation approach, the study used data from the Californian Highway Patrol to track the number of motor vehicle deaths before and after the introduction of Uber in each city.
The study found that the entry of uberX ‘strongly and negatively’ affects the number of motor vehicle deaths in each city, estimating there was a 3.6 to 5.6 per cent decrease in the rate of motor vehicle deaths per quarter in California following the introduction of uberX.68 It is suggested that the cheaper price point of uberX influences decision making such that individuals choose to use the service, rather than take the risks associated with drink driving. This conclusion is supported by the finding that the introduction of UberBLACK and times of dynamic pricing did not have any significant effect.69
While not undertaking a robust economic study, there is also evidence that driving under the influence (DUI) rates decreased in Philadelphia and San Francisco following the introduction of ridesharing services in those areas. However, these results only show correlation as opposed to causation, and it is possible that there are other factors at play.70
Uber’s own research has also commented on the safety impacts of its platform. It has found that the entrance of Uber in Seattle saw the number of arrests for DUI decrease by more than 10 per cent, also adopting a differences-in-differences approach.71 A study conducted in partnership with Mothers Against Drunk Driving (MADD) explored the relationship between DUI and the introduction of Uber in a number of North American cities. It found that the volume of ride requests followed a similar trend to the number of alcohol-related crash fatalities in Miami, while demand for Uber rides in Pittsburgh spike at around the same time that bars close. It also found that a disproportionate number of weekend, late-night Uber ride requests come from businesses with liquor licences in Chicago, and that taxi supply decreases at midnight in Austin, which is the time at which alcohol-related crashes peak.72
66 Linsey Grove, ‘Drunk DIAL! An evidence-informed program to reduce alcohol-related vehicle mortality among university students’ (Paper
presented at APHA Annual Meeting and Exposition, 2013).67 Brad N. Greenwood and Sunil Wattal, ‘Show Me the Way to Go Home: An Empirical Investigation of Ride Sharing and Alcohol Related Motor
Vehicle Homicide’ (2015) Fox School of Business Research Paper No. 15-054.68 Brad N. Greenwood and Sunil Wattal, ‘Show Me the Way to Go Home: An Empirical Investigation of Ride Sharing and Alcohol Related Motor
Vehicle Homicide’ (2015) Fox School of Business Research Paper No. 15-054, 3-4.69 Brad N. Greenwood and Sunil Wattal, ‘Show Me the Way to Go Home: An Empirical Investigation of Ride Sharing and Alcohol Related Motor
Vehicle Homicide’ (2015) Fox School of Business Research Paper No. 15-054, 3.70 Emily Badger, ‘Are Uber and Lyft responsible for reducing DUIs?’ Washington Post (online), 10 July 2014 <http://www.washingtonpost.com/
news/wonkblog/wp/2014/07/10/are-uber-and-lyft-responsible-for-reducing-duis/>.71 Uber, DUI Rates Decline in Uber Cities (10 May 2014) <http://newsroom.uber.com/chicago/2014/05/dui-rates-decline-in-uber-cities/>.72 Uber and Mothers Against Drunk Driving, More options. Shifting Mindsets. Driving Better Choices. (2015) <https://newsroom.uber.com/wp-
content/uploads/2015/01/UberMADD-Report.pdf> 3-9.
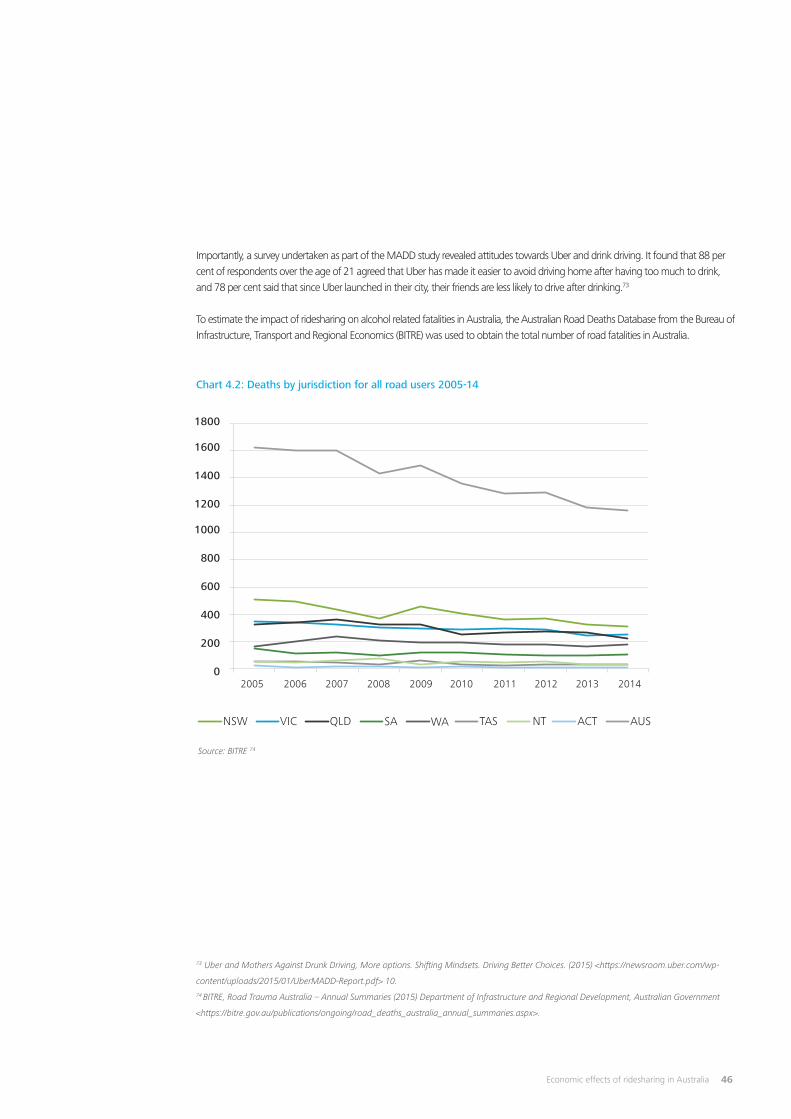
46Economic effects of ridesharing in Australia
73 Uber and Mothers Against Drunk Driving, More options. Shifting Mindsets. Driving Better Choices. (2015) <https://newsroom.uber.com/wp-
content/uploads/2015/01/UberMADD-Report.pdf> 10.74 BITRE, Road Trauma Australia – Annual Summaries (2015) Department of Infrastructure and Regional Development, Australian Government
<https://bitre.gov.au/publications/ongoing/road_deaths_australia_annual_summaries.aspx>.
Importantly, a survey undertaken as part of the MADD study revealed attitudes towards Uber and drink driving. It found that 88 per cent of respondents over the age of 21 agreed that Uber has made it easier to avoid driving home after having too much to drink, and 78 per cent said that since Uber launched in their city, their friends are less likely to drive after drinking.73
To estimate the impact of ridesharing on alcohol related fatalities in Australia, the Australian Road Deaths Database from the Bureau of Infrastructure, Transport and Regional Economics (BITRE) was used to obtain the total number of road fatalities in Australia.
Chart 4.2: Deaths by jurisdiction for all road users 2005-14
Source: BITRE 74
2005 2006 2007 2008 2009 2010 2011 2012 2013 2014
1800
1600
1400
1200
1000
800
600
400
200
0
NSW VIC QLD WASA TAS ACT AUSNT
47 Economic effects of ridesharing in Australia
Based on alcohol contributing to 19.3 per cent of total fatalities in NSW in 2013, this suggests that there were around 223 alcohol related road fatalities in Australia in 2014. Based on Greenwood and Wattal, if ridesharing had a 3.6 per cent negative impact on alcohol related driving fatalities, approximately 8 fatalities could be prevented each year. It is important to note that this an indicative analysis not based on an analysis of the impact of the entry of uberX into the Australian market.
Safer conditions for drivers and ridersQuantifications of how the ridesharing platform has affected incidences of occupational violence in Australia was not available due to limitations in safety data supplied.
As they carry cash on hand, taxis are sometimes seen as ‘soft targets’ for targeting by criminals, especially as targets for robbery.79 As all payments are conducted electronically, uberX driver partners have no need to carry cash.
Analysis by Uber in Chicago found that the rate of taxicab-located crimes decrease by 20 per cent in the 300 days after Uber entered Chicago, compared to the 300 days prior.80 It has been suggested this effect may relate to the move away from cash payments and towards an electronic economy.81 Others suggest that the criminal law will work the same way for Uber as it currently does in taxis, although it was noted that Uber has the benefit of being able to identify the wrongdoer who may then suffer the legal consequences.82
79 See e.g. Sydney Morning Herald, Taxi drivers warned after new attack (12 August 2008) at http://www.smh.com.au/national/taxi-drivers-
warned-after-new-attack-20080812-3u17.html. ABC, Call for mandatory jail for bashings: Taxis (20 April 2010) at http://mobile.abc.net.au/
news/2010-04-20/call-for-mandatory-jail-for-bashings-taxis/402872?pfm=sm&site=news.80 Uber, Uber’s impact on Taxi Crime in Chicago (28 April 2014) <http://newsroom.uber.com/chicago/2014/04/ubers-impact-on-taxi-crime-in-
chicago/>.81 Richard Wright et al, ‘Less Cash, Less Crime: Evidence from the Electronic Benefit Transfer Program’ (Working Paper No 19996, 2014, NBER) <
http://www.nber.org/papers/w19996>.
82 Brishen Rogers, ‘The Social Costs of Uber’ (2015) 82 University of Chicago Law Review 85.
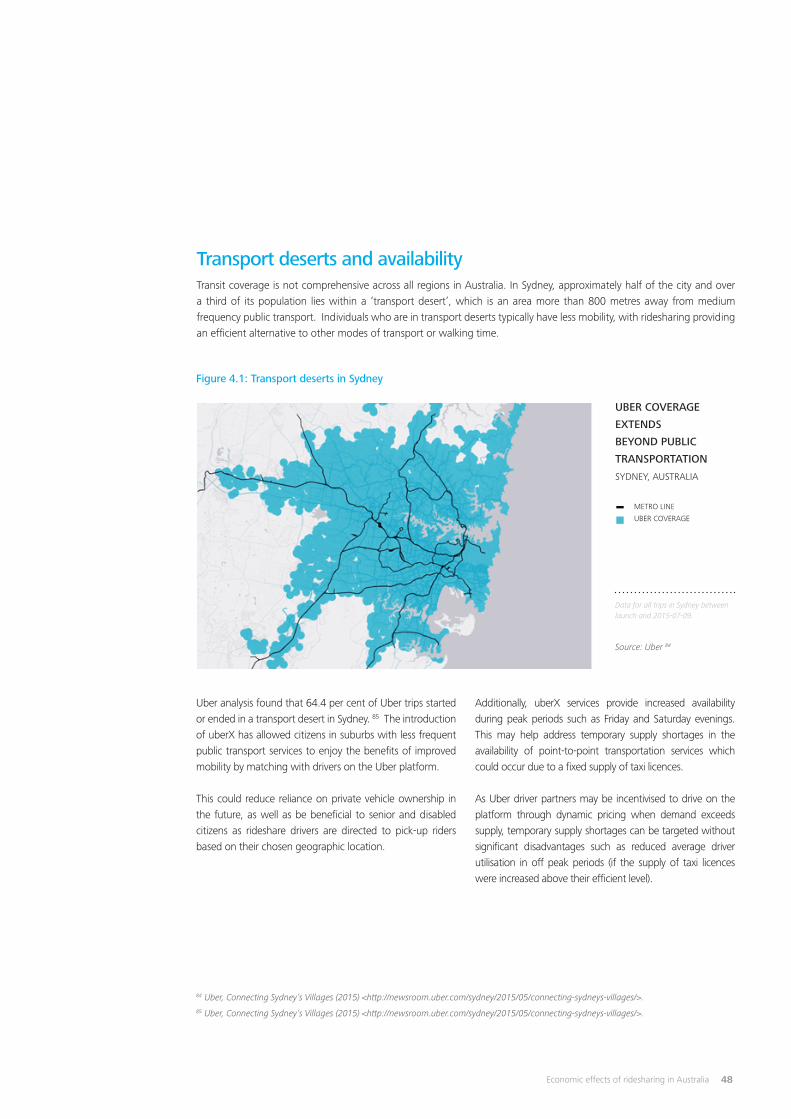
48Economic effects of ridesharing in Australia
Uber analysis found that 64.4 per cent of Uber trips started or ended in a transport desert in Sydney. 85 The introduction of uberX has allowed citizens in suburbs with less frequent public transport services to enjoy the benefits of improved mobility by matching with drivers on the Uber platform. This could reduce reliance on private vehicle ownership in the future, as well as be beneficial to senior and disabled citizens as rideshare drivers are directed to pick-up riders based on their chosen geographic location.
84 Uber, Connecting Sydney’s Villages (2015) <http://newsroom.uber.com/sydney/2015/05/connecting-sydneys-villages/>.85 Uber, Connecting Sydney’s Villages (2015) <http://newsroom.uber.com/sydney/2015/05/connecting-sydneys-villages/>.
Source: Uber 84
UBER COVERAGE
EXTENDS
BEYOND PUBLIC
TRANSPORTATION
SYDNEY, AUSTRALIA
METRO LINE
UBER COVERAGE
Data for all trips in Sydney between launch and 2015-07-09.
Figure 4.1: Transport deserts in Sydney
Additionally, uberX services provide increased availability during peak periods such as Friday and Saturday evenings. This may help address temporary supply shortages in the availability of point-to-point transportation services which could occur due to a fixed supply of taxi licences.
As Uber driver partners may be incentivised to drive on the platform through dynamic pricing when demand exceeds supply, temporary supply shortages can be targeted without significant disadvantages such as reduced average driver utilisation in off peak periods (if the supply of taxi licences were increased above their efficient level).
Transport deserts and availabilityTransit coverage is not comprehensive across all regions in Australia. In Sydney, approximately half of the city and over a third of its population lies within a ‘transport desert’, which is an area more than 800 metres away from medium frequency public transport. Individuals who are in transport deserts typically have less mobility, with ridesharing providing an efficient alternative to other modes of transport or walking time.
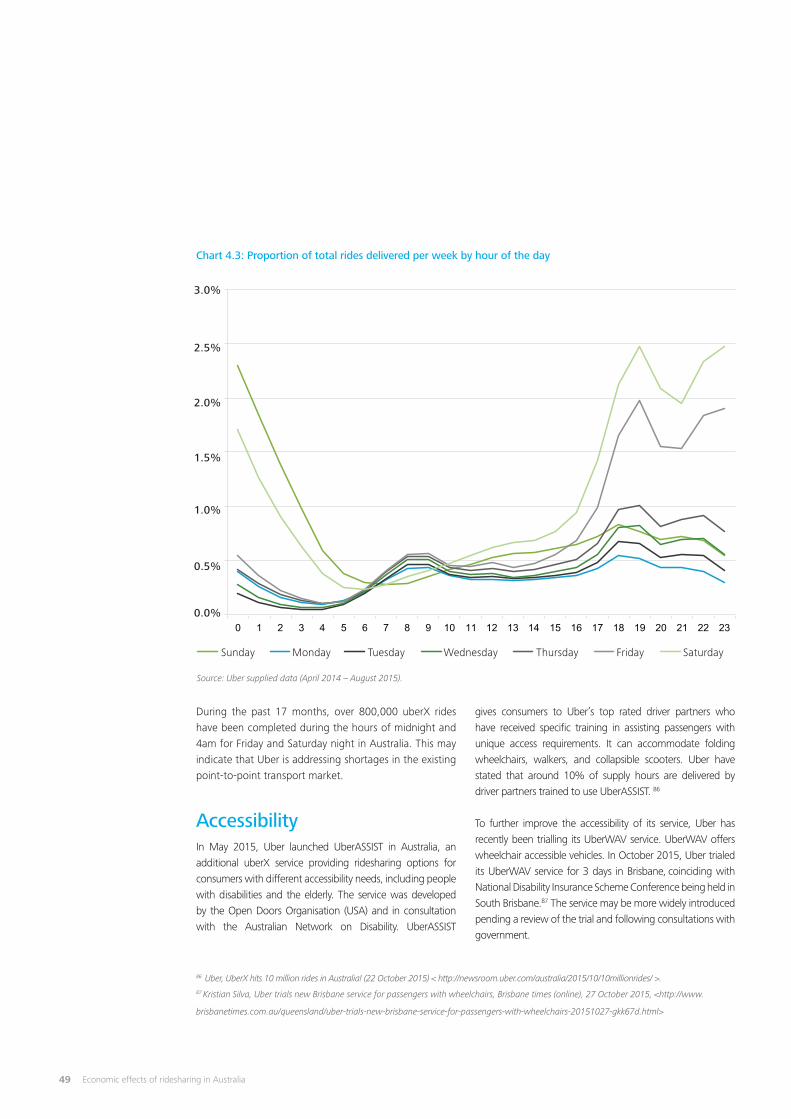
49 Economic effects of ridesharing in Australia
0 1 2 3 4 5 6 7 8 9 10 11 12 13 14 15 16 17 18 19 20 21 22 23
Chart 4.3: Proportion of total rides delivered per week by hour of the day
During the past 17 months, over 800,000 uberX rides have been completed during the hours of midnight and 4am for Friday and Saturday night in Australia. This may indicate that Uber is addressing shortages in the existing point-to-point transport market.
AccessibilityIn May 2015, Uber launched UberASSIST in Australia, an additional uberX service providing ridesharing options for consumers with different accessibility needs, including people with disabilities and the elderly. The service was developed by the Open Doors Organisation (USA) and in consultation with the Australian Network on Disability. UberASSIST
86 Uber, UberX hits 10 million rides in Australia! (22 October 2015) < http://newsroom.uber.com/australia/2015/10/10millionrides/ >.87 Kristian Silva, Uber trials new Brisbane service for passengers with wheelchairs, Brisbane times (online), 27 October 2015, <http://www.
brisbanetimes.com.au/queensland/uber-trials-new-brisbane-service-for-passengers-with-wheelchairs-20151027-gkk67d.html>
Source: Uber supplied data (April 2014 – August 2015).
gives consumers to Uber’s top rated driver partners who have received specific training in assisting passengers with unique access requirements. It can accommodate folding wheelchairs, walkers, and collapsible scooters. Uber have stated that around 10% of supply hours are delivered by driver partners trained to use UberASSIST. 86
To further improve the accessibility of its service, Uber has recently been trialling its UberWAV service. UberWAV offers wheelchair accessible vehicles. In October 2015, Uber trialed its UberWAV service for 3 days in Brisbane, coinciding with National Disability Insurance Scheme Conference being held in South Brisbane.87 The service may be more widely introduced pending a review of the trial and following consultations with government.
3.0%
2.5%
2.0%
1.5%
1.0%
0.5%
0.0%
Sunday Monday Tuesday Wednesday Thursday Friday Saturday
50Economic effects of ridesharing in Australia
As well as providing greater accessibility for riders, Uber has also been focusing on providing economic opportunities to people living with disabilities. In September 2015, Uber announced that it was partnering with Enabled Employment, an employment agency for Australians with disabilities, to encourage people living with disabilities to apply to drive on the uberX platform.
Uber provided an update to its smartphone application in July 2015 that helps driver partners who are deaf or hearing impaired to use the platform. The app replaces all audio notifications of the normal app with a flashing light, and removes the ability for passengers to call their driver, instead allowing driver partners to communicate with passengers via text. It also informs passengers ahead of pickup that their driver partner is deaf or hearing impaired, prompting them to enter their destination before the ride begins, as passengers cannot verbally communicate their destination.
Ongoing and monitoring costs
Regulatory costsIn September 2015, the ACT became the first Australian State/Territory to regulate Uber. Associated with this was a decrease in the cost of taxi licences and the cost of hire car licences and a 5 per cent cap on electronic payment surcharges.88
In terms of fees for ridesharing:• Rideshare driver accreditation will cost $50 per driver
per year;• Rideshare driver licence fees will cost $100 per year or
$400 for five years; and • Hire car licence fees will fall from $4600 to $100 and all
transport booking services (e.g. uberX) will pay a $600 application fee.89
Given the information above, this suggests that the regulatory cost is reflected by the cost of accreditation and licence fees. The hire car application fee is more similar to a transfer rather than a new regulatory cost. Noting that in 2014-15, there were 23,833 drivers registered on the uberX platform in Australia, this suggests that if the ACT regulatory regime were adopted across Australia, the cost of regulating ridesharing drivers is around $3.6 million per year.
Similarly, in NSW, rideshare drivers are required to have hire car driver authorisation and have a business registration for their car, following NSW Government response to the point to point transport taskforce.
Vehicle inspection costsUber engages a third party to inspect the cars of driver partners every twelve months to ensure safety and comfort for riders and drivers. Under the new ACT and NSW regulatory regime, the cars of rideshare drivers must be inspected annually.
The vehicle inspection fee is $65.40 at the RTA according to the ACT Government. Assuming Uber driver partners have one vehicle inspections per year, the total cost for driver partners would be $1.6 million per year. This may be a high estimate, as the fee required in NSW is $37.40. It should be noted that whilst these additional costs are costs associated with the operation of Uber, they also create employment opportunities for vehicle inspectors. A proportion of this cost would be offset by the additional economic activity
created by hiring vehicle inspectors.
88ACT Government, ACT Taxi Industry Innovation Reforms – Taxi and Hire Car Industry (2015) <http://www.cmd.act.gov.au/__data/assets/pdf_
file/0011/778574/150929_ACT-TaxiIndustryReforms_Industry.pdf>.89ACT Government, ACT Taxi Industry Innovation Reforms – Fees and Charges (2015) < http://www.cmd.act.gov.au/__data/assets/pdf_
file/0005/778595/150929_ACT-TaxiIndustryReforms_Fees.pdf >.90 ACT Government, ACT Taxi Industry Innovation Reforms – Fees and Charges (2015) < http://www.cmd.act.gov.au/__data/assets/pdf_
file/0005/778595/150929_ACT-TaxiIndustryReforms_Fees.pdf >.

51 Economic effects of ridesharing in Australia
52Economic effects of ridesharing in Australia
uber driver partners in Sydney, Brisbane, Melbourne and Perth
in August 2015
12,680
53 Economic effects of ridesharing in Australia
Data analyticsAs data for each uberX trip is collected and stored, there is potential for this data to be analysed to assist in urban planning and managing traffic related problems.
In 2015, Boston became the first city to receive anonymised Uber quarterly trip data.91 This data included trip length and drop-off location, though did not include fare price, specific pickup location or driver partner-identifying information.
In the short run, Uber believes that this data will help planners identify where to prioritize street repairs, how to tweak traffic light patterns and where to increase public transport. In the longer term, this data may help planners identify where to build new roads or offer other transportation options based on daily commute patterns. Data collection has also been prioritised by the recently established Taxi Services Commission, which has planned to invest in infrastructure that will allow it collect and publically release large volumes of data on taxi performance in near real-time. Data may include a public register of taxi operators with information regarding trips, shifts, fares, wait times and complaint resolution statistics.
Infrastructure utilisation and carpoolingIn a mature market, services such as uberX may eventually be used to replace or complement personal car usage. There is anecdotal evidence suggesting this has occurred in San Francisco92 and London.93 Uber eventually aims to take 1 million cars off the road in New York City.94
In Australia, one analysis has suggested that if taxi and ride-sharing services were to decrease the number of motor vehicles owned in Australia by 10 per cent, or by 1.8 million mid-sized cars, families would save approximately $14.4 billion (based on a cost of $8000 per car per year). Assuming the cost of ridesharing took up one third of these savings, there remains $9.6 billion in potential gain.95 Uber estimated that relying on ridesharing as opposed to private vehicle transportation would mean an average person could afford up to 882 uberX rides per year with the savings.96
91Douglas MacMillan, ‘Uber Offers Trip Data to Cities, Starting With Boston’, Wall Street Journal (online), 13 January 2015 <http://blogs.wsj.com/
digits/2015/01/13/uber-offers-trip-data-to-cities-starting-in-boston/>; Ellen Huet, ‘Uber Hands Over Sought-After Trip Data – On Its Own Terms’, Forbes
(online), 13 January 2015 <http://www.forbes.com/sites/ellenhuet/2015/01/13/uber-boston-city-data/>.92Katherine Krug, ‘Ditching my car for Uber saves me over 6 days of time and $11,000 a year’, Business Insider (online), 9 February 2015 <http://www.
businessinsider.com/how-using-uber-and-lyft-saves-me-money-2015-2?IR=T>.93Megan Quinn, ‘I Don’t Own, I Uber’ on Medium <https://medium.com/the-wtf-economy/i-don-t-own-i-uber-68a5f5d8e0ae>.94Uber, Taking 1 Million Cars Off the Road in New York City (10 July 2015) <https://newsroom.uber.com/nyc/2015/07/taking-1-million-cars-off-the-road-
in-new-york-city/>.95Stephen King, ‘Uber could save families $10b per year - but it faces tax threats’, The Conversation (online), 13 August 2015 <https://theconversation.
com/uber-could-save-families-10b-per-year-but-it-faces-tax-threats-46047>.96Uber, How Do Car Ownership Costs Compare to Using Uber? (4 March 2013) <http://newsroom.uber.com/2013/03/economics-of-car-ownership/>.
5 Potential for growth
54Economic effects of ridesharing in Australia
97 Mobility Investment Priorities, Texas A&M Transportation Institute, Carpooling <http://mobility.tamu.edu/mip/strategies-pdfs/travel-options/technical-
summary/Carpooling-4-Pg.pdf>.98 Mobility Investment Priorities, Texas A&M Transportation Institute, Carpooling <http://mobility.tamu.edu/mip/strategies-pdfs/travel-options/technical-
summary/Carpooling-4-Pg.pdf>.99 Mobility Investment Priorities, Texas A&M Transportation Institute, Carpooling <http://mobility.tamu.edu/mip/strategies-pdfs/travel-options/technical-
summary/Carpooling-4-Pg.pdf>.100Santi, Restam, Szell, Sobolevsky, Strogatz and Ratti, ‘Quantifying the benefits of vehicle pooling with shareability networks’ (2014) 111(37),
Proceedings of the National Academy of Sciences of the United States of America, 13290–13294.101“These curves are well-known to describe binding processes in biochemical systems, providing an interesting link to general pairing problems (SI
Appendix). At around 100,000 trips, or 25% of the daily average, we already reach saturation and near-maximum shareability. This fast saturation
suggests that taxi-sharing systems could be effective even in cities with taxi fleet densities much lower than New York” (Santi, Restam, Szell, Sobolevsky,
Trogatz and Ratti (2014).102 Harrison Research, Carpooling 2.0 - An Old Concept In A New Age Prepared for the Department of Planning, Transport & Infrastructure SA (2012)
<http://www.aes.asn.au/images/stories/files/conferences/2012/presentations/Eltridge_Halling.pdf>.
The potential for carpooling on the Uber platform may provide additional savings and benefits. UberPOOL is an additional feature of uberX not yet implemented in Australian cities. It allows uberX riders to carpool if they are travelling to the same destination or along a similar route.
One of the key benefits of carpooling is reduced congestion and other infrastructure. To highlight, Texas A&M University have stated that:
“By consolidating more person-trips into fewer vehicles, carpooling offers a range of benefits the community as a whole, and the individual. Community benefits include reduced traffic congestion, vehicle emissions, and parking infrastructure demand. Car-poolers save cost in terms of fuel and maintenance, reduced commute stress, and may have travel time savings through high occupancy vehicle lane use or preferential parking, if provided” (Texas A&M University, 2015) 97
The impact on parking can be significant. According to the Capital Metropolitan Transportation Authority in Texas, the implementation of carpooling incentives in Minneapolis and St. Paul reduced trips to work by between 27 per cent and 37 per cent. Associated with this was a reduction in parking demand by between 11 per cent and 21 per cent.98
Carpooling is also expected to reduce congestion along major corridors in and out of the city during peak hours. According to Texas A&M:
“Since some carpools have three or more participants, most corridors benefit from a significant proportion of traffic that is not added because of carpooling” (Texas A&M University, 2015) 99
This also suggests that the increased use of carpooling may help delay the need to increase road capacity of major roads.
Several studies have quantified the benefits arising from carpooling. One such study found that if taxi passengers in New York were willing to tolerate a delay of 5 minutes per ride requested, almost 95 per cent of rides could be shared, saving a total of 32 per cent of cumulative travel time. This analysis was conducted on the assumption that only trips starting within one minute of each other could be combined.100
It is important to note that this study was based on New York taxi data, where the average number of daily trips is approximately 400,000. However, the authors noted that the results remain valid even if the number of trips is closer to 100,000 per day.101
Domestically, Eltridge and Halling conducted a cost benefit analysis to implement a carpooling program in South Australia, with costs generally relating to those of administering the program and benefits generally relating to traffic congestion, road maintenance and carbon emission savings. It was found that if 11,796 Greater Adelaide residents carpooled, benefits would total $3.4 million, with costs of $1.1 million (2011 present value). Similarly, carpooling for 840 Adelaide Hills residents would result in benefits of 0.4 million and costs of 0.3 million. Overall, it was suggested that there are significant benefits to carpooling, with the greatest potential for carpooling in those who drive to work, making up 85 per cent of regular travellers.102
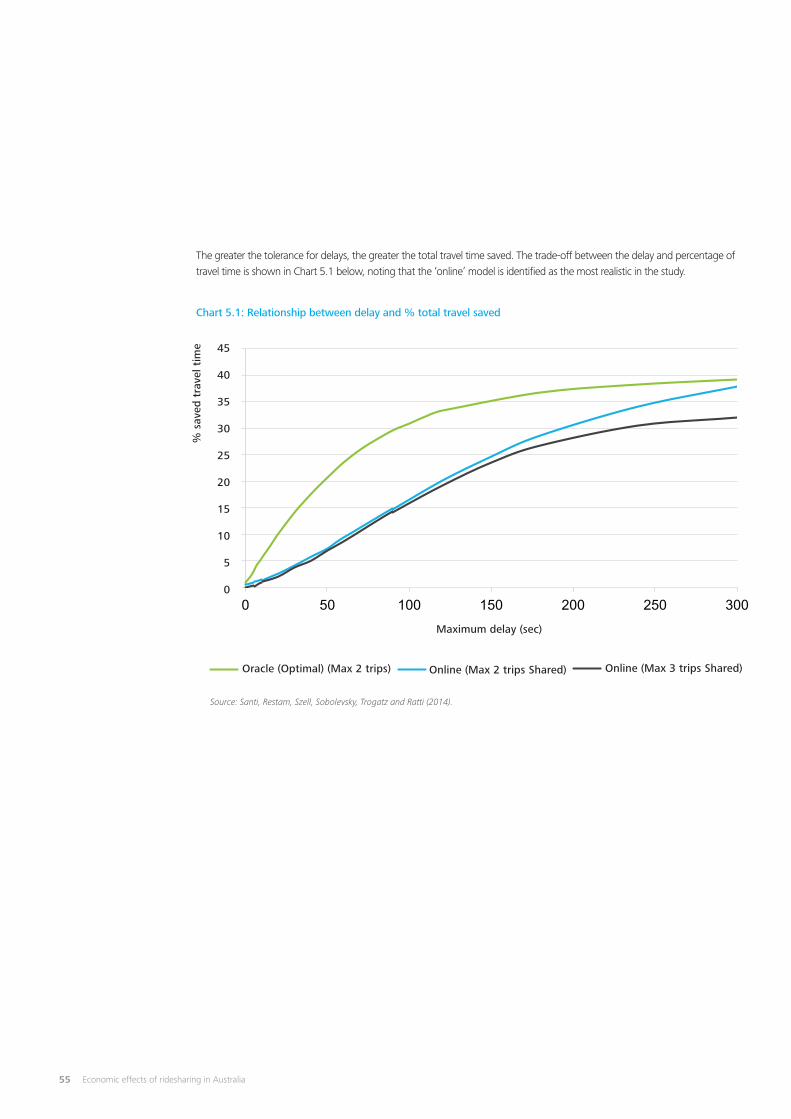
55 Economic effects of ridesharing in Australia
The greater the tolerance for delays, the greater the total travel time saved. The trade-off between the delay and percentage of travel time is shown in Chart 5.1 below, noting that the ‘online’ model is identified as the most realistic in the study.
Chart 5.1: Relationship between delay and % total travel saved
0 50 100 150 200 250 300
Source: Santi, Restam, Szell, Sobolevsky, Trogatz and Ratti (2014).
45
40
35
30
25
20
15
10
5
0
% s
aved
tra
vel t
ime
Maximum delay (sec)
Oracle (Optimal) (Max 2 trips) Online (Max 2 trips Shared) Online (Max 3 trips Shared)
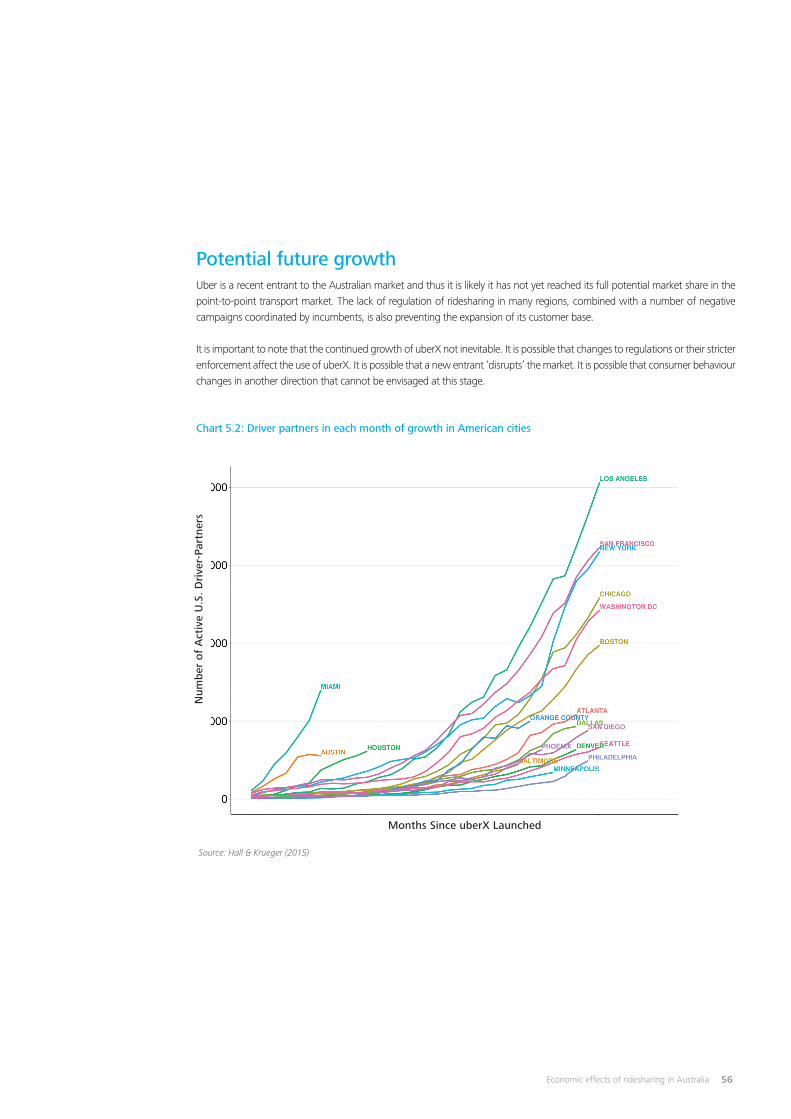
56Economic effects of ridesharing in Australia
Potential future growthUber is a recent entrant to the Australian market and thus it is likely it has not yet reached its full potential market share in the point-to-point transport market. The lack of regulation of ridesharing in many regions, combined with a number of negative campaigns coordinated by incumbents, is also preventing the expansion of its customer base.
It is important to note that the continued growth of uberX not inevitable. It is possible that changes to regulations or their stricter enforcement affect the use of uberX. It is possible that a new entrant ‘disrupts’ the market. It is possible that consumer behaviour changes in another direction that cannot be envisaged at this stage.
Chart 5.2: Driver partners in each month of growth in American cities
Source: Hall & Krueger (2015)
Num
ber
of
Act
ive
U.S
. D
rive
r-Pa
rtne
rs
Months Since uberX Launched
57 Economic effects of ridesharing in Australia
Growth of UberA proxy for Uber’s potential growth is the growth in the number of active driver partners on the platform following Uber’s launch in a city. This data is available for a variety of American cities following an analysis by Hall and Krueger in 2015.103 An active driver is defined as a driver who undertakes at least four rides per month.
In recent modelling conducted for the ACT Taxi Industry Innovation Reforms, the CIE forecasted the growth path of Uber in the ACT, assuming steady population growth (1.5 per cent per annum). It assumes that ridesharing reaches a 30 per cent market share if ridesharing was legalised, or 17 per cent if ridesharing enters illegally, in the year 2019-20.104
However, the growth in the number of driver partners is dependent on the number of driver partners a city’s population size can support. In smaller cities, the aggregate demand for rides will be less than in larger cities, and depending on the number of driver partners on launch, it is possible that growth will be slower than in a large city. Of course, there are a range of other factors that may affect growth in the number of driver partners on the Uber platform in a city, including marketing, the time of year at launch and the local regulatory situation.
103 Jonathan V. Hall and Alan B. Krueger, An Analysis of the Labor Market for Uber’s Driver-Partners in the United States (22 January 2015) <https://
s3.amazonaws.com/uber-static/comms/PDF/Uber_Driver-Partners_Hall_Kreuger_2015.pdf>.104 CIE, Modelling of policy scenarios for the ACT on-demand transport sector (2015) <http://www.cmd.act.gov.au/__data/assets/pdf_file/0004/779179/
CIE-Final-Report_ACT-Gov_ACT-Taxis-2015-04092015.pdf> 11.
The number of driver partners on the Uber platform may be a base indicator for the growth path of Uber rides in a city, but given that an active driver partner must only facilitate four rides per month to remain active, it is unwise to compare a predicted number of driver partners compared to the number of drivers in the taxi industry. Adopting this logic, there would be a large portion of underutilised labour, but it does not take into account the number of rides a driver partner facilitates.
The market share of Uber in the long run depends not only on the number of driver partner (supply), but also demand in the market. Demand in the market is influenced by the overall population size, as mentioned above, as well as the ease of regulation.
Growth of the point-to-point transport marketAs described in this report, the growth of uberX is not merely the result of rides ‘switching’ to uberX from other similar services, but there is also a product of many rides occurring in the point-to-point transport market which did not occur previously. There is evidence to suggest that this has occurred in other cities where uberX has operated for a longer period of time, including New York and Los Angeles.
Los AngelesData from in Los Angeles shows how the entrance of uberX grew the size of the point to point transport market in that city. In this example, the size of the market is measured using the gross revenue of taxi companies and of uberX.
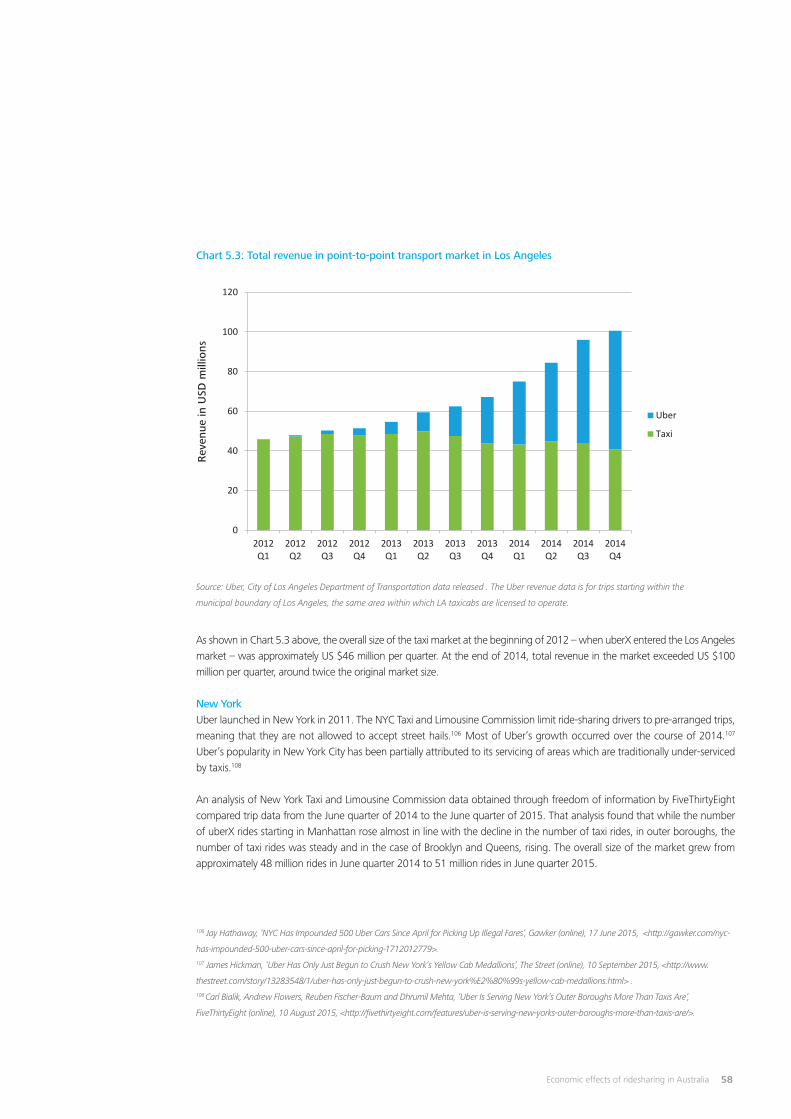
58Economic effects of ridesharing in Australia
Chart 5.3: Total revenue in point-to-point transport market in Los Angeles
0
20
40
60
80
100
120
2012Q1
2012Q2
2012Q3
2012Q4
2013Q1
2013Q2
2013Q3
2013Q4
2014Q1
2014Q2
2014Q3
2014Q4
Uber
Taxi
Source: Uber, City of Los Angeles Department of Transportation data released . The Uber revenue data is for trips starting within the
municipal boundary of Los Angeles, the same area within which LA taxicabs are licensed to operate.
As shown in Chart 5.3 above, the overall size of the taxi market at the beginning of 2012 – when uberX entered the Los Angeles market – was approximately US $46 million per quarter. At the end of 2014, total revenue in the market exceeded US $100 million per quarter, around twice the original market size.
New YorkUber launched in New York in 2011. The NYC Taxi and Limousine Commission limit ride-sharing drivers to pre-arranged trips, meaning that they are not allowed to accept street hails.106 Most of Uber’s growth occurred over the course of 2014.107 Uber’s popularity in New York City has been partially attributed to its servicing of areas which are traditionally under-serviced by taxis.108
An analysis of New York Taxi and Limousine Commission data obtained through freedom of information by FiveThirtyEight compared trip data from the June quarter of 2014 to the June quarter of 2015. That analysis found that while the number of uberX rides starting in Manhattan rose almost in line with the decline in the number of taxi rides, in outer boroughs, the number of taxi rides was steady and in the case of Brooklyn and Queens, rising. The overall size of the market grew from approximately 48 million rides in June quarter 2014 to 51 million rides in June quarter 2015.
106 Jay Hathaway, ‘NYC Has Impounded 500 Uber Cars Since April for Picking Up Illegal Fares’, Gawker (online), 17 June 2015, <http://gawker.com/nyc-
has-impounded-500-uber-cars-since-april-for-picking-1712012779>.107 James Hickman, ‘Uber Has Only Just Begun to Crush New York’s Yellow Cab Medallions’, The Street (online), 10 September 2015, <http://www.
thestreet.com/story/13283548/1/uber-has-only-just-begun-to-crush-new-york%E2%80%99s-yellow-cab-medallions.html> .108 Carl Bialik, Andrew Flowers, Reuben Fischer-Baum and Dhrumil Mehta, ‘Uber Is Serving New York’s Outer Boroughs More Than Taxis Are’,
FiveThirtyEight (online), 10 August 2015, <http://fivethirtyeight.com/features/uber-is-serving-new-yorks-outer-boroughs-more-than-taxis-are/>.
Rev
enue
in U
SD m
illio
ns

59 Economic effects of ridesharing in Australia
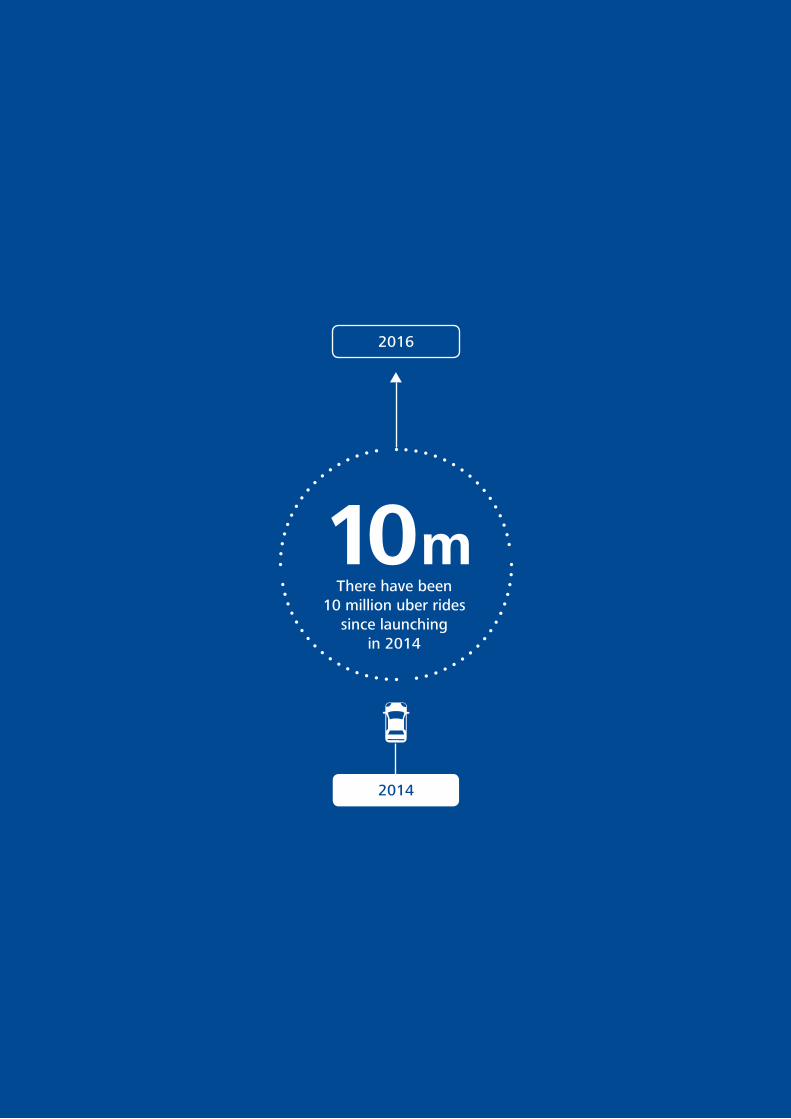
60Economic effects of ridesharing in Australia
There have been 10 million uber rides
since launching in 2014
10m
2014
2016
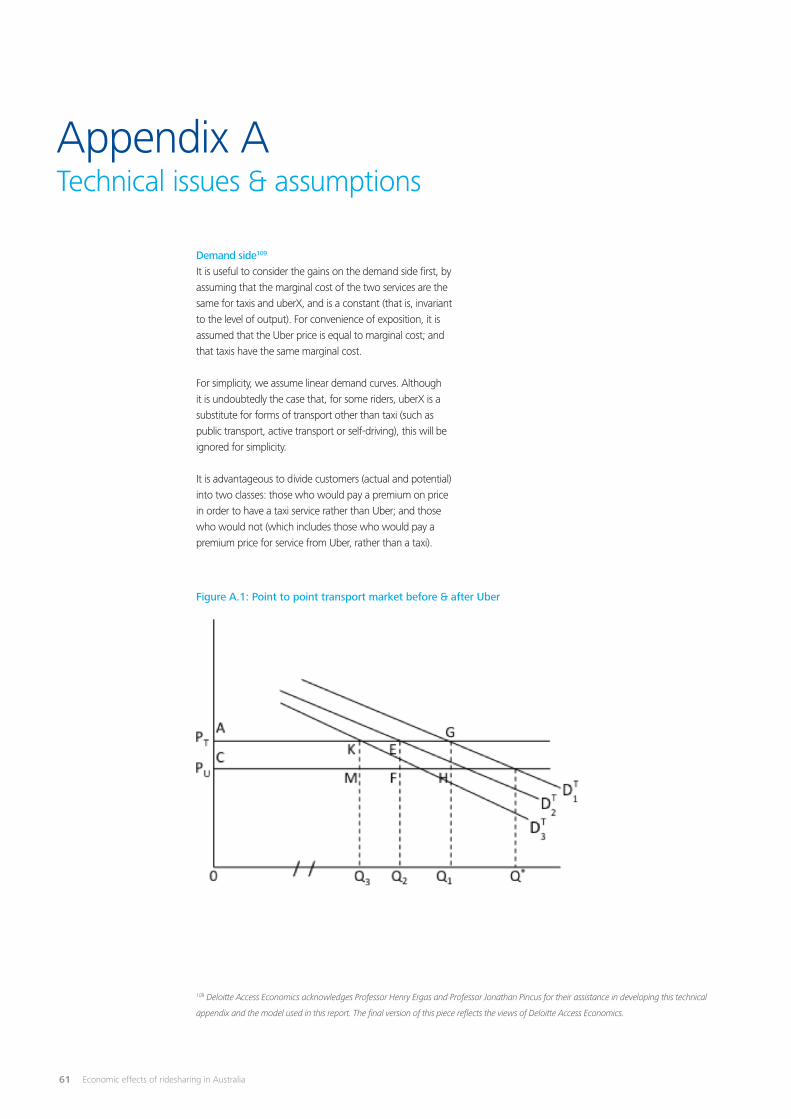
61 Economic effects of ridesharing in Australia
Demand side109 It is useful to consider the gains on the demand side first, by assuming that the marginal cost of the two services are the same for taxis and uberX, and is a constant (that is, invariant to the level of output). For convenience of exposition, it is assumed that the Uber price is equal to marginal cost; and that taxis have the same marginal cost.
For simplicity, we assume linear demand curves. Although it is undoubtedly the case that, for some riders, uberX is a substitute for forms of transport other than taxi (such as public transport, active transport or self-driving), this will be ignored for simplicity.
It is advantageous to divide customers (actual and potential) into two classes: those who would pay a premium on price in order to have a taxi service rather than Uber; and those who would not (which includes those who would pay a premium price for service from Uber, rather than a taxi).
Figure A.1: Point to point transport market before & after Uber
109 Deloitte Access Economics acknowledges Professor Henry Ergas and Professor Jonathan Pincus for their assistance in developing this technical
appendix and the model used in this report. The final version of this piece reflects the views of Deloitte Access Economics.
Appendix ATechnical issues & assumptions
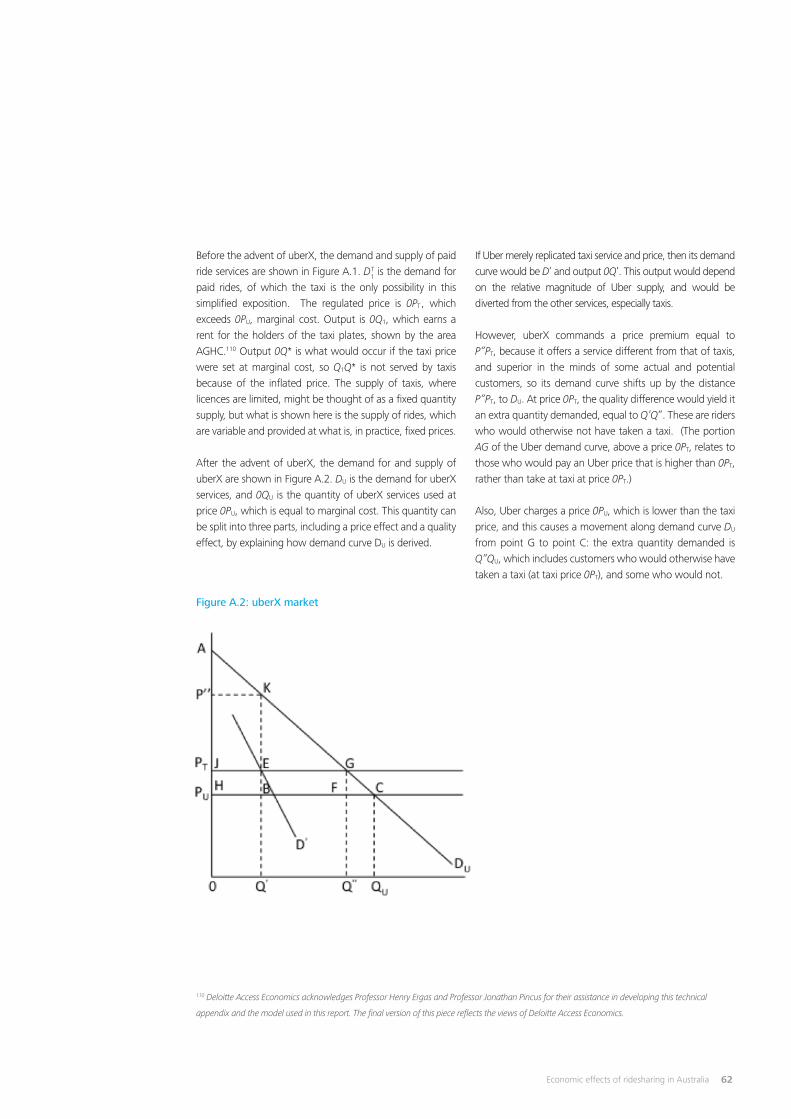
62Economic effects of ridesharing in Australia
Before the advent of uberX, the demand and supply of paid ride services are shown in Figure A.1. DT
1 is the demand for paid rides, of which the taxi is the only possibility in this simplified exposition. The regulated price is 0PT , which exceeds 0PU, marginal cost. Output is 0Q1, which earns a rent for the holders of the taxi plates, shown by the area AGHC.110 Output 0Q* is what would occur if the taxi price were set at marginal cost, so Q1Q* is not served by taxis because of the inflated price. The supply of taxis, where licences are limited, might be thought of as a fixed quantity supply, but what is shown here is the supply of rides, which are variable and provided at what is, in practice, fixed prices.
After the advent of uberX, the demand for and supply of uberX are shown in Figure A.2. DU is the demand for uberX services, and 0QU is the quantity of uberX services used at price 0PU, which is equal to marginal cost. This quantity can be split into three parts, including a price effect and a quality effect, by explaining how demand curve DU is derived.
If Uber merely replicated taxi service and price, then its demand curve would be D’ and output 0Q’. This output would depend on the relative magnitude of Uber supply, and would be diverted from the other services, especially taxis.
However, uberX commands a price premium equal to P”PT, because it offers a service different from that of taxis, and superior in the minds of some actual and potential customers, so its demand curve shifts up by the distance P”PT, to DU. At price 0PT, the quality difference would yield it an extra quantity demanded, equal to Q’Q”. These are riders who would otherwise not have taken a taxi. (The portion AG of the Uber demand curve, above a price 0PT, relates to those who would pay an Uber price that is higher than 0PT, rather than take at taxi at price 0PT.)
Also, Uber charges a price 0PU, which is lower than the taxi price, and this causes a movement along demand curve DU from point G to point C: the extra quantity demanded is Q”QU, which includes customers who would otherwise have taken a taxi (at taxi price 0PT), and some who would not.
Figure A.2: uberX market
110 Deloitte Access Economics acknowledges Professor Henry Ergas and Professor Jonathan Pincus for their assistance in developing this technical
appendix and the model used in this report. The final version of this piece reflects the views of Deloitte Access Economics.
63 Economic effects of ridesharing in Australia
Price elasticity of demand for ridesharingThe price elasticity of taxi services has been examined in a number of industry reports. For example, analysis conducted for the NSW Independent Pricing & Regulatory Tribunal (IPART) assumes an elasticity of -0.8. 111
Ridesharing services share similarities with taxi services, and therefore the elasticities reported above may provide some indication as to the elasticity of demand for uberX. However, it is likely that the demand facing a single company would be more elastic than the demand for the entire market; that is, consumers would be more responsive to a change in price, as they can easily substitute for another company.
Deloitte Access Economics calculated the price elasticity of demand for uberX services across Australia. The Australia-wide elasticity was calculated with reference to a 10 per cent price increase on 7 August 2015, based on the change in quantity demanded net of the average rate of fortnightly growth. This elasticity was adopted as the lower bound for this report.
Elasticity is influenced by any substitutes available in the market. Recent analysis conducted by the Centre for International Economics for the ACT Taxi Industry Innovation Reforms found that price elasticity of taxi services in a world without ridesharing is -0.8, but in a world where ridesharing exists, that elasticity is -1.2. The report assumed that the price elasticity for ridesharing services is -2.0. 112
Given that higher absolute elasticities would tend to increase the estimate of the consumer benefits of ridesharing (i.e. that consumer benefits would be higher at an elasticity of -1 than at -2), for the purposes of this report, a range for the elasticity of uberX of from -1.27 to –3.00 has been adopted, with the core assumption being at the approximate midpoint of -2.00.
The elasticity for uberX services may change over time as it grows into different parts of the market.
Uber demand due to price and quality We need to divide uberX output, 0QU, into three parts: that due to price, that due quality and the remainder, which is what Uber would enjoy if it were merely another taxi company; and further divide the part due to price into new business and transferred. These estimates require us to define the demand curve.
We will assume that the uberX demand curve is linear, with elasticity LU at point C, that is, at the uberX market quantity and price. At point A in Figure A.2, Uber demand would be zero. Therefore, by the method of similar triangles, the quantity effect of any price rise, $X, is given by the ratio X/(A-PU).113 The boost to Uber demand from the lower price, distance FC or Q”QU, is readily calculated from the price difference.
D’ is the demand curve in the hypothetical situation when Uber is merely another taxi company. Uber would then charge 0PT and sell OQ’. Thus far, we have not fixed 0Q’: this can be done geometrically, if we knew the distance P”PT (or KE), which sets the price at which Uber would gather no more customers than if it were a mere taxi company charging 0PT: the price premium P”PT exactly offsets the quality advantage of Uber. By geometry, once the ratio P”PT to APT is set, it is possible to calculate the distance EG (= BF). The quality premium assigned must be less than the difference between the limit price, which is the difference between the limit price at which Uber demand would be zero, shown by 0A in Figure A.2 and the Uber price.
As described in Chapter 2.3, Uber provides significant differentiated benefits compared to existing operators in the taxi industry. By appealing to different market segments, Uber provides differentiated services in the point-to-point transport market. For simplicity in this report, we show this difference as a price premium P”PT. equal to $4.
111 IPART, Sydney taxi fares to apply and new licences to be released from July 2015 (2015) 30.112 Centre for International Economics, Modelling of policy scenarios for the ACT on-demand transport sector – Prepared for ACT Government (2015) 5.113 This is attained by manipulation of the definition of price elasticity, as η=(ΔQ/Q)÷(ΔP/P)⇒ΔP=P/η when ΔQ=Q.
64Economic effects of ridesharing in Australia
We now turn to the of Uber business that is due to price. A plausible way to divide Q”QU into two components, new business and business attracted from taxi, is to assume that the additional Uber custom, those attracted by the price cut, has the same share of new customers as would have been obtained if Uber had charged the same price as taxis; that is, in the ratio EG:JE.
In Figure A.1, as a consequence of the advent of Uber, the taxi demand curve shifts to the left, from DT
1 to DT2 , and taxi service
output falls to 0Q2. This fall is entirely due to what we have earlier called the relative supply effect, that is, it is not due to the superior quality of Uber and it is not due to the lower price of Uber: Q’Q1 in Figure A.1 is equal to 0Q’ in Figure A.2. But, in addition, as has just been discussed, taxis lose custom because of the lower Uber price. This is illustrated by the shift in demand curve from DT
2 to DT3, so the loss of rent on taxi
plates is equal to area KGHM in Figure A.1.
Social gainThe social gain from Uber’s operation in these circumstances is the consumer surplus in the Uber market, shown as the consumer surplus triangle ACH in Figure A.2, less the rectangle rent KGHM in Figure A.1, which is transferred from taxi plate holders. The size of the consumer surplus triangle is ½(A− PU)*QU.
The loss of consumer surplus in the taxi market should not be offset against the consumer surplus gain in the Uber market. In explanation: the demand curve DU shows the willingness to pay for Uber services, given that the alternative is to take a taxi; that is to say, the willingness of any Uber rider to pay for Uber service is net of the loss of any consumer surplus that he or she would have obtained if the rider had taken a cab instead of Uber. Note also that the remaining taxi users have suffered no loss.
From these must be subtracted the reduction in taxi rents. We have made the simplifying assumption that the rent per trip is equal to the difference between the average taxi and average Uber fare, namely, PT−PU. Dominating the net gain is the large consumer surplus triangle, ACH. This area cumulates the gaps between the willingness of Uber customers to pay for Uber services, and the price that Uber charge.


![The SIGSPATIAL Special · ing. Ridesharing can be either static or dynamic [9, 10]. Most ridesharing systems operating today belong to static ridesharing, which arrange the driver](https://img.pdfslide.us/doc/110x75/5ed37bb0847f87317f77be5b/the-sigspatial-special-ing-ridesharing-can-be-either-static-or-dynamic-9-10.jpg)