Embed Size (px)
Citation preview

Effects of vegetation on hydrology in
Australia
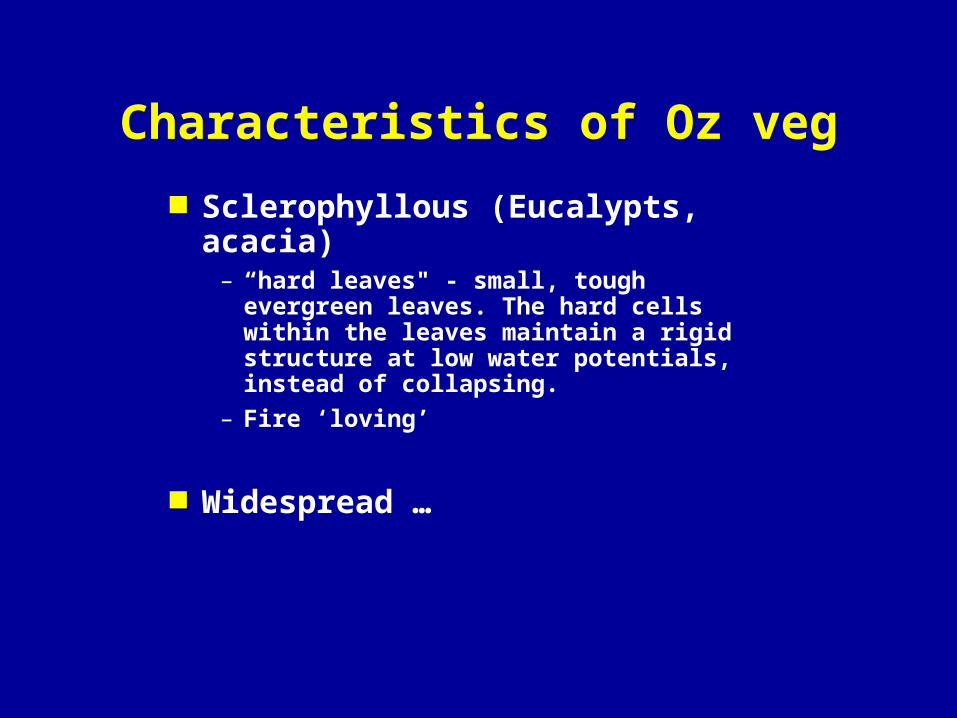
Characteristics of Oz veg
Sclerophyllous (Eucalypts, acacia)– “hard leaves" - small, tough evergreen
leaves. The hard cells within the leaves maintain a rigid structure at low water potentials, instead of collapsing.
– Fire ‘loving’
Widespread …
Effects of vegetation on hydrology/hydraulics
Issues associated with vegetation and hydrology/hydraulics
Input to water tables = Salinity Proportion of water to Runoff
– Salinity revegetation
– Fire and water supply
Water quality = Temperature
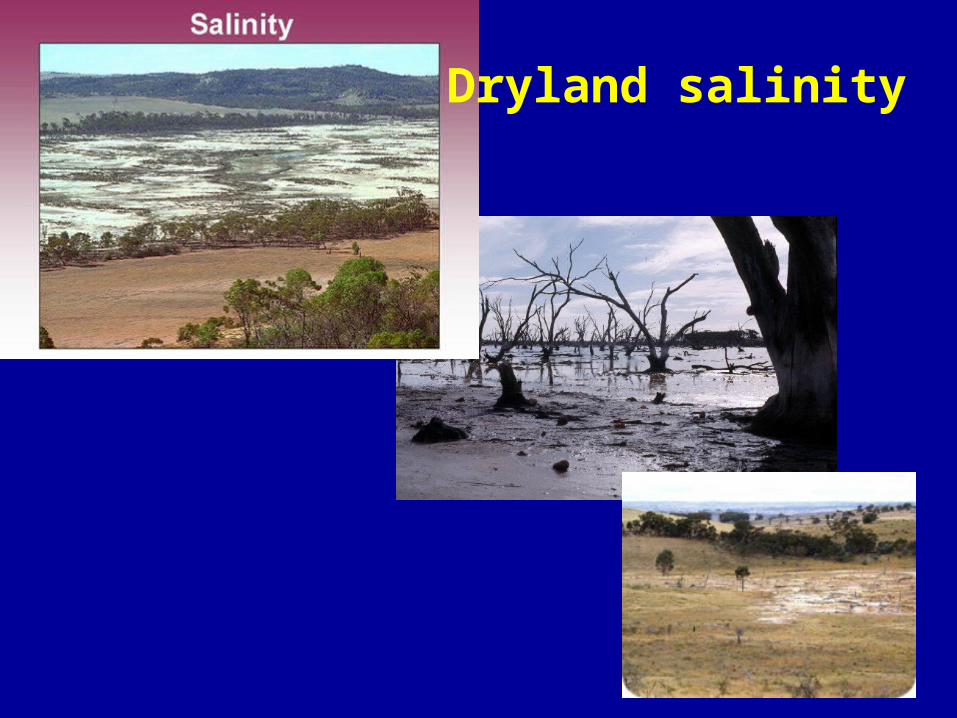
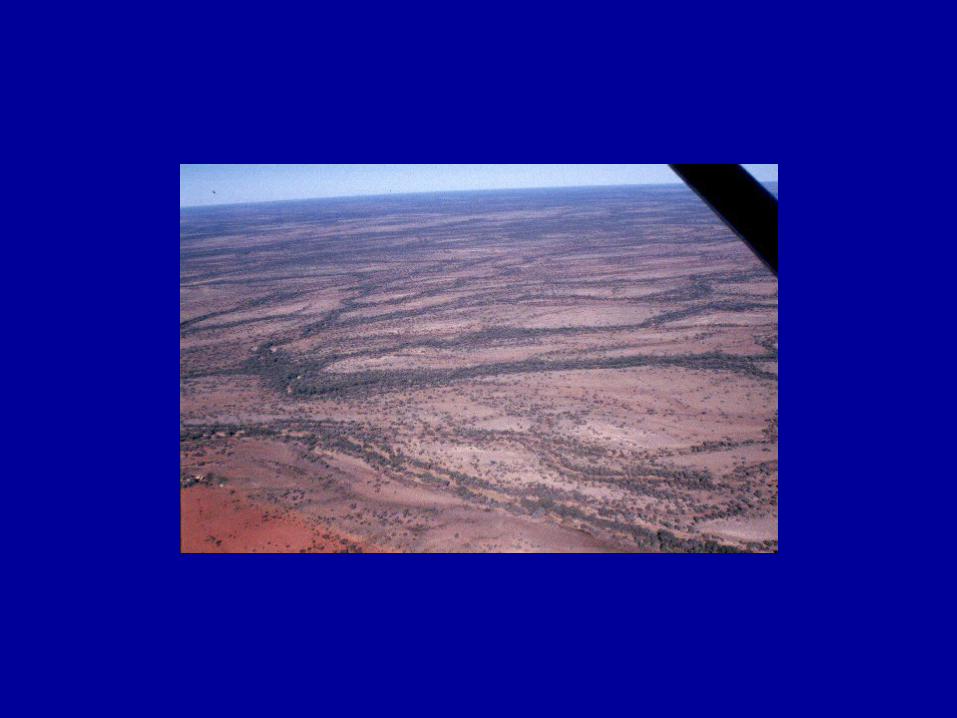
Dryland salinity
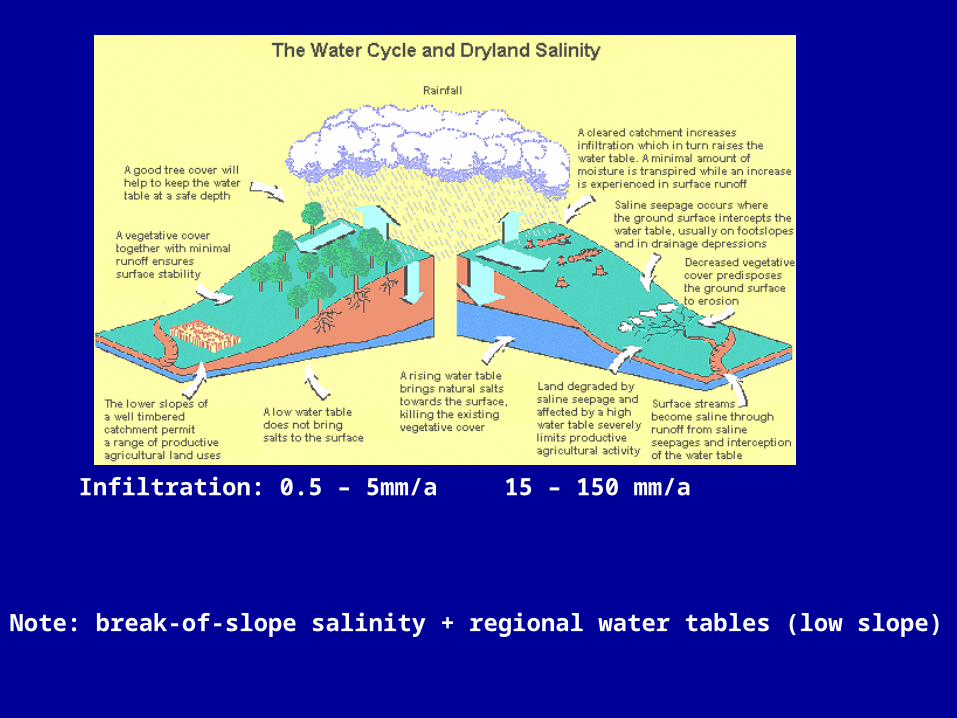
Note: break-of-slope salinity + regional water tables (low slope)
Infiltration: 0.5 – 5mm/a 15 – 150 mm/a
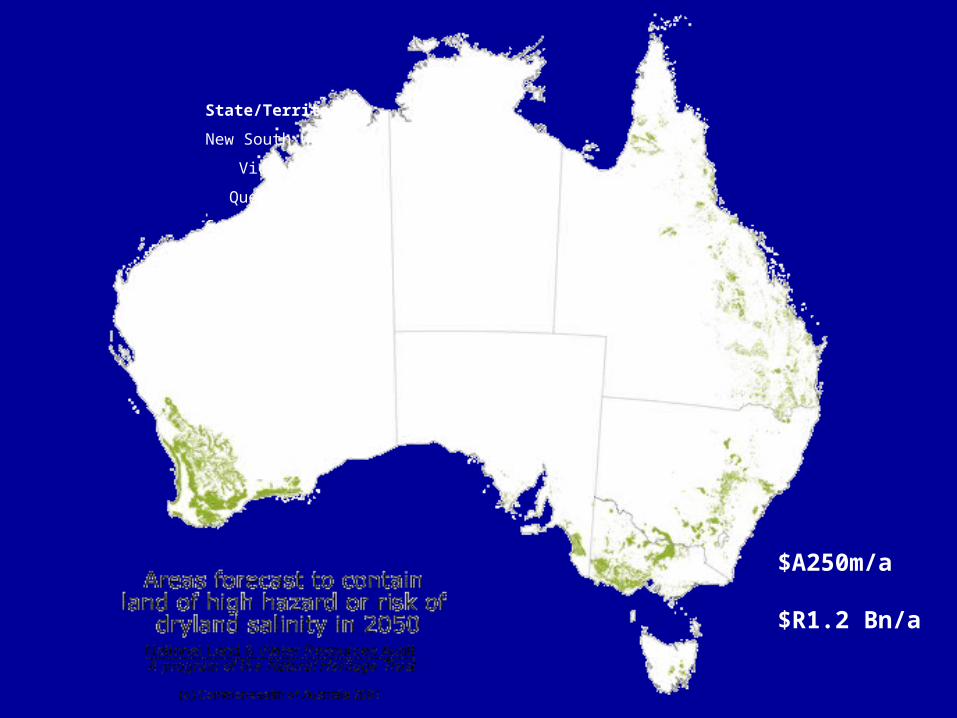
State/Territory 2050
New South Wales 1 300 000
Victoria 3 110 000
Queensland 3 100 000
South Australia 600 000
Western Australia 8 800 000
Tasmania 90 000
Total 17 000 000
$A250m/a
$R1.2 Bn/a
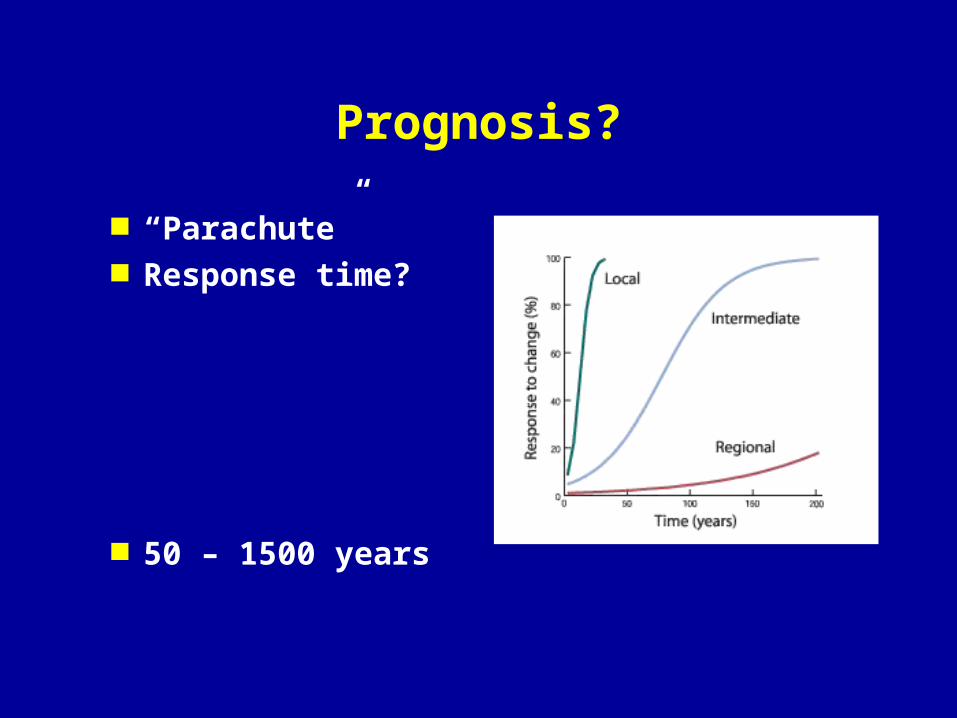
Prognosis?
“Parachute” Response time?
50 – 1500 years
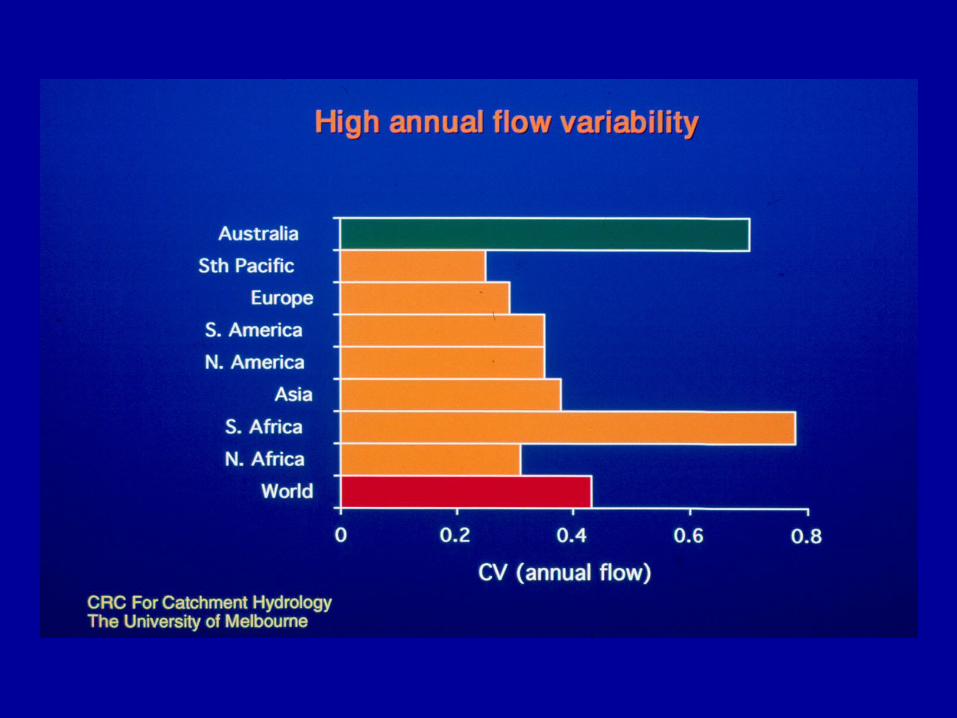
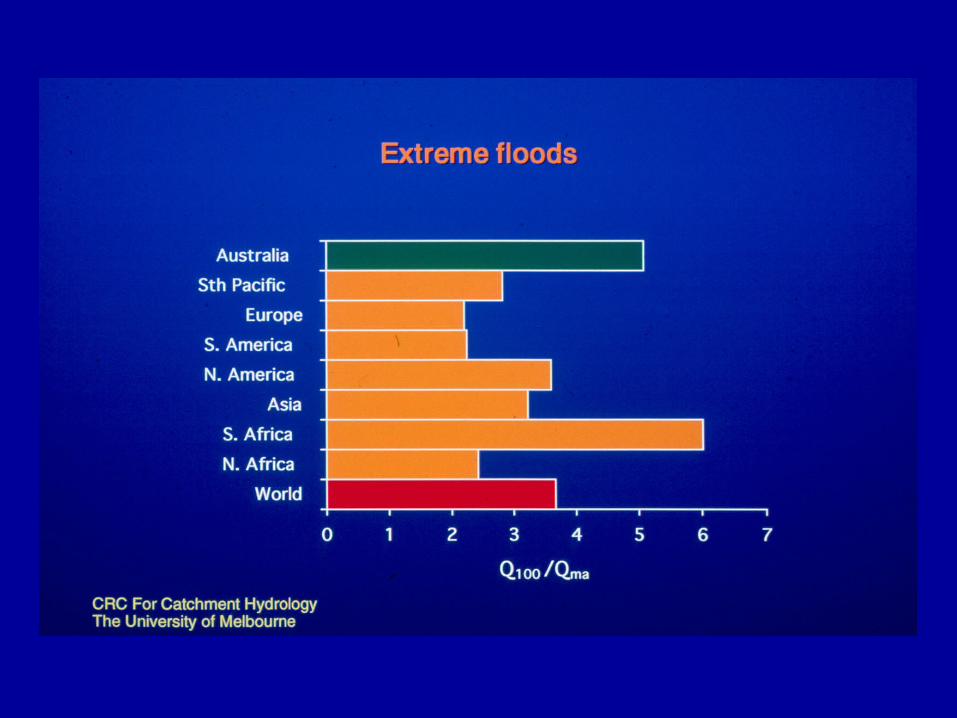
Effects of vegetation on runoff
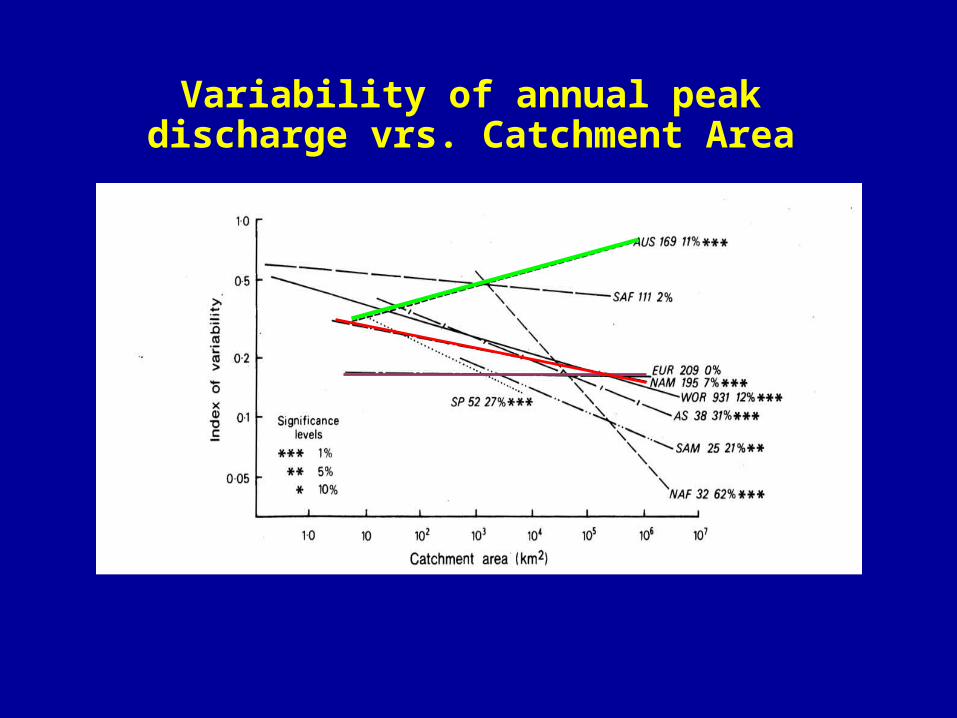
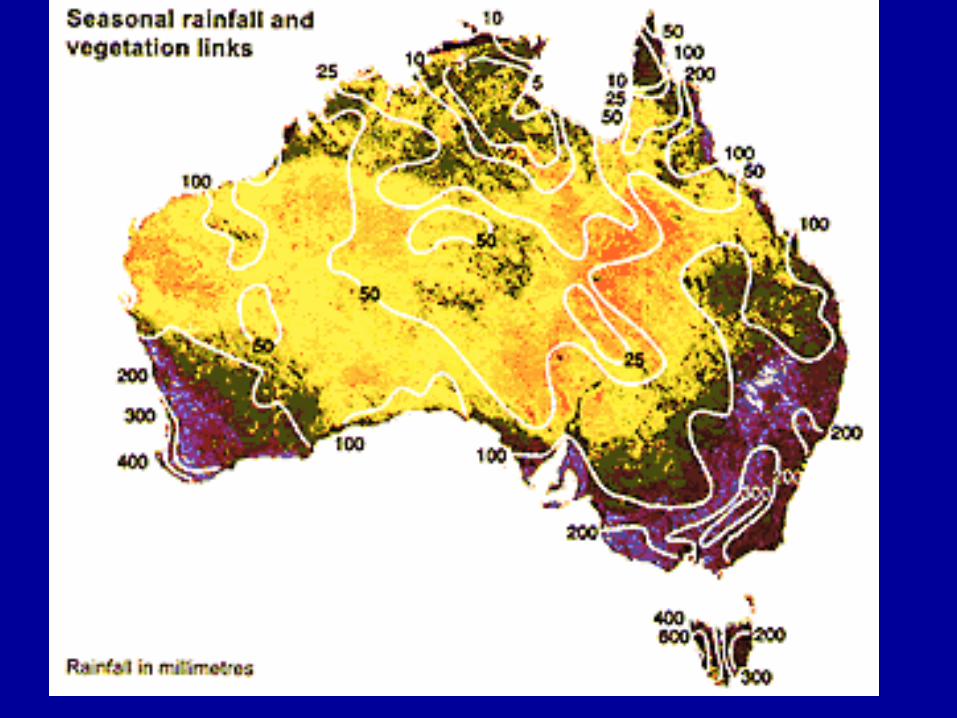
Variability of annual peak discharge vrs. Catchment Area
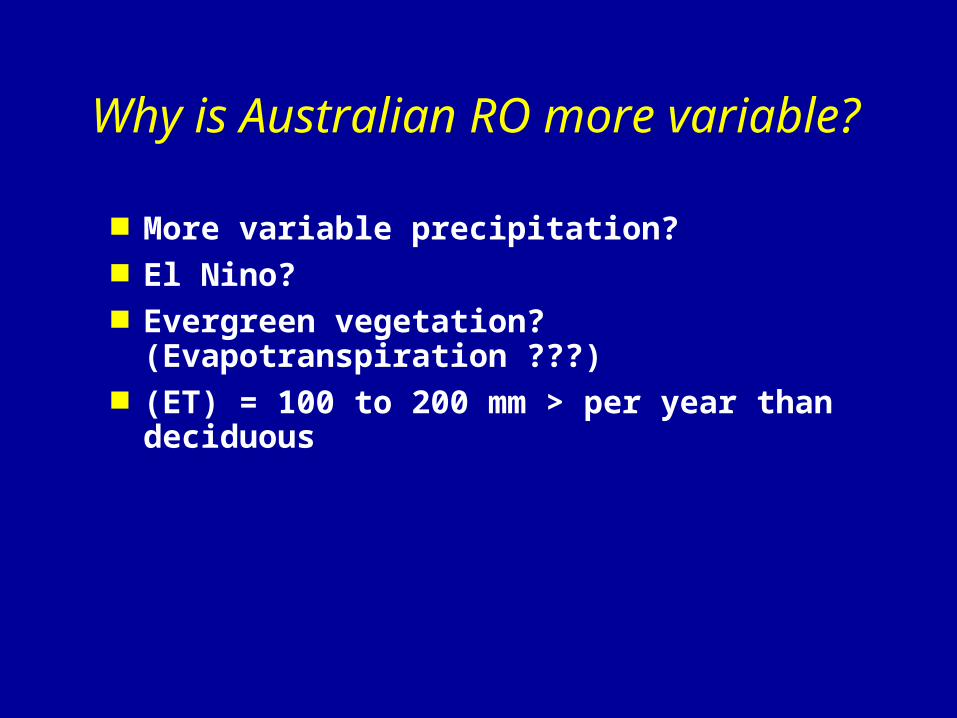
More variable precipitation? El Nino? Evergreen vegetation?
(Evapotranspiration ???) (ET) = 100 to 200 mm > per year than
deciduous
Why is Australian RO more variable?
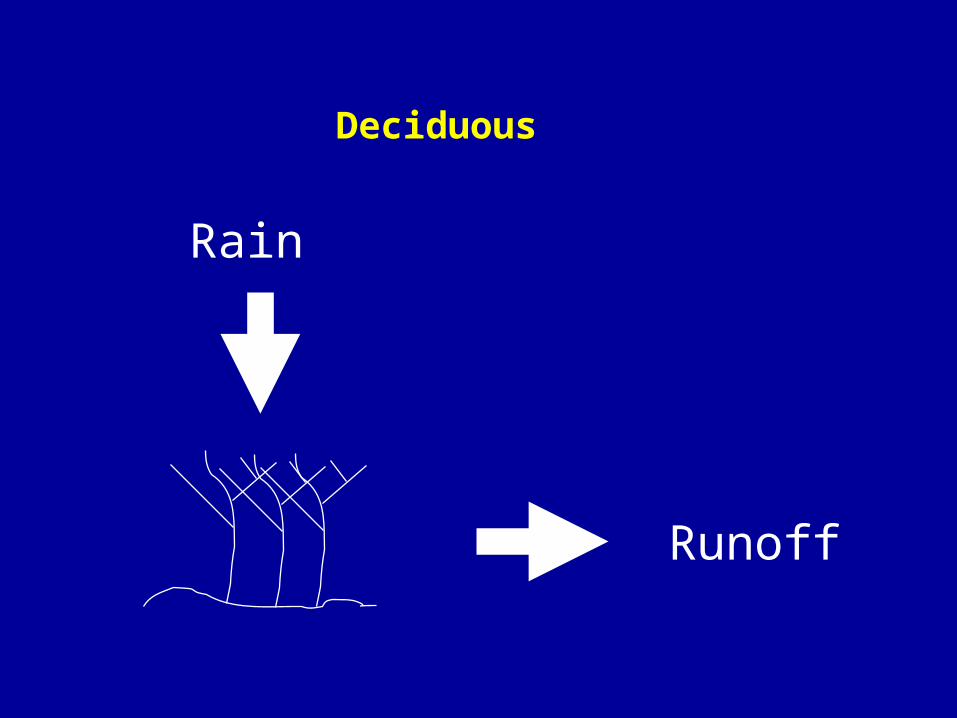
Deciduous
Rain
Runoff
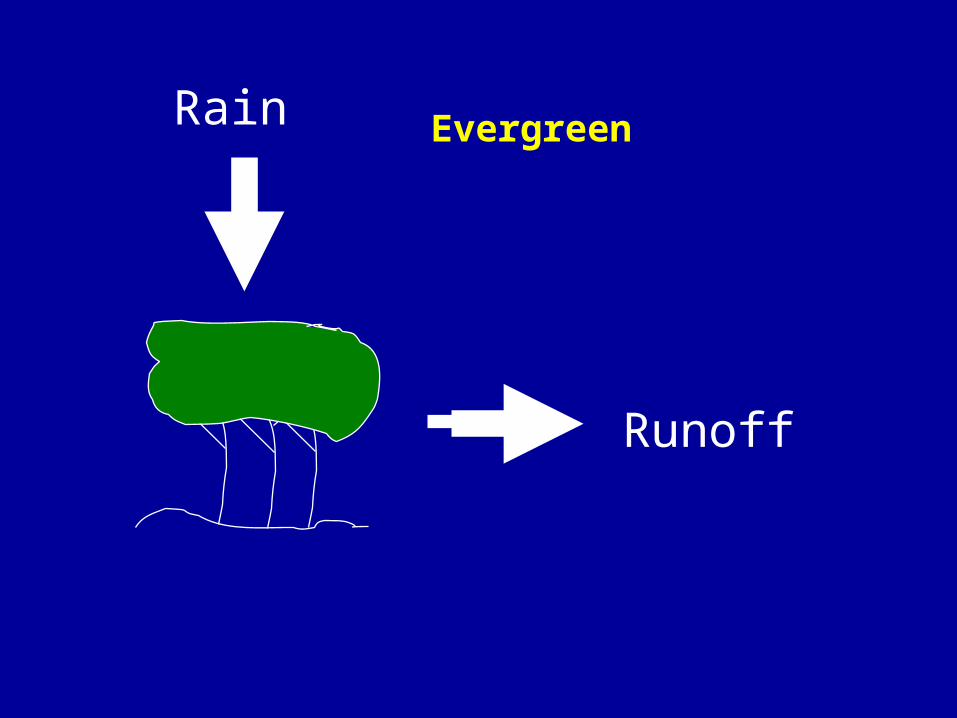
Evergreen
Runoff
Rain
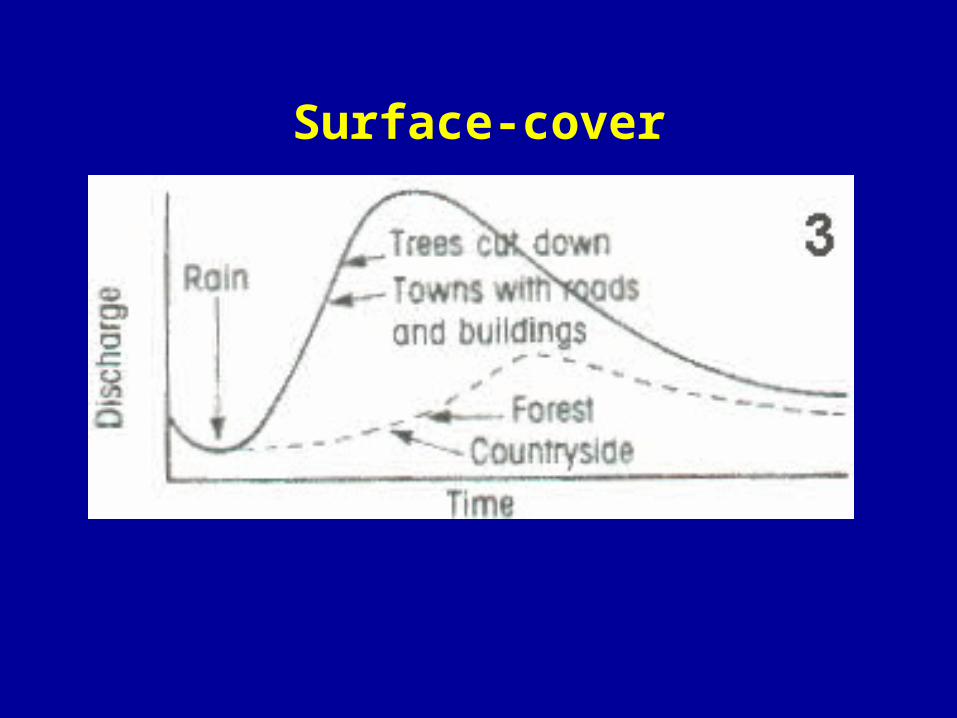
Surface-cover
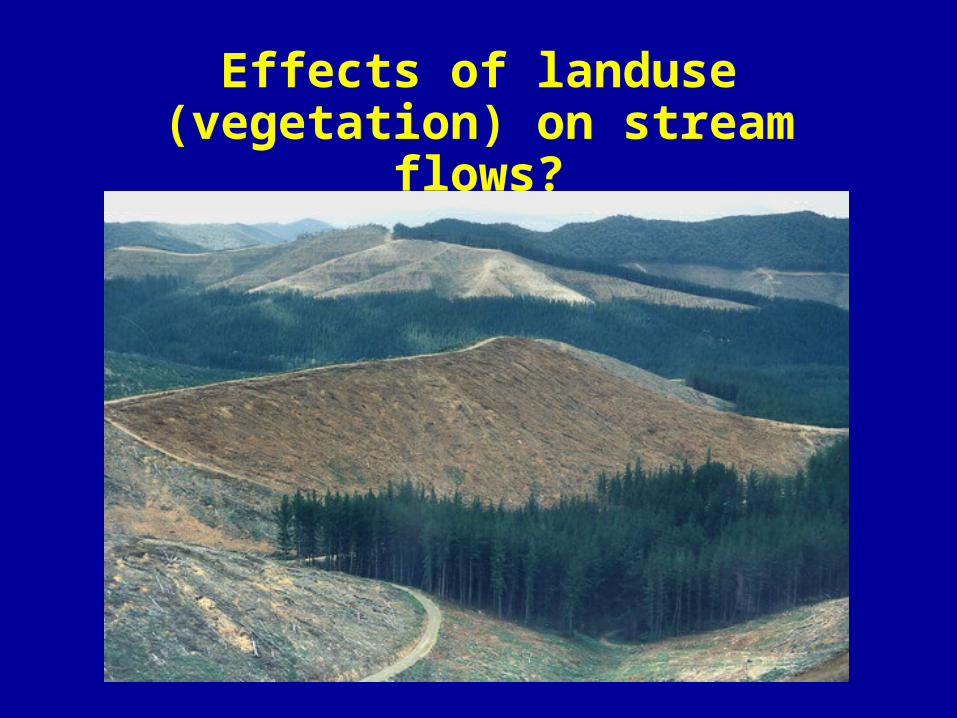
Effects of landuse (vegetation) on stream flows?
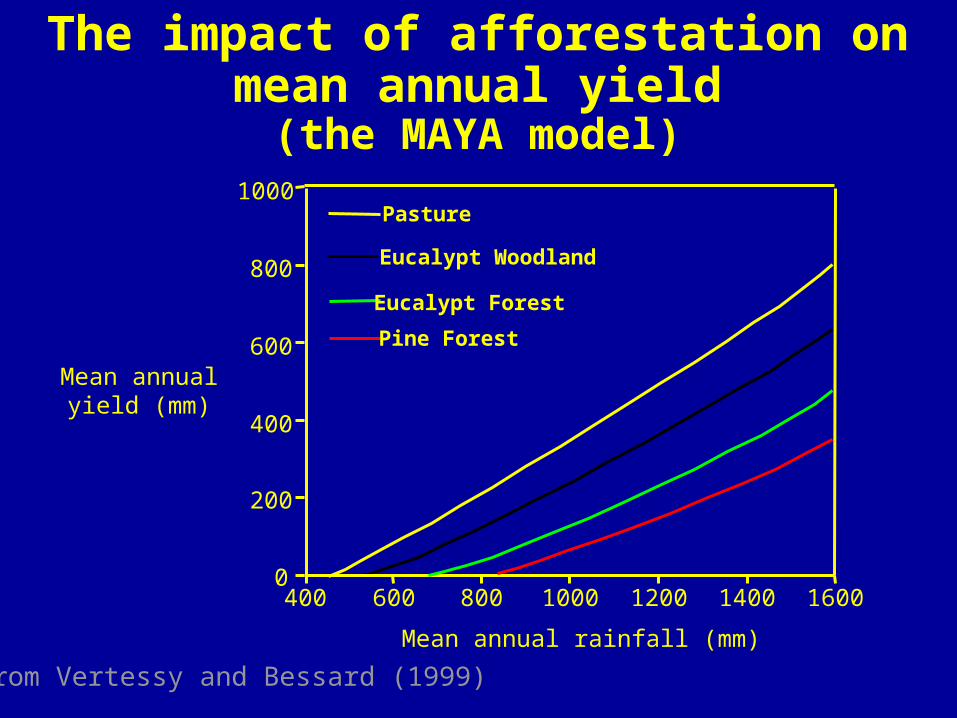
Eucalypt Woodland
0
200
400
600
800
1000
400 600 800 1000 1200 1400 1600
Pasture
Mean annual rainfall (mm)
Mean annualyield (mm)
Eucalypt Forest
Pine Forest
from Vertessy and Bessard (1999)
The impact of afforestation on mean annual yield
(the MAYA model)
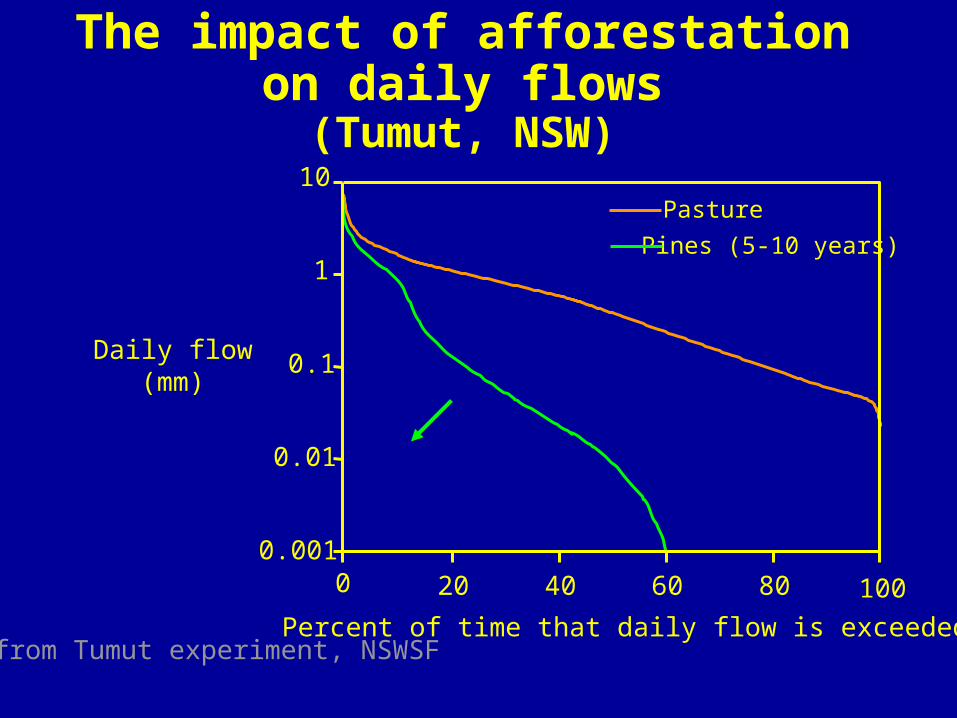
The impact of afforestation on daily flows
(Tumut, NSW)
0.01
0.001
0.1
1
10
0 20 40 60 80 100
Pasture
Percent of time that daily flow is exceeded
Daily flow(mm)
Pines (5-10 years)
from Tumut experiment, NSWSF
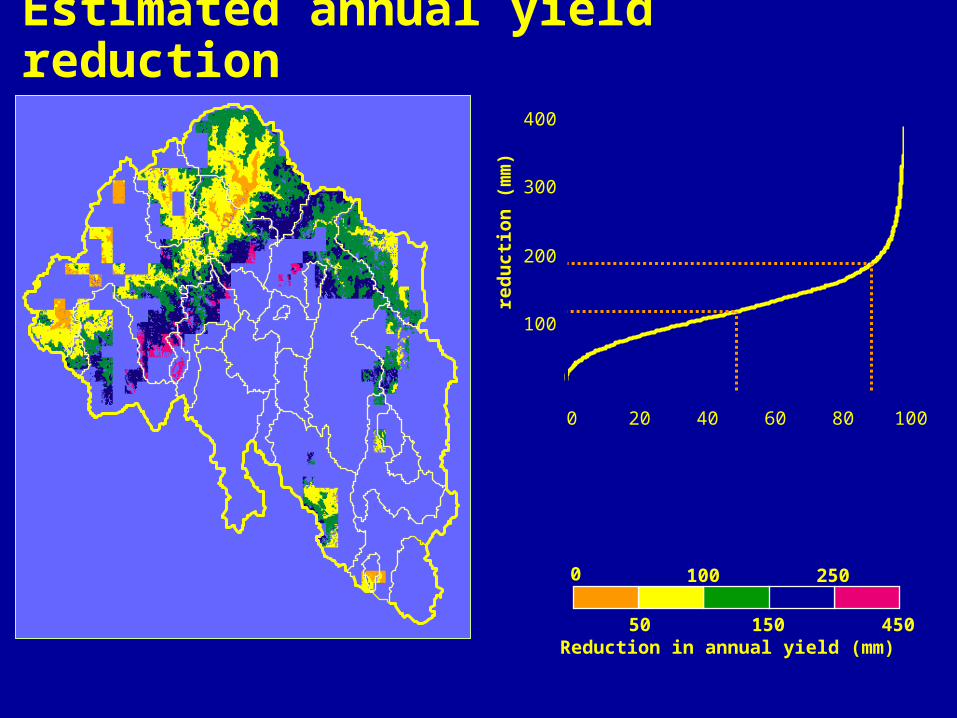
Reduction in annual yield (mm)
0
50
100
150
250
450
0
100
200
300
400
0 20 40 60 80 100
red
uct
ion
(m
m)
% planted area
Estimated annual yield reduction
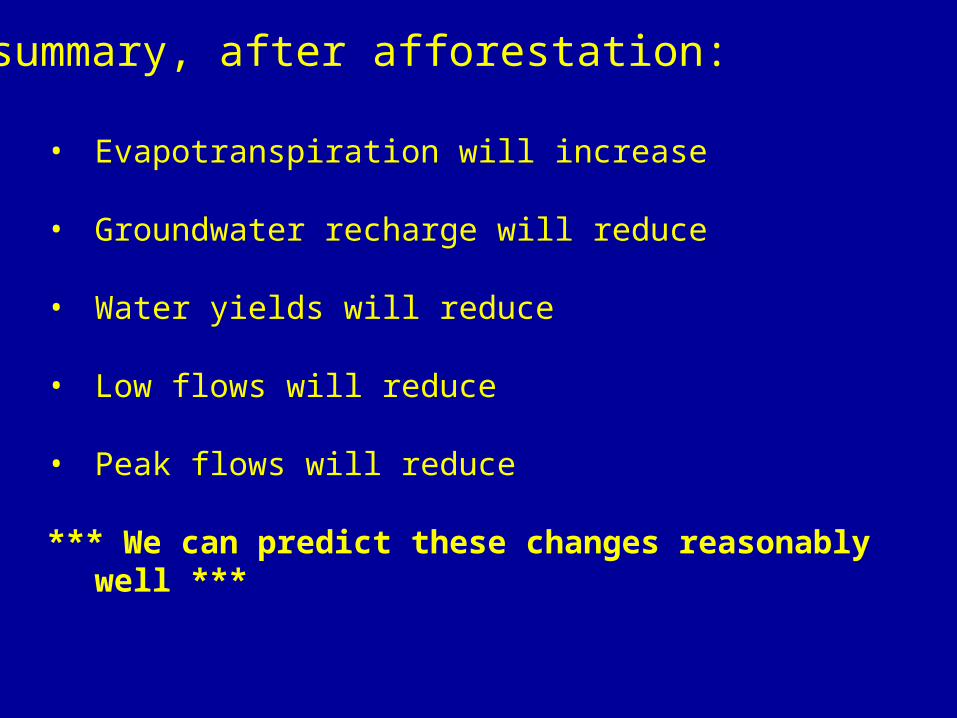
• Evapotranspiration will increase
• Groundwater recharge will reduce
• Water yields will reduce
• Low flows will reduce
• Peak flows will reduce
*** We can predict these changes reasonably well ***
In summary, after afforestation:

The dilution effect: a plausible afforestation scenario
upland afforestationcommences
lowland groundwaterrelaxation may start
flow
salt concentration
years
0 1005 40 80
Runoff and water supply + fires
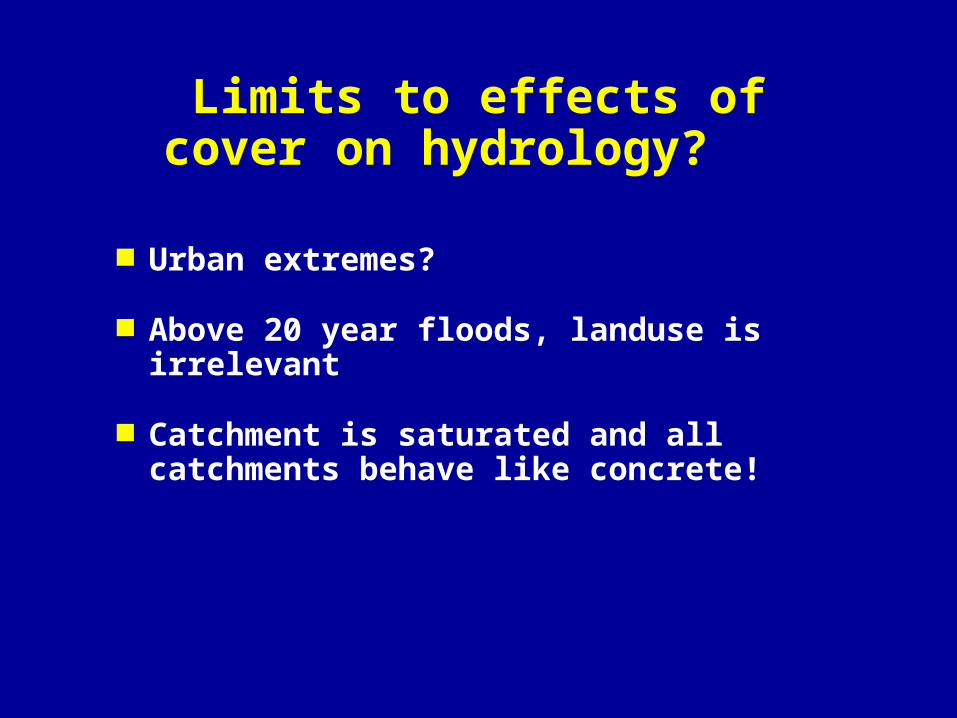
Limits to effects of cover on hydrology?
Urban extremes?
Above 20 year floods, landuse is irrelevant
Catchment is saturated and all catchments behave like concrete!
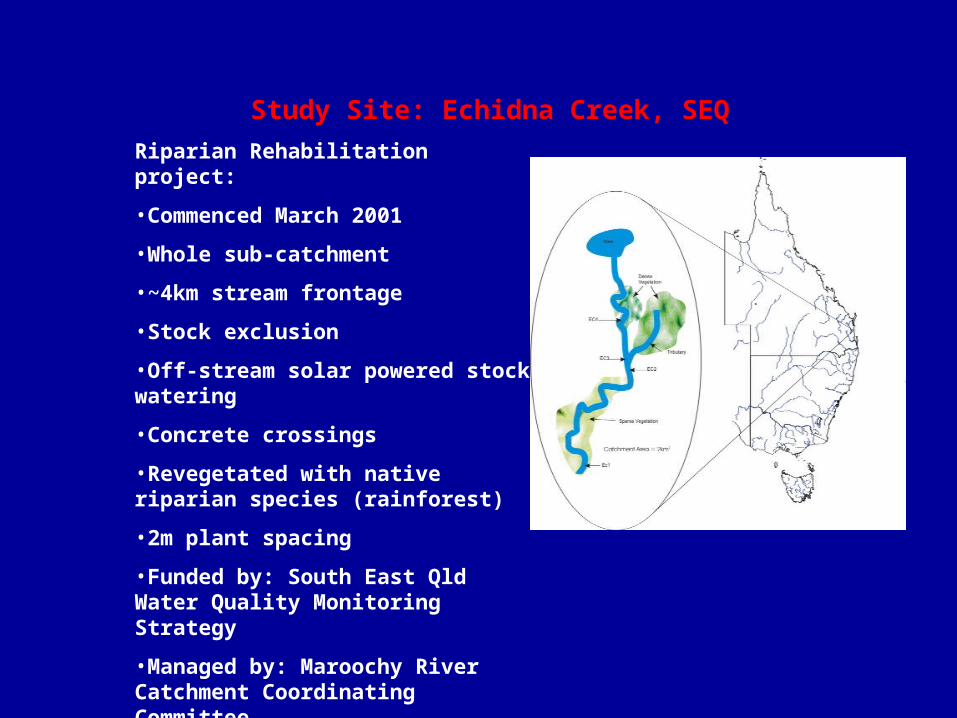
Study Site: Echidna Creek, SEQ
Riparian Rehabilitation project:
•Commenced March 2001
•Whole sub-catchment
•~4km stream frontage
•Stock exclusion
•Off-stream solar powered stock watering
•Concrete crossings
•Revegetated with native riparian species (rainforest)
•2m plant spacing
•Funded by: South East Qld Water Quality Monitoring Strategy
•Managed by: Maroochy River Catchment Coordinating Committee
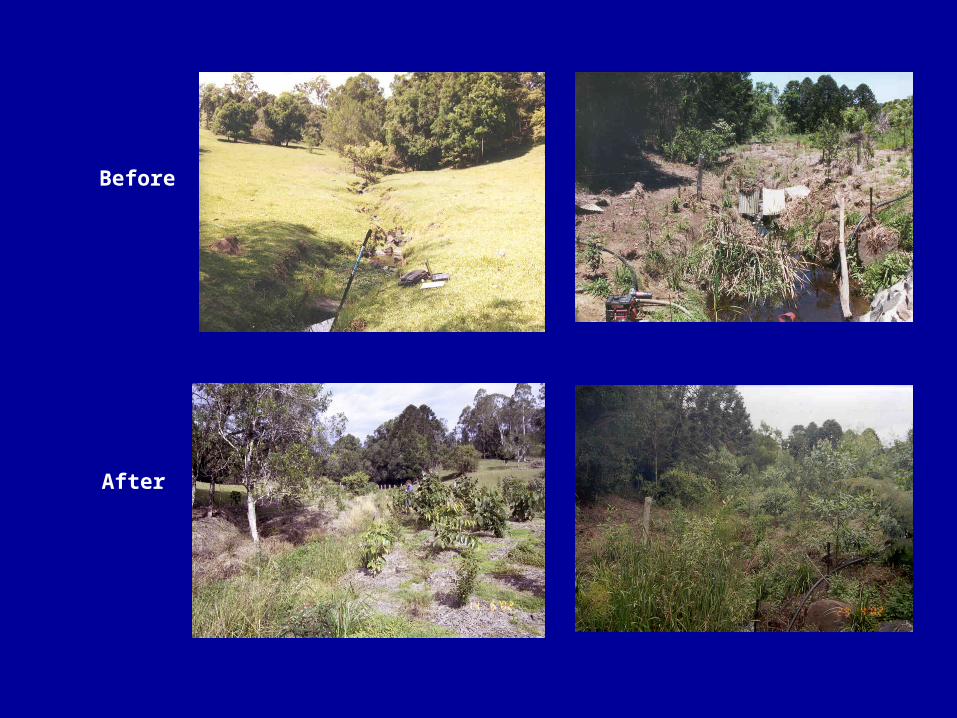
Before
After
18
20
22
24
26
28
30
32
34
36
25/1
1/01
30/1
1/01
05/1
2/01
10/1
2/01
15/1
2/01
20/1
2/01
25/1
2/01
30/1
2/01
04/0
1/02
09/0
1/02
14/0
1/02
19/0
1/02
24/0
1/02
29/0
1/02
03/0
2/02
08/0
2/02
13/0
2/02
18/0
2/02
23/0
2/02
28/0
2/02
05/0
3/02
Tem
pera
ture
(D
eg C
) EC1
EC2
EC3
EC4
D1
P1
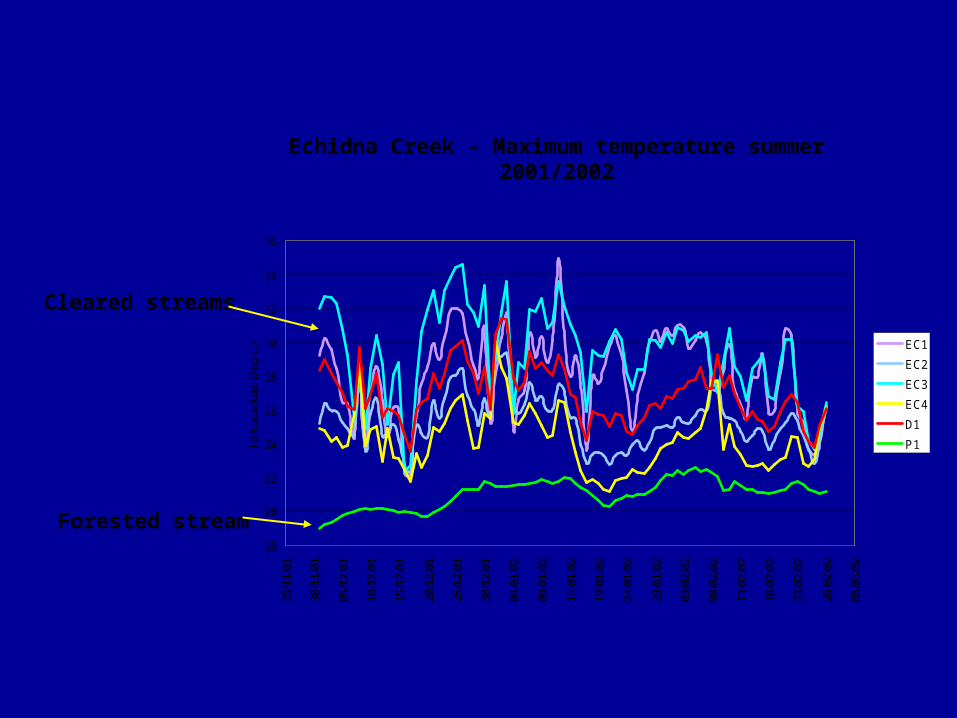
Echidna Creek - Maximum temperature summer 2001/2002
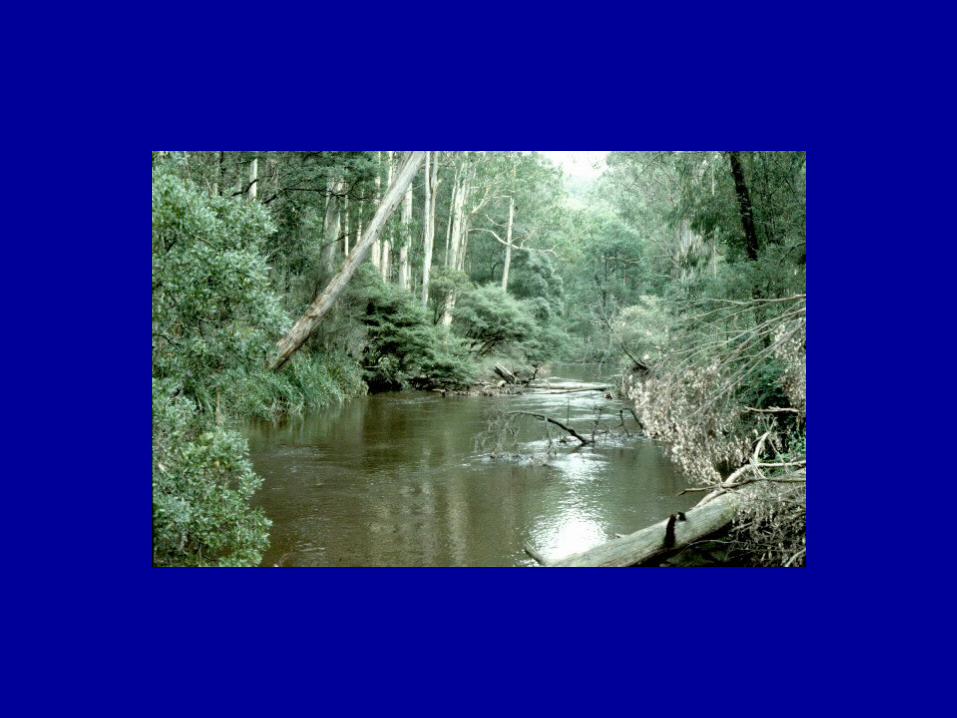
Forested stream
Cleared streams
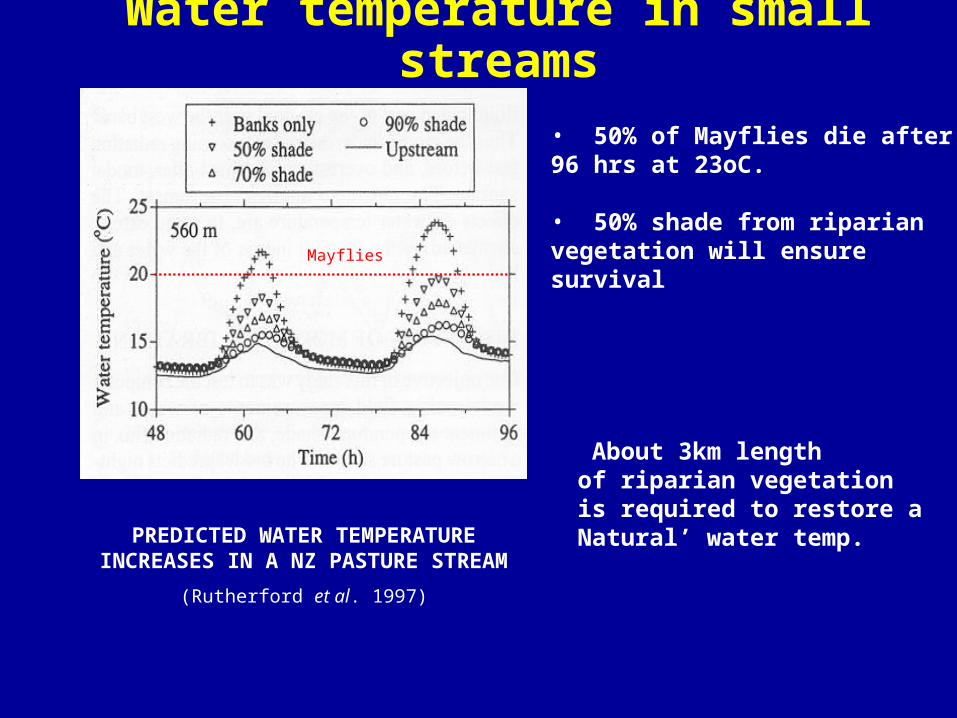
Water temperature in small streams
PREDICTED WATER TEMPERATURE INCREASES IN A NZ PASTURE STREAM
(Rutherford et al. 1997)
Mayflies
About 3km length of riparian vegetation is required to restore a Natural’ water temp.
• 50% of Mayflies die after96 hrs at 23oC.
• 50% shade from riparian vegetation will ensure survival

Summary
Sclerophyllous vegetation affects all aspects of hydrograph
Clearing, fire = rising water table and salinity Reforestation = decreasing runoff Shade = decreased water temperatures
Next lecture
Other controls on the hydrograph Regionalisation Begin on geomorphology!