Embed Size (px)
Citation preview
Chapter 1 Economic Development & Land Use
Chicago Central Area ACTION Plan
Chicago Central Area ACTION Plan
Page 1-2 Chapter 1: Economic Development & Land UseAugust 2009
87,794
165,500
111,742
215,000
230,000
50,000
75,000
100,000
125,000
150,000
175,000
200,000
225,000
250,000
1990 Census 2000 Census 2007 Estimate 2020 Projection
Popu
lati
on
Actuals Base Case Opportunity Scenario
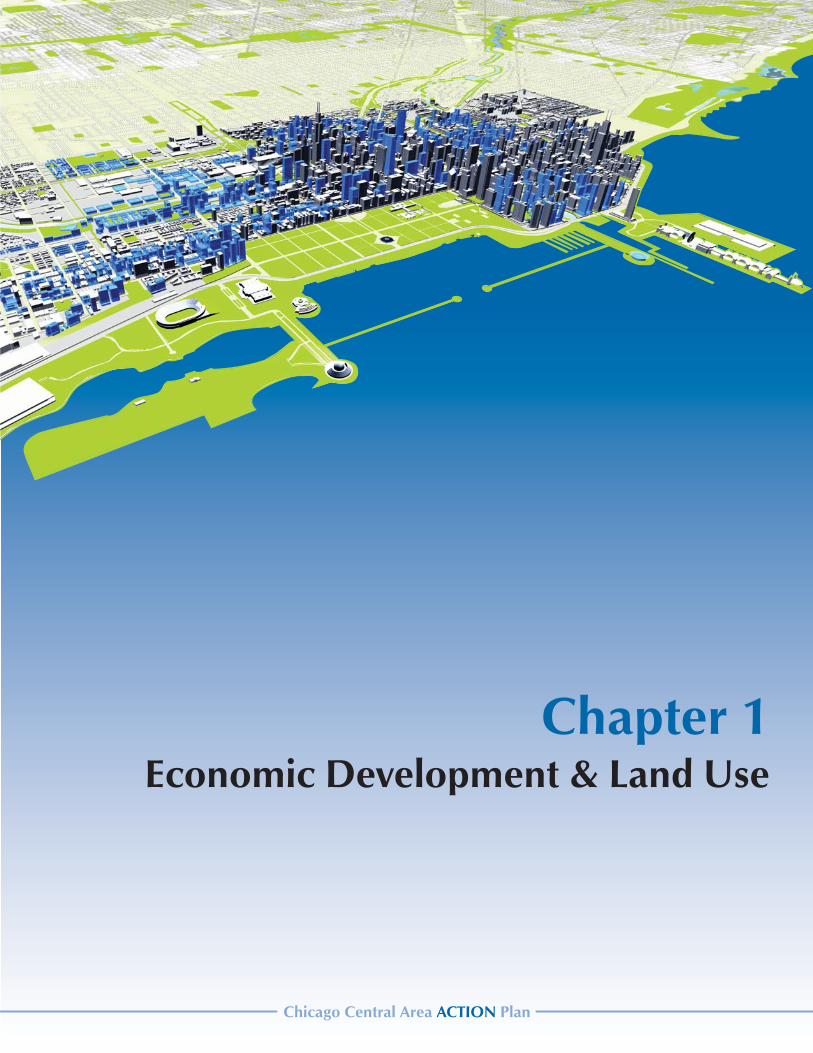
The 2003 Central Area Plan com-bined an economic sector analy-
sis with a comprehensive physical plan. It included an analysis of annual demand for land by market sector through 2020 under both a current-trend (base-case) scenario and an opportunity (best-case) scenario. The base-case scenario accounts for the current downturn in the economy and assumes moderate levels of public and private investment. The opportunity scenario envisions the growth poten-tial of the Central Area if the goals and projects of the CAAP are implemented through increased public and private investments.
Continuing that approach, the Central Area Action Plan examines the perfor-mance of the Central Area since 2000
and sets new economic benchmarks under the two scenarios (see Table 1-1 below for a comparison between the projections and actual trends). The potential growth could be slowed if current economic conditions persist.
Office growth projections were •on target as of 2007, although not primarily driven by job growth. New space additions came from changing office technology and user space needs as well as fund-ing availability. Retail development exceeded pro-•jections as a result of stronger than anticipated residential growth. Educational facility development •surpassed projections, with stu-dent housing emerging as a growth sector supporting new levels of
Table 1-1: Central Area Growth Trends and Forecasts
Figure 1-1: Central Area Population Trends and Projections, 1990-2020
Annual Projections Actual Development Annual Growth Benchmarks2003 Central Area Plan 2000-2007 2008-2020
Base CaseOpportunity Scenario Total
Annual Average Base Case
Opportunity Scenario
Office (SF) 1,600,000 2,200,000 15,135,000 1,892,000 700,000 1,000,000Retail (SF) 250,000 350,000 3,160,000 395,000 200,000 300,000
Residential (Units) 1,800 2,200 33,464 4,183 2,600 3,300Student Housing (Beds) 150 180 4,206 526 200 400
Hotel (Rooms) 600 700 4,323 540 500 700
DEvELOPmENT GrOwTh AND BENChmArks
full-time student enrollments.Hotel development was also •close to projections, with the market recovering in 2005-2006. The 9/11/2001 terrorist attacks brought about a prolonged de-cline in tourism, and the “jobless” economic recovery hurt conven-tion activity and business travel. Millennium Park was the fore-most factor in bringing tourists back after the downturn.Residential growth between 2000 •and 2007 far exceeded the projec-tions in the 2003 Plan, reflecting the low interest rate environment, the draw of a new generation of residential projects and the grow-ing appeal of the Central Area to empty nesters as well as younger owners and renters.
Chicago Central Area ACTION Plan
Page 1-3Chapter 1: Economic Development & Land UseAugust 2009
New Development BenchmarksIn light of development trends over the past eight years, updated demo-graphic data, input from Task Force members and market analyses, 2020 benchmarks have been revised (see Table 1-1). While projections for re-tail and hotel rooms are similar to the 2003 Plan, the growth benchmarks have been adjusted upward for stu-dent housing and downward for the office sector. Residential benchmarks are higher than the 2003 Plan, but lower than the housing boom years of 2005 - 2007.
Employment Trends and ProjectionsHighlights of economic trends and projections include the following:
The Chicago metro area has a dis-•tribution of jobs similar to the U.S. but, with its strong economic ties to the Midwest, has been grow-ing more slowly.Over 40% of exports from the •Chicago metropolitan area are to the “rest of the Midwest”, which suffers from a continuing turn-down in manufacturing, particu-larly in the auto industry.During the national recession of •2001 and the jobless recovery through 2005, the Central Area lost 45,000 private-sector jobs. This downward trend was mir-rored in the Chicago metropoli-tan statistical area (MSA) level and across multiple large MSAs, including New York City, Boston and San Francisco. In the Central Area, the four em-•ployment sectors experiencing growth were: management of companies, education services, healthcare, and accommoda-tions/food service.
work ProcessThe Economic Development and Land Use (EDLU) Task Force was one of three Task Forces charged with making recommendations to the Steering Committee. At six meetings and numerous work sessions over six months, the EDLU Task Force followed a three step process to review and refine strategies and projects.
First, the Task Force reviewed land use and economic develop-ment trends in the Central Area since 2000. The original econom-ic framework was updated with recent trends, current conditions and new 2020 benchmarks.
Second, the Task Force confirmed land use and economic develop-ment goals for the Central Area and its twelve planning districts. To help establish priorities, plan-ning districts were ranked accord-ing to the degree and intensity of current and projected develop-ment and growth, and strategies were created for each. The up-dated economic framework and visions guided the other two Task Forces (Urban Design and Trans-portation) in identifying and pri-oritizing projects.
Finally, with consideration of the work of the other two Task Forces, the EDLU Task Force rec-ommended actions and projects to attain nine land use and eco-nomic development policy goals. While the Plan looks toward 2020, most of the actions and projects could be implemented in a shorter time frame.
The Central Area’s economic •recovery was evidenced by an increase of 16,333 private-sector jobs in 2006.
Total private- and public-sector em-ployment in the Central Area is es-timated to reach between 600,000 (base case) and 630,000 (opportuni-ty scenario) by 2020. These employ-ment estimates represent an average growth rate of 3,500 to 5,000 jobs per year.
The opportunity scenario, which en-visions high growth in office-using employment, reaffirms the Central Area’s continued role as the hub of the regional job market. It also as-sumes investment in infrastructure as recommended in this Plan.
Population Trends and ProjectionsHighlights of population trends and projections include the following:
The 2007 population in the Cen-•tral Area is estimated to have reached 165,500 persons (based on the growth in completed resi-dential units and typical house-hold sizes). Since the 2000 Census count of 111,742, the population has grown by nearly 54,000—an increase of 48%. From 2000 to 2007, the Central •Area grew at an annual average rate of 5.8%. This compares with an annual growth rate for the Chi-cago MSA of 0.7% and for the U.S. of 1.0% over the same period.
By 2020, the Central Area population is projected to range from 215,000 to 230,000. This represents an average growth of 4,200 to 5,300 per year.
DEvELOPmENT GrOwTh AND BENChmArks
Chicago Central Area ACTION Plan
Page 1-4 Chapter 1: Economic Development & Land UseAugust 2009
Current Office Trends As of 2007, there were approximately 120 million SF of office space in the Central Area. Highlighted office mar-ket trends and conditions include the following:
As of year-end 2007, the Cen-•tral Area inventory represented 53.3% of all office space in the Chicago metro area. The Cen-tral Area has maintained its office market share in the range of 53% to 55% since 2000.The office sector added 15.1 mil-•lion SF of new space from 2000 to 2007, for an average of 1.9 million SF per year, in line with the 2003 Central Area Plan projections. New office development has con-•tinued to shift to the west, along Wacker Drive (high density) and to the West Loop (medium den-sity) in proximity to train stations.Class C office buildings, particu-•larly on the east side of the Loop, are being converted to residential, hotel and institutional uses.
Office ProjectionsOffice demand between 2000 and 2007 was driven largely by changing technology and user space needs. These trends plus moderate pro-jected increases in business services and other types of office-using em-ployment will generate demand for 700,000 to 1.0 million SF of new of-fice space annually through 2020.
Image 1-1: The ABN/Amro Building on Madison was one of numerous new mid-rise office buildings constructed in the West Loop.
Figure 1-2: Office Development, 2000-2007
DEvELOPmENT TrENDs & PrOjECTIONs
Image 1-2: Infill sites in the Central Loop are being developed as Class A office space.
Chicago Central Area ACTION Plan
Page 1-5Chapter 1: Economic Development & Land UseAugust 2009
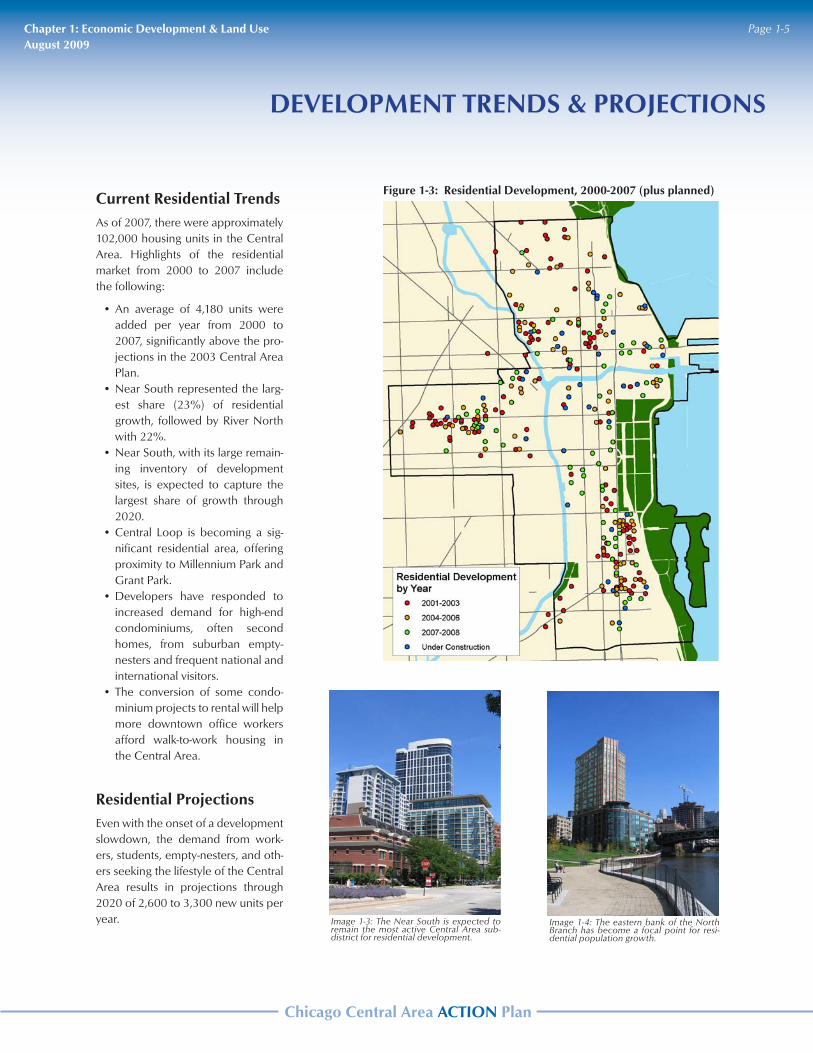
Current residential Trends As of 2007, there were approximately 102,000 housing units in the Central Area. Highlights of the residential market from 2000 to 2007 include the following:
An average of 4,180 units were •added per year from 2000 to 2007, significantly above the pro-jections in the 2003 Central Area Plan.Near South represented the larg-•est share (23%) of residential growth, followed by River North with 22%. Near South, with its large remain-•ing inventory of development sites, is expected to capture the largest share of growth through 2020.Central Loop is becoming a sig-•nificant residential area, offering proximity to Millennium Park and Grant Park.Developers have responded to •increased demand for high-end condominiums, often second homes, from suburban empty-nesters and frequent national and international visitors.The conversion of some condo-•minium projects to rental will help more downtown office workers afford walk-to-work housing in the Central Area.
residential ProjectionsEven with the onset of a development slowdown, the demand from work-ers, students, empty-nesters, and oth-ers seeking the lifestyle of the Central Area results in projections through 2020 of 2,600 to 3,300 new units per year. Image 1-4: The eastern bank of the North
Branch has become a focal point for resi-dential population growth.
Image 1-3: The Near South is expected to remain the most active Central Area sub-district for residential development.
Figure 1-3: residential Development, 2000-2007 (plus planned)
DEvELOPmENT TrENDs & PrOjECTIONs
Chicago Central Area ACTION Plan
Page 1-6 Chapter 1: Economic Development & Land UseAugust 2009
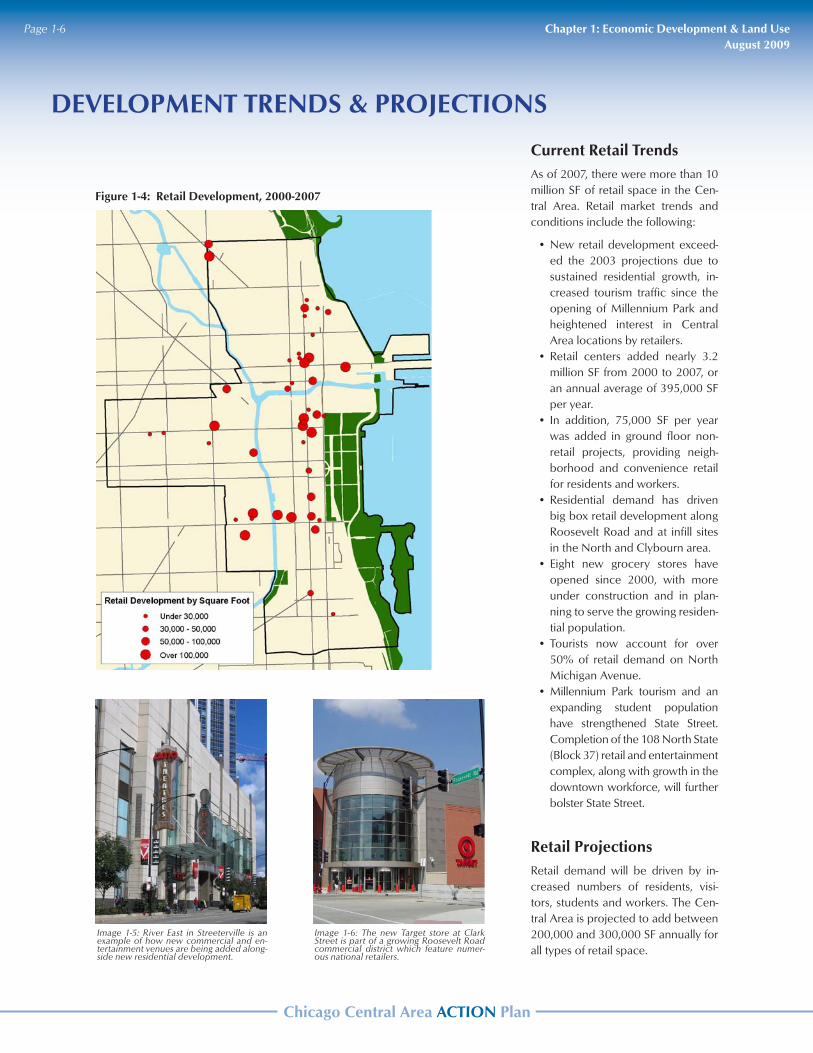
Current retail TrendsAs of 2007, there were more than 10 million SF of retail space in the Cen-tral Area. Retail market trends and conditions include the following:
New retail development exceed-•ed the 2003 projections due to sustained residential growth, in-creased tourism traffic since the opening of Millennium Park and heightened interest in Central Area locations by retailers.Retail centers added nearly 3.2 •million SF from 2000 to 2007, or an annual average of 395,000 SF per year.In addition, 75,000 SF per year •was added in ground floor non-retail projects, providing neigh-borhood and convenience retail for residents and workers.Residential demand has driven •big box retail development along Roosevelt Road and at infill sites in the North and Clybourn area. Eight new grocery stores have •opened since 2000, with more under construction and in plan-ning to serve the growing residen-tial population.Tourists now account for over •50% of retail demand on North Michigan Avenue.Millennium Park tourism and an •expanding student population have strengthened State Street. Completion of the 108 North State (Block 37) retail and entertainment complex, along with growth in the downtown workforce, will further bolster State Street.
retail ProjectionsRetail demand will be driven by in-creased numbers of residents, visi-tors, students and workers. The Cen-tral Area is projected to add between 200,000 and 300,000 SF annually for all types of retail space.
Figure 1-4: retail Development, 2000-2007
DEvELOPmENT TrENDs & PrOjECTIONs
Image 1-6: The new Target store at Clark Street is part of a growing Roosevelt Road commercial district which feature numer-ous national retailers.
Image 1-5: River East in Streeterville is an example of how new commercial and en-tertainment venues are being added along-side new residential development.
Chicago Central Area ACTION Plan
Page 1-7Chapter 1: Economic Development & Land UseAugust 2009
Image 1-7: Millennium Park continues to have a strong impact on residential and ho-tel development in the Central Area.
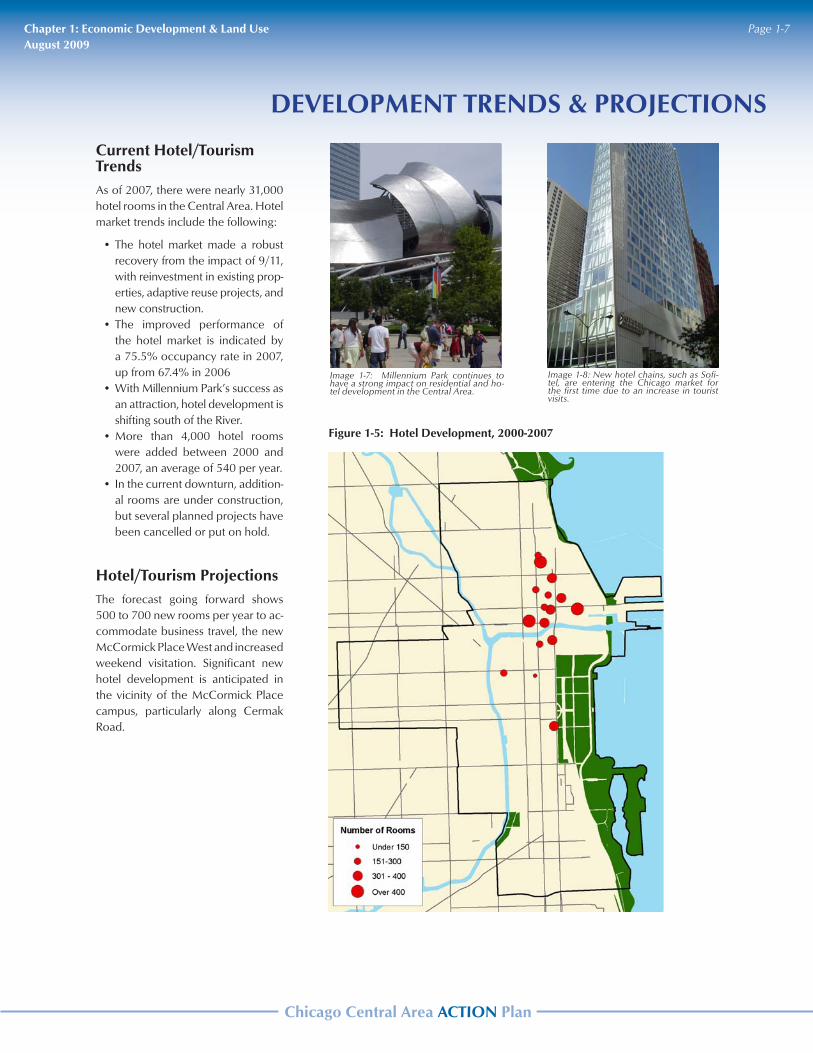
Current hotel/Tourism Trends As of 2007, there were nearly 31,000 hotel rooms in the Central Area. Hotel market trends include the following:
The hotel market made a robust •recovery from the impact of 9/11, with reinvestment in existing prop-erties, adaptive reuse projects, and new construction. The improved performance of •the hotel market is indicated by a 75.5% occupancy rate in 2007, up from 67.4% in 2006 With Millennium Park’s success as •an attraction, hotel development is shifting south of the River.More than 4,000 hotel rooms •were added between 2000 and 2007, an average of 540 per year. In the current downturn, addition-•al rooms are under construction, but several planned projects have been cancelled or put on hold.
hotel/Tourism ProjectionsThe forecast going forward shows 500 to 700 new rooms per year to ac-commodate business travel, the new McCormick Place West and increased weekend visitation. Significant new hotel development is anticipated in the vicinity of the McCormick Place campus, particularly along Cermak Road.
Figure 1-5: hotel Development, 2000-2007
Image 1-8: New hotel chains, such as Sofi-tel, are entering the Chicago market for the first time due to an increase in tourist visits.
DEvELOPmENT TrENDs & PrOjECTIONs
Chicago Central Area ACTION Plan
Page 1-8 Chapter 1: Economic Development & Land UseAugust 2009
DEvELOPmENT TrENDs & PrOjECTIONs
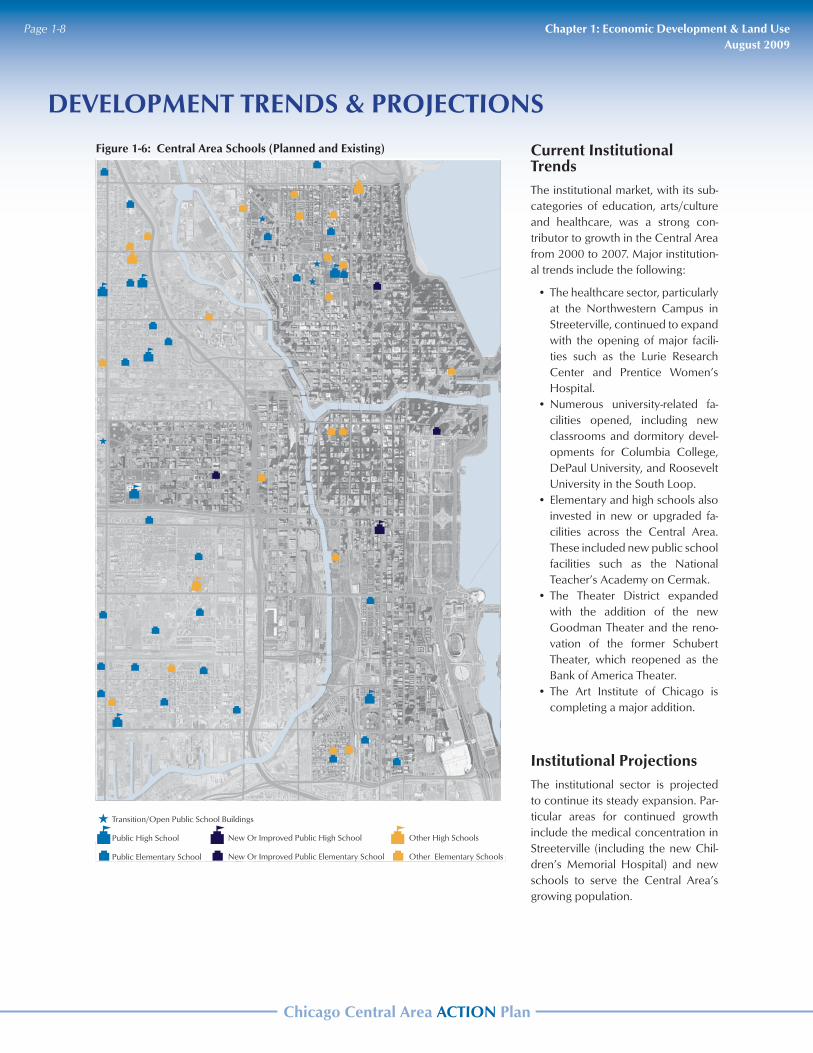
Current Institutional TrendsThe institutional market, with its sub-categories of education, arts/culture and healthcare, was a strong con-tributor to growth in the Central Area from 2000 to 2007. Major institution-al trends include the following:
The healthcare sector, particularly •at the Northwestern Campus in Streeterville, continued to expand with the opening of major facili-ties such as the Lurie Research Center and Prentice Women’s Hospital.Numerous university-related fa-•cilities opened, including new classrooms and dormitory devel-opments for Columbia College, DePaul University, and Roosevelt University in the South Loop. Elementary and high schools also •invested in new or upgraded fa-cilities across the Central Area. These included new public school facilities such as the National Teacher’s Academy on Cermak.The Theater District expanded •with the addition of the new Goodman Theater and the reno-vation of the former Schubert Theater, which reopened as the Bank of America Theater. The Art Institute of Chicago is •completing a major addition.
Institutional ProjectionsThe institutional sector is projected to continue its steady expansion. Par-ticular areas for continued growth include the medical concentration in Streeterville (including the new Chil-dren’s Memorial Hospital) and new schools to serve the Central Area’s growing population.
Transition/Open Public School Buildings
Public High School
Public Elementary School
New Or Improved Public High School
New Or Improved Public Elementary School
Other High Schools
Other Elementary Schools
Central Area Schools
Transition/Open Public School Buildings
Public High School
Public Elementary School
New Or Improved Public High School
New Or Improved Public Elementary School
Other High Schools
Other Elementary Schools
Central Area Schools
Figure 1-6: Central Area schools (Planned and Existing)
Chicago Central Area ACTION Plan
Page 1-9Chapter 1: Economic Development & Land UseAugust 2009
that support downtown business.Assist and collaborate on public/•private ventures that support edu-cational institutions, such as links between businesses and schools.
support Dense residential Growth to Enhance Urban vibrancy and Uti-lize the Urban Infrastructure
Protect existing densities, affirming •the 2004 Chicago Zoning Ordi-nance that developed Downtown Districts in support of the 2003 Central Area Plan.Maintain the supply and building •capacity of remaining sites to en-able the growth projections upon which the Plan is premised. Implement performance stan-•dards addressing factors such as noise and waste management to mitigate conflicts from mixes of residential with other uses.Encourage a range of housing •choices, including workforce housing, to serve a diverse em-ployment base.Build and improve schools and •recreation facilities to support residential growth, using signifi-cant TIF contributions as needed.Pursue the highest standards •of urban design, continuing streetscape, park, trail and public art projects in recognition of their contribution to quality of life.
Implement Cutting-Edge Environ-mental Practices and Green Build-ing Techniques
Employ Smart Growth principles •in land use and transportation planning in the Central Area—the strongest location in the region to demonstrate their efficacy. Maximize densities in high-use •corridors and around transit lines to create a walkable environment,
The land use and economic devel-opment recommendations are
summarized under nine comprehen-sive goals below. For each of these goals, specific projects and regula-tory actions are presented. Together, they create a strategy for a multi-year implementation program.
The result is a multi-year public and private investment program of $15.55 billion, organized around the follow-ing implementation policies.
maintain Chicago’s Position as the Economic Engine of the region and state
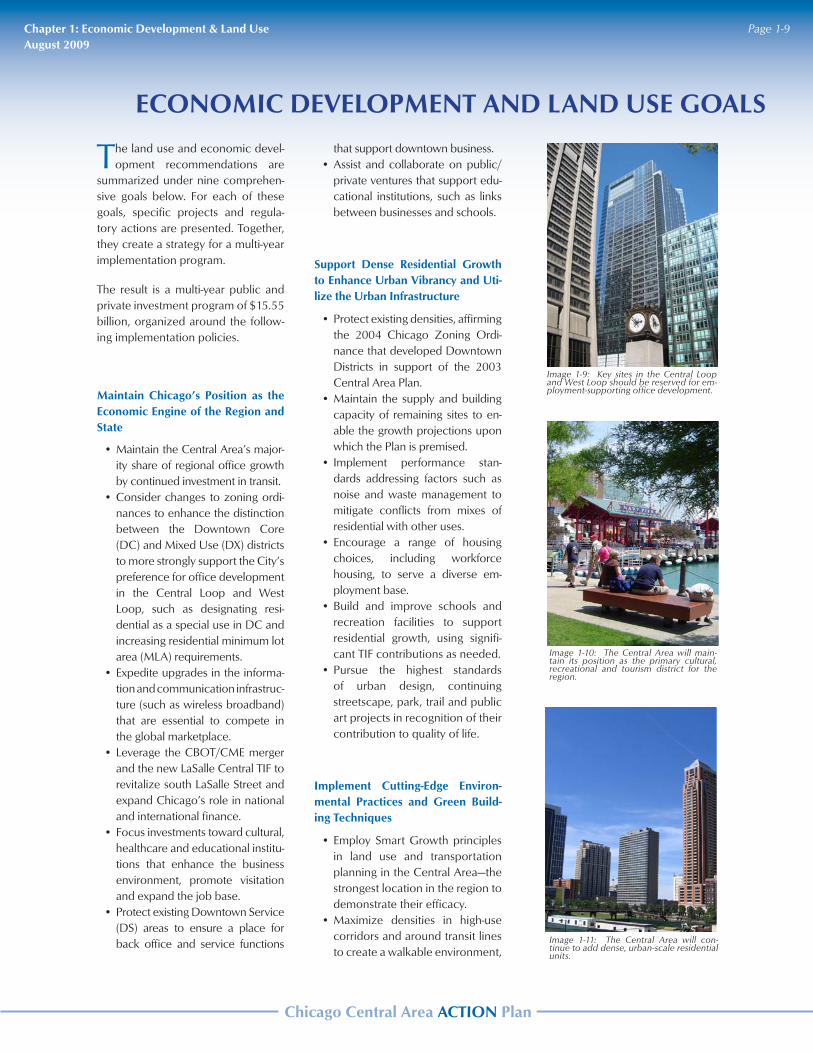
Maintain the Central Area’s major-•ity share of regional office growth by continued investment in transit.Consider changes to zoning ordi-•nances to enhance the distinction between the Downtown Core (DC) and Mixed Use (DX) districts to more strongly support the City’s preference for office development in the Central Loop and West Loop, such as designating resi-dential as a special use in DC and increasing residential minimum lot area (MLA) requirements.Expedite upgrades in the informa-•tion and communication infrastruc-ture (such as wireless broadband) that are essential to compete in the global marketplace. Leverage the CBOT/CME merger •and the new LaSalle Central TIF to revitalize south LaSalle Street and expand Chicago’s role in national and international finance. Focus investments toward cultural, •healthcare and educational institu-tions that enhance the business environment, promote visitation and expand the job base. Protect existing Downtown Service •(DS) areas to ensure a place for back office and service functions
Image 1-10: The Central Area will main-tain its position as the primary cultural, recreational and tourism district for the region.
Image 1-9: Key sites in the Central Loop and West Loop should be reserved for em-ployment-supporting office development.
Image 1-11: The Central Area will con-tinue to add dense, urban-scale residential units.
ECONOmIC DEvELOPmENT AND LAND UsE GOALs
Chicago Central Area ACTION Plan
Page 1-10 Chapter 1: Economic Development & Land UseAugust 2009
ECONOmIC DEvELOPmENT AND LAND UsE GOALs
Image 1-14: Improvements at Union Station will reinforce its role as a major gateway to the Central Area.
Image 1-12: The Riverfront and Lakefront areas will become continuous pedestrian and open space corridors.
Image 1-13: Programs that strengthen green building practices will be encouraged in the Central Area.
promote public transit use and le-verage public investment.Increase energy efficiency and •conservation by upgrading build-ing codes incrementally to reach LEED Silver and Gold standards. Make infrastructure development •sustainable by reducing material consumption through the use of recycled materials and by minimiz-ing negative environmental im-pacts, such as stormwater runoff.Transition the CTA and other pub-•lic vehicles to low-emission stan-dards and alternative fuels.
Enhance Parks, Corridors and wa-terfronts for residents, workers, students, and visitors
Set the highest standards for urban •design as an essential ingredient in “bonding people to a place.” Expand the park impact fee pro-•gram to create sufficient park space for new residents.Implement the park, waterfront •and streetscape/corridor recom-mendations of the Urban Design Task Force. Prioritize completion of the River-•walk system as an amenity to sup-port Central Area shopping, em-ployment, and cultural facilities, beginning with the Main Branch (Lake Shore Drive to Franklin Av-enue).Expand the Lakefront Trail and •parkland between Navy Pier and North Avenue to fill missing gap in Lakefront park system.
Better Connect to the world through O’hare and midway Airports as well as the regional rail Network
Connect the Central Area to •O’Hare and Midway regional airports with direct, express train service, building on investments
by the City and CTA, and attract-ing private involvement.Continue O’Hare expansion and •Midway improvement programs.Reaffirm Chicago Union Station’s •status as a prime gateway into the Central Area by reinvesting in in-termodal facilities; improving sta-tion access and wayfinding; and supporting expansion and en-hancements to Amtrak service.
strengthen Chicago’s ties to the North American Economy through Efficient Freight Delivery
Protect Chicago’s role as the larg-•est inland international container port in North America. Fully support all state and fed-•eral initiatives to implement the Chicago Region Environmental and Transportation Efficiency Pro-gram (CREATE), a menu of rail-road enhancements to maintain Chicago’s global freight competi-tiveness.Reduce conflicts with Metra •trains to ensure rush-hour passen-ger capacity and efficient freight movement. Channel freight rail traffic to cor-•ridors outside the Central Area.Continue viaduct and roadway •improvements to rail, truck and intermodal locations.Improve the efficiency and mini-•mize impacts of freight delivery by requiring off-peak hours, en-couraging loading zone manage-ment and implementing other recommendations of CDOT’s Downtown Freight Study (2007).
Chicago Central Area ACTION Plan
Page 1-11Chapter 1: Economic Development & Land UseAugust 2009
Image 1-15: Better use of existing transpor-tation infrastructure, such as the Lakefront busway, will improve mobility within the Central Area.
Invest in Transit to support the Growth Envisioned by the Plan
Invest in transit to support the •growth projections in the Plan, particularly for employment and office space.Implement the transit, roadway, •and related improvement recom-mendations of the Action Plan. Give first priority to Metra and •CTA rush-hour/commuter capac-ity enhancements. For CTA, this includes upgrading information systems; modernizing stations; adding stations in growing resi-dential areas; and extending rail lines to allow more workers to commute to the Central Area via public transit. For Metra, this includes expanding service ca-pacity, including lengthening plat-forms at the downtown stations and expanding parking and tran-sit-oriented development at sub-urban stations; assisting intermo-dal upgrades at LaSalle and Union Stations; and continuing improve-ments along the Electric Line.Create a new system of dedi-•cated Transitways to serve high growth and high density centers.
Frame a City/state/Federal Capital Investment Plan supplemented by Private Participation
Launch a campaign to educate •residents and business leaders on the benefits of a long-term capital investment in the Central Area as the driver of the region’s growth.The established TIF districts will re-•main essential and should be pro-tected, coordinated, expanded, ex-tended as feasible and otherwise creatively and aggressively utilized to insure a secure funding base and redevelopment framework.Dedicate the majority of TIF and •related funding to the long-term
capital projects identified in the Action Plan.Use TIF immediately as seed capi-•tal to initiate plans for key transpor-tation and corridor improvements.Although market conditions sup-•port most development projects, selectively use site-specific incen-tives where there are significant public benefits.Pool tax increment income from •all the contiguous TIF districts for significant area-wide projects.Update revenue projections of all •TIFs using the base growth projec-tions of this Plan.Issue general obligation bonds •pledged against future TIF reve-nues to fund capital projects.Enable improvement districts in •neighborhoods and commercial districts that will fund new services and capital projects.Identify the local match require-•ments for key transportation proj-ects and ensure it is designated.Present the prioritized project list •to RTA, Metra and CTA to be in-cluded in state and federal trans-portation budgets.Support increased capital spend-•ing from the federal and state governments, and utilize public-private partnerships as appropri-ate to leverage public dollars to achieve capital projects.
Incorporate the Central Area Action Plan into the regional Transporta-tion Plan, mcCormick Place Plan-ning and state and Federal Capital Programs
Hold to the principles of sustain-•able development, compact growth, transit oriented design and smart growth by maintaining the Central Area as the economic core of the region.Facilitate funding with a regional •
approach that coordinates the ef-forts of the City, Counties and the State of Illinois, with the Action Plan as a core element.Join with long-term planning ef-•forts for McCormick Place and the surrounding district to support those projects that would provide long-term benefits to the City.
Image 1-16: Recent expansion of McCor-mick Place will drive the need for improved facilities for business visitors.
ECONOmIC DEvELOPmENT AND LAND UsE GOALs

Chicago Central Area ACTION Plan
Page 1-12 Chapter 1: Economic Development & Land UseAugust 2009