Embed Size (px)
Citation preview

Land Demand and Land Potential of Central Java in 2030:
a Forecast to Promote More Balanced Development Policy
By
Wiwandari Handayani

Area: 32.548,2 Km2
Population: 32.177.730 (2006)
CENTRAL JAVA - INDONESIA
OUTLINE
• Introduction
• Land demand and land potential analyses
– Land demand: number of population growth and land use
coefficient calculation
– Land potential: probability of transferability calculation
– Land demand vs. Land potential
• Course to balanced development: a brief policy review
• Conclusion

Introduction
• Land allocation issues : land demand vs. land supply
As our planet doet not growth but it should be developed over time.
• There are problems in many developing countries including
Indonesia – Central Java:
− Disparity
− Primate cities
− Food security
− Environmental balances
•The paper aims to assess the land demand and the land potential of
Central Java based on trend in 1994-2006 to forecast the situation of 2030,
for further propose policy review to promote balanced development.

Land Demand:
Number of Population Growth (in district level)
Two scenarios applied
– Status Quo Scenario
grotwh rate (r) based on 1990 and 2000 population
censuses with geometric formula.
– Low Projection Scenario
as Central Java population growth rate has been
declining in the lowest rate compared to other
provinces.

Land Demand:
Number of Population Growth
Population Projection for Central Java, 2030: Status Quo and Low Projection Scenario
Source: CBS and calculation result

Land Demand:
Land Coefficient Formula
Where:
L2 = Built-up area 2006 Pop2 = Population 2006
L1 = Built-up area 1994 Pop1 = Population 1994
Year Change in built-up area Change in population Land use coefficient(Provincial average, m2
per person)
1994-2006 1836,52 2.701.907 640,569
Land use coefficient in Central Java, 1994-2006

Land Demand in 2030
Status Quo and Low Projection Scenario
SQ: Status Quo scenario LP: Low Projection scenario
Shrink district assumed as 0 (zero) growth population

Land Potential:
Probability of Transferability Calculation
• Based on trend of land conversion that had been happenning
between 1994 and 2006.
• The variables include:
slope
land use type
distance from built-up in 1994
distance from main road
• All variables were analyzed using ArcGIS 9.3. Most of the
calculation are raster based within each 300mx300m cell sized
(grid)

Land Potential:
Probability of Transferability Calculation
Slope Area (Km2) Proportion
> 40 % 0,37 0
0 - 8 % 1587,46 87
15 - 25 % 76,71 4
25 - 40 % 13,00 1
8 - 15 % 146,09 8
Water body 1,92 0
100
Land use
1994
Land use
2006
Area (Km2) Proportion
Dry Land
Farming Built-up 535,64 29
Forest Built-up 65,16 4
Plantation Built-up 4,67 0
Protected
Paddy Field Built-up 1206,95 66
Water Body Built-up 23,18 1
100
Distance from
built-up
1994 (Km)
Polygons Proportion
0-1 1781 54
1,01-2 772 23
2,01-5 529 16
5,01-12 144 4
12,01-19,1 87 3
100
As it was indicated that all land use change are likely taking place in the radius of 1 km from the main road, therefore, there is not any detail result for distance from main road but only delineating the scope area of final analyses result into one km maximum distance from main road.
1 2
3
4

Value of Potential of Transferability (based on data 1994 and 2006)
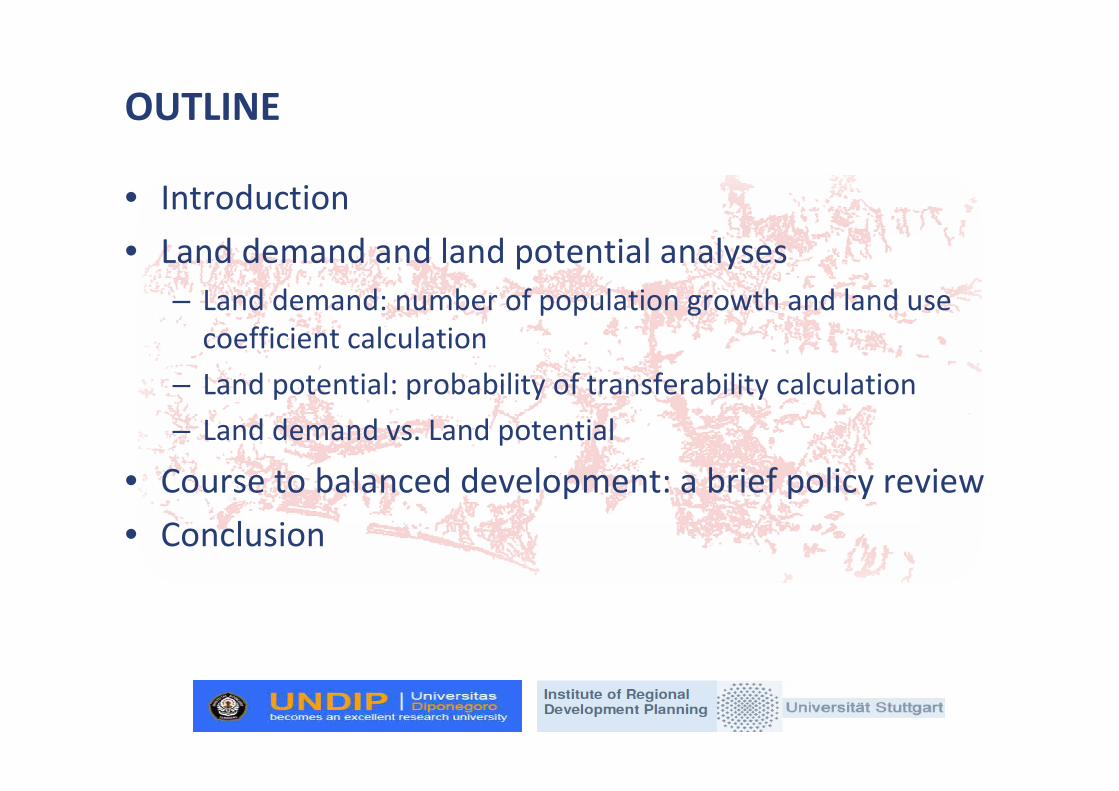
Potential of Transferability (per District based on data 1994 and 2006)

Potential of Transferability (per District based on data 1994 and 2006)
LAND DEMANDLAND POTENTIALDistrict
land coefficientProvincial average land coefficient
Status Quo 5560,165 6357,795 40.368-91.872=3604,5991.872,01-136.242=2792,52136.242,01-310.068=3392,46
Less potentialPotentialVery potential
Low projection 1482,811 2051,178
Total Land Demand and Land Potential, 2030
(Km2)

Land Demand and Land Potential of Transferability in District
Level in Central Java, 2030

Land Demand and Land Potential of Transferability in District
Level in Central Java, 2030
Built-up 2030
Built-up 1994 Built-up 2006
Built-up and protected paddy field 2006

Brief Overview Regarding Analyses Result
• In general, the land demand is likely less than land supply
BUT
If the pattern would be similar with the trend between 1994-2006, it will lead to a serious problem in food security
• There is still a lot of discrepancy between available land supply and estimated land demand.
• A ‘fundamental‘ change of policy framework is required to address the problems.

Course to Balanced Development:
a Brief Policy Review (#1)
Dillema of two headed snake: growth vs. equity
Inner zone (Developed region)
Favorable site for big manufacturing (mostly foreign
based) industries due to better infrastructure support
and closer to any required urban facilities.
Attract significant number of laborers and other
potential resources from outer regions.
Outer zone (Underdeveloped region)
Mostly dominated by agricultural activities.
Core (the most developed region)
Perform as a growth centre
: Spread effect of the growth centre that is unfortunately unbalanced with the backwash
effect.
: Spread affect which gets lesser in the outer zone.
: Backwash effect (core as well inner zone take so many potential resources from outer
zone)
: Endogenous potential in the outer zone that should be developed to have a more
balanced development
Rapid growth
cannot always
be a good sign
of development
UNBALANCED
→ DISPARITY

Course to Balanced Development:
a Brief Policy Review (#2)
Recognition of critical situation regarding Food Security
• Indonesian rice consumption is 133 kg per capita, the highest worldwide
(to compare: Thailand is 80 kg per capita, and Japan is 40 kg per capita)
• Java is still dominating rice production in Indonesia by contributing ± 60 per
cent of national production in 2000.
• 66 per cent of land conversion (± 1212,1km2) in Central Java has been
utilized arable land (Protected paddy field). Similar phenomenon for other
provinces in Java Island.
• Urgently need to ‘re-allocate‘ urbanization by enforcing development
outside Java.
• Breakthrough regarding land use and agricultural integrated policy

Conclusion
• Land allocation is critical for development in Central
Java, a lot of homework to be done.
• Potential solutions would be begin with determining
‘new‘ policy criteria and increasing commitment from
any related stakeholders to improve institutional
capability.

Terimakasih... Thank You... Vielen Dank