Embed Size (px)
Citation preview
Economic contribution of Deakin University’s Geelong Waurn Ponds and Waterfront campuses Deakin University October 2014
Deloitte Access Economics
Contents Glossary ................................................................................................................................... iv
Executive Summary ................................................................................................................... 1
1 Background ..................................................................................................................... 6
1.1 Scope and approach ......................................................................................................... 6
1.2 Structure of the report ...................................................................................................... 7
2 The value of higher education ......................................................................................... 8
3 Deakin’s local community .............................................................................................. 10
3.1 Geography ...................................................................................................................... 10
3.2 Population ...................................................................................................................... 11
3.3 Economy......................................................................................................................... 12
3.4 Social indicators .............................................................................................................. 17
4 Deakin student characteristics ....................................................................................... 19
4.1 The students of Deakin University’s Geelong Waurn Ponds and Waterfront Campuses ....................................................................................................................... 19
4.2 Where do students live? ................................................................................................. 21
4.3 Graduate destination survey 2013 .................................................................................. 24
5 Economic contribution of the Geelong campuses .......................................................... 26
5.1 Approach ........................................................................................................................ 26
5.2 Direct contribution of the Geelong campuses .................................................................. 28
5.3 Indirect contribution of the Geelong Campuses ............................................................... 29
5.4 Economic contribution of Deakin’s students .................................................................... 31
5.5 Total economic contribution ........................................................................................... 33
5.6 Employment ................................................................................................................... 37
5.7 Gross Output .................................................................................................................. 38
References .............................................................................................................................. 39
Appendix A – Economic contribution studies ........................................................................... 40
Appendix B – CGE modelling ................................................................................................... 45
Appendix C : Comparison to previous estimates ...................................................................... 47
Limitation of our work ................................................................................................................. 1
Tables Table 1.1 Summary of total economic contribution of the Geelong campuses by region ........... 3
Table 3.1 Population ............................................................................................................... 11
Table 3.2 The Geelong LGA’s GRP by industry (current prices, $m) 2012-13 ............................ 13
Table 3.3 Structural change in the Geelong economy, 2003-2013 ............................................ 13
Table 3.4 Full-time-equivalent employment by industry 2012-13 ............................................ 15
Table 3.5 Weekly income in the Geelong Region, 2011 ............................................................ 17
Table 3.6 SEIFA index of relative socio-economic disadvantage, 2011...................................... 17
Table 3.7 Demographic indicators (population percentages) ................................................... 18
Table 4.1 Key statistics 2013.................................................................................................... 20
Table 4.2 Domestic students by country of birth and language spoken at home ...................... 21
Table 4.3 Term location address .............................................................................................. 22
Table 4.4 Relocating to university ............................................................................................ 22
Table 4.5 Enrolments by socio-economic status (SES) and disability 2013 ................................ 23
Table 4.6 Location of home address ........................................................................................ 23
Table 4.7 Deakin students by general course area ................................................................... 24
Table 5.1 Consolidated revenue and expenses, 2013 ($’000) ................................................... 29
Table 5.2 Direct economic contribution, Geelong campuses, 2013 .......................................... 29
Table 5.3 Intermediate inputs for the Geelong campuses, 2013 .............................................. 30
Table 5.4 Total economic contribution of university operations, 2013 $m ............................... 30
Table 5.5 Direct and indirect economic contribution of the Geelong campuses’ ongoing operations to the GRP of Greater Geelong LGA, 2013 $m ........................................................ 30
Table 5.6 Deakin university students Geelong, 2011-2013 ....................................................... 31
Table 5.7 Students by modelling region, 2013 ......................................................................... 32
Table 5.8 Average annual student expenditure ($) .................................................................. 32
Table 5.9 Student expenditure in modelling region, 2013, $m ................................................. 33
Table 5.10 Student-related contribution, by modelling region, 2013, $m ................................. 33
Table 5.11 Total economic contribution of the Geelong campuses and students to the local community, 2013, $m ............................................................................................................. 34
Table 5.12 Total economic contribution of the Geelong campuses and students by region, 2013, $m ................................................................................................................................. 34
Table 5.13 : Deakin’s capital expenditure, $m.......................................................................... 35
Table 5.14 Total employment contributed by the economic activity of the Geelong campuses and students in the local community, 2013, FTE jobs .............................................. 37
Table 5.15 Total employment contributed by the economic activity of the Geelong campuses and students by region, 2013, FTE jobs ................................................................... 37
Table 5.16 Total gross output contributed by the Geelong campuses and students in the local community, 2013, $m ..................................................................................................... 38
Table 5.17 Total gross output contributed by the Geelong campuses and students by region, 2013, $m ................................................................................................................................. 38
Table A.1 Home and study region consumption assumptions .................................................. 44
Table C.1 : Comparison of estimates of the economic contribution of the Burwood campus to Melbourne .......................................................................................................................... 47
Figures Figure 1.1 The economic contributions of Deakin University’s Geelong campuses ..................... 1
Figure 1.2 Estimates of the Geelong campuses’ economic contribution in 2013 ........................ 2
Figure 1.3 The economic contribution of the Geelong campuses by region................................ 4
Figure 1.4 Economic impact of Deakin University’s total capital expenditure in Geelong ........... 5
Figure 3.1 Deakin University’s Geelong Waterfront campus .................................................... 10
Figure 3.2 Deakin University’s Geelong Waurn Ponds campus ................................................. 11
Figure 3.3 Unemployment and labour force for the Geelong region ........................................ 16
Figure 3.4 Age profile of Greater Geelong LGA population with a bachelor degree or higher .. 18
Figure 5.1 Overview of the analytical approach ....................................................................... 27
Figure 5.2 Distribution of impact of Deakin’s capital expenditure ............................................ 36
Figure A.1 Economic activity accounting framework ................................................................ 41
Figure B.1 : Key components of DAE-RGEM ............................................................................. 45
Glossary
AGS Australian Graduate Survey
CGE Computable General Equilibrium
DAE-IRIOM Deloitte Access Economics’ In-House Integrated Regional Input-Output Model
DAE-RGEM Deloitte Access Economics’ Regional General Equilibrium Model
FTE Full-Time Equivalent
GDP Gross Domestic Product
GOS Gross Operating Surplus
GRP Gross Regional Product
GSP Gross State Product
IRSD Index Of Relative Socio-Economic Disadvantage
LGA Local Government Area
SEIFA Socio-Economic Indexes For Areas
SES Socio-Economic Status
VIC Victoria
Economic contribution of Deakin University’s Geelong Waurn Ponds and Waterfront campuses
1 Deloitte Access Economics
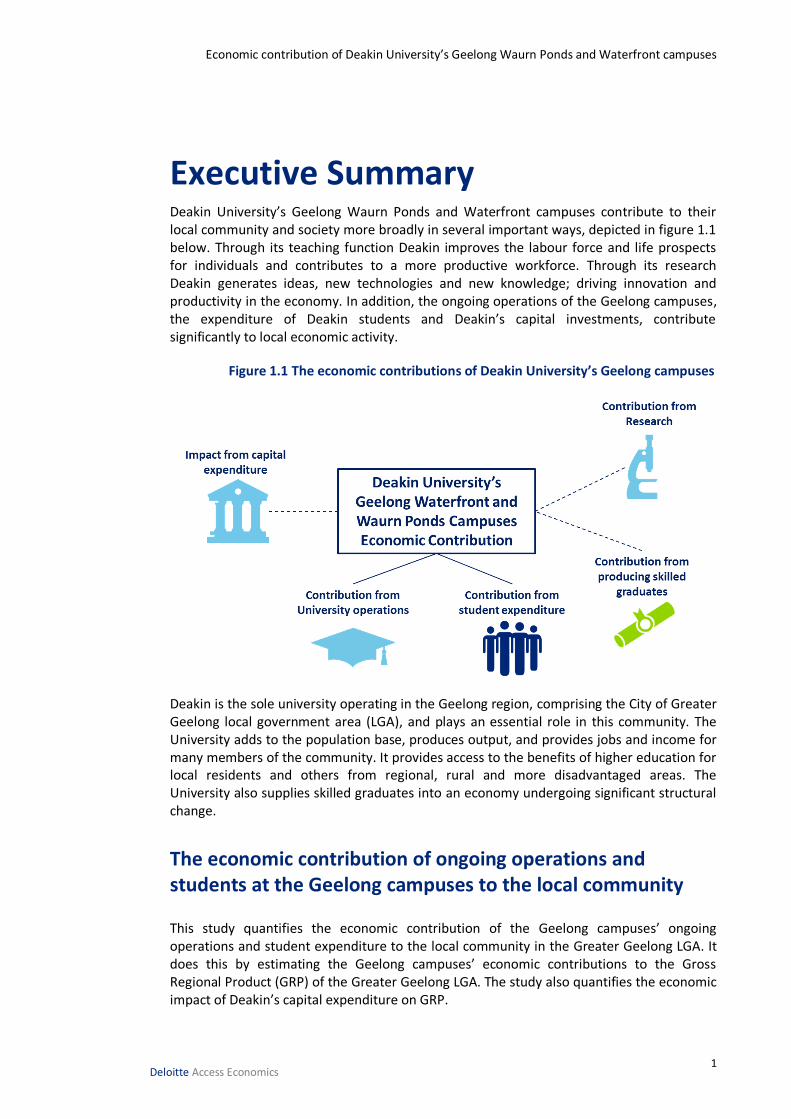
Executive Summary Deakin University’s Geelong Waurn Ponds and Waterfront campuses contribute to their local community and society more broadly in several important ways, depicted in figure 1.1 below. Through its teaching function Deakin improves the labour force and life prospects for individuals and contributes to a more productive workforce. Through its research Deakin generates ideas, new technologies and new knowledge; driving innovation and productivity in the economy. In addition, the ongoing operations of the Geelong campuses, the expenditure of Deakin students and Deakin’s capital investments, contribute significantly to local economic activity.
Figure 1.1 The economic contributions of Deakin University’s Geelong campuses
Deakin is the sole university operating in the Geelong region, comprising the City of Greater Geelong local government area (LGA), and plays an essential role in this community. The University adds to the population base, produces output, and provides jobs and income for many members of the community. It provides access to the benefits of higher education for local residents and others from regional, rural and more disadvantaged areas. The University also supplies skilled graduates into an economy undergoing significant structural change.
The economic contribution of ongoing operations and students at the Geelong campuses to the local community This study quantifies the economic contribution of the Geelong campuses’ ongoing operations and student expenditure to the local community in the Greater Geelong LGA. It does this by estimating the Geelong campuses’ economic contributions to the Gross Regional Product (GRP) of the Greater Geelong LGA. The study also quantifies the economic impact of Deakin’s capital expenditure on GRP.
Economic contribution of Deakin University’s Geelong Waurn Ponds and Waterfront campuses
2 Deloitte Access Economics
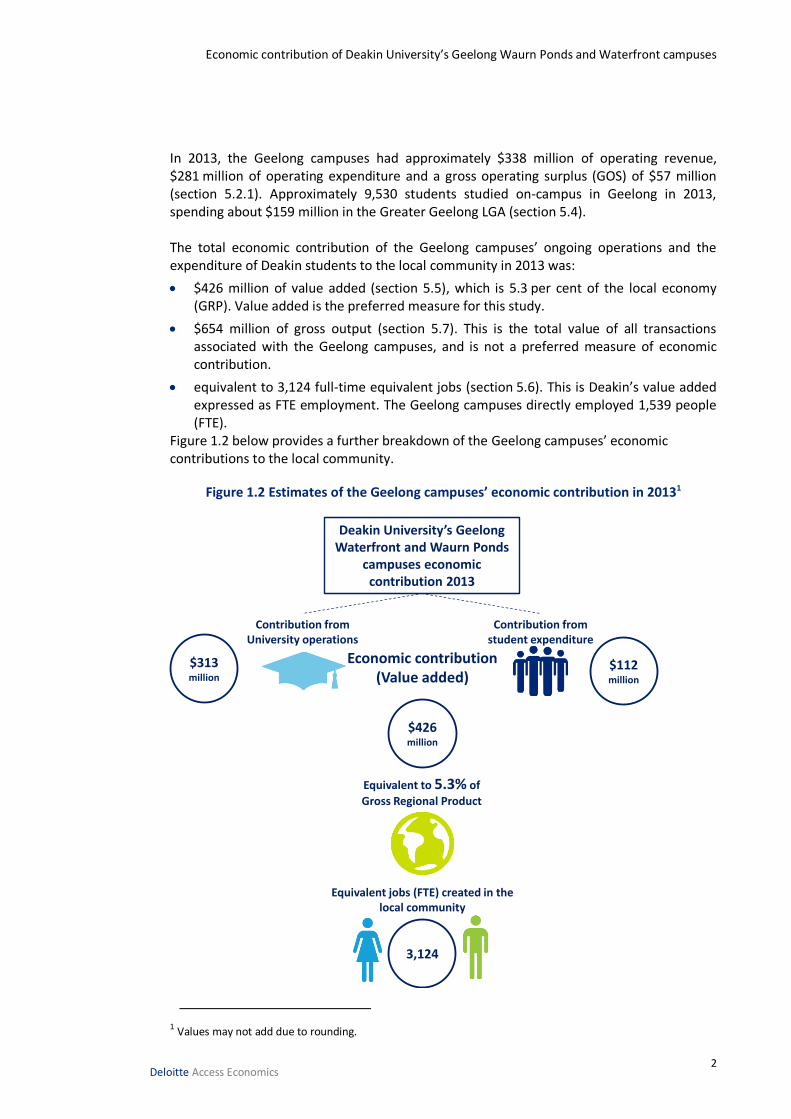
In 2013, the Geelong campuses had approximately $338 million of operating revenue, $281 million of operating expenditure and a gross operating surplus (GOS) of $57 million (section 5.2.1). Approximately 9,530 students studied on-campus in Geelong in 2013, spending about $159 million in the Greater Geelong LGA (section 5.4). The total economic contribution of the Geelong campuses’ ongoing operations and the expenditure of Deakin students to the local community in 2013 was:
$426 million of value added (section 5.5), which is 5.3 per cent of the local economy (GRP). Value added is the preferred measure for this study.
$654 million of gross output (section 5.7). This is the total value of all transactions associated with the Geelong campuses, and is not a preferred measure of economic contribution.
equivalent to 3,124 full-time equivalent jobs (section 5.6). This is Deakin’s value added expressed as FTE employment. The Geelong campuses directly employed 1,539 people (FTE).
Figure 1.2 below provides a further breakdown of the Geelong campuses’ economic contributions to the local community.
Figure 1.2 Estimates of the Geelong campuses’ economic contribution in 20131
1 Values may not add due to rounding.
Contribution from University operations
Contribution from student expenditure
Deakin University’s Geelong Waterfront and Waurn Ponds
campuses economic contribution 2013
$313million
$112million
Economic contribution (Value added)
Equivalent jobs (FTE) created in the local community
$426million
3,124
Equivalent to 5.3% of
Gross Regional Product
Economic contribution of Deakin University’s Geelong Waurn Ponds and Waterfront campuses
3 Deloitte Access Economics
The Geelong campuses’ economic contributions to the local community in 2013 were made up of:
Deakin’s operations contributing approximately $313 million to GRP (sections 5.2 and 5.3)
Deakin student expenditure contributing approximately $112 million to GRP (section 5.4)
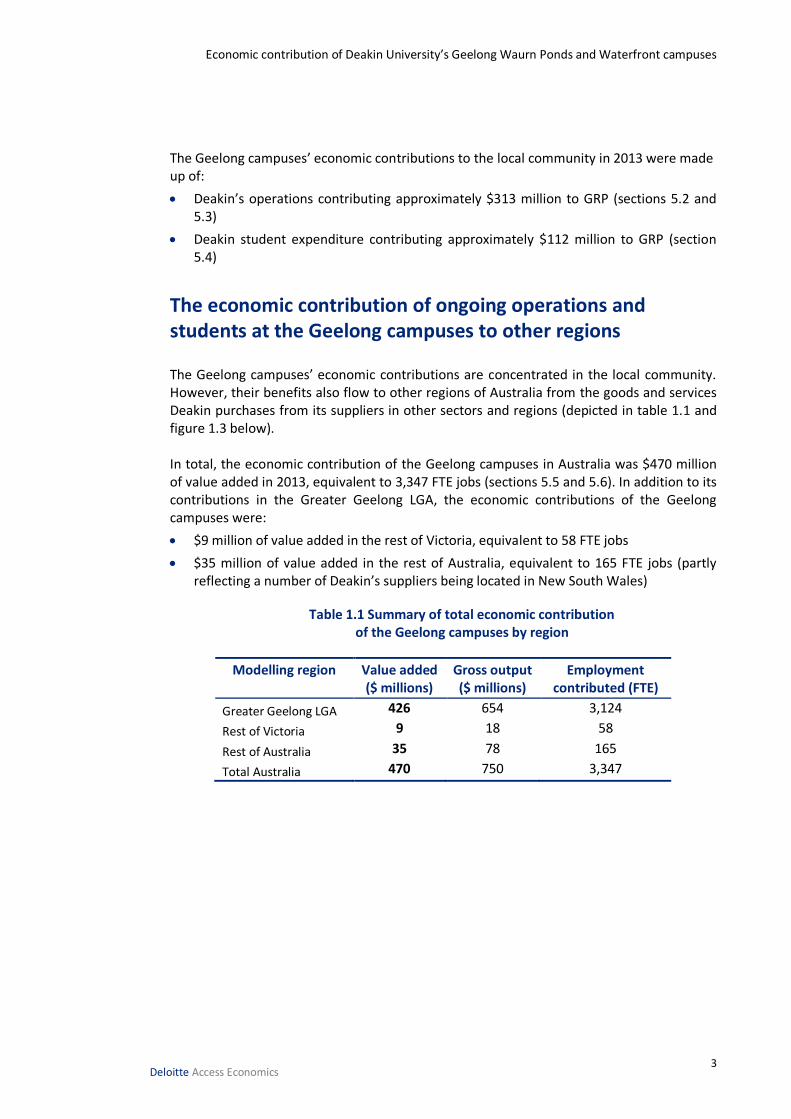
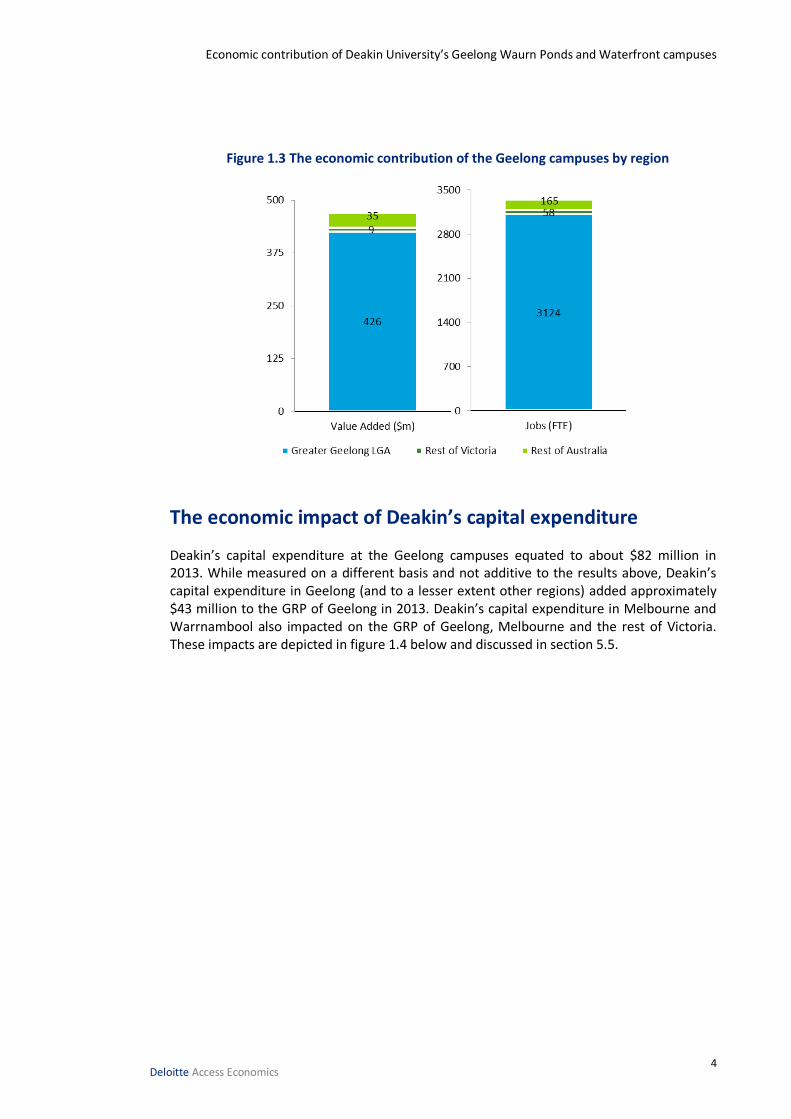
The economic contribution of ongoing operations and students at the Geelong campuses to other regions The Geelong campuses’ economic contributions are concentrated in the local community. However, their benefits also flow to other regions of Australia from the goods and services Deakin purchases from its suppliers in other sectors and regions (depicted in table 1.1 and figure 1.3 below). In total, the economic contribution of the Geelong campuses in Australia was $470 million of value added in 2013, equivalent to 3,347 FTE jobs (sections 5.5 and 5.6). In addition to its contributions in the Greater Geelong LGA, the economic contributions of the Geelong campuses were:
$9 million of value added in the rest of Victoria, equivalent to 58 FTE jobs
$35 million of value added in the rest of Australia, equivalent to 165 FTE jobs (partly reflecting a number of Deakin’s suppliers being located in New South Wales)
Table 1.1 Summary of total economic contribution of the Geelong campuses by region
Modelling region Value added ($ millions)
Gross output ($ millions)
Employment contributed (FTE)
Greater Geelong LGA 426 654 3,124
Rest of Victoria 9 18 58
Rest of Australia 35 78 165
Total Australia 470 750 3,347
Economic contribution of Deakin University’s Geelong Waurn Ponds and Waterfront campuses
4 Deloitte Access Economics
Figure 1.3 The economic contribution of the Geelong campuses by region
The economic impact of Deakin’s capital expenditure
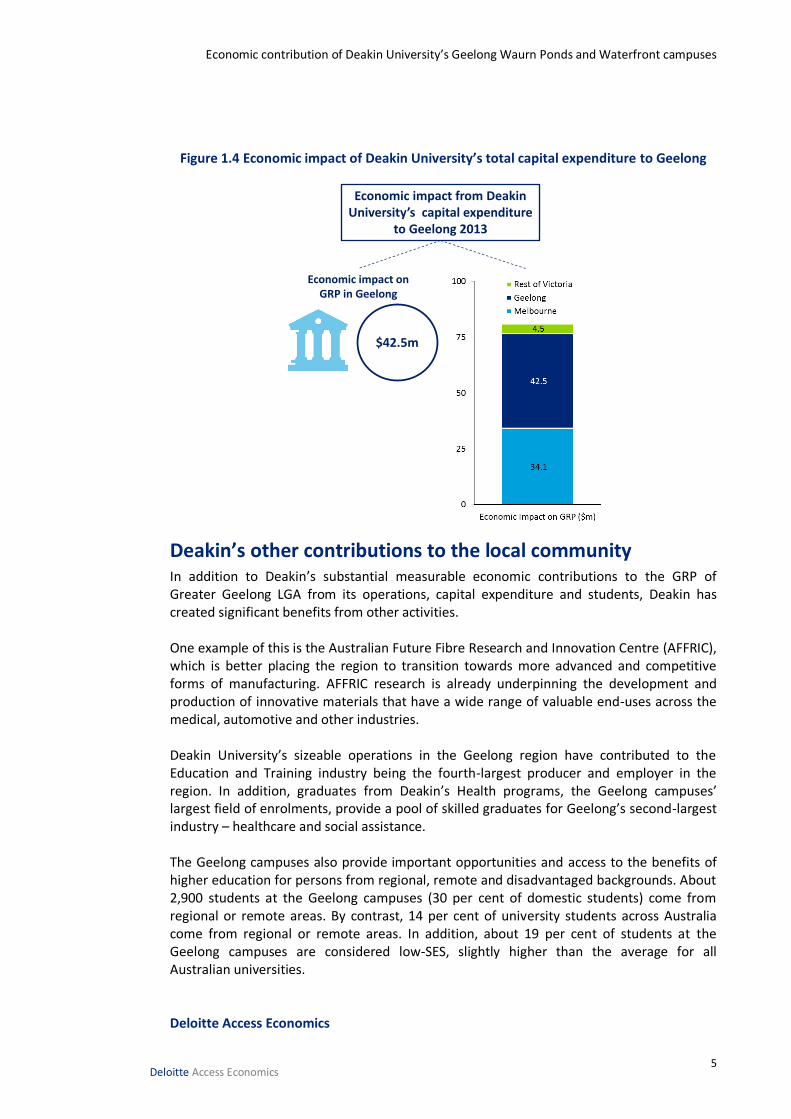
Deakin’s capital expenditure at the Geelong campuses equated to about $82 million in 2013. While measured on a different basis and not additive to the results above, Deakin’s capital expenditure in Geelong (and to a lesser extent other regions) added approximately $43 million to the GRP of Geelong in 2013. Deakin’s capital expenditure in Melbourne and Warrnambool also impacted on the GRP of Geelong, Melbourne and the rest of Victoria. These impacts are depicted in figure 1.4 below and discussed in section 5.5.
Economic contribution of Deakin University’s Geelong Waurn Ponds and Waterfront campuses
5 Deloitte Access Economics
Figure 1.4 Economic impact of Deakin University’s total capital expenditure to Geelong
Deakin’s other contributions to the local community In addition to Deakin’s substantial measurable economic contributions to the GRP of Greater Geelong LGA from its operations, capital expenditure and students, Deakin has created significant benefits from other activities. One example of this is the Australian Future Fibre Research and Innovation Centre (AFFRIC), which is better placing the region to transition towards more advanced and competitive forms of manufacturing. AFFRIC research is already underpinning the development and production of innovative materials that have a wide range of valuable end-uses across the medical, automotive and other industries. Deakin University’s sizeable operations in the Geelong region have contributed to the Education and Training industry being the fourth-largest producer and employer in the region. In addition, graduates from Deakin’s Health programs, the Geelong campuses’ largest field of enrolments, provide a pool of skilled graduates for Geelong’s second-largest industry – healthcare and social assistance. The Geelong campuses also provide important opportunities and access to the benefits of higher education for persons from regional, remote and disadvantaged backgrounds. About 2,900 students at the Geelong campuses (30 per cent of domestic students) come from regional or remote areas. By contrast, 14 per cent of university students across Australia come from regional or remote areas. In addition, about 19 per cent of students at the Geelong campuses are considered low-SES, slightly higher than the average for all Australian universities. Deloitte Access Economics
$42.5m
Economic impact from Deakin University’s capital expenditure
to Geelong 2013
Economic impact on GRP in Geelong
Economic contribution of Deakin University’s Geelong Waurn Ponds and Waterfront campuses
6 Deloitte Access Economics
1 Background
1.1 Scope and approach
This report provides estimates of the economic contribution of Deakin University’s Geelong Waurn Ponds and Waterfront campuses to the GRP of the Greater Geelong LGA.2 These contributions are generated by Deakin’s ongoing operations and the expenditure of its students, and its capital expenditure.
While measured on a different basis and not additive to the economic contribution estimates, the economic impact of Deakin’s total capital expenditure at all campuses to Geelong as a whole has also been modelled. Throughout the report, economic ‘contribution’ refers to the economic activity generated by Deakin’s ongoing operations and the expenditure of its students, while economic ‘impact’ refers to economic activity generated by Deakin University’s total capital expenditure.
Alongside this quantitative analysis is information on the region in which Deakin operates, the characteristics of Deakin’s students, including graduate outcomes, and case study material highlighting the Geelong campuses’ broader contributions to the local community.
Economic contribution studies quantify measures such as value added, gross output and employment associated with a given industry or firm, in a historical reference year. The economic contribution is a measure of the value of production by a firm or industry. Deakin University’s economic contributions are quantified using Deloitte Access Economics’ in-house integrated regional input-output model (known as DAE-IRIOM). The model enables us to estimate the economic contributions of each of Deakin’s three campuses in a rigorous, tested economic framework.
The data used to estimate the economic contribution of Deakin University falls into the following broad categories:
Deakin enrolment statistics by student characteristics
Deakin’s financial information (including information on intermediate inputs and suppliers)
Deakin student expenditure by domestic and international students
The majority of this data comes from Deakin University itself. Data on student expenditure comes from the Universities Australia publication University Student Finances in 2012. The model outputs the total economic contribution of Deakin University’s campuses to their local communities, including all direct expenditure by the University and its students, as well as the flow on to other sectors and regions of the economy. The primary measure is ‘value added’. Value added measures the value added to intermediate inputs by the application of capital and labour, by summing wages paid for labour by the University and
2 Gross Regional Product is the total level of final goods output produced by factor inputs within a geographical region over the course of a financial year. GRP is measured using imputed methods as it is difficult to accurately allocate factor inputs to specific regions and the ABS does not publish a series on it.
Economic contribution of Deakin University’s Geelong Waurn Ponds and Waterfront campuses
7 Deloitte Access Economics
its gross operating surplus. The sum of value added across all entities in the economy equals gross domestic product (GDP). Deakin’s economic contribution is also reported in equivalent employment numbers (FTE), and gross output is also reported.
Deloitte Access Economics has used the Deloitte Access Economics – Regional General Equilibrium Model (DAE-RGEM) to estimate the impacts of Deakin University’s total capital expenditure to various regions in 2013. The DAE-RGEM is a large scale, dynamic, multi-region, multi-commodity computable general equilibrium (CGE) model. The model has been customised to include the Melbourne statistical division, the City of Geelong LGA, and the rest of Victoria.
The key difference between the DAE-IRIOM and the DAE-RGEM is that the later captures more relationships and responses from changes in one part of the economy on other parts of the economy. For example, in the DAE-RGEM as Deakin’s capital expenditure causes demand for construction workers to increase, the wage rate for construction workers also increases, muting growth in construction employment. For this reason, CGE models like DAE-RGEM typically produce lower, but more reliable results than other models (discussed in more detail in appendices A and B). The DAE-RGEM projects changes in macroeconomic aggregates such as GDP, employment, export volumes, investment and private consumption. It produces results on the impact to the economy from a shock like a large capital investment by a university. Because of the methodological differences between the DAE-IRIOM and the DAE-RGEM and the potential for double-counting the effects of Deakin’s capital expenditure, the results of the models cannot be added.
1.2 Structure of the report
The report is structured as follows:
Section 2 provides a brief overview of the broader private and social benefits of higher education, and what component of this is captured in economic contribution modelling.
Section 3 provides the contextual backdrop for the Geelong campuses’ economic contributions,, by describing the major characteristics of the local community, including geography, population, economic activity, employment and social indicators.
Section 4 provides an overview of the characteristics of students at the Geelong campuses, including where students live, their cultural and linguistic background, socio-economic status and graduate outcomes.
Section 5 is the core of this report, providing the results of the economic contribution modelling, including the direct and indirect contributions of Deakin’s operations and student expenditure to the local community and beyond. The results of the separate economic impact modelling of Deakin’s total capital expenditure to Geelong are also reported in this section.
Economic contribution of Deakin University’s Geelong Waurn Ponds and Waterfront campuses
8 Deloitte Access Economics
2 The value of higher education Higher education generates a range of benefits for students and the wider community, some of which is amenable to quantifying in economic contribution modelling like that undertaken for this report, and some of which is not captured. Universities contribute to the economy through a variety of channels:
as an economic entity they employ staff, produce economic output and contribute to regional socio-economic atmosphere;
their students spend money over the course of their education, fuelling activity in the local economy (and, in the case of international students, export income as well);
as a teaching institution, they improve the labour force and life prospects for individuals and contribute to a more productive workforce; and
as a research body they generate ideas, new technologies and new knowledge; driving innovation and productivity.
Higher education increases the knowledge and skills of workers, which in turn improves productivity in the workforce, labour force participation and employment. As such, it plays a key role in the national productivity agenda which aims to provide a solid foundation for ongoing economic growth in Australia. The returns to the individual from higher education include an increase in individual income and employment opportunities, as well as wider social benefits from increasing a person’s skill set. An individual completing a bachelor degree in Australia could expect an average private rate of return of 15.3 per cent for males and 17.3 per cent for females, compared to someone who had finished Year 12 (Leigh, 2008). However, it should be noted that these figures may not account for ability bias as people with particular academic abilities are more likely to attend university. Social returns of higher education include greater equality, better informed citizens, and flow-on benefits of improved health outcomes associated with better education and having children more likely to participate in higher education. The opportunities for employment for people with university qualifications are also expected to grow at a faster rate than for workers without such qualifications. Faster growth in knowledge industries will drive employment opportunities in the growing health and education sectors, as well as for professional, managerial and administrative occupations. Recognising the importance of higher education, successive Governments have sought to increase the proportion of the population with higher education qualifications to improve workforce productivity. Higher education policy in Australia has also included goals to increase participation by students from low socioeconomic backgrounds, in order to realise the substantial potential from education beyond high school.
Economic contribution of Deakin University’s Geelong Waurn Ponds and Waterfront campuses
9 Deloitte Access Economics
The value added and employment figures generated by this economic contribution study need to be understood in the context of the broader value of higher education. The model quantifies the economic contribution of Deakin University’s Geelong campuses and students to the local community in 2013. This is based on the direct and flow-on effects of the University’s expenses (including wages and payments to suppliers), revenue and gross operating surplus, as well as student expenditure in the region. Other benefits like improved productivity, contributions to research and knowledge and greater equality are very real consequences of Deakin University’ activities, but not captured in the modelling.
Economic contribution of Deakin University’s Geelong Waurn Ponds and Waterfront campuses
10 Deloitte Access Economics
3 Deakin’s local community In addition to Deakin graduates themselves, the local communities surrounding the Geelong campuses are major beneficiaries of Deakin’s activity in the region. This section provides an overview of the key characteristics of the local community in which the Geelong campuses operate, identifying areas where Deakin influences and is influenced by the local community.
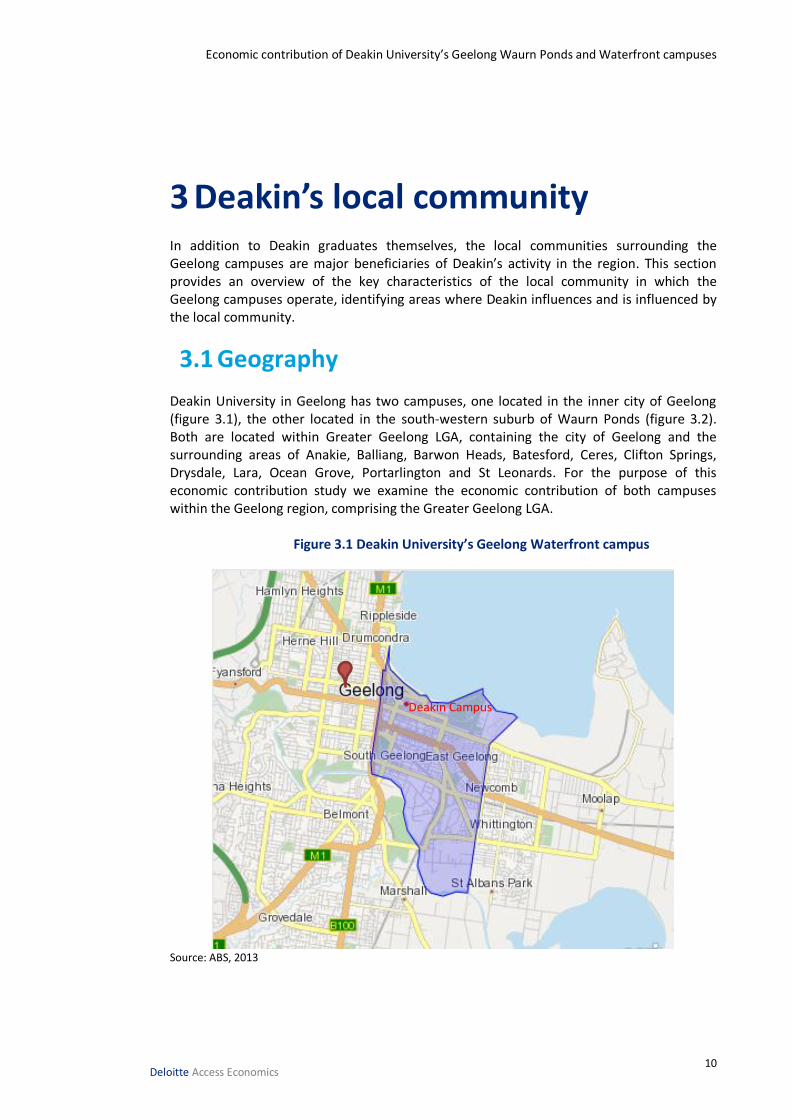
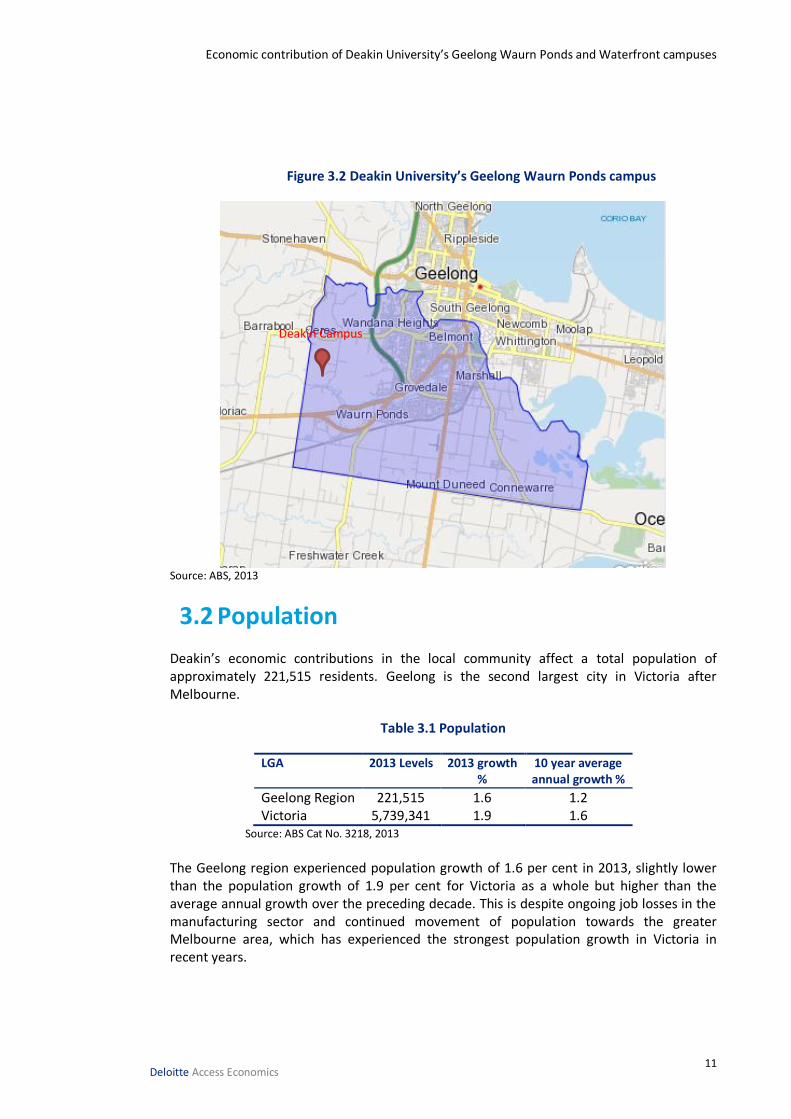
3.1 Geography Deakin University in Geelong has two campuses, one located in the inner city of Geelong (figure 3.1), the other located in the south-western suburb of Waurn Ponds (figure 3.2). Both are located within Greater Geelong LGA, containing the city of Geelong and the surrounding areas of Anakie, Balliang, Barwon Heads, Batesford, Ceres, Clifton Springs, Drysdale, Lara, Ocean Grove, Portarlington and St Leonards. For the purpose of this economic contribution study we examine the economic contribution of both campuses within the Geelong region, comprising the Greater Geelong LGA.
Figure 3.1 Deakin University’s Geelong Waterfront campus
Source: ABS, 2013
Deakin Campus
Economic contribution of Deakin University’s Geelong Waurn Ponds and Waterfront campuses
11 Deloitte Access Economics
Figure 3.2 Deakin University’s Geelong Waurn Ponds campus
Source: ABS, 2013
3.2 Population Deakin’s economic contributions in the local community affect a total population of approximately 221,515 residents. Geelong is the second largest city in Victoria after Melbourne.
Table 3.1 Population
LGA 2013 Levels
2013 growth %
10 year average annual growth %
Geelong Region 221,515 1.6 1.2 Victoria 5,739,341 1.9 1.6
Source: ABS Cat No. 3218, 2013
The Geelong region experienced population growth of 1.6 per cent in 2013, slightly lower than the population growth of 1.9 per cent for Victoria as a whole but higher than the average annual growth over the preceding decade. This is despite ongoing job losses in the manufacturing sector and continued movement of population towards the greater Melbourne area, which has experienced the strongest population growth in Victoria in recent years.
Deakin Campus
Economic contribution of Deakin University’s Geelong Waurn Ponds and Waterfront campuses
12 Deloitte Access Economics
3.3 Economy The economy of the Geelong region is facing challenges from ongoing economic restructuring away from traditional manufacturing, higher than average unemployment and lower than average incomes. Deakin University’s operations and investments have undoubtedly helped bolster local economic performance, and present an ongoing source of economic growth for the local economy.
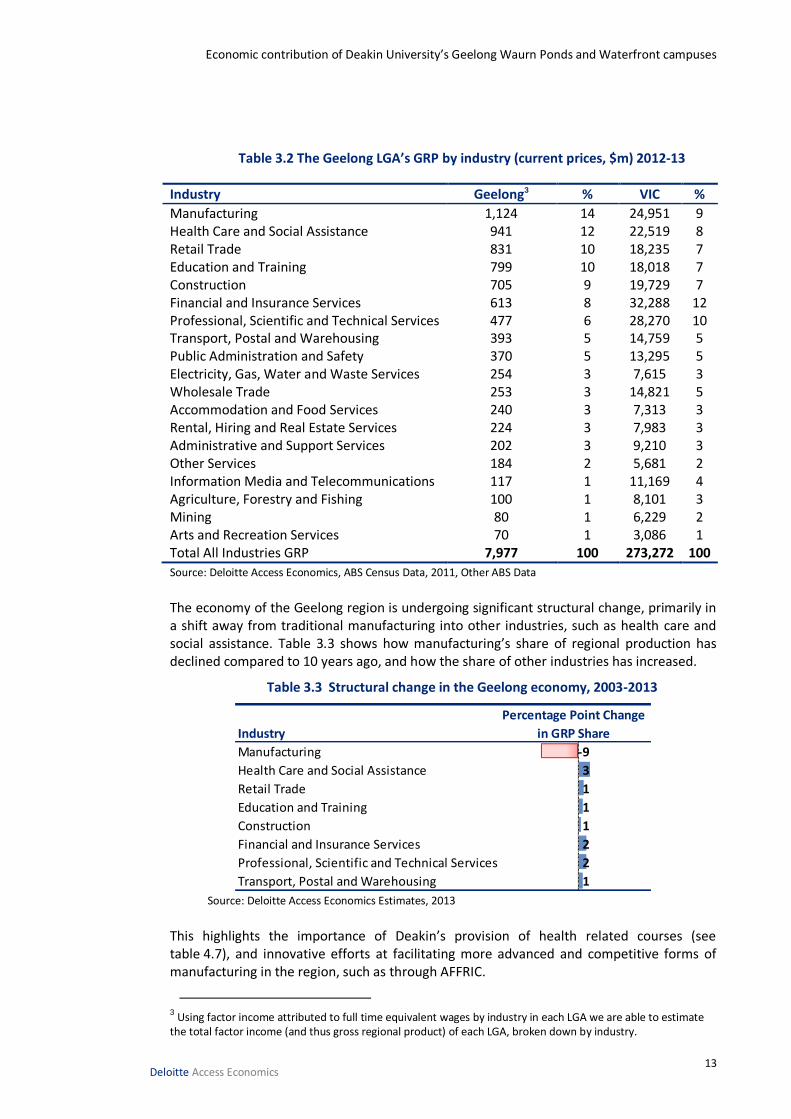
3.3.1 Industry Output Deakin University’s large-scale operations in the Geelong region have undoubtedly influenced the region’s total output and industry make-up, with the fourth largest producer being the Education and Training Industry. The Gross Regional Product (GRP) of the Geelong region in 2013 was $7.98 billion, accounting for 2.9 per cent of Victoria’s total Gross State Product (GSP). The share of GRP attributable to each industry is shown in Table 3.2. Compared to the Victrorian economy as a whole, Geelong has an above average share of Manufacturing (14 per cent of output, compared to 9 per cent for Victoria as a whole). Health care and social assistance, retail, and education and training also represent a higher share of output in the Geelong region than they do in Victoria as a whole.
Economic contribution of Deakin University’s Geelong Waurn Ponds and Waterfront campuses
13 Deloitte Access Economics
Table 3.2 The Geelong LGA’s GRP by industry (current prices, $m) 2012-13
Industry Geelong3 % VIC %
Manufacturing 1,124 14 24,951 9 Health Care and Social Assistance 941 12 22,519 8 Retail Trade 831 10 18,235 7 Education and Training 799 10 18,018 7 Construction 705 9 19,729 7 Financial and Insurance Services 613 8 32,288 12 Professional, Scientific and Technical Services 477 6 28,270 10 Transport, Postal and Warehousing 393 5 14,759 5 Public Administration and Safety 370 5 13,295 5 Electricity, Gas, Water and Waste Services 254 3 7,615 3 Wholesale Trade 253 3 14,821 5 Accommodation and Food Services 240 3 7,313 3 Rental, Hiring and Real Estate Services 224 3 7,983 3 Administrative and Support Services 202 3 9,210 3 Other Services 184 2 5,681 2 Information Media and Telecommunications 117 1 11,169 4 Agriculture, Forestry and Fishing 100 1 8,101 3 Mining 80 1 6,229 2 Arts and Recreation Services 70 1 3,086 1 Total All Industries GRP 7,977 100 273,272 100
Source: Deloitte Access Economics, ABS Census Data, 2011, Other ABS Data
The economy of the Geelong region is undergoing significant structural change, primarily in a shift away from traditional manufacturing into other industries, such as health care and social assistance. Table 3.3 shows how manufacturing’s share of regional production has declined compared to 10 years ago, and how the share of other industries has increased.
Table 3.3 Structural change in the Geelong economy, 2003-2013
Source: Deloitte Access Economics Estimates, 2013
This highlights the importance of Deakin’s provision of health related courses (see table 4.7), and innovative efforts at facilitating more advanced and competitive forms of manufacturing in the region, such as through AFFRIC.
3 Using factor income attributed to full time equivalent wages by industry in each LGA we are able to estimate
the total factor income (and thus gross regional product) of each LGA, broken down by industry.
Industry
Manufacturing -9
Health Care and Social Assistance 3
Retail Trade 1
Education and Training 1
Construction 1
Financial and Insurance Services 2
Professional, Scientific and Technical Services 2
Transport, Postal and Warehousing 1
Percentage Point Change
in GRP Share
Economic contribution of Deakin University’s Geelong Waurn Ponds and Waterfront campuses
14 Deloitte Access Economics
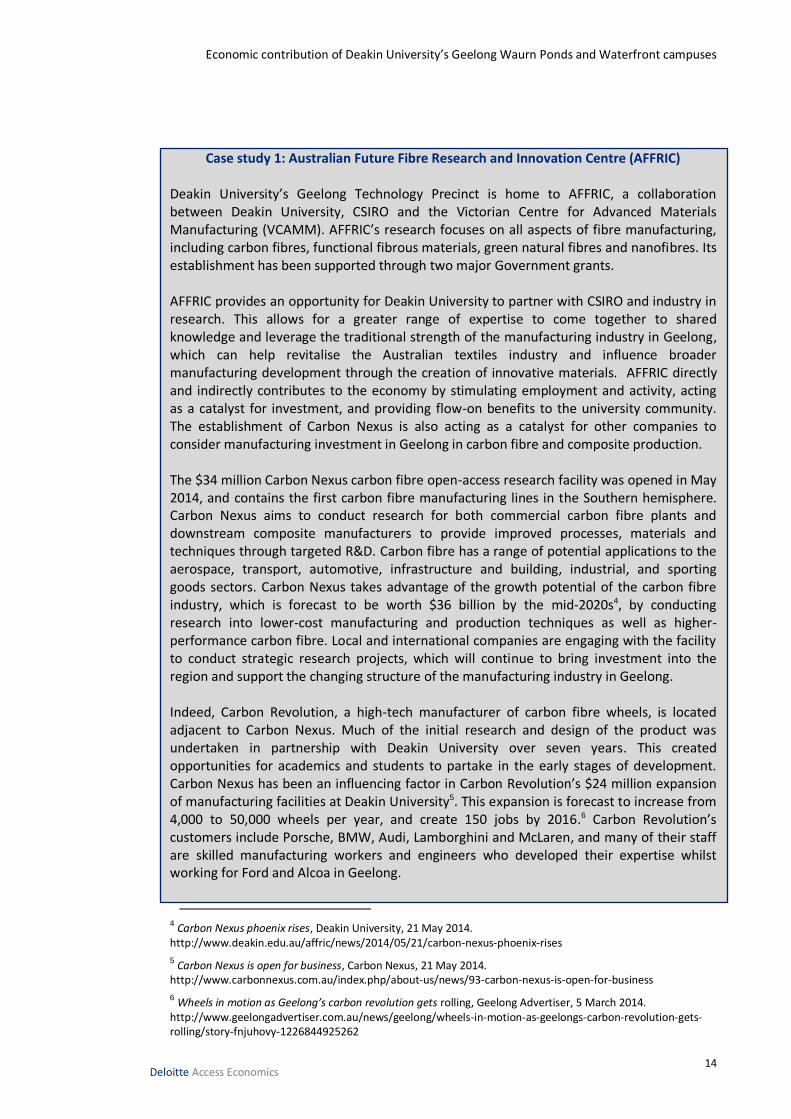
Case study 1: Australian Future Fibre Research and Innovation Centre (AFFRIC) Deakin University’s Geelong Technology Precinct is home to AFFRIC, a collaboration between Deakin University, CSIRO and the Victorian Centre for Advanced Materials Manufacturing (VCAMM). AFFRIC’s research focuses on all aspects of fibre manufacturing, including carbon fibres, functional fibrous materials, green natural fibres and nanofibres. Its establishment has been supported through two major Government grants. AFFRIC provides an opportunity for Deakin University to partner with CSIRO and industry in research. This allows for a greater range of expertise to come together to shared knowledge and leverage the traditional strength of the manufacturing industry in Geelong, which can help revitalise the Australian textiles industry and influence broader manufacturing development through the creation of innovative materials. AFFRIC directly and indirectly contributes to the economy by stimulating employment and activity, acting as a catalyst for investment, and providing flow-on benefits to the university community. The establishment of Carbon Nexus is also acting as a catalyst for other companies to consider manufacturing investment in Geelong in carbon fibre and composite production. The $34 million Carbon Nexus carbon fibre open-access research facility was opened in May 2014, and contains the first carbon fibre manufacturing lines in the Southern hemisphere. Carbon Nexus aims to conduct research for both commercial carbon fibre plants and downstream composite manufacturers to provide improved processes, materials and techniques through targeted R&D. Carbon fibre has a range of potential applications to the aerospace, transport, automotive, infrastructure and building, industrial, and sporting goods sectors. Carbon Nexus takes advantage of the growth potential of the carbon fibre industry, which is forecast to be worth $36 billion by the mid-2020s4, by conducting research into lower-cost manufacturing and production techniques as well as higher-performance carbon fibre. Local and international companies are engaging with the facility to conduct strategic research projects, which will continue to bring investment into the region and support the changing structure of the manufacturing industry in Geelong. Indeed, Carbon Revolution, a high-tech manufacturer of carbon fibre wheels, is located adjacent to Carbon Nexus. Much of the initial research and design of the product was undertaken in partnership with Deakin University over seven years. This created opportunities for academics and students to partake in the early stages of development. Carbon Nexus has been an influencing factor in Carbon Revolution’s $24 million expansion of manufacturing facilities at Deakin University5. This expansion is forecast to increase from 4,000 to 50,000 wheels per year, and create 150 jobs by 2016.6 Carbon Revolution’s customers include Porsche, BMW, Audi, Lamborghini and McLaren, and many of their staff are skilled manufacturing workers and engineers who developed their expertise whilst working for Ford and Alcoa in Geelong.
4 Carbon Nexus phoenix rises, Deakin University, 21 May 2014. http://www.deakin.edu.au/affric/news/2014/05/21/carbon-nexus-phoenix-rises
5 Carbon Nexus is open for business, Carbon Nexus, 21 May 2014. http://www.carbonnexus.com.au/index.php/about-us/news/93-carbon-nexus-is-open-for-business
6 Wheels in motion as Geelong’s carbon revolution gets rolling, Geelong Advertiser, 5 March 2014. http://www.geelongadvertiser.com.au/news/geelong/wheels-in-motion-as-geelongs-carbon-revolution-gets-rolling/story-fnjuhovy-1226844925262
Economic contribution of Deakin University’s Geelong Waurn Ponds and Waterfront campuses
15 Deloitte Access Economics
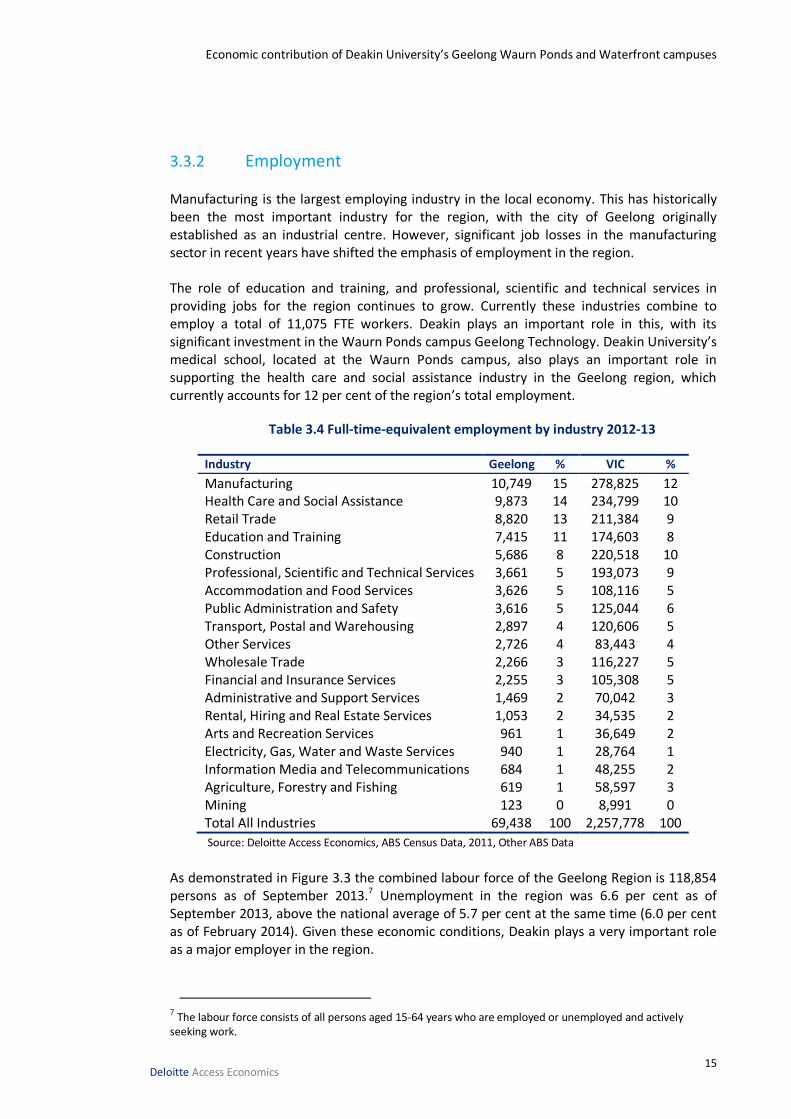
3.3.2 Employment Manufacturing is the largest employing industry in the local economy. This has historically been the most important industry for the region, with the city of Geelong originally established as an industrial centre. However, significant job losses in the manufacturing sector in recent years have shifted the emphasis of employment in the region. The role of education and training, and professional, scientific and technical services in providing jobs for the region continues to grow. Currently these industries combine to employ a total of 11,075 FTE workers. Deakin plays an important role in this, with its significant investment in the Waurn Ponds campus Geelong Technology. Deakin University’s medical school, located at the Waurn Ponds campus, also plays an important role in supporting the health care and social assistance industry in the Geelong region, which currently accounts for 12 per cent of the region’s total employment.
Table 3.4 Full-time-equivalent employment by industry 2012-13
Industry Geelong % VIC %
Manufacturing 10,749 15 278,825 12 Health Care and Social Assistance 9,873 14 234,799 10 Retail Trade 8,820 13 211,384 9 Education and Training 7,415 11 174,603 8 Construction 5,686 8 220,518 10 Professional, Scientific and Technical Services 3,661 5 193,073 9 Accommodation and Food Services 3,626 5 108,116 5 Public Administration and Safety 3,616 5 125,044 6 Transport, Postal and Warehousing 2,897 4 120,606 5 Other Services 2,726 4 83,443 4 Wholesale Trade 2,266 3 116,227 5 Financial and Insurance Services 2,255 3 105,308 5 Administrative and Support Services 1,469 2 70,042 3 Rental, Hiring and Real Estate Services 1,053 2 34,535 2 Arts and Recreation Services 961 1 36,649 2 Electricity, Gas, Water and Waste Services 940 1 28,764 1 Information Media and Telecommunications 684 1 48,255 2 Agriculture, Forestry and Fishing 619 1 58,597 3 Mining 123 0 8,991 0 Total All Industries 69,438 100 2,257,778 100
Source: Deloitte Access Economics, ABS Census Data, 2011, Other ABS Data
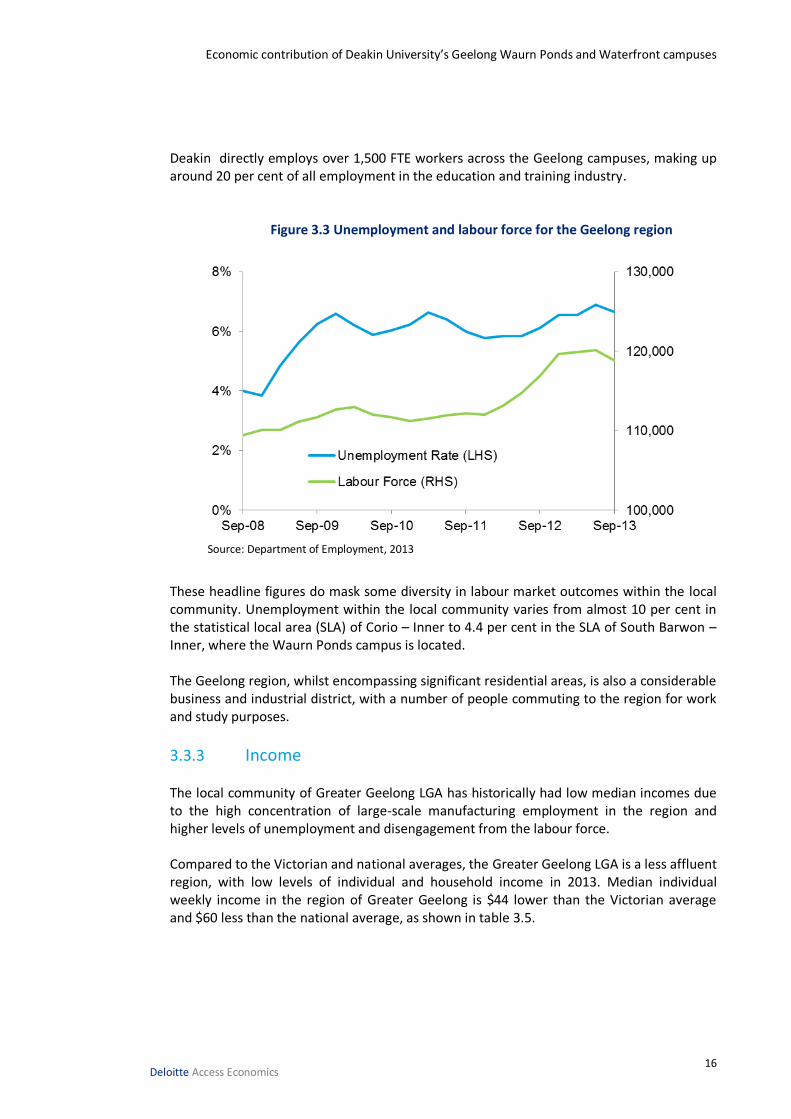
As demonstrated in Figure 3.3 the combined labour force of the Geelong Region is 118,854 persons as of September 2013.7 Unemployment in the region was 6.6 per cent as of September 2013, above the national average of 5.7 per cent at the same time (6.0 per cent as of February 2014). Given these economic conditions, Deakin plays a very important role as a major employer in the region.
7 The labour force consists of all persons aged 15-64 years who are employed or unemployed and actively
seeking work.
Economic contribution of Deakin University’s Geelong Waurn Ponds and Waterfront campuses
16 Deloitte Access Economics
Deakin directly employs over 1,500 FTE workers across the Geelong campuses, making up around 20 per cent of all employment in the education and training industry.
Figure 3.3 Unemployment and labour force for the Geelong region
Source: Department of Employment, 2013
These headline figures do mask some diversity in labour market outcomes within the local community. Unemployment within the local community varies from almost 10 per cent in the statistical local area (SLA) of Corio – Inner to 4.4 per cent in the SLA of South Barwon – Inner, where the Waurn Ponds campus is located. The Geelong region, whilst encompassing significant residential areas, is also a considerable business and industrial district, with a number of people commuting to the region for work and study purposes.
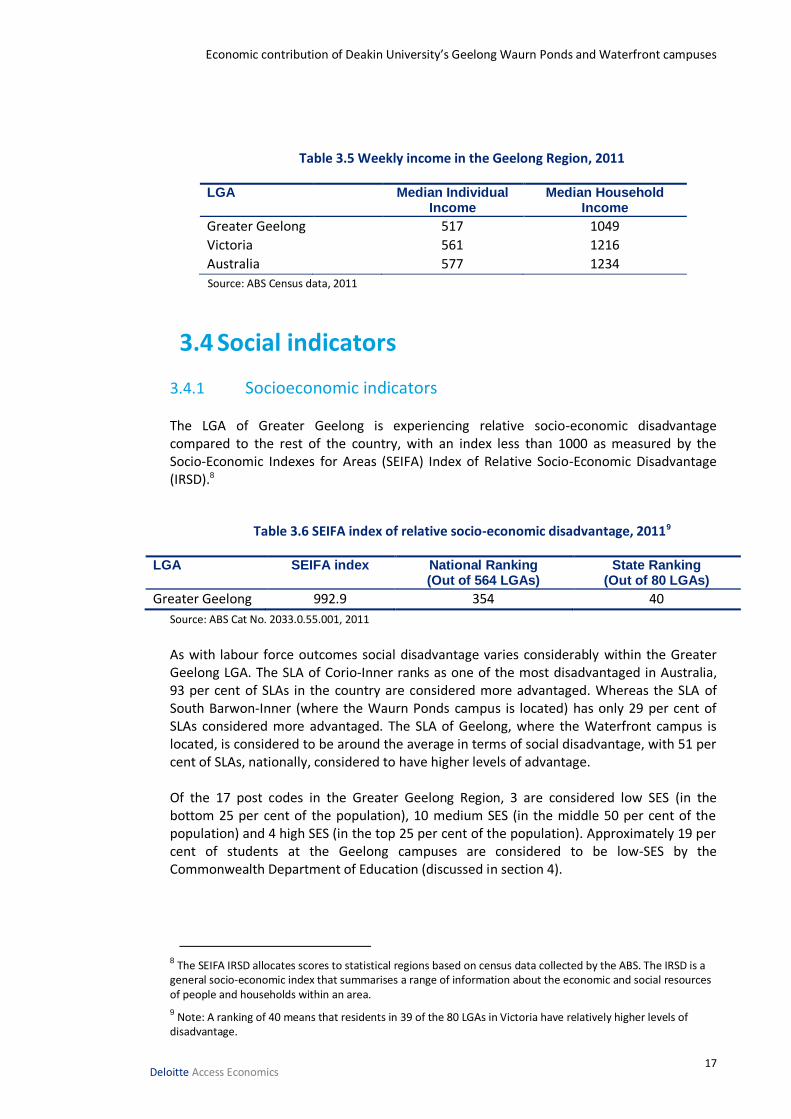
3.3.3 Income The local community of Greater Geelong LGA has historically had low median incomes due to the high concentration of large-scale manufacturing employment in the region and higher levels of unemployment and disengagement from the labour force. Compared to the Victorian and national averages, the Greater Geelong LGA is a less affluent region, with low levels of individual and household income in 2013. Median individual weekly income in the region of Greater Geelong is $44 lower than the Victorian average and $60 less than the national average, as shown in table 3.5.
Economic contribution of Deakin University’s Geelong Waurn Ponds and Waterfront campuses
17 Deloitte Access Economics
Table 3.5 Weekly income in the Geelong Region, 2011
LGA Median Individual Income
Median Household Income
Greater Geelong 517 1049
Victoria 561 1216
Australia 577 1234
Source: ABS Census data, 2011
3.4 Social indicators
3.4.1 Socioeconomic indicators The LGA of Greater Geelong is experiencing relative socio-economic disadvantage compared to the rest of the country, with an index less than 1000 as measured by the Socio-Economic Indexes for Areas (SEIFA) Index of Relative Socio-Economic Disadvantage (IRSD).8
Table 3.6 SEIFA index of relative socio-economic disadvantage, 20119
LGA SEIFA index National Ranking (Out of 564 LGAs)
State Ranking (Out of 80 LGAs)
Greater Geelong 992.9 354 40
Source: ABS Cat No. 2033.0.55.001, 2011
As with labour force outcomes social disadvantage varies considerably within the Greater Geelong LGA. The SLA of Corio-Inner ranks as one of the most disadvantaged in Australia, 93 per cent of SLAs in the country are considered more advantaged. Whereas the SLA of South Barwon-Inner (where the Waurn Ponds campus is located) has only 29 per cent of SLAs considered more advantaged. The SLA of Geelong, where the Waterfront campus is located, is considered to be around the average in terms of social disadvantage, with 51 per cent of SLAs, nationally, considered to have higher levels of advantage. Of the 17 post codes in the Greater Geelong Region, 3 are considered low SES (in the bottom 25 per cent of the population), 10 medium SES (in the middle 50 per cent of the population) and 4 high SES (in the top 25 per cent of the population). Approximately 19 per cent of students at the Geelong campuses are considered to be low-SES by the Commonwealth Department of Education (discussed in section 4).
8 The SEIFA IRSD allocates scores to statistical regions based on census data collected by the ABS. The IRSD is a general socio-economic index that summarises a range of information about the economic and social resources of people and households within an area.
9 Note: A ranking of 40 means that residents in 39 of the 80 LGAs in Victoria have relatively higher levels of
disadvantage.
Economic contribution of Deakin University’s Geelong Waurn Ponds and Waterfront campuses
18 Deloitte Access Economics
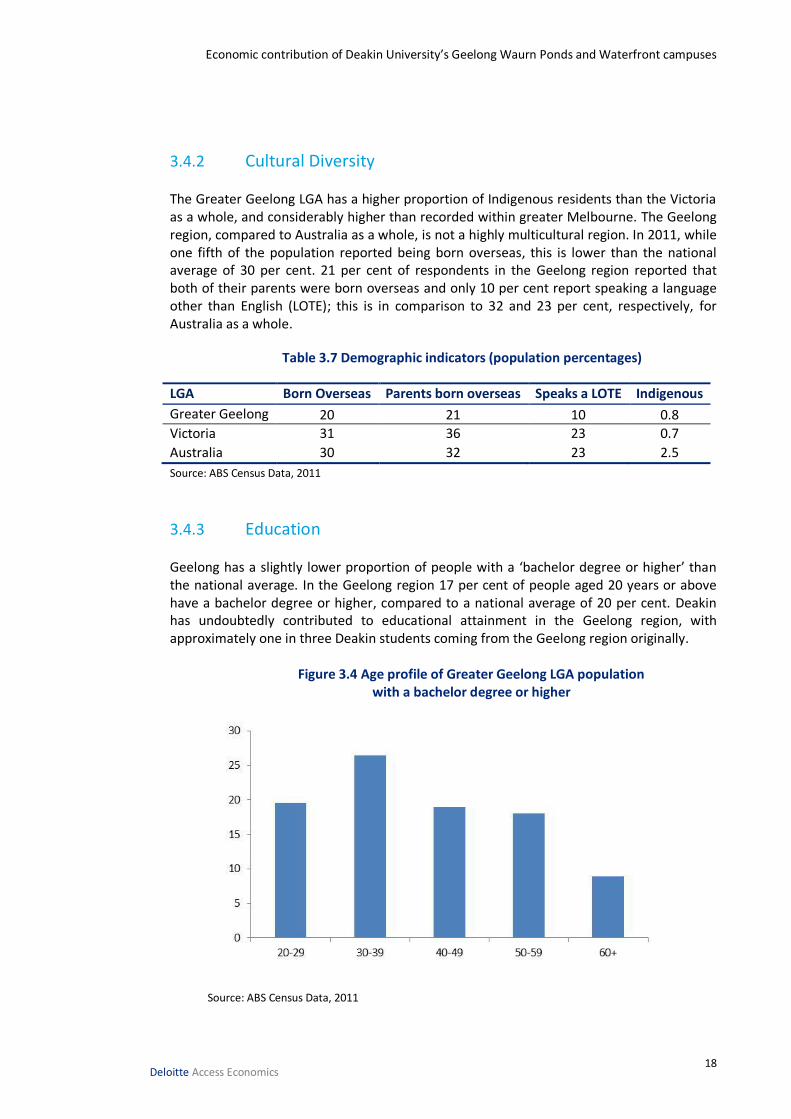
3.4.2 Cultural Diversity The Greater Geelong LGA has a higher proportion of Indigenous residents than the Victoria as a whole, and considerably higher than recorded within greater Melbourne. The Geelong region, compared to Australia as a whole, is not a highly multicultural region. In 2011, while one fifth of the population reported being born overseas, this is lower than the national average of 30 per cent. 21 per cent of respondents in the Geelong region reported that both of their parents were born overseas and only 10 per cent report speaking a language other than English (LOTE); this is in comparison to 32 and 23 per cent, respectively, for Australia as a whole.
Table 3.7 Demographic indicators (population percentages)
LGA Born Overseas Parents born overseas Speaks a LOTE Indigenous
Greater Geelong 20 21 10 0.8
Victoria 31 36 23 0.7
Australia 30 32 23 2.5
Source: ABS Census Data, 2011
3.4.3 Education Geelong has a slightly lower proportion of people with a ‘bachelor degree or higher’ than the national average. In the Geelong region 17 per cent of people aged 20 years or above have a bachelor degree or higher, compared to a national average of 20 per cent. Deakin has undoubtedly contributed to educational attainment in the Geelong region, with approximately one in three Deakin students coming from the Geelong region originally.
Figure 3.4 Age profile of Greater Geelong LGA population with a bachelor degree or higher
Source: ABS Census Data, 2011
Economic contribution of Deakin University’s Geelong Waurn Ponds and Waterfront campuses
19 Deloitte Access Economics
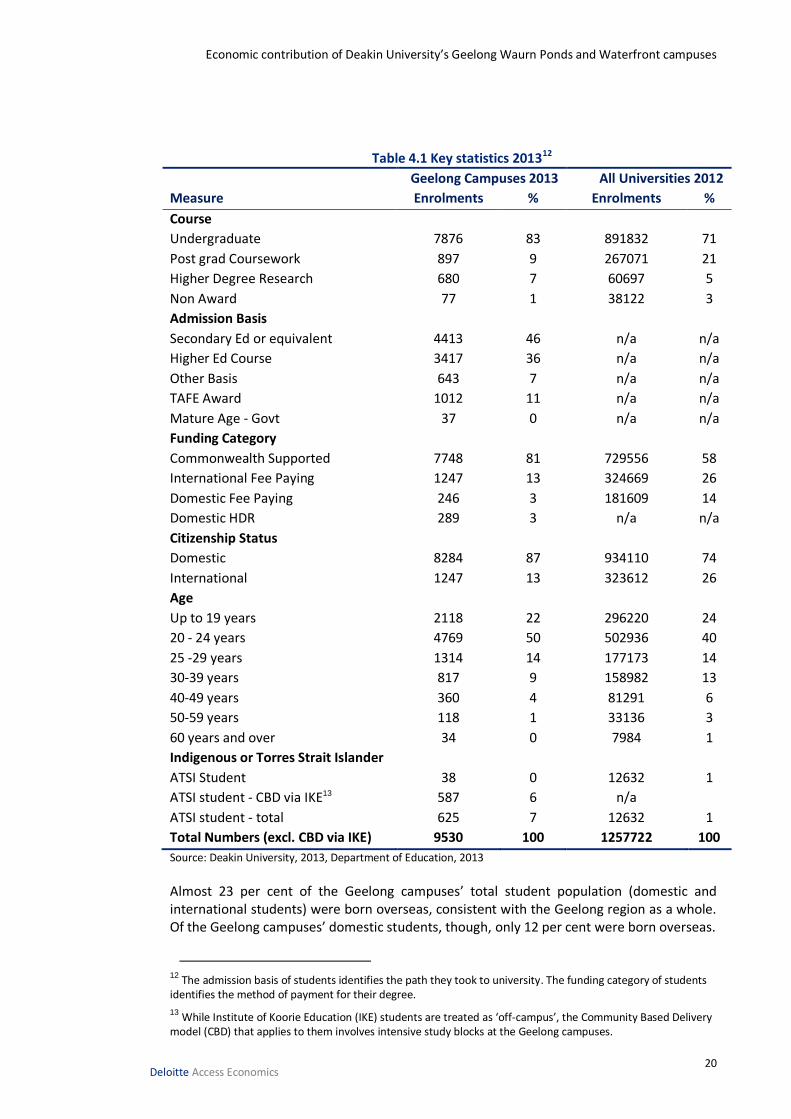
4 Deakin student characteristics Deakin University students are an integral part of the Geelong region, both influencing and influenced by the social, economic and demographic characteristics of the broader population. Approximately 9,530 students study on-campus at Deakin’s two campuses in Geelong. Of these students, 4,901 live in the Geelong region during their studies, with around a third of these moving in from other regions. Approximately 4.3 per cent of the total population living in the Geelong region are Deakin students. Deakin’s Geelong campuses provide important opportunities and access to the benefits of higher education for persons from regional, remote and disadvantaged backgrounds. About 2,900 students at Deakin University’s Geelong campuses (30 per cent of domestic students) come from regional or remote areas. By contrast, 14 per cent of university students across Australia come from regional or remote areas. In addition, about 19 per cent of students at Deakin University’s Geelong campuses are considered low-SES, slightly higher than the average for all Australian universities. This section describes key characteristics of Deakin’s student population.
4.1 The students of Deakin University’s Geelong Waurn Ponds and Waterfront Campuses
Table 4.1 provides a breakdown of information on on-campus10 students at Deakin University’s Geelong campuses in 2013, compared to students at all Australian universities.11 Some key characteristics of Deakin’s student population include:
The vast majority of students at Deakin University’s Geelong campuses are undertaking undergraduate courses. Given undergraduate courses qualify for Commonwealth funding, relatively more Deakin students are accessing higher education through Commonwealth Supported Places than the average for all Australian universities.
The Geelong campuses have a larger proportion of students in higher degree research than the national average. Deakin University’s undergraduate courses are providing a platform for students to go onto further education. The proportion of Deakin graduates in further full-time study has been increasing steadily since 2009 and is currently above the sector average at 21.7 per cent (more information in section 4.3).
Deakin University’s Geelong campuses’ students enrol in the university via several routes apart from the traditional secondary education or equivalent entry. This is consistent with the relatively older age profile of Deakin enrolments.
10 Deakin defines ‘on-campus’ students as students who take most of their subjects on-campus. As such many ‘mixed-mode’ students are included (while some are excluded). While only on-campus student numbers are reported here, reflecting the focus of the modelling on economic contributions in the campus regions, the modelling results capture the economic contribution of all of Deakin’s students via total student revenue.
11 The student numbers are “reportable students”. Deakin advised that these are essentially the number of students, although the very small number of students undertaking more than one courses would be double-counted.
Economic contribution of Deakin University’s Geelong Waurn Ponds and Waterfront campuses
20 Deloitte Access Economics
Table 4.1 Key statistics 201312
Geelong Campuses 2013 All Universities 2012
Measure Enrolments % Enrolments %
Course
Undergraduate 7876 83 891832 71
Post grad Coursework 897 9 267071 21
Higher Degree Research 680 7 60697 5
Non Award 77 1 38122 3
Admission Basis
Secondary Ed or equivalent 4413 46 n/a n/a
Higher Ed Course 3417 36 n/a n/a
Other Basis 643 7 n/a n/a
TAFE Award 1012 11 n/a n/a
Mature Age - Govt 37 0 n/a n/a
Funding Category
Commonwealth Supported 7748 81 729556 58
International Fee Paying 1247 13 324669 26
Domestic Fee Paying 246 3 181609 14
Domestic HDR 289 3 n/a n/a
Citizenship Status
Domestic 8284 87 934110 74
International 1247 13 323612 26
Age
Up to 19 years 2118 22 296220 24
20 - 24 years 4769 50 502936 40
25 -29 years 1314 14 177173 14
30-39 years 817 9 158982 13
40-49 years 360 4 81291 6
50-59 years 118 1 33136 3
60 years and over 34 0 7984 1
Indigenous or Torres Strait Islander
ATSI Student 38 0 12632 1
ATSI student - CBD via IKE13 587 6 n/a
ATSI student - total 625 7 12632 1
Total Numbers (excl. CBD via IKE) 9530 100 1257722 100
Source: Deakin University, 2013, Department of Education, 2013
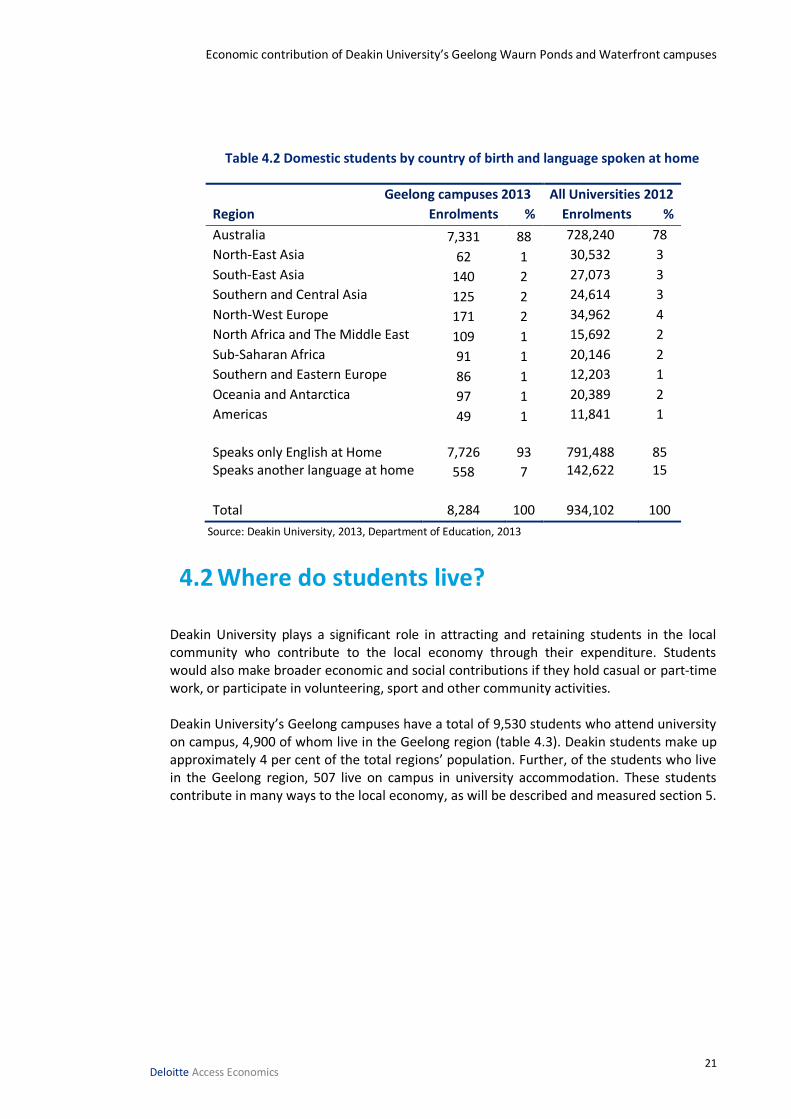
Almost 23 per cent of the Geelong campuses’ total student population (domestic and international students) were born overseas, consistent with the Geelong region as a whole. Of the Geelong campuses’ domestic students, though, only 12 per cent were born overseas.
12 The admission basis of students identifies the path they took to university. The funding category of students identifies the method of payment for their degree.
13 While Institute of Koorie Education (IKE) students are treated as ‘off-campus’, the Community Based Delivery
model (CBD) that applies to them involves intensive study blocks at the Geelong campuses.
Economic contribution of Deakin University’s Geelong Waurn Ponds and Waterfront campuses
21 Deloitte Access Economics
Table 4.2 Domestic students by country of birth and language spoken at home
Geelong campuses 2013 All Universities 2012
Region Enrolments % Enrolments %
Australia 7,331 88 728,240 78
North-East Asia 62 1 30,532 3
South-East Asia 140 2 27,073 3
Southern and Central Asia 125 2 24,614 3
North-West Europe 171 2 34,962 4
North Africa and The Middle East 109 1 15,692 2
Sub-Saharan Africa 91 1 20,146 2
Southern and Eastern Europe 86 1 12,203 1
Oceania and Antarctica 97 1 20,389 2
Americas 49 1 11,841 1
Speaks only English at Home 7,726 93 791,488 85 Speaks another language at home 558 7 142,622 15
Total 8,284 100 934,102 100
Source: Deakin University, 2013, Department of Education, 2013
4.2 Where do students live?
Deakin University plays a significant role in attracting and retaining students in the local community who contribute to the local economy through their expenditure. Students would also make broader economic and social contributions if they hold casual or part-time work, or participate in volunteering, sport and other community activities. Deakin University’s Geelong campuses have a total of 9,530 students who attend university on campus, 4,900 of whom live in the Geelong region (table 4.3). Deakin students make up approximately 4 per cent of the total regions’ population. Further, of the students who live in the Geelong region, 507 live on campus in university accommodation. These students contribute in many ways to the local economy, as will be described and measured section 5.
Economic contribution of Deakin University’s Geelong Waurn Ponds and Waterfront campuses
22 Deloitte Access Economics
Table 4.3 Term location address
Geelong Campuses
Region Enrolments %
Geelong Region 4,901 51
Rest of Victoria 4,292 45
Unknown14 337 4
Total 9,530 100
Source: Deakin University, 2013
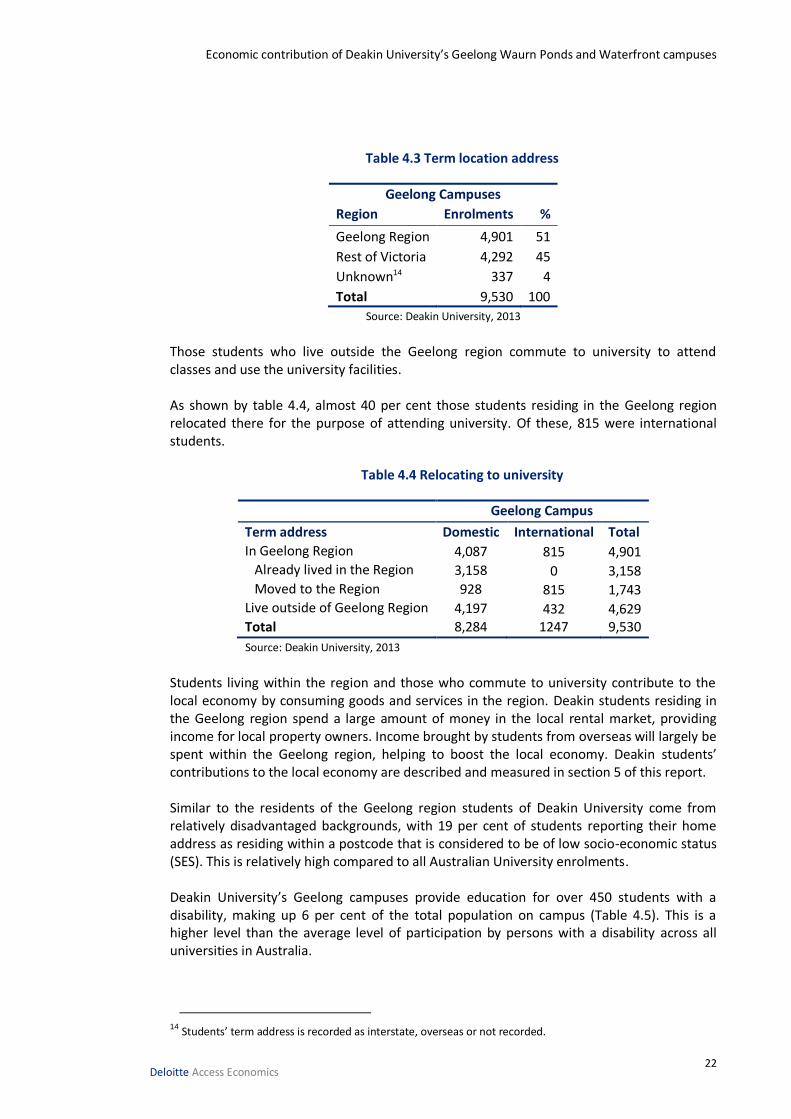
Those students who live outside the Geelong region commute to university to attend classes and use the university facilities. As shown by table 4.4, almost 40 per cent those students residing in the Geelong region relocated there for the purpose of attending university. Of these, 815 were international students.
Table 4.4 Relocating to university
Geelong Campus
Term address Domestic International Total
In Geelong Region 4,087 815 4,901 Already lived in the Region 3,158 0 3,158 Moved to the Region 928 815 1,743 Live outside of Geelong Region 4,197 432 4,629 Total 8,284 1247 9,530
Source: Deakin University, 2013
Students living within the region and those who commute to university contribute to the local economy by consuming goods and services in the region. Deakin students residing in the Geelong region spend a large amount of money in the local rental market, providing income for local property owners. Income brought by students from overseas will largely be spent within the Geelong region, helping to boost the local economy. Deakin students’ contributions to the local economy are described and measured in section 5 of this report. Similar to the residents of the Geelong region students of Deakin University come from relatively disadvantaged backgrounds, with 19 per cent of students reporting their home address as residing within a postcode that is considered to be of low socio-economic status (SES). This is relatively high compared to all Australian University enrolments. Deakin University’s Geelong campuses provide education for over 450 students with a disability, making up 6 per cent of the total population on campus (Table 4.5). This is a higher level than the average level of participation by persons with a disability across all universities in Australia.
14
Students’ term address is recorded as interstate, overseas or not recorded.
Economic contribution of Deakin University’s Geelong Waurn Ponds and Waterfront campuses
23 Deloitte Access Economics
Table 4.5 Enrolments by socio-economic status (SES) and disability 201315
Geelong campuses 2013 All Universities 2012
SES16/Disability Category17 Enrolments % Enrolments %
Low SES18 1,380 19 138,644 17
Medium SES19 4,563 62 n/a n/a
High SES20 1,379 19 n/a n/a
unknown 80 1 n/a n/a
Disability 478 6 43,011 4.5
Source: Deakin University, 2013; Department of Education 2013.
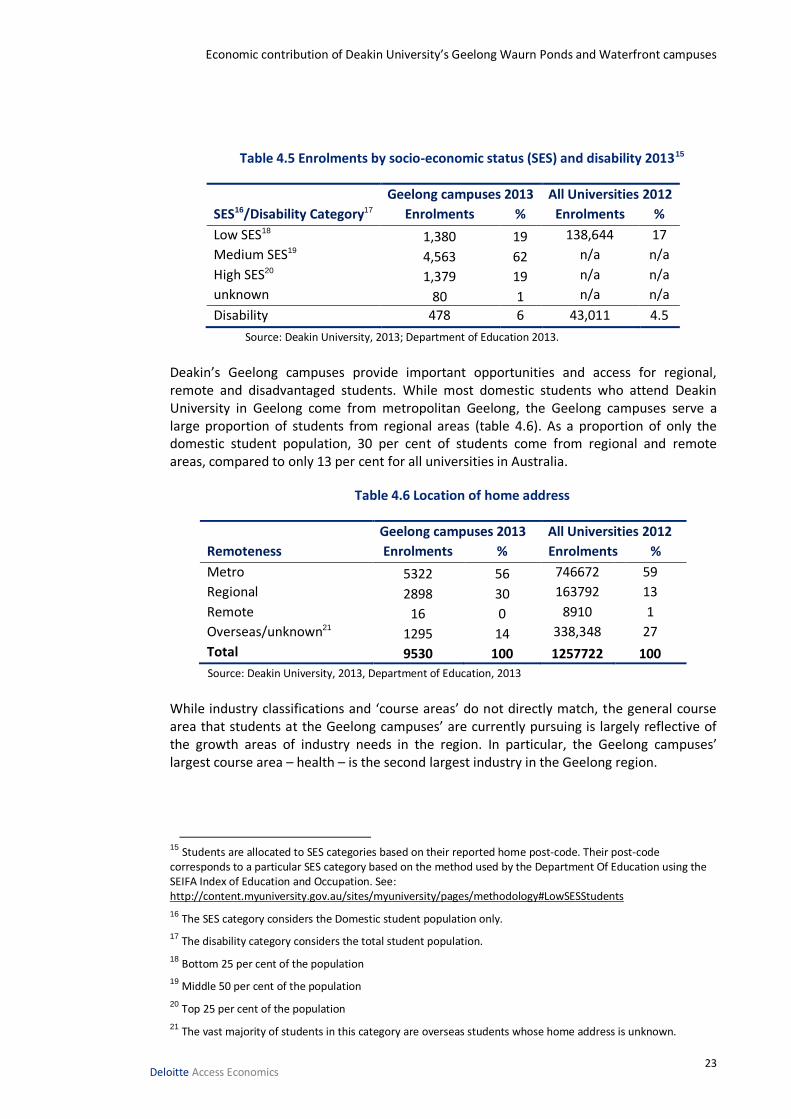
Deakin’s Geelong campuses provide important opportunities and access for regional, remote and disadvantaged students. While most domestic students who attend Deakin University in Geelong come from metropolitan Geelong, the Geelong campuses serve a large proportion of students from regional areas (table 4.6). As a proportion of only the domestic student population, 30 per cent of students come from regional and remote areas, compared to only 13 per cent for all universities in Australia.
Table 4.6 Location of home address
Geelong campuses 2013 All Universities 2012
Remoteness Enrolments % Enrolments %
Metro 5322 56 746672 59
Regional 2898 30 163792 13
Remote 16 0 8910 1
Overseas/unknown21 1295 14 338,348 27
Total 9530 100 1257722 100
Source: Deakin University, 2013, Department of Education, 2013
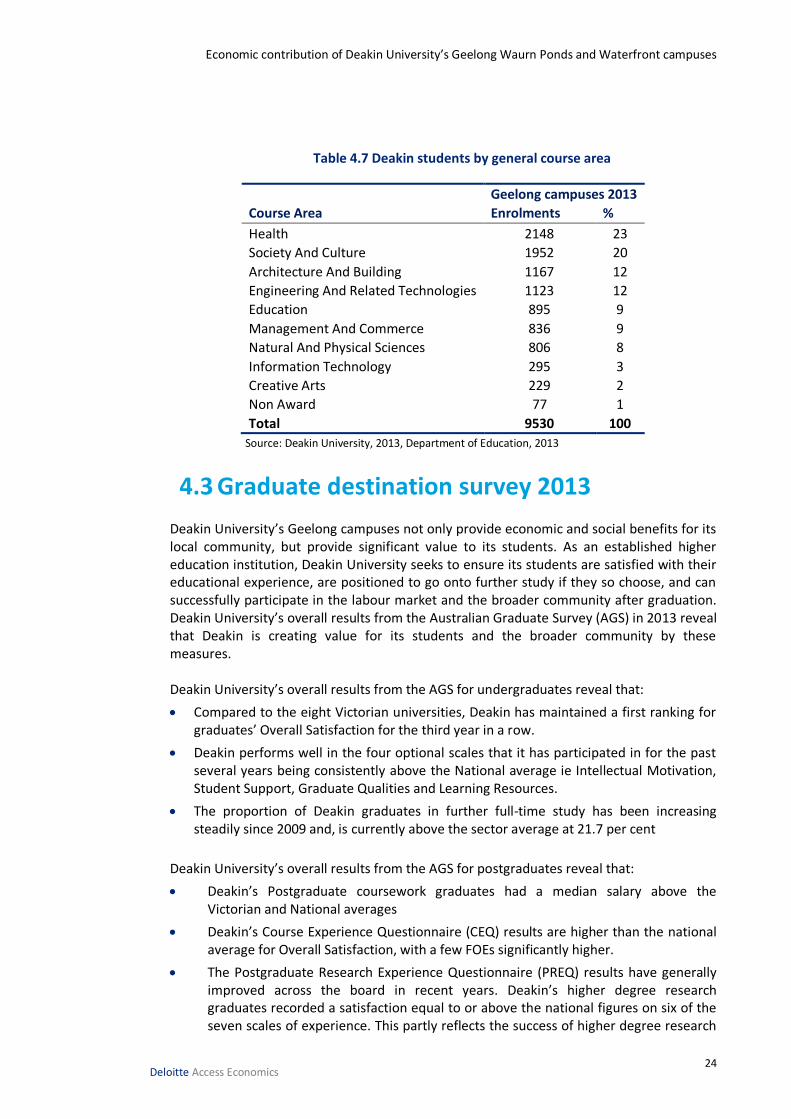
While industry classifications and ‘course areas’ do not directly match, the general course area that students at the Geelong campuses’ are currently pursuing is largely reflective of the growth areas of industry needs in the region. In particular, the Geelong campuses’ largest course area – health – is the second largest industry in the Geelong region.
15 Students are allocated to SES categories based on their reported home post-code. Their post-code corresponds to a particular SES category based on the method used by the Department Of Education using the SEIFA Index of Education and Occupation. See: http://content.myuniversity.gov.au/sites/myuniversity/pages/methodology#LowSESStudents
16 The SES category considers the Domestic student population only.
17 The disability category considers the total student population.
18 Bottom 25 per cent of the population
19 Middle 50 per cent of the population
20 Top 25 per cent of the population
21 The vast majority of students in this category are overseas students whose home address is unknown.
Economic contribution of Deakin University’s Geelong Waurn Ponds and Waterfront campuses
24 Deloitte Access Economics
Table 4.7 Deakin students by general course area
Geelong campuses 2013
Course Area Enrolments %
Health 2148 23
Society And Culture 1952 20
Architecture And Building 1167 12
Engineering And Related Technologies 1123 12
Education 895 9
Management And Commerce 836 9
Natural And Physical Sciences 806 8
Information Technology 295 3
Creative Arts 229 2
Non Award 77 1
Total 9530 100
Source: Deakin University, 2013, Department of Education, 2013
4.3 Graduate destination survey 2013 Deakin University’s Geelong campuses not only provide economic and social benefits for its local community, but provide significant value to its students. As an established higher education institution, Deakin University seeks to ensure its students are satisfied with their educational experience, are positioned to go onto further study if they so choose, and can successfully participate in the labour market and the broader community after graduation. Deakin University’s overall results from the Australian Graduate Survey (AGS) in 2013 reveal that Deakin is creating value for its students and the broader community by these measures. Deakin University’s overall results from the AGS for undergraduates reveal that:
Compared to the eight Victorian universities, Deakin has maintained a first ranking for graduates’ Overall Satisfaction for the third year in a row.
Deakin performs well in the four optional scales that it has participated in for the past several years being consistently above the National average ie Intellectual Motivation, Student Support, Graduate Qualities and Learning Resources.
The proportion of Deakin graduates in further full-time study has been increasing steadily since 2009 and, is currently above the sector average at 21.7 per cent
Deakin University’s overall results from the AGS for postgraduates reveal that:
Deakin’s Postgraduate coursework graduates had a median salary above the Victorian and National averages
Deakin’s Course Experience Questionnaire (CEQ) results are higher than the national average for Overall Satisfaction, with a few FOEs significantly higher.
The Postgraduate Research Experience Questionnaire (PREQ) results have generally improved across the board in recent years. Deakin’s higher degree research graduates recorded a satisfaction equal to or above the national figures on six of the seven scales of experience. This partly reflects the success of higher degree research
Economic contribution of Deakin University’s Geelong Waurn Ponds and Waterfront campuses
25 Deloitte Access Economics
at Geelong which has a higher percentage of higher degree research students than the national average.
The following section presents the results of modelling the economic contribution of Deakin University and its students to the Geelong region.
Economic contribution of Deakin University’s Geelong Waurn Ponds and Waterfront campuses
26 Deloitte Access Economics
5 Economic contribution of the Geelong campuses
Deakin University’s Geelong campuses make specific and measurable economic contributions to the local community from their ongoing operations and the expenditure of their students. Deakin’s capital expenditure also adds to economic activity and creates jobs in industries supplying into these projects. This section presents the:
modelling approach taken, including key data assumptions
estimated economic contribution of Deakin’s operations
• in terms of direct contribution; and
• in terms of indirect contribution
estimated economic contribution of Deakin’s students
total economic impact of Deakin’s ongoing operations and students
contribution in terms of employment (FTE)
contribution in terms of gross output
The impacts of Deakin University’s total capital expenditure are modelled and reported separately, and are not additive to the economic contribution results described above. An explanation of the methodology employed in economic contribution studies and capital expenditure modelling appear in Appendices A and B.
5.1 Approach
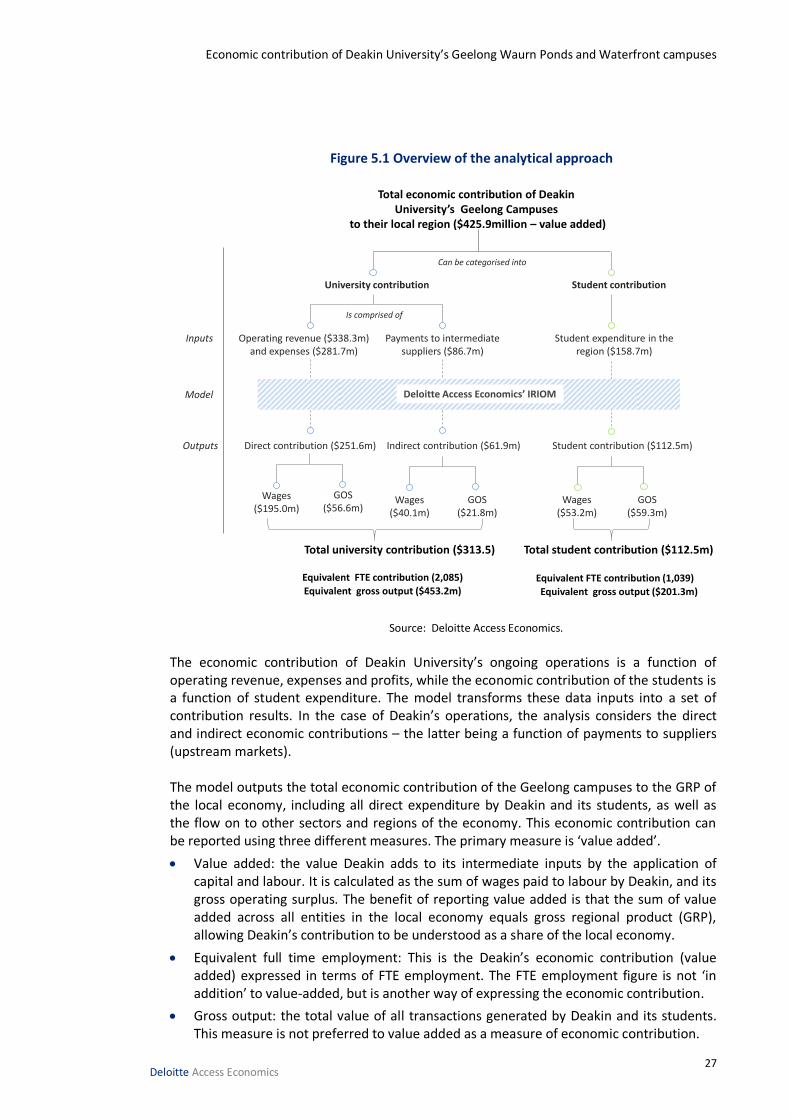
5.1.1 Modelling Deakin University’s economic contributions (excluding capital expenditure) are quantified using Deloitte Access Economics’ in-house integrated regional input-output model (known as DAE-IRIOM). The model estimates the economic contributions of each of Deakin’s four campuses in a rigorous, tested economic framework. The analytical approach is overviewed in a stylised fashion in figure 5.1. It features two broad streams of analysis: one focused on the university operations; one focused on student expenditure.
Economic contribution of Deakin University’s Geelong Waurn Ponds and Waterfront campuses
27 Deloitte Access Economics
Figure 5.1 Overview of the analytical approach
Source: Deloitte Access Economics.
The economic contribution of Deakin University’s ongoing operations is a function of operating revenue, expenses and profits, while the economic contribution of the students is a function of student expenditure. The model transforms these data inputs into a set of contribution results. In the case of Deakin’s operations, the analysis considers the direct and indirect economic contributions – the latter being a function of payments to suppliers (upstream markets). The model outputs the total economic contribution of the Geelong campuses to the GRP of the local economy, including all direct expenditure by Deakin and its students, as well as the flow on to other sectors and regions of the economy. This economic contribution can be reported using three different measures. The primary measure is ‘value added’.
Value added: the value Deakin adds to its intermediate inputs by the application of capital and labour. It is calculated as the sum of wages paid to labour by Deakin, and its gross operating surplus. The benefit of reporting value added is that the sum of value added across all entities in the local economy equals gross regional product (GRP), allowing Deakin’s contribution to be understood as a share of the local economy.
Equivalent full time employment: This is the Deakin’s economic contribution (value added) expressed in terms of FTE employment. The FTE employment figure is not ‘in addition’ to value-added, but is another way of expressing the economic contribution.
Gross output: the total value of all transactions generated by Deakin and its students. This measure is not preferred to value added as a measure of economic contribution.
Total economic contribution of Deakin University’s Geelong Campuses
to their local region ($425.9million – value added)
Can be categorised into
University contribution Student contribution
Operating revenue ($338.3m) and expenses ($281.7m)
Payments to intermediate suppliers ($86.7m)
Inputs
Model
Outputs Direct contribution ($251.6m) Indirect contribution ($61.9m)
Wages ($40.1m)
GOS ($21.8m)
Wages ($195.0m)
GOS ($56.6m)
Total university contribution ($313.5)
Student expenditure in the region ($158.7m)
Student contribution ($112.5m)
GOS ($59.3m)
Wages ($53.2m)
Total student contribution ($112.5m)
Equivalent FTE contribution (2,085)
Deloitte Access Economics’ IRIOM
Is comprised of
Equivalent FTE contribution (1,039)Equivalent gross output ($453.2m) Equivalent gross output ($201.3m)
Economic contribution of Deakin University’s Geelong Waurn Ponds and Waterfront campuses
28 Deloitte Access Economics
5.1.2 Data Deakin University reports financial data for the whole of its operations, covering four campuses and three geographical regions. For the purpose of this economic contribution study, commercial activity, including revenues and costs generated from Deakin operations, needs to be attributed to specific regions. To analyse the economic contributions of Deakin University’s campuses to their local communities, it is necessary to have campus-level operating expenditure, revenue and profit data. As Deakin does not typically report this data at the campus level, Deloitte Access Economics and the University agreed on an approach to allocate total University activity to each campus. For the purposes of this study, as a general rule the University’s activity has been allocated to each campus based on the proportion of full time equivalent (FTE) employees located at the campus. This is also the case for costs and revenue associated with off-campus students (reflecting the labour inputs (FTE) required to support this activity).
5.2 Direct contribution of the Geelong campuses The direct contribution of Deakin University to the local economy is its share of GRP, measured as the value added of Deakin’s operations. This is the sum of the wages paid for labour by the University and its gross operating surplus. The University’s operating revenue and expenses for 2013 have been used to calculate the direct contribution of its ongoing operations. The data inputs used in the model and the estimated direct contribution of the University are outlined below.
5.2.1 Revenue and expenses
The direct economic contribution is calculated from information contained in Deakin’s financial reports. Table 5.1 shows the revenue and expenses from the 2013 financial statement for Deakin University that have been allocated to the Geelong campuses (predominately in proportion to total University FTE at the Geelong campuses, as explained in section 5.1.2). Total operating revenue attributable to the Geelong campuses was estimated at $338.3 million, above the $281.7 million in estimated operating costs for the year 2013.
Government financial assistance is the greatest contributor to revenue for Deakin University, representing two-thirds of total revenue from continuing operations. The modelling of the direct contribution of the Geelong campuses captures all Deakin students (on-campus, off-campus including on-line students, and community-based delivery including Institute of Koorie Education students) as ‘operating revenue’ includes total student-related revenue. Employee related expenses are the greatest expense for Deakin University, representing approximately 70 per cent of total revenue from continuing operations.
Economic contribution of Deakin University’s Geelong Waurn Ponds and Waterfront campuses
29 Deloitte Access Economics
Table 5.1 Consolidated revenue and expenses, 2013 ($’000)
Geelong campuses 2013
Operating revenue 338,301
Operating Costs 281,727
Wages 194,994
Other operating costs 86,733
Gross Operating Surplus 56,574 Source: Deakin University Annual Report, 2013; Deloitte Access Economics.
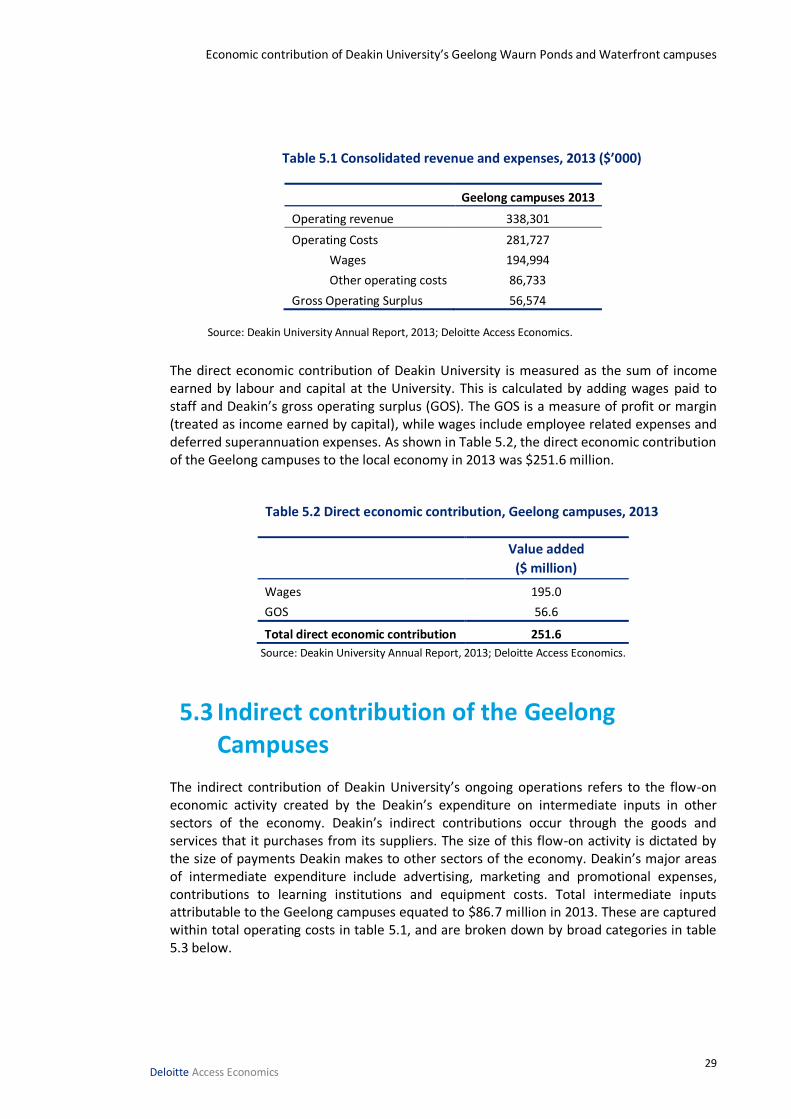
The direct economic contribution of Deakin University is measured as the sum of income earned by labour and capital at the University. This is calculated by adding wages paid to staff and Deakin’s gross operating surplus (GOS). The GOS is a measure of profit or margin (treated as income earned by capital), while wages include employee related expenses and deferred superannuation expenses. As shown in Table 5.2, the direct economic contribution of the Geelong campuses to the local economy in 2013 was $251.6 million.
Table 5.2 Direct economic contribution, Geelong campuses, 2013
Value added
($ million)
Wages 195.0
GOS 56.6
Total direct economic contribution 251.6
Source: Deakin University Annual Report, 2013; Deloitte Access Economics.
5.3 Indirect contribution of the Geelong Campuses
The indirect contribution of Deakin University’s ongoing operations refers to the flow-on economic activity created by the Deakin’s expenditure on intermediate inputs in other sectors of the economy. Deakin’s indirect contributions occur through the goods and services that it purchases from its suppliers. The size of this flow-on activity is dictated by the size of payments Deakin makes to other sectors of the economy. Deakin’s major areas of intermediate expenditure include advertising, marketing and promotional expenses, contributions to learning institutions and equipment costs. Total intermediate inputs attributable to the Geelong campuses equated to $86.7 million in 2013. These are captured within total operating costs in table 5.1, and are broken down by broad categories in table 5.3 below.
Economic contribution of Deakin University’s Geelong Waurn Ponds and Waterfront campuses
30 Deloitte Access Economics
Table 5.3 Intermediate inputs for the Geelong campuses, 2013
Category $(‘000) % of spending
Other services 26,826 31
Communication costs 2,101 2
Contributions to learning institutions 28,884 33
Equipment costs 18,028 21
Library expenses 3,253 4
Operating lease rentals 4,149 5
Rates and energy costs 3,492 4
Total intermediate inputs 86,733 100
Source: Deakin University Data, 2013
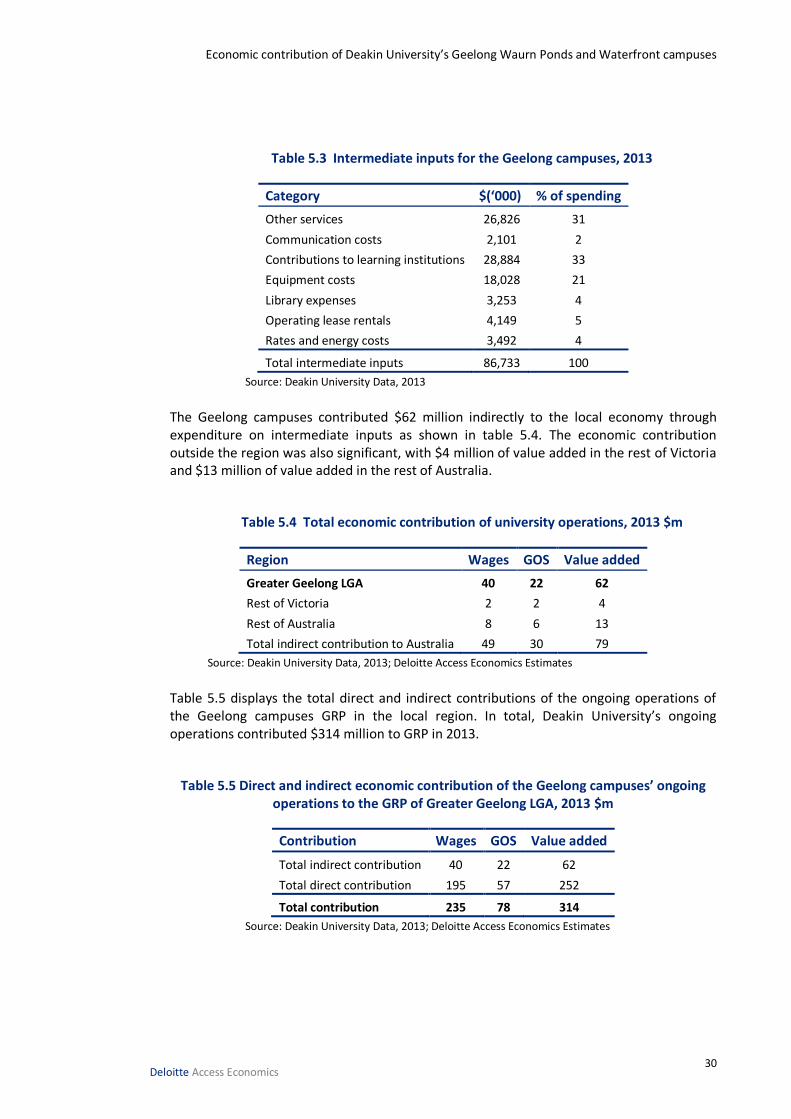
The Geelong campuses contributed $62 million indirectly to the local economy through expenditure on intermediate inputs as shown in table 5.4. The economic contribution outside the region was also significant, with $4 million of value added in the rest of Victoria and $13 million of value added in the rest of Australia.
Table 5.4 Total economic contribution of university operations, 2013 $m
Region Wages GOS Value added
Greater Geelong LGA 40 22 62
Rest of Victoria 2 2 4
Rest of Australia 8 6 13
Total indirect contribution to Australia 49 30 79
Source: Deakin University Data, 2013; Deloitte Access Economics Estimates
Table 5.5 displays the total direct and indirect contributions of the ongoing operations of the Geelong campuses GRP in the local region. In total, Deakin University’s ongoing operations contributed $314 million to GRP in 2013.
Table 5.5 Direct and indirect economic contribution of the Geelong campuses’ ongoing operations to the GRP of Greater Geelong LGA, 2013 $m
Contribution Wages GOS Value added
Total indirect contribution 40 22 62
Total direct contribution 195 57 252
Total contribution 235 78 314
Source: Deakin University Data, 2013; Deloitte Access Economics Estimates
Economic contribution of Deakin University’s Geelong Waurn Ponds and Waterfront campuses
31 Deloitte Access Economics
5.4 Economic contribution of Deakin’s students
The following section outlines the economic contribution of the students who attended Deakin University’s Geelong campuses in 2013 to the local community. The section makes use of information compiled from a number of sources including student expenditure data from the Australian University Student Finances 2012 report published by Universities Australia, and student data provided by Deakin University. Data from Australian University Student Finances 2012 has been adjusted to 2013 dollars using the Australian Bureau of Statistics inflation data. In the analysis, student expenditure is apportioned between the ‘home region’ where the student resides, and the ‘study region’ where the student attends university (in this case the Greater Geelong LGA). This is detailed further in Appendix A. The sections below describe student expenditure patterns in recent years, and report the economic contributions of student expenditure to the local community in 2013.
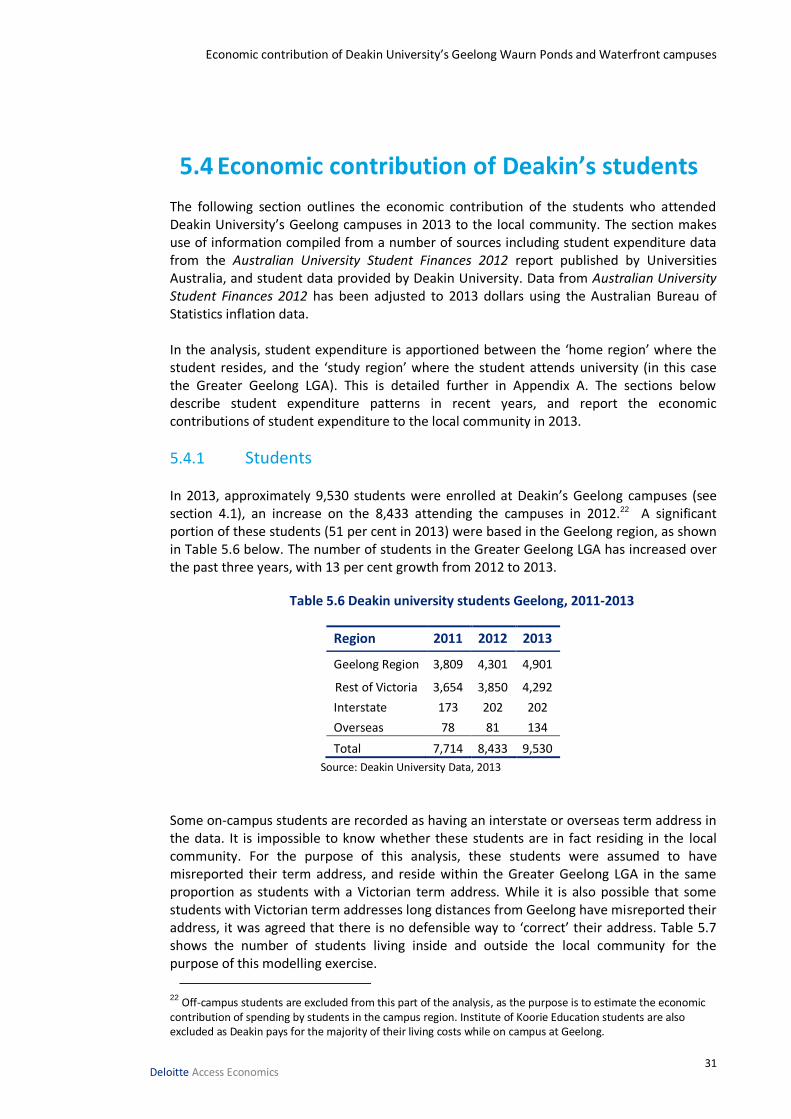
5.4.1 Students In 2013, approximately 9,530 students were enrolled at Deakin’s Geelong campuses (see section 4.1), an increase on the 8,433 attending the campuses in 2012.22 A significant portion of these students (51 per cent in 2013) were based in the Geelong region, as shown in Table 5.6 below. The number of students in the Greater Geelong LGA has increased over the past three years, with 13 per cent growth from 2012 to 2013.
Table 5.6 Deakin university students Geelong, 2011-2013
Region 2011 2012 2013
Geelong Region 3,809 4,301 4,901
Rest of Victoria 3,654 3,850 4,292
Interstate 173 202 202
Overseas 78 81 134
Total 7,714 8,433 9,530
Source: Deakin University Data, 2013
Some on-campus students are recorded as having an interstate or overseas term address in the data. It is impossible to know whether these students are in fact residing in the local community. For the purpose of this analysis, these students were assumed to have misreported their term address, and reside within the Greater Geelong LGA in the same proportion as students with a Victorian term address. While it is also possible that some students with Victorian term addresses long distances from Geelong have misreported their address, it was agreed that there is no defensible way to ‘correct’ their address. Table 5.7 shows the number of students living inside and outside the local community for the purpose of this modelling exercise.
22 Off-campus students are excluded from this part of the analysis, as the purpose is to estimate the economic contribution of spending by students in the campus region. Institute of Koorie Education students are also excluded as Deakin pays for the majority of their living costs while on campus at Geelong.
Economic contribution of Deakin University’s Geelong Waurn Ponds and Waterfront campuses
32 Deloitte Access Economics
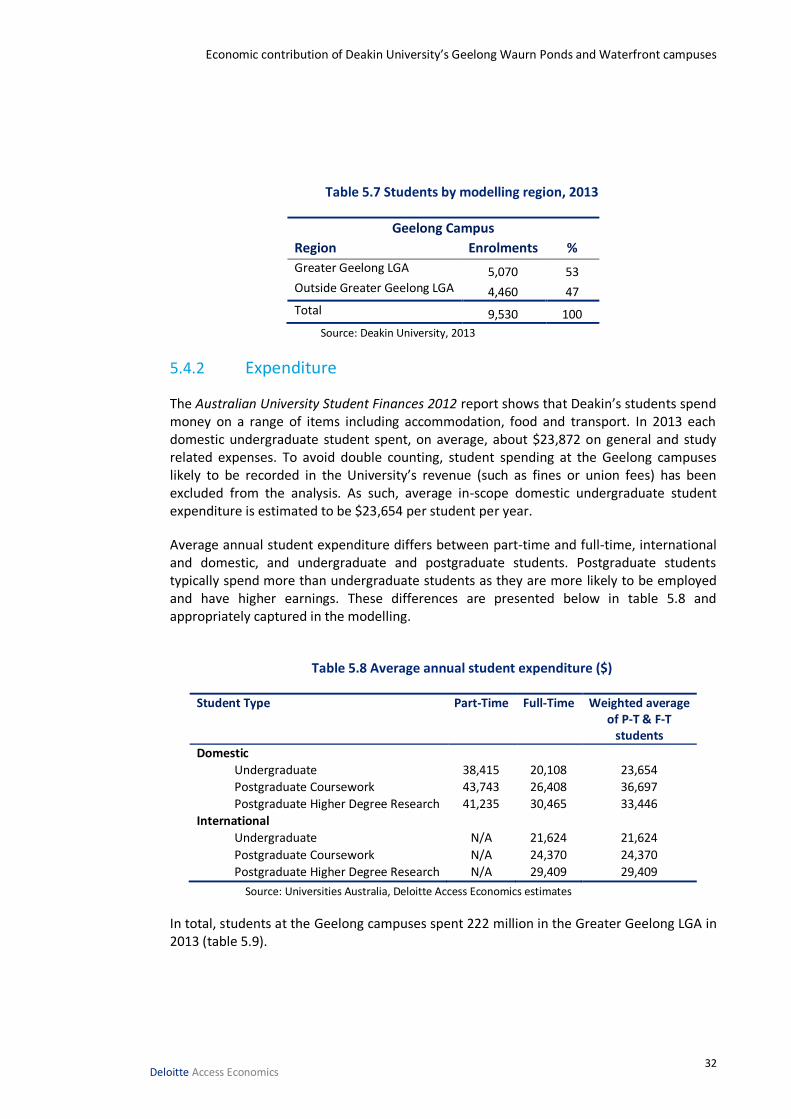
Table 5.7 Students by modelling region, 2013
Geelong Campus
Region Enrolments %
Greater Geelong LGA 5,070 53 Outside Greater Geelong LGA 4,460 47
Total 9,530 100
Source: Deakin University, 2013
5.4.2 Expenditure
The Australian University Student Finances 2012 report shows that Deakin’s students spend money on a range of items including accommodation, food and transport. In 2013 each domestic undergraduate student spent, on average, about $23,872 on general and study related expenses. To avoid double counting, student spending at the Geelong campuses likely to be recorded in the University’s revenue (such as fines or union fees) has been excluded from the analysis. As such, average in-scope domestic undergraduate student expenditure is estimated to be $23,654 per student per year.
Average annual student expenditure differs between part-time and full-time, international and domestic, and undergraduate and postgraduate students. Postgraduate students typically spend more than undergraduate students as they are more likely to be employed and have higher earnings. These differences are presented below in table 5.8 and appropriately captured in the modelling.
Table 5.8 Average annual student expenditure ($)
Student Type Part-Time Full-Time Weighted average of P-T & F-T
students
Domestic
Undergraduate 38,415 20,108 23,654
Postgraduate Coursework 43,743 26,408 36,697
Postgraduate Higher Degree Research 41,235 30,465 33,446
International
Undergraduate N/A 21,624 21,624
Postgraduate Coursework N/A 24,370 24,370
Postgraduate Higher Degree Research N/A 29,409 29,409
Source: Universities Australia, Deloitte Access Economics estimates
In total, students at the Geelong campuses spent 222 million in the Greater Geelong LGA in 2013 (table 5.9).
Economic contribution of Deakin University’s Geelong Waurn Ponds and Waterfront campuses
33 Deloitte Access Economics
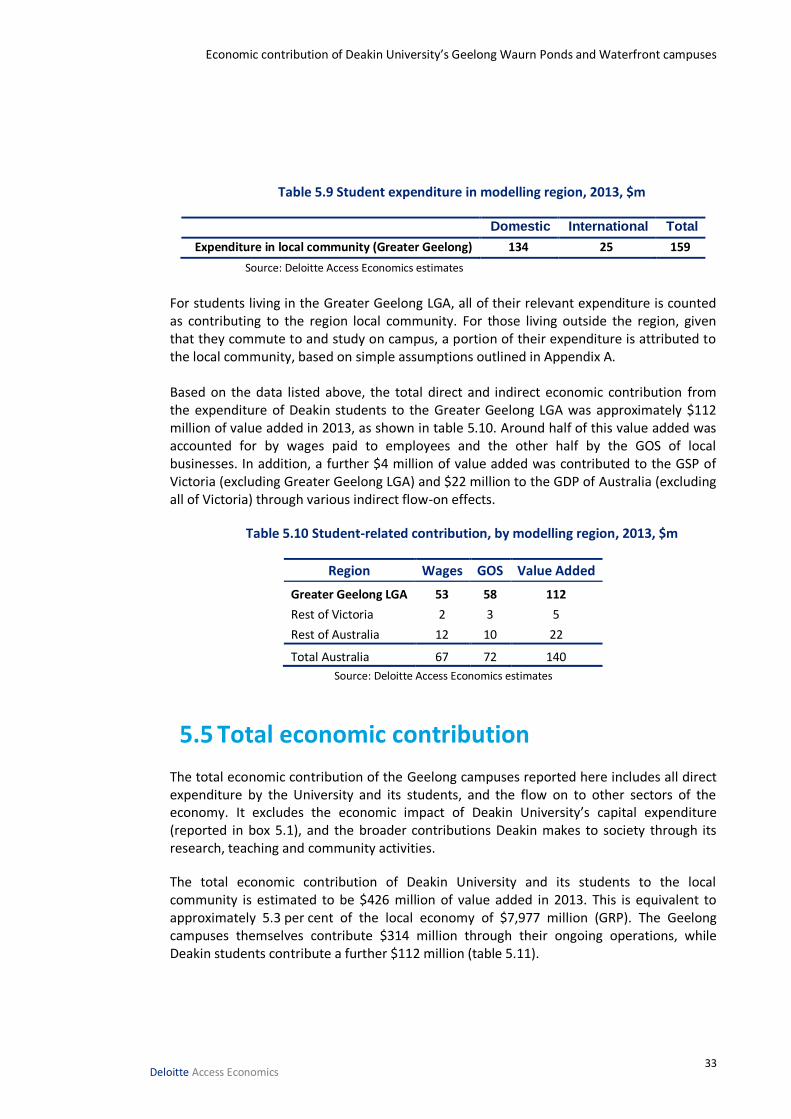
Table 5.9 Student expenditure in modelling region, 2013, $m
Domestic International Total
Expenditure in local community (Greater Geelong) 134 25 159
Source: Deloitte Access Economics estimates
For students living in the Greater Geelong LGA, all of their relevant expenditure is counted as contributing to the region local community. For those living outside the region, given that they commute to and study on campus, a portion of their expenditure is attributed to the local community, based on simple assumptions outlined in Appendix A. Based on the data listed above, the total direct and indirect economic contribution from the expenditure of Deakin students to the Greater Geelong LGA was approximately $112 million of value added in 2013, as shown in table 5.10. Around half of this value added was accounted for by wages paid to employees and the other half by the GOS of local businesses. In addition, a further $4 million of value added was contributed to the GSP of Victoria (excluding Greater Geelong LGA) and $22 million to the GDP of Australia (excluding all of Victoria) through various indirect flow-on effects.
Table 5.10 Student-related contribution, by modelling region, 2013, $m
Region Wages GOS Value Added
Greater Geelong LGA 53 58 112
Rest of Victoria 2 3 5
Rest of Australia 12 10 22
Total Australia 67 72 140
Source: Deloitte Access Economics estimates
5.5 Total economic contribution The total economic contribution of the Geelong campuses reported here includes all direct expenditure by the University and its students, and the flow on to other sectors of the economy. It excludes the economic impact of Deakin University’s capital expenditure (reported in box 5.1), and the broader contributions Deakin makes to society through its research, teaching and community activities.
The total economic contribution of Deakin University and its students to the local community is estimated to be $426 million of value added in 2013. This is equivalent to approximately 5.3 per cent of the local economy of $7,977 million (GRP). The Geelong campuses themselves contribute $314 million through their ongoing operations, while Deakin students contribute a further $112 million (table 5.11).
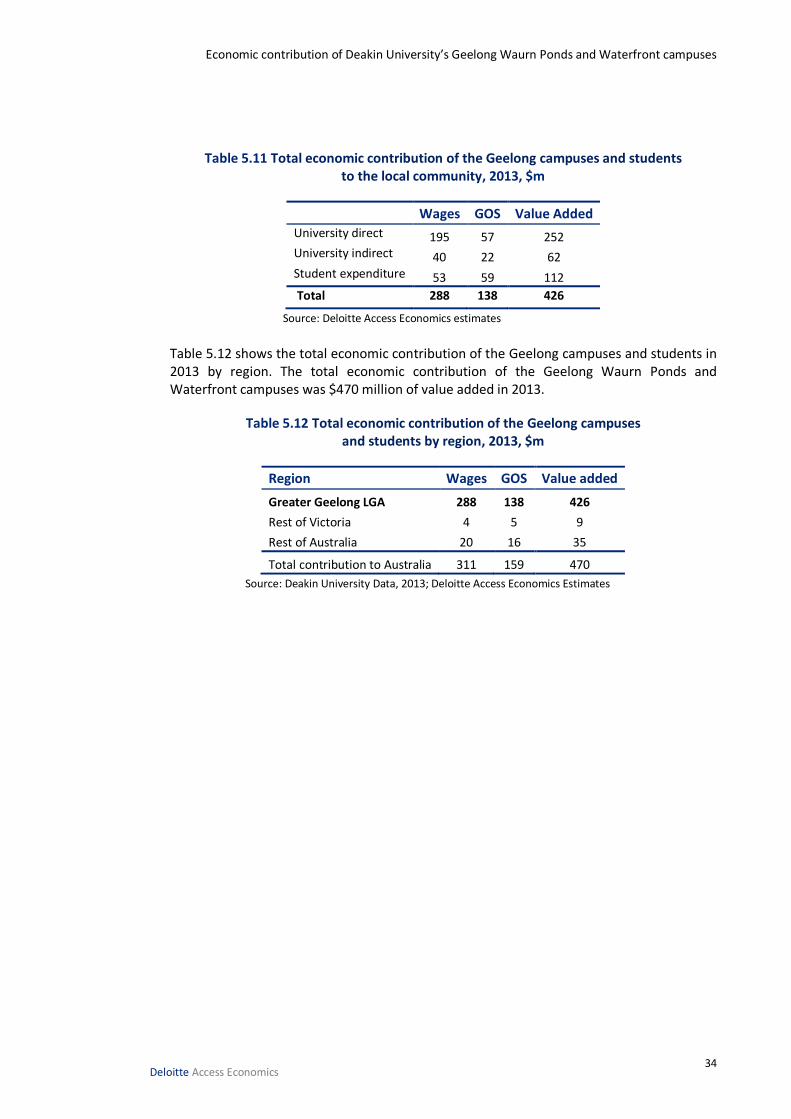
Economic contribution of Deakin University’s Geelong Waurn Ponds and Waterfront campuses
34 Deloitte Access Economics
Table 5.11 Total economic contribution of the Geelong campuses and students to the local community, 2013, $m
Wages GOS Value Added
University direct 195 57 252 University indirect 40 22 62 Student expenditure 53 59 112
Total 288 138 426
Source: Deloitte Access Economics estimates
Table 5.12 shows the total economic contribution of the Geelong campuses and students in 2013 by region. The total economic contribution of the Geelong Waurn Ponds and Waterfront campuses was $470 million of value added in 2013.
Table 5.12 Total economic contribution of the Geelong campuses and students by region, 2013, $m
Region Wages GOS Value added
Greater Geelong LGA 288 138 426
Rest of Victoria 4 5 9
Rest of Australia 20 16 35
Total contribution to Australia 311 159 470
Source: Deakin University Data, 2013; Deloitte Access Economics Estimates
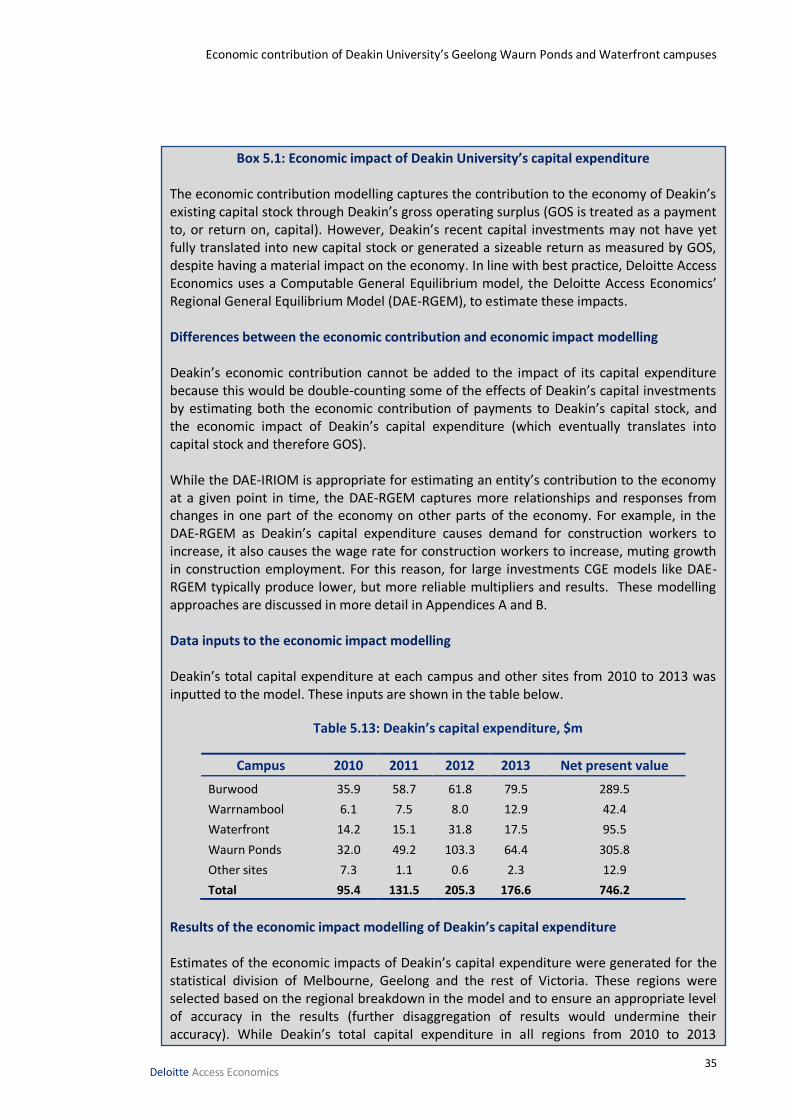
Economic contribution of Deakin University’s Geelong Waurn Ponds and Waterfront campuses
35 Deloitte Access Economics
Box 5.1: Economic impact of Deakin University’s capital expenditure The economic contribution modelling captures the contribution to the economy of Deakin’s existing capital stock through Deakin’s gross operating surplus (GOS is treated as a payment to, or return on, capital). However, Deakin’s recent capital investments may not have yet fully translated into new capital stock or generated a sizeable return as measured by GOS, despite having a material impact on the economy. In line with best practice, Deloitte Access Economics uses a Computable General Equilibrium model, the Deloitte Access Economics’ Regional General Equilibrium Model (DAE-RGEM), to estimate these impacts. Differences between the economic contribution and economic impact modelling Deakin’s economic contribution cannot be added to the impact of its capital expenditure because this would be double-counting some of the effects of Deakin’s capital investments by estimating both the economic contribution of payments to Deakin’s capital stock, and the economic impact of Deakin’s capital expenditure (which eventually translates into capital stock and therefore GOS). While the DAE-IRIOM is appropriate for estimating an entity’s contribution to the economy at a given point in time, the DAE-RGEM captures more relationships and responses from changes in one part of the economy on other parts of the economy. For example, in the DAE-RGEM as Deakin’s capital expenditure causes demand for construction workers to increase, it also causes the wage rate for construction workers to increase, muting growth in construction employment. For this reason, for large investments CGE models like DAE-RGEM typically produce lower, but more reliable multipliers and results. These modelling approaches are discussed in more detail in Appendices A and B. Data inputs to the economic impact modelling Deakin’s total capital expenditure at each campus and other sites from 2010 to 2013 was inputted to the model. These inputs are shown in the table below.
Table 5.13: Deakin’s capital expenditure, $m
Campus 2010 2011 2012 2013 Net present value
Burwood 35.9 58.7 61.8 79.5 289.5
Warrnambool 6.1 7.5 8.0 12.9 42.4
Waterfront 14.2 15.1 31.8 17.5 95.5
Waurn Ponds 32.0 49.2 103.3 64.4 305.8
Other sites 7.3 1.1 0.6 2.3 12.9
Total 95.4 131.5 205.3 176.6 746.2
Results of the economic impact modelling of Deakin’s capital expenditure Estimates of the economic impacts of Deakin’s capital expenditure were generated for the statistical division of Melbourne, Geelong and the rest of Victoria. These regions were selected based on the regional breakdown in the model and to ensure an appropriate level of accuracy in the results (further disaggregation of results would undermine their accuracy). While Deakin’s total capital expenditure in all regions from 2010 to 2013
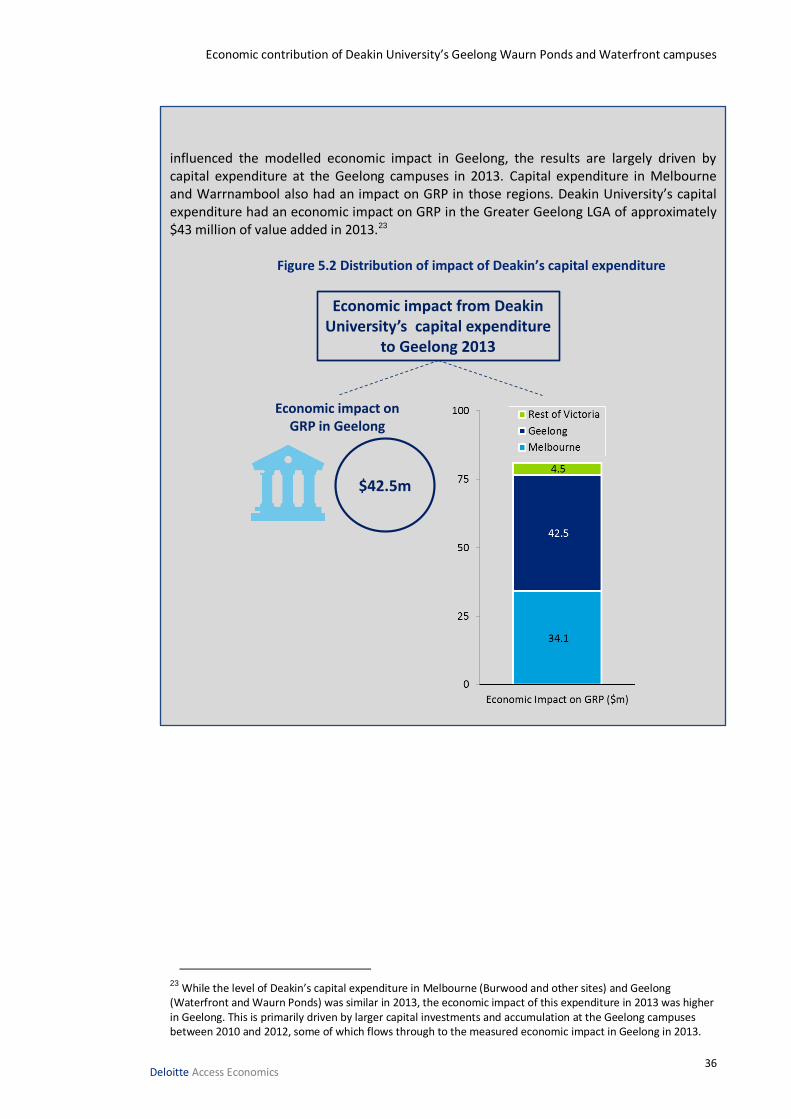
Economic contribution of Deakin University’s Geelong Waurn Ponds and Waterfront campuses
36 Deloitte Access Economics
influenced the modelled economic impact in Geelong, the results are largely driven by capital expenditure at the Geelong campuses in 2013. Capital expenditure in Melbourne and Warrnambool also had an impact on GRP in those regions. Deakin University’s capital expenditure had an economic impact on GRP in the Greater Geelong LGA of approximately $43 million of value added in 2013.23
Figure 5.2 Distribution of impact of Deakin’s capital expenditure
23 While the level of Deakin’s capital expenditure in Melbourne (Burwood and other sites) and Geelong (Waterfront and Waurn Ponds) was similar in 2013, the economic impact of this expenditure in 2013 was higher in Geelong. This is primarily driven by larger capital investments and accumulation at the Geelong campuses between 2010 and 2012, some of which flows through to the measured economic impact in Geelong in 2013.
$42.5m
Economic impact from Deakin University’s capital expenditure
to Geelong 2013
Economic impact on GRP in Geelong
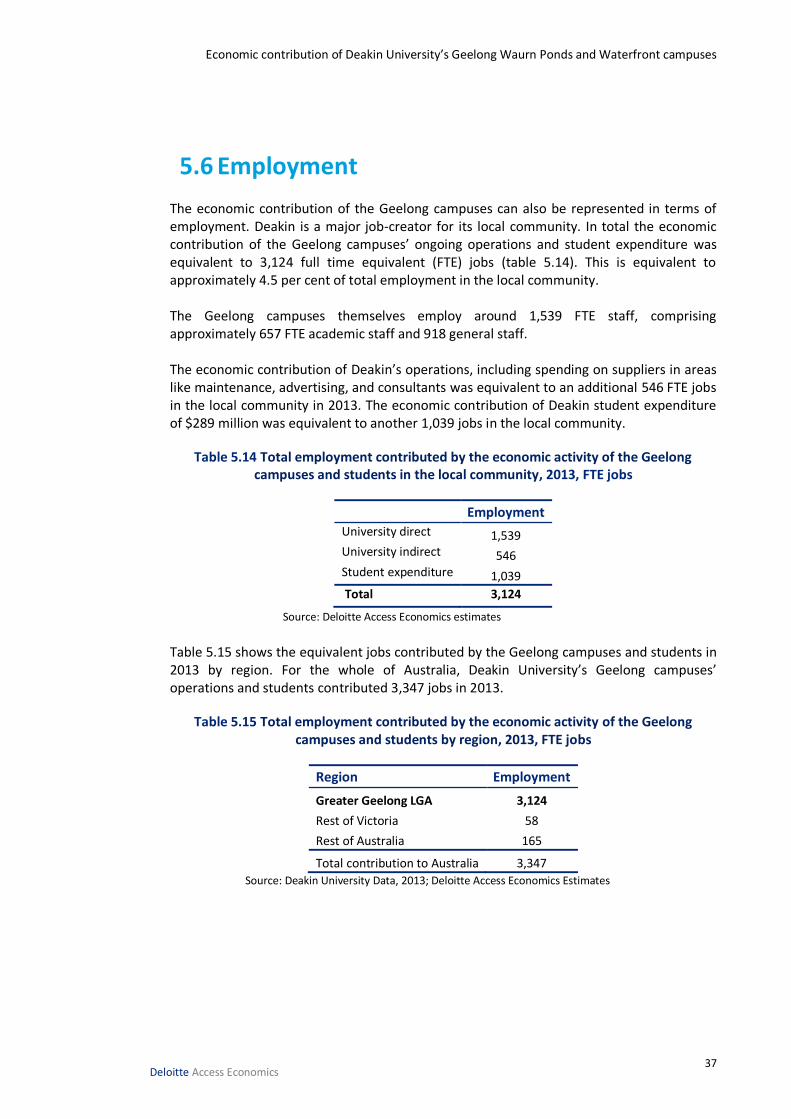
Economic contribution of Deakin University’s Geelong Waurn Ponds and Waterfront campuses
37 Deloitte Access Economics
5.6 Employment The economic contribution of the Geelong campuses can also be represented in terms of employment. Deakin is a major job-creator for its local community. In total the economic contribution of the Geelong campuses’ ongoing operations and student expenditure was equivalent to 3,124 full time equivalent (FTE) jobs (table 5.14). This is equivalent to approximately 4.5 per cent of total employment in the local community. The Geelong campuses themselves employ around 1,539 FTE staff, comprising approximately 657 FTE academic staff and 918 general staff. The economic contribution of Deakin’s operations, including spending on suppliers in areas like maintenance, advertising, and consultants was equivalent to an additional 546 FTE jobs in the local community in 2013. The economic contribution of Deakin student expenditure of $289 million was equivalent to another 1,039 jobs in the local community.
Table 5.14 Total employment contributed by the economic activity of the Geelong campuses and students in the local community, 2013, FTE jobs
Employment
University direct 1,539 University indirect 546 Student expenditure 1,039
Total 3,124
Source: Deloitte Access Economics estimates
Table 5.15 shows the equivalent jobs contributed by the Geelong campuses and students in 2013 by region. For the whole of Australia, Deakin University’s Geelong campuses’ operations and students contributed 3,347 jobs in 2013.
Table 5.15 Total employment contributed by the economic activity of the Geelong campuses and students by region, 2013, FTE jobs
Region Employment
Greater Geelong LGA 3,124
Rest of Victoria 58
Rest of Australia 165
Total contribution to Australia 3,347
Source: Deakin University Data, 2013; Deloitte Access Economics Estimates
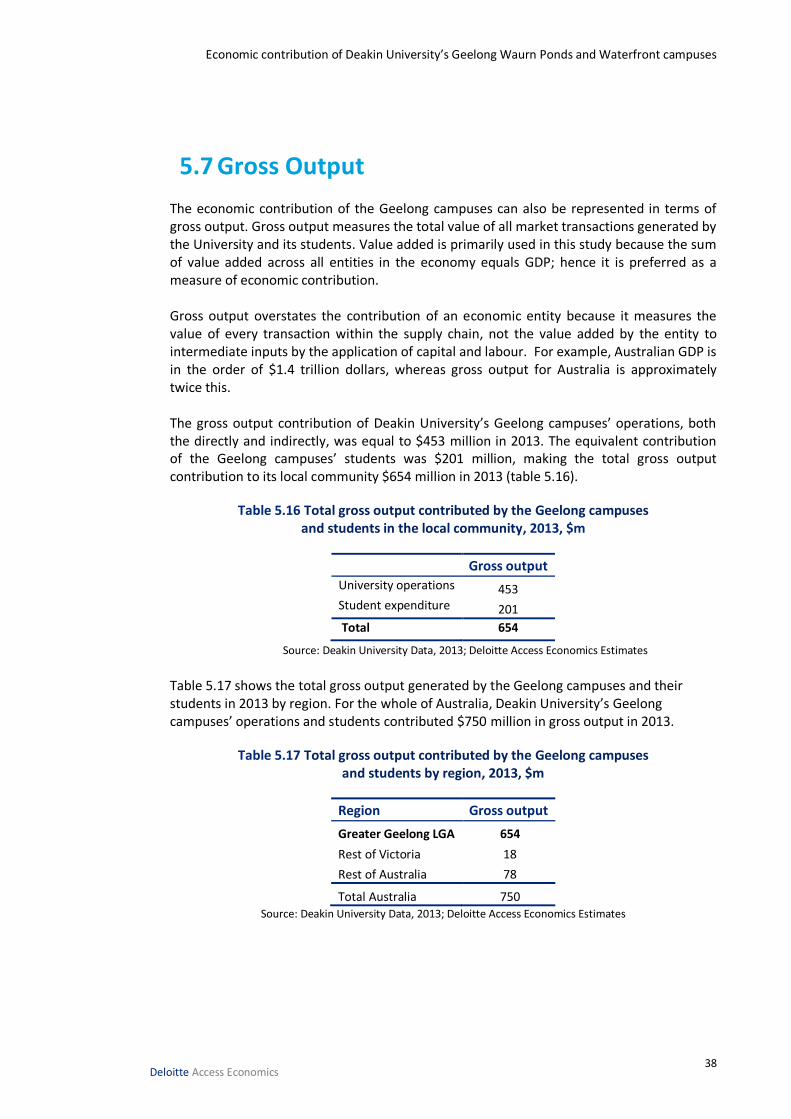
Economic contribution of Deakin University’s Geelong Waurn Ponds and Waterfront campuses
38 Deloitte Access Economics
5.7 Gross Output The economic contribution of the Geelong campuses can also be represented in terms of gross output. Gross output measures the total value of all market transactions generated by the University and its students. Value added is primarily used in this study because the sum of value added across all entities in the economy equals GDP; hence it is preferred as a measure of economic contribution. Gross output overstates the contribution of an economic entity because it measures the value of every transaction within the supply chain, not the value added by the entity to intermediate inputs by the application of capital and labour. For example, Australian GDP is in the order of $1.4 trillion dollars, whereas gross output for Australia is approximately twice this. The gross output contribution of Deakin University’s Geelong campuses’ operations, both the directly and indirectly, was equal to $453 million in 2013. The equivalent contribution of the Geelong campuses’ students was $201 million, making the total gross output contribution to its local community $654 million in 2013 (table 5.16).
Table 5.16 Total gross output contributed by the Geelong campuses and students in the local community, 2013, $m
Gross output
University operations 453 Student expenditure 201
Total 654
Source: Deakin University Data, 2013; Deloitte Access Economics Estimates
Table 5.17 shows the total gross output generated by the Geelong campuses and their students in 2013 by region. For the whole of Australia, Deakin University’s Geelong campuses’ operations and students contributed $750 million in gross output in 2013.
Table 5.17 Total gross output contributed by the Geelong campuses and students by region, 2013, $m
Region Gross output
Greater Geelong LGA 654
Rest of Victoria 18
Rest of Australia 78
Total Australia 750 Source: Deakin University Data, 2013; Deloitte Access Economics Estimates
Economic contribution of Deakin University’s Geelong Waurn Ponds and Waterfront campuses
39 Deloitte Access Economics
References Australian Bureau of Statistics (ABS) 2013, Regional Population Growth, Australia. Cat no.
3218. Australian Bureau of Statistics (ABS) 2011, Census of Population and Housing. Australian Bureau of Statistics (ABS) 2011, Census Community Profiles.
http://www.censusdata.abs.gov.au/census_services/getproduct/census/2011/communityprofile/
Australian Bureau of Statistics (ABS) 2011, National Regional Profile.
http://www.ausstats.abs.gov.au/ausstats/nrpmaps.nsf/NEW+GmapPages/national+regional+profile
Australian Bureau of Statistics (ABS) 2011, Census of Population and Housing: Socio-
Economic Indexes for Areas (SEIFA), Australia. Cat no. 2033.0.55.001 Department of Education, Higher Education Statistics, 2012.
http://education.gov.au/selected-higher-education-statistics-2012-student-data Department of Education, Data Methodologies, 2014. http://content.myuniversity.gov.au/sites/myuniversity/pages/methodology#LowSESStudents Department of Employment (2013), Small Area Labour Market Statistics, September 2013
http://lmip.gov.au/default.aspx?LMIP/SALM Leigh, A 2008, ‘Returns to Education in Australia’, Economic papers, 27(3): 233 – 249.
Economic contribution of Deakin University’s Geelong Waurn Ponds and Waterfront campuses
40 Deloitte Access Economics
Appendix A – Economic contribution studies
Contribution – the general approach Economic contribution studies are intended to quantify measures such as value added, exports, imports and employment associated with a given industry or firm, in a historical reference year. The economic contribution is a measure of the value of production by a firm or industry.
Value added Value added is the most appropriate measure of an industry’s/company’s economic contribution to gross domestic product (GDP) at the national level, or gross state product (GSP) at the state level. The value added of each industry in the value chain can be added without the risk of double counting across industries caused by including the value added by other industries earlier in the production chain. Other measures, such as total revenue or total exports, may be easier to estimate than value added but they ‘double count’. That is, they overstate the contribution of a company to economic activity because they include, for example, the value added by external firms supplying inputs or the value added by other industries.
Measuring the economic contribution
There are several commonly used measures of economic activity, each of which describes a different aspect of an industry’s economic contribution:
Value added measures the value of output (i.e. goods and services) generated by the entity’s factors of production (i.e. labour and capital) as measured in the income to those factors of production. The sum of value added across all entities in the economy equals gross domestic product. Given the relationship to GDP, the value added measure can be thought of as the increased contribution to welfare.
Value added is the sum of:
• Gross operating surplus (GOS). GOS represents the value of income generated by the entity’s direct capital inputs, generally measured as the earnings before interest, tax, depreciation and amortisation (EBITDA).
• Tax on production less subsidy provided for production. This generally includes company taxes and taxes on employment. Note: given the returns to capital before tax (EBITDA) are calculated, company tax is not included or this would double count that tax.
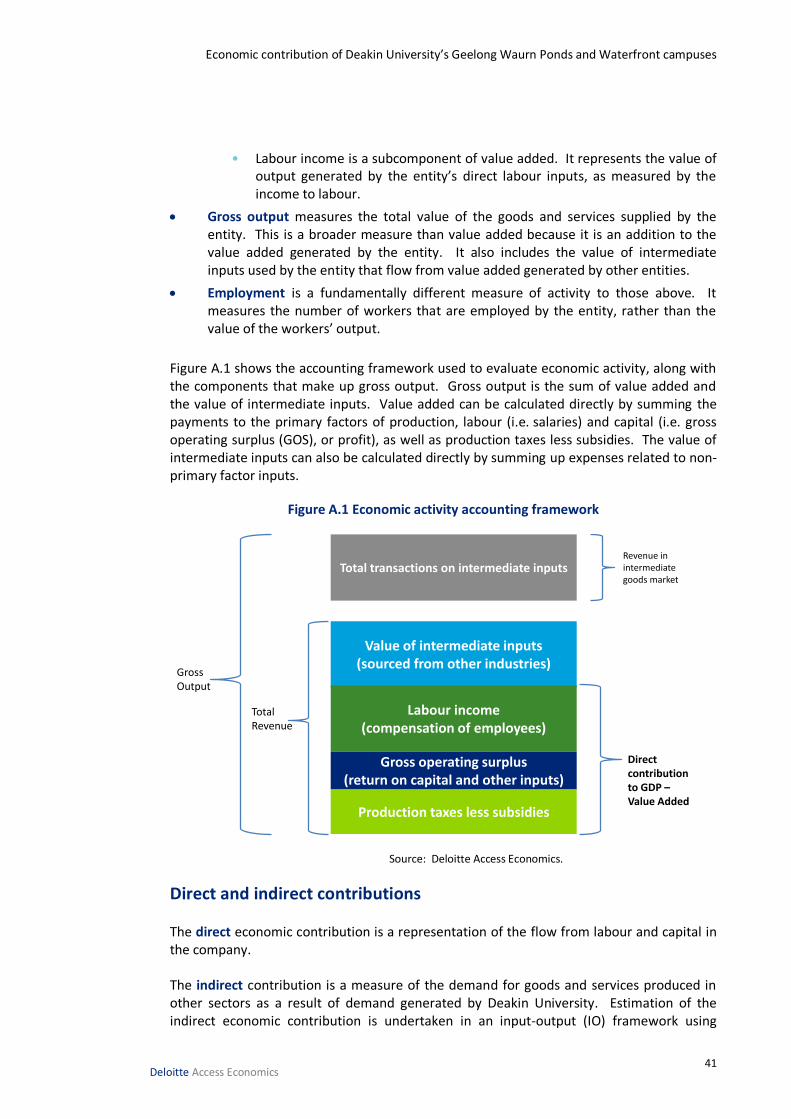
Economic contribution of Deakin University’s Geelong Waurn Ponds and Waterfront campuses
41 Deloitte Access Economics
• Labour income is a subcomponent of value added. It represents the value of output generated by the entity’s direct labour inputs, as measured by the income to labour.
Gross output measures the total value of the goods and services supplied by the entity. This is a broader measure than value added because it is an addition to the value added generated by the entity. It also includes the value of intermediate inputs used by the entity that flow from value added generated by other entities.
Employment is a fundamentally different measure of activity to those above. It measures the number of workers that are employed by the entity, rather than the value of the workers’ output.
Figure A.1 shows the accounting framework used to evaluate economic activity, along with the components that make up gross output. Gross output is the sum of value added and the value of intermediate inputs. Value added can be calculated directly by summing the payments to the primary factors of production, labour (i.e. salaries) and capital (i.e. gross operating surplus (GOS), or profit), as well as production taxes less subsidies. The value of intermediate inputs can also be calculated directly by summing up expenses related to non-primary factor inputs.
Figure A.1 Economic activity accounting framework
Source: Deloitte Access Economics.
Direct and indirect contributions The direct economic contribution is a representation of the flow from labour and capital in the company. The indirect contribution is a measure of the demand for goods and services produced in other sectors as a result of demand generated by Deakin University. Estimation of the indirect economic contribution is undertaken in an input-output (IO) framework using
Value of intermediate inputs (sourced from other industries)
Labour income (compensation of employees)
Gross operating surplus (return on capital and other inputs)
Production taxes less subsidies
Total transactions on intermediate inputs
Gross Output
Total Revenue
Direct contribution to GDP –Value Added
Revenue in intermediate goods market
Economic contribution of Deakin University’s Geelong Waurn Ponds and Waterfront campuses
42 Deloitte Access Economics
Australian Bureau of Statistics input-output tables which report the inputs and outputs of specific sectors of the economy (ABS 2010). The total economic contribution to the economy is the sum of the direct and indirect economic contributions.
Limitations of economic contribution studies While describing the geographic origin of production inputs may be a guide to a firm’s linkages with the local economy, it should be recognised that these are the type of normal industry linkages that characterise all economic activities. Unless there is significant unused capacity in the economy (such as unemployed labour) there is only a weak relationship between a firm’s economic contribution as measured by value added (or other static aggregates) and the welfare or living standard of the community. Indeed, the use of labour and capital by demand created from the industry comes at an opportunity cost as it may reduce the amount of resources available to spend on other economic activities. This is not to say that the economic contribution, including employment, is not important. As stated by the Productivity Commission in the context of Australia’s gambling industries:24
Value added, trade and job creation arguments need to be considered in the context of the economy as a whole … income from trade uses real resources, which could have been employed to generate benefits elsewhere. These arguments do not mean that jobs, trade and activity are unimportant in an economy. To the contrary they are critical to people’s well-being. However, any particular industry’s contribution to these benefits is much smaller than might at first be thought, because substitute industries could produce similar, though not equal gains.
In a fundamental sense, economic contribution studies are simply historical accounting exercises. No ‘what-if’, or counterfactual inferences – such as ‘what would happen to living standards if the firm disappeared?’ – should be drawn from them. The analysis – as discussed in the report – relies on a national input-output table modelling framework and there are some limitations to this modelling framework. The analysis assumes that goods and services provided to the sector is produced by factors of production that are located completely within the state or region defined and that income flows do not leak to other states. The IO framework and the derivation of the multipliers also assume that the relevant economic activity takes place within an unconstrained environment. That is, an increase in economic activity in one area of the economy does not increase prices and subsequently crowd out economic activity in another area of the economy. As a result, the modelled total and indirect contribution can be regarded as an upper-bound estimate of the contribution made by the supply of intermediate inputs.
24
Productivity Commission (1999), Australia’s Gambling Industries, Report No. 10, AusInfo, Canberra, (page 4.19).
Economic contribution of Deakin University’s Geelong Waurn Ponds and Waterfront campuses
43 Deloitte Access Economics
Similarly the IO framework does not account for further flow-on benefits as captured in a more dynamic modelling environment like the CGE model.
Input-output analysis Input-output tables are required to account for the intermediate flows between sectors. These tables measure the direct economic activity of every sector in the economy at the national level. Importantly, these tables allow intermediate inputs to be further broken down by source. These detailed intermediate flows can be used to derive the total change in economic activity associated with a given direct change in activity for a given sector. A widely used measure of the spill-over of activity from one sector to another is captured by the ratio of the total to direct change in economic activity. The resulting estimate is typically referred to as ‘the multiplier’. A multiplier greater than one implies some indirect activity, with higher multipliers indicating relatively larger indirect and total activity flowing from a given level of direct activity. The input-output matrix used for Australia is derived from the Australian Bureau of Statistics 2005-06 Input-Output Tables (2010). The industry classification used for input-output tables is based on ANZSIC, with 109 sectors in the modelling framework.
Regions of expenditure The student expenditure analysis above does include an expenditure adjustment that allocates the student expenditure between where the student studies and where the student lives. If the allocation of spending was to be solely on where the students live the allocation of expenditure will be based on that outlined in Table 5.8, where 51 per cent of students are assumed to live in the Geelong region, resulting in 51 per cent of expenditure being attributed to that region. Table A.2 outlines the assumption we have used to apportion expenditure between home region and study region. For example we have assumed that rent is expensed in the home region but on the other hand we have assumed that 50 per cent of personal costs are spent in the home region and the remaining 50 per cent in the study region. Conversely we have assumed that 100 per cent of textbook are purchased in the study region (that is on the Geelong campus).
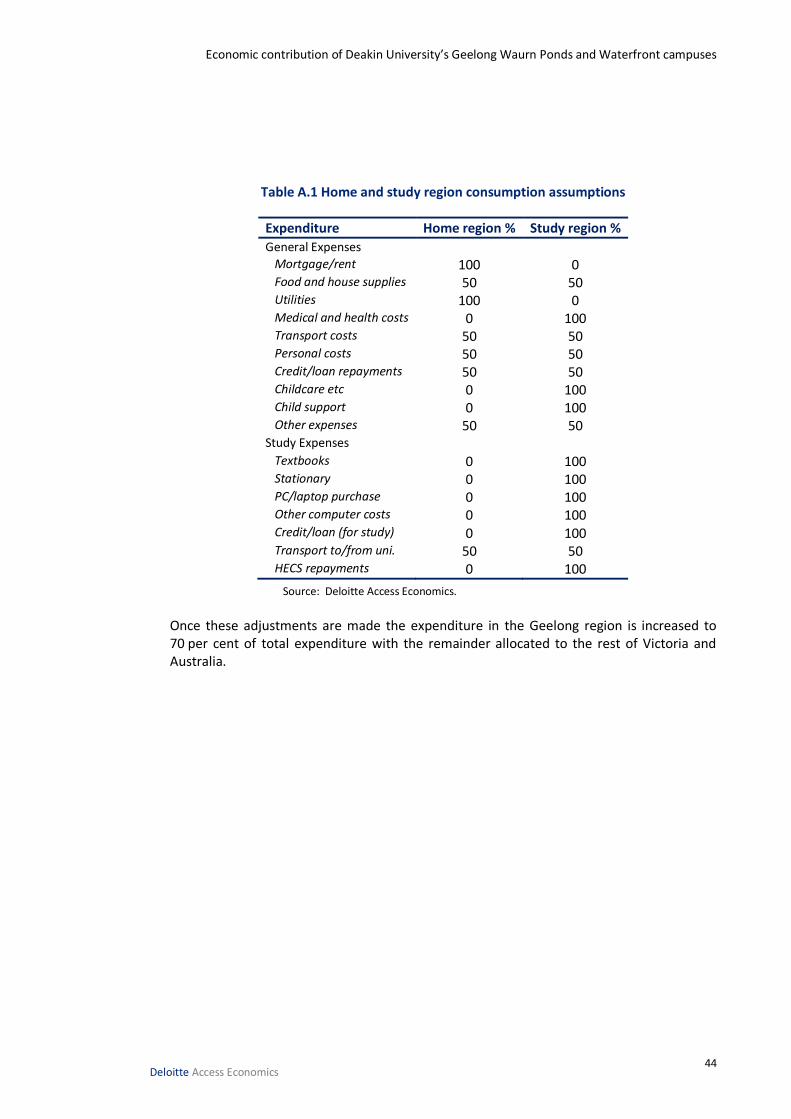
Economic contribution of Deakin University’s Geelong Waurn Ponds and Waterfront campuses
44 Deloitte Access Economics
Table A.1 Home and study region consumption assumptions
Expenditure Home region % Study region %
General Expenses Mortgage/rent 100 0 Food and house supplies 50 50 Utilities 100 0 Medical and health costs 0 100 Transport costs 50 50 Personal costs 50 50 Credit/loan repayments 50 50 Childcare etc 0 100 Child support 0 100 Other expenses 50 50 Study Expenses Textbooks 0 100 Stationary 0 100 PC/laptop purchase 0 100 Other computer costs 0 100 Credit/loan (for study) 0 100 Transport to/from uni. 50 50 HECS repayments 0 100
Source: Deloitte Access Economics.
Once these adjustments are made the expenditure in the Geelong region is increased to 70 per cent of total expenditure with the remainder allocated to the rest of Victoria and Australia.
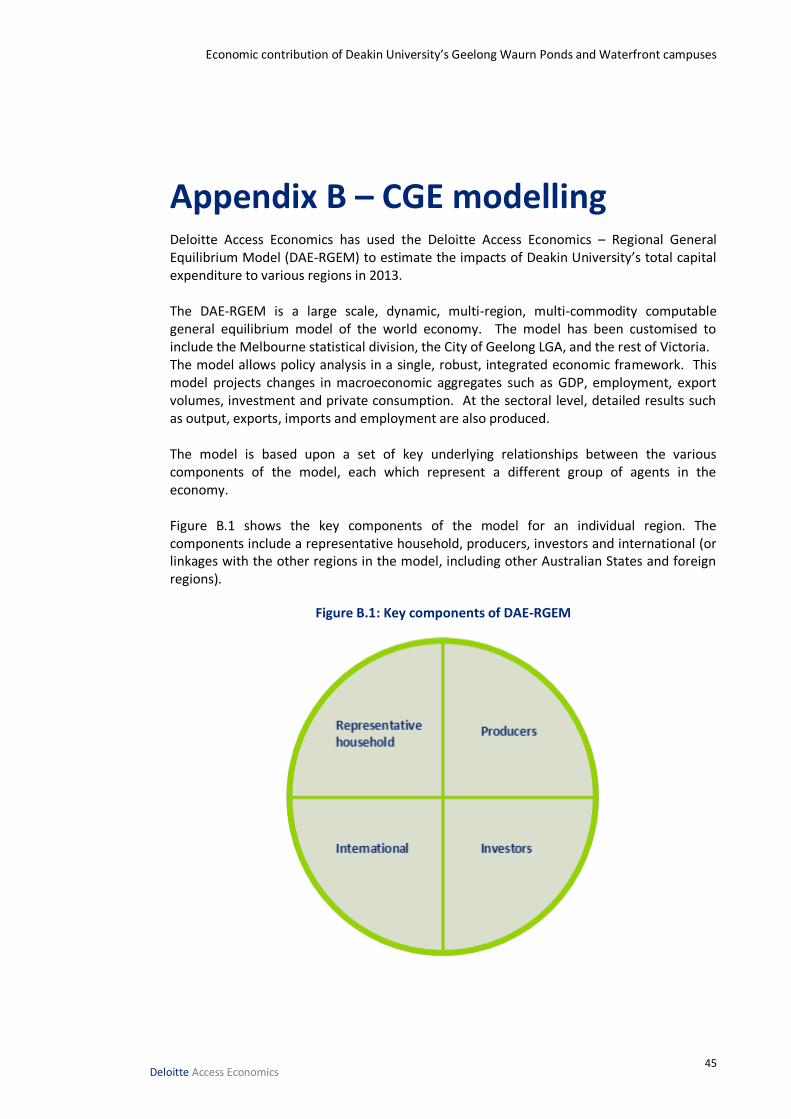
Economic contribution of Deakin University’s Geelong Waurn Ponds and Waterfront campuses
45 Deloitte Access Economics
Appendix B – CGE modelling Deloitte Access Economics has used the Deloitte Access Economics – Regional General Equilibrium Model (DAE-RGEM) to estimate the impacts of Deakin University’s total capital expenditure to various regions in 2013. The DAE-RGEM is a large scale, dynamic, multi-region, multi-commodity computable general equilibrium model of the world economy. The model has been customised to include the Melbourne statistical division, the City of Geelong LGA, and the rest of Victoria. The model allows policy analysis in a single, robust, integrated economic framework. This model projects changes in macroeconomic aggregates such as GDP, employment, export volumes, investment and private consumption. At the sectoral level, detailed results such as output, exports, imports and employment are also produced. The model is based upon a set of key underlying relationships between the various components of the model, each which represent a different group of agents in the economy. Figure B.1 shows the key components of the model for an individual region. The components include a representative household, producers, investors and international (or linkages with the other regions in the model, including other Australian States and foreign regions).
Figure B.1: Key components of DAE-RGEM
Economic contribution of Deakin University’s Geelong Waurn Ponds and Waterfront campuses
46 Deloitte Access Economics
CGE analysis is an extension of IO analysis, in that it is based on a database that incorporates input output tables and details of transactions between economic agents. In addition, CGE models also incorporate a system of equations and modelling parameters, based on a widely accepted body of economic theory, that model competition for resources (particularly in labour and capital markets) between economic agents. The framework allows for economy-wide modelling impacts incorporating any “crowding-out” impacts of a specific development project on other projects.
Economic contribution of Deakin University’s Geelong Waurn Ponds and Waterfront campuses
47 Deloitte Access Economics
Appendix C: Comparison to previous estimates To support the understanding of Deloitte Access Economics’ 2014 report on the economic contribution of Deakin University to its local communities, this appendix compares the economic contribution results to the WRI report produced in 2010. As the WRI report’s Melbourne Burwood campus region analysis most closely aligns with Deloitte Access Economics modelling the comparisons are made here for the Melbourne Burwood campus and the economic impact on the statistical division of Melbourne. The table below compares estimates of the economic contribution (in value added terms) of the Burwood campus to Melbourne.
Table C.1: Comparison of estimates of the economic contribution of the Burwood campus to Melbourne
DAE WRI Difference
Year (data) 2013 2009
Economic contributions
University
Value Added ($m) 376 412 -36
Employment (FTE) 2,501 3,009 -508
Students
Value Added ($m) 405 36 370
Employment (FTE) 3,260 285 2,975
Total contribution
Value Added ($m) 782 448 334
Employment (FTE) 5,761 3,294 2,467
Comments on differences:
University contributions: Likely reflects how total University activity has been allocated to the 4 campuses. Deloitte Access Economics largely allocated activity to campuses via FTE shares, while WRI allocated activity to campuses via student numbers. Deloitte Access Economics has attributed a higher share of activity to Geelong campuses and therefore has a much higher estimate of contribution to Geelong ($426m, 3124 FTE compared to WRI's $260m, 2609 FTE)
Student contributions: Deloitte Access Economics and WRI modelled student expenditure quite differently. WRI only modelled the impacts of students who moved into Melbourne from outside, whereas DAE included contributions from all students at Burwood. DAE used the student finance survey as specific evidence on student expenditure (estimating student expenditure to be between $21,000 and $37,000 p.a. depending on enrolment type), whereas WRI used generic household income
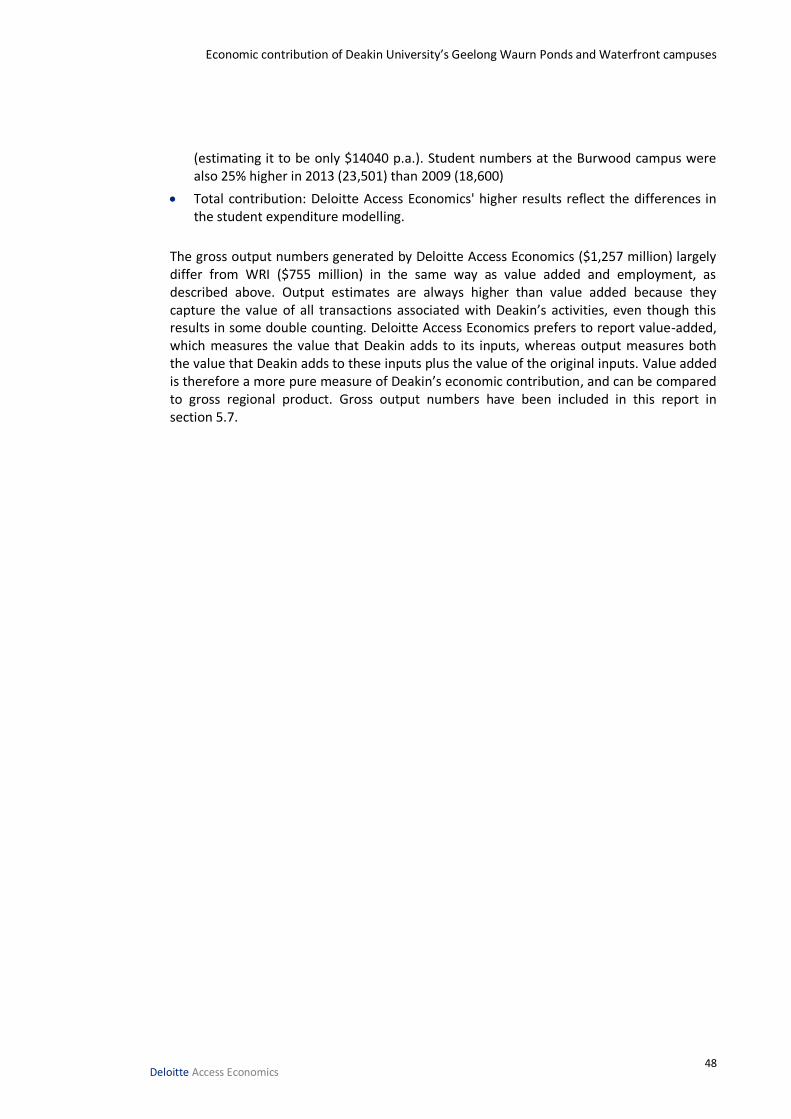
Economic contribution of Deakin University’s Geelong Waurn Ponds and Waterfront campuses
48 Deloitte Access Economics
(estimating it to be only $14040 p.a.). Student numbers at the Burwood campus were also 25% higher in 2013 (23,501) than 2009 (18,600)
Total contribution: Deloitte Access Economics' higher results reflect the differences in the student expenditure modelling.
The gross output numbers generated by Deloitte Access Economics ($1,257 million) largely differ from WRI ($755 million) in the same way as value added and employment, as described above. Output estimates are always higher than value added because they capture the value of all transactions associated with Deakin’s activities, even though this results in some double counting. Deloitte Access Economics prefers to report value-added, which measures the value that Deakin adds to its inputs, whereas output measures both the value that Deakin adds to these inputs plus the value of the original inputs. Value added is therefore a more pure measure of Deakin’s economic contribution, and can be compared to gross regional product. Gross output numbers have been included in this report in section 5.7.

Limitation of our work
General use restriction
This report is prepared for the use of Deakin University as per the engagement letter. This report is not intended to and should not be used or relied upon by anyone else and we accept no duty of care to any other person or entity. The report has been prepared for the purpose of estimating the economic contribution of Deakin University to its local community. You should not refer to or use our name or the advice for any other purpose.
Contact us
Deloitte Access Economics ACN: 149 633 116 Level 1 9 Sydney Avenue Barton ACT 2600 PO Box 6334 Kingston ACT 2604 Australia Tel: +61 2 6175 2000 Fax: +61 2 6175 2001
www.deloitteaccesseconomics.com.au
Deloitte Access Economics is Australia’s pre-eminent economics advisory practice and a member of Deloitte's global economics group. The Directors and staff of Access Economics joined Deloitte in early 2011.
About Deloitte
Deloitte refers to one or more of Deloitte Touche Tohmatsu Limited, a UK private company limited by guarantee, and its network of member firms, each of which is a legally separate and independent entity. Please see www.deloitte.com/au/about for a detailed description of the legal structure of Deloitte Touche Tohmatsu Limited and its member firms.
Deloitte provides audit, tax, consulting, and financial advisory services to public and private clients spanning multiple industries. With a globally connected network of member firms in more than 150 countries, Deloitte brings world-class capabilities and deep local expertise to help clients succeed wherever they operate. Deloitte's approximately 200,000 professionals are committed to becoming the standard of excellence.
About Deloitte Australia
In Australia, the member firm is the Australian partnership of Deloitte Touche Tohmatsu. As one of Australia’s leading professional services firms. Deloitte Touche Tohmatsu and its affiliates provide audit, tax, consulting, and financial advisory services through approximately 6,000 people across the country. Focused on the creation of value and growth, and known as an employer of choice for innovative human resources programs, we are dedicated to helping our clients and our people excel. For more information, please visit our web site at www.deloitte.com.au.
Liability limited by a scheme approved under Professional Standards Legislation.
Member of Deloitte Touche Tohmatsu Limited
© 2013 Deloitte Access Economics Pty Ltd