Embed Size (px)
Citation preview

8/13/2019 Economic Bulletin January 2013
http://slidepdf.com/reader/full/economic-bulletin-january-2013 1/108
ISSN: 1818 - 0027
January 2013 Volume XV No. 1

8/13/2019 Economic Bulletin January 2013
http://slidepdf.com/reader/full/economic-bulletin-january-2013 2/108

8/13/2019 Economic Bulletin January 2013
http://slidepdf.com/reader/full/economic-bulletin-january-2013 3/108
CENTRAL BANK OF TRINIDAD AND TOBAGO
ECONOMIC BULLETIN
VOLUME XV NO. 1
JANUARY 2013
CONTENTS
Pages
REVIEW OF ECONOMIC AND FINANCIAL DEVELOPMENTS
Part I Overview 1Part II Outlook 4
Part III International Economic Developments 7
Part IV Regional Economic Developments 9
Part V Gross Domestic Product 11
Part VI Domestic Activity 13
Part VII Labour Market 18
Part VIII Prices 19
Part IX Central Government Fiscal Operations 20
Part X Public Sector Debt 22
Part XI Money, Credit and Interest Rates 24
Part XII Capital Market 29Part XIII Balance of Payments 33
Part XIV International Commodity Markets 37
APPENDIX I: STATISTICAL TABLES (Tables 1-35) 41
APPENDIX II: FEATURE ARTICLE 86
APPENDIX III:
Calendar of Key Economic Events, July-December 2012 92

8/13/2019 Economic Bulletin January 2013
http://slidepdf.com/reader/full/economic-bulletin-january-2013 4/108

8/13/2019 Economic Bulletin January 2013
http://slidepdf.com/reader/full/economic-bulletin-january-2013 5/108
ECONOMIC BULLETIN VOLUME XV NO. 1 1
REVIEW OF ECONOMIC AND FINANCIAL DEVELOPMENTS
JANUARY 2013
PART I - OVERVIEW
In the face of continued uncertainty resulting
from the ongoing sovereign debt crisis in
Europe, growth prospects in the global economy
remain tepid. In January 2013, the International
Monetary Fund (IMF) slightly lowered its forecasts
for world economic growth for this year from 3.6
to 3.5 per cent and for 2014 from 4.2 to 4.1 per
cent. Indeed, the Euro Area debt crisis continues
to cast a shadow on global short term prospects
despite a series of policy steps taken over the
course of 2012. These included a new financing
programme for Greece in November 2012
involving measures to buy back the country’s
sovereign debt and the establishment of a single
supervisory mechanism for the Euro Area. All
in all, economic activity in continental Europe
remained sluggish. The situation was similar inthe United Kingdom (UK) despite a boost from
the hosting of the Summer Olympics.
There were encouraging signs of a gradual
pickup in the United States (US) in 2012 although
the economy contracted marginally in the fourth
quarter (Chart I). Financial markets became jittery
in the final quarter in the run up to the Presidential
elections and the potential “fiscal -cliff” related
to a combination of steep spending cuts and tax
increases that could have occurred at the start of2013. The sense of policy continuity following the
re-election of President Obama, last ditch political
compromise to stave off the “fiscal -cliff, and some
encouraging housing and labour indicators helped
to calm the markets in the first few weeks of 2013.
Even as emerging markets outperformed their
industrialized counterparts, they have not been
impervious to contagion from the sovereign
debt crisis. As a result of this as well as somepolicy tightening to avoid overheating, growth in
China and India experienced a mild slowdown.
For the year 2012, China’s economy expanded
by 7.8 per cent, its slowest rate of growth in
thirteen years. India’s expansion moderated from
5.5 per cent (year-on-year) in the second quarter
of 2012 to 5.3 per cent (year-on-year) in the third
quarter of 2012. Russia was also deeply affected
by the Euro Area crisis and in the third quarter
of 2012, recorded its slowest rate of growth in
three years. Within Latin America, the Brazilian
economy expanded by 0.9 per cent (year-on-
year) in the third quarter of 2012 boosted by
government stimulus programmes. Meanwhile,
on the African continent, plagued by widespread
industrial action, the economy of South Africa
expanded by 1.2 per cent (year-on-year) in the
third quarter of 2012, which was the country’s
slowest rate of growth in three years.
The economic climate in the Caribbean
remained subdued in light of global fragilities,
the associated weakening of external demand
and underlying debt problems in several
nations. The Economic Commission for Latin
America and the Caribbean (ECLAC) estimated
that the Caribbean would grow by 1.1 per centin 2012 and will expand by 2.0 per cent in 2013,
Chart I Advanced Economies –GDP Growth(Quarter-on-Quarter Per cent Change)
Source: Bloomberg.
8/13/2019 Economic Bulletin January 2013
http://slidepdf.com/reader/full/economic-bulletin-january-2013 6/108
ECONOMIC BULLETIN VOLUME XV NO. 1 2
down from their previous forecasts of 1.6 per
cent and 2.2 per cent, respectively. Unlike their
peers in the region, both Guyana and Suriname
performed creditably as their real output grew
and inflationary pressures remained contained
during 2011 and early 2012. In contrast, activity
in Barbados remained stagnant, mostly due to
the lacklustre performance of the tourism sector,
while Jamaica’s economy slipped back into
recession in 2012.
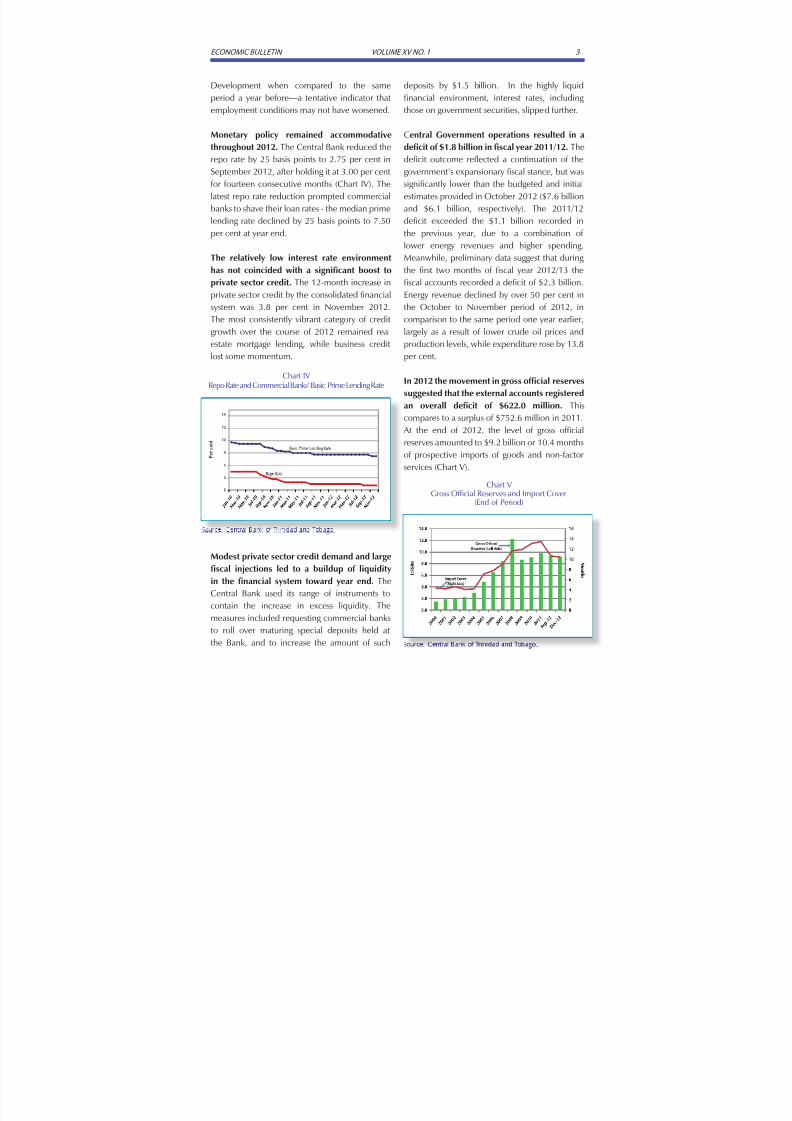
The Trinidad and Tobago economy displayed
signs of modest growth in the third quarter
of 2012. Provisional estimates from the Central
Bank’s Quarterly GDP Index indicate that theeconomy grew by 1.5 per cent (year-on-year) in
the third quarter (Chart II). After four successive
quarters of contraction, the energy sector
expanded by 0.5 per cent as higher production
of natural gas and liquefied natural gas (LNG)
offset a decline in petroleum and petrochemical
output. Meanwhile, following several months
in which construction was severely affected by
a strike in the cement industry, the non-energy
sector strengthened in the third quarter with
growth of 2.2 per cent. Growth in the non-
energy sector was driven mainly by activity in the
finance sector (2.4 per cent) and the distribution
sector which expanded by 4.0 per cent. For the
first nine months of 2012 as a whole, economic
activity is estimated to have slipped by 0.5 per
cent relative to the same period a year earlier.
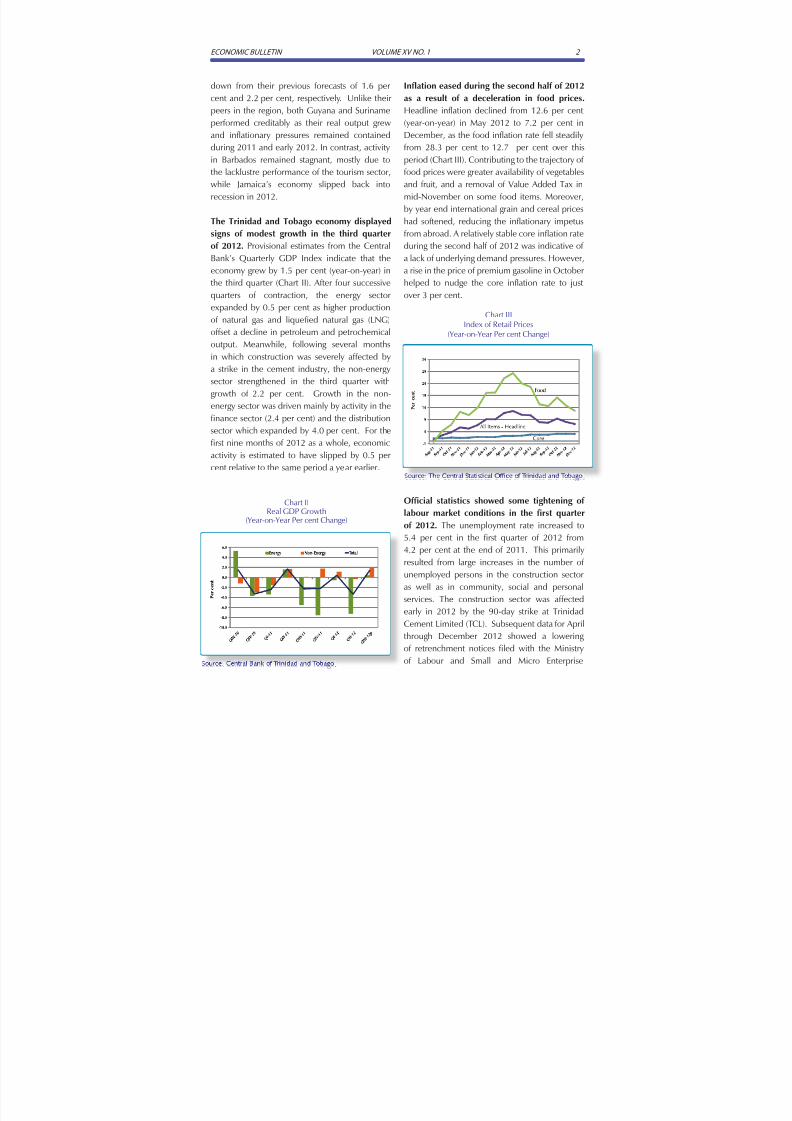
Inflation eased during the second half of 2012
as a result of a deceleration in food prices.
Headline inflation declined from 12.6 per cent
(year-on-year) in May 2012 to 7.2 per cent in
December, as the food inflation rate fell steadily
from 28.3 per cent to 12.7 per cent over this
period (Chart III). Contributing to the trajectory of
food prices were greater availability of vegetables
and fruit, and a removal of Value Added Tax in
mid-November on some food items. Moreover,
by year end international grain and cereal prices
had softened, reducing the inflationary impetus
from abroad. A relatively stable core inflation rate
during the second half of 2012 was indicative of
a lack of underlying demand pressures. However,a rise in the price of premium gasoline in October
helped to nudge the core inflation rate to just
over 3 per cent.
Official statistics showed some tightening of
labour market conditions in the first quarter
of 2012. The unemployment rate increased to
5.4 per cent in the first quarter of 2012 from
4.2 per cent at the end of 2011. This primarily
resulted from large increases in the number of
unemployed persons in the construction sector
as well as in community, social and personal
services. The construction sector was affected
early in 2012 by the 90-day strike at Trinidad
Cement Limited (TCL). Subsequent data for April
through December 2012 showed a lowering
of retrenchment notices filed with the Ministryof Labour and Small and Micro Enterprise
Chart IIReal GDP Growth
(Year-on-Year Per cent Change)
Source: Central Bank of Trinidad and Tobago..
Chart IIIIndex of Retail Prices
(Year-on-Year Per cent Change)
Source: The Central Statistical Office of Trinidad and Tobago..
8/13/2019 Economic Bulletin January 2013
http://slidepdf.com/reader/full/economic-bulletin-january-2013 7/108
ECONOMIC BULLETIN VOLUME XV NO. 1 3
Development when compared to the same
period a year before—a tentative indicator that
employment conditions may not have worsened.
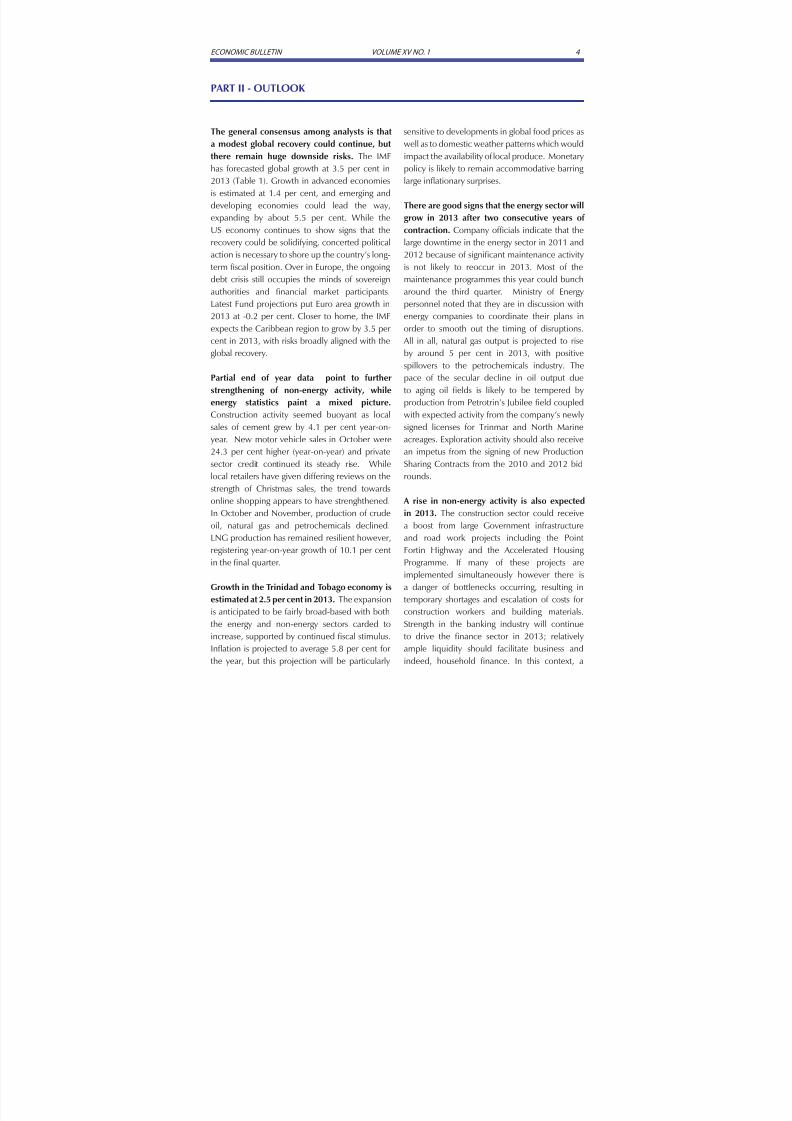
Monetary policy remained accommodative
throughout 2012. The Central Bank reduced the
repo rate by 25 basis points to 2.75 per cent in
September 2012, after holding it at 3.00 per cent
for fourteen consecutive months (Chart IV). The
latest repo rate reduction prompted commercial
banks to shave their loan rates - the median prime
lending rate declined by 25 basis points to 7.50
per cent at year end.
The relatively low interest rate environmenthas not coincided with a significant boost to
private sector credit. The 12-month increase in
private sector credit by the consolidated financial
system was 3.8 per cent in November 2012.
The most consistently vibrant category of credit
growth over the course of 2012 remained real
estate mortgage lending, while business credit
lost some momentum.
Modest private sector credit demand and large
fiscal injections led to a buildup of liquidity
in the financial system toward year end. The
Central Bank used its range of instruments to
contain the increase in excess liquidity. The
measures included requesting commercial banks
to roll over maturing special deposits held at
the Bank, and to increase the amount of such
deposits by $1.5 billion. In the highly liquid
financial environment, interest rates, including
those on government securities, slipped further.
Central Government operations resulted in a
deficit of $1.8 billion in fiscal year 2011/12. The
deficit outcome reflected a continuation of the
government’s expansionary fiscal stance, but was
significantly lower than the budgeted and initial
estimates provided in October 2012 ($7.6 billion
and $6.1 billion, respectively). The 2011/12
deficit exceeded the $1.1 billion recorded in
the previous year, due to a combination of
lower energy revenues and higher spending.
Meanwhile, preliminary data suggest that duringthe first two months of fiscal year 2012/13 the
fiscal accounts recorded a deficit of $2.3 billion.
Energy revenue declined by over 50 per cent in
the October to November period of 2012, in
comparison to the same period one year earlier,
largely as a result of lower crude oil prices and
production levels, while expenditure rose by 13.8
per cent.
In 2012 the movement in gross official reserves
suggested that the external accounts registeredan overall deficit of $622.0 million. This
compares to a surplus of $752.6 million in 2011.
At the end of 2012, the level of gross official
reserves amounted to $9.2 billion or 10.4 months
of prospective imports of goods and non-factor
services (Chart V).
Chart IVRepo Rate and Commercial Banks’ Basic Prime Lending Rate
Source: Central Bank of Trinidad and Tobago.o .
Chart VGross Official Reserves and Import Cover
(End of Period)
Source: Central Bank of Trinidad and Tobago. ..
8/13/2019 Economic Bulletin January 2013
http://slidepdf.com/reader/full/economic-bulletin-january-2013 8/108
ECONOMIC BULLETIN VOLUME XV NO. 1 4
The general consensus among analysts is thata modest global recovery could continue, but
there remain huge downside risks. The IMF
has forecasted global growth at 3.5 per cent in
2013 (Table 1). Growth in advanced economies
is estimated at 1.4 per cent, and emerging and
developing economies could lead the way,
expanding by about 5.5 per cent. While the
US economy continues to show signs that the
recovery could be solidifying, concerted political
action is necessary to shore up the country’s long-
term fiscal position. Over in Europe, the ongoing
debt crisis still occupies the minds of sovereign
authorities and financial market participants.
Latest Fund projections put Euro area growth in
2013 at -0.2 per cent. Closer to home, the IMF
expects the Caribbean region to grow by 3.5 per
cent in 2013, with risks broadly aligned with the
global recovery.
Partial end of year data point to further
strengthening of non-energy activity, whileenergy statistics paint a mixed picture.
Construction activity seemed buoyant as local
sales of cement grew by 4.1 per cent year-on-
year. New motor vehicle sales in October were
24.3 per cent higher (year-on-year) and private
sector credit continued its steady rise. While
local retailers have given differing reviews on the
strength of Christmas sales, the trend towards
online shopping appears to have strenghthened.
In October and November, production of crude
oil, natural gas and petrochemicals declined.
LNG production has remained resilient however,
registering year-on-year growth of 10.1 per cent
in the final quarter.
Growth in the Trinidad and Tobago economy is
estimated at 2.5 per cent in 2013. The expansion
is anticipated to be fairly broad-based with both
the energy and non-energy sectors carded to
increase, supported by continued fiscal stimulus.
Inflation is projected to average 5.8 per cent forthe year, but this projection will be particularly
sensitive to developments in global food prices aswell as to domestic weather patterns which would
impact the availability of local produce. Monetary
policy is likely to remain accommodative barring
large inflationary surprises.
There are good signs that the energy sector will
grow in 2013 after two consecutive years of
contraction. Company officials indicate that the
large downtime in the energy sector in 2011 and
2012 because of significant maintenance activity
is not likely to reoccur in 2013. Most of the
maintenance programmes this year could bunch
around the third quarter. Ministry of Energy
personnel noted that they are in discussion with
energy companies to coordinate their plans in
order to smooth out the timing of disruptions.
All in all, natural gas output is projected to rise
by around 5 per cent in 2013, with positive
spillovers to the petrochemicals industry. The
pace of the secular decline in oil output due
to aging oil fields is likely to be tempered byproduction from Petrotrin’s Jubilee field coupled
with expected activity from the company’s newly
signed licenses for Trinmar and North Marine
acreages. Exploration activity should also receive
an impetus from the signing of new Production
Sharing Contracts from the 2010 and 2012 bid
rounds.
A rise in non-energy activity is also expected
in 2013. The construction sector could receive
a boost from large Government infrastructure
and road work projects including the Point
Fortin Highway and the Accelerated Housing
Programme. If many of these projects are
implemented simultaneously however there is
a danger of bottlenecks occurring, resulting in
temporary shortages and escalation of costs for
construction workers and building materials.
Strength in the banking industry will continue
to drive the finance sector in 2013; relatively
ample liquidity should facilitate business andindeed, household finance. In this context, a
PART II - OUTLOOK

8/13/2019 Economic Bulletin January 2013
http://slidepdf.com/reader/full/economic-bulletin-january-2013 9/108
ECONOMIC BULLETIN VOLUME XV NO. 1 5
step up in business and consumer confidence
could translate into a notable increase in private
investment and consumer spending.
The cautiously optimistic outlook needs
nonetheless to be tempered by an appreciation
of the associated risks. Clearly the external
setting is an overarching concern (including the
fortunes of Caribbean neighbours) given the
implications for demand and prices for Trinidad
and Tobago’s energy exports as well as imports
of food, intermediate products and capital
equipment. External financial market volatility
could also ultimately impact on inward as well
as outward capital flows, although the short term
impact on Trinidad and Tobago is likely to be low.
Domestically, if there is heightened tension in the
industrial relations climate, productivity could
suffer a major setback. Slow implementation
of the public sector investment program could
stymie growth in the non-energy sector. At
the same time, the fiscal situation needs to be
carefully guarded in order to ensure that capital
spending is devoted to high quality projects with
strong social returns and that the public debt
remains at manageable levels.
8/13/2019 Economic Bulletin January 2013
http://slidepdf.com/reader/full/economic-bulletin-january-2013 10/108
ECONOMIC BULLETIN VOLUME XV NO. 1 6
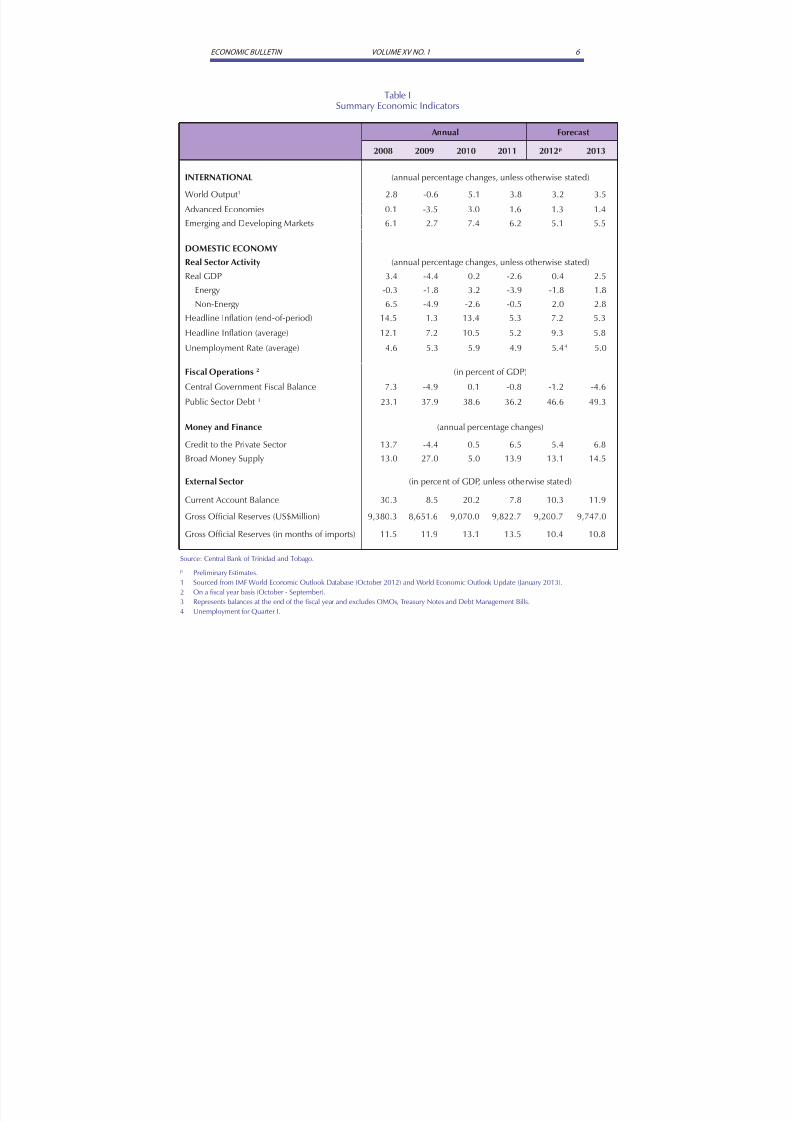
Table ISummary Economic Indicators
Annual Forecast
2008 2009 2010 2011 2012p 2013
INTERNATIONAL (annual percentage changes, unless otherwise stated)
World Output 1 2.8 -0.6 5.1 3.8 3.2 3.5
Advanced Economies 0.1 -3.5 3.0 1.6 1.3 1.4
Emerging and Developing Markets 6.1 2.7 7.4 6.2 5.1 5.5
DOMESTIC ECONOMY
Real Sector Activity (annual percentage changes, unless otherwise stated)
Real GDP 3.4 -4.4 0.2 -2.6 0.4 2.5
Energy -0.3 -1.8 3.2 -3.9 -1.8 1.8
Non-Energy 6.5 -4.9 -2.6 -0.5 2.0 2.8
Headline Inflation (end-of-period) 14.5 1.3 13.4 5.3 7.2 5.3
Headline Inflation (average) 12.1 7.2 10.5 5.2 9.3 5.8
Unemployment Rate (average) 4.6 5.3 5.9 4.9 5.44 5.0
Fiscal Operations 2 (in percent of GDP)
Central Government Fiscal Balance 7.3 -4.9 0.1 -0.8 -1.2 -4.6Public Sector Debt 3 23.1 37.9 38.6 36.2 46.6 49.3
Money and Finance (annual percentage changes)
Credit to the Private Sector 13.7 -4.4 0.5 6.5 5.4 6.8
Broad Money Supply 13.0 27.0 5.0 13.9 13.1 14.5
External Sector (in percent of GDP, unless otherwise stated)
Current Account Balance 30.3 8.5 20.2 7.8 10.3 11.9
Gross Official Reserves (US$Million) 9,380.3 8,651.6 9,070.0 9,822.7 9,200.7 9,747.0Gross Official Reserves (in months of imports) 11.5 11.9 13.1 13.5 10.4 10.8
Source: Central Bank of Trinidad and Tobago.
p Preliminary Estimates.
1 Sourced from IMF World Economic Outlook Database (October 2012) and World Economic Outlook Update (January 2013).
2 On a fiscal year basis (October - September).
3 Represents balances at the end of the fiscal year and excludes OMOs, Treasury Notes and Debt Management Bills.
4 Unemployment for Quarter I.

8/13/2019 Economic Bulletin January 2013
http://slidepdf.com/reader/full/economic-bulletin-january-2013 11/108
ECONOMIC BULLETIN VOLUME XV NO. 1 7
PART III - INTERNATIONAL ECONOMIC DEVELOPMENTS
Table 2Emerging Economies – Quarterly GDP Growth
(Year-on-Year Per cent Change)
2011 2012
I II III IV I II III
China 9.7 9.5 9.1 8.9 8.1 7.6 7.4
India 9.2 8.0 6.7 6.1 5.3 5.5 5.3
Brazil 4.2 3.3 2.1 1.4 0.8 0.5 0.9
Source: Bloomberg.
The global economic recovery continues to
face uncertainty due to the persistent sovereigndebt crisis in Europe. As part of the support for
Greece, European authorities announced a new
financing program in November 2012, which
included measures to buy back the country’s
sovereign debt. In addition, leaders of the
European Union agreed to establish a single
supervisory mechanism for the Euro Area, marking
a fundamental step towards closer integration1.
Nonetheless, European governments are yet to
agree on several key elements to establish the
planned Economic and Monetary Union, such as
fiscal integration and major structural reforms to
bolster growth and competitiveness.
Growth in most advanced economies was
sluggish. Preliminary estimates showed that in
the fourth quarter of 2012, economic growth in
the United Kingdom (UK) declined by 0.3 per cent
(quarter-on-quarter). The Euro Area economy
continued to contract in the third quarter of
2012, declining by 0.1 per cent. During thethird quarter, growth in the French economy was
stagnant while the German economy slowed. In
the US, preliminary estimates indicate that the
economy contracted by 0.1 per cent (quarter-
on-quarter) in the fourth quarter of 2012, mainly
on account of a downturn in private inventory
investment and government spending.
While emerging markets continued to
outperform their industrialized counterparts,
they have not been impervious to the effects of
1 Under the agreement, the European Central Bank will directly supervise banks with asset values of either €30 billion or
more, or larger than one-fifth of the economic output of the bank’s respective country of residence.2 International Monetary Fund, World Economic Outlook Update, January 2013.
the sovereign debt crisis. Growth in China and
India experienced a mild slow down, not only asthe economies adjusted to the policy tightening
which commenced in 2011 but also as a result
of contagion effects from the European crisis.
Supported by fiscal stimulus and modest easing
of monetary conditions, China’s economy grew
by 7.9 per cent on a year-on-year basis in the
fourth quarter of 2012, compared with 7.4 per
cent in the previous quarter (Table 2). However,
the country’s growth rate of 7.8 per cent for all
of 2012 is its slowest rate of growth in thirteen
years. Meanwhile, India’s economy grew by 5.3
per cent in the third quarter of 2012, lower than
5.5 per cent expansion in the second quarter and
well below the average of the past decade. In
light of the deceleration, policymakers in China
and India have gradually shifted their monetary
stance to be more accommodative. Russia was
also deeply affected by the Euro Area crisis, and
economic growth decelerated sharply during the
third quarter of 2012. Plagued by widespread
industrial action, the economy of South Africaexpanded by 1.2 per cent (year-on-year) in the
third quarter of 2012, the country’s slowest rate
of growth in three years. Meanwhile, boosted by
government stimulus programmes the Brazilian
economy expanded by 0.9 per cent (year-on-
year) in the third quarter of 2012, from 0.5 per
cent in the previous quarter.
The IMF has projected a gradual strengthening
of the global recovery2. Its latest forecasts put
global economic growth at 3.5 per cent in 2013
8/13/2019 Economic Bulletin January 2013
http://slidepdf.com/reader/full/economic-bulletin-january-2013 12/108
ECONOMIC BULLETIN VOLUME XV NO. 1 8
and 4.1 per cent in 2014, slightly down from its
earlier projections of 3.6 per cent and 4.2 per
cent, respectively (Box 1).
Apprehensions over the fiscal cliff 3 in the US
were averted early in the new year, albeit
temporarily. On January 01, 2013, the US
House of Representatives passed a critical
bipartisan fiscal bill. Key elements of the bill
3 The fiscal cliff was the sharp reduction in the budget deficit that would have occurred when certain terms of the Budget
Control Act of 2012 relating to tax increases and spending cuts went into effect at the end of 2012.
included: (i) a permanent extension of the Bush
tax cuts for annual income below US$400,000
per individual; (ii) a one year extension of
unemployment benefits for two million people;
and (iii) the postponement of automatic spending
cuts until March 01, 2013. Despite removing the
immediate threat of the fiscal cliff, the bill did not
address the Federal debt ceiling, which currently
stands at US$16.4 trillion.
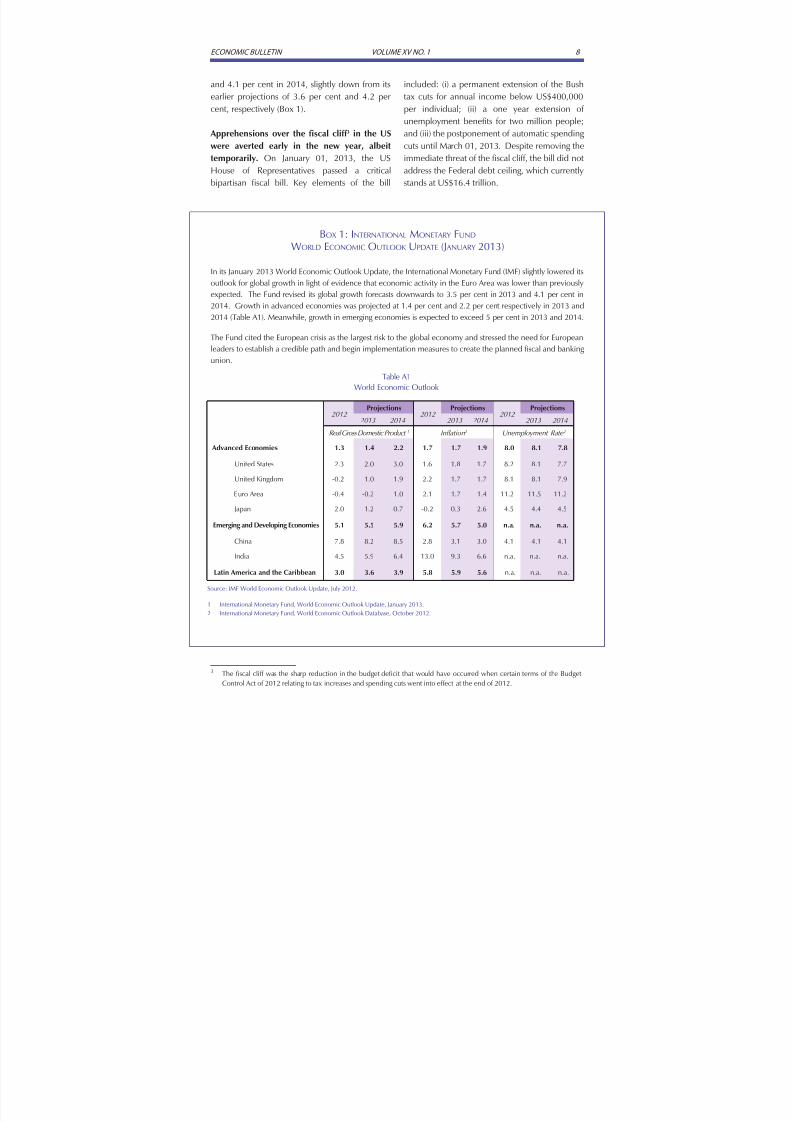
BOX 1: INTERNATIONAL MONETARY FUND
WORLD ECONOMIC OUTLOOK UPDATE (J ANUARY 2013)
Table A1
World Economic Outlook
2012 Projections
2012 Projections
2012 Projections
2013 2014 2013 2014 2013 2014
Real Gross Domestic Product 1 Inflation 2 Unemployment Rate 2
Advanced Economies 1.3 1.4 2.2 1.7 1.7 1.9 8.0 8.1 7.8
United States 2.3 2.0 3.0 1.6 1.8 1.7 8.2 8.1 7.7
United Kingdom -0.2 1.0 1.9 2.2 1.7 1.7 8.1 8.1 7.9
Euro Area -0.4 -0.2 1.0 2.1 1.7 1.4 11.2 11.5 11.2
Japan 2.0 1.2 0.7 -0.2 0.3 2.6 4.5 4.4 4.5
Emerging and Developing Economies 5.1 5.5 5.9 6.2 5.7 5.0 n.a. n.a. n.a.
China 7.8 8.2 8.5 2.8 3.1 3.0 4.1 4.1 4.1
India 4.5 5.9 6.4 13.0 9.3 6.6 n.a. n.a. n.a.
Latin America and the Caribbean 3.0 3.6 3.9 5.8 5.9 5.6 n.a. n.a. n.a.
Source: IMF World Economic Outlook Update, July 2012.
1 International Monetary Fund, World Economic Outlook Update, January 2013.
2 International Monetary Fund, World Economic Outlook Database, October 2012.
In its January 2013 World Economic Outlook Update, the International Monetary Fund (IMF) slightly lowered its
outlook for global growth in light of evidence that economic activity in the Euro Area was lower than previously
expected. The Fund revised its global growth forecasts downwards to 3.5 per cent in 2013 and 4.1 per cent in
2014. Growth in advanced economies was projected at 1.4 per cent and 2.2 per cent respectively in 2013 and
2014 (Table A1). Meanwhile, growth in emerging economies is expected to exceed 5 per cent in 2013 and 2014.
The Fund cited the European crisis as the largest risk to the global economy and stressed the need for European
leaders to establish a credible path and begin implementation measures to create the planned fiscal and banking
union.
8/13/2019 Economic Bulletin January 2013
http://slidepdf.com/reader/full/economic-bulletin-january-2013 13/108
ECONOMIC BULLETIN VOLUME XV NO. 1 9
PART IV - REGIONAL ECONOMIC DEVELOPMENTS
Both the IMF and ECLAC recently lowered
their 2012 real growth estimates for the
Caribbean. ECLAC noted that the weak global
economy, which is suffering from the difficulties
faced by Europe, the United States and China,
has negatively affected growth in the Caribbean.
In December 2012, ECLAC estimated that the
Caribbean will expand by 1.1 per cent in 2012
and 2.0 per cent in 20134, down from previous
forecasts made in October 2012 (1.6 per cent
and 2.2 per cent growth in 2012 and 2013,
respectively). The IMF’s estimates for both2012 and 2013 GDP growth rates were more
optimistic than ECLAC’s forecasts5. In the latest
World Economic Outlook, October 20126, the
IMF estimated that the Caribbean would expand
by 2.8 per cent in 2012 (down from the 3.5 per
cent forecast made in April 2012), followed by a
3.5 per cent increase in growth in 2013.
Barbados
In 2012, real economic activity in Barbados isestimated to have remained stagnant, mostly
due to the lacklustre performance of the
tourism sector. Real growth in 2012 is estimated
at zero per cent (year-on-year), compared with
the 0.8 per cent growth experienced in 2011.
Tourism value-added declined by 3.5 per cent,
following a contraction of 0.2 per cent in 2011.
While the length of stay of tourists in Barbados
remained steady throughout the year, tourist
arrivals declined by 6.2 per cent (year-on-year)in 2012. Additionally, there was a 10 per cent
reduction in cruise ship calls in the third quarter
of the year, which reversed the gains in cruise
passenger arrivals recorded during the first half of
the year.
Favourable movements in the inflation rate was
coupled with a slight increase in unemployment.
4
Economic Commission for Latin America and the Caribbean. 2012. “Preliminary Overview of the Economies of Latin Americaand the Caribbean”, December. Available at http://www.eclac.cl/publicaciones/xml/3/48593/PreliminaryOverview2012.pdf.5 The countries that constitute the Caribbean in ECLAC’s and IMF’s GDP growth projections differ. Both ECLAC and the
IMF include in their respective definitions of the Caribbean: the ECCU, Barbados, Jamaica, the Bahamas and Trinidad and
Tobago. ECLAC also includes Belize, Guyana and Suriname, while IMF includes the Dominican Republic and Haiti.6 International Monetary Fund. 2012. “World Economic Outlook (WEO), October 2012”. Available at http://www.imf.org/
external/pubs/ft/weo/2012/02/pdf/text.pdf.
Inflation relented in 2012, measuring 3.2 per
cent year-on-year in September, down from 10.4
per cent in September 2011. This was mainly
on account of slower price increases for food and
fuel. The 12-month inflation rate for the food, as
well as the fuel and light sub-indices measured
6.0 per cent and -0.9 per cent, respectively in
September 2012, down from 9.5 per cent and
25.5 per cent, respectively in September 2011.
Sluggish economic activity throughout the year
led to a slight increase in the unemployment rate
to 11.7 per cent as at the end of September 2012.Layoffs were recorded in the accommodation
and food services industries, and some also
resulted from the closure of Redjet Airlines. The
Central Bank of Barbados has forecasted that the
Barbadian economy will expand by 0.7 per cent
in 2013.
Jamaica
In 2012, Jamaica’s economy slipped back
into recession. The economy contracted by anaverage of 0.15 per cent over the first half of the
year and was expected to have performed poorly
in the latter half in light of weak domestic demand
and the impact of Hurricane Sandy. Preliminary
estimates of damage from the hurricane stand at
US$54.3 million, inclusive of US$16.3 million
for the agricultural sector, US$1.8 million
for damaged schools and US$1.7 million for
damaged health facilities.
On a brighter note, Jamaica registered
significant growth in both its long-stay and
cruise tourism. During the first three quarters of
2012, the island recorded an increase of nearly
3.0 per cent (year-on-year) in stop-over arrivals.
Meanwhile, total cruise arrivals for the period
January to August 2012 increased by 33.9 per
cent compared to the same period a year earlier.
8/13/2019 Economic Bulletin January 2013
http://slidepdf.com/reader/full/economic-bulletin-january-2013 14/108
ECONOMIC BULLETIN VOLUME XV NO. 1 10
7 Statement by an IMF Mission to Jamaica, Press Release No. 12/384, October 5, 2012. Available at http://www.imf.org/
external/np/sec/pr/2012/pr12384.htm.8 The members of the Eastern Caribbean Currency Union include: Anguilla, Antigua and Barbuda, Dominica, Grenada,
Montserrat, St. Kitts, St. Lucia, and St. Vincent and the Grenadines.
The Government of Jamaica is currently
seeking to renew IMF financing. An IMF mission
that visited the island in late 2012 indicated that
agreement had been reached on the following 7:
• Elements of a growth agenda consistent with
debt reduction and fiscal consolidation;
• Some important structural reforms to
promote growth, support fiscal and external
sustainability, and enhance financial market
stability; and
• A preliminary timetable for implementing
various structural benchmarks to monitor
progress in meeting possible programobjectives.
Guyana
During the first half of 2012, real economic
growth in Guyana was 2.8 per cent, driven
mainly by the mining and quarrying and services
sectors. The positive outturn in the mining and
quarrying sub-sector reflected the high gold and
bauxite output, while services benefitted from
improved performances in the transportation and
storage as well as wholesale and retail sub-sectors.
In the 12 months to September 2012, inflation
was contained at 2.3 per cent compared with
4.7 per cent recorded in the same period a year
earlier. The Guyanese economy was projected to
grow by 3.8 per cent (Central Bank of Guyana)
in calendar 2012, and according to the IMF, the
pace of growth is expected to increase to 5.5 per
cent in 2013.
Suriname
At the conclusion of the Article IV Consultation
in September 2012, IMF officials noted that
economic activity in Suriname remained
strong, while inflation pressures have abated.
The IMF estimated that the Surinamese economy
would grow by 4.0 per cent in 2012 supported
by robust activity in the oil and gold sectors.
Inflationary pressures in 2012 eased following
the (20 per cent) devaluation of the currency vis-
à-vis the US dollar which took place in January
2011. Alongside this devaluation of the currency,
there was a simultaneous increase in domestic
fuel taxes. These two moves increased domestic
inflationary pressures, with the inflation rate
spiking at 22.6 per cent year-on-year in April
2011. Since then, the inflation rate decreased
steadily, reaching 4.1 per cent year-on-year inDecember 2012. The IMF has projected that the
Surinamese economy will remain robust in 2013
and is expected to expand even further, by 4.5
per cent.
Eastern Caribbean Currency Union (ECCU) 8
Preliminary data indicate that economic
activity in the ECCU contracted for a fourth
consecutive year in 2012. Real GDP is
estimated to have declined by 0.1 per cent,
compared with an average contraction of 2.2
per cent in the previous three years (2009-
2011). This outturn reflected lower output in key
sectors such as construction, transport, storage
and communications, and sluggish growth in the
tourism industry. In 2012, value-added by the
construction sector contracted by 5.6 per cent,
following an average decline of 13.3 per cent in
the previous three years. However, the Eastern
Caribbean Central Bank has projected that as awhole, the ECCU will experience a turnaround in
2013 with real GDP expected to expand by 1.4
per cent.
8/13/2019 Economic Bulletin January 2013
http://slidepdf.com/reader/full/economic-bulletin-january-2013 15/108
ECONOMIC BULLETIN VOLUME XV NO. 1 11
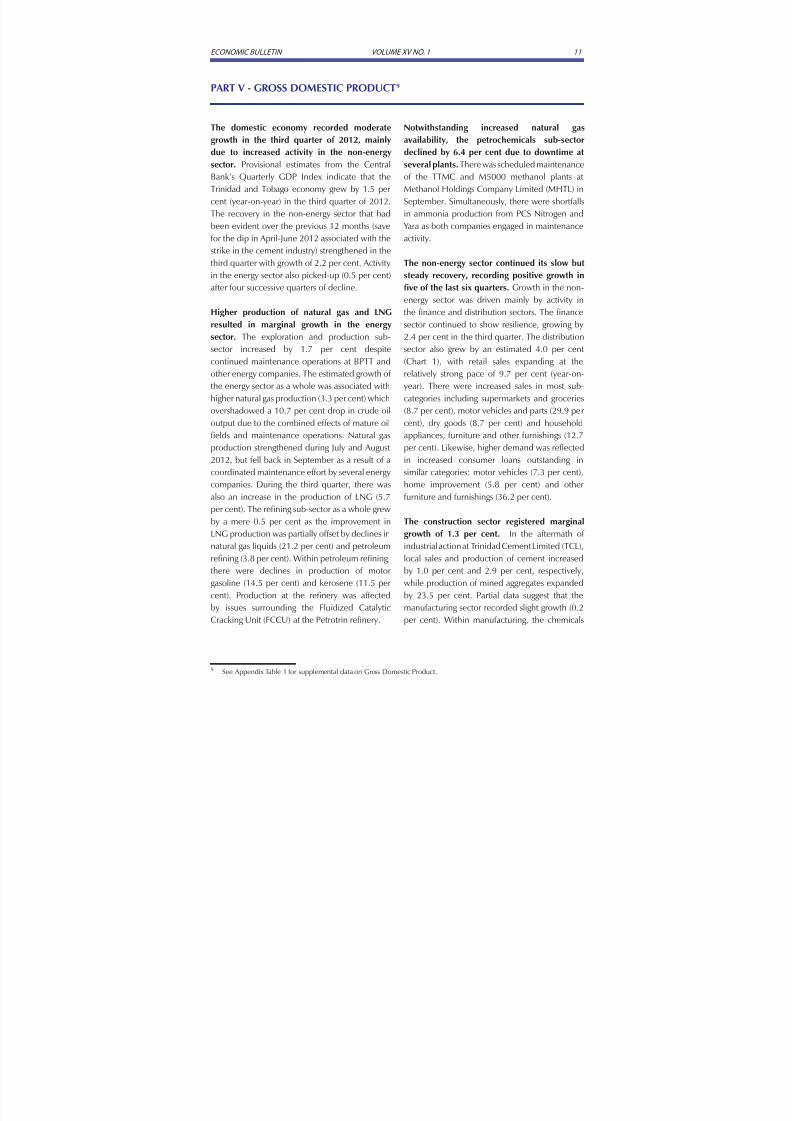
PART V - GROSS DOMESTIC PRODUCT9
The domestic economy recorded moderategrowth in the third quarter of 2012, mainly
due to increased activity in the non-energy
sector. Provisional estimates from the Central
Bank’s Quarterly GDP Index indicate that the
Trinidad and Tobago economy grew by 1.5 per
cent (year-on-year) in the third quarter of 2012.
The recovery in the non-energy sector that had
been evident over the previous 12 months (save
for the dip in April-June 2012 associated with the
strike in the cement industry) strengthened in the
third quarter with growth of 2.2 per cent. Activityin the energy sector also picked-up (0.5 per cent)
after four successive quarters of decline.
Higher production of natural gas and LNG
resulted in marginal growth in the energy
sector. The exploration and production sub-
sector increased by 1.7 per cent despite
continued maintenance operations at BPTT and
other energy companies. The estimated growth of
the energy sector as a whole was associated withhigher natural gas production (3.3 per cent) which
overshadowed a 10.7 per cent drop in crude oil
output due to the combined effects of mature oil
fields and maintenance operations. Natural gas
production strengthened during July and August
2012, but fell back in September as a result of a
coordinated maintenance effort by several energy
companies. During the third quarter, there was
also an increase in the production of LNG (5.7
per cent). The refining sub-sector as a whole grew
by a mere 0.5 per cent as the improvement inLNG production was partially offset by declines in
natural gas liquids (21.2 per cent) and petroleum
refining (3.8 per cent). Within petroleum refining,
there were declines in production of motor
gasoline (14.5 per cent) and kerosene (11.5 per
cent). Production at the refinery was affected
by issues surrounding the Fluidized Catalytic
Cracking Unit (FCCU) at the Petrotrin refinery.
Notwithstanding increased natural gasavailability, the petrochemicals sub-sector
declined by 6.4 per cent due to downtime at
several plants. There was scheduled maintenance
of the TTMC and M5000 methanol plants at
Methanol Holdings Company Limited (MHTL) in
September. Simultaneously, there were shortfalls
in ammonia production from PCS Nitrogen and
Yara as both companies engaged in maintenance
activity.
The non-energy sector continued its slow butsteady recovery, recording positive growth in
five of the last six quarters. Growth in the non-
energy sector was driven mainly by activity in
the finance and distribution sectors. The finance
sector continued to show resilience, growing by
2.4 per cent in the third quarter. The distribution
sector also grew by an estimated 4.0 per cent
(Chart 1), with retail sales expanding at the
relatively strong pace of 9.7 per cent (year-on-
year). There were increased sales in most sub-categories including supermarkets and groceries
(8.7 per cent), motor vehicles and parts (29.9 per
cent), dry goods (8.7 per cent) and household
appliances, furniture and other furnishings (12.7
per cent). Likewise, higher demand was reflected
in increased consumer loans outstanding in
similar categories: motor vehicles (7.3 per cent),
home improvement (5.8 per cent) and other
furniture and furnishings (36.2 per cent).
The construction sector registered marginalgrowth of 1.3 per cent. In the aftermath of
industrial action at Trinidad Cement Limited (TCL),
local sales and production of cement increased
by 1.0 per cent and 2.9 per cent, respectively,
while production of mined aggregates expanded
by 23.5 per cent. Partial data suggest that the
manufacturing sector recorded slight growth (0.2
per cent). Within manufacturing, the chemicals
9 See Appendix Table 1 for supplemental data on Gross Domestic Product.

8/13/2019 Economic Bulletin January 2013
http://slidepdf.com/reader/full/economic-bulletin-january-2013 16/108
ECONOMIC BULLETIN VOLUME XV NO. 1 12
sub-industry grew by 9 per cent. This was offset
by a drop in steel production (-10.6 per cent)
which led to a decline in the assembly type and
related industries. The food processing sub-industry also declined slightly (0.2 per cent). In
addition, the water and electricity sector posted
growth (4.3 per cent). Overall, manufacturers
continued to operate at around 65 per cent of
existing capacity.
Chart 1Real GDP Growth
(Year-on-Year Per cent Change)
Source: Central Bank of Trinidad and Tobago..
-10.0
-8.0
-6.0
-4.0
-2.0
0.0
2.0
4.0
6.0
QIII-10 QIV-10 QI-11 QII-11 QIII-11 QIV-11 QI-12 QII-11 QIII-11
P e r c e n t
Energy Non-Energy Total
8/13/2019 Economic Bulletin January 2013
http://slidepdf.com/reader/full/economic-bulletin-january-2013 17/108
ECONOMIC BULLETIN VOLUME XV NO. 1 13
PART VI - DOMESTIC ACTIVITY 10
Petroleum
Crude production continued to tumble over
the second half of 2012. Crude oil production
averaged 80,279 barrels per day (bpd) during July
to November 2012, down from 89,495 bpd in
the corresponding period of 2011 (Table 3). The
decline was exacerbated in September/October
2012 as several producers engaged in maintenance
activity (Box 2). During the July to November 2012
period average rig days grew by 3.6 per cent (year-
on-year), while operators performed 11.5 per cent
less drilling.
Petroleum refining was also down during the
second half of 2012. Between July and November
2012, refinery throughput was 21.5 per cent lower
than in the earlier period of the year, led by significant
declines in the output of motor gasoline and
kerosene. These reductions resulted from significant
downtime at the refinery as maintenance activity as
well as several days of industrial unrest interrupted
production. The Fluidized Catalytic Cracking Unit(FCCU) was down for most of 2012. Additionally,
Petrotrin began phase 1 of its turnaround works
on the 8CDU Train in late October 2012 which
affected several plants. Industrial action at the
refinery in September and October also resulted in
several days of downtime.
Natural Gas
The second half of 2012 saw a slight increase
in production of natural gas. Robust production
rates in July and August 2012 outweighed
curtailed output during September, October
and November 2012. Natural gas output grew
by an overall rate of 0.5 per cent during July to
November 2012 compared to one year ago (Table
3) and initial estimates are that the December
2012 gas production was much higher than in
previous months. The lower output during the
10 See Appendix Tables 4, 5 and 6 for supplemental data on energy production.11 LNG refers to natural gas which has been liquefied in order to facilitate cost savings in transport over long distances. NGLs
refer mainly to propane, butane and natural gasoline. These are naturally occurring elements found in natural gas and are
separated from the gas in the form of liquids.12 Natural Gas Liquids (NGLs) are extracted from natural gas. The ‘drier’ the natural gas, the less the amount of liquids (NGLs)
that can be obtained per unit of natural gas.
period resulted from maintenance activity at BPTT
and BGTT, the country’s two largest natural gasproducers.
Liquefied Natural Gas (LNG) and Natural Gas
Liquids (NGLs) 11
While LNG output grew at a healthy rate in
the second half of the year, the NGLs industry
continued to shrink. The production of LNG
increased by 7.9 per cent during the second half of
2012 compared to the previous year. This growth
reflected the much lower production in 2011related to maintenance work at Train 4 in October
of that year, as well as increased gas production
in July/August 2012 which was mainly channeled
to LNG. On the other hand, production of NGLs
declined 21.4 per cent year-on-year during July to
November 2012. This resulted from the production
of natural gas that has been progressively drier12.
Nitrogenous Fertilizers
Fertilizer production fell in the second half
of 2012. As discussed earlier, lower natural gas
availability and maintenance programmes in
September/October dampened the output of urea
as well as ammonia. Overall fertilizer production
was down 12.1 per cent during July to November
2012 compared to a year earlier (Table 3).
Methanol
Methanol production was also lower during thesecond half. The coordinated maintenance effort
of September/October 2012 saw outages at the
M5000 plant and the Atlas plant, the country’s two
largest methanol plants. The smaller TTMC 1 plant
also engaged in turnaround activity. The end result
was a 8.8 per cent decline in methanol production
during July to November 2012 compared to a year
ago (Table 3).

8/13/2019 Economic Bulletin January 2013
http://slidepdf.com/reader/full/economic-bulletin-january-2013 18/108
ECONOMIC BULLETIN VOLUME XV NO. 1 14
Iron and Steel
There was a substantial drop in production
of direct reduced iron (DRI) during the third
quarter of 2012. A major mechanical outage at
the DRI plant in September 2012 led to a 20.6 per
cent decline in DRI output during the third quarter
of the year relative to the same period in 2011.
Small increases in billet and wire rod productioncountered some of this decline. However, all in all
iron and steel output declined by 10.6 per cent.
Energy Commodity Price Index (ECPI) 13,14
During the second half of 2012, fluctuations
in the prices of crude oil and associated
derivatives were primarily responsible for the
observed movements in the EPCI (Chart 2). The
price of crude drives the price of several crude oil
derivatives which feature in the ECPI includingmotor gasoline, diesel and jet fuel. The Index stood
at 125.57 in June 2012 and increased during the
third quarter of the year as geo-political tensions
drove crude markets. As prices eased during the
fourth quarter with the roll-back of geo-political
tensions and increasing output from OPEC, the
ECPI weakened. Most other prices in the ECPI
remained relatively stable over the period.
The Energy Services Sector Survey (ESSS) 15
The ESSS for the third quarter of 2012 pointed to
a rise in optimism among industry participants.
The Survey results indicated that factors behind
this optimism included the announcement by
the Government of an investment of US$3
billion in the energy sector in fiscal year 2012/13,
the success of the recent bid round and the
expectation of a new bid round in January 2013
(Box 2).
Table 3Production of Selected Energy and Energy-based Commodities
Period
Crude Oil
bbl/d
Natural Gas
mmcf/d
Fertilizers
tonnes
Methanol
tonnes
Jul-12 83,946 4,468 461,823 512,288
Aug-12 81,776 4,382 472,478 495,509
Sep-12 77,288 3,693 390,053 422,318
Oct-12 79,537 3,643 323,190 301,767
Nov-12 78,846 4,048 413,643 441,496
Jul-Nov11 89,495 3,951 2,321,929 2,383,965
Jul-Nov 12 80,279 3,971 2,040,886 2,173,378
Source: Ministry of Energy and Energy Affairs.
13 The Energy Commodity Price Index (ECPI) is a summary measure of the price movements of Trinidad and Tobago’s top ten
energy-based commodity exports. See also Table 4 of the Summary Economic Indicators Bulletin.14 For details on individual commodity prices see Part XIV - International Commodities Markets.15 The ESSS is conducted quarterly by the Energy Chamber. The energy services sector comprises all services contracted along
the process from exploration to end-use of energy that require energy sector-specific skills, knowledge or capabilities,
including the provision of specialist equipment, tools or processes.
Chart 2The Energy Commodity Price Index
(Jan. 2007 = 100)
Source: Central Bank of Trinidad and Tobago. .
0
50
100
150
200
250
I n d e x V a l u e

8/13/2019 Economic Bulletin January 2013
http://slidepdf.com/reader/full/economic-bulletin-january-2013 19/108
ECONOMIC BULLETIN VOLUME XV NO. 1 15
Agriculture
Latest data from the Central Statistical Office
(CSO) show declines in output of some
agricultural products during the first half
of 2012. The production of sweet potato and
cassava declined by 60.2 per cent and 40.0 per
cent, respectively, compared to a year prior.
Adverse weather conditions during the planting
period accounted for much of the declines inroot crops. Declines were also evident in the
production of watermelon (43.9 per cent), sweet
pepper (68.8 per cent) and tomato (42.0 per
cent). Conversely, production of dasheen and
eddoes increased by 27.2 per cent and 46.6 per
cent, respectively (see Table 4). Supplementary
data from the National Agricultural and Marketing
Development Corporation (NAMDEVCO) and
the Trinidad and Tobago Agribusiness Association
(TTABA) suggest that there has been an increase in
imports of agricultural products to offset declines
in the availability of local produce (see Box 3 onthe Food Import Bill).
BOX 2: DEVELOPMENTS IN THE ENERGY INDUSTRY IN THE SECOND H ALF OF 2012/E ARLY 2013
• Coordinated maintenance - Trinidad and Tobago’s two largest natural gas producers, bpTT and BG T&T
conducted maintenance works on the Kapok and Dolphin platforms respectively. The Kapok platform, off
the South East coast of Trinidad, was taken offline for approximately 50 days from September 3rd while
the Dolphin platform was taken down on September 18th for about five weeks. Given the shortfall of gas
that ensued, several companies on the Point Lisas Estate also took the opportunity to perform maintenance
works including Phoenix Park Gas Processors Limited, Yara Trinidad Limited, PCS Nitrogen Trinidad Limited,
Methanex Trinidad and Methanol Holdings Trinidad Limited.
• The Ministry of Energy closed a deepwater bid round in early September 2012. A total of 12 bids were
received on 5 out of the 6 blocks, which had been put out for auction. In early December, the Ministry
revealed that BHP Billiton was the successful bidder on four of the five blocks. The fifth block was notawarded.
• In mid November, bpTT announced the discovery of 1 trillion cubic feet (tcf) of gas in its Savonette field
off Trinidad’s south east coast. This find doubled the estimated volume of gas in the field to 2 tcf.
• The Prime Minister announced investment in the energy sector of some $20 billion in medium-term.
The Government indicated that BHP Billiton will expend between $3.7 billion and $6.4 billion on its four
newly awarded blocks. In addition, Government has awarded the licenses of Trinmar and the North Marine
block to state-owned Petrotrin and expects the latter to invest $7 billion in its newly licensed acreages. Thirdly,
Mitsubishi of Japan together with Neal and Massy will invest $5.4 billion in a methanol-to-petrochemicals
project. The facility will be located at the Union Estate in La Brea and construction is due to commence in
2013.
• The Prime Minister commissioned the NGC Cove Estate Gas Receiving Facility in Tobago in mid January
2013. The facility will receive natural gas from BHP Billiton’s Angostura field via a 12-inch pipeline, which
will be fed to the neighbouring Cove Estate T&TEC Power Plant which is currently diesel-powered.
• The Government launched the first of its 2013 bid rounds at the Trinidad and Tobago Energy Conference
in late January 2013. A bid round will be open from February 1st to June 14th, 2013 and a total of three
blocks will be put up for bid.

8/13/2019 Economic Bulletin January 2013
http://slidepdf.com/reader/full/economic-bulletin-january-2013 20/108
ECONOMIC BULLETIN VOLUME XV NO. 1 16
Table 4Production of Selected Commodities (Trinidad only)
Commodity Jan-Jun 2012 Jan-Jun 2011 Year-on-Year PerCent Change)
LOCAL
Root Crops
Sweet Potato (kg) 232.6 583.8 (60.2)
Cassava (kg) 1,282.6 2,139.4 (40.0)
Dasheen (kg) 1,950.5 1,533.5 27.2
Eddoes (kg) 1,065.9 727.3 46.6
Leafy Vegetables
Dasheen Bush 110.9 206.1 (46.2)
Vegetables
Tomato(kg) 549.1 946.1 (42.0)
Cucumber(kg) 671.2 681.2 (1.5)
Sweet Pepper(kg) 84.7 271.8 (68.8)
Fruits
Watermelon(kg) 372.9 664.4 (43.9)
Source: The Central Statistical Office of Trinidad and Tobago.
8/13/2019 Economic Bulletin January 2013
http://slidepdf.com/reader/full/economic-bulletin-january-2013 21/108
ECONOMIC BULLETIN VOLUME XV NO. 1 17
BOX 3: FOOD IMPORT BILL
Table B1Food Import Composition
2011
(TT$)
Proportion
of Total FoodImport Values
2011
(Kgs)
Proportion
of Total FoodImport Volumes
00 Live Animals Excl. Div. 03 1,923,852 0.3 98,655 0.0
01 Meat, Meat Preparations 590,609,810 12.6 93,364,866 14.1
02 Dairy Products And Birds' Eggs 680,386,117 14.5 29,604,832 4.5
03 Fish, Fish Preparations 229,911,661 4.9 10,235,589 1.5
04 Cereal, Cereal Preparations 760,222,532 16.2 181,927,588 27.5
05 Vegetables And Fruits 847,023,649 18.0 119,948,372 18.1
06 Sugar, Sugar Preps. And Honey 478,915,135 10.2 107,701,527 16.3
07 Coffee, Tea, Cocoa, Spices 173,599,576 3.7 6,991,347 1.1
08 Feeding Stuff For Animals 330,756,155 7.0 90,008,007 13.6
09 Misc. Food Preparations 594,565,728 12.7 21,235,319 3.2
Total 4,697,914,215 100.0 661,116,102 100.0
Source: The Central Statistical Office of Trinidad and Tobago.
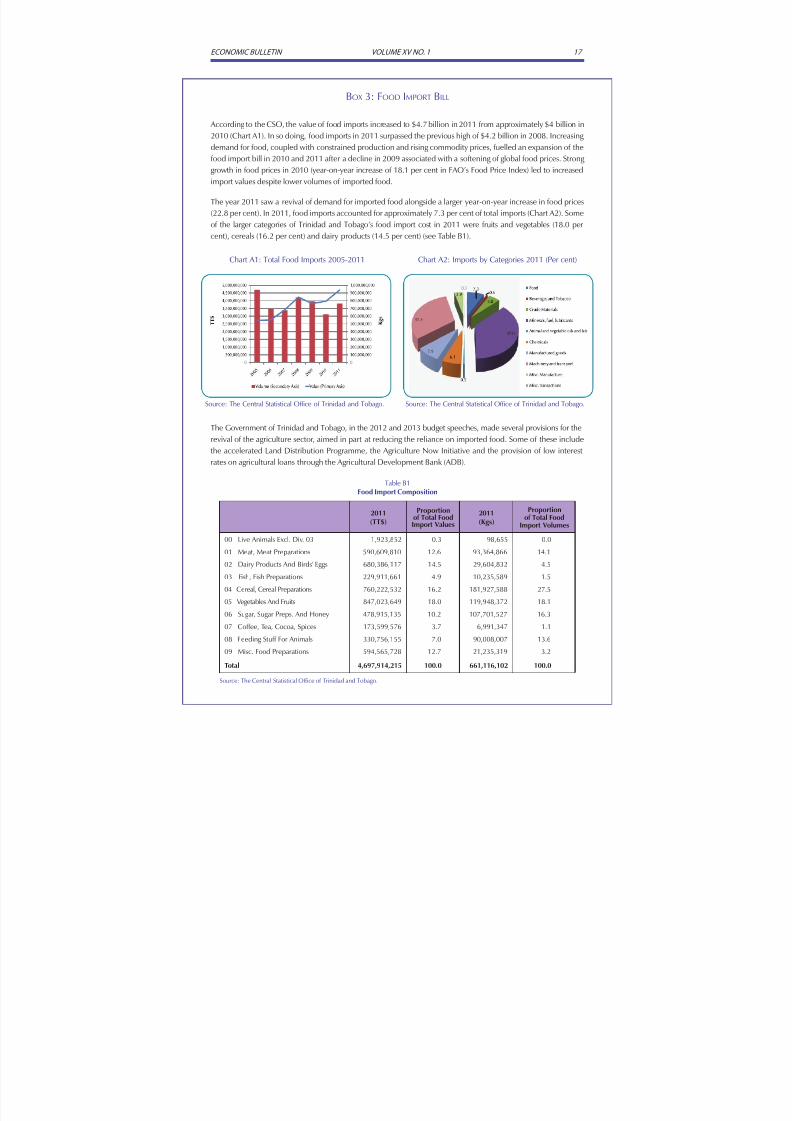
According to the CSO, the value of food imports increased to $4.7 billion in 2011 from approximately $4 billion in
2010 (Chart A1). In so doing, food imports in 2011 surpassed the previous high of $4.2 billion in 2008. Increasing
demand for food, coupled with constrained production and rising commodity prices, fuelled an expansion of the
food import bill in 2010 and 2011 after a decline in 2009 associated with a softening of global food prices. Strong
growth in food prices in 2010 (year-on-year increase of 18.1 per cent in FAO’s Food Price Index) led to increased
import values despite lower volumes of imported food.
The year 2011 saw a revival of demand for imported food alongside a larger year-on-year increase in food prices
(22.8 per cent). In 2011, food imports accounted for approximately 7.3 per cent of total imports (Chart A2). Some
of the larger categories of Trinidad and Tobago’s food import cost in 2011 were fruits and vegetables (18.0 per
cent), cereals (16.2 per cent) and dairy products (14.5 per cent) (see Table B1).
Chart A1: Total Food Imports 2005-2011
Source: The Central Statistical Office of Trinidad and Tobago.
The Government of Trinidad and Tobago, in the 2012 and 2013 budget speeches, made several provisions for the
revival of the agriculture sector, aimed in part at reducing the reliance on imported food. Some of these include
the accelerated Land Distribution Programme, the Agriculture Now Initiative and the provision of low interest
rates on agricultural loans through the Agricultural Development Bank (ADB).
Chart A2: Imports by Categories 2011 (Per cent)
Source: The Central Statistical Office of Trinidad and Tobago.

8/13/2019 Economic Bulletin January 2013
http://slidepdf.com/reader/full/economic-bulletin-january-2013 22/108
8 11.O N V X E M U LO V N I T E LLU B C I M O N O C E
PART VII - LABOUR MARKET
There was a small increase in the unemployment
rate in the first quarter of 2012 to 5.4 per centof the labour force. This compares with 4.2 per
cent at the end of 2011 when the Government
launched a fresh drive to employ unskilled
labourers in several lower income communities.
Increased numbers of unemployed persons
within the construction sector, as well as the
community, social and personal services sectors
helped push the rate upwards at the start of 2012.
The construction sector was affected in the first
quarter by the strike at a major cement company.
Data from the Ministry of Labour and Small
and Micro Enterprise Development (MLSMED)
suggest that there may have been a slowdown
in the pace of job losses over the rest of 2012. A
total of 612 retrenchment notices were filed with
the MLSMED during April to December 2012,
down from 1,070 notices in the same period a
year before. Most of these notices were in the
Distribution, Petroleum, Finance and Personal
Services sectors.
There was also evidence of a rise in man hours
worked. The Index of Hours Worked increased
by 1.5 per cent (year-on-year) in the third quarter
of 2012. There was a 22.8 per cent increase in
hours worked in exploration of oil and gas as oil
companies continued a heightened search for
hydrocarbon deposits. Moreover there were
substantial increases in the electricity (20.1 per
cent) and water (39.7 per cent) sub-indices.
Most other sub-indices recorded small declines
(Appendix Table 3A).
Productivity
The Index of Domestic Production declined by
10.0 per cent (year-on-year) in the third quarter
of 2012. Leading this decline was a 23.7 per cent
drop in the assembly type and related products
sub-index, primarily reflecting lower output ofiron and steel products. Similarly, the 22.4 per
cent fall in the gas refining sub-sector resulted
from significant declines in the output of natural
gas liquids. Several other energy sector sub-
indices also declined, including petrochemicals
(10.9 per cent) and exploration of oil and gas (4.2
per cent).
The rise in hours worked alongside the decline
in production resulted in a fall in measured
productivity. The Index of Productivity is
calculated as the Index of Domestic Production
divided by the Index of Man Hours Worked
(Chart 3 and Appendix Table 3B). The fall in the
index of 11.3 per cent compared to the same
period a year earlier was comprised of declines
within oil and natural gas refining (9.8 per cent),
exploration and production (21.9 per cent) and
petrochemicals (3.3 per cent). Other sectors
witnessing declines in productivity included
assembly type and related products (-15.8 percent) and food processing (-5.1 per cent).
Chart 3Index of Productivity
(Year-on-Year Per cent Change)
Source: The Central Statistical Office of Trinidad and Tobago o.
8/13/2019 Economic Bulletin January 2013
http://slidepdf.com/reader/full/economic-bulletin-january-2013 23/108
9 11.O N V X E M U LO V N I T E LLU B C I M O N O C E
Inflationary pressures eased during the second
half of 2012. Headline inflation declined from
12.6 per cent (year-on-year) in May 2012 to 7.7
per cent in September 2012. Thereafter, the rate
climbed to 9.4 per cent in the following month
and settled at 7.2 per cent in December 2012.
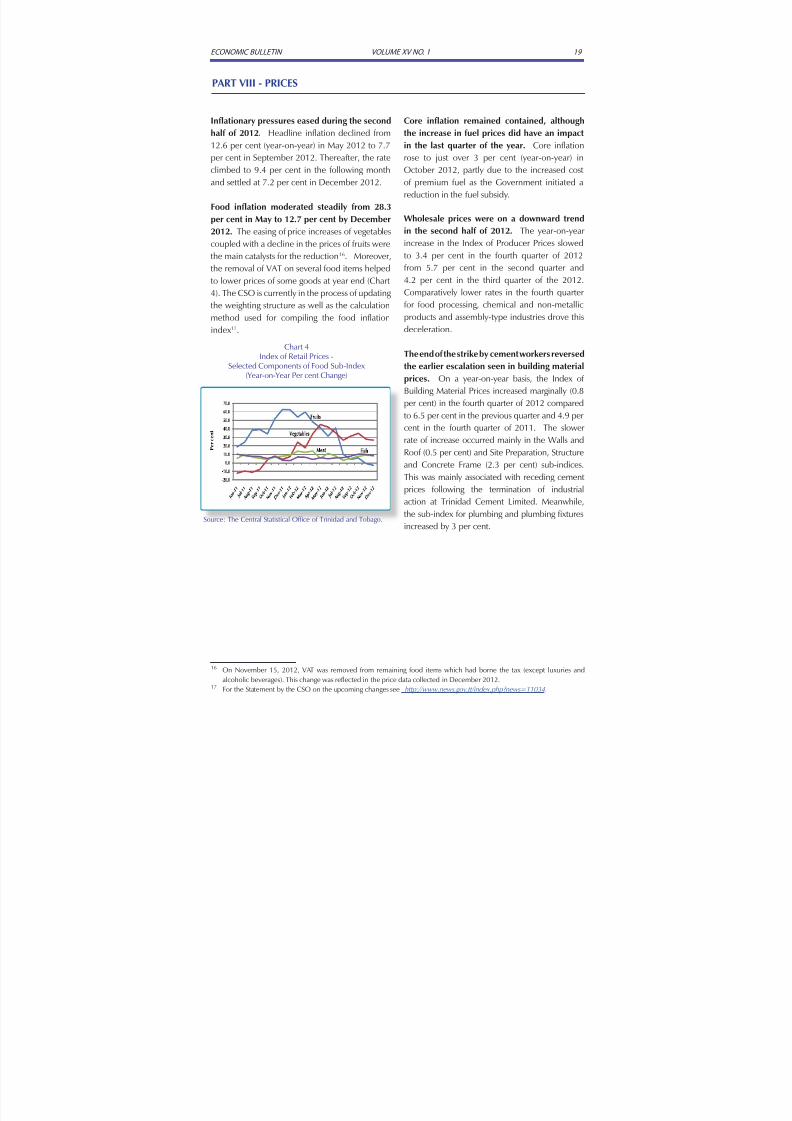
Food inflation moderated steadily from 28.3
per cent in May to 12.7 per cent by December
2012. The easing of price increases of vegetables
coupled with a decline in the prices of fruits were
the main catalysts for the reduction16
. Moreover,the removal of VAT on several food items helped
to lower prices of some goods at year end (Chart
4). The CSO is currently in the process of updating
the weighting structure as well as the calculation
method used for compiling the food inflation
index17.
PART VIII - PRICES
16 On November 15, 2012, VAT was removed from remaining food items which had borne the tax (except luxuries and
alcoholic beverages). This change was reflected in the price data collected in December 2012.17 For the Statement by the CSO on the upcoming changes see http://www.news.gov.tt/index.php?news=11034.
Core inflation remained contained, although
the increase in fuel prices did have an impact
in the last quarter of the year. Core inflation
rose to just over 3 per cent (year-on-year) in
October 2012, partly due to the increased cost
of premium fuel as the Government initiated a
reduction in the fuel subsidy.
Wholesale prices were on a downward trend
in the second half of 2012. The year-on-year
increase in the Index of Producer Prices slowed
to 3.4 per cent in the fourth quarter of 2012from 5.7 per cent in the second quarter and
4.2 per cent in the third quarter of the 2012.
Comparatively lower rates in the fourth quarter
for food processing, chemical and non-metallic
products and assembly-type industries drove this
deceleration.
The end of the strike by cement workers reversed
the earlier escalation seen in building material
prices. On a year-on-year basis, the Index of
Building Material Prices increased marginally (0.8per cent) in the fourth quarter of 2012 compared
to 6.5 per cent in the previous quarter and 4.9 per
cent in the fourth quarter of 2011. The slower
rate of increase occurred mainly in the Walls and
Roof (0.5 per cent) and Site Preparation, Structure
and Concrete Frame (2.3 per cent) sub-indices.
This was mainly associated with receding cement
prices following the termination of industrial
action at Trinidad Cement Limited. Meanwhile,
the sub-index for plumbing and plumbing fixtures
increased by 3 per cent.
Chart 4Index of Retail Prices -
Selected Components of Food Sub-Index(Year-on-Year Per cent Change)
Source: The Central Statistical Office of Trinidad and Tobago.

8/13/2019 Economic Bulletin January 2013
http://slidepdf.com/reader/full/economic-bulletin-january-2013 24/108
ECONOMIC BULLETIN VOLUME XV NO. 1 20
PART IX - CENTRAL GOVERNMENT FISCAL OPERATIONS
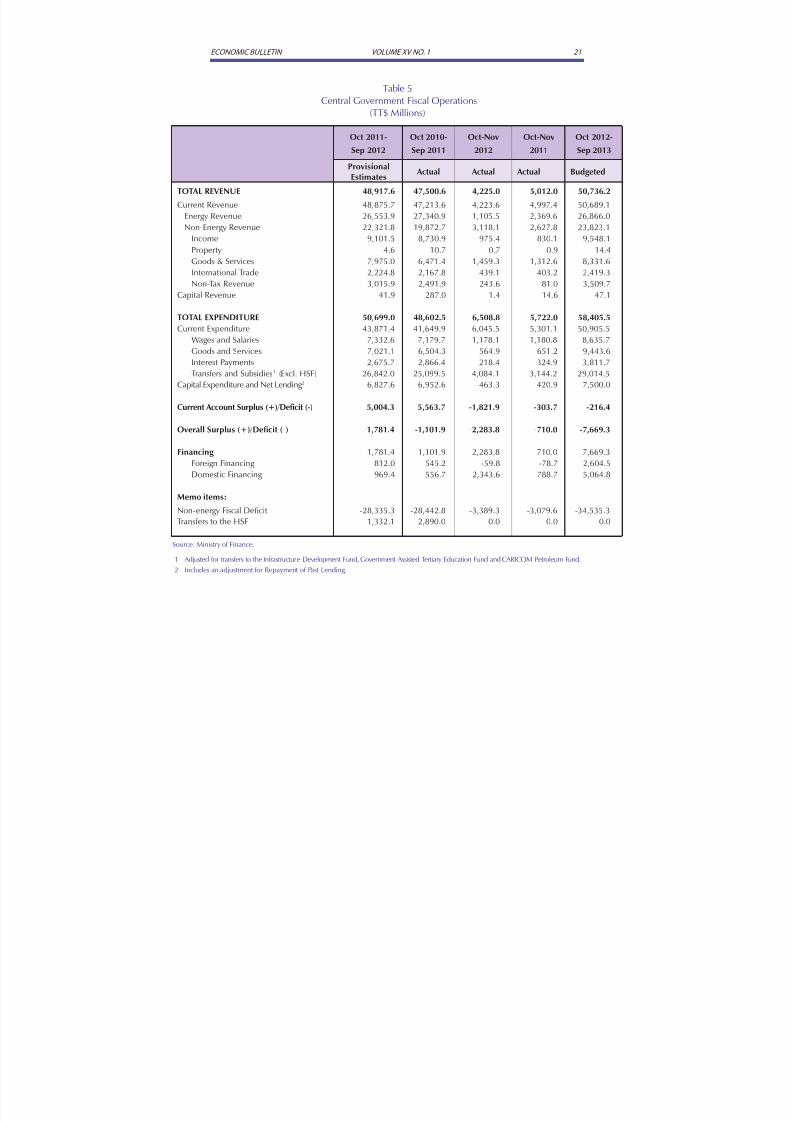
The fiscal accounts recorded a deficit of $1.8billion18 in fiscal year 2011/12 (October to
September), in line with the government’s
expansionary fiscal stance. This deficit was larger
when compared with the deficit of $1.1 billion
in the previous fiscal year, due to a combination
of lower energy revenues and higher spending
(Table 5). Higher than budgeted crude oil prices
enabled the government to transfer $1,332.1
million into the Heritage and Stabilization Fund
(HSF)19.
Preliminary estimates point to a deficit of $2.3
billion in the first two months of FY 2012/13,
compared with a deficit of $710 million in
October-November 2011. Energy revenue
collections declined by over 50 per cent in
the October to November period of 2012, in
comparison to the same period one year earlier,
as a result of lower crude oil prices and production
levels and perhaps the timing of tax payments.
Crude oil prices averaged US$88.10 per barrel(WTI) during the first two months of fiscal year
2013, down from an average of US$91.80 per
barrel (WTI) in the same period one year earlier
while crude oil production slowed to 79,192
barrels per day (bpd) from 87, 475 bpd.
Meanwhile, non-energy revenue was 18.7
per cent higher, mainly on account of non-
tax collections arising from greater profits
recorded by state enterprises. Non-tax revenues
amounted to $243.6 million for the first twomonths of fiscal year 2013, when compared to
18 The overall fiscal balance reported by the Ministry of Finance (MOF) and the Central Bank of Trinidad and Tobago (CBTT)
differs on account of the treatment of transfers to the Heritage and Stabilization (HSF). While the MOF records transfers to
the HSF as part of total expenditure the CBTT treats it as a movement of funds between government accounts. As a result
CBTT total expenditure is lower and the overall balance is consequently higher when compared with the Ministry of Finance.
For fiscal year 2011/2012 the overall balance as stated by the MOF was a deficit of $3,113.5 million inclusive of transfers tothe HSF of $1,332.1 million. However, CBTT recorded a deficit of $1,781.4 million as the HSF balance was excluded from
expenditure. (Refer to Box 3 in the January 2012 Economic Bulletin available on the Central Bank of Trinidad and Tobago’s
website).19 The Heritage and Stabilisation Fund Act. No.6 of 200, states that at least 60 per cent of the excess between actual and
budgeted energy revenues must be placed in the HSF.
$81 million for the similar period of fiscal year2012. Additionally, increases in tax payments
from individuals, international trade and goods
and services in the form of value added tax
(VAT) receipts, boosted non-energy revenue.
The removal of VAT on all food items with the
exception of luxury goods and alcohol came into
effect on November 15, 2012; the Ministry of
Finance estimates that the measure could lower
government revenues over the fiscal year by
around $400 million.
Central Government expenditure increased
by 13.8 per cent to reach $6.5 billion as both
recurrent and capital expenditures trended
upward. The rise in recurrent expenditure
was mainly on account of the $1 billion rise in
transfers and subsidies. There were declines in
the other categories of recurrent expenditure
which included goods and services, and interest
payments (due to the maturing of domestic
bonds) while expenditure on wages and salariesremained at around $1.2 billion.
The pace of capital spending has accelerated.
Expenditure related to the public sector
investment programmed reached $463.3
million, 10 per cent more than the amount
recorded one year earlier. Work continues
on some of the major capital projects which
include the Accelerated Housing Programme,
the construction and rehabilitation of roads and
bridges and the Early Childhood, Primary andSecondary Modernization Programme.
8/13/2019 Economic Bulletin January 2013
http://slidepdf.com/reader/full/economic-bulletin-january-2013 25/108
ECONOMIC BULLETIN VOLUME XV NO. 1 21
Table 5 Central Government Fiscal Operations
(TT$ Millions)
Oct 2011-
Sep 2012
Oct 2010-
Sep 2011
Oct-Nov
2012
Oct-Nov
2011
Oct 2012-
Sep 2013
ProvisionalEstimates
Actual Actual Actual Budgeted
TOTAL REVENUE 48,917.6 47,500.6 4,225.0 5,012.0 50,736.2
Current Revenue 48,875.7 47,213.6 4,223.6 4,997.4 50,689.1
Energy Revenue 26,553.9 27,340.9 1,105.5 2,369.6 26,866.0
Non-Energy Revenue 22,321.8 19,872.7 3,118.1 2,627.8 23,823.1
Income 9,101.5 8,730.9 975.4 830.1 9,548.1
Property 4.6 10.7 0.7 0.9 14.4
Goods & Services 7,975.0 6,471.4 1,459.3 1,312.6 8,331.6 International Trade 2,224.8 2,167.8 439.1 403.2 2,419.3
Non-Tax Revenue 3,015.9 2,491.9 243.6 81.0 3,509.7
Capital Revenue 41.9 287.0 1.4 14.6 47.1
TOTAL EXPENDITURE 50,699.0 48,602.5 6,508.8 5,722.0 58,405.5
Current Expenditure 43,871.4 41,649.9 6,045.5 5,301.1 50,905.5
Wages and Salaries 7,332.6 7,179.7 1,178.1 1,180.8 8,635.7
Goods and Services 7,021.1 6,504.3 564.9 651.2 9,443.6
Interest Payments 2,675.7 2,866.4 218.4 324.9 3,811.7
Transfers and Subsidies1 (Excl. HSF) 26,842.0 25,099.5 4,084.1 3,144.2 29,014.5
Capital Expenditure and Net Lending 2 6,827.6 6,952.6 463.3 420.9 7,500.0
Current Account Surplus (+)/Deficit (-) 5,004.3 5,563.7 -1,821.9 -303.7 -216.4
Overall Surplus (+)/Deficit (-) -1,781.4 -1,101.9 -2,283.8 -710.0 -7,669.3
Financing 1,781.4 1,101.9 2,283.8 710.0 7,669.3
Foreign Financing 812.0 545.2 -59.8 -78.7 2,604.5
Domestic Financing 969.4 556.7 2,343.6 788.7 5,064.8
Memo items:
Non-energy Fiscal Deficit -28,335.3 -28,442.8 -3,389.3 -3,079.6 -34,535.3
Transfers to the HSF 1,332.1 2,890.0 0.0 0.0 0.0
Source: Ministry of Finance.
1 Adjusted for transfers to the Infrastructure Development Fund, Government Assisted Tertiary Education Fund and CARICOM Petroleum Fund.
2 Includes an adjustment for Repayment of Past Lending.

8/13/2019 Economic Bulletin January 2013
http://slidepdf.com/reader/full/economic-bulletin-january-2013 26/108
ECONOMIC BULLETIN VOLUME XV NO. 1 22
PART X - PUBLIC SECTOR DEBT
Total public sector debt is estimated to have
increased marginally during the first two months
of FY 2012/13. Preliminary data show a 0.4 per
cent increase in the debt stock from $91.3 billion
at the end of September 2012 to $91.8 billion at
the end of November 2012 (Table 6), bringing the
estimated debt to GDP ratio to 46.7 per cent.
The small increase in public debt outstanding
was mainly on account of new contingent
liabilities. In October 2012, the Government
guaranteed a $213 million fixed-rate domesticbond issued by the Urban Development
Corporation of Trinidad and Tobago (UDECOTT).
Two loans amounting to US$32 million were also
contracted for improving the communications
system for the Police Service but disbursement
on the facilities have not yet commenced.
Disbursements from other external loan
arrangements amounted to US$22.6 million
while principal repayments were recorded at
US$13.6 million. As a result, the external debt
outstanding increased from US$1,858.8 million
to US$1,867.8 million at the end of November
2012 (Appendix Table 16).
The CLICO Investment Fund (CIF) was launched
on November 1, 2012, representing the final
phase of the settlement of CLICO liabilities
(Box 4). In January 2012, the Government began
issuing zero-coupon bonds to depositors whohad investments in CLICO greater than $75,000.
Policyholders had the option to exchange their
bonds with maturities of 11-20 years for shares
in the CIF until the end of December 2012. The
settlement to depositors of the Hindu Credit
Union (HCU) is expected to take place over the
course of the current fiscal year.
Table 6Total Public Debt
September 2012 - November 2012
Sep-12 p Nov-12e
(In TT$ Millions)
TOTAL PUBLIC DEBT 91,328 91,784
CENTRAL GOV'T DOMESTIC DEBT 53,453 53,638
Bonds/Notes 33,096 33,011
Treasury Bills 13,930 14,200
Treasury Notes 5,000 5,000
Debt Management Bills 800 800Bolts & Leases 536 536
Other1
91 91
EXTERNAL DEBT 12,424 12,482
CONTINGENT DEBT 25,451 25,664
Per cent of GDP
Total Public Debt 59.5 59.8
Total Public Debt (excluding OMOs) 46.6 46.7
Central Government Domestic Debt (excluding OMOs) 22.0 21.9
External Debt 8.1 8.1
Contingent Liabilities 16.6 16.7
Memo:
Nominal GDP (Calendar Year 2012) 153,588 153,588
Source: Ministry of Finance.
p Provisional.e Estimate.1 Consists of the outstanding balances on tax-free saving bonds, public sector arrears and Central Bank fixed-rate
bonds.
8/13/2019 Economic Bulletin January 2013
http://slidepdf.com/reader/full/economic-bulletin-january-2013 27/108
ECONOMIC BULLETIN VOLUME XV NO. 1 23
1 The CL Financial Group operated in over 32 countries. Within the Caribbean, the group had subsidiaries in The Bahamas,
Belize, Guyana, Suriname, Barbados and Trinidad and Tobago, with the largest being in Barbados (estimated at US$500M).2
International Monetary Fund, 2010. Trinidad and Tobago Staff Report for the 2010 Article IV Consultation ....3 Public debt outstanding excludes Treasury bills and notes issued for Open Market Operations (OMOs).
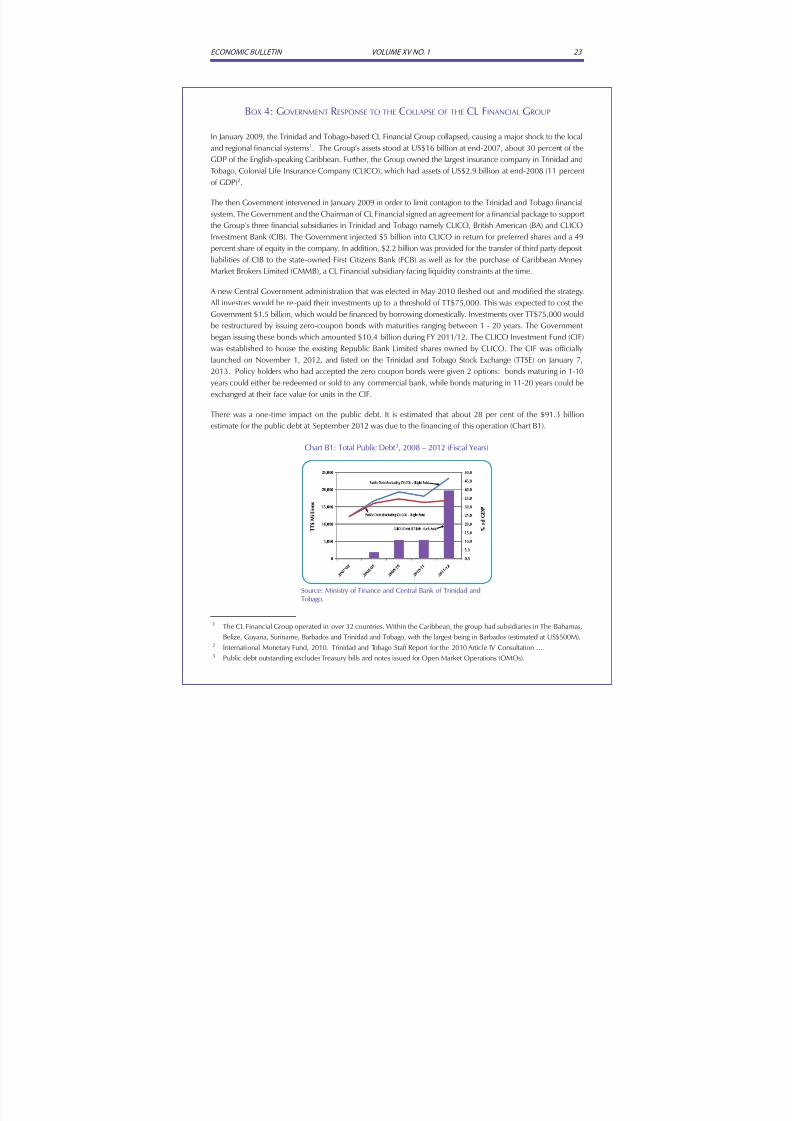
BOX 4: GOVERNMENT RESPONSE TO THE COLLAPSE OF THE CL FINANCIAL GROUP
In January 2009, the Trinidad and Tobago-based CL Financial Group collapsed, causing a major shock to the local
and regional financial systems1. The Group’s assets stood at US$16 billion at end-2007, about 30 percent of the
GDP of the English-speaking Caribbean. Further, the Group owned the largest insurance company in Trinidad and
Tobago, Colonial Life Insurance Company (CLICO), which had assets of US$2.9 billion at end-2008 (11 percent
of GDP)2.
The then Government intervened in January 2009 in order to limit contagion to the Trinidad and Tobago financial
system. The Government and the Chairman of CL Financial signed an agreement for a financial package to support
the Group’s three financial subsidiaries in Trinidad and Tobago namely CLICO, British American (BA) and CLICO
Investment Bank (CIB). The Government injected $5 billion into CLICO in return for preferred shares and a 49
percent share of equity in the company. In addition, $2.2 billion was provided for the transfer of third party deposit
liabilities of CIB to the state-owned First Citizens Bank (FCB) as well as for the purchase of Caribbean MoneyMarket Brokers Limited (CMMB), a CL Financial subsidiary facing liquidity constraints at the time.
A new Central Government administration that was elected in May 2010 fleshed out and modified the strategy.
All investors would be re-paid their investments up to a threshold of TT$75,000. This was expected to cost the
Government $1.5 billion, which would be financed by borrowing domestically. Investments over TT$75,000 would
be restructured by issuing zero-coupon bonds with maturities ranging between 1 - 20 years. The Government
began issuing these bonds which amounted $10.4 billion during FY 2011/12. The CLICO Investment Fund (CIF)
was established to house the existing Republic Bank Limited shares owned by CLICO. The CIF was officially
launched on November 1, 2012, and listed on the Trinidad and Tobago Stock Exchange (TTSE) on January 7,
2013. Policy holders who had accepted the zero coupon bonds were given 2 options: bonds maturing in 1-10
years could either be redeemed or sold to any commercial bank, while bonds maturing in 11-20 years could be
exchanged at their face value for units in the CIF.
There was a one-time impact on the public debt. It is estimated that about 28 per cent of the $91.3 billion
estimate for the public debt at September 2012 was due to the financing of this operation (Chart B1).
Chart B1: Total Public Debt 3, 2008 – 2012 (Fiscal Years)
Source: Ministry of Finance and Central Bank of Trinidad andTobago.
8/13/2019 Economic Bulletin January 2013
http://slidepdf.com/reader/full/economic-bulletin-january-2013 28/108
ECONOMIC BULLETIN VOLUME XV NO. 1 24
PART XI - MONEY, CREDIT AND INTEREST RATES
Monetary policy remained accommodative in
the second half of 2012, given that underlyinginflation was well contained. The repo rate was
kept at 3 per cent for fourteen consecutive months
before it was lowered by 25 basis points to 2.75
per cent in September 2012 (see Appendix Table
26). In response, the median prime lending rate
of the commercial banks also declined by 25 basis
points to end the year at 7.50 per cent. The Bank
continued to pursue a liquidity absorption strategy
involving the use of open market operations and
other monetary initiatives including an increase in
commercial banks’ holdings of special deposits at
the Central Bank.
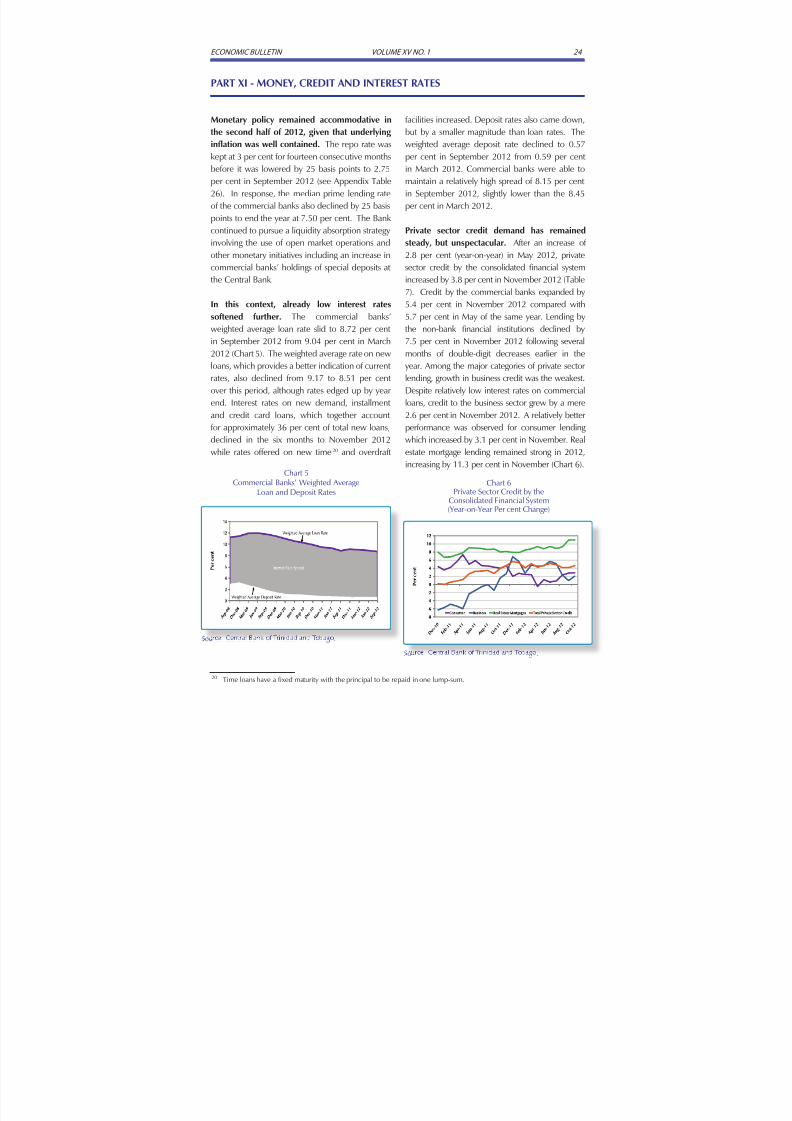
In this context, already low interest rates
softened further. The commercial banks’
weighted average loan rate slid to 8.72 per cent
in September 2012 from 9.04 per cent in March
2012 (Chart 5). The weighted average rate on new
loans, which provides a better indication of current
rates, also declined from 9.17 to 8.51 per cent
over this period, although rates edged up by yearend. Interest rates on new demand, installment
and credit card loans, which together account
for approximately 36 per cent of total new loans,
declined in the six months to November 2012
while rates offered on new time20 and overdraft
20 Time loans have a fixed maturity with the principal to be repaid in one lump-sum.
facilities increased. Deposit rates also came down,
but by a smaller magnitude than loan rates. Theweighted average deposit rate declined to 0.57
per cent in September 2012 from 0.59 per cent
in March 2012. Commercial banks were able to
maintain a relatively high spread of 8.15 per cent
in September 2012, slightly lower than the 8.45
per cent in March 2012.
Private sector credit demand has remained
steady, but unspectacular. After an increase of
2.8 per cent (year-on-year) in May 2012, private
sector credit by the consolidated financial system
increased by 3.8 per cent in November 2012 (Table
7). Credit by the commercial banks expanded by
5.4 per cent in November 2012 compared with
5.7 per cent in May of the same year. Lending by
the non-bank financial institutions declined by
7.5 per cent in November 2012 following several
months of double-digit decreases earlier in the
year. Among the major categories of private sector
lending, growth in business credit was the weakest.
Despite relatively low interest rates on commercialloans, credit to the business sector grew by a mere
2.6 per cent in November 2012. A relatively better
performance was observed for consumer lending
which increased by 3.1 per cent in November. Real
estate mortgage lending remained strong in 2012,
increasing by 11.3 per cent in November (Chart 6).
Source: Central Bank of Trinidad and Tobago.o .
Chart 5Commercial Banks’ Weighted Average
Loan and Deposit RatesChart 6
Private Sector Credit by theConsolidated Financial System(Year-on-Year Per cent Change)
Source: Central Bank of Trinidad and Tobago.o .
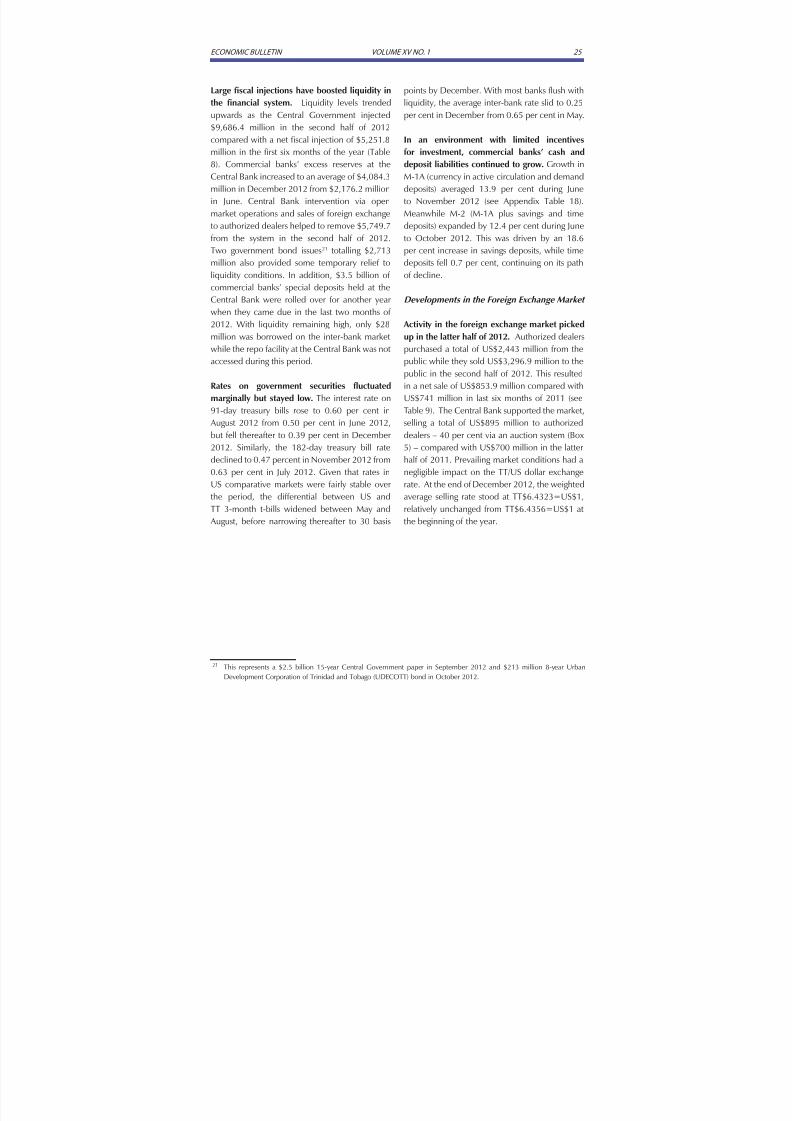
8/13/2019 Economic Bulletin January 2013
http://slidepdf.com/reader/full/economic-bulletin-january-2013 29/108
ECONOMIC BULLETIN VOLUME XV NO. 1 25
Large fiscal injections have boosted liquidity in
the financial system. Liquidity levels trended
upwards as the Central Government injected
$9,686.4 million in the second half of 2012compared with a net fiscal injection of $5,251.8
million in the first six months of the year (Table
8). Commercial banks’ excess reserves at the
Central Bank increased to an average of $4,084.3
million in December 2012 from $2,176.2 million
in June. Central Bank intervention via open
market operations and sales of foreign exchange
to authorized dealers helped to remove $5,749.7
from the system in the second half of 2012.
Two government bond issues21 totalling $2,713
million also provided some temporary relief toliquidity conditions. In addition, $3.5 billion of
commercial banks’ special deposits held at the
Central Bank were rolled over for another year
when they came due in the last two months of
2012. With liquidity remaining high, only $28
million was borrowed on the inter-bank market
while the repo facility at the Central Bank was not
accessed during this period.
Rates on government securities fluctuatedmarginally but stayed low. The interest rate on
91-day treasury bills rose to 0.60 per cent in
August 2012 from 0.50 per cent in June 2012,
but fell thereafter to 0.39 per cent in December
2012. Similarly, the 182-day treasury bill rate
declined to 0.47 percent in November 2012 from
0.63 per cent in July 2012. Given that rates in
US comparative markets were fairly stable over
the period, the differential between US and
TT 3-month t-bills widened between May and
August, before narrowing thereafter to 30 basis
21 This represents a $2.5 billion 15-year Central Government paper in September 2012 and $213 million 8-year Urban
Development Corporation of Trinidad and Tobago (UDECOTT) bond in October 2012.
points by December. With most banks flush with
liquidity, the average inter-bank rate slid to 0.25
per cent in December from 0.65 per cent in May.
In an environment with limited incentives
for investment, commercial banks’ cash and
deposit liabilities continued to grow. Growth in
M-1A (currency in active circulation and demand
deposits) averaged 13.9 per cent during June
to November 2012 (see Appendix Table 18).
Meanwhile M-2 (M-1A plus savings and time
deposits) expanded by 12.4 per cent during June
to October 2012. This was driven by an 18.6
per cent increase in savings deposits, while time
deposits fell 0.7 per cent, continuing on its pathof decline.
Developments in the Foreign Exchange Market
Activity in the foreign exchange market picked
up in the latter half of 2012. Authorized dealers
purchased a total of US$2,443 million from the
public while they sold US$3,296.9 million to the
public in the second half of 2012. This resulted
in a net sale of US$853.9 million compared withUS$741 million in last six months of 2011 (see
Table 9). The Central Bank supported the market,
selling a total of US$895 million to authorized
dealers – 40 per cent via an auction system (Box
5) – compared with US$700 million in the latter
half of 2011. Prevailing market conditions had a
negligible impact on the TT/US dollar exchange
rate. At the end of December 2012, the weighted
average selling rate stood at TT$6.4323=US$1,
relatively unchanged from TT$6.4356=US$1 at
the beginning of the year.

8/13/2019 Economic Bulletin January 2013
http://slidepdf.com/reader/full/economic-bulletin-january-2013 30/108
ECONOMIC BULLETIN VOLUME XV NO. 1 26
In 1993 when Trinidad and Tobago’s foreign exchange market was liberalized, the Central Bank established new
arrangements for the operations of the market including a Code of Conduct, a set of agreed Guidelines1 and
regular sales of foreign exchange to authorized dealers. These sales were on the basis of agreed ratios linked to
the market shares of authorized dealers, the size of their branch networks and their asset bases. This framework
recognized the structural characteristics of the market, and sought to achieve a certain minimum distribution of
foreign exchange throughout the banking system.
While the system has met this objective, one shortcoming was that prices were not sufficiently market determined.
In order to establish more market-based pricing in transactions between the Central Bank and dealers, the Bank
introduced an auction system in May 2012 to be operated alongside the existing intervention mechanism.
The system adopted was a multiple price auction system. Under this arrangement dealers are free to submit more
than one bid at prices they are willing to pay, but could only receive up to 20 per cent of the total foreign exchange
to be auctioned. Bids are satisfied from the highest to the lowest prices until the total amount offered in the auction
is allocated. The agreed Guidelines for the market have been maintained.
The first auction took place on May 31, 2012, and generally one auction has been held in each subsequent month.
There were 9 auctions between May 2012 and mid-January 2013. A total of US$535.0 million or 44 per cent of
the foreign exchange sold by the Bank in this period was through the auction system.
The auction system has not affected the determination of the amount of foreign exchange sold in the market,
nor has it affected the selling price of foreign exchange by dealers to the public. However, there has been a
narrowing of spreads earned by dealers on the auctioned funds compared to those earned on the other CentralBank interventions. The introduction of the auction system has also led to changes in the share of funds received
by some dealers.
The new auction system, as indeed the wider foreign exchange arrangement, remains under constant review with
the Bank making modifications from time to time. So far, there have been some changes to the scheduling of
auctions and to the proportion of funds sold through auctions. The Central Bank, in consultation with the dealers,
is continuing to evaluate the impact of the system and would take appropriate action as needed.
1
These guidelines include arrangements for informing the Central Bank of any extraordinary developments in the market,for adherence to maximum movements in rates over a defined period, and for maximum spreads.
BOX 5: THE FOREIGN EXCHANGE AUCTION S YSTEM
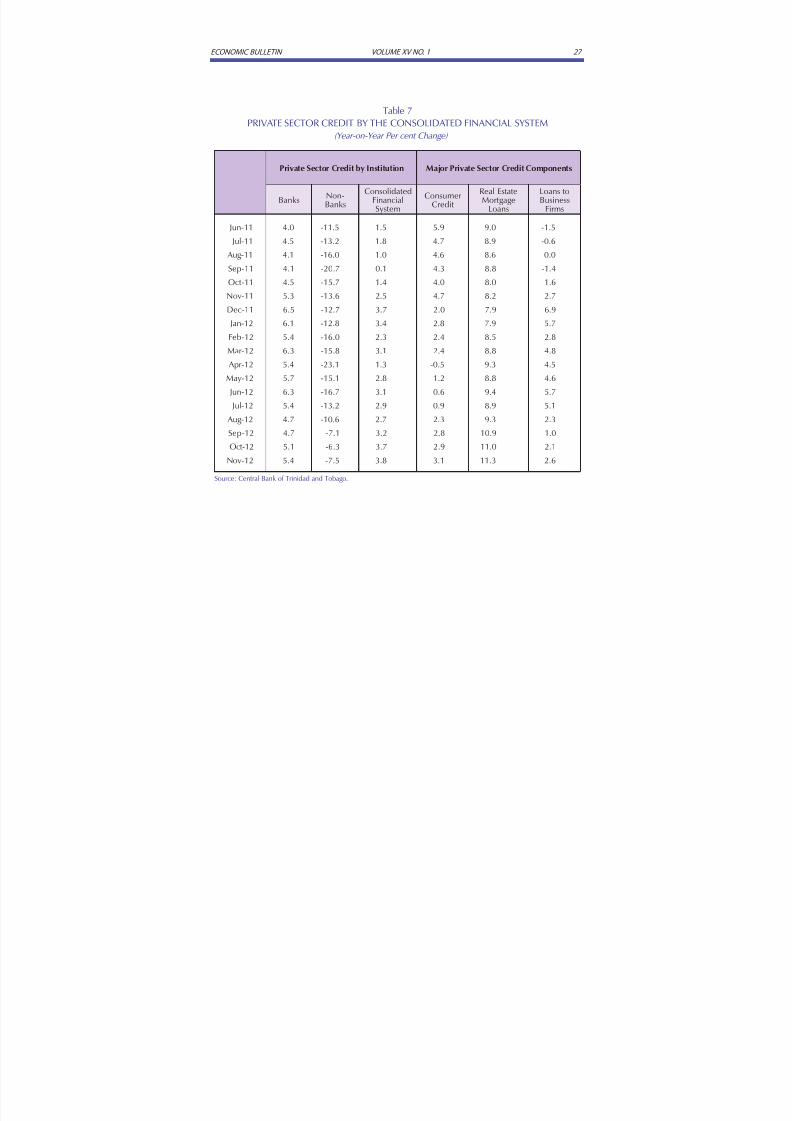
8/13/2019 Economic Bulletin January 2013
http://slidepdf.com/reader/full/economic-bulletin-january-2013 31/108
7 2 1.O N V X E M U LO V N I T E LLU B C I M O N O C E
Table 7PRIVATE SECTOR CREDIT BY THE CONSOLIDATED FINANCIAL SYSTEM
(Year-on-Year Per cent Change)
Private Sector Credit by Institution Major Private Sector Credit Components
Banks Non-
Banks
ConsolidatedFinancialSystem
ConsumerCredit
Real EstateMortgage
Loans
Loans toBusiness
Firms
Jun-11 4.0 -11.5 1.5 5.9 9.0 -1.5
Jul-11 4.5 -13.2 1.8 4.7 8.9 -0.6
Aug-11 4.1 -16.0 1.0 4.6 8.6 0.0
Sep-11 4.1 -20.7 0.1 4.3 8.8 -1.4
Oct-11 4.5 -15.7 1.4 4.0 8.0 1.6
Nov-11 5.3 -13.6 2.5 4.7 8.2 2.7
Dec-11 6.5 -12.7 3.7 2.0 7.9 6.9
Jan-12 6.1 -12.8 3.4 2.8 7.9 5.7
Feb-12 5.4 -16.0 2.3 2.4 8.5 2.8
Mar-12 6.3 -15.8 3.1 2.4 8.8 4.8
Apr-12 5.4 -23.1 1.3 -0.5 9.3 4.5
May-12 5.7 -15.1 2.8 1.2 8.8 4.6
Jun-12 6.3 -16.7 3.1 0.6 9.4 5.7
Jul-12 5.4 -13.2 2.9 0.9 8.9 5.1
Aug-12 4.7 -10.6 2.7 2.3 9.3 2.3
Sep-12 4.7 -7.1 3.2 2.8 10.9 1.0
Oct-12 5.1 -6.3 3.7 2.9 11.0 2.1
Nov-12 5.4 -7.5 3.8 3.1 11.3 2.6
Source: Central Bank of Trinidad and Tobago.

8/13/2019 Economic Bulletin January 2013
http://slidepdf.com/reader/full/economic-bulletin-january-2013 32/108
ECONOMIC BULLETIN VOLUME XV NO. 1 28
Table 8Liquidity Indicators
(TT$ Millions)
NetDomestic
FiscalInjections
NetOMO
CBTTSale of
FX
CentralGov'tBondIssues
Repos(Avg.)
Inter-Bank
Activity(Avg.)
ExcessReserves
(Avg.)
Oct-11 2,521.8 0.0 792.2 0.0 0.0 0.0 4,587.2
Nov-11 69.4 25.0 888.0 1,500.0 0.0 0.0 5,225.3
Dec-11 2,309.8 -25.0 507.4 0.0 0.0 0.0 5,671.7
Jan-12 -575.0 0.0 888.0 0.0 0.0 0.0 4,269.5
Feb-12 1,619.7 0.0 920.0 0.0 0.0 0.0 5,132.5
Mar-12 1,503.3 0.0 698.0 0.0 0.0 0.0 5,609.9 Apr-12 629.3 0.0 666.2 0.0 0.0 0.0 3,419.3
May-12 888.0 236.3 888.5 0.0 0.0 0.0 2,529.9
Jun-12 1,186.6 62.3 1,594.6 0.0 0.0 85.7 2,176.2
Jul-12 1,508.1 367.1 926.0 0.0 0.0 0.6 2,268.3
Aug-12 3,155.2 -590.7 926.4 0.0 0.0 0.0 3,802.1
Sep-12 -2,446.3 195.0 958.4 2,500.0 0.0 0.3 3,850.3
Oct-12 3,096.2 -190.0 987.1 0.0 0.0 0.0 2,769.7
Nov-12 2,865.3 -80.0 1,275.9 0.0 0.0 0.0 3,341.6
Dec-12 1,507.9 260.1 637.4 0.0 0.0 0.4 4,084.3
Source: Central Bank of Trinidad and Tobago.
Table 9Foreign Exchange Market Trading Activity by Authorized Dealers
(US$ Millions)
DatePurchases
from PublicSales to Public Net Sales
Purchasesfrom CBTT
2009 3,808.2 5,637.2 1,828.9 1,899.1
2010 4,043.3 5,536.0 1,492.7 1,550.1
2011 4,755.5 6,186.8 1,431.4 1,475.0
2012 4,859.1 6,713.7 1,854.7 1,785.7
Jul-Dec 2011 2,467.3 3,208.3 741.0 700.0
Jul-Dec 2012 2,443.0 3,296.9 853.9 895.0
Jul-Dec 2012/Jul-Dec2011 Per cent Change
(0.98) 2.8 15.2 27.9
Source: Central Bank of Trinidad and Tobago.
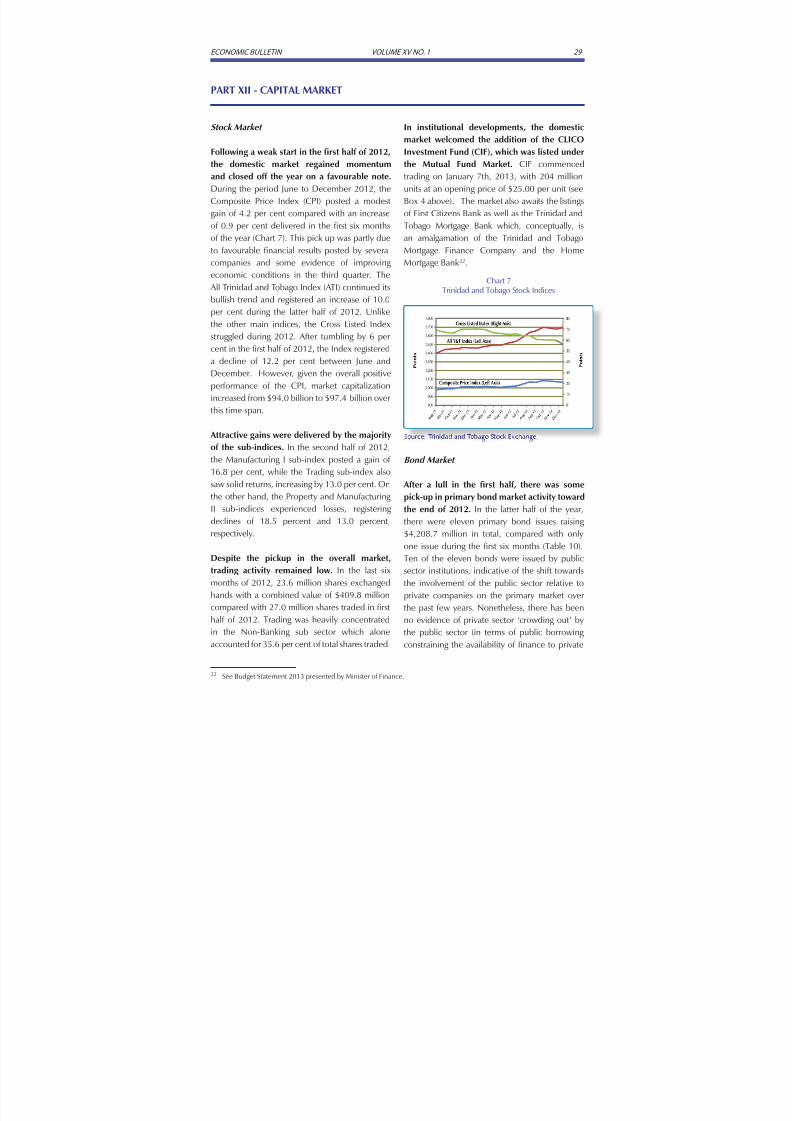
8/13/2019 Economic Bulletin January 2013
http://slidepdf.com/reader/full/economic-bulletin-january-2013 33/108
ECONOMIC BULLETIN VOLUME XV NO. 1 29
Stock Market
Following a weak start in the first half of 2012,
the domestic market regained momentum
and closed off the year on a favourable note.
During the period June to December 2012, the
Composite Price Index (CPI) posted a modest
gain of 4.2 per cent compared with an increase
of 0.9 per cent delivered in the first six months
of the year (Chart 7). This pick up was partly due
to favourable financial results posted by several
companies and some evidence of improvingeconomic conditions in the third quarter. The
All Trinidad and Tobago Index (ATI) continued its
bullish trend and registered an increase of 10.0
per cent during the latter half of 2012. Unlike
the other main indices, the Cross Listed Index
struggled during 2012. After tumbling by 6 per
cent in the first half of 2012, the Index registered
a decline of 12.2 per cent between June and
December. However, given the overall positive
performance of the CPI, market capitalizationincreased from $94.0 billion to $97.4 billion over
this time span.
Attractive gains were delivered by the majority
of the sub-indices. In the second half of 2012,
the Manufacturing I sub-index posted a gain of
16.8 per cent, while the Trading sub-index also
saw solid returns, increasing by 13.0 per cent. On
the other hand, the Property and Manufacturing
II sub-indices experienced losses, registering
declines of 18.5 percent and 13.0 percent,respectively.
Despite the pickup in the overall market,
trading activity remained low. In the last six
months of 2012, 23.6 million shares exchanged
hands with a combined value of $409.8 million
compared with 27.0 million shares traded in first
half of 2012. Trading was heavily concentrated
in the Non-Banking sub sector which alone
accounted for 35.6 per cent of total shares traded.
PART XII - CAPITAL MARKET
In institutional developments, the domesticmarket welcomed the addition of the CLICO
Investment Fund (CIF), which was listed under
the Mutual Fund Market. CIF commenced
trading on January 7th, 2013, with 204 million
units at an opening price of $25.00 per unit (see
Box 4 above). The market also awaits the listings
of First Citizens Bank as well as the Trinidad and
Tobago Mortgage Bank which, conceptually, is
an amalgamation of the Trinidad and Tobago
Mortgage Finance Company and the Home
Mortgage Bank22.
22 See Budget Statement 2013 presented by Minister of Finance.
Chart 7Trinidad and Tobago Stock Indices
Source: Trinidad and Tobago Stock Exchange..
Bond Market
After a lull in the first half, there was some
pick-up in primary bond market activity toward
the end of 2012. In the latter half of the year,
there were eleven primary bond issues raising$4,208.7 million in total, compared with only
one issue during the first six months (Table 10).
Ten of the eleven bonds were issued by public
sector institutions, indicative of the shift towards
the involvement of the public sector relative to
private companies on the primary market over
the past few years. Nonetheless, there has been
no evidence of private sector ‘crowding out’ by
the public sector (in terms of public borrowing
constraining the availability of finance to private
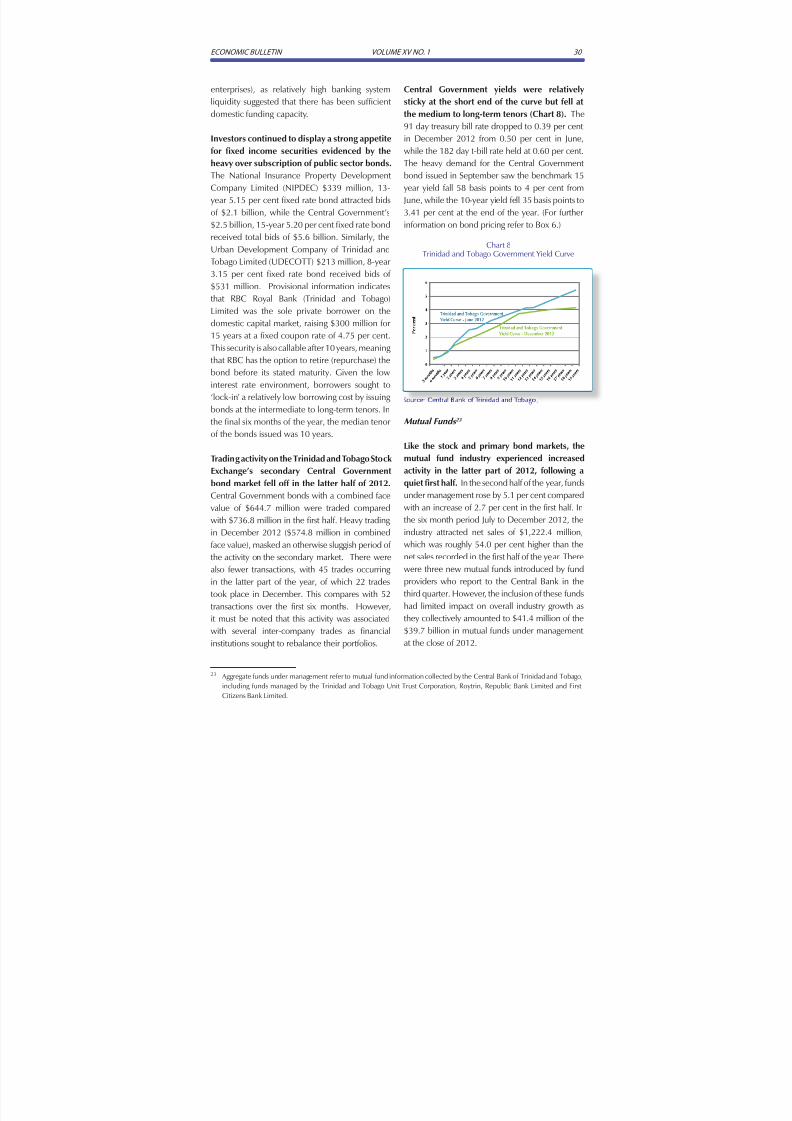
8/13/2019 Economic Bulletin January 2013
http://slidepdf.com/reader/full/economic-bulletin-january-2013 34/108
ECONOMIC BULLETIN VOLUME XV NO. 1 30
enterprises), as relatively high banking system
liquidity suggested that there has been sufficient
domestic funding capacity.
Investors continued to display a strong appetite
for fixed income securities evidenced by the
heavy over subscription of public sector bonds.
The National Insurance Property Development
Company Limited (NIPDEC) $339 million, 13-
year 5.15 per cent fixed rate bond attracted bids
of $2.1 billion, while the Central Government’s
$2.5 billion, 15-year 5.20 per cent fixed rate bond
received total bids of $5.6 billion. Similarly, the
Urban Development Company of Trinidad and
Tobago Limited (UDECOTT) $213 million, 8-year3.15 per cent fixed rate bond received bids of
$531 million. Provisional information indicates
that RBC Royal Bank (Trinidad and Tobago)
Limited was the sole private borrower on the
domestic capital market, raising $300 million for
15 years at a fixed coupon rate of 4.75 per cent.
This security is also callable after 10 years, meaning
that RBC has the option to retire (repurchase) the
bond before its stated maturity. Given the low
interest rate environment, borrowers sought to
‘lock-in’ a relatively low borrowing cost by issuing
bonds at the intermediate to long-term tenors. In
the final six months of the year, the median tenor
of the bonds issued was 10 years.
Trading activity on the Trinidad and Tobago Stock
Exchange’s secondary Central Government
bond market fell off in the latter half of 2012.
Central Government bonds with a combined face
value of $644.7 million were traded compared
with $736.8 million in the first half. Heavy tradingin December 2012 ($574.8 million in combined
face value), masked an otherwise sluggish period of
the activity on the secondary market. There were
also fewer transactions, with 45 trades occurring
in the latter part of the year, of which 22 trades
took place in December. This compares with 52
transactions over the first six months. However,
it must be noted that this activity was associated
with several inter-company trades as financial
institutions sought to rebalance their portfolios.
Central Government yields were relatively
sticky at the short end of the curve but fell at
the medium to long-term tenors (Chart 8). The
91 day treasury bill rate dropped to 0.39 per centin December 2012 from 0.50 per cent in June,
while the 182 day t-bill rate held at 0.60 per cent.
The heavy demand for the Central Government
bond issued in September saw the benchmark 15
year yield fall 58 basis points to 4 per cent from
June, while the 10-year yield fell 35 basis points to
3.41 per cent at the end of the year. (For further
information on bond pricing refer to Box 6.)
Chart 8Trinidad and Tobago Government Yield Curve
Source: Central Bank of Trinidad and Tobago. .
Mutual Funds 23
Like the stock and primary bond markets, the
mutual fund industry experienced increased
activity in the latter part of 2012, following a
quiet first half. In the second half of the year, funds
under management rose by 5.1 per cent compared
with an increase of 2.7 per cent in the first half. In
the six month period July to December 2012, theindustry attracted net sales of $1,222.4 million,
which was roughly 54.0 per cent higher than the
net sales recorded in the first half of the year. There
were three new mutual funds introduced by fund
providers who report to the Central Bank in the
third quarter. However, the inclusion of these funds
had limited impact on overall industry growth as
they collectively amounted to $41.4 million of the
$39.7 billion in mutual funds under management
at the close of 2012.
23 Aggregate funds under management refer to mutual fund information collected by the Central Bank of Trinidad and Tobago,
including funds managed by the Trinidad and Tobago Unit Trust Corporation, Roytrin, Republic Bank Limited and First
Citizens Bank Limited.
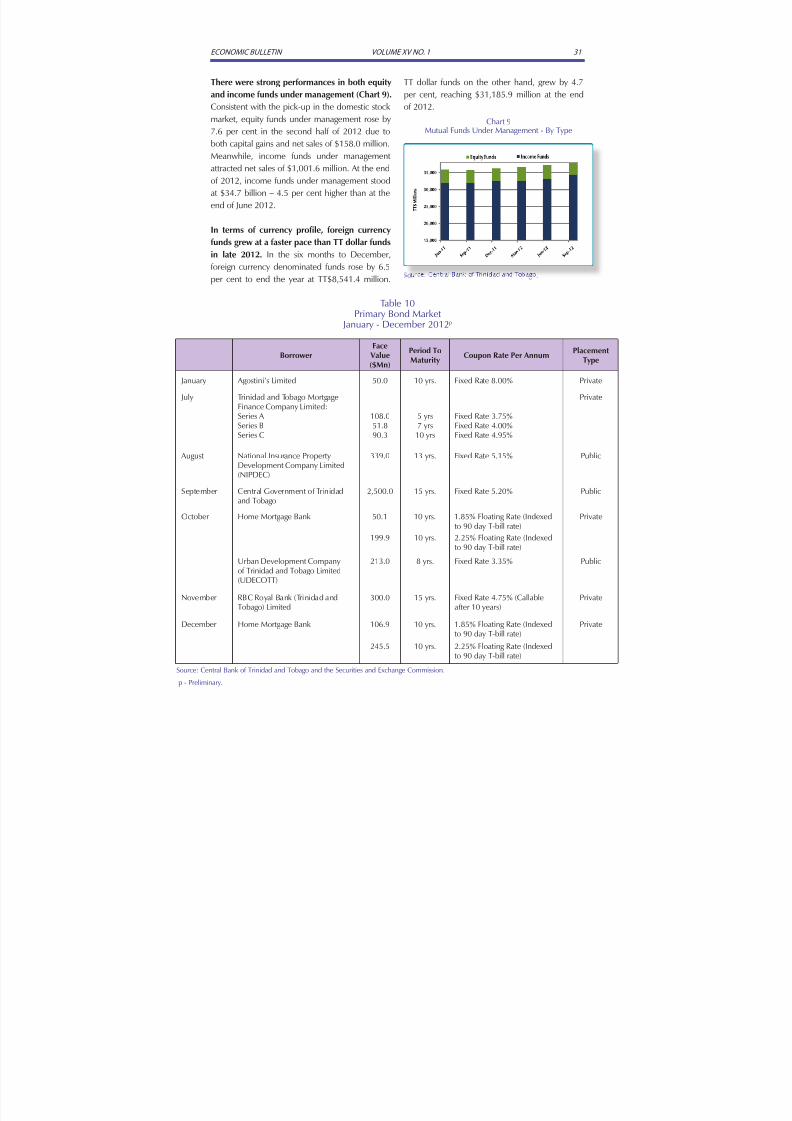
8/13/2019 Economic Bulletin January 2013
http://slidepdf.com/reader/full/economic-bulletin-january-2013 35/108
ECONOMIC BULLETIN VOLUME XV NO. 1 31
There were strong performances in both equity
and income funds under management (Chart 9).
Consistent with the pick-up in the domestic stock
market, equity funds under management rose by
7.6 per cent in the second half of 2012 due toboth capital gains and net sales of $158.0 million.
Meanwhile, income funds under management
attracted net sales of $1,001.6 million. At the end
of 2012, income funds under management stood
at $34.7 billion – 4.5 per cent higher than at the
end of June 2012.
In terms of currency profile, foreign currency
funds grew at a faster pace than TT dollar funds
in late 2012. In the six months to December,
foreign currency denominated funds rose by 6.5
per cent to end the year at TT$8,541.4 million.
Table 10Primary Bond Market
January - December 2012p
BorrowerFace
Value($Mn)
Period ToMaturity
Coupon Rate Per AnnumPlacement
Type
January Agostini’s Limited 50.0 10 yrs. Fixed Rate 8.00% Private
July Trinidad and Tobago MortgageFinance Company Limited:Series ASeries BSeries C
108.051.890.3
5 yrs7 yrs
10 yrs
Fixed Rate 3.75%Fixed Rate 4.00%Fixed Rate 4.95%
Private
August National Insurance PropertyDevelopment Company Limited(NIPDEC)
339.0 13 yrs. Fixed Rate 5.15% Public
September Central Government of Trinidadand Tobago
2,500.0 15 yrs. Fixed Rate 5.20% Public
October Home Mortgage Bank 50.1 10 yrs. 1.85% Floating Rate (Indexedto 90 day T-bill rate) Private
199.9 10 yrs. 2.25% Floating Rate (Indexedto 90 day T-bill rate)
Urban Development Companyof Trinidad and Tobago Limited(UDECOTT)
213.0 8 yrs. Fixed Rate 3.35% Public
November RBC Royal Bank (Trinidad andTobago) Limited
300.0 15 yrs. Fixed Rate 4.75% (Callableafter 10 years)
Private
December Home Mortgage Bank 106.9 10 yrs. 1.85% Floating Rate (Indexedto 90 day T-bill rate)
Private
245.5 10 yrs. 2.25% Floating Rate (Indexedto 90 day T-bill rate)
Source: Central Bank of Trinidad and Tobago and the Securities and Exchange Commission.
p - Preliminary.
TT dollar funds on the other hand, grew by 4.7
per cent, reaching $31,185.9 million at the end
of 2012.
Chart 9
Mutual Funds Under Management - By Type
Source: Central Bank of Trinidad and Tobago.o .
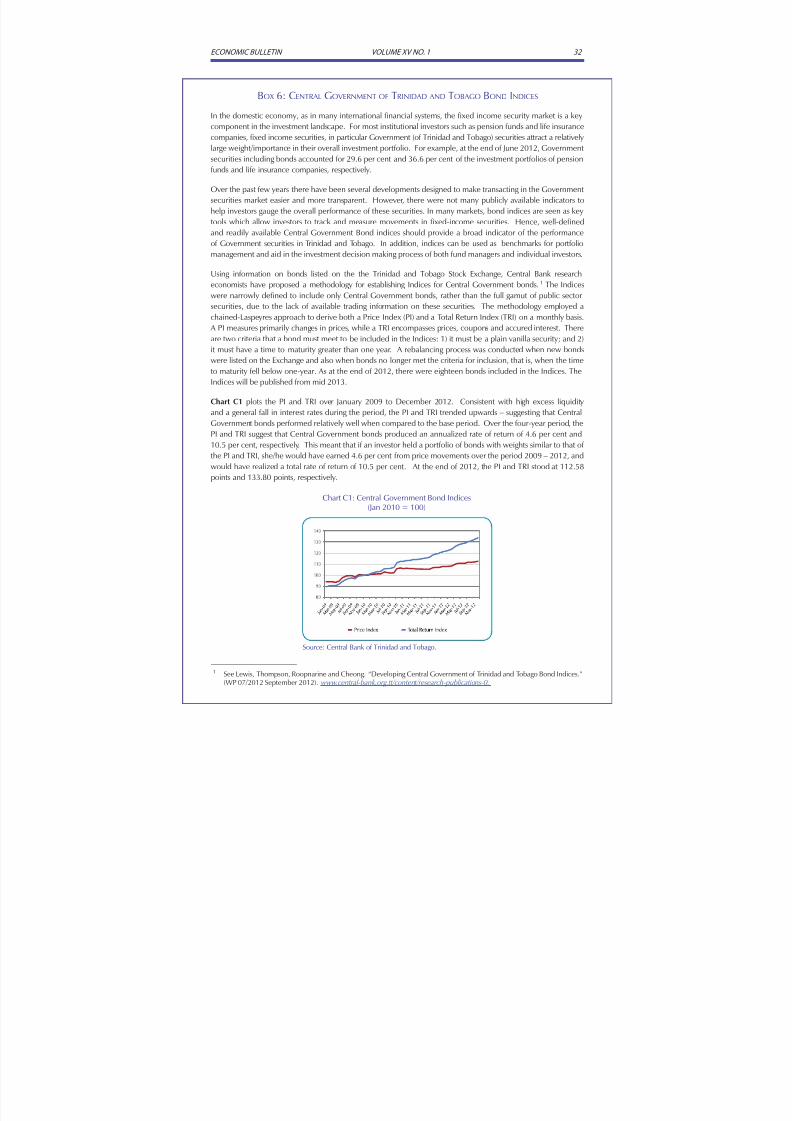
8/13/2019 Economic Bulletin January 2013
http://slidepdf.com/reader/full/economic-bulletin-january-2013 36/108
ECONOMIC BULLETIN VOLUME XV NO. 1 32
1 See Lewis, Thompson, Roopnarine and Cheong. “Developing Central Government of Trinidad and Tobago Bond Indices.”(WP 07/2012 September 2012). www.central-bank.org.tt/content/research-publications-0.
BOX 6: CENTRAL GOVERNMENT OF TRINIDAD AND TOBAGO BOND INDICES
In the domestic economy, as in many international financial systems, the fixed income security market is a key
component in the investment landscape. For most institutional investors such as pension funds and life insurancecompanies, fixed income securities, in particular Government (of Trinidad and Tobago) securities attract a relatively
large weight/importance in their overall investment portfolio. For example, at the end of June 2012, Government
securities including bonds accounted for 29.6 per cent and 36.6 per cent of the investment portfolios of pension
funds and life insurance companies, respectively.
Over the past few years there have been several developments designed to make transacting in the Government
securities market easier and more transparent. However, there were not many publicly available indicators to
help investors gauge the overall performance of these securities. In many markets, bond indices are seen as key
tools which allow investors to track and measure movements in fixed-income securities. Hence, well-defined
and readily available Central Government Bond indices should provide a broad indicator of the performance
of Government securities in Trinidad and Tobago. In addition, indices can be used as benchmarks for portfolio
management and aid in the investment decision making process of both fund managers and individual investors.
Using information on bonds listed on the the Trinidad and Tobago Stock Exchange, Central Bank research
economists have proposed a methodology for establishing Indices for Central Government bonds.1 The Indices
were narrowly defined to include only Central Government bonds, rather than the full gamut of public sector
securities, due to the lack of available trading information on these securities. The methodology employed a
chained-Laspeyres approach to derive both a Price Index (PI) and a Total Return Index (TRI) on a monthly basis.
A PI measures primarily changes in prices, while a TRI encompasses prices, coupons and accured interest. There
are two criteria that a bond must meet to be included in the Indices: 1) it must be a plain vanilla security; and 2)
it must have a time to maturity greater than one year. A rebalancing process was conducted when new bonds
were listed on the Exchange and also when bonds no longer met the criteria for inclusion, that is, when the time
to maturity fell below one-year. As at the end of 2012, there were eighteen bonds included in the Indices. The
Indices will be published from mid 2013.
Chart C1 plots the PI and TRI over January 2009 to December 2012. Consistent with high excess liquidity
and a general fall in interest rates during the period, the PI and TRI trended upwards – suggesting that Central
Government bonds performed relatively well when compared to the base period. Over the four-year period, the
PI and TRI suggest that Central Government bonds produced an annualized rate of return of 4.6 per cent and
10.5 per cent, respectively. This meant that if an investor held a portfolio of bonds with weights similar to that of
the PI and TRI, she/he would have earned 4.6 per cent from price movements over the period 2009 – 2012, and
would have realized a total rate of return of 10.5 per cent. At the end of 2012, the PI and TRI stood at 112.58
points and 133.80 points, respectively.
Chart C1: Central Government Bond Indices(Jan 2010 = 100)
Source: Central Bank of Trinidad and Tobago.

8/13/2019 Economic Bulletin January 2013
http://slidepdf.com/reader/full/economic-bulletin-january-2013 37/108
ECONOMIC BULLETIN VOLUME XV NO. 1 33
In the third quarter of 2012 the external currentaccount is estimated to have recorded a surplus
of $1,799.4 million25 (Table 11). The balance on
the current account worsened in the third quarter
of 2012 compared to the third quarter of 2011,
mostly on account of lower export volumes of
energy and energy related products. Also, the
investment income account registered a higher
net outflow of $1,298.0 million compared with
$898.6 million in the corresponding period of
2011. This higher net outflow was on account of
significantly larger reinvested earnings in foreigndirect investment enterprises – $855.1 million in
the third quarter of 2012 compared with $235.9
million a year earlier. Net current transfers
increased to $26.4 million in the third quarter of
2012, up from $6.7 million in the corresponding
quarter of 201126.
The estimated merchandise trade surplus in
the third quarter of 2012 was similar to that
of the year-earlier period. The third quarter of
2012 was marred by lower export volumes ofpetroleum and lower prices for natural gas. The
volume of petroleum exports in the third quarter
of 2012 (1,881.4 thousand barrels) was just
about one half of volumes in the similar quarter
of 2011 (3,717.3 thousand barrels). At the same
time, average natural gas prices in major regional
markets – including the US, European and Asian
markets – all registered year-on-year declines
in the third quarter of 2012. Meanwhile, the
reduced import of crude oil led to a decline in
the value of energy imports to $946.0 million in
the July to September 2012 period, down from
$1,028.3 million in the similar period of 2011.
24 The Research Department is in the process of reviewing and improving its Balance of Payments Statistics with a move
towards Balance of Payments and International Investment Position Manual (BPM6) (http://www.imf.org/external/pubs/ft/
bop/2007/pdf/bpm6.pdf) reporting . As part of this initiative, a new compilation system for the Survey of Private Investment
was developed starting with data from 2011. Data collected from this survey are used in the compilation of items in both
the current and capital and financial account. Data prior to 2011 will be revised in due course. A comprehensive overview
of these methodological changes will be provided in the 2011 Balance of Payments Report.25 Due to unavailability of trade data from the CSO, imports and exports for the period January 2012 to September 2012,
represent Central Bank estimates based on comparative mirror trade data with the rest of the world, and supplemental
information on domestic activity in the energy sector (Box 7).26 Part of the increase is likely due to more comprehensive reporting, as the number of remittance provider firms surveyed
increased in 2012.27 For a greater discussion on reinvested earnings see Taylor, T., R. Mahabir, V. Jagessar and J. Cotton. “Examining Reinvestment
in Trinidad and Tobago.” Central Bank of Trinidad and Tobago Working Papers (WP 10/2013 January 2013.)28 See Central Bank of Trinidad and Tobago. 2012. Financial Stability Report - December 2012 . Port-of-Spain. Central Bank of
Trinidad and Tobago for further discussion.
PART XIII - BALANCE OF PAYMENTS24
(Data in this section are in US dollars unless otherwise stated)
In the third quarter of 2012, the capital andfinancial account recorded a deficit of $2,198.5
million. Net foreign direct investment inflows rose
from $215.9 million in the third quarter of 2011
to $523.4 million in Q3 2012 largely on account
of greater reinvestments27 by foreign multinational
energy companies. Net foreign direct investments
in the review period were sourced mainly from
North America (Box 8). Portfolio investment
recorded a net outflow of US$13.3 million,
significantly larger than the net outflow of $3.0
million reported in the corresponding period oneyear earlier. This was mainly on account of larger
transactions by foreign owned energy companies.
Commercial banks have increased their
holdings of foreign assets. Most of these assets
consist of investments in US treasury bills and time
deposits28. According to preliminary estimates,
some net outflows of other private sector
capital in the third quarter of 2012 emanated
from loans ($477.6 million) and transactions
involving currency and deposits ($257.7 million).Meanwhile, the deficit on the public sector
account moved from US$298.6 million in the
third quarter of 2011 to $369.9 million in the
third quarter of 2012 primarily reflecting net
loan proceeds and investments abroad from the
Heritage and Stabilization Fund.
In 2012, gross official reserves declined by
$622.0 million compared to the $752.6 million
increase of the previous year. At the end of
2012, the level of gross official reserves stood
at $9.2 billion or 10.4 months of prospective
imports of goods and non-factor services.
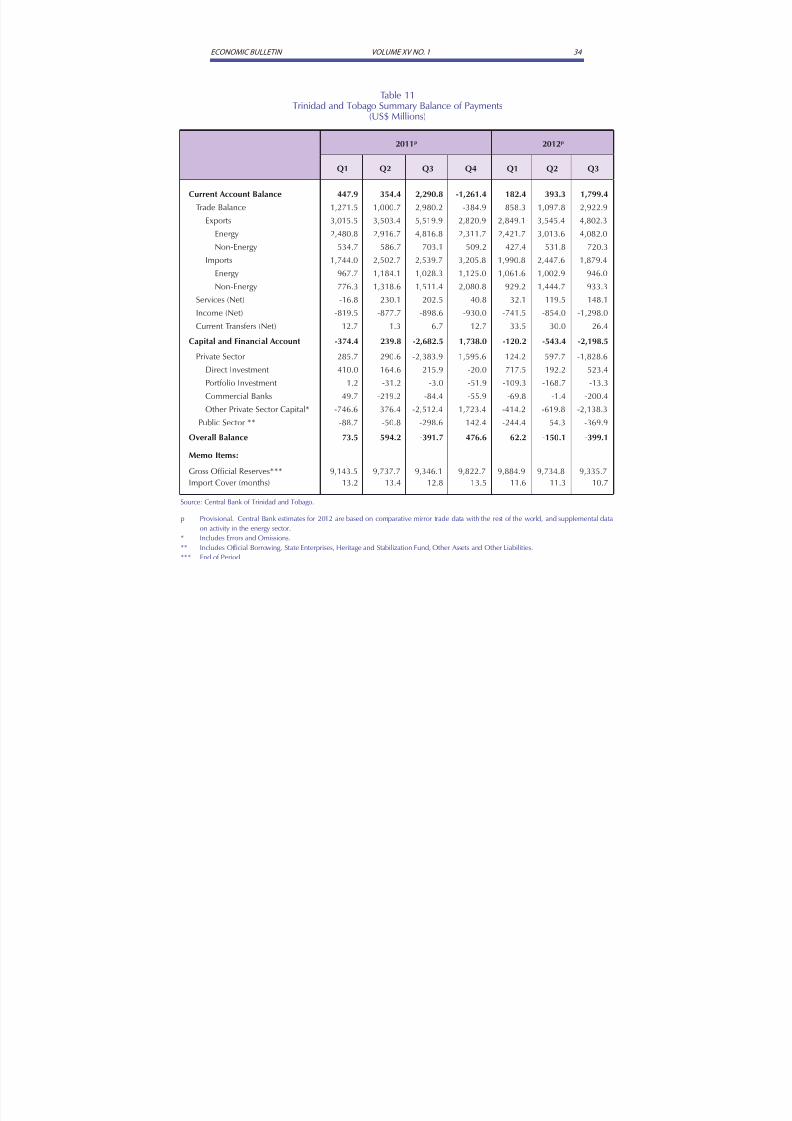
8/13/2019 Economic Bulletin January 2013
http://slidepdf.com/reader/full/economic-bulletin-january-2013 38/108
ECONOMIC BULLETIN VOLUME XV NO. 1 34
Table 11Trinidad and Tobago Summary Balance of Payments
(US$ Millions)
2011p 2012p
Q1 Q2 Q3 Q4 Q1 Q2 Q3
Current Account Balance 447.9 354.4 2,290.8 -1,261.4 182.4 393.3 1,799.4
Trade Balance 1,271.5 1,000.7 2,980.2 -384.9 858.3 1,097.8 2,922.9
Exports 3,015.5 3,503.4 5,519.9 2,820.9 2,849.1 3,545.4 4,802.3
Energy 2,480.8 2,916.7 4,816.8 2,311.7 2,421.7 3,013.6 4,082.0
Non-Energy 534.7 586.7 703.1 509.2 427.4 531.8 720.3
Imports 1,744.0 2,502.7 2,539.7 3,205.8 1,990.8 2,447.6 1,879.4Energy 967.7 1,184.1 1,028.3 1,125.0 1,061.6 1,002.9 946.0
Non-Energy 776.3 1,318.6 1,511.4 2,080.8 929.2 1,444.7 933.3
Services (Net) -16.8 230.1 202.5 40.8 32.1 119.5 148.1
Income (Net) -819.5 -877.7 -898.6 -930.0 -741.5 -854.0 -1,298.0
Current Transfers (Net) 12.7 1.3 6.7 12.7 33.5 30.0 26.4
Capital and Financial Account -374.4 239.8 -2,682.5 1,738.0 -120.2 -543.4 -2,198.5
Private Sector -285.7 290.6 -2,383.9 1,595.6 124.2 -597.7 -1,828.6
Direct Investment 410.0 164.6 215.9 -20.0 717.5 192.2 523.4
Portfolio Investment 1.2 -31.2 -3.0 -51.9 -109.3 -168.7 -13.3
Commercial Banks 49.7 -219.2 -84.4 -55.9 -69.8 -1.4 -200.4
Other Private Sector Capital* -746.6 376.4 -2,512.4 1,723.4 -414.2 -619.8 -2,138.3
Public Sector ** -88.7 -50.8 -298.6 142.4 -244.4 54.3 -369.9
Overall Balance 73.5 594.2 -391.7 476.6 62.2 -150.1 -399.1
Memo Items:
Gross Official Reserves*** 9,143.5 9,737.7 9,346.1 9,822.7 9,884.9 9,734.8 9,335.7
Import Cover (months) 13.2 13.4 12.8 13.5 11.6 11.3 10.7
Source: Central Bank of Trinidad and Tobago.
p Provisional. Central Bank estimates for 2012 are based on comparative mirror trade data with the rest of the world, and supplemental dataon activity in the energy sector.
* Includes Errors and Omissions.
** Includes Official Borrowing, State Enterprises, Heritage and Stabilization Fund, Other Assets and Other Liabilities.
*** End of Period.
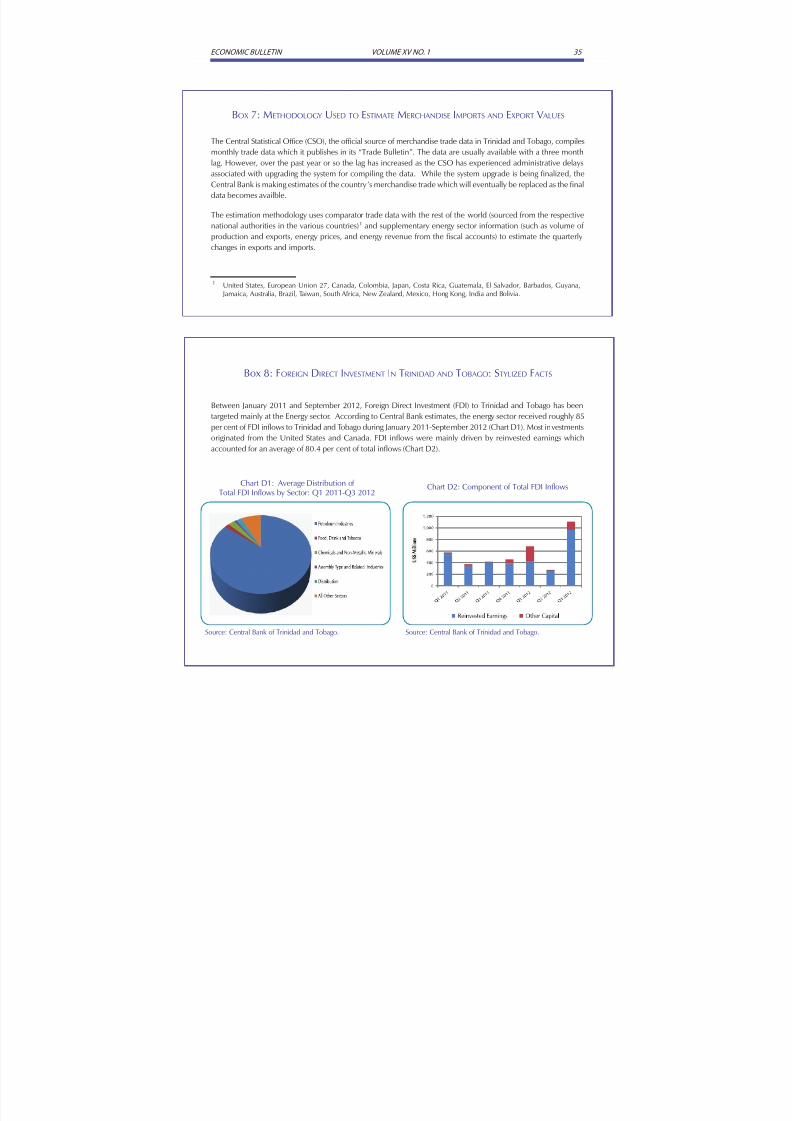
8/13/2019 Economic Bulletin January 2013
http://slidepdf.com/reader/full/economic-bulletin-january-2013 39/108
ECONOMIC BULLETIN VOLUME XV NO. 1 35
BOX 7: METHODOLOGY USED TO ESTIMATE MERCHANDISE IMPORTS AND EXPORT V ALUES
The Central Statistical Office (CSO), the official source of merchandise trade data in Trinidad and Tobago, compiles
monthly trade data which it publishes in its “Trade Bulletin”. The data are usually available with a three month
lag. However, over the past year or so the lag has increased as the CSO has experienced administrative delays
associated with upgrading the system for compiling the data. While the system upgrade is being finalized, the
Central Bank is making estimates of the country’s merchandise trade which will eventually be replaced as the final
data becomes availble.
The estimation methodology uses comparator trade data with the rest of the world (sourced from the respective
national authorities in the various countries)1 and supplementary energy sector information (such as volume of
production and exports, energy prices, and energy revenue from the fiscal accounts) to estimate the quarterly
changes in exports and imports.
Box 8: FOREIGN DIRECT INVESTMENT IN TRINIDAD AND TOBAGO: STYLIZED F ACTS
Chart D2: Component of Total FDI Inflows
Source: Central Bank of Trinidad and Tobago.
Chart D1: Average Distribution ofTotal FDI Inflows by Sector: Q1 2011-Q3 2012
Source: Central Bank of Trinidad and Tobago.
Between January 2011 and September 2012, Foreign Direct Investment (FDI) to Trinidad and Tobago has been
targeted mainly at the Energy sector. According to Central Bank estimates, the energy sector received roughly 85
per cent of FDI inflows to Trinidad and Tobago during January 2011-September 2012 (Chart D1). Most investments
originated from the United States and Canada. FDI inflows were mainly driven by reinvested earnings which
accounted for an average of 80.4 per cent of total inflows (Chart D2).
1 United States, European Union 27, Canada, Colombia, Japan, Costa Rica, Guatemala, El Salvador, Barbados, Guyana, Jamaica, Australia, Brazil, Taiwan, South Africa, New Zealand, Mexico, Hong Kong, India and Bolivia.

8/13/2019 Economic Bulletin January 2013
http://slidepdf.com/reader/full/economic-bulletin-january-2013 40/108
ECONOMIC BULLETIN VOLUME XV NO. 1 36
Effective Exchange Rates
In the 12 months to November 2012, the
trade-weighted real effective exchange rateappreciated by 5.8 per cent. The trade-weighted
real effective exchange rate (TWREER) reflects the
trade-weighted (nominal) exchange rate adjusted
for inflation (Chart 10). The TWNEER appreciated
by just 0.9 per cent while the weighted inflation
differential (which refers to domestic inflation rates
relative to those of our major trading partners)
increased by 4.9 per cent. The main contributory
factor to the appreciation in real effective terms
of the Trinidad and Tobago dollar was the rise in
domestic inflation compared to price increases
in partner countries. Domestic inflation averaged
9.1 per cent over the 12-month review period,
significantly higher than the average weighted
inflation rate of 5.5 per cent for our major trading
partners.
Chart 10Trade Weighted Real and Nominal
Effective Exchange Rate Indices(2000=100)
Source: Central Bank of Trinidad and Tobago.
8/13/2019 Economic Bulletin January 2013
http://slidepdf.com/reader/full/economic-bulletin-january-2013 41/108
ECONOMIC BULLETIN VOLUME XV NO. 1 37
PART XIV - INTERNATIONAL COMMODITY MARKETS29
(Data in this section are in US dollars unless otherwise stated)
29 Table 12 details the movement in prices of several energy and energy-related commodities.30 The Strait of Hormuz is located between the Gulf of Oman and the Persian Gulf. Roughly 20 per cent of the world’s oil, or
35 per cent of seaborne traded oil, passes through the Strait.31 See Box 2 on page 15.32 Trinidad and Tobago is the major supplier of US imported ammonia (approximately 60 per cent of ammonia imports during
January to October 2012).
Petroleum
The international crude oil market garnered
strength as the third quarter began, but weaker
fundamentals prevailed as the year came to
an end. When US and EU sanctions against
Iran (for its controversial nuclear programme)
became effective on July 1, 2012, a number of
countries had already significantly lowered their
imports of Iranian crude. Iran, whose output had
been severely affected by the move, renewed its
threat to block the Strait of Hormuz30. This added
some upward momentum to world markets and
prices. As the year progressed however, the
effect of geo-political tensions eased. Increasing
output from Iraq, the world’s second largest oil
producer, effectively replaced lost supply from
Iran. By late October, crude oil stocks in the US
were 12 per cent above the 5-year average while
stocks in other parts of the world were similarly
high. Global prices grew somewhat weaker as a
result. Despite these price movements, averageoil prices for the second half of 2012 have not
deviated significantly from prices twelve months
earlier.
Natural Gas
Though other regional markets were vibrant
in the second half of 2012, the US natural
gas market became progressively weaker. US
natural gas storage began the 2012 injection
season (April to October) some 800 billion cubicfeet above the 5-year average and reached an all-
time high of 3.929 trillion cubic feet by the end
of October. Other regional markets remained
buoyant. Markets in Europe recorded prices in
the vicinity of $9 per mmbtu while Asian buyers
paid closer to $15 per mmbtu for natural gas.
Petrochemicals
Fertilizer markets were strong during the
second half of 2012. As news of Trinidad
and Tobago’s September 2012 maintenance
plans31 spread, US buyers began to scamper for
replacement ammonia32. The increased demand
coupled with an expectation of reduced supply
brought significant upward pressure on prices
worldwide. However, the US ammonia market
grew weaker by end October/early November as
demand softened. Meanwhile, prices in Europe
and further east remained sustained by shortfalls
in supply.
Methanol
Global methanol markets were relatively stable
over the second half of 2012. A loss of supply
from Trinidad and Tobago, the largest single
exporter of methanol, during September 2012
threatened to aggravate the market. However,the start up of a 750,000 tonne per year plant in
the US restored some level of calm.
Iron and Steel
General economic weakness across continental
Europe put downward pressure on prices in late
2012. This was exacerbated by the seasonal lull
in demand during the summer months. Wire rod
and billet prices in the second half of 2012 were
19.2 per cent and 14.1 per cent, respectively,below the average price in the year-earlier period.
The Food Price Index
Global food prices, except cereals, continued to
slip during the final quarter of 2012. Following

8/13/2019 Economic Bulletin January 2013
http://slidepdf.com/reader/full/economic-bulletin-january-2013 42/108
8 3 1.O N V X E M U LO V N I T E LLU B C I M O N O C E
sharp increases in the previous year, the Food
and Agriculture Organization’s (FAO) Food Price
Index declined 1.2 per cent (year-on-year) in
the fourth quarter of 2012 (Table 13). The Sugar
Price Index showed the largest decline (18.6 per
cent) over the period. Accompanying this drop
were year-on-year decreases within the Meat (1.2
per cent), Diary (3.4 per cent) and the Oils Price
Indices (12.1 per cent).
However, the price of cereals continued to
face upward pressures due to adverse weather
conditions in the United States and Russia.
The Cereals Index increased 12.9 per cent in
the fourth quarter of 2012 (year-on-year). These
higher prices encouraged increased crop planting
within South America. Additionally, demand
for cereal for feedstock as well as industrial use
waned towards the end of 2012. This reduction
in demand, accompanied by increased output
projections for Russia, the United States, Brazil
and the Black Sea, could lead to lower prices in
the new year.

8/13/2019 Economic Bulletin January 2013
http://slidepdf.com/reader/full/economic-bulletin-january-2013 43/108
ECONOMIC BULLETIN VOLUME XV NO. 1 39
Table 12Prices of Selected Export Commodities
US$/bbl1 US$/mmbtu2 US$/tonne
Crude Oil
(BRENT)
Crude Oil
(WTI3)
Natural Gas
(Henry Hub)
Ammonia
(fob
Caribbean)
Urea (fob
Caribbean)
Methanol
(fob
Rotterdam)
Billets
(fob Latin
America)
Wire Rods
(fob Latin
America)
Jan-11 96.59 89.41 4.49 435.00 384.63 426.50 612.50 640.00
Feb-11 103.57 89.53 4.09 475.00 388.50 433.50 637.50 695.00
Mar-11 114.60 102.92 3.97 507.00 371.40 441.00 645.00 682.00
Apr-11 118.27 109.96 4.24 515.00 355.50 441.00 633.75 686.25
May11 110.59 101.28 4.31 522.50 378.50 433.00 630.63 720.00
Jun-11 111.70 96.25 4.54 524.00 446.00 441.00 657.00 720.00
Jul-11 116.13 97.31 4.42 521.88 473.38 413.00 690.00 740.00
Aug-11 108.70 86.32 4.05 526.25 510.00 424.00 693.75 746.25
Sep-11 106.00 86.58 3.89 556.25 509.00 405.00 705.00 765.00
Oct-11 103.83 86.41 3.56 623.13 499.38 440.50 655.00 750.00
Nov-11 107.76 97.12 3.26 651.25 491.25 436.50 615.00 698.75
Dec-11 106.23 98.56 3.16 553.00 421.50 424.50 610.00 678.33
Jan-12 110.67 100.29 2.67 495.90 393.00 410.00 627.50 697.50
Feb-12 117.68 102.21 2.50 393.50 414.88 423.00 604.00 692.00
Mar-12 123.60 105.88 2.16 357.50 535.38 420.00 612.50 698.75
Apr-12 119.47 103.28 1.95 425.00 680.00 446.00 610.00 691.88
May12 109.53 94.68 2.43 520.00 666.25 436.00 610.00 679.50
Jun-12 95.77 82.36 2.45 580.00 491.13 426.00 605.00 688.75
Jul-12 102.50 87.90 2.97 651.00 443.80 417.00 565.00 650.00
Aug-12 111.83 94.11 2.84 651.25 436.25 419.00 554.00 650.00
Sep-12 112.77 94.51 2.85 662.50 429.13 447.00 527.50 630.00
Oct-12 110.20 89.52 3.32 670.50 428.70 441.00 510.00 620.00
Nov-12 108.99 86.68 3.54 668.75 396.13 432.00 525.00 611.25Dec-12 108.66 88.19 3.34 642.50 402.00 439.00 525.00 600.00
Source: Bloomberg; Green Markets; Fertilizer Week; European Chemical News; Monthly Methanol Newsletter (TECNON); Metal Bulletin.
All prices are monthly averages of published quotations and not necessarily realized prices.
1 US dollars per barrel.
2 US dollars per million British thermal units.
3 West Texas Intermediate.
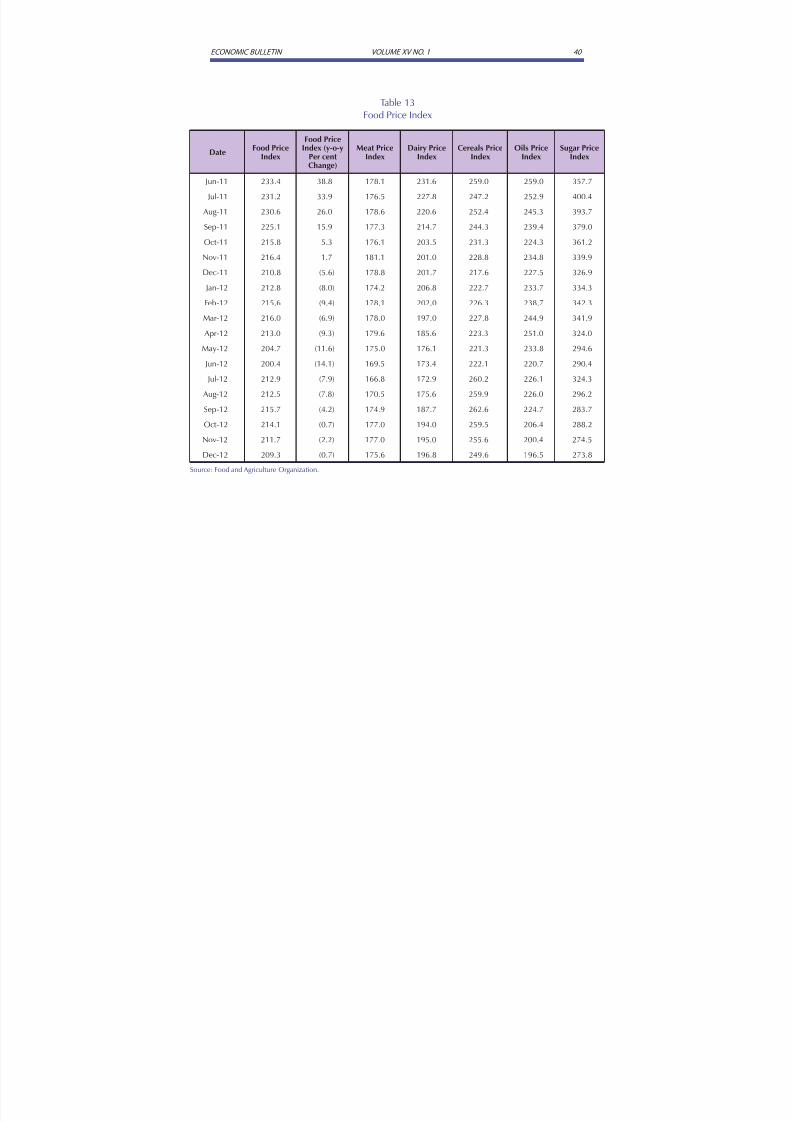
8/13/2019 Economic Bulletin January 2013
http://slidepdf.com/reader/full/economic-bulletin-january-2013 44/108
0 4 1.O N V X E M U LO V N I T E LLU B C I M O N O C E
Table 13Food Price Index
DateFood Price
Index
Food PriceIndex (y-o-y
Per centChange)
Meat PriceIndex
Dairy PriceIndex
Cereals PriceIndex
Oils PriceIndex
Sugar PriceIndex
Jun-11 233.4 38.8 178.1 231.6 259.0 259.0 357.7
Jul-11 231.2 33.9 176.5 227.8 247.2 252.9 400.4
Aug-11 230.6 26.0 178.6 220.6 252.4 245.3 393.7
Sep-11 225.1 15.9 177.3 214.7 244.3 239.4 379.0
Oct-11 215.8 5.3 176.1 203.5 231.3 224.3 361.2
Nov-11 216.4 1.7 181.1 201.0 228.8 234.8 339.9Dec-11 210.8 (5.6) 178.8 201.7 217.6 227.5 326.9
Jan-12 212.8 (8.0) 174.2 206.8 222.7 233.7 334.3
Feb-12 215.6 (9.4) 178.1 202.0 226.3 238.7 342.3
Mar-12 216.0 (6.9) 178.0 197.0 227.8 244.9 341.9
Apr-12 213.0 (9.3) 179.6 185.6 223.3 251.0 324.0
May-12 204.7 (11.6) 175.0 176.1 221.3 233.8 294.6
Jun-12 200.4 (14.1) 169.5 173.4 222.1 220.7 290.4
Jul-12 212.9 (7.9) 166.8 172.9 260.2 226.1 324.3
Aug-12 212.5 (7.8) 170.5 175.6 259.9 226.0 296.2
Sep-12 215.7 (4.2) 174.9 187.7 262.6 224.7 283.7
Oct-12 214.1 (0.7) 177.0 194.0 259.5 206.4 288.2
Nov-12 211.7 (2.2) 177.0 195.0 255.6 200.4 274.5
Dec-12 209.3 (0.7) 175.6 196.8 249.6 196.5 273.8
Source: Food and Agriculture Organization.

8/13/2019 Economic Bulletin January 2013
http://slidepdf.com/reader/full/economic-bulletin-january-2013 45/108
APPENDIX I
STATISTICAL TABLES

8/13/2019 Economic Bulletin January 2013
http://slidepdf.com/reader/full/economic-bulletin-january-2013 46/108

8/13/2019 Economic Bulletin January 2013
http://slidepdf.com/reader/full/economic-bulletin-january-2013 47/108
ECONOMIC BULLETIN VOLUME XV NO. 1 41
STATISTICAL APPENDIX
TABLE 1 QUARTERLY GROSS DOMESTIC PRODUCT INDEX AT CONSTANT PRICES
(SEASONALLY ADJUSTED)
TABLE 2A INDEX OF DOMESTIC PRODUCTION
TABLE 2B INDEX OF DOMESTIC PRODUCTION - PER CENT CHANGE
TABLE 3A INDEX OF HOURS WORKED
TABLE 3B INDEX OF PRODUCTIVITY
TABLE 4 PRODUCTION AND SALES OF NATURAL GAS, PETROLEUM AND PETROLEUM
BASED PRODUCTS
TABLE 5 PRODUCTION AND SALES OF PETROCHEMICAL PRODUCTS
TABLE 6 PRODUCTION AND SALES OF CEMENT AND IRON AND STEEL PRODUCTS
TABLE 7 INDEX OF RETAIL SALESTABLE 8 PRODUCTION AND SALES OF MAJOR AGRICULTURAL COMMODITIES
TABLE 9 PRODUCTION OF SELECTED FOOD CROPS
TABLE 10 INDEX OF RETAIL PRICES
TABLE 11A INDEX OF PRODUCERS’ PRICES
TABLE 11B INDEX OF RETAIL PRICES OF BUILDING MATERIALS
TABLE 12 EMPLOYMENT AND LABOUR FORCE
TABLE 13 SECTORAL DISTRIBUTION OF EMPLOYMENT
TABLE 14 CENTRAL GOVERNMENT - FISCAL OPERATIONS
TABLE 15 CENTRAL GOVERNMENT - NET DOMESTIC BUDGET DEFICIT
TABLE 16 CENTRAL GOVERNMENT - EXTERNAL DEBT
TABLE 17 MONEY SUPPLY
TABLE 18 COMMERCIAL BANKS - SELECTED DATA
TABLE 19 COMMERCIAL BANKS: OUTSTANDING LOANS TO BUSINESSES - PRIVATE SECTOR
TABLE 19 (CONT’D) COMMERCIAL BANKS: OUTSTANDING LOANS TO BUSINESSES - PRIVATE SECTOR
- BY ACTIVITY
TABLE 20 COMMERCIAL BANKS: OUTSTANDING LOANS TO BUSINESSES - PUBLIC SECTOR
TABLE 21 LOANS OUTSTANDING BY PURPOSE - CONSUMERS
TABLE 22 COMMERCIAL BANKS LIQUID ASSETS
TABLE 23 FINANCE HOUSES & MERCHANT BANKS - SELECTED DATA
TABLE 24 TRUST AND MORTGAGE FINANCE COMPANIES - SELECTED DATA
TABLE 25 SELECTED INTEREST RATESTABLE 26A COMMERCIAL BANKS: INTEREST RATES
TABLE 26B COMMERCIAL BANKS: RANGE OF INTEREST RATES ON TT DOLLAR LOANS
AND DEPOSITS
TABLE 27A NON-BANK FINANCIAL INSTITUTIONS: MEDIAN INTEREST RATES
TABLE 27B NON-BANK FINANCIAL INSTITUTIONS: RANGE OF INTEREST RATES
TABLE 28 MONEY AND CAPITAL MARKET: PRIMARY MARKET ISSUES
TABLE 29 MONEY AND CAPITAL MARKET: SECONDARY MARKET TURNOVER
TABLE 30 MONEY AND CAPITAL MARKET: MUTUAL FUNDS - SALES AND REPURCHASES
TABLE 31A BALANCE OF PAYMENTS - CURRENT ACCOUNT

8/13/2019 Economic Bulletin January 2013
http://slidepdf.com/reader/full/economic-bulletin-january-2013 48/108
ECONOMIC BULLETIN VOLUME XV NO. 1 42
TABLE 31B BALANCE OF PAYMENTS - CAPITAL AND FINANCIAL ACCOUNT
TABLE 32 VISIBLE TRADE
TABLE 33 COMMERCIAL BANKS FOREIGN CURRENCY ACCOUNTS SIZE DISTRIBUTIONOF DEPOSITS
TABLE 34A DIRECTION OF TRADE WITH CARICOM COUNTRIES - IMPORTS
TABLE 34B DIRECTION OF TRADE WITH CARICOM COUNTRIES - EXPORTS
TABLE 35 TRINIDAD AND TOBAGO FOREIGN RESERVES
r - revised
p - provisional
n.a. - not available
# - multiple of 100
0 - nil/negligible
.. - infinity
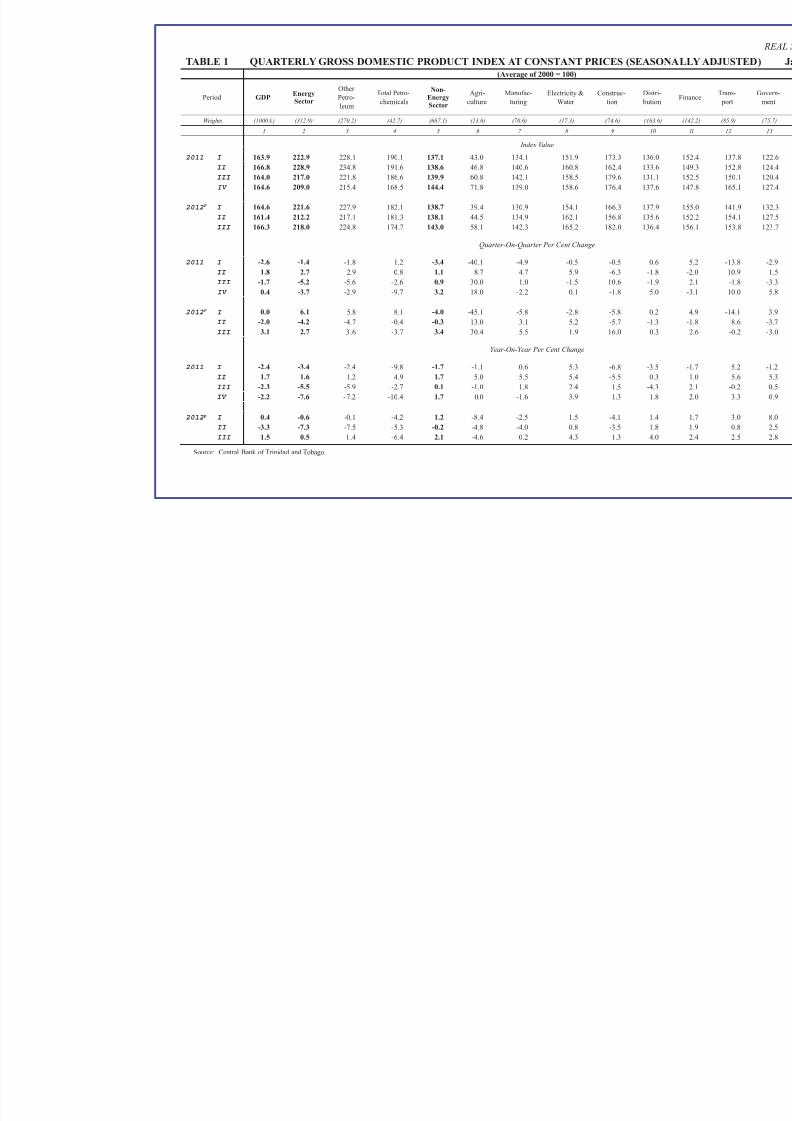
8/13/2019 Economic Bulletin January 2013
http://slidepdf.com/reader/full/economic-bulletin-january-2013 49/108
TABLE 1 QUARTERLY GROSS DOMESTIC PRODUCT INDEX AT CONSTANT PRICES (SEASO
(Average of 2000 = 100)
Period GDPEnergySector
Other
Petro-
leum
Total Petro-
chemicals
Non-EnergySector
Agri-
culture
Manufac-
turing
Electricity &
Water
Construc-
tion
Distri
butio
Weights (1000.0) (312.9) (270.2) (42.7) (687.1) (13.6) (70.6) (17.3) (74.6) (163.6
1 2 3 4 5 6 7 8 9 10
Index Value
2011 I 163.9 222.9 228.1 190.1 137.1 43.0 134.1 151.9 173.3 136.0
II 166.8 228.9 234.8 191.6 138.6 46.8 140.6 160.8 162.4 133.6
III 164.0 217.0 221.8 186.6 139.9 60.8 142.1 158.5 179.6 131.1
IV 164.6 209.0 215.4 168.5 144.4 71.8 139.0 158.6 176.4 137.6
2012P I 164.6 221.6 227.9 182.1 138.7 39.4 130.9 154.1 166.3 137.9
II 161.4 212.2 217.1 181.3 138.1 44.5 134.9 162.1 156.8 135.6
III 166.3 218.0 224.8 174.7 143.0 58.1 142.3 165.2 182.0 136.4
Quarter-On-Quarter Per Cent Change
2011 I -2.6 -1.4 -1.8 1.2 -3.4 -40.1 -4.9 -0.5 -0.5 0.6
II 1.8 2.7 2.9 0.8 1.1 8.7 4.7 5.9 -6.3 -1.8
III -1.7 -5.2 -5.6 -2.6 0.9 30.0 1.0 -1.5 10.6 -1.9
IV 0.4 -3.7 -2.9 -9.7 3.2 18.0 -2.2 0.1 -1.8 5.0
2012P I 0.0 6.1 5.8 8.1 -4.0 -45.1 -5.8 -2.8 -5.8 0.2
II -2.0 -4.2 -4.7 -0.4 -0.3 13.0 3.1 5.2 -5.7 -1.3
III 3.1 2.7 3.6 -3.7 3.4 30.4 5.5 1.9 16.0 0.3
Year-On-Year Per Cent Change
2011 I -2.4 -3.4 -2.4 -9.8 -1.7 -1.1 0.6 5.3 -6.8 -3.5
II 1.7 1.6 1.2 4.9 1.7 5.0 5.5 5.4 -5.5 0.3
III -2.3 -5.5 -5.9 -2.7 0.1 -1.0 1.8 2.4 1.5 -4.3 IV -2.2 -7.6 -7.2 -10.4 1.7 0.0 -1.6 3.9 1.3 1.8
2012 p I 0.4 -0.6 -0.1 -4.2 1.2 -8.4 -2.5 1.5 -4.1 1.4
II -3.3 -7.3 -7.5 -5.3 -0.2 -4.8 -4.0 0.8 -3.5 1.8
III 1.5 0.5 1.4 -6.4 2.1 -4.6 0.2 4.3 1.3 4.0
Source: Central Bank of Trinidad and Tobago.

8/13/2019 Economic Bulletin January 2013
http://slidepdf.com/reader/full/economic-bulletin-january-2013 50/108
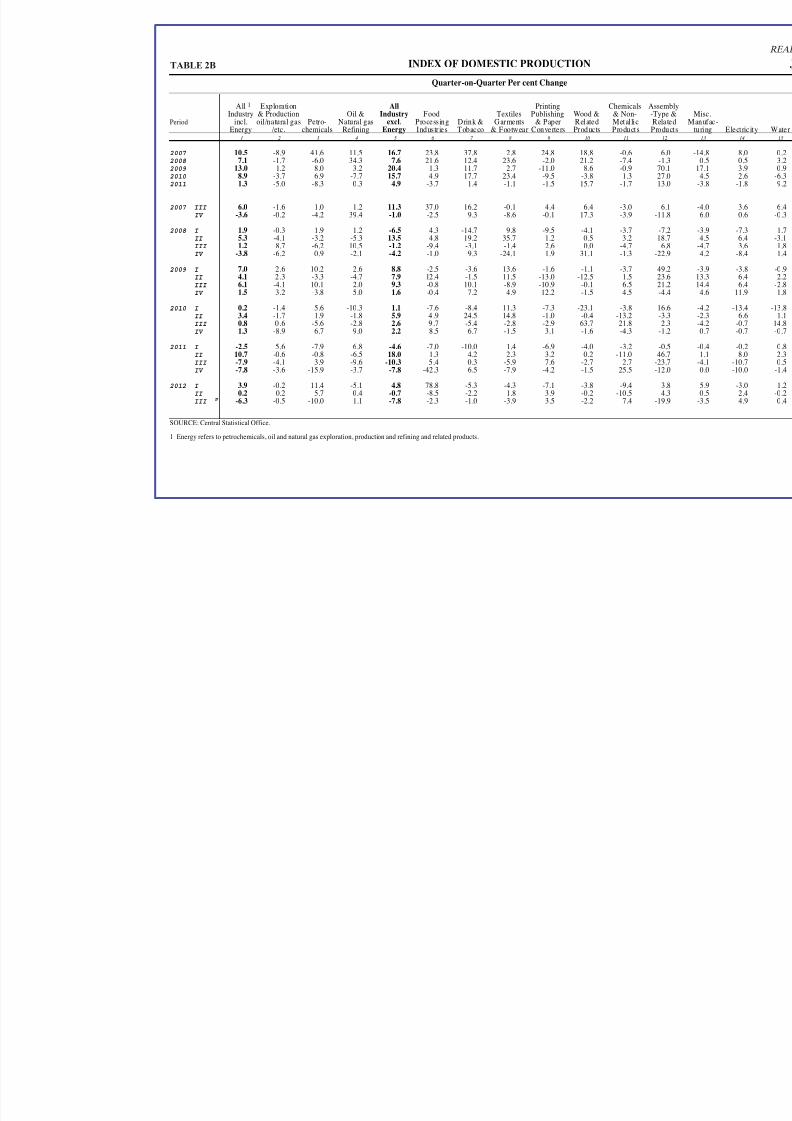
8/13/2019 Economic Bulletin January 2013
http://slidepdf.com/reader/full/economic-bulletin-january-2013 51/108
Period
1
TABLE 2B INDEX OF DOMESTIC PRODUCTION
Quarter-on-Quarter Per cent Change
All Exploration All Printing Chemicals AssIndustry & Production Oil & Industry Food Textiles Publishing Wood & & Non- -T
incl. oil/natural gas Petro- Natural gas excl. Processing Drink & Garments & Paper Related Metal lic R
Energy /etc. chemicals Refining Energy Industries Tobacco & Footwear Converters Products Products Pro1 2 3 4 5 6 7 8 9 10 11
2007 10.5 -8.9 41.6 11.5 16.7 23.8 37.8 2.8 24.8 18.8 -0.6 2008 7.1 -1.7 -6.0 34.3 7.6 21.6 12.4 23.6 -2.0 21.2 -7.4 2009 13.0 1.2 8.0 3.2 20.4 1.3 11.7 2.7 -11.0 8.6 -0.9 72010 8.9 -3.7 6.9 -7.7 15.7 4.9 17.7 23.4 -9.5 -3.8 1.3 22011 1.3 -5.0 -8.3 0.3 4.9 -3.7 1.4 -1.1 -1.5 15.7 -1.7
2007 III 6.0 -1.6 1.0 1.2 11.3 37.0 16.2 -0.1 4.4 6.4 -3.0 IV -3.6 -0.2 -4.2 39.4 -1.0 -2.5 9.3 -8.6 -0.1 17.3 -3.9 -
2008 I 1.9 -0.3 1.9 1.2 -6.5 4.3 -14.7 9.8 -9.5 -4.1 -3.7 II 5.3 -4.1 -3.2 -5.3 13.5 4.8 19.2 35.7 1.2 0.5 3.2 III 1.2 8.7 -6.2 10.5 -1.2 -9.4 -3.1 -1.4 2.6 0.0 -4.7 IV -3.8 -6.2 0.9 -2.1 -4.2 -1.0 9.3 -24.1 1.9 31.1 -1.3 -2
2009 I 7.0 2.6 10.2 2.6 8.8 -2.5 -3.6 13.6 -1.6 -1.1 -3.7 4 II 4.1 2.3 -3.3 -4.7 7.9 12.4 -1.5 11.5 -13.0 -12.5 1.5 2 III 6.1 -4.1 10.1 2.0 9.3 -0.8 10.1 -8.9 -10.9 -0.1 6.5 2 IV 1.5 3.2 -3.8 5.0 1.6 -0.4 7.2 4.9 12.2 -1.5 4.5
2010 I 0.2 -1.4 5.6 -10.3 1.1 -7.6 -8.4 11.3 -7.3 -23.1 -3.8 II 3.4 -1.7 1.9 -1.8 5.9 4.9 24.5 14.8 -1.0 -0.4 -13.2 III 0.8 0.6 -5.6 -2.8 2.6 9.7 -5.4 -2.8 -2.9 63.7 21.8 IV 1.3 -8.9 6.7 9.0 2.2 8.5 6.7 -1.5 3.1 -1.6 -4.3
2011 I -2.5 5.6 -7.9 6.8 -4.6 -7.0 -10.0 1.4 -6.9 -4.0 -3.2 II 10.7 -0.6 -0.8 -6.5 18.0 1.3 4.2 2.3 3.2 0.2 -11.0 4 III -7.9 -4.1 3.9 -9.6 -10.3 5.4 0.3 -5.9 7.6 -2.7 2.7 -2 IV -7.8 -3.6 -15.9 -3.7 -7.8 -42.3 6.5 -7.9 -4.2 -1.5 25.5 -
2012 I3.9 -0.2 11.4 -5.1 4.8 78.8 -5.3 -4.3 -7.1 -3.8 -9.4 II 0.2 0.2 5.7 0.4 -0.7 -8.5 -2.2 1.8 3.9 -0.2 -10.5
III p -6.3 -0.5 -10.0 1.1 -7.8 -2.3 -1.0 -3.9 3.5 -2.2 7.4 -
SOURCE: Central Statistical Office.
1 Energy refers to petrochemicals, oil and natural gas exploration, production and refining and related products.
TABLE 2B
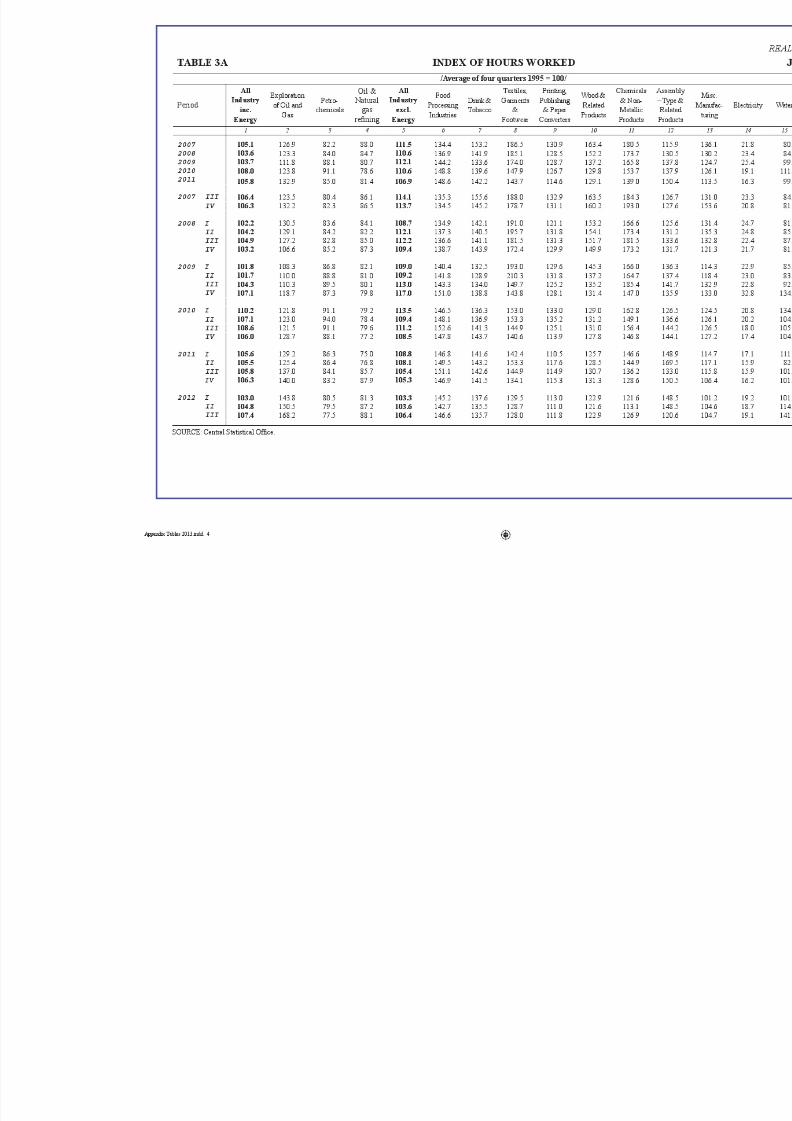
8/13/2019 Economic Bulletin January 2013
http://slidepdf.com/reader/full/economic-bulletin-january-2013 52/108
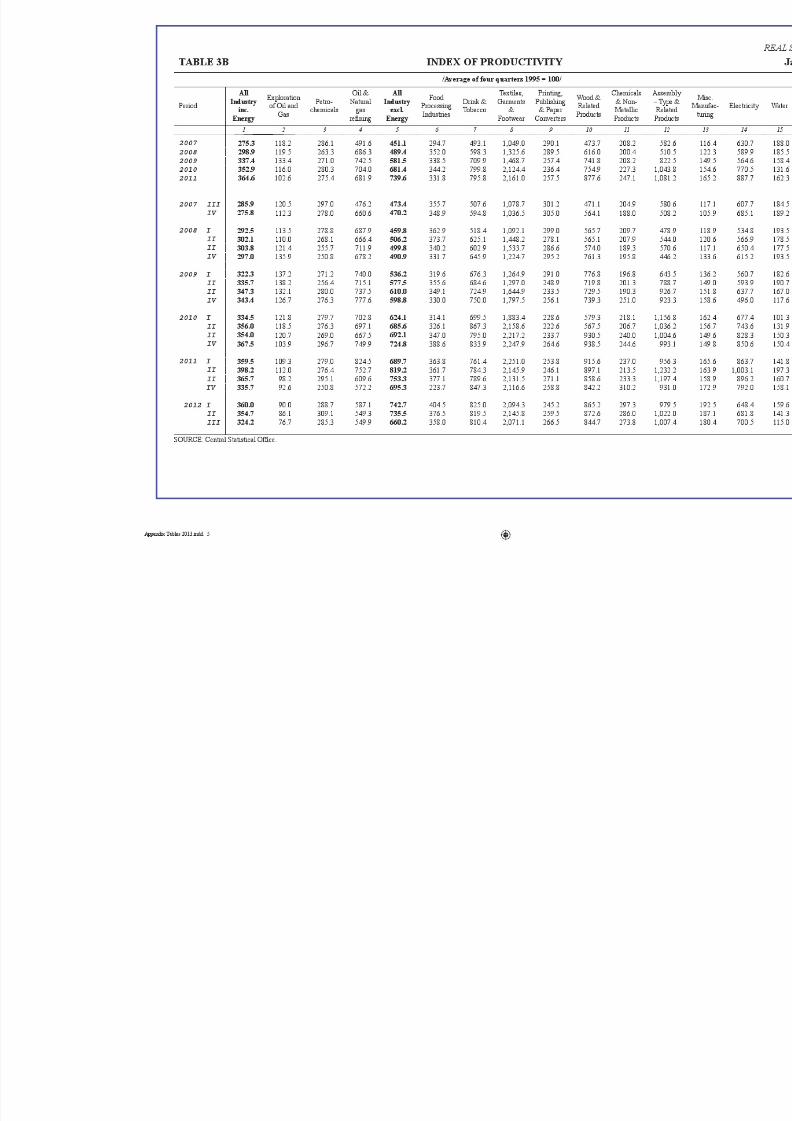
8/13/2019 Economic Bulletin January 2013
http://slidepdf.com/reader/full/economic-bulletin-january-2013 53/108
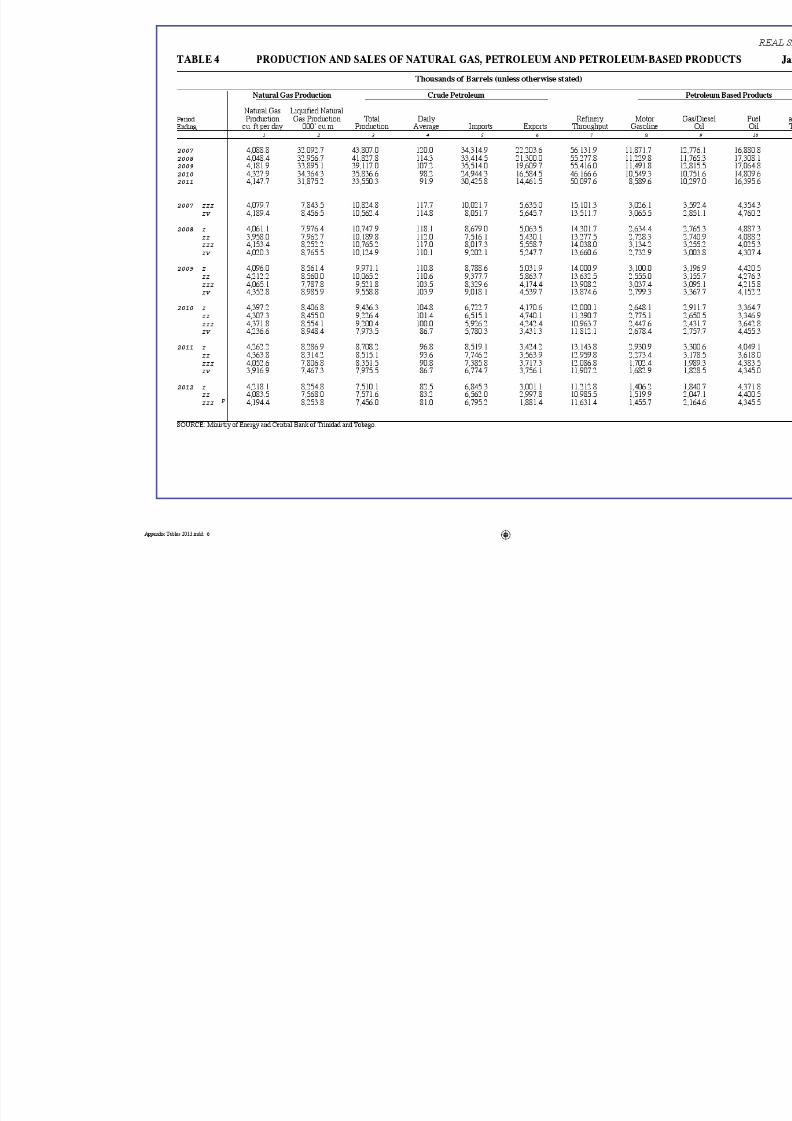
8/13/2019 Economic Bulletin January 2013
http://slidepdf.com/reader/full/economic-bulletin-january-2013 54/108
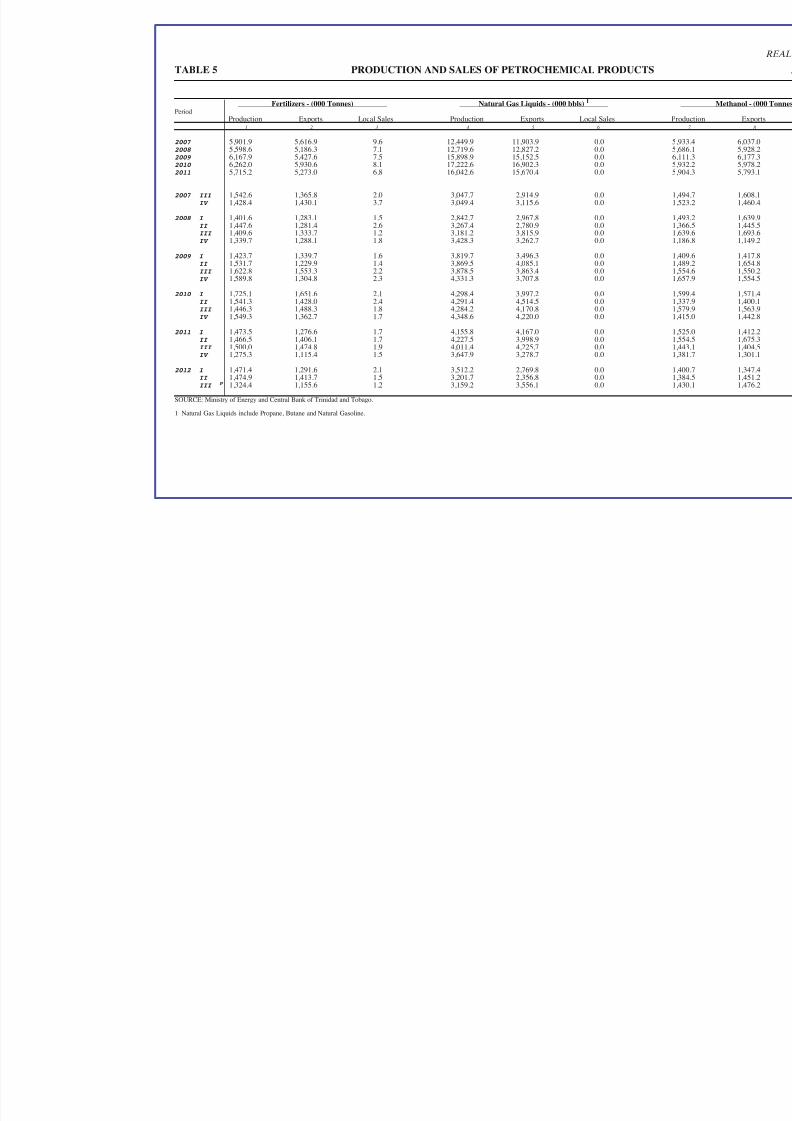
8/13/2019 Economic Bulletin January 2013
http://slidepdf.com/reader/full/economic-bulletin-january-2013 55/108
Period
STCUDORPLACIMEHCORTEPFOSELASDNANOITCUDORP5ELBAT
Fertilizers - (000 Tonnes) Natural Gas Liquids - (000 bbls) 1
Production Exports Local Sales Production Exports Local Sales 1 2 3 4 5 6
2007 5,901.9 5,616.9 9.6 12,449.9 11,903.9 0.0 2008 5,598.6 5,186.3 7.1 12,719.6 12,827.2 0.0 2009 6,167.9 5,427.6 7.5 15,898.9 15,152.5 0.0 2010 6,262.0 5,930.6 8.1 17,222.6 16,902.3 0.0 2011 5,715.2 5,273.0 6.8 16,042.6 15,670.4 0.0
2007 III 1,542.6 1,365.8 2.0 3,047.7 2,914.9 0.0 IV 1,428.4 1,430.1 3.7 3,049.4 3,115.6 0.0
2008 I 1,401.6 1,283.1 1.5 2,842.7 2,967.8 0.0 II 1,447.6 1,281.4 2.6 3,267.4 2,780.9 0.0 III 1,409.6 1,333.7 1.2 3,181.2 3,815.9 0.0 IV 1,339.7 1,288.1 1.8 3,428.3 3,262.7 0.0
2009 I 1,423.7 1,339.7 1.6 3,819.7 3,496.3 0.0 II 1,531.7 1,229.9 1.4 3,869.5 4,085.1 0.0 III 1,622.8 1,553.3 2.2 3,878.5 3,863.4 0.0 IV 1,589.8 1,304.8 2.3 4,331.3 3,707.8 0.0
2010 I 1,725.1 1,651.6 2.1 4,298.4 3,997.2 0.0 II 1,541.3 1,428.0 2.4 4,291.4 4,514.5 0.0 III 1,446.3 1,488.3 1.8 4,284.2 4,170.8 0.0 IV 1,549.3 1,362.7 1.7 4,348.6 4,220.0 0.0
2011 I 1,473.5 1,276.6 1.7 4,155.8 4,167.0 0.0 II 1,466.5 1,406.1 1.7 4,227.5 3,998.9 0.0 III 1,500.0 1,474.8 1.9 4,011.4 4,225.7 0.0 IV 1,275.3 1,115.4 1.5 3,647.9 3,278.7 0.0
2012 I 1,471.4 1,291.6 2.1 3,512.2 2,769.8 0.0 II 1,474.9 1,413.7 1.5 3,201.7 2,356.8 0.0 III
p 1,324.4 1,155.6 1.2 3,159.2 3,556.1 0.0
SOURCE: Ministry of Energy and Central Bank of Trinidad and Tobago.
1 Natural Gas Liquids include Propane, Butane and Natural Gasoline.
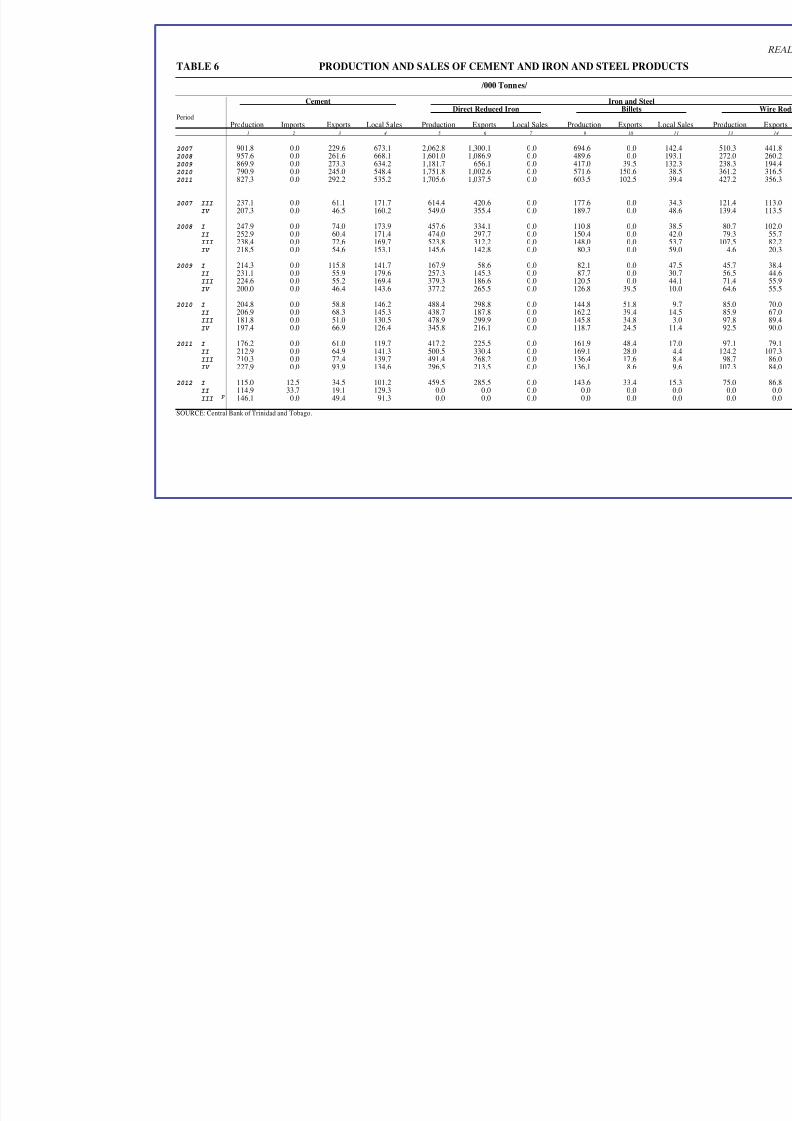
8/13/2019 Economic Bulletin January 2013
http://slidepdf.com/reader/full/economic-bulletin-january-2013 56/108
Period
TABLE 6 PRODUCTION AND SALES OF CEMENT AND IRON AND STEEL PROD
/000 Tonnes/
Cement Iron and SteelDirect Reduced Iron Billets
Production Imports Exports Local Sales Production Exports Local Sales Production Exports 1 2 3 4 5 6 7 9 10
2007 901.8 0.0 229.6 673.1 2,062.8 1,300.1 0.0 694.6 0.0 2008 957.6 0.0 261.6 668.1 1,601.0 1,086.9 0.0 489.6 0.0 2009 869.9 0.0 273.3 634.2 1,181.7 656.1 0.0 417.0 39.5 2010 790.9 0.0 245.0 548.4 1,751.8 1,002.6 0.0 571.6 150.6 2011 827.3 0.0 292.2 535.2 1,705.6 1,037.5 0.0 603.5 102.5
2007 III 237.1 0.0 61.1 171.7 614.4 420.6 0.0 177.6 0.0 IV 207.3 0.0 46.5 160.2 549.0 355.4 0.0 189.7 0.0
2008 I 247.9 0.0 74.0 173.9 457.6 334.1 0.0 110.8 0.0 II 252.9 0.0 60.4 171.4 474.0 297.7 0.0 150.4 0.0 III 238.4 0.0 72.6 169.7 523.8 312.2 0.0 148.0 0.0 IV 218.5 0.0 54.6 153.1 145.6 142.8 0.0 80.3 0.0
2009 I 214.3 0.0 115.8 141.7 167.9 58.6 0.0 82.1 0.0 II 231.1 0.0 55.9 179.6 257.3 145.3 0.0 87.7 0.0 III 224.6 0.0 55.2 169.4 379.3 186.6 0.0 120.5 0.0 IV 200.0 0.0 46.4 143.6 377.2 265.5 0.0 126.8 39.5
2010 I 204.8 0.0 58.8 146.2 488.4 298.8 0.0 144.8 51.8 II 206.9 0.0 68.3 145.3 438.7 187.8 0.0 162.2 39.4 III 181.8 0.0 51.0 130.5 478.9 299.9 0.0 145.8 34.8 IV 197.4 0.0 66.9 126.4 345.8 216.1 0.0 118.7 24.5
2011 I 176.2 0.0 61.0 119.7 417.2 225.5 0.0 161.9 48.4 II 212.9 0.0 64.9 141.3 500.5 330.4 0.0 169.1 28.0 III 210.3 0.0 72.4 139.7 491.4 268.2 0.0 136.4 17.6 IV 227.9 0.0 93.9 134.6 296.5 213.5 0.0 136.1 8.6
2012 I 115.0 12.5 34.5 101.2 459.5 285.5 0.0 143.6 33.4 II 114.9 33.7 19.1 129.3 0.0 0.0 0.0 0.0 0.0 III
p 146.1 0.0 49.4 91.3 0.0 0.0 0.0 0.0 0.0
SOURCE: Central Bank of Trinidad and Tobago.

8/13/2019 Economic Bulletin January 2013
http://slidepdf.com/reader/full/economic-bulletin-january-2013 57/108

8/13/2019 Economic Bulletin January 2013
http://slidepdf.com/reader/full/economic-bulletin-january-2013 58/108
Period
TABLE 8 PRODUCTION AND SALES OF MAJOR AGRICULTURAL COMM
Sugar - (000 Tonnes) Cocoa - (000 Kgs)
Production Raw Granulated Exports Local Sales Production Exports Local Sales Produc
1 2 3 4 5 6 7 8 9
2007 66.7 25.3 41.3 25.3 38.5 598.1 747.1 939.2 620.
2008 37.6 0.0 37.6 n.a. 39.7 574.3 276.0 172.3 102.2009 26.0 0.0 26.0 n.a. 27.9 516.9 591.7 73.0 182010 n.a. n.a. n.a. n.a. n.a. 509.0 536.9 21.3 182011 n.a. n.a. n.a. n.a. n.a. 339.0 328.0 23.4 n.
2007 III 10.7 0.0 10.7 0.0 9.0 38.0 171.2 104.3 100. IV 9.0 0.0 9.0 0.0 9.4 7.7 37.5 402.0 40
2008 I 7.5 0.0 7.5 n.a. 7.3 157.6 0.0 63.0 62 II 10.3 0.0 10.3 n.a. 10.2 174.6 75.7 30.3 30 III 9.1 0.0 9.1 n.a. 11.2 186.2 124.2 75.3 6 IV 10.7 0.0 10.7 n.a. 11.0 55.9 76.0 3.7 3
2009 I 10.2 0.0 10.2 n.a. 9.5 157.6 202.2 62.6 18 II 5.5 0.0 5.5 n.a. 8.2 138.3 90.9 2.4 0 III 10.3 0.0 10.3 n.a. 10.3 54.4 34.7 1.1 0 IV n.a. n.a. n.a. n.a. n.a. 166.6 263.9 6.9 0
2010 I n.a. n.a. n.a. n.a. n.a. 360.0 222.2 2.7 0 II n.a. n.a. n.a. n.a. n.a. 86.4 306.4 8.4 12 III n.a. n.a. n.a. n.a. n.a. 17.1 205.9 6.0 0 IV n.a. n.a. n.a. n.a. n.a. 51.8 148.7 6.1 0
2011 I n.a. n.a. n.a. n.a. n.a. 108.7 100.7 8.0 0 II n.a. n.a. n.a. n.a. n.a. 66.7 169.8 16.0 0 III n.a. n.a. n.a. n.a. n.a. 60.8 39.7 7.1 0 IV n.a. n.a. n.a. n.a. n.a. 102.7 159.2 6.6 0
2012 I n.a. n.a. n.a. n.a. n.a. 102.6 n.a. n.a. n II n.a. n.a. n.a. n.a. n.a. 71.5 n.a. n.a. n III
p n.a. n.a. n.a. n.a. n.a. n.a. n.a. n.a. n
SOURCE: Central Bank of Trinidad and Tobago and the Central Statistical Office.

8/13/2019 Economic Bulletin January 2013
http://slidepdf.com/reader/full/economic-bulletin-january-2013 59/108
Period
TABLE 9 PRODUCTION OF SELECTED FOOD CROPS
/000 Kgs/
Tomato Cabbage Cucumber Dasheen Rice Pigeon1 2 3 4 5 6
2007 3,464.7 936.8 2,175.8 2,643.3 2,412.7 7122008 1,814.7 969.9 1,557.4 2,694.2 2,677.0 8242009 1,860.6 532.8 1,363.4 3,184.5 2,225.1 8942010 2,142.2 290.5 1,291.0 2,278.5 2,259.5 1202011 1,509.9 786.9 1,193.1 2,741.4 2,666.7 2,033
2007 III 1,297.2 100.0 758.6 496.1 0.0 0 IV 964.9 562.2 498.5 563.4 422.0 34
2008 I 224.3 350.6 353.0 857.8 1,661.0 740 II 1,056.0 240.4 373.6 780.4 547.0 20 III 218.1 167.3 390.8 451.8 0.0 0 IV 316.3 211.6 440.0 604.2 469.0 62
2009 I 398.5 126.6 200.0 804.8 326.7 875
II 345.6 85.5 369.3 978.5 456.6 6 III 761.1 155.7 172.3 655.5 38.7 0 IV 355.4 165.0 621.8 745.7 1,403.1 12
2010 I 517.5 129.2 314.1 795.0 285.2 117 II 587.2 68.3 329.0 423.6 379.5 0 III 466.5 29.8 268.9 332.4 440.4 0 IV 571.0 63.2 379.0 727.5 1,154.4 2
2011 I 478.5 234.1 410.6 578.1 673.4 1,988 II 467.6 224.5 270.6 955.4 482.4 0 III 321.8 65.4 129.0 369.4 138.6 0 IV 242.0 262.9 382.9 838.5 1,372.2 44
2012 I 272.0 98.9 214.0 1,153.7 0.0 1,465 II 277.1 32.9 457.2 796.8 0.0 0 III
p n.a. n.a. n.a. n.a. n.a. n.
SOURCE: Central Statistical Office.
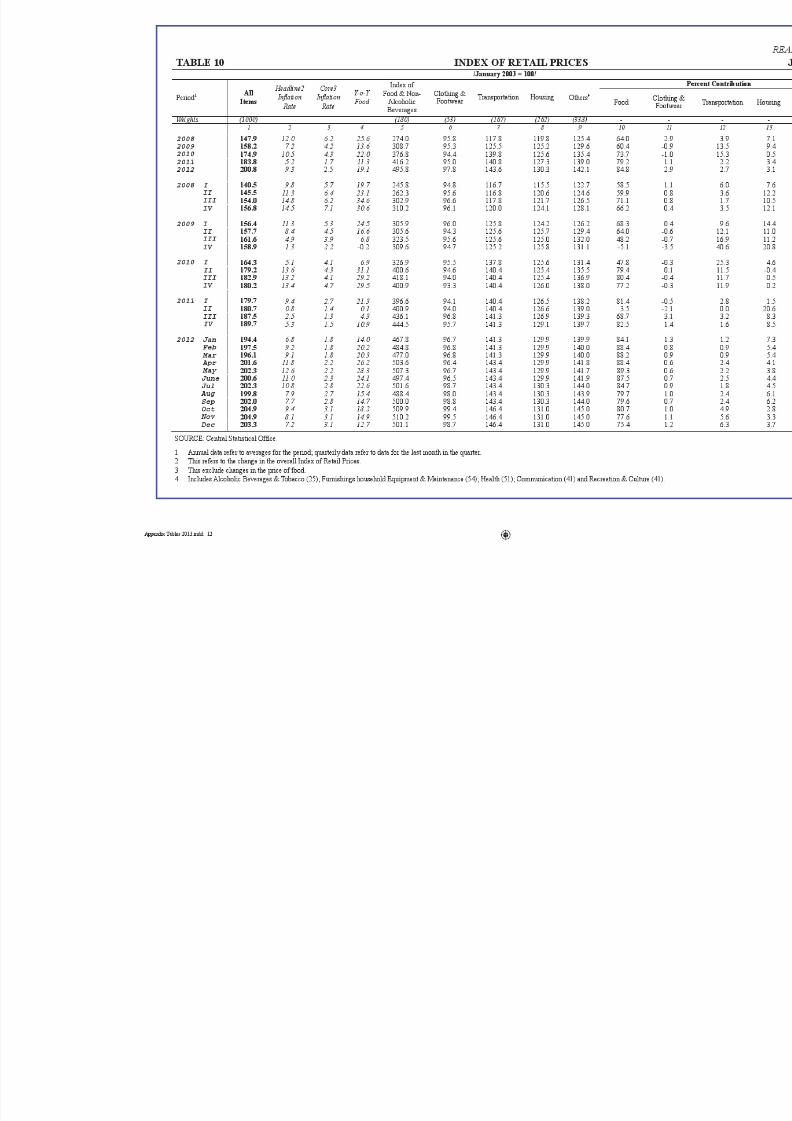
8/13/2019 Economic Bulletin January 2013
http://slidepdf.com/reader/full/economic-bulletin-january-2013 60/108
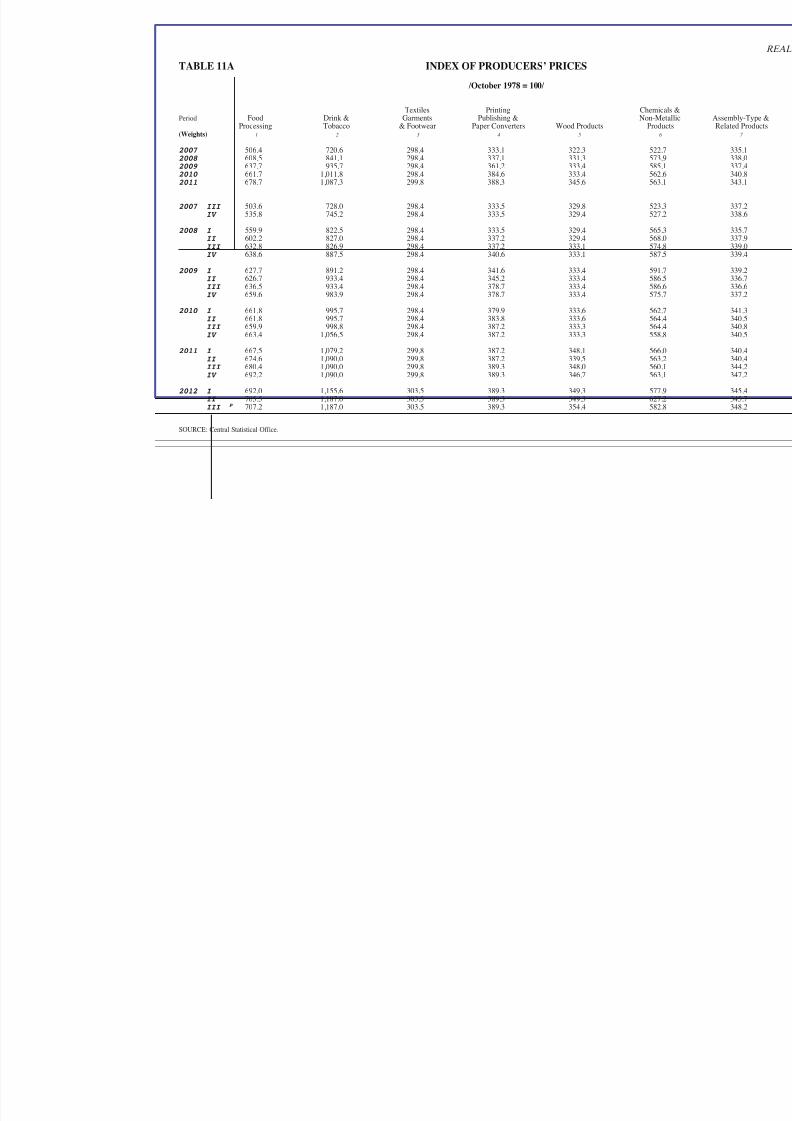
8/13/2019 Economic Bulletin January 2013
http://slidepdf.com/reader/full/economic-bulletin-january-2013 61/108
Period
(Weights)
SECIRP’SRECUDORPFOXEDNIA11ELBAT
/October 1978 = 100/
mehCgnitnirPselitxeTM-noN&gnihsilbuPstnemraG&knirDdooF
Processing Tobacco & Footwear Paper Converters Wood Products Prod1 2 3 4 5
2007 506.4 720.6 298.4 333.1 322.3 522008 608.5 841.1 298.4 337.1 331.3 572009 637.7 935.7 298.4 361.2 333.4 582010 661.7 1,011.8 298.4 384.6 333.4 562011 678.7 1,087.3 299.8 388.3 345.6 56
2007 III 503.6 728.0 298.4 333.5 329.8 52 IV 535.8 745.2 298.4 333.5 329.4 527
2008 I 559.9 822.5 298.4 333.5 329.4 56 II 602.2 827.0 298.4 337.2 329.4 56 III 632.8 826.9 298.4 337.2 333.1 574 IV 638.6 887.5 298.4 340.6 333.1 587
2009 I 627.7 891.2 298.4 341.6 333.4 59 II 626.7 933.4 298.4 345.2 333.4 58 III 636.5 933.4 298.4 378.7 333.4 58 IV 659.6 983.9 298.4 378.7 333.4 57
2010 I 661.8 995.7 298.4 379.9 333.6 56 II 661.8 995.7 298.4 383.8 333.6 564 III 659.9 998.8 298.4 387.2 333.3 564 IV 663.4 1,056.5 298.4 387.2 333.3 55
2011 I 667.5 1,079.2 299.8 387.2 348.1 56 II 674.6 1,090.0 299.8 387.2 339.5 56 III 680.4 1,090.0 299.8 389.3 348.0 560 IV 692.2 1,090.0 299.8 389.3 346.7 56
2012 I 692.0 1,155.6 303.5 389.3 349.3 577 II 705.5 1,187.0 303.5 389.3 349.3 627 III p 707.2 1,187.0 303.5 389.3 354.4 58
SOURCE: Central Statistical Office.
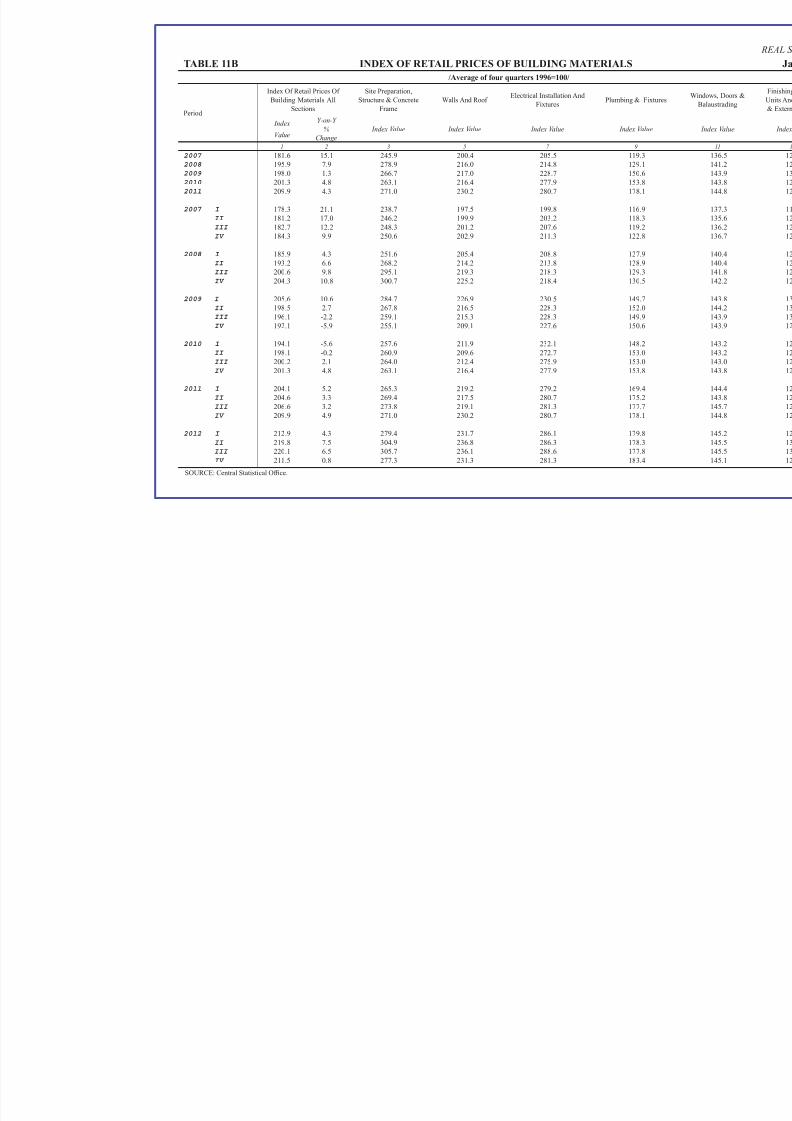
8/13/2019 Economic Bulletin January 2013
http://slidepdf.com/reader/full/economic-bulletin-january-2013 62/108
TABLE 11B INDEX OF RETAIL PRICES OF BUILDING MATERIALS
/Average of four quarters 1996=100/
Period
Index Of Retail Prices Of
Building Materials All
Sections
Site Preparation,
Structure & Concrete
Frame
Walls And Roof Electrical Installation And
Fixtures Plumbing & Fixtu
Index
Value
Y-on-Y
%Change
Index Value Index Value Index Value Index Value
1 2 3 5 7 9
2007 181.6 15.1 245.9 200.4 205.5 119.3
2008 195.9 7.9 278.9 216.0 214.8 129.1
2009 198.0 1.3 266.7 217.0 228.7 150.6
2010 201.3 4.8 263.1 216.4 277.9 153.8
2011 209.9 4.3 271.0 230.2 280.7 178.1
2007 I 178.3 21.1 238.7 197.5 199.8 116.9
II 181.2 17.0 246.2 199.9 203.2 118.3
III 182.7 12.2 248.3 201.2 207.6 119.2
IV 184.3 9.9 250.6 202.9 211.3 122.8
2008 I 185.9 4.3 251.6 205.4 208.8 127.9
II 193.2 6.6 268.2 214.2 213.8 128.9
III 200.6 9.8 295.1 219.3 218.3 129.3
IV 204.3 10.8 300.7 225.2 218.4 130.5
2009 I 205.6 10.6 284.7 226.9 230.5 149.7
II 198.5 2.7 267.8 216.5 228.3 152.0
III 196.1 -2.2 259.1 215.3 228.3 149.9
IV 192.1 -5.9 255.1 209.1 227.6 150.6
2010 I 194.1 -5.6 257.6 211.9 232.1 148.2
II 198.1 -0.2 260.9 209.6 272.7 153.0
III 200.2 2.1 264.0 212.4 275.9 153.0
IV 201.3 4.8 263.1 216.4 277.9 153.8
2011 I 204.1 5.2 265.3 219.2 279.2 169.4 II 204.6 3.3 269.4 217.5 280.7 175.2
III 206.6 3.2 273.8 219.1 281.3 177.7
IV 209.9 4.9 271.0 230.2 280.7 178.1
2012 I 212.9 4.3 279.4 231.7 286.1 179.8
II 219.8 7.5 304.9 236.8 286.3 178.3
III 220.1 6.5 305.7 236.1 288.6 177.8
IV 211.5 0.8 277.3 231.3 281.3 183.4
SOURCE: Central Statistical Of fice.
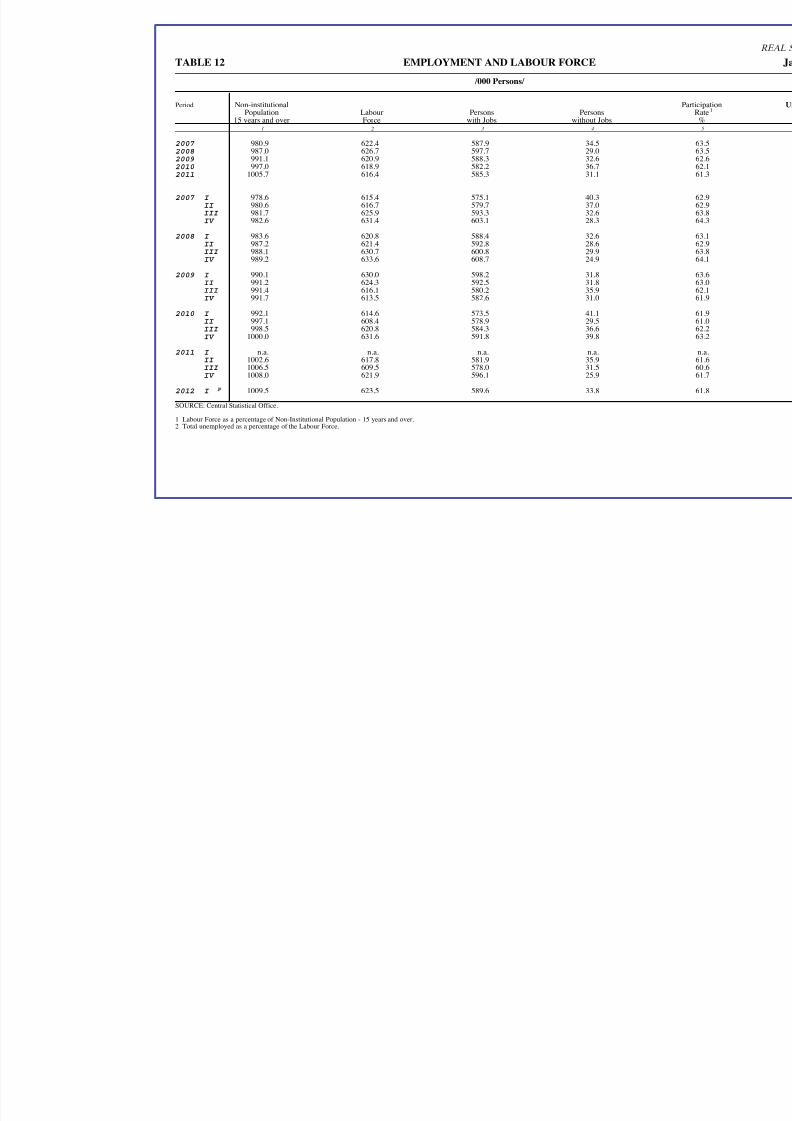
8/13/2019 Economic Bulletin January 2013
http://slidepdf.com/reader/full/economic-bulletin-january-2013 63/108
Period
TABLE 12 EMPLOYMENT AND LABOUR FORCE
/000 Persons/
Non-institutional Population Labour Persons Persons
15 years and over Force with Jobs without Jobs
1 2 3 4
2007 980.9 622.4 587.9 34.5 2008 987.0 626.7 597.7 29.0 2009 991.1 620.9 588.3 32.6 2010 997.0 618.9 582.2 36.7 2011 1005.7 616.4 585.3 31.1
2007 I 978.6 615.4 575.1 40.3 II 980.6 616.7 579.7 37.0 III 981.7 625.9 593.3 32.6 IV 982.6 631.4 603.1 28.3
2008 I 983.6 620.8 588.4 32.6 II 987.2 621.4 592.8 28.6 III 988.1 630.7 600.8 29.9
IV 989.2 633.6 608.7 24.9
2009 I 990.1 630.0 598.2 31.8 II 991.2 624.3 592.5 31.8 III 991.4 616.1 580.2 35.9 IV 991.7 613.5 582.6 31.0
2010 I 992.1 614.6 573.5 41.1 II 997.1 608.4 578.9 29.5 III 998.5 620.8 584.3 36.6 IV 1000.0 631.6 591.8 39.8
2011 I n.a. n.a. n.a. n.a. II 1002.6 617.8 581.9 35.9 III 1006.5 609.5 578.0 31.5 IV 1008.0 621.9 596.1 25.9
2012 I p 1009.5 623.5 589.6 33.8
SOURCE: Central Statistical Office.
1 Labour Force as a percentage of Non-Institutional Population - 15 years and over.2 Total unemployed as a percentage of the Labour Force.
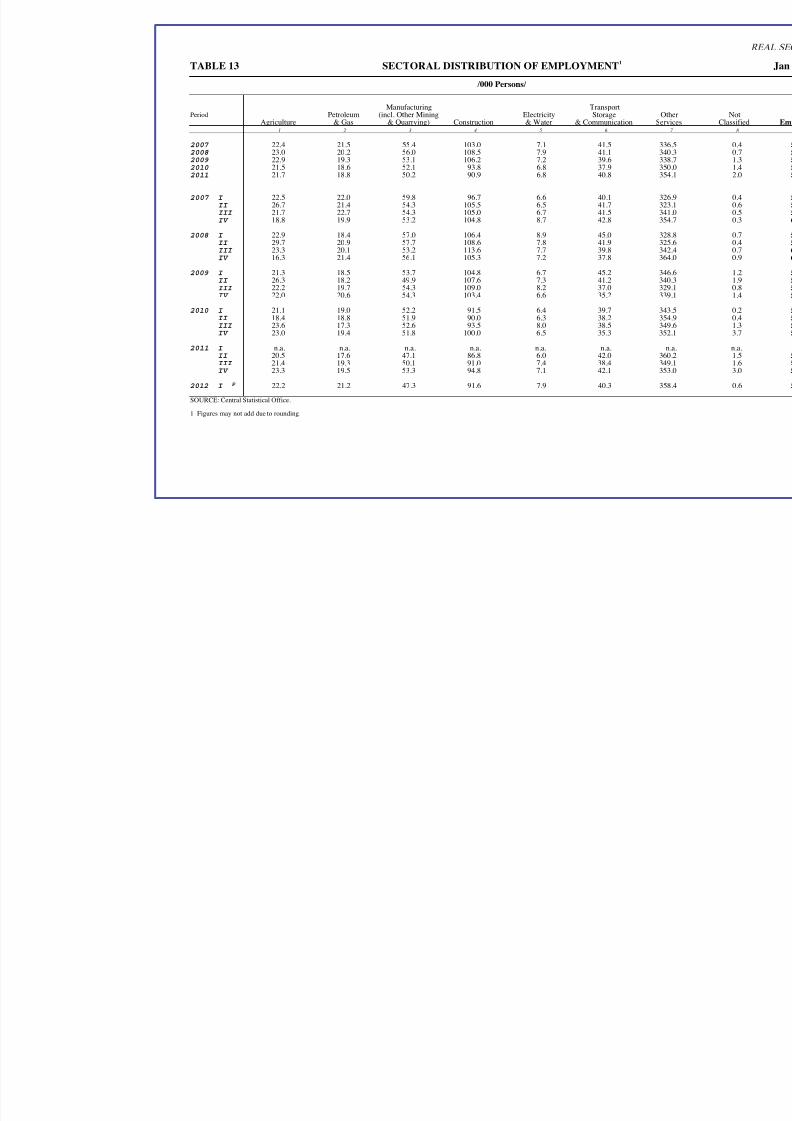
8/13/2019 Economic Bulletin January 2013
http://slidepdf.com/reader/full/economic-bulletin-january-2013 64/108
Period
TABLE 13 SECTORAL DISTRIBUTION OF EMPLOYMENT 1
/000 Persons/
Manufacturing TransportPetroleum (incl. Other Mining Electricity Storage
Agriculture & Gas & Quarrying) Construction & Water & Communication
1 2 3 4 5 6
2007 22.4 21.5 55.4 103.0 7.1 41.5 2008 23.0 20.2 56.0 108.5 7.9 41.1 2009 22.9 19.3 53.1 106.2 7.2 39.6 2010 21.5 18.6 52.1 93.8 6.8 37.9 2011 21.7 18.8 50.2 90.9 6.8 40.8
2007 I 22.5 22.0 59.8 96.7 6.6 40.1 II 26.7 21.4 54.3 105.5 6.5 41.7 III 21.7 22.7 54.3 105.0 6.7 41.5 IV 18.8 19.9 53.2 104.8 8.7 42.8
2008 I 22.9 18.4 57.0 106.4 8.9 45.0 II 29.7 20.9 57.7 108.6 7.8 41.9 III 23.3 20.1 53.2 113.6 7.7 39.8
IV 16.3 21.4 56.1 105.3 7.2 37.8
2009 I 21.3 18.5 53.7 104.8 6.7 45.2 II 26.3 18.2 49.9 107.6 7.3 41.2 III 22.2 19.7 54.3 109.0 8.2 37.0 IV 22.0 20.6 54.3 103.4 6.6 35.2
2010 I 21.1 19.0 52.2 91.5 6.4 39.7 II 18.4 18.8 51.9 90.0 6.3 38.2 III 23.6 17.3 52.6 93.5 8.0 38.5 IV 23.0 19.4 51.8 100.0 6.5 35.3
2011 I n.a. n.a. n.a. n.a. n.a. n.a. II 20.5 17.6 47.1 86.8 6.0 42.0 III 21.4 19.3 50.1 91.0 7.4 38.4 IV 23.3 19.5 53.3 94.8 7.1 42.1
2012 I
p
22.2 21.2 47.3 91.6 7.9 40.3 SOURCE: Central Statistical Office.
1 Figures may not add due to rounding.

8/13/2019 Economic Bulletin January 2013
http://slidepdf.com/reader/full/economic-bulletin-january-2013 65/108
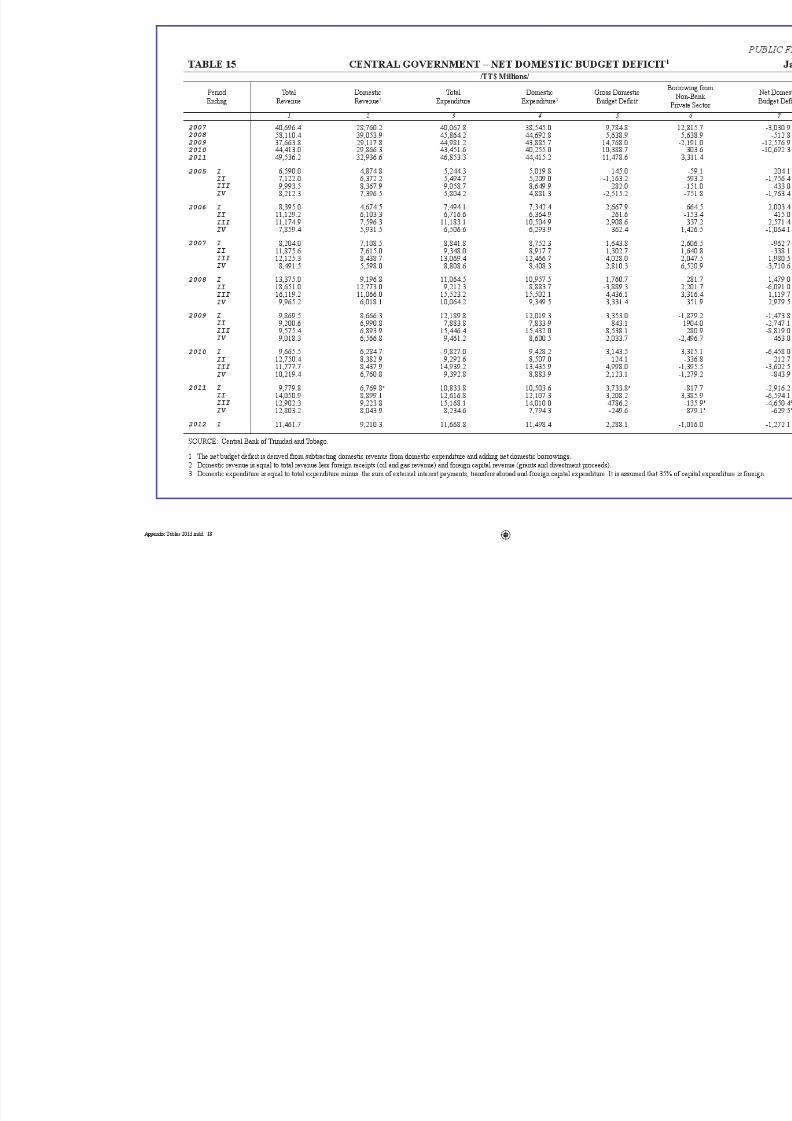
8/13/2019 Economic Bulletin January 2013
http://slidepdf.com/reader/full/economic-bulletin-january-2013 66/108

8/13/2019 Economic Bulletin January 2013
http://slidepdf.com/reader/full/economic-bulletin-january-2013 67/108
TBEDLANR ETXE – TNEMNR EVOGLAR TNEC61ELBAT
/US$ Millions/
Period Ending
Central Government
Receipts Amortization Debt Conversion Valuation Adjustment Balan
2007 0.00.09.161.3812008 0.00.02.669.0812009 0.00.09.9336.982
2010 0.00.06.172.0522011 0.00.02.6019.013
2007 I 0.00.03.427.7
II 0.00.06.51.38 III 0.00.03.523.71 IV 0.00.07.60.57
2008 I 0.00.08.425.43
II 0.00.00.76.64 III 0.00.07.527.15 IV 0.00.07.81.84
2009 I 0.00.05.523.46 II 0.00.03.254.52
III 0.00.07.5523.801 IV 0.00.04.66.19
2010 I 0.00.06.323.92 II 0.00.02.60.24 III
IV
44.7
134.4
32.0
9.8
0.0
0.0
0.0
0.0
2011 I
II
III
IV
6.0
33.2
1.6
270.2
34.2
15.2
38.9
17.9
0.0
0.0
0.0
0.0
0.0
0.0
0.0
0.0
2012 I
II
III
2.5
56.4
3.5
38.0
17.6
37.2
0.0
0.0
0.0
0.0
0.0
0.0
* Includes the balance of non-government public sector debt (2005/2006).
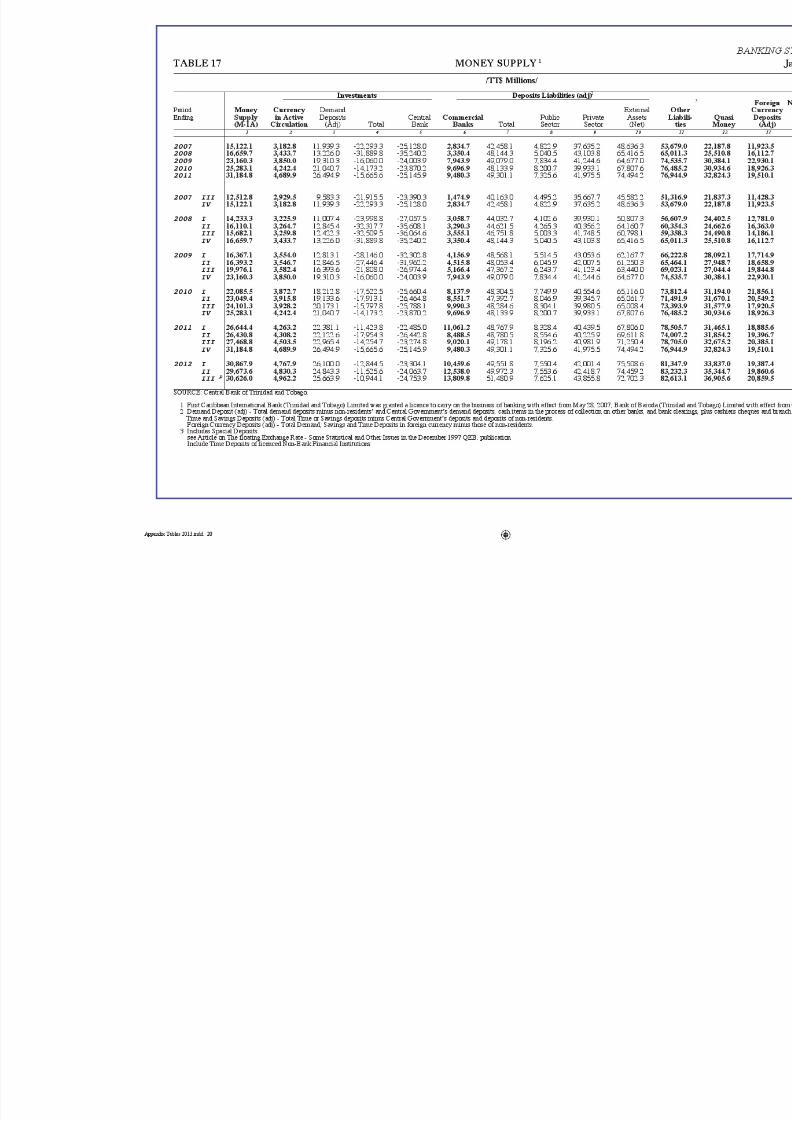
8/13/2019 Economic Bulletin January 2013
http://slidepdf.com/reader/full/economic-bulletin-january-2013 68/108

8/13/2019 Economic Bulletin January 2013
http://slidepdf.com/reader/full/economic-bulletin-january-2013 69/108

8/13/2019 Economic Bulletin January 2013
http://slidepdf.com/reader/full/economic-bulletin-january-2013 70/108
Period
Ending
TABLE 19 COMMERCIAL BANKS : OUTSTANDING LOANS TO BUSINESSES - PRIVAT
/TT$ Millions/
ProductionManufacturing: Of WhichgnitnirPselitxeT
Food Garments Publishing Wood & Che
Production Agriculture Petroleum Manufacturing Drink Footwear & Paper Related & Non& Tobacco & Headwear Converters Products Ma1 2 3 4 5 6 7 8
2007 5,025.3 83.9 751.7 2,406.1 487.2 134.6 394.8 80.4 342008 6,386.7 141.0 995.1 3,213.4 730.0 283.5 471.3 116.1 372009 6,380.5 106.8 417.4 3,130.3 810.0 376.3 370.5 136.5 342010 6,169.0 96.9 472.9 3,116.7 828.0 509.3 422.7 96.3 402011 7,101.1 95.4 946.8 3,375.6 1,007.8 505.3 486.2 116.0 40
2007 III 4,834.7 81.7 589.0 2,575.3 416.4 255.6 363.2 97.2 35 IV 5,025.3 83.9 751.7 2,406.1 487.2 134.6 394.8 80.4 34
2008 I 5,514.2 94.5 812.0 2,710.0 578.4 122.1 398.9 186.2 36 II 5,456.5 99.4 716.7 2,857.2 628.0 129.3 408.1 204.6 36 III 5,686.1 123.9 710.4 2,956.8 706.4 146.9 410.2 99.2 36
IV 6,386.7 141.0 995.1 3,213.4 730.0 283.5 471.3 116.1 37
2009 I 6,880.0 140.4 700.5 3,218.2 799.1 304.3 408.1 110.3 40 II 6,937.0 137.1 754.5 3,281.2 758.4 347.3 410.1 124.7 38 III 6,770.8 136.3 593.9 3,225.8 873.6 368.2 386.8 126.7 38 IV 6,380.5 106.8 417.4 3,130.3 810.0 376.3 370.5 136.5 34
2010 I 6,322.4 110.0 489.3 2,950.8 696.3 377.4 327.6 112.0 38 II 6,049.7 104.6 457.0 2,881.0 688.7 370.1 356.3 104.6 39 III 5,904.3 86.1 446.6 2,740.8 680.7 352.4 355.0 85.5 35 IV 6,169.0 96.9 472.9 3,116.7 828.0 509.3 422.7 96.3 40
2011 I 5,868.4 95.7 473.1 2,919.3 791.6 400.5 366.8 98.7 47 II 6,094.0 92.2 442.9 3,051.3 765.5 424.5 356.7 112.8 52 III 6,881.4 97.3 931.4 3,234.6 920.8 414.0 443.3 105.3 50 IV 7,101.1 95.4 946.8 3,375.6 1,007.8 505.3 486.2 116.0 40
2012 I 7,022.7 93.8 1,029.9 3,431.6 1,088.7 595.9 423.5 104.4 37 II 7,398.4 109.6 995.6 3,605.0 920.4 592.8 432.7 115.9 52 III p 7,319.8 115.4 976.7 3,551.8 892.2 590.3 442.0 112.8 5
SOURCE: Central Bank of Trinidad and Tobago.

8/13/2019 Economic Bulletin January 2013
http://slidepdf.com/reader/full/economic-bulletin-january-2013 71/108
Period
Ending
TABLE 19 (Cont’d) COMMERCIAL BANKS : OUTSTANDING LOANS TO BUSINESSES - PRIVAT
/TT$ Millions/
ServicesnoitacudEecnaniF larutluCecnarusnItropsnarTsletoH
& Guest Storage & Real Electricity & Community
Services Distribution Houses & Communication Estate & Water Services 13 14 15 16 17 18 19
2007 13,169.3 2,743.7 478.4 908.4 7,888.5 655.2 104.9 2008 14,821.6 3,426.9 737.3 1,099.4 8,313.7 573.4 94.6 2009 13,150.2 2,657.0 1,153.7 701.1 7,477.8 545.2 97.4 2010 11,490.9 2,354.5 922.2 768.0 6,489.4 455.6 91.7 2011 11,712.5 2,314.4 781.2 886.2 6,856.8 405.3 98.9
2007 III 12,934.3 2,720.1 710.1 962.3 7,420.7 671.9 94.7 IV 13,169.3 2,743.7 478.4 908.4 7,888.5 655.2 104.9
2008 I 14,385.9 2,838.9 553.7 1,004.3 8,701.8 755.8 90.1 II 14,239.3 2,939.2 655.1 1,059.8 8,446.2 587.7 73.3 III 14,643.5 2,971.7 682.5 1,051.4 8,711.5 584.6 127.9 IV 14,821.6 3,426.9 737.3 1,099.4 8,313.7 573.4 94.6
2009 I 14,947.8 3,183.6 764.6 860.7 8,876.2 626.6 102.0 II 13,923.9 3,051.2 772.1 979.3 7,869.8 569.4 89.2 III 12,832.8 2,898.8 769.4 755.3 7,133.0 568.0 88.1 IV 13,150.2 2,657.0 1,153.7 701.1 7,477.8 545.2 97.4
2010 I 12,420.5 2,619.5 1,079.4 857.9 6,733.8 528.8 97.8 II 12,046.4 2,527.9 1,028.0 749.9 6,741.0 518.2 84.4 III 12,320.0 2,347.3 898.9 632.3 7,408.2 482.3 83.5 IV 11,490.9 2,354.5 922.2 768.0 6,489.4 455.6 91.7
2011 I 12,273.6 2,508.2 671.7 716.4 7,477.9 446.2 85.6 II 11,568.6 2,232.4 623.6 673.1 7,109.9 431.2 87.4 III 11,725.0 2,233.8 763.6 637.5 7,187.8 418.3 78.9 IV 11,712.5 2,314.4 781.2 886.2 6,856.8 405.3 98.9
2012 I 11,710.4 2,259.9 828.5 895.2 6,910.4 344.7 86.1 II 11,620.0 2,373.5 820.1 908.8 6,658.6 404.2 86.3
III p 12,393.8 2,370.5 842.5 1,007.5 7,335.5 388.9 87.4
SOURCE: Central Bank of Trinidad and Tobago.
1 Includes a small portion of loans which are unclassified.

8/13/2019 Economic Bulletin January 2013
http://slidepdf.com/reader/full/economic-bulletin-january-2013 72/108

8/13/2019 Economic Bulletin January 2013
http://slidepdf.com/reader/full/economic-bulletin-january-2013 73/108

8/13/2019 Economic Bulletin January 2013
http://slidepdf.com/reader/full/economic-bulletin-january-2013 74/108
PeriodEnding
2
3 4 5
TABLE 22 COMMERCIAL BANKS LIQUID ASSETS 1
Percentage of Prescribed Liabilities (unless otherwise stated)
Reserve Position LiquDeposits at Central Bank
PrescribedDeposits Required Cash Excess (+) or Excess (+) or Cash Special
Liabilities (Adj.) Reserves Reserves Shortage (-) Shortage (-) Reserves Deposits 1 2 3 4 5 6 7
2007 32,958.2 11.0 11.9 0.9 226.5 11.9 6.5 2008 37,745.3 17.0 22.1 5.1 1,541.5 22.1 6.0 2009 47,386.5 17.0 21.3 4.3 2,570.0 21.3 9.4 2010 52,334.7 17.0 20.3 3.3 1,909.7 20.3 10.6 2011 57,336.5 17.0 26.9 9.9 5,573.8 26.9 9.8
2007 III 31,619.1 11.0 13.4 2.4 210.4 13.4 6.7 IV 32,958.2 11.0 11.9 0.9 226.5 11.9 6.5
2008 I 33,833.1 13.0 16.6 3.6 453.6 16.6 6.4 II 34,860.0 13.0 19.5 6.5 619.6 19.5 6.3 III 35,554.0 15.0 17.1 2.1 1,012.1 17.1 6.2 IV 37,745.3 17.0 22.1 5.1 1,541.5 22.1 6.0
2009 I 39,824.1 17.0 23.9 6.9 2,778.6 23.9 5.8 II 41,408.2 17.0 20.3 3.3 1,718.7 20.3 5.6 III 42,521.2 17.0 24.9 7.9 2,612.6 24.9 5.5 IV 47,386.5 17.0 21.3 4.3 2,570.0 21.3 9.4
2010 I 49,318.8 17.0 20.7 3.7 1,805.1 20.7 9.1 II 49,867.1 17.0 23.8 6.8 2,922.4 23.8 9.0 III 50,888.2 17.0 22.9 5.9 3,109.5 22.9 8.9 IV 52,334.7 17.0 20.3 3.3 1,909.7 20.3 10.6
2011 I 52,385.3 17.0 20.7 3.7 1,643.9 20.7 10.6 II 52,903.5 17.0 23.5 6.5 1,561.4 23.5 10.5 III 54,904.7 17.0 25.4 8.4 4,551.4 25.4 10.2 IV 57,336.5 17.0 26.9 9.9 5,573.8 26.9 9.8
2012 I 58,862.4 17.0 24.5 7.5 5,628.8 24.5 12.2 II 59,515.3 17.0 21.3 4.3 2,155.7 21.3 12.1 III
p 61,361.8 17.0 21.0 4.0 3,865.0 21.0 11.8
SOURCE: Central Bank of Trinidad and Tobago.
1 See note 1 on Table 18.2 Represents total demand, savings and time deposits, short-term credit instruments with a maturity up to and including one year and all fund raising instruments maturing within These are all denominated in local currency and are adjusted for inter-bank and intra-bank cheques and other items credited to the banks on the books of the Central Bank.3 This includes the total of required and any excess reserves.4 Represents the excess/shortage as an average through the month. Annual data reflect an average of the 12 monthly averages.5 See note 1 on Table 18.

8/13/2019 Economic Bulletin January 2013
http://slidepdf.com/reader/full/economic-bulletin-january-2013 75/108

8/13/2019 Economic Bulletin January 2013
http://slidepdf.com/reader/full/economic-bulletin-january-2013 76/108

8/13/2019 Economic Bulletin January 2013
http://slidepdf.com/reader/full/economic-bulletin-january-2013 77/108
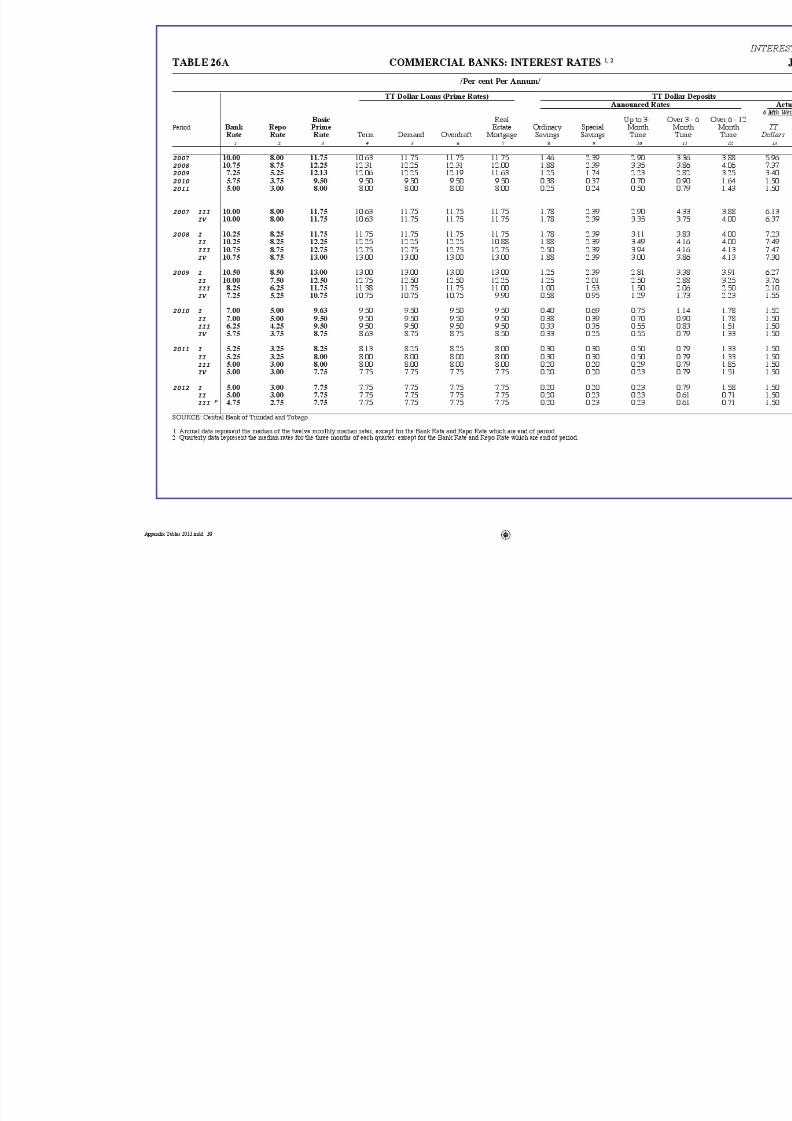
8/13/2019 Economic Bulletin January 2013
http://slidepdf.com/reader/full/economic-bulletin-january-2013 78/108
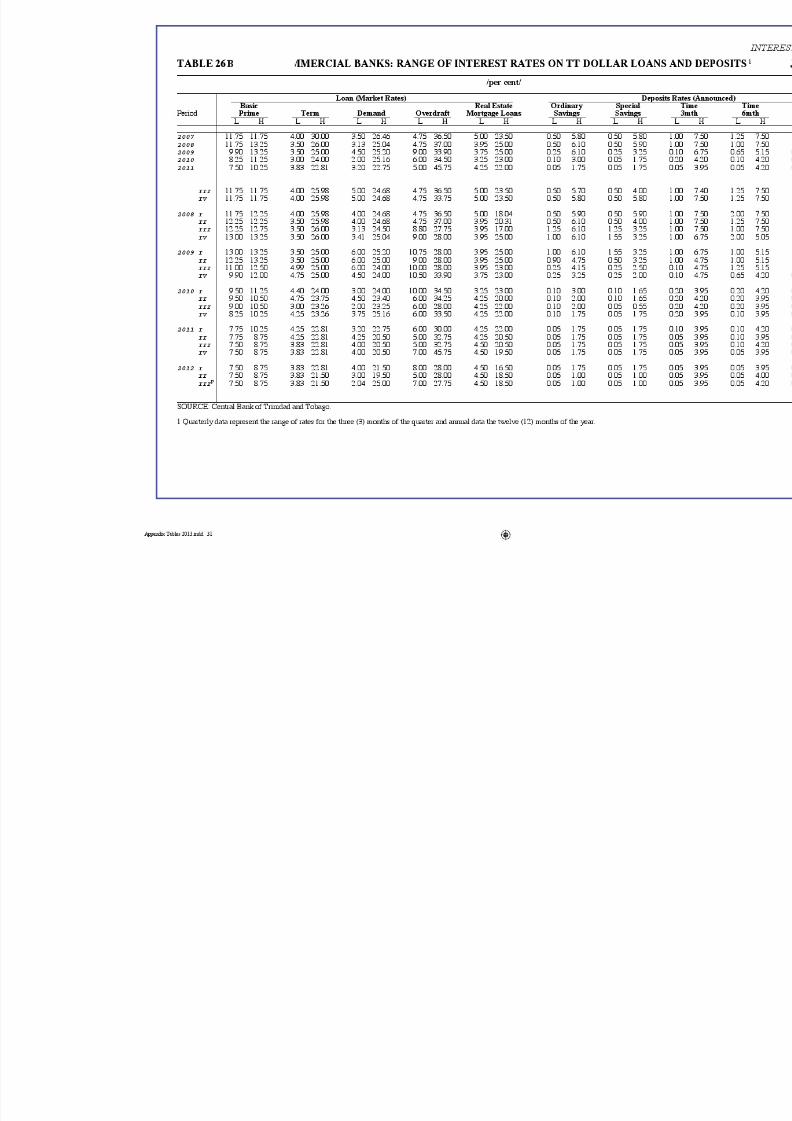
8/13/2019 Economic Bulletin January 2013
http://slidepdf.com/reader/full/economic-bulletin-january-2013 79/108
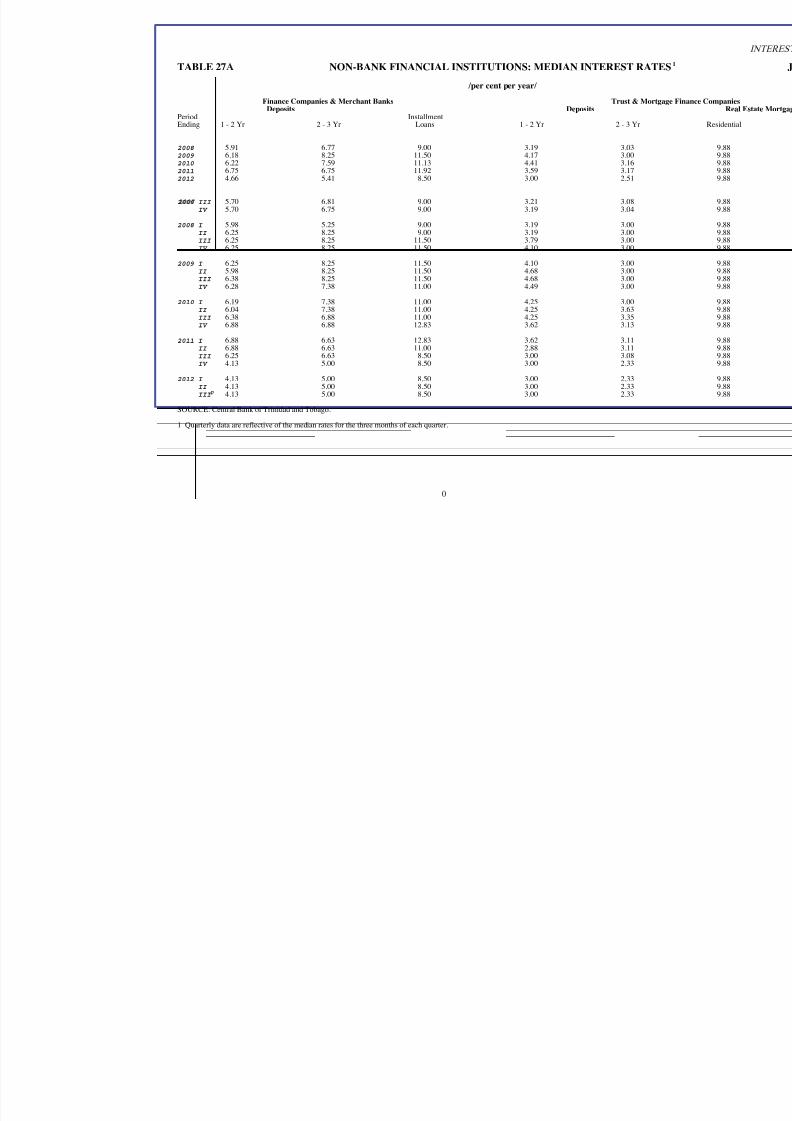
8/13/2019 Economic Bulletin January 2013
http://slidepdf.com/reader/full/economic-bulletin-january-2013 80/108
PeriodEnding
2006
TABLE 27 NON-BANK FINANCIAL INSTITUTIONS: MEDIAN INTEREST RAT
/per cent per year/
Finance Companies & Merchant Banks Trust & MortDeposits Deposits
Installment1 - 2 Yr 2 - 3 Yr Loans 1 - 2 Yr 2 - 3 Yr
2008 5.91 6.77 9.00 3.19 3.03 2009 6.18 8.25 11.50 4.17 3.00 2010 6.22 7.59 11.13 4.41 3.16 2011 6.75 6.75 11.92 3.59 3.17 2012 4.66 5.41 8.50 3.00 2.51
III 5.70 6.81 9.00 3.21 3.08 IV 5.70 6.75 9.00 3.19 3.04
2008 I 5.98 5.25 9.00 3.19 3.00 II 6.25 8.25 9.00 3.19 3.00 III 6.25 8.25 11.50 3.79 3.00 IV 6.25 8.25 11.50 4.10 3.00
2009 I 6.25 8.25 11.50 4.10 3.00 II 5.98 8.25 11.50 4.68 3.00 III 6.38 8.25 11.50 4.68 3.00 IV 6.28 7.38 11.00 4.49 3.00
2010 I 6.19 7.38 11.00 4.25 3.00 II 6.04 7.38 11.00 4.25 3.63 III 6.38 6.88 11.00 4.25 3.35 IV 6.88 6.88 12.83 3.62 3.13
2011 I 6.88 6.63 12.83 3.62 3.11 II 6.88 6.63 11.00 2.88 3.11 III 6.25 6.63 8.50 3.00 3.08 IV 4.13 5.00 8.50 3.00 2.33
2012 I 4.13 5.00 8.50 3.00 2.33 II 4.13 5.00 8.50 3.00 2.33 III p 4.13 5.00 8.50 3.00 2.33
SOURCE: Central Bank of Trinidad and Tobago.
1 Quarterly data are reflective of the median rates for the three months of each quarter.
2007
0
A

8/13/2019 Economic Bulletin January 2013
http://slidepdf.com/reader/full/economic-bulletin-january-2013 81/108

8/13/2019 Economic Bulletin January 2013
http://slidepdf.com/reader/full/economic-bulletin-january-2013 82/108
IN
EUSSITEK R AMYR AMIR P:TEK R AMLATIPACDNAYENOM82ELBAT
/TT$ Millions/
Period
Ending
GovernmentBond
Securities
Company Shares
New Issues 1
Company Shares
Bonus Issues 1
321
2008 7.74.8370.002,1
2009 0.00.06.847,22010 0.08.230.494,4
2011 0.00.00.005,1
2012 p 0.00.00.005,2
2008 I 0.04.8370.0
II 7.70.00.0
III 0.00.00.002,1
IV 0.00.00.0
2009 I 0.00.00.0
II 0.00.05.841,2
III 0.00.06.863
IV 0.00.05.132
2010 I 0.03.30.0073
II 0.00.00.497
III 0.05.920.0
IV 0.00.00.0
2011 I 0.00.00.0
II 0.00.00.0
III 0.00.00.0
IV 0.00.00.005,1
2012 I 0.00.00.0
II 0.00.00.0
III 0.00.00.005,2 IV 0.00.00.0
SOURCE: Central Bank of Trinidad and Tobago.
1 Par Value Shares traded on the Trinidad and Tobago Stock Exchange and refers to only new company listings.
2 Public loan issues of State Corporations and Other State Enterprises (Contingent Liabilities). Also includes securities issued by the Home Mortgage Bank from QI 200

8/13/2019 Economic Bulletin January 2013
http://slidepdf.com/reader/full/economic-bulletin-january-2013 83/108
Period
Ending
(1)
H.6 MONEY AND CAPITAL MARKET: SECONDARY MARKET TURNOVE
/TT$ Millions/
Gov’t Securities Treasury Bills Public ComPurchases Sales
tekraMecaFecaFecaFValue Number of Value Number of Value Number of Value Num
($Mn) Transactions ($Mn) Transactions ($Mn) Transactions ($Mn) Trans1 2 3 4 5 6 7
2007 _ _ 15 18 1,025 300 2,138 17,72008 575 46 93 47 1,514 537 2,191 22,02009 699 87 26 263 1,352 308 1,474 9,2010 1,738 137 0 9 139 52 865 8,42011 177 46 4 30 1,356 233 1,032 9,22012 1,381 97 1 16 98 20 747 8,7
2007 I _ _ 0 1 134 27 779 5,4 II _ _ 1 5 290 66 275 4,0 III _ _ 0 5 221 76 623 4,3 IV _ _ 13 7 380 131 461 3,
2008 I 8 4 27 4 395 112 353 4,0 II 249 5 2 14 509 169 757 8, III 127 20 1 14 302 111 535 5, IV 192 17 63 15 308 145 546 4,
2009 I 38 9 1 21 0 8 382 2, II 83 18 4 24 256 56 541 2, III 227 32 0 13 62 6 331 2, IV 350 28 21 205 1,034 238 221 2,4
2010 I 780 11 0 4 0 5 239 2,4 II 469 46 0 3 0 2 216 2,0 III 383 36 0 2 64 7 139 1,7 IV 107 44 0 0 75 38 271 2,
2011 I 83 17 0 2 115 47 194 2, II 3 6 0 4 241 37 272 2, III 32 7 1 14 737 116 411 2, IV 59 16 3 10 264 33 155 1,
2012 I 197 7 0 3 59 5 171 2,0 II 540 45 0 3 39 11 165 2,2 III 51 16 0 8 0 3 241 2,5 IV
p 593 29 0 2 0 1 169 1,
SOURCE: Central Bank of Trinidad and Tobago and the Trinidad and Tobago Stock Exchange.
1 In January 2008 the platform of the Trinidad and Tobago Stock Exchange was modified to accommodate secondary market trading in government securities.2 Data refer to the double transaction of buying and selling.
TABLE 29
INTERE

8/13/2019 Economic Bulletin January 2013
http://slidepdf.com/reader/full/economic-bulletin-january-2013 84/108
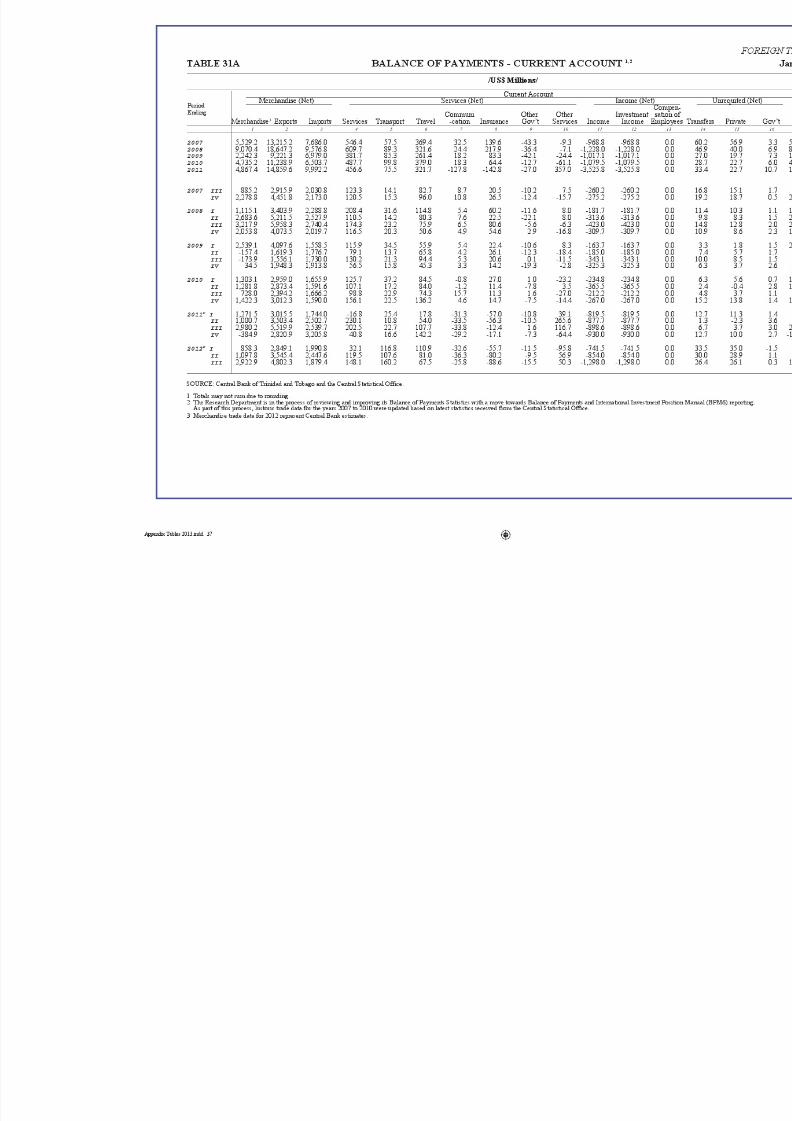
8/13/2019 Economic Bulletin January 2013
http://slidepdf.com/reader/full/economic-bulletin-january-2013 85/108

8/13/2019 Economic Bulletin January 2013
http://slidepdf.com/reader/full/economic-bulletin-january-2013 86/108
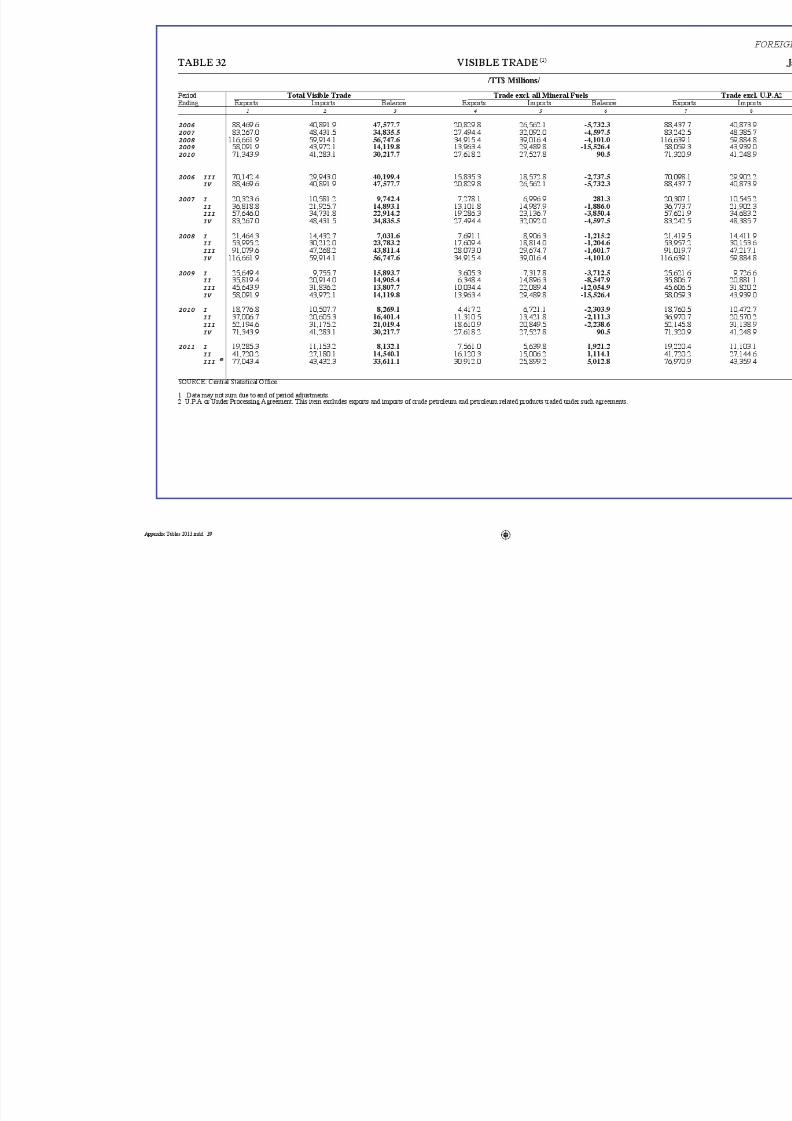
8/13/2019 Economic Bulletin January 2013
http://slidepdf.com/reader/full/economic-bulletin-january-2013 87/108

8/13/2019 Economic Bulletin January 2013
http://slidepdf.com/reader/full/economic-bulletin-january-2013 88/108
TABLE 33 COMMERCIAL BANKS FOREIGN CURRENCY ACCOUNTS SIZE DISTRIBUTION
/$US/
QUARTER I — 2012
SIZE OF DEPOSITS DEMAND DEPOSITS SAVINGS DEPOSITS TIME DEPOSITS
No. VALUE No. VALUE No. VAL
UNDER $5,000 2,237 2,551,582 53,221 52,952,181 1,442 3
$5,000 - $50,000 839 17,027,046 17,177 276,140,203 2,130 82
$50,001 - $100,000 248 17,827,383 2,089 144,497,375 375 36
$100,001 - $200,000 231 32,701,905 1,193 162,481,394 298 40
$200,001 - $500,000 205 65,007,624 682 205,215,779 186 58
OVER $500,000 255 825,250,274 372 700,712,341 171 562
TOTAL 4,015 960,365,814 74,734 1,541,999,273 4,602 782
QUARTER II — 2012
SIZE OF DEPOSITS DEMAND DEPOSITS SAVINGS DEPOSITS TIME DEPOSITS
No. VALUE No. VALUE No. VAL
UNDER $5,000 2,242 2,424,429 52,267 51,760,575 1,265 3
$5,000 - $50,000 859 16,582,326 17,905 277,852,595 2,258 36
$50,001 - $100,000 250 17,805,393 2,257 151,671,745 374 26
$100,001 - $200,000 215 30,226,318 1,197 158,696,313 293 38
$200,001 - $500,000 213 66,959,004 737 211,886,862 186 56
OVER $500,000 240 989,981,372 377 667,292,064 160 470
TOTAL 4,019 1,123,978,842 74,740 1,519,160,154 4,536 631
QUARTER III — 2012
SIZE OF DEPOSITS DEMAND DEPOSITS SAVINGS DEPOSITS TIME DEPOSITS
No. VALUE No. VALUE No. VAL
UNDER $5,000 2,382 2,444,201 53,395 53,843,213 1,199 5
$5,000 - $50,000 869 17,429,947 17,918 280,773,055 2,240 36
$50,001 - $100,000 233 16,766,575 2,299 155,531,228 374 26
$100,001 - $200,000 202 28,439,456 1,227 164,944,599 282 37
$200,001 - $500,000 217 68,023,175 719 214,913,547 183 56
OVER $500,000 241 923,263,531 374 737,071,807 167 566
TOTAL 4,144 1,056,366,885 75,932 1,607,077,449 4,445 728
SOURCE: Central Bank of Trinidad and Tobago.
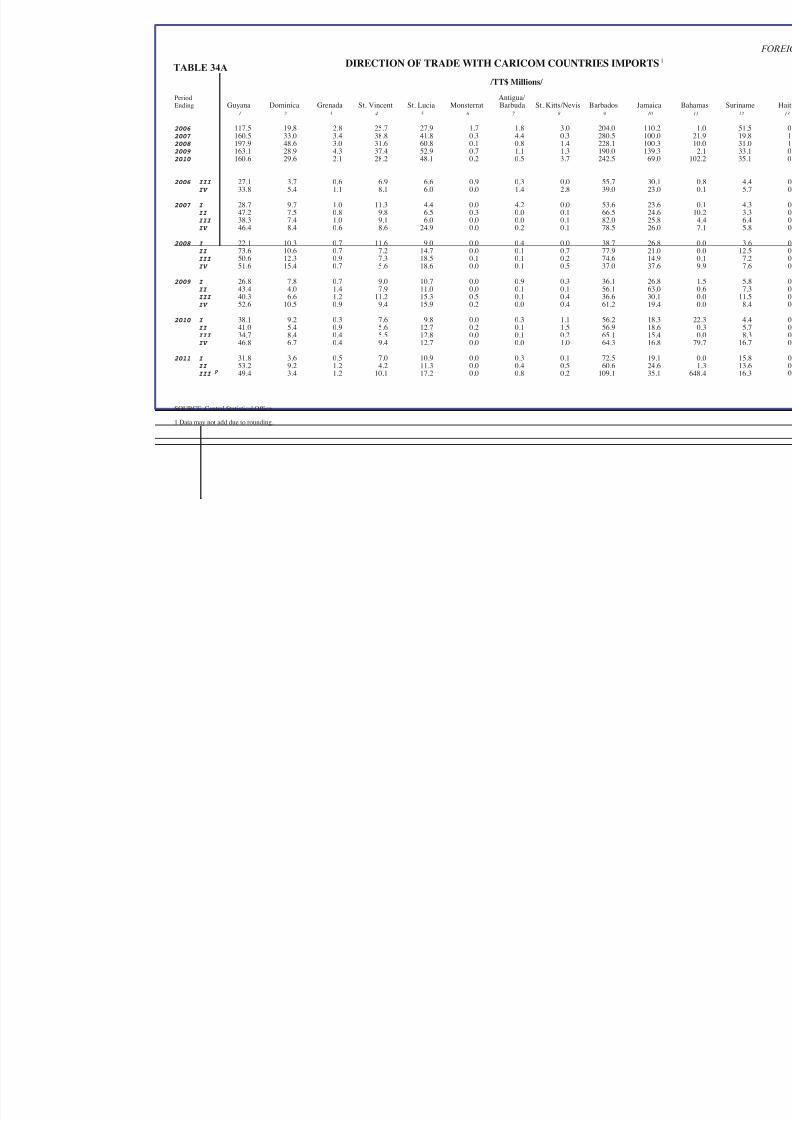
8/13/2019 Economic Bulletin January 2013
http://slidepdf.com/reader/full/economic-bulletin-january-2013 89/108
PeriodEnding
STROPMISEIRTNUOCMOCIRACHTIWEDARTFONOITCERID
/TT$ Millions/
Antigua/Guyana Dominica Grenada St. Vincent St. Lucia Monsterrat Barbuda St. Kitts/Nevis Barbados Jamaica
1 2 3 4 5 6 7 8 9 10
2006 117.5 19.8 2.8 25.7 27.9 1.7 1.8 3.0 204.0 110.22007 160.5 33.0 3.4 38.8 41.8 0.3 4.4 0.3 280.5 100.02008 197.9 48.6 3.0 31.6 60.8 0.1 0.8 1.4 228.1 100.32009 163.1 28.9 4.3 37.4 52.9 0.7 1.1 1.3 190.0 139.32010 160.6 29.6 2.1 28.2 48.1 0.2 0.5 3.7 242.5 69.0
2006 III 27.1 3.7 0.6 6.9 6.6 0.9 0.3 0.0 55.7 30. IV 33.8 5.4 1.1 8.1 6.0 0.0 1.4 2.8 39.0 23.0
2007 I 28.7 9.7 1.0 11.3 4.4 0.0 4.2 0.0 53.6 23.6 II 47.2 7.5 0.8 9.8 6.5 0.3 0.0 0.1 66.5 24.6 III 38.3 7.4 1.0 9.1 6.0 0.0 0.0 0.1 82.0 25.8 IV 46.4 8.4 0.6 8.6 24.9 0.0 0.2 0.1 78.5 26.0
2008 I 22.1 10.3 0.7 11.6 9.0 0.0 0.4 0.0 38.7 26.8 II 73.6 10.6 0.7 7.2 14.7 0.0 0.1 0.7 77.9 21.0
III 50.6 12.3 0.9 7.3 18.5 0.1 0.1 0.2 74.6 14.9 IV 51.6 15.4 0.7 5.6 18.6 0.0 0.1 0.5 37.0 37.6
2009 I 26.8 7.8 0.7 9.0 10.7 0.0 0.9 0.3 36.1 26.8 II 43.4 4.0 1.4 7.9 11.0 0.0 0.1 0.1 56.1 63.0 III 40.3 6.6 1.2 11.2 15.3 0.5 0.1 0.4 36.6 30. IV 52.6 10.5 0.9 9.4 15.9 0.2 0.0 0.4 61.2 19.4
2010 I 38.1 9.2 0.3 7.6 9.8 0.0 0.3 1.1 56.2 18.3 II 41.0 5.4 0.9 5.6 12.7 0.2 0.1 1.5 56.9 18.6 III 34.7 8.4 0.4 5.5 12.8 0.0 0.1 0.2 65.1 15.4 IV 46.8 6.7 0.4 9.4 12.7 0.0 0.0 1.0 64.3 16.8
2011 I 31.8 3.6 0.5 7.0 10.9 0.0 0.3 0.1 72.5 19. II 53.2 9.2 1.2 4.2 11.3 0.0 0.4 0.5 60.6 24.6 III
p 49.4 3.4 1.2 10.1 17.2 0.0 0.8 0.2 109.1 35.
SOURCE: Central Statistical Office.
1 Data may not add due to rounding.
TABLE 34A

8/13/2019 Economic Bulletin January 2013
http://slidepdf.com/reader/full/economic-bulletin-january-2013 90/108

8/13/2019 Economic Bulletin January 2013
http://slidepdf.com/reader/full/economic-bulletin-january-2013 91/108

8/13/2019 Economic Bulletin January 2013
http://slidepdf.com/reader/full/economic-bulletin-january-2013 92/108

8/13/2019 Economic Bulletin January 2013
http://slidepdf.com/reader/full/economic-bulletin-january-2013 93/108
ECONOMIC BULLETIN VOLUME XIII NO. 2 85
APPENDIX II
FEATURE ARTICLE

8/13/2019 Economic Bulletin January 2013
http://slidepdf.com/reader/full/economic-bulletin-january-2013 94/108

8/13/2019 Economic Bulletin January 2013
http://slidepdf.com/reader/full/economic-bulletin-january-2013 95/108
ECONOMIC BULLETIN VOLUME XV NO. 1 86
“FOREIGN A CCOUNT T AX COMPLIANCE A CT (F ATCA )”
Imperial Outreach or Hidden Opportunity
OPENING REMARKS
at the
Meeting of the Council of SecuritiesRegulators of the Americas (COSRA)
Monday 29th October, 2012at 8.30 a.m.
by Jwala Rambarran
Governor, Central Bank of Trinidad and Tobago
Ladies and Gentlemen,
I thank the Trinidad and Tobago Securities and Exchange Commission (TTSEC) for inviting me to speak
at the Opening Ceremony of the 2012 meetings of the Council of Securities Regulators of America(COSRA) and the Caribbean Group of Securities Regulators (CGSR).
As I look across at this august gathering of securities regulators from North, Central and South America,
the Caribbean and even from Europe, I am reminded of the prescient words of former U.S. President
John F. Kennedy at his address to the Canadian Parliament in May 1961, “Geography has made us
neighbors. History has made us friends. Economics has made us partners, and necessity has made us
allies.”
The global economic crisis, which is now in its fifth year, has certainly made us partners. Countries
cannot successfully regulate their financial markets in isolation. Going it alone is no longer a viable
option. Closer international partnership between regulators has never been so important – and yet so
challenging.
In my remarks this morning, I would like to first share my perspective on an issue that is not only of
immediate concern to all regulators in the Americas, but also an issue that has the potential to deepen
our model of engagement from that of partners to allies. I speak, of course, about the Foreign Account
Tax Compliance Act, otherwise known as FATCA.
Secondly, I would briefly describe the context in which the Caribbean would have to attain FATCA
compliance, if countries are so desirous.
I will end with the state of FATCA preparedness of Trinidad and Tobago, and some key messages for
moving forward.
8/13/2019 Economic Bulletin January 2013
http://slidepdf.com/reader/full/economic-bulletin-january-2013 96/108
ECONOMIC BULLETIN VOLUME XV NO. 1 87
W HAT IS FATCA?
Ladies and Gentlemen, since FATCA was enacted in March 2010 by the U.S. government as part of
the Hiring Incentives to Restore Employment (HIRE) Act, it has generated much heated debate and has
been described in rather uncomplimentary terms. FATCA has been hailed as:
“A ticking time-bomb”;
“An attempt to convert foreigners into unpaid IRS agents”;
“A kind of U.S. backward imperialism”.
FATCA requires foreign financial institutions to report directly to the U.S. Internal Revenue Service
(IRS), all clients who are U.S. citizens, green card holders living in the U.S. or abroad, or who are foreign
entities in which U.S. taxpayers hold a substantial ownership interest.
To properly comply with these new reporting requirements, a foreign financial institution will have toenter into a special agreement with the IRS by June 30, 2013. Under this agreement, a participating
foreign financial institution will be obligated to:
1. Obtain information to determine which account holders are U.S. persons;
2. Comply with verification and due diligence procedures on such account holders as required by
the IRS; and
3. Report annually to the IRS on the name and address of each U.S. client, as well as the largest
account balance in the year and total debit and credits of any account owned by a U.S. person
or foreign entities with substantial U.S. ownership.
The penalties are steep for non-compliance. A participating foreign financial institution will be requiredto deduct and withhold a 30 percent tax on ALL payments of U.S. source income (such as interest and
dividends), as well as U.S. source capital gains made to recalcitrant account holders (those who do not
willingly and promptly provide the requested information) and to foreign financial institutions that did
not enter into an agreement with the IRS.
In addition, FATCA requires U.S. citizens and green card holders who have financial assets outside of
the United States exceeding US$50,000 to report these assets to the IRS. FATCA focuses on the high
net-worth individuals, the so-called “FATCAts”.
If a foreign financial institution refuses to comply with these requirements, a withholding tax of 30 per
cent will be applied on all U.S. source income of that institution, regardless of whether or not such
payment was made for the benefit of the U.S. account holder, for another client, or for the institution
itself.
Foreign financial institutions, as currently drafted, may broadly include every member of the investment
community and encompass banks, credit unions, custodians, asset managers, investment funds and
pension fund schemes, brokers and insurance companies (where their products have an investment
element).
Ladies and Gentlemen, it would be quite easy for some non-U.S. institutions to believe that they will
not be affected by FATCA, as they do not have any U.S. investors. But FATCA paints with a very broadbrush. The legislation is structured so that all accounts will be deemed non-compliant or ‘recalcitrant’
8/13/2019 Economic Bulletin January 2013
http://slidepdf.com/reader/full/economic-bulletin-january-2013 97/108
ECONOMIC BULLETIN VOLUME XV NO. 1 88
unless the institution can demonstrate it undertook a rigorous due diligence process to prove it has
no U.S. account holders. Otherwise, the 30 per cent withholding tax will be applied. Moreover,
correspondent banks everywhere may refuse to deal with a financial institution unless that institution
can show it is FATCA compliant.
POTENTIAL IMPACT OF FATCA
Ladies and Gentlemen, FATCA has the potential to affect every person or entity that has any interest in
U.S. assets – in either capital value or income arising from these assets.
American Citizens Abroad (ACA), a Geneva-based organization representing the interests of six million
Americans living abroad, launched a campaign to repeal FATCA. The ACA claims that “FATCA is an
unacceptable manifestation of U.S. financial imperialism that imposes U.S. law on the rest of the world;
this can lead to systematic destabilizing of international financial markets”.
So, should we really be concerned about this so-called “ticking time bomb”?
Let me underscore that the aim of FATCA is to target those who evade paying U.S. taxes by hiding
assets in undisclosed foreign bank accounts. We recognize and affirm the sovereign right of the U.S.
government, as it is of any government, to collect taxes from its citizens. We also recognize that tax
avoidance and tax evasion threaten the already weak revenue position of many governments.
According to a November 2011 report from the Tax Justice Network, an independent group that
promotes financial transparency, governments worldwide lose more than US$3 trillion in annual
revenue because of tax evasion. This loss is equivalent to more than 5 per cent of global GDP.
The report estimates that the United States is in the unpleasant position of Number One when it comes
to tax evasion. The U.S. government loses some US$377 billion a year from tax evasion by U.S.-based
firms and individuals. To put this sum in perspective, it represents some 7.5 per cent of total U.S.
government revenue. In addition, the Euro Zone countries of Italy, Germany, France and Spain, as
well as the United Kingdom, are estimated to each lose at least US$100 billion in revenue every year
to tax evasion.
Not surprisingly, these five countries have seen an opportunity in FATCA to counter offshore tax evasion
and improve international tax compliance. They have agreed to each enter into Intergovernmental
Agreements with the United States for collecting and reporting FATCA-style information to their local
tax authorities. On September 14, 2012, the United States and the United Kingdom announced they
had signed the first bilateral agreement to implement FATCA.
FATCA AND THE C ARIBBEAN
So, Ladies and Gentlemen, where does this leave the Caribbean?
As you may be aware, tax transparency and the fight against cross-border tax evasion have been high
on the agenda of successive G-20 Summits. At the G-20 Summit held in Los Cabos, Mexico in June2012, leaders reiterated their commitment to strengthen transparency and comprehensive exchange
of tax information including through the Global Forum on Transparency and Exchange of Information

8/13/2019 Economic Bulletin January 2013
http://slidepdf.com/reader/full/economic-bulletin-january-2013 98/108
ECONOMIC BULLETIN VOLUME XV NO. 1 89
for Tax Purposes and through the Multilateral Convention on Mutual Administrative Assistance. This
will be mainly achieved through peer reviews of countries’ compliance with internationally agreed tax
standards.
It is my respectful view that adopting a robust, common set of standards may be essential to fostering
global financial stability. But it is neither practical nor desirable to effect a dogmatic application of
these identical standards to every country or region. Standards must be calibrated and adapted to local
circumstances. This is particularly true in the Caribbean given the limitation and vulnerabilities inherent
in the relatively small size of individual economies.
For some time now, Caribbean countries have had to grapple with the exercise of the asymmetrical
global application of power and influence when it comes to the increased regulatory scrutiny by the
advanced countries of the region’s offshore financial centres, especially in respect of tax evasion and
money laundering. To be fair, some of these Caribbean jurisdictions did have loosely defined regulatoryand supervisory environments, but have subsequently come a long way in strengthening their capacity.
As an example, I recall 1998, when the Organization for Economic Cooperation and Development
(OECD) produced a list of countries which it said would be “blacklisted” for “harmful tax competition”.
Caribbean countries, which were on that list, mounted a spirited response with the assistance of the
Commonwealth Secretariat, forcing the OECD to relax its position in 2000.
Since then, the global financial crisis and a string of headline-grabbing fraud scandals like those involving
disgraced Wall Street financier Bernard Madoff and Texas billionaire Allen Stanford have focused new
attention on offshore financial centers in the Caribbean. However, no Caribbean country is currently
on the OECD “gray” or “black” list of non-cooperative jurisdictions.
Now, the Caribbean region has to cope with FATCA. Quite rightfully, the Caribbean Community
(CARICOM), an organization of 15 Caribbean nations and which coordinates economic policy in the
region, is taking the lead on FATCA. CARICOM has created a Task Force led by Jamaica and has hired
the accounting firm of PriceWaterhouseCoopers to advise on the best approach for the region on the
issue. The region’s strategic approach to FATCA will be on the agenda of the upcoming CARICOM
Central Bank Governors Meeting to be held in Suriname in mid-November 2012.
Apart from using the joint regional machinery of the CARICOM Secretariat to advance their collective
interests in FATCA, I would also encourage Caribbean countries to build alliances with other jurisdictions
in the Americas that are equally affected by FATCA.
In particular, I note that the TTSEC, which is the third representative of the Inter-American Regional
Committee (IARC), is in a unique position to make representations on behalf of the Caribbean to the
International Organisation of Securities Commission (IOSCO). I encourage the TTSEC to use this
avenue to highlight FATCA implementation issues that are of particular concern to the Caribbean
region or to members within the region.
As I indicated before, no one country can do this alone. Now is the time for Caribbean countries to put
their case before influential and potential allies in the G-20 such as Brazil and Canada, which together
represent the Caribbean region on the Executive Boards of the IMF and the World Bank.
8/13/2019 Economic Bulletin January 2013
http://slidepdf.com/reader/full/economic-bulletin-january-2013 99/108
ECONOMIC BULLETIN VOLUME XV NO. 1 90
I believe that now is also time for the Caribbean to develop a different engagement model with China.
China recently joined the Global Forum to maintain its interests in mainland China, Hong Kong and
Macao. As a Vice President of the Global Forum, China may prove to be an invaluable ally to the
Caribbean on implementation of standards of transparency and international tax matters, instead of
being viewed solely as a non-traditional provider of aid resources to the region.
TRINIDAD AND TOBAGO – PREPAREDNESS FOR FATCA
Ladies and Gentlemen, I now turn to Trinidad and Tobago’s readiness for FATCA. I wish to state quite
categorically that Trinidad and Tobago is not a tax haven. Trinidad and Tobago is recognized by
competent institutions such as the IMF, the World Bank and the Financial Action Task Force (FATF) as a
clean and transparent jurisdiction. We have taken significant steps to enhance the effectiveness of our
jurisdiction in our fight against tax avoidance and tax evasion.
Indeed, at its Plenary Meeting in Paris just a week ago, FATF agreed to move Trinidad and Tobago from
its list of countries with strategic Anti-Money Laundering and Combating the Financing of Terrorism
(AML/CFT) deficiencies.
Over the past decade, the Central Bank of Trinidad and Tobago has taken measures to enhance Know
Your Customer (KYC) procedures for institutions falling under its purview. We have issued Guidelines
on AML/CFT, which comply with the standards of the FATF and which eventually formed the basis for
new legislation in bringing the country closer to full compliance.
In this respect, the Central Bank is one of three supervisory authorities responsible for preventing
money laundering and terrorist financing, the other two authorities being the TTSEC and the FinancialIntelligence Unit (FIU).
Trinidad and Tobago is party to 17 Double Taxation Treaties in force, and there are others awaiting
ratification or under negotiation. We signed our first Double Taxation Treaties with both Norway and
Denmark in 1969. Our Double Taxation Treaty with the United States was signed in 1971. We also
have a Tax Information Exchange Agreement (TIEA) with the United States.
This should make it relatively easier to enter into Intergovernmental Agreements of the model types
proposed by the United States, in which foreign financial institutions report information to authorities
in their residence country and have those foreign authorities report the information to the IRS.
We recognize that several benefits may arise from concluding a FATCA-style agreement using the
Intergovernmental model. It eliminates U.S. withholding on payments to our financial institutions;
it identifies specific categories of our financial institutions which are deemed compliant or which
present a low risk of tax evasion; it relieves our financial institutions from terminating the account of a
recalcitrant account holder; and it imposes passthru withholding on payments to other foreign financial
institutions in the FATCA treaty partner or in another jurisdiction with which the U.S. has a FATCA
agreement.
Based on submissions, it appears that all of our banks are ready to respond to, and comply with, FACTA
requirements. However, there are varying levels of preparedness within the banking sector. Our threeCanadian and the U.S.-owned banks are at the highest level of preparedness, having been part of their

8/13/2019 Economic Bulletin January 2013
http://slidepdf.com/reader/full/economic-bulletin-january-2013 100/108
ECONOMIC BULLETIN VOLUME XV NO. 1 91
parents’ global program of FATCA compliance. The two large local banks have initiated projects which
would enable them to be well in train to comply with the FATCA requirements. The smaller banks are
in the process of amending their KYC procedures to identify U.S. residents and citizens.
So, in my respectful view, there is little need for us to be unduly alarmed about FATCA. I do concede,
however, that successful navigation of FATCA would entail a number of challenges for our financial
institutions, including the immediate need to mount an aggressive public awareness campaign and, of
course, much more work needs to be done by several other sectors and entities in preparing for FATCA
including credit unions, and the Unit Trust Corporation.
As you can appreciate, ladies and gentlemen, many of the issues surrounding FATCA go well beyond
the remit of the Central Bank. For example, one key issue relates to the capacity of our Board of Inland
Revenue, which would probably be the tax authority designated to conduct these operations, to cope
with the requirements imposed by the proposed FATCA Partnership.
It is from this perspective that the Central Bank proposes the establishment of a Joint Working Group
of key stakeholders to prepare for FATCA implementation. Among the proposed terms of reference of
the Working Group would be to evaluate the impact of FATCA on the financial sector in Trinidad and
Tobago, to determine a cost-effective strategy for compliance, and to advise on a promotions strategy.
The Working Group would comprise the Board of Inland Revenue, the Ministry of Finance, the
Ministry of Foreign Affairs, members of the Banking Association of Trinidad and Tobago, members
of the Association of Trinidad and Tobago Insurance Companies (ATTIC), members of the Institute of
Chartered Accountants of Trinidad and Tobago (ICATT), the FIU, the TTSEC and the Central Bank.
CONCLUSION
In closing ladies and gentlemen, we must recognize that the FATCA clock is ticking, but partnership
models for engagement are emerging. Whether Trinidad and Tobago settles FATCA on the basis of
bilateral interventions, or through joint partnership with other Caribbean countries, we will be forcefully
seeking to ensure that financial institutions in Trinidad and Tobago face no undue disadvantage from
FATCA compliance.
I thank you.

8/13/2019 Economic Bulletin January 2013
http://slidepdf.com/reader/full/economic-bulletin-january-2013 101/108
APPENDIX III

8/13/2019 Economic Bulletin January 2013
http://slidepdf.com/reader/full/economic-bulletin-january-2013 102/108
8/13/2019 Economic Bulletin January 2013
http://slidepdf.com/reader/full/economic-bulletin-january-2013 103/108
ECONOMIC BULLETIN VOLUME XV NO. 1 92
CALENDAR OF KEY ECONOMIC EVENTS JULY - DECEMBER 2012
JULY
10 The National Gas Company of Trinidad
and Tobago (NGC) signed an agreement
to supply 100m cubic feet of natural gas
per day to the Methanol Holdings Trinidad
Limited (MHTL) AUM II (ammonia-urea-
melamine) complex. The complex is due
to begin construction in early 2013, at an
estimated cost of US$2 billion.
17 Mr. Jwala Rambarran assumed the position
of Governor of the Central Bank of Trinidad
and Tobago.
13 Bayfield Energy Holdings, an English oil
exploration company, brought the Trintes
field, located in the Galeota Block off the
southeast coast of Trinidad, into production.
The field was discovered in 1963 and
started production nine years later. The field
currently produces over 2,300 barrels of oilper day (bopd).
AUGUST
2 Pan-American Life Insurance Group
(PALIG) acquired the American Life
Insurance Company of Trinidad and Tobago
(ALGICO) in Trinidad and Tobago, and the
regional subsidiaries of ALGICO’s parent
company ALICO in the Cayman Islands,Costa Rica, Panama, and St. Lucia. With
the acquisition of these companies PALIG
obtained approximately US$675m in assets,
encompassing 15 countries in Central
America and the Caribbean.
17 The National Insurance Property
Development Company Limited (NIPDEC)
issued a TT$339 million bond with a 5.15
per cent per annum fixed rate and a maturity
date of 2025. The proceeds of this issue willprovide for the implementation of Phase II
of the Motor Vehicle Authority of Trinidad
and Tobago Project.
24 The Miscellaneous Provisions (Financial
Intelligence Unit of Trinidad and Tobago
and Anti-Terrorism) Act, 2012. (Act No. 14
of 2012) was assented on this date. This Act
amended the Financial Intelligence Unit of
Trinidad and Tobago Act, 2009 and the Anti-
Terrorism Act, Chap 12:07.
Oldendorff Carriers Trinidad Ltd, a German
transhipment company, signed a US$45
million contract with the Ministry of Trade,
Industry and Investment and Trinidad &
Tobago Free Zone Company Ltd. Trinidad
and Tobago will be used as a trans-shipment
port for the company’s cargo of iron and
steel, which is being shipped from Brazil to
China.
SEPTEMBER
25 The Government of Trinidad and Tobago
issued a TT$2 billion 15 year bond with a
5.20 per cent per annum coupon rate. The
bonds were issued under the authority of
the Development Loans Act Chap. 71:04
of the Revised (1980) Laws of Trinidad and
Tobago. The proceeds of this issue will
be used to settle outstanding Government
liabilities.
27 The United States signed an agreement
to provide the Government of Trinidad
and Tobago with US$1.2 million for its
security assistance programmes. These
programmes are aimed at strengthening
Trinidad and Tobago’s security systems and
will assist in several areas including citizen
security, juvenile justice, military and police
professionalization, drug reduction and
financial crimes investigation.

8/13/2019 Economic Bulletin January 2013
http://slidepdf.com/reader/full/economic-bulletin-january-2013 104/108

8/13/2019 Economic Bulletin January 2013
http://slidepdf.com/reader/full/economic-bulletin-january-2013 105/108
ECONOMIC BULLETIN VOLUME XV NO. 1 94
the International Chamber of Commerce
found that World GTL of St. Lucia Limited
and World GTL Inc (together WGTL), had
breached its obligation under a GuaranteeContribution Agreement between Petrotrin
and WGTL. The company was ordered to
transfer 9,398,211 common shares of WGTL
Trinidad to Petrotrin, to pay the majority
of Petrotrin’s legal fees and expenses in
the amount of US$2,334,220.21 (about
TT$13 million) and to transfer additional
shares of WGTL Trinidad to Petrotrin
as compensation for accrued interest.
4 Scotiabank Trinidad and Tobago became
the first bank in Trinidad and Tobago
to offer gold bullion certificates as an
investment option. The certificates can
be purchased through the bank’s precious
metals division, ScotiaMocatta. A minimum
order of ten ounces (10 oz) of 99.999
per cent purity gold, at an estimated cost
of TT$1 million at current world marketprices, must be placed to receive a gold
certificate. The US$ gold certificates
are backed by the assets of Scotiabank’s
parent, the Bank of Nova Scotia.
24 The Securities Act, 2012. (Act No. 17
of 2012) was assented to on this date.
This Act provides protection to investors
from unfair, improper or fraudulent
practices; fosters fair and efficient
securities markets and confidence in
the securities industry in Trinidad and
Tobago; reduces systemic risk, repeals and
replaces the Securities Industry Act, Chap.
83:02, as well as other related matters.

8/13/2019 Economic Bulletin January 2013
http://slidepdf.com/reader/full/economic-bulletin-january-2013 106/108

8/13/2019 Economic Bulletin January 2013
http://slidepdf.com/reader/full/economic-bulletin-january-2013 107/108

8/13/2019 Economic Bulletin January 2013
http://slidepdf.com/reader/full/economic-bulletin-january-2013 108/108