Embed Size (px)
Citation preview
June 11, 2014
© Anderson Economic Group, LLC, 2014Permission to reproduce in entirety granted with proper citation. All other rights reserved.
Anderson Economic Group, LLC1555 Watertower Place, Suite 100East Lansing, Michigan 48823Tel: (517) 333-6984Fax: (517) 333-7058
www.AndersonEconomicGroup.com
Economic Benefits of the Grand Rapids Whitewater Project
Prepared by:
Scott D. Watkins, Senior ConsultantSara N. Bowers, Analyst
Commissioned by:Grand Rapids Whitewater, Inc.

Table of Contents
I. Executive Summary ..............................................1
Introduction ........................................................................... 1
Approach ............................................................................... 1
Overview of Findings ........................................................... 2
About Anderson Economic Group ........................................ 5
II. The Grand Rapids Whitewater Project ................6
About Grand Rapids Whitewater .......................................... 6
Scope of the Proposed Project .............................................. 6Dam Removals........................................................................... 6Riverbed Restoration ................................................................. 7Riverside Enhancements............................................................ 7Other Features and Enhancements............................................. 8
Comparable River Restoration Projects ................................ 9
River Recreation and Enhanced Recreational Opportunities 13
III. Economic Overview: With and Without The Rapids...............................................................14
Grand Rapids Today ........................................................... 14Business and Employment....................................................... 14Colleges and Universities ........................................................ 14Arts, Culture, and Entertainment ............................................. 14Parks and Recreation ............................................................... 15
A Restored Grand River in Grand Rapids .......................... 15Recreational Benefits ............................................................... 16
River Restoration and Land Uses ....................................... 17
IV. Economic Impacts from Direct New Uses of the Grand River.............................................................19
Estimating Net New Economic Impact ............................... 19
Estimating Net New Recreation Users ............................... 19Whitewater Boating User Estimates ........................................ 20 Non-Whitewater Boating User Estimates............................... 21Fishing User Estimates ............................................................ 22Shore-Based User Estimates.................................................... 23
User Expenditure Estimates ................................................ 23
Economic Impacts from Net-New Expenditures ................ 24
Anderson Economic Group, LLC

Table of Contents
V. Other Economic Benefits of the Grand River Restoration ..............................................................25
Other Economic Impacts ..................................................... 25Attraction and Retention of Businesses ................................... 25Improved Land Uses and Fiscal Benefits ................................ 25
Ecological Benefits ............................................................. 27Flood Control........................................................................... 27Fish Habitats ............................................................................ 28Sea Lamprey Barrier ................................................................ 28
Health and Safety ................................................................ 28
Quality of Life ..................................................................... 29
Appendix A: Market Area Data.............................A-1
Appendix B: Project Area Maps........................... B-1
Appendix C: Riverfront Parcels ........................... C-1
Appendix D: Economic Impact Calculations...... D-1
Net Economic Impact Defined .......................................... D-1
Determination of Net New Expenditures .......................... D-1
Estimating Indirect Impacts .............................................. D-1
Appendix E: List of Resource Documents ............ E-1
Appendix F: About AEG ...................................... F-1
Anderson Economic Group, LLC

Executive Summary
I.Executive Summary
INTRODUCTION Grand Rapids is known for many things: Furniture City, President Ford, the Medical Mile, ArtPrize, and even Fluoride. But the city’s namesake—the rapids of the Grand River—have long been silenced. This, however, may soon change, with Grand Rapids Whitewater (GRWW) leading efforts to restore the rapids.
The Grand River runs through the heart of downtown Grand Rapids, but five dams quiet the rapids along a natural decline of some 18 feet from Ann Street to Fulton Street. This 2.2 mile stretch of river once featured large boulders, rock islands, and natural reefs. These were cleared, however, to facilitate the transfer of timbers in the mid to late 1800s. The mid to late 1800s also saw the intro-duction of dams as flow controls to facilitate timber transportation on the river.
The remaining dams serve no useful purpose; they require costly ongoing maintenance and prevent safe travel along the river. As a result, the Grand River through downtown Grand Rapids is largely unused, though its natural beauty preserves its place as a centerpiece in the downtown. The removal of the dams and restoration of natural bottom features will bring back not only the rapids; it will restore fish habitats; create new, safer recreational opportunities; and enhance the natural beauty of the river. This, in turn, will provide ecological, recreational, and economic benefits to the community.
Report Purpose. This study focuses on the potential for expanded economic activity related to the restoration of the Grand River in Grand Rapids. This includes quantitative estimates of net-new economic activity stemming from new and enhanced recreational uses of the restored river and riverfront. The study also provides a qualitative assessment of economic value stemming from: i) indirect uses of the river and riverfront (such as environmental improve-ments); ii) “quality-of-life” benefits that stem from enhancing and maintaining a community’s amenities and natural resources; and iii) options for further economic enhancement, primarily in the form of new real estate development and enhanced land use along the riverfront.
APPROACH To assess the economic benefits that are likely to be realized in Grand Rapids if the Grand River’s rapids are restored, we:
1. Documented baseline economic, land use, and river usage conditions in Grand Rapids, as well as the proposed scope of the restoration;
2. Reviewed river restoration projects and related analyses that have occurred in other urban communities;
3. Estimated the scope and scale of new and enhanced uses of the restored river and riverfront in Grand Rapids;
Anderson Economic Group, LLC 1

Executive Summary
4. Quantified an approximate range of net-new direct and indirect eco-nomic impacts that can be expected as a result of the new and enhanced uses of the river and riverfront; and
5. Assessed other benefits, including the more difficult to quantify eco-nomic benefits that are expected to stem from restoring the rapids to the Grand River in Grand Rapids.
OVERVIEW OF FINDINGS
Our analysis finds that:
1. The Grand Rapids Whitewater project will physically transform the city’s riverfront by restoring the Grand River’s natural flows and hab-itats, while also improving recreational uses and accessibility.
a. Today, the City of Grand Rapids has a vibrant downtown core that is built on and around the Grand River. The river, however, is a relatively underutilized piece of the downtown landscape.
b. The river restoration project will include the removal of five dams; the restoration of natural reefs, bottom features, and fish habitats; recreat-ing the boulder strewn rapids that were originally below the 6th Street dam; and uncovering the submerged limestone shelves that once pro-vided a natural spawning ground for lake sturgeon.
c. The riverside will also undergo restorations and enhancements, with floodwall modifications, new boulder walls to provide natural flood-walls, two new riverfront parks, safe wading areas, additional walking and bicycle pathways, and improved boat ramps and portage takeouts.
d. The project will also include a new hydraulic structure to provide more effective sea lamprey control than the 6th Street dam affords. It will also allow for regulation of upstream flows, providing a better environment for rowing events.
See “Scope of the Proposed Project” on page 6.
2. Waterways have long served as economic backbones to communities, and river restoration projects elsewhere in the country demonstrate the Grand Rapids Whitewater project’s potential benefits.
a. The Grand River was once essential to the Grand Rapids economy and furniture industry. It’s economic value today, however, is muted. Restoring the river will allow more recreational uses that spur eco-nomic activity, including visitorship associated with kayaking, rafting, and fly-fishing, all of which are growing in popularity.
b. The city of South Bend, Indiana undertook a riverfront redevelopment effort in the mid-1980s. The area has since developed into a thriving downtown and is the home of restaurants, shops, offices, and town-houses. An estimated $78 million in economic development has occurred since the redevelopment took place.
Anderson Economic Group, LLC 2

Executive Summary
c. The Chattahoochee River has been a focal point for downtown devel-opment in Columbus, Georgia and Phenix City, Alabama. The cities collaborated on a 2013 project to bring more recreation to the area, including a whitewater park with year-round operations. Estimates put the whitewater park’s economic impact at $7 to $11 million annually.
d. The City of Wausau, Wisconsin, in the mid 1980s, initiated a whitewa-ter park project that has brought international recognition to the area. Shops and restaurants have experienced increased business since the development, and the downtown “river district” hosts numerous national and international kayaking and paddling competitions each year.
e. River-based recreation is growing in popularity, with stand-up pad-dling, whitewater and recreational kayaking, rafting, and fly-fishing each among the top-20 outdoor activities with the fastest growing rates of participation. The growing popularity of these activities will benefit the project, just as the project will afford area residents with signifi-cantly improved access to these activities.
See “Comparable River Restoration Projects” on page 9 and “River Recreation and Enhanced Recreational Opportunities” on page 13.
3. The Grand Rapids Whitewater project will create a river and river-front with significantly more recreational uses for residents and visi-tors alike. This expanded recreational use will stimulate net new economic impacts of $15.9 million to $19.1 million per year.
a. The restoration project will create a natural amenity that is unmatched in the region, drawing locals and visitors to enjoy being in, on, and near the river. Many of these new recreational users of the river will spend money at local restaurants, hotels, shops, and other venues while in Grand Rapids, thereby generating direct economic impacts for the community.
b. We estimate that the restored river and riverfront will generate between 232,434 and 538,313 new visitor days for Grand Rapids each year. The low-end estimate is a conservative scenario based on data and observations of smaller-scale river restoration projects. The higher estimate is a potential scenario reflecting possible increased draws given the project’s location, broad scope, potential to attract several major events, and overall community and statewide interest.See “Estimating Net New Recreation Users” on page 19 and “Net New Visi-torship Estimates” on page D-2.
c. The economic impact under the conservative scenario is $15.9 million in net new activity each year. This is driven by direct net new spending of $12.9 million which stimulates an additional $3.0 million in indirect economic impacts within Grand Rapids. This economic impact includes 80 new jobs and nearly $2 million in new earnings for the Grand Rapids’ workforce.
Anderson Economic Group, LLC 3
Executive Summary
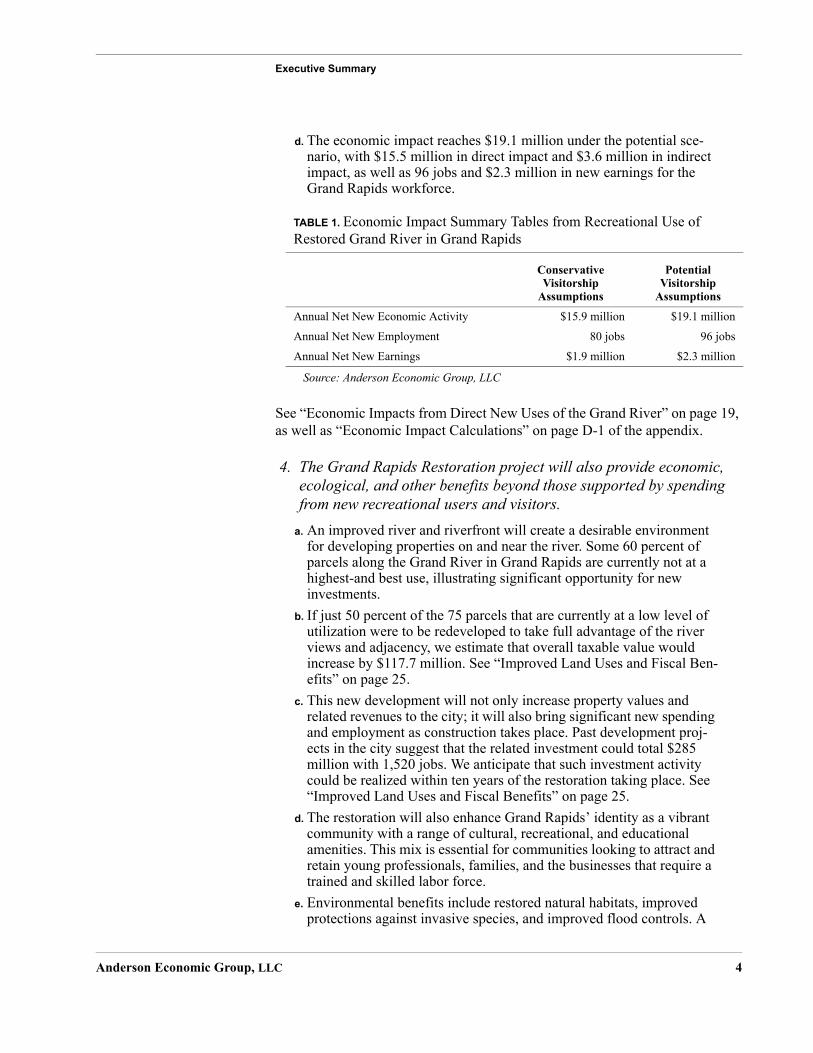
d. The economic impact reaches $19.1 million under the potential sce-nario, with $15.5 million in direct impact and $3.6 million in indirect impact, as well as 96 jobs and $2.3 million in new earnings for the Grand Rapids workforce.
See “Economic Impacts from Direct New Uses of the Grand River” on page 19, as well as “Economic Impact Calculations” on page D-1 of the appendix.
4. The Grand Rapids Restoration project will also provide economic, ecological, and other benefits beyond those supported by spending from new recreational users and visitors.
a. An improved river and riverfront will create a desirable environment for developing properties on and near the river. Some 60 percent of parcels along the Grand River in Grand Rapids are currently not at a highest-and best use, illustrating significant opportunity for new investments.
b. If just 50 percent of the 75 parcels that are currently at a low level of utilization were to be redeveloped to take full advantage of the river views and adjacency, we estimate that overall taxable value would increase by $117.7 million. See “Improved Land Uses and Fiscal Ben-efits” on page 25.
c. This new development will not only increase property values and related revenues to the city; it will also bring significant new spending and employment as construction takes place. Past development proj-ects in the city suggest that the related investment could total $285 million with 1,520 jobs. We anticipate that such investment activity could be realized within ten years of the restoration taking place. See “Improved Land Uses and Fiscal Benefits” on page 25.
d. The restoration will also enhance Grand Rapids’ identity as a vibrant community with a range of cultural, recreational, and educational amenities. This mix is essential for communities looking to attract and retain young professionals, families, and the businesses that require a trained and skilled labor force.
e. Environmental benefits include restored natural habitats, improved protections against invasive species, and improved flood controls. A
TABLE 1. Economic Impact Summary Tables from Recreational Use of Restored Grand River in Grand Rapids
Conservative Visitorship
Assumptions
Potential Visitorship
Assumptions
Annual Net New Economic Activity $15.9 million $19.1 million
Annual Net New Employment 80 jobs 96 jobs
Annual Net New Earnings $1.9 million $2.3 million
Source: Anderson Economic Group, LLC
Anderson Economic Group, LLC 4

Executive Summary
re-exposed bedrock shelf north of the 6th Street dam will restore a nat-ural spawning ground for lake sturgeon. Other restored bottom fea-tures will also provide improved fish habitats, while a new hydraulic gate will provide a more reliable sea lamprey barrier. Removing the dams will result in less debris buildup and related flooding.
f. Additional benefits include a safer river way, increased access to healthy activities, additional educational opportunities, and enhanced national and international awareness of the community. These all pro-vide immeasurable value to the community, both for current and future generations.
See “Improved Land Uses and Fiscal Benefits” on page 25.
ABOUT ANDERSON ECONOMIC GROUP
Anderson Economic Group, LLC offers research and consulting in economics, finance, market analysis, and public policy. Since AEG’s founding in 1996, the company has helped clients including universities, state and local governments, non-profit organizations, and private and public companies. AEG has completed economic impact studies for clients located throughout the United States. For more information on the report’s authors, please see “About AEG” on page F-1.
Anderson Economic Group, LLC 5

The Grand Rapids Whitewater Project
II.The Grand Rapids Whitewater Project
ABOUT GRAND RAPIDS WHITEWATER
Grand Rapids Whitewater is a non-profit organization dedicated to restoring the Grand River and creating a one-of-a-kind centerpiece in downtown Grand Rapids. GRWW grew out of a citywide green infrastructure master planning process, Green Grand Rapids, that focuses on physical infrastructure and the city’s natural amenities, recreation, and public health. During the planning process, Green Grand Rapids combined the idea of returning the rapids to the Grand River with improving outdoor recreation opportunities. Now, Grand Rapids Whitewater champions the effort to restore and revitalize the river.
Grand Rapids Whitewater held focus group meetings in 2008 and 2009 to discuss river recreational opportunities and what other cities have done to increase downtown river usage. The focus soon grew beyond recreational elements to include a comprehensive restoration of the Grand River. In 2012,
representatives from GRWW began holding meetings with stakeholder groups.1 By May of 2013, the U.S. Environmental Protection Agency announced that they would include the Grand River Restoration in its Urban Waters Federal Partnership program, and various state and local agencies also voiced support for the project.
SCOPE OF THE PROPOSED PROJECT
The following section describes the different aspects of the proposed restoration project, as described in the Grand Rapids Whitewater Preliminary Plan that was released in November 2013. We also provide maps on pages B-2 and B-3 to illustrate where the project will take place.
Dam Removals
The preliminary plan involves removing five the dams between 6th and Pearl
Streets, including the 6th Street dam.2 These dams currently do not serve a pur-pose and they make navigating the river nearly impossible and very unsafe. They are also aging and will require significant maintenance if left in place. Four of the five dams are lower, and may not be noticed by most visitors to the riverfront. The Sixth Street dam, however, is much more noticeable and well known. These dams will be removed in their entirety to allow the natural river drops to return.
1. “Grand River Whitewater Park Preferred Alternative,” Green Grand Rapids, 2009, pp. 5-6.
2. This dam is sometimes referred to as the 4th Street dam, owing to the fact that it crosses the river where 4th Street would, if it were extended. However, since 6th Street is the closest bridge to the dam, we refer to it as the 6th Street dam.
Anderson Economic Group, LLC 6

The Grand Rapids Whitewater Project
Riverbed Restoration
Another significant aspect of the project is the work that will be done to restore the riverbed to its natural form. A 12-acre limestone shelf that is currently sub-merged upstream of the 6th Street dam will be revealed, and the reefs and boul-ders that will be exposed in the river upstream of Bridge Street will increase lake sturgeon spawning habitats by 850 percent. These are important features
because they are essential for the prosperity of native fish species.3
Bedrock islands between I-196 and Fulton Street will create a wading path through downtown. Boulders and rock formations will create 9,400 feet of whitewater rapids with eight whitewater features that paddlers will be able to enjoy. Pools with calmer water separating these rough elements will increase
fish holding habitats by 500 percent.4
FIGURE 1. Wading Shoals and Boating Route in Downtown Grand Rapids
Source: Grand Rapids Whitewater Preliminary Plan
Riverside Enhancements
The restoration will reach beyond the river bottom to also include shoreline and accessibility elements. Included in the project is the addition of a riverside park north of Leonard Street on the east side of the river, which will add more path-ways and connect to existing parks. There is an existing network of pathways along the Grand River, though some portions are currently disconnected. The restoration will also preserve four acres of native riparian forest along the river.
3. “Grand Rapids Restoration,” Grand Rapids Whitewater, 2013.
4. Ibid.
Anderson Economic Group, LLC 7

The Grand Rapids Whitewater Project
Signage, and boat launches will be added to the river between Ann Street and Highway 131 to improve access and navigability. Portage paths will be added on both sides of the river near the existing Fish Ladder and on the east side of the river upstream from 6th Street. On-shore signs near parking areas will assist park visitors with finding their way around the network of parks. In addition, rescue ladders will be added to existing flood walls to improve safety and allow rescue workers to more easily reach stranded river users. The fish ladder will be left intact, and another fish ladder will be constructed on the east side of the river, between Ann and Leonard Streets. Finally, a hydraulic barrier upstream from Leonard Street will assist with flow control and raising water levels, which will allow rowing events upstream to take place.
FIGURE 2. The Grand Rapids Fish Ladder
Source: Pure Michigan
Other Features and Enhancements
The construction of an effective sea lamprey barrier is an important part of the project. The hydraulic barrier that will be constructed upstream from Leonard Street will act as a barrier to the lamprey during their seasonal migration and will prevent them from traveling upstream. It can also be used to help control upstream water levels so that other recreational uses, including rowing events, will not be interrupted by the change in flows. This will provide a more depend-able rowing venue, making it more attractive for competitive events.
Anderson Economic Group, LLC 8
The Grand Rapids Whitewater Project
COMPARABLE RIVER RESTORATION PROJECTS
To illustrate the benefits of the proposed river restoration project, we reviewed economic impact studies and news articles about previously completed river restoration projects. River restoration projects prove to increase both use value and non-use value of the river and riverfront by increasing recreational opportu-nities and providing a renewable resource that generations to come will be able to enjoy. Below is a summary of five projects and the benefits they brought to their respective cities.
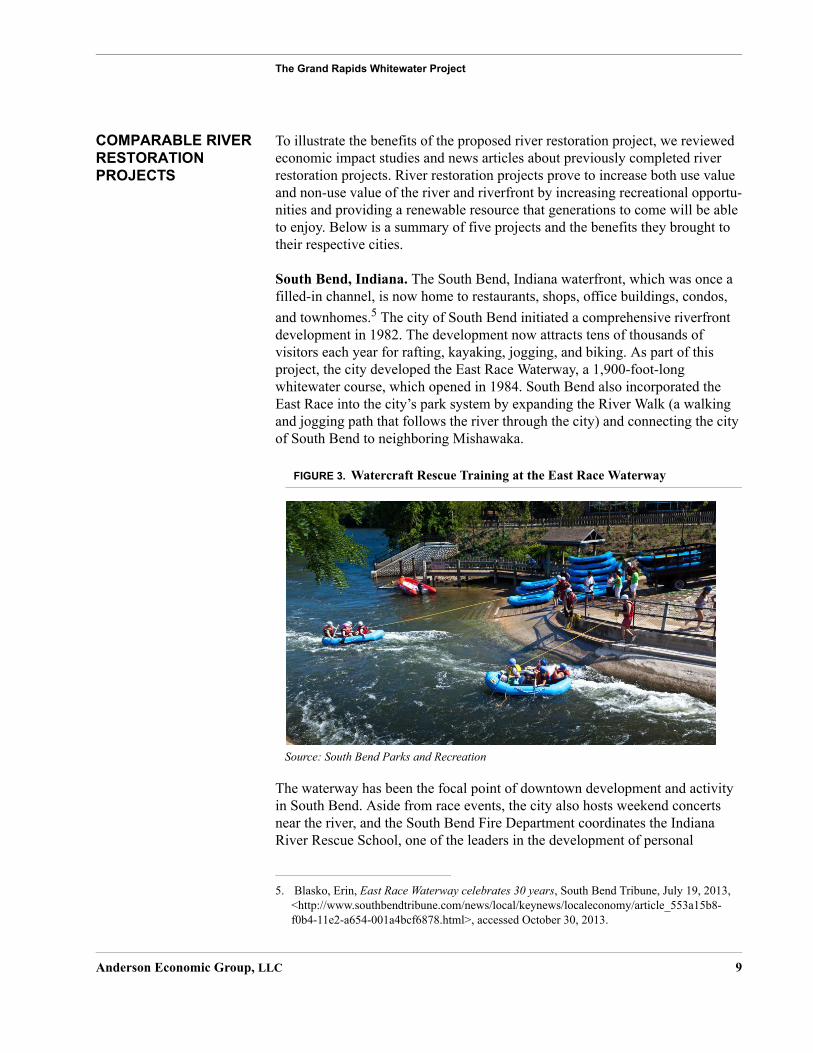
South Bend, Indiana. The South Bend, Indiana waterfront, which was once a filled-in channel, is now home to restaurants, shops, office buildings, condos,
and townhomes.5 The city of South Bend initiated a comprehensive riverfront development in 1982. The development now attracts tens of thousands of visitors each year for rafting, kayaking, jogging, and biking. As part of this project, the city developed the East Race Waterway, a 1,900-foot-long whitewater course, which opened in 1984. South Bend also incorporated the East Race into the city’s park system by expanding the River Walk (a walking and jogging path that follows the river through the city) and connecting the city of South Bend to neighboring Mishawaka.
FIGURE 3. Watercraft Rescue Training at the East Race Waterway
Source: South Bend Parks and Recreation
The waterway has been the focal point of downtown development and activity in South Bend. Aside from race events, the city also hosts weekend concerts near the river, and the South Bend Fire Department coordinates the Indiana River Rescue School, one of the leaders in the development of personal
5. Blasko, Erin, East Race Waterway celebrates 30 years, South Bend Tribune, July 19, 2013, <http://www.southbendtribune.com/news/local/keynews/localeconomy/article_553a15b8-f0b4-11e2-a654-001a4bcf6878.html>, accessed October 30, 2013.
Anderson Economic Group, LLC 9
The Grand Rapids Whitewater Project
watercraft rescue techniques.6 Over 300,000 people have gone down the race since it opened, and according to the city’s Department of Community Investment, an estimated $78 million in economic development has occurred
since the race opened.7
Columbus, Georgia and Phenix City, Alabama. The cities of Columbus, Georgia and Phenix City, Alabama collaborated to implement the Chatta-hoochee River Restoration project in 2013. The river restoration project is expected to create additional business activity; increase property values for those near the river; and further the process of each community’s ongoing
revitalization.8
The project included removal of two dams and creation of a whitewater park to help increase recreation on the river. A market and economic analysis estimates that the whitewater park alone would attract between 60,000 and 100,000 participants per year. The total direct economic impact of the whitewater venue was estimated to be between $4.2 million and $7 million. The total economic impact of the park, including direct and indirect impacts, is expected to total
between $7.1 and $11.9 million annually for the two cities.9
Wausau, Wisconsin. In the 1970s, outdoor enthusiasts sought a way to improve and increase recreational opportunities on the Wisconsin River in Wausau, Wisconsin. Public and private entities worked together to improve the river channel and the entire watershed area to protect the waterway. In 1984, the city’s River Edge Commission initiated work on a whitewater park, which included modifications to the river as well as a landscaped portion of the riverfront in the downtown area for spectators.
In addition to bringing income to the local economy, the course has provided cultural benefits and exposure to the downtown. Wausau has hosted interna-tional events since 1985 and the whitewater portion of the park is a training site for the U.S. Olympic Kayak and Canoe teams. According to Main Street Wausau, the town’s downtown development authority, the races bring new
6. McMinn, Paul, “A Success Story: The East Race Waterway,” South Bend Parks and Recre-ation, January 2013, <http://sbpark.org/news/east-race-celebrates-30-great-years/>, accessed December 11, 2013.
7. South Bend Parks and Recreation, <http://sbpark.org/news/east-race-celebrates-30-great-years/>, accessed December 11, 2013.
8. Caldwell, Carla, First Columbus whitewater season a hit, fuels development, Atlanta Business Chronicle, October 3, 2013, <http://www.lakenews.com/News.asp?ID=017FCE66-37B4-49EF-B8B9-A278B0461484&SiteID=GA019>, accessed November 13, 2013.
9. Adams, Tony, $24.4 million Chattahoochee River restoration project a blend of public, pri-vate funding, Ledger-Enquirer, April 6, 2013, <http://www.ledger-enquirer.com/2013/04/06/2453838/244-million-chattahoochee-river.html>, accessed November 13, 2013.
Anderson Economic Group, LLC 10

The Grand Rapids Whitewater Project
demographics downtown and increase interest in the central business district.10 This type of exposure provides far-reaching benefits for Wausau that cannot be measured in dollars and cents.
Golden, Colorado. The city of Golden, Colorado is the home of an extensive trail system called Clear Creek that is frequented by fishermen, kayakers, runners, and bikers all year. Clear Creek has been the centerpiece of Golden’s
commerce since the city was founded, and is still the main hub of activity.11 As an expansion to the extensive trail system, the city of Golden implemented the Clear Creek Whitewater Park in 1998 and commissioned an economic impact study in 2000 which estimated visitorship for the whitewater park portion of the trail system.
The direct economic impact from kayaker expenditures alone is estimated at $913,545 to $1.15 million annually. The study also estimates that the total
annual impact of the whitewater park comes to between $1.4 and $2.0 million.12 The park hosts multiple events per year and is another training site for the U.S. Olympic Kayak Team, so it is reasonable to estimate that the city realizes many economic benefits due to the popularity of the whitewater park, such as increased spending at hotels, shops, and restaurants.
FIGURE 4. Man-made Stairstep Features at Clear Creek
Source: American Whitewater
10.VanBelleghem, Luke, National Main Street Center, Network Notes: Wausau’s Whitewater Enhances its Downtown Draw, <http://www.preservationnation.org/main-street/main-street-news/2003/05/network-notes-wausaus-whitewater.html>, May 2003.
11.Golden, Colorado Visitors Center, <http://visitgolden.com/things-to-do-golden/clear-creek-trail-and-white-water-park:, accessed March 24, 2014.
12. “Preliminary Evaluation of the Beneficial Value of Waters Diverted in the Clear Creek White-water Park in the City of Golden,” Stratus Consulting, 2000.
Anderson Economic Group, LLC 11

The Grand Rapids Whitewater Project
Reno, Nevada. The city of Reno, Nevada sought a way to increase recreation opportunities and build on the vibrancy of its downtown resort area. In 2004, the city commenced development of the Truckee River Whitewater Park. The park is located in the heart of Reno and draws tens of thousands of visitors per year to its annual River Festival, and to participate in and watch paddling competitions. It also offers numerous outdoor recreational opportunities for residents and visitors. In addition, the success of the park inspired a nearby town to undertake a similar river and riverfront development project.
An economic impact study conducted by the City of Reno estimated that with two events per year (an organized whitewater event and a festival event) and normal park usage, the direct economic impact of the Truckee River Whitewater
Park ranges from $1.9 to $4.1 million annually.13 The study also estimated that the economic activity created by the park would generate tax revenues of up to $263,000 per year.
FIGURE 5. Recreational Kayaking at the Truckee River Whitewater Park
Source: Sierra Nevada Geotourism
13. “Truckee River Recreation Plan,” Resource Concepts, 2004.
Anderson Economic Group, LLC 12

The Grand Rapids Whitewater Project
RIVER RECREATION AND ENHANCED RECREATIONAL OPPORTUNITIES
River-based activities have been growing in popularity in the United States. According to a study published by The Outdoor Foundation, stand-up paddling, whitewater and recreational kayaking, rafting, and fly-fishing were among the top 20 outdoor activities in terms of first-time participants in 2012. Stand up paddling had the highest percentage of first-time participants at nearly 60% (meaning that of all the people who participated in stand up paddling in 2012, 60% were trying it for the first time). Whitewater kayaking had a first-time par-ticipant rate of 32%; rafting 28%; recreational kayaking 25%; and fly fishing
21%.14
Not all outdoor recreation activities happen in or on the river after a restoration project. Running, jogging, and trail running were the most popular outdoor activities based on the participation rate in 2012. About 19% of Americans, or 53.2 million, participated in these activities. Running, jogging, and trail running were also among the most popular outdoor activities in terms of the frequency of participation. In 2012, runners/joggers averaged 87 outings each.
Having more outdoor recreation opportunities within the city of Grand Rapids may encourage residents to participate more often. According to The Outdoor Foundation’s study, 26% of Americans do not participate in outdoor recreation because they do not have the time; 21% feel they do not have the skills or abilities; 18% do not have anyone with whom to participate; and 9% skip out because places for outdoor recreation are too far away. For many people, one accessible, popular outdoor activity leads to interest in others. The two most
popular “gateway” activities in 2012 were running, jogging, and fishing.15 So, the river-based and non-river based recreation participants may feed into one another.
14. Outdoor Participation Report, The Outdoor Foundation, 2013.
15.Outdoor Participation Report, The Outdoor Foundation, 2013.
Anderson Economic Group, LLC 13

Economic Overview: With and Without The Rapids
III.Economic Overview: With and Without The Rapids
A strong job-base, several colleges and universities, and diverse cultural and recreational offerings have contributed to the current vibrancy in downtown Grand Rapids. As discussed below, these aspects are core to the community today, and stand to be enhanced further by the restoration of the Grand River through downtown Grand Rapids.
GRAND RAPIDS TODAY
Business and Employment
Grand Rapids has one of Michigan’s strongest and most diverse economies, with significant manufacturing, healthcare, professional service, and retail industry employers. Downtown Grand Rapids is home to large employers including the Spectrum Health System, several banks, medical research facili-ties, and a number of law firms. There are also a wide variety of restaurants, locally owned shops, and educational institutions in the downtown.
In 2011, 71,092 people were employed in downtown Grand Rapids, repre-senting an increase of 6.4 percent from 2005. The downtown area experiences a net inflow of 55,378 workers during the day, providing a significant boost to the
market area.16 See Table 2 on page A-4 for further employment data.
Colleges and Universities
Seven colleges and universities have a major presence in downtown Grand Rap-ids. These schools—Davenport University, Grand Rapids Community College, Kendall College of Art and Design, Ferris State University, Michigan State Uni-versity College of Human Medicine, Grand Valley State University, and West-ern Michigan University—have a combined enrollment of approximately 26,000 at their downtown Grand Rapids campuses, contributing to the active and vibrant population of the area. An additional 18,000 students are enrolled at other colleges in Grand Rapids, including Aquinas College, Calvin College,
Cornerstone University, Grace Bible College, and Kuyper College.17
Arts, Culture, and Entertainment
Downtown Grand Rapids is the home of three main event centers: DeVos Place convention center, DeVos Performance Hall, and Van Andel Arena. These ven-ues allow the downtown to host conferences and conventions for large organiza-
16.On the average day more than 67,000 people commute into downtown Grand Rapids for work while just 11,955 people who live in downtown leave to work elsewhere. U.S. Census Bureau, Center for Economic Studies, <http://onthemap.ces.census.gov/>, accessed on October 31, 2013.
17. Enrollment data collected from university and college websites.
Anderson Economic Group, LLC 14

Economic Overview: With and Without The Rapids
tions; public shows such as the Michigan International Auto Show; performances by the Grand Rapids Symphony and the Grand Rapids Ballet; and other events such as concerts, basketball games, and Grand Rapids Griffins hockey games.
The downtown is also home to The Gerald R. Ford Presidential Library and Museum and The Grand Rapids Public Museum, both located on the river. The Grand Rapids Art Museum and The Grand Rapids Children’s Museum are near the river, and ArtPrize, an annual open-art competition that began in 2009, showcases venues along the riverfront. See Map 4, “Overview of Downtown Colleges, Museums, and Event Centers,” on page B-5 for the locations of downtown attractions relative to the Grand River.
Parks and Recreation
Downtown Grand Rapids is home to a number of parks, including three along the Grand River. Canal Street Park and 6th Street Bridge Park are located on the east bank of the Grand River between Leonard Street and I-196. Ah-Nab-Awen Park is on the west bank of the river next to the Gerald R. Ford Museum. These parks primarily offer shore-based recreation, such as picnic space and play areas. There are pathways through the parks, but they are disconnected in some places from other portions of the riverfront.
Recreational activities on and in the river are limited, primarily by safety issues. The existing dams create a perpetual circle of water on the downstream side,
leaving a turbulent flow that can roll or flip boats and seriously injury people.18 The most notable water-based activity is fishing near the 6th Street dam: steelhead in March through April and November through December; salmon mainly in August through October; and bass, carp, perch, and walleye year-round. Many fisherman wade into the river when flows are not too high; others fish from the East Wall or small boats.
A RESTORED GRAND RIVER IN GRAND RAPIDS
A restored Grand River will provide for an even more vibrant downtown core in Grand Rapids to the benefit of existing businesses, attractions, and amenities.
Current and future residents of downtown Grand Rapids, as well as the greater Grand Rapids region, will gain access to new recreational activities. The down-town area will be more attractive to young professionals, as well as people seek-ing a “live-work-play” environment.
18.There are an average of 12 accidents each year on the river in Grand Rapids.Walker, Heather, “DNR: 6th Street Dam a ‘drowning machine,’ WoodTV8, August 19, 2013, <http://www.woodtv.com/news/local/grand-rapids/dnr-6th-street-dam-a-drowning-machine>, accessed November 12, 2013 and River Quality and Use Subcommittee Report to the Grand River Restoration Stakeholder Group, 2013.
Anderson Economic Group, LLC 15

Economic Overview: With and Without The Rapids
New river recreation will benefit existing businesses by bringing more potential consumers to the downtown area. It may result in new businesses being opened, particularly those specializing in paddle sports, fishing, and other recreational equipment. Outdoor recreation has been a stable and growing part of the recre-
ation economy, with growth of about five percent annually from 2005 to 2011.19 As such, the new business opportunity will be backed by a growing and resilient consumer base.
The overall business community, as well as colleges and universities, will also benefit from the creation of an environment in which workers want to live. An amenity such as the whitewater course and better access to the river for all users will add to the appeal of Grand Rapids, helping local businesses better attract potential employees to the market, and colleges and universities to attract new students.
Establishing a reputation in Grand Rapids as an outdoor recreation center presents opportunities to use the nearby DeVos Place to host industry trade shows or conferences. A reverse effect may arise as well; visitors of the convention center or performance hall may choose to visit the waterfront before or after their respective events, or observe an event happening on the same weekend as a show.
Recreational Benefits
The project will grow Grand Rapids’ reputation as an outdoor recreation center by providing increased opportunities for visitors to participate in outdoor recre-ational activities. The modified river environment will allow Grand Rapids to host kayak, canoe, and rafting events which provide opportunities for both par-ticipation and observation. Fishing in the Grand River will be improved because migratory fish will be able to more easily reach their natural spawning areas, and their populations will be able to grow.
The river restoration project will help create new uses for the three parks that are located along the river. Downtown residents may choose to use the expanded network of walking and biking paths for outdoor recreation, which is an important quality of life factor. The parks are also an attractive amenity that bring local college students to the riverfront to enjoy the scenery and observe or take part in other recreational activities.
19.Outdoor Recreation Economy report, 2012, Outdoor Industry Association.
Anderson Economic Group, LLC 16

Economic Overview: With and Without The Rapids
RIVER RESTORATION AND LAND USES
The Grand River riverfront in Grand Rapids features a mix of public and private land uses. As part of this study we assessed these parcels, first via satellite imag-ery and then during an on-foot survey. The assessment included visual inspec-tion of the exterior of the properties to gauge the level of use of the property.
We designated each parcels as having a high, mid, or low level of utilization based on connectivity with surrounding uses; whether the use takes advantage of the riverside location; and whether the use would at all be hindered if it were not located on or near the river. The results from this assessment are as follows:
• These parcels cover nearly 247 acres with a varying degree of development den-sity. Some small pieces of property include high-rise residential buildings with tens, if not hundreds of parcels, while other parcels are larger and contain no development.
FIGURE 6. Grand River Adjacent Land Utility, in Grand Rapids, in Acres
Source: Anderson Economic Group, LLC
• Of the total land area, 41.7 percent (103 acres) has a low level of utilization. This acreage is primarily located north of downtown, between Ann and 6th Streets. Most of this acreage includes parking lots and public works buildings. An area between Fulton and Wealthy Streets that houses parking lots and aban-doned structures also fall into this low utilization category.
• About 20.8 percent (51.3 acres) has a mid-level utilization. This acreage is scat-tered throughout the downtown area and primarily consists of small offices, sin-gle-use buildings, and a few acres that have plans for new construction in the near future. These areas gain value from their proximity to the river and have the potential to be upgraded to a higher use.
• About 37.5 percent (92.6 acres) has a high level of utilization. These acres are primarily located in the central downtown area between I-96 and Fulton Street. Acres that we qualified as high-level utilization include condos/apartments, hotels, and mixed-use buildings. They can serve many people at once and take advantage of their riverside location. Some acreage also qualified as high-level utilization if it included open space, parks, or museums.
103.0
51.3
92.6 Low Level Utilization
Mid Level Utilization
High Level Utilization
Anderson Economic Group, LLC 17
Economic Overview: With and Without The Rapids
See Figure 6, “Grand River Adjacent Land Utility, in Grand Rapids, in Acres,” on page 17 and Map 3, “Highest and Best Use Assessment,” on page B-4 for our land utility assessment.
Later in this report, in “Improved Land Uses and Fiscal Benefits” on page 25, we further discuss the opportunity and benefits from enhancing these land uses.
Anderson Economic Group, LLC 18

Economic Impacts from Direct New Uses of the Grand River
IV.Economic Impacts from Direct New Uses of the Grand River
The most visible and immediate economic benefits from many river restoration projects relate to new and increased recreational uses of the river and riverfront. These direct uses draw visitors to the community. They also stimulate current resi-dents to partake in new activities, or to stay home instead of traveling elsewhere for the activities. With this recreational activity comes spending that otherwise would not have occurred, fueling additional economic activity, employment, and income.
ESTIMATING NET NEW ECONOMIC IMPACT
A “net economic impact” is the level of change in economic output directly and indirectly caused by a given project, event, policy, or other action. This new eco-nomic activity is driven by increased expenditures. Expenditures that would have occurred anyway are not counted, nor are expenditures that are immediately directed outside of the local economy. For example, we do not count, as net new, expenditures related to the level of fishing activity that already takes place. We only count the spending that would be above and beyond this existing level. See “Eco-nomic Impact Calculations” on page D-1 for a further discussion of this methodol-ogy.
ESTIMATING NET NEW RECREATION USERS
The proposed Grand Rapids Whitewater project will attract a variety of new river users to the city of Grand Rapids. To get an accurate picture of the impacts due to the project, we defined four expected user groups:
• Whitewater users,
• Other paddle and boating users,
• Fishing users,
• Shore-based recreation users and spectators
Usage estimates for each of these groups were derived using local market data, realized usage of analogous projects (see “Whitewater Boating User Estimates” on page 20), and results from national surveys of recreational activities and
TABLE 2. Grand Rapids Whitewater Project Visitor and User Estimates
Annual Net New User DaysLow End Estimate
Annual Net New User DaysHigh End Estimate
Whitewater Boating Users 13,090 15,400
Non-Whitewater Boating Users 42,500 50,000
Fishing Users 66,844 80,213
Shore-based Users 110,000 392,700
Total 232,434 538,313
Source: Anderson Economic Group, LLC
Anderson Economic Group, LLC 19
Economic Impacts from Direct New Uses of the Grand River
frequency of participation. These sources also informed our estimates of the share of overall users who are local compared to visiting, and the share of those visitors who are likely to come primarily as a result of the newly available river recreation (as opposed to those who visit and use the river, but would have visited even if not for the availability of river recreation).
Using these figures, we calculated net new user days, under both a conservative and potential scenario, that Grand Rapids may experience as a result of the restoration project. The conservative scenarios is based on data and observa-tions of smaller-scale river restoration projects. The potential scenario reflects possible increased draws given the project’s location, broad scope, and overall community and statewide interest. The calculations are summarized below, and presented in more detail in “Net New Visitorship Estimates” on page D-2.
Whitewater Boating User Estimates
To estimate the expected number of whitewater-related users for the planned Grand Rapids Whitewater restoration project we examined usership data and estimates from other whitewater parks in cities of a similar population size to Grand Rapids, including:
• South Bend, Indiana had a population of 101,168 in 2010 and its whitewater park, East Race Waterway, opened in 1984. The course is used by 500 to 700 people on a typical Saturday or Sunday. Over 300,000 people have gone down
the course since the raceway opened.20 This averages to about 10,000 per year since the 1984 opening.
• Reno, Nevada had a population of 225,221 in 2010. Its year-round Truckee River Whitewater Park opened in 2004, and it was originally estimated that total annual usage would be approximately 10,000 though some thought it could be
as high as 50,000.21 More recent observations peg the attendance to be in the
70,000 to 80,000 range, including spectators and non-river users.22
• Columbus, Georgia and Phenix City, Alabama had a combined population of 222,707 in 2010. The Chattahoochee River Whitewater Park opened in the spring of 2013 and the course is about two miles long. According to a recent market and economic analysis, between 60,000 and 100,000 participants are expected per year (including those actually using the river and patrons viewing
the event).23
• Fort Collins, Colorado had a 2010 population of 143,986. A whitewater park has not yet been constructed but researchers at Colorado State University con-
20.South Bend Tribune and South Bend Parks and Recreation.
21.Truckee River Recreation Plan and Reno’s Riverwalk Merchants Association.
22.“Whitewater Parks Revitalize Local Economies.” Canoe & Kayak Magazine, January 18, 2008.
23.Chattahoochee River Whitewater and Chattahoochee River Restoration Market and Economic Impact Analysis.
Anderson Economic Group, LLC 20

Economic Impacts from Direct New Uses of the Grand River
ducted an economic assessment study on expected usage. Depending on river flows, between 12,992 and 14,616 users are expected annually.
Our total usership estimate for pure whitewater activities (whitewater paddling) on the Grand River in Grand Rapids ranges from 8,500 (conservative) to 10,000 (potential) users per year. This includes visiting users and local users, but not spectators.
Visitors from outside the city are assumed to comprise 90 percent of the total usership. It is assumed that only 20 percent of these visitors would have visited anyway. These assumptions reflect the unique nature of the attraction and the interest that people from outside of the area will have in it. The estimate also reflects a shorter season relative to several of the examples cited above.
Local users are assumed to comprise the other ten percent of the whitewater user base, and we further assume that 50 percent of this local base would have participated in some substitutable form of recreation within the area, thus not providing a net new benefit.
After considering user origins and substitution activities, we further assume that each user will spend two days in the area. From this we arrive at a range of 13,090 (conservative) to 15,400 (potential) net new visitor days attributable to whitewater recreation.
Non-Whitewater Boating User Estimates
The restoration project will provide for a river experience that is also conducive to many other rowing and paddle sports, including recreational kayaking, canoeing, rowing, stand-up paddling, and other primarily non-motorized boat-ing. To estimate related usership, we observed national industry statistics indi-cating that recreational kayaking and canoeing participation is approximately three times greater than whitewater kayaking participation. Recognizing that some of this difference in participation level is the greater accessibility that most people have to waters for non-whitewater activity, we have assumed that total canoe, recreational kayaking, rowing, and other non-whitewater boating uses will be about four times the whitewater kayaking usage estimate, or 34,000 to 40,000.
Visiting non-whitewater boating users are assumed to comprise 75 percent of the total usership. It is assumed that 25 percent of these visitors would have visited anyway. These assumptions reflect the unique nature of the attraction, but also realize that non-whitewater recreation options are quite available elsewhere in the region and across the state, thus the lower visitor share and higher rate assumed for visitors who would have visited anyway relative to the whitewater user assumptions.
Anderson Economic Group, LLC 21

Economic Impacts from Direct New Uses of the Grand River
Local users are assumed to comprise the majority, 25 percent, of non-whitewater boating users. We further assume that 75 percent of this local base would have participated in some substitutable form of recreation within the area, thus not providing a net new benefit. This again reflects the currently available non-whitewater opportunities available throughout the area.
After considering user origins and substitution activities, and further assuming that each non-whitewater boating user will spend two days in the area, we arrived at a total of 42,500 to 50,000 net new visitor days attributable to non-whitewater river recreation.
Fishing User Estimates
The Grand River in Grand Rapids is already well-known as a fishing destina-tion, especially among local and regional populations. The restoration project, however, will provide greater fishing opportunities along the entire project area, while maintaining many of the elements that make the 6th Street dam area such a popular fishing spot today. In total, the project is expected to add 500 percent in fish holding habitat and provide a 275 percent increase in sport fishing perim-
eter.24
To estimate fishing-related visitors we primarily relied on a Grand River Assessment conducted by the Michigan Department of Natural Resources (MDNR) in 2003 and 2004. Survey statistics estimated just over 46,000 angler trips to the Grand River in the Grand Rapids metropolitan area. In our calcula-tions, we estimate that the number of angler trips will increase by approximately 25 to 50 percent due to improved fishing conditions and larger fish populations due to the river restoration. Based on this assumption and the Grand River surveys, we estimate 57,500 to 69,000 annual users for fishing after the resto-ration is completed.
Visiting users from outside the city of Grand Rapids are assumed to comprise 75 percent of the total usership. It is assumed that 50 percent of these visitors would have visited anyway. This recognizes that the area is already a known fishing destination, while also accounting for the fact that the restoration will create a fishing environment to which more people will be willing to travel.
Local users are assumed to comprise 25 percent of fishing users. We further assume that 95 percent of this local base would have participated in some substitutable form of recreation within the area, thus not providing a net new benefit. This again reflects the current availability of fishing on the Grand River, and elsewhere in the region.
24.Grand Rapids Whitewater Preliminary Plan, November 2013.
Anderson Economic Group, LLC 22

Economic Impacts from Direct New Uses of the Grand River
After considering user origins and substitution activities, and further assuming that each user will spend three days in the area, we arrive at a total of 66,844 to
80,213 net new user days attributable to fishing recreation.25
Shore-Based User Estimates
Lastly, we estimated the expected number of people who will come to the river-front area for other recreational purposes, such as biking or jogging, or simply to enjoy watching the river, attending a river-related event, or enjoying other shore based activities, perhaps while a family member kayaks or fishes. This is a more difficult estimate at which to arrive, given the broad appeal of a river-front setting.
Our estimates are based on the assumption that there will be one to three shore-based user for every one water-based user. This produces an estimate of 100,000 (conservative) to 357,000 (potential) shore-based users. About 25 percent of these users are assumed to be local, and that 35 percent would have stayed in the city, regardless of the restoration project.
A strong visitor draw is also expected, however, as people will accompany white-water users, other boaters, and fishers, and others will come simply to enjoy the views and parks. For the 25 percent who are assumed to be from out-of-the-area, we assume a 75 percent substitution. We also assume an average length-of-stay of two days, which yields a total estimate of 110,000 to 392,700 net-new visitor days from shore-based users.
USER EXPENDITURE ESTIMATES
We used previously completed economic impact studies and general knowledge of the Grand Rapids area to estimate the net-new expenditures that each type of user will make while in the Grand Rapids area. These expenditure estimates reflect expected spending while they are in the area because of the whitewater project’s benefits and attractions. Further, the expenditure estimates are only for net-new users. Users who we’ve assumed to not be net-new, or existing users of the Grand River or a substitute asset in the area, would be assumed to spend less as it would be a more regular activity and closer to home.
Our average daily expenditure estimates, on a per person basis for net new users, are:
1. $100 for whitewater boating users
2. $75 for non-whitewater boating users
25.We assume a larger number of usage days per user for fishing, relative to boating, as the fish-ing season begins earlier in the spring and extends deeper into the fall. Fishing is also less dependent on weather, and in fact may be aided by rain, cool temperatures, and other factors that would limit boating uses.
Anderson Economic Group, LLC 23

Economic Impacts from Direct New Uses of the Grand River
3. $125 for fishing users
4. $10 for shore-based users
We’ve assumed slightly higher spending for whitewater boating users as the group includes more non-local users, and because there will likely be more need for equipment rental relative to non-whitewater use. The net-new fishing users are expected to be drawn for fly fishing opportunities, and research shows that those traveling fly-fishing tend to spend more than those participating in whitewater activities. This may be because anglers tend to be older individuals with higher median incomes than kayakers. Finally, we have assumed a modest $10 daily expenditure average for net-new visitors that are primarily drawn for shoreline activities. These shore-based users are more likely to be from the area, and those that are visiting are assumed to be staying with a boating or fishing user, thus not requiring additional accommodation expenditures and limited other expenditures that would not have been made in the market anyway.
ECONOMIC IMPACTS FROM NET-NEW EXPENDITURES
We used our estimates of net-new visitor days and new expenditures to determine the net economic impacts from the project. Based on our calculations of net-new user days (new visitor days due to people using the river or surrounding parks for different activities), and different spending habits depending on the activity, we arrive at a total of $12.9-$15.5 million in direct
new spending.26 See “Net New Spending Estimates” on page D-4.
This new spending stimulates further spending in the region. To estimate the total net-new demand for goods and services, as well as the number of jobs and the level of wages that are supported by the spending, we apply region and industry-specific RIMS II Regional Multipliers from the U.S. Bureau of Economic Analysis. We adjusted the multipliers to account for only the city of Grand Rapids by finding the ratio of jobs in the city to the two-county region, and increasing the result slightly to account for Grand Rapids having a dense concentration of jobs. We then reduced the regional multipliers by that ratio. In doing so we find that:
1. The total annual economic impact from net new visitor spending is estimated to be $15.8 under the conservative scenario and $19.0 million under the potential scenario.
2. This net-new economic activity will support or create some 80 to 96 jobs within the city, and produce a total of $1.9 to 2.3 million in net new earnings to house-holds in the city.
26.Note that these are current year figures, with no adjustment for inflation.
Anderson Economic Group, LLC 24

Other Economic Benefits of the Grand River Restoration
V.Other Economic Benefits of the Grand River Restoration
The restoration will also generate impacts that are difficult or impossible to accurately project, including health, quality of life, and environmental impacts. These factors improve the city and the region but are often realized over long periods, making them more difficult to see and measure.
OTHER ECONOMIC IMPACTS
Attraction and Retention of Businesses
The restoration of the rapids will draw paddlers from across the state; create opportunities for the city to host competitions; and provide a training course for Olympic athletes. Wausau, Wisconsin has realized economic impacts from host-ing international paddling events, and its downtown gains worldwide exposure because competitors and spectators visit from around the globe. The ability to host such events provides a new market opportunity for Grand Rapids and may encourage retailers that supply outdoor recreation equipment to open. Currently, we know of only one other whitewater park in lower Michigan (Petoskey), and a handful in Illinois, Indiana, and Wisconsin. None, however, are of the scale envisioned for Grand Rapids.
The river restoration project will help draw more visitors to downtown Grand Rapids. Not only will these visitors take advantage of the river and adjacent parks, but they will bring business to and increase awareness of restaurants and shops in close proximity to the river. Increased visitation also makes the city conducive to entrepreneurship, since new business owners can have confidence that their establishment will be seen by thousands of people every day. Grand Rapids currently fosters an excellent entrepreneurship community, with several incubators located in the downtown area.
Some visitors may be traveling from several hours away since there are no similar attractions in the region. These visitors are likely stay a night or two at a downtown hotel and spend more on meals than day visitors. Increasing the number of visitors and visitor nights directly benefits the hotels where they stay and retail establishments where they spend money, encouraging downtown business retention. They also benefit the city as a whole by raising the profile of Grand Rapids and helping the city to be more competitive on a regional and state scale.
Improved Land Uses and Fiscal Benefits
Connectivity. Opening up the river to more recreation activities provides an opportunity to increase connectivity throughout the downtown and to adjacent areas. Riverside pathways are a great means of seeing important parts of the city for pedestrians and bicyclists. They also provide alternative methods of
Anderson Economic Group, LLC 25

Other Economic Benefits of the Grand River Restoration
traveling from the downtown areas to nearby neighborhoods while enjoying scenic river views. While there are pathways along the river in downtown Grand Rapids, they are disconnected in some areas. In addition, some portions of pathways lack railings and may be dangerous if used by many pedestrians or anglers at one time. Expanding and enhancing these pathways will encourage increased shore-based usage of the Grand River.
Economic Benefits from New Development. As previously discussed in “River Restoration and Land Uses” on page 17, over 60 percent of parcels adjacent to the Grand River in downtown Grand Rapids are under utilized (41.7 percent low-level utilization, and 20.8 percent mid-level utilization). The river restoration will make the riverfront more attractive and accessible, helping to stimulate new development on river-adjacent parcels.
This new development is most likely to begin with parcels that are currently at a low-use, thus presenting the most upside for new development. Based on our parcel survey, knowledge of recent development trends in Grand Rapids, and the proximity of current low-use parcels to downtown Grand Rapids, we feel it reasonable to anticipate that some 50 percent of low-use parcels (38 of the 75) will shift to a high-use within a decade of the river renovation. As this devel-opment takes place the city will benefit from construction expenditures, construction jobs, and the resulting increased taxable values.
To estimate potential construction expenditures and jobs, we reviewed brownfield and building permit data from the City of Grand Rapids Planning Department. We examined project costs for both brownfield projects and from construction projects in which building permits were issued and calculated an average project cost of about $7.5 million. Based on the number of jobs committed to recent brownfield projects, we estimate an average of 40 jobs per
project.27 This yields a total potential investment estimate of $285 million, involving 1,520 jobs, for projects to convert 38 low-use parcels (50 percent of low-use parcels) to higher and better uses.
To estimate the potential increase in property tax base that would accompany the new development we relied current taxable value information for river-adjacent parcels, as is available from the Kent County assessors office. With this data we found the average value per parcel for the current low, medium, and
27.The planning department provided us with a Brownfield Projects Report (2010-2014) and con-struction cost data from issued building permits, for parcels within 100 feet of the Grand River (2000-2014). The average brownfield project size was $10,308,208 with 37 jobs committed. The average permitted project on or near the river was $5,827,172. Jobs data for these projects was not provided. We further selected specific projects that appeared to best represent the development types that would occur along the riverfront and found the average budget for these was $7,513,486 with 48 jobs. Thus, we have used $7.5 million in costs and 40 jobs as representative averages.
Anderson Economic Group, LLC 26

Other Economic Benefits of the Grand River Restoration
high-use properties. We then calculated the change in overall taxable value that
would occur is a given share of properties were upgraded to a higher use.28
As shown in Table 3, “Current Estimated Land Values,” on page 27, the current average taxable value for low-use properties is $237,023 while the average value for a high-use property is $3.3 million. If 50 percent of the current low-user properties are developed into a high-use with taxable values that align, on average, with current high-use properties, the overall taxable value would increase by nearly $117.8 million (calculated at 38 properties seeing taxable values increase from $237,023 to $3.3 million).
Source: Kent County Property Information SystemAnalysis: Anderson Economic Group, LLC*Land Units refers to a property and in most cases on parcel is one land unit. However, several properties in the area contain tens, or even hundreds of unique parcel numbers, primarily in the case of multi-unit residential properties. Each of these is considered a land unit despite consisting of multiple parcel numbers. To determine average parcel value for such instances we used the average of a sample of units and multiplied by the number of units to find the value of the building.**All Units refers to each parcel as reported to the Kent County assessor. One building can be comprised of multiple parcels, as each tenant owns or rents a parcel.
ECOLOGICAL BENEFITS
Flood Control
Because the dams were not originally built for flood control, removing them will not exacerbate the problem. The 6th Street dam was built in 1917 to pro-duce hydroelectricity and the lowhead dams were built for beautification pur-
poses.29 Removing and modifying the dams will actually help reduce flooding by eliminating areas where debris becomes easily trapped during flood events.
Lower water levels will increase the capacity of the channel.30
28.In the case of multi-tenant buildings, we took a sample of values from several parcels in each building to provide a representative average value per parcel, then multiplied this by the total number of parcels in the building to approximate the total taxable value of the building on the multi-parcel land unit. We then assumed that high-utility parcels will keep their high-utility use and related value, and that parcels moving to a higher use come to have the current average value of those higher uses.
TABLE 3. Current Estimated Land Values
Total Taxable Value
Parcel Count: Land Units*
Parcel Count: Total Units**
Average Taxable Value per Parcel
Low-Utility $17,776,726 75 75 $237,023
Mid-Utility $34,857,290 32 54 $1,089,290
High-Utility $176,798,634 53 787 $3,335,823
Total $229,432,650 160 916
29.Hanshue, Scott and Amy Harrington, “Special Report: Draft Grand River Assessment,” Mich-igan Department of Natural Resources Fisheries Division, 2011.
Anderson Economic Group, LLC 27

Other Economic Benefits of the Grand River Restoration
Fish Habitats
Dams often have the effect of blocking spawning runs and isolating fish popula-tions, which decreases the overall productivity of the fish community. Aside from blocking fish from their spawning areas, fish can be injured or killed trying to move around dams. The Fish Ladder located at the 6th Street dam prevents these negative effects to an extent, but allowing fish populations to move more freely up and downstream will help restore their numbers to a higher level as well as improve the fishing experience in the river. Downstream from the site of the 6th Street dam, exposed boulders and bedrock formations will recreate fish holding areas. Removing the dams will allow a higher percentage of fish to pass to upstream areas, will help diversify the river’s aquatic life by up to five times,
and will sustain the game fish populations.31
Sea Lamprey Barrier
A sea lamprey adjustable velocity barrier will be constructed between Leonard and Ann Streets to prevent lamprey from traveling farther up the Grand River. This type of barrier exploits the fact that lampreys are poor swimmers by creat-ing an area of very fast-moving water with surfaces to which sea lampreys can-not attach. Fish are able to pass the barrier as they are much stronger
swimmers.32 An effective barrier is an important aspect of the restoration of the Grand River because lamprey are an invasive species, and they prey on native species of the river. Preventing them from spreading upstream will not only help fish species in the Grand River to thrive, it will also strengthen the local fishery.
HEALTH AND SAFETY Parks and recreation areas present opportunities for physical activity. Exercise helps curb obesity and also can significantly reduce the risk of serious chronic diseases such as cardiovascular disease, high blood pressure, and diabetes. In addition, regular physical activity can reduce the severity of mental health disorders such as depression, anxiety, and panic disorder. Finally, social inter-action that often results from physical activity improves energy levels and
personal self-esteem.33 Increasing recreational opportunities in downtown Grand Rapids will be a benefit to public health.
30.Tuthill, Samantha-Rae, “National Dam Removals Revitalize Wildlife, Decrease Flood Risks,” AccuWeather.com, March 20, 2013, <http://www.accuweather.com/en/weather-news/national-dam-removals-revitali/8231692>, accessed on December 4, 2013.
31.Hanshue, Scott and Amy Harrington, “Special Report: Draft Grand River Assessment,” Mich-igan Department of Natural Resources Fisheries Division, 2011.
32.Great Lakes Fishery Commission, “Sea Lamprey Barriers: New Technologies Help Solve an Old Problem,” <http://www.glfc.org/pubs/FACT_5.pdf>, accessed March 25, 2014.
33.California State Parks, “The Health and Social Benefits of Recreation,” California State Parks Planning Division, 2005, pp. 36.
Anderson Economic Group, LLC 28

Other Economic Benefits of the Grand River Restoration
Some social and health benefits associated with urban parks and green spaces are well-studied. A project in Philadelphia involving cleaning up vacant lots and planting gardens correlated with a 90% drop in burglaries and thefts in the surrounding precinct. A study in California showed that the presence of park users is an excellent deterrent of crime, and helps residents feel more safe and
secure at home.34 Park and recreation opportunities also bring neighbors together and encourage a lively community atmosphere. A safe, active environment increases an area’s desirability and may encourage further investment in the downtown.
Removing the dams as part of the restoration project will make the river safer for all users. Dangerous water patterns that occur at the base of dams will be eliminated, which will make the river much more safe for all users. The addition of rescue ladders to the existing floodwalls will assist rescue teams in quickly reaching river users who are in trouble and need to be pulled out of the river. Finally, whitewater features that will be created in the river will provide an opportunity for rescue teams and firefighters to train in an active river environment. Grand Rapids could become a training center for rescue teams and firefighters from around the state, since the closest swiftwater rescue training
courses are in Indiana and Minnesota.35 South Bend, Indiana hosts a river rescue training program that has attracted over 2,500 students from across the U.S. and South America to train at its East Race Waterway.
QUALITY OF LIFE The project has associated educational benefits. Outdoor recreation facilities provide exceptional learning opportunities. In addition, using park and/or recreation areas as a learning center creates a fun atmosphere where students
want to participate.36 Outside of a structured learning environment, the enhanced recreation options presents opportunities for anyone to learn a new sport or activity. As previously mentioned, stand-up paddling is a new sport that is rapidly gaining participants and the more accessible river would provide a place to learn the sport.
The riverfront development project in Detroit, Michigan has initiated positive spin-off aspects for both the riverfront area and the entire city. Anecdotal evidence suggests that the project helped to spur development that may not have
34.California State Parks, “The Health and Social Benefits of Recreation,” California State Parks Planning Division, 2005, pp. 23.
35. Indiana River Rescue School, <http://www.indianariverrescue.com/>, accessed on November 15, 2013 and University of Minnesota Duluth Recreational Sports Outdoor Program, <http://www.umdrsop.org/(RSOP%20Web)/Kayak_&_Canoe/infosheets_sm12/WW%20canoe%20pdfs%202012/2012SwiftwaterRescueInfo.pdf>, accessed on November 15, 2013.
36.California State Parks, “The Health and Social Benefits of Recreation,” California State Parks Planning Division, 2005, pp. 32.
Anderson Economic Group, LLC 29

Other Economic Benefits of the Grand River Restoration
otherwise taken place, and that the riverfront has transformed perceptions of Detroit among residents and non-locals alike. Further, the riverfront is a desirable space for workers, supporting a strong rental structure for properties
close to the river.37 Riverfront restoration and accompanying development has the potential to affect the entire city and region in unexpected ways.
Overall, restoring the river in downtown Grand Rapids provides countless benefits and opportunities to residents and visitors. Increasing the types of river-based recreation available of which residents and visitors can take advantage, such as kayaking, canoeing, rafting, and fishing contributes to their health and well-being. It encourages people to participate in new activities and build relationships with a new network of participants. It also helps diversify the local economy by providing another reason for visitors to come to Grand Rapids and another sector in which they can spend tourism dollars. Restoring the river will also improve the quality of life for residents by providing a place for enter-tainment and relaxation.
37.CSL International, “Economic Impact Study: Detroit Riverfront 2013,” Detroit Riverfront Conservancy, 2013, pp. 14.
Anderson Economic Group, LLC 30

Appendix A. Market Area Data
Appendix A contains:
Table 1, “Market Demographic Report,” on page A-2.
Table 2, “Business and Employment,” on page A-4.
Anderson Economic Group, LLC A-1

© A-2
Chg 2013 2018 % Chg
2.4% 876,463 902,663 3.0%
2.8% 326,047 337,016 3.4%0.4% 2.6 2.6 -0.4%
- 19,614 - -
Chg 2013 2018 % Chg
3.5% 34.8 35.6 2.3%
2.5% 250,693 253,675 1.2%8.9% 69,707 65,073 -6.6%4.8% 61,234 63,686 4.0%2.2% 58,385 61,537 5.4%4.1% 52,408 59,250 13.1%1.2% 55,104 52,655 -4.4%0.3% 57,366 54,704 -4.6%7.5% 61,727 56,800 -8.0%1.3% 56,939 59,150 3.9%9.4% 47,211 52,449 11.1%6.0% 105,689 123,684 17.0%
0.1% 28.6% 28.1% -1.7%3.2% 12.1% 13.7% 13.6%
Chg 2013 2018 % Chg
0.1% 721,629 732,275 1.5%3.3% 64,551 69,081 7.0%6.3% 26,554 29,096 9.6%1.6% 63,729 72,211 13.3%2.1% 87,257 99,400 13.9%
2.2% 82.3% 81.1% -1.5%0.9% 7.4% 7.7% 3.9%3.8% 3.0% 3.2% 6.4%9.0% 7.3% 8.0% 10.0%9.4% 10.0% 11.0% 10.6%
Grand Rapids Region
2014, Anderson Economic Group, LLC
TABLE 1. Market Demographic Report
Population 2013 2018 % Chg 2013 2018 %
Total Population 41,800 43,008 2.9% 189,416 194,002
Total Households 17,324 17,823 2.9% 73,001 75,030Average Household Size 2.4 2.4 0.0% 2.5 2.5 -
Population in Group Quarters 1,064 - - 7,980 -
Age 2013 2018 % Chg 2013 2018 %
Median Age 28.5 29.4 3.2% 31.7 32.8
Population: Under 20 10,990 11,167 1.6% 53,549 54,875Population: Age 20-24 6,085 5,590 -8.1% 18,442 16,804 -Population: Age 25-29 5,431 5,418 -0.2% 17,378 16,540 -Population: Age 30-34 3,873 4,191 8.2% 15,303 15,647Population: Age 35-39 2,640 3,054 15.7% 11,934 13,615 1Population: Age 40-44 2,400 2,348 -2.2% 10,749 10,882Population: Age 45-49 2,232 2,231 0.0% 10,265 10,239 -Population: Age 50-54 2,361 2,270 -3.9% 10,988 10,169 -Population: Age 55-59 1,992 2,172 9.0% 10,452 10,589Population: Age 60-64 1,436 1,626 13.2% 8,646 9,462Population: Age 65+ 2,361 2,940 24.5% 21,711 25,179 1
% of Population: Under 20 26.3% 26.0% -1.2% 28.3% 28.3%% of Population: Age 65+ 5.6% 6.8% 21.0% 11.5% 13.0% 1
Ethnicity And Race 2013 2018 % Chg 2013 2018 %
White / Caucasian 27,328 27,321 0.0% 120,698 120,871Black / African American 6,667 6,876 3.1% 39,752 41,072Asian, American Indian, and Pacific 981 1,031 5.1% 5,184 5,511Other or More Than One Race 6,825 7,781 14.0% 23,781 26,548 1Hispanic Ethnicity (any race ) 8,923 10,270 15.1% 31,175 34,935 1
% White / Caucasian 65.4% 63.5% -2.8% 63.7% 62.3% -% Black / African American 15.9% 16.0% 0.2% 21.0% 21.2%% Asian, American Indian, and Pacific 2.3% 2.4% 2.1% 2.7% 2.8%% Other or More Than One Race 16.3% 18.1% 10.8% 12.6% 13.7%% Hispanic Ethnicity (any race ) 21.3% 23.9% 11.9% 16.5% 18.0%
City of Grand RapidsDowntown Grand Rapids

© A-3
Grand Rapids Region
Chg 2013 2018 % Chg
6.0% $24,375 $28,379 16.4%6.9% $49,405 $58,000 17.4%
0.6% 40,028 38,862 -2.9%3.5% 38,628 27,947 -27.7%9.6% 36,930 31,386 -15.0%1.8% 48,876 41,447 -15.2%6.4% 68,432 69,233 1.2%1.9% 39,725 56,781 42.9%9.3% 35,127 49,185 40.0%5.3% 9,992 12,425 24.3%4.3% 8,309 9,750 17.3%
2.1% 12.3% 11.5% -6.1%5.6% 11.8% 8.3% -30.0%2.0% 11.3% 9.3% -17.8%4.2% 15.0% 12.3% -18.0%3.5% 21.0% 20.5% -2.1%7.8% 12.2% 16.8% 38.3%5.3% 10.8% 14.6% 35.5%1.6% 3.1% 3.7% 20.3%0.9% 2.5% 2.9% 13.5%
Chg 2013 2018 % Chg
2.1% 353,966 363,322 2.6%1.7% 65.6% 66.6% 1.5%0.5% 26.5% 26.2% -1.3%6.6% 7.9% 7.2% -8.2%
2014, Anderson Economic Group, LLC
TABLE CONTINUED.
Source: Esri, IncAnalysis: Anderson Economic Group, LLC
City of Grand RapidsDowntown Grand Rapids
Incomes 2013 2018 % Chg 2013 2018 %
Per Capita Income $16,452 $18,955 15.2% $19,021 $22,062 1Median Household Income $28,201 $31,280 10.9% $36,000 $42,099 1
Households w/Inc $14,999 and Below 4,705 4,824 2.5% 14,668 14,757Households w/Inc $15,000 - $24,999 2,909 2,354 -19.1% 11,217 8,581 -2Households w/Inc $25,000 - $34,999 2,652 2,494 -6.0% 9,560 8,647 -Households w/Inc $35,000 - $49,999 2,797 2,543 -9.1% 11,382 10,040 -1Households w/Inc $50,000 - $74,999 2,560 2,899 13.2% 13,746 14,628Households w/Inc $75,000 - $99,999 857 1,412 64.8% 6,181 9,389 5Households w/Inc $100,000 - $149,999 487 814 67.1% 4,436 6,625 4Households w/ Inc $150,000 - $199,999 224 311 38.8% 1,018 1,377 3Households w/Inc $200,000 and Above 133 173 30.1% 794 987 2
Households w/Inc $14,999 and Below 27.2% 27.1% -0.3% 20.1% 19.7% -Households w/Inc $15,000 - $24,999 16.8% 13.2% -21.3% 15.4% 11.4% -2Households w/Inc $25,000 - $34,999 15.3% 14.0% -8.6% 13.1% 11.5% -1Households w/Inc $35,000 - $49,999 16.1% 14.3% -11.6% 15.6% 13.4% -1Households w/Inc $50,000 - $74,999 14.8% 16.3% 10.1% 18.8% 19.5%Households w/Inc $75,000 - $99,999 4.9% 7.9% 60.1% 8.5% 12.5% 4Households w/Inc $100,000 - $149,999 2.8% 4.6% 62.5% 6.1% 8.8% 4Households w/ Inc $150,000 - $199,999 1.3% 1.7% 34.9% 1.4% 1.8% 3Households w/Inc $200,000 and Above 0.8% 1.0% 26.4% 1.1% 1.3% 2
Housing Unit Growth & Occupancy 2013 2018 % Chg 2013 2018 %
Total Housing Units 20,034 20,342 1.5% 80,944 82,604% Owner Occupied Housing Units 30.4% 31.3% 3.1% 49.5% 50.4%% Renter Occupied Housing Units 56.1% 56.3% 0.4% 40.6% 40.4% -% Vacant Housing Units 13.5% 12.4% -8.5% 9.8% 9.2% -

© A-4
Chg 2005 2011 % Chg
-4.6% 458,413 439,599 -4.1%1.9% 5,216 5,235 0.4%
-9.5% 229 147 -35.8%-9.0% 1,061 984 -7.3%9.9% 21,047 14,518 -31.0%9.7% 107,005 90,047 -15.8%6.7% 27,873 27,107 -2.7%5.6% 49,780 42,312 -15.0%3.0% 9,401 10,975 16.7%9.7% 6,667 4,795 -28.1%3.2% 16,251 15,722 -3.3%2.8% 4,759 4,596 -3.4%
-1.0% 18,964 18,247 -3.8%9.0% 5,333 5,218 -2.2%1.9% 29,600 41,302 39.5%0.9% 39,035 36,675 -6.0%5.5% 51,988 62,511 20.2%5.7% 4,670 4,388 -6.0%1.6% 35,123 30,469 -13.3%2.1% 14,657 14,599 -0.4%
-1.8% 9,754 9,752 0.0%
Chg 2005 2011 % Chg
-4.6% 458,413 439,599 -4.1%5.4% 391,959 384,789 -1.8%5.8% 66,454 54,810 -17.5%
Chg 2005 2011 % Chg
-11.2% 228,872 209,765 -8.3%17.4% 96,709 93,366 -3.5%13.5% 20,867 20,962 0.5%
2.5% 19,367 18,210 -6.0%3.5% 6,863 6,901 0.6%0.3% 6,209 5,827 -6.2%0.0% 7,745 7,576 -2.2%
-2.3% 6,734 7,189 6.8%70.2% 5,405 7,145 32.2%3.0% 59,642 62,658 5.1%
Grand Rapids Region
Grand Rapids Region
2014, Anderson Economic Group, LLC
TABLE 2. Business and Employment
Source: U.S. Census Bureau Center for Economic StudiesAnalysis: Anderson Economic Group, LLC
Jobs by Industry Sector 2005 2011 % Chg 2005 2011 %
Total Jobs 66,817 71,092 6.4% 131,215 125,130 Agriculture, Forestry, Fishing and Hunting 17 44 158.8% 258 150 -4 Mining, Quarrying, and Oil and Gas Extraction 21 34 61.9% 42 38 Utilities 277 251 -9.4% 278 253 Construction 1,174 930 -20.8% 3,587 2,516 -2 Manufacturing 10,751 8,316 -22.6% 22,293 15,664 -2 Wholesale Trade 1,508 1,712 13.5% 6,544 4,800 -2 Retail Trade 2,010 1,475 -26.6% 9,162 7,730 -1 Transportation and Warehousing 552 706 27.9% 1,300 1,469 1 Information 1,960 1,268 -35.3% 3,032 2,132 -2 Finance and Insurance 2,985 2,154 -27.8% 6,108 4,692 -2 Real Estate and Rental and Leasing 569 1,077 89.3% 1,227 1,752 4 Professional, Scientific, and Technical Services 4,311 4,830 12.0% 6,462 6,395 Management of Companies and Enterprises 430 53 -87.7% 600 186 -6 Administration & Support, Waste Management and Remediation 2,536 4,788 88.8% 4,857 11,747 14 Educational Services 8,169 6,954 -14.9% 14,652 11,588 -2 Health Care and Social Assistance 18,187 24,716 35.9% 30,655 35,396 1 Arts, Entertainment, and Recreation 394 670 70.1% 883 1,110 2 Accommodation and Food Services 3,995 4,225 5.8% 9,606 8,491 -1 Other Services (excluding Public Administration) 2,084 2,113 1.4% 4,613 4,056 -1 Public Administration 4,887 4,776 -2.3% 5,056 4,965
Inflow (+) and Outflow (-) 2005 2011 % Chg 2005 2011 %
Employed in the Selection Area 66,817 71,092 6.4% 131,215 125,130Living in the Selection Area 17,904 15,714 -12.2% 86,054 72,827 -1Net Job Inflow (+) or Outflow (-) 48,913 55,378 13.2% 45,161 52,303 1
Where Workers Live 2005 2011 % Chg 2005 2011 %
Kent County, MI 47,387 46,899 -1.0% 89,969 79,879Ottawa County, MI 6,391 8,899 39.2% 11,989 14,075Allegan County, MI 1,497 1,824 21.8% 2,916 3,309Muskegon County, MI 1,607 1,661 3.4% 3,026 3,102Montcalm County, MI 871 1,095 25.7% 1,980 2,049Newaygo County, MI 869 999 15.0% 1,779 1,785Ionia County, MI 884 975 10.3% 1,889 1,889Barry County, MI 939 944 0.5% 1,791 1,750Wayne County 618 787 27.3% 1,399 2,381All Other Counties 5,754 7,009 21.8% 14,477 14,911
Downtown Grand Rapids City of Grand Rapids
Downtown Grand Rapids City of Grand Rapids
Appendix B. Project Area Maps
Appendix B contains:
Map 1, “Overview of Project Area, North of 6th Street,” on page B-2.
Map 2, “Overview of the Project Area, South of 6th Street,” on page B-3.
Map 3, “Highest and Best Use Assessment,” on page B-4.
Map 4, “Overview of Downtown Colleges, Museums, and Event Centers,” on page B-5.
Anderson Economic Group, LLC B-1

MAP 1. Overview of Project Area, North of 6th Street
Source: Grand Rapids Whitewater Preliminary Plan
0́ 0.25 0.5Miles
Site for new parkAdjustable hydraulic structure
Bedrock shoals and wading pools
Rowing lanes
Anderson Economic Group, LLC B-2

MAP 2. Overview of the Project Area, South of 6th Street
Source: Grand River Whitewater Preliminary Plan
0́ 0.15 0.3Miles
Stair-step rapids andboat chute passage
Boulders, runs, riffles, and wading areas
Anderson Economic Group, LLC B-3

MAP 3. Highest and Best Use Assessment
Source: Kent County Property Information SystemAnalysis: Anderson Economic Group, LLC
KentCountry
Club
SaintMary's
Health Care
Gr a
n dR
iver
Fulton St W
Div
isio
n A
ve
S
Leonard St NW
Michigan St NE
Div
isio
n A
ve
NE
Co
lle
ge
Av
e N
E
Fulton St E
Leonard St NE
Pearl St NW
Bridge St NW
W Fulton St
Oakes St SW
Pla
infi
eld
Ave
NE
Wa lker Ave NW
Ann St NW
2nd St NW
Ann St NE
Sto
ckin
g A
ve N
W
Mark
et
Av
e S
W
Butterworth St SW
ND
ivis
ion
Av
e
Alp
ine
Av
e N
W
£¤131
Wealthy St SW
6th St NW
Will i ams St SW
Go
ld A
ve
SW
Sylvia St NW
Bartlett St SW
Mo
rris
Av
e S
E
5th St NW
Lyon St NW
10th St NW
Na
tio
na
l A
ve
SW
Sh
eld
on
Blv
d S
E
Page St NE
Webster St NW
Bo
stw
ick
Av
e N
E
Dale St NE
Cedar St NE
Pro
sp
ec
tA
ve
SE
Fairbanks St NE
Arianna St NW
Trowbridge St NE
9th St NW
Palmer St NE
Hovey St SW
Dayton St SW
Quimby St NE
1st St NW
Co
mm
erc
e A
ve
SW
Hastings St NE
Ma
rio
n A
ve
NW
Go
ld A
ve
NW
Win
ter
Av
e N
W
La
ne
Av
e N
W
No
rth
Av
e N
E
Str
aig
ht
Av
e S
W
Park St SW
Co
lle
ge
Av
e S
E
Myrtle St NW
Ta
ylo
r A
ve
N
Douglas St NW
Carrier St NE
Sweet St NE
7th St NW
Fountain St NE
Le
xin
gto
n A
ve
NW
California St NW
Veto St NW
Watson St SW
Ott
aw
a A
ve
NW
Mu
sk
eg
on
Av
eN
W
11th St NW
Cla
nc
y A
ve
NEDa
vis
Av
e N
W
Richmond St NW
Ta
ma
rac
k A
ve
NW
Se
wa
rd A
ve
NW
La
fay
ett
e A
ve
NE
Ce
nte
r A
ve
NE
Ma
dis
on
Av
e S
E
Bo
nd
Av
e N
W
Fa
irv
iew
Av
e N
E
Na
tio
na
l A
ve
NW
La
Gra
ve
Av
e S
E
Pro
sp
ec
t A
ve
NE
Ha
mil
ton
Av
eN
W
Qu
arr
yA
ve
NW
Tu
rne
r A
ve
NW
Fro
nt
Av
e N
W
Po
we
rs A
ve
NW
Sc
rib
ne
r A
ve
NW
Mo
nro
e A
ve
NW
MaryMaryWatersWaters
ParkPark
BelknapBelknapParkPark
CoitCoitParkPark
§̈¦196
§̈¦196
0 0.4 0.8Miles
Legend
Low Utilization
Moderate Utilization
High Utilization
´
Anderson Economic Group, LLC B-4

MAP 4. Overview of Downtown Colleges, Museums, and Event Centers
XW
XW
XW
XW
#
##
#
#
#
#
DavenportUniversity
Grand RapidsCommunityCollege
KendallCollege of Artand Design
Michigan StateUniversity Collegeof Human Medicine
WesternMichiganUniversity
Grand ValleyStateUniversity
85B
84A
85A
86B
86A
85B
85B
Gra
ndR
ive rC
SX
Tra
nspo
rtat
ion
Nor
fol k
Sou
t her
n
US
-13
1- B
R
E Fulton StFulton St W
Gerald R Ford Fwy
W Fulton St
£¤131
£¤131
6th St NW
Pearl St NW
State St SE
M aple St SE
Library St NE
Ott
aw
aA
ve
SW
Cherry St SE
3rd St NW
Newberry St NW
Weston St SE
Goodrich St SE
Oakes St SE
LouisS
t NW
Ba
rcla
y A
ve
NE
5th St NW
2nd St NWF
inn
ey
Av
e S
W
1st St NW
W illiams St SW
Je
ffe
rso
n A
ve
SE
4th St NW
Hastings St NE
Bartlett St SW
7th St NW
Cla
rem
on
t P
l N
E
Fro
nt
Av
e N
W
Mo
nroeC
enterSt
NW
Fairbanks St NE
Lyon St NW
Fountain St NE
Trowbridge St NE
He
ste
r P
l N
EB
os
twic
k A
ve
NE
Cherry St SW
Cla
nc
y A
ve
NE
Ion
ia A
ve
NW
Ott
aw
a A
ve
NW
La
Gra
ve
Av
eS
E
Co
mm
erc
e A
ve
SW
Bro
ad
wa
y A
ve
NW
Win
ter
Av
eN
W
S
cribne
rA
ve
NW
Se
wa
rd A
ve
NW
Su
mm
er
Av
e N
W
Gra
nd
vil
leA
ve
SW
Bo
nd
Av
e N
W
Liv
ing
sto
n A
ve
NE
Fa
irv
iew
Av
e N
E
Ion
ia A
ve
SW
Co
it A
ve
NE
Tu
rne
r A
ve
NW
Mo
nro
e A
ve
NW
Fro
nt
Av
e S
W
Mt
Ve
rno
n A
ve
NW
CoitCoitParkPark
Fulton St W
Michigan St NW Michigan St NE
Fulton St E
Bridge St NW
ND
ivis
ion
Av
e
Oakes St SW
Ma
rket
Ave
SW
Div
isio
nA
ve
S
US
-13
1 S
US
-13
1 N
§̈¦196
Gerald R. FordPresidentialLibrary and Museum
Grand RapidsPublic
Museum
Grand RapidsArt Museum
Grand RapidsChildren's Museum
DeVosPlace
DeVosPerformanceHall
Van AndelArena
FerrisStateUniversity
0 0.2 0.4Miles
Legend
# Downtown Schools
Event Centers
XW Museums
´
Anderson Economic Group, LLC B-5

Appendix C. Riverfront Parcels
This Appendix contains:
Table 1, “Inventory of Riverfront Parcels,” on page C-2.
Map 7, “Ann Street to Coldbrook Street,” on page C-6.
Map 8, “Coldbrook Street to Lyon Street,” on page C-7.
Map 9, “Lyon Street to Wealthy Street,” on page C-8.
Anderson Economic Group, LLC C-1

TABLE 1. Inventory of Riverfront Parcels
Parcel Number Address
Property
Class
Zoning
Designation Landmark Total Acreage Land Utilization
411313252001 304 ANN ST NW 201 TCC Parking lot 0.05 Mid411313252004 280 ANN ST NW 201 TCC For-rent office bldg 2.52 Mid411313252005 270 ANN ST NW 201 TCC Radisson Hotel 3.23 High
411313254001 1632 TURNER AVE NW 702 TCCKent County Road Commission building 0.94 Low
411313254002 1660 TURNER AVE NW 702 TCCKent County Road Commission building 0.86 Low
411313254003 1600 TURNER AVE NW 701 TCCKent County Road Commission building 3.89 Low
411313276001 150 ANN ST NW 201 TCCGrand Rapids Family Credit Union 0.65 Mid
411313276005 1615 MONROE AVE NW 201 TCC 1-story commercial building 0.99 Low411313276007 60 ANN ST NW 702 TCC City-owned open space 0.56 High411313276008 1661 MONROE AVE NW 301 TCC Baker Furniture 7.28 Low
411313403001 1500 SCRIBNER AVE NW 701 TCCKent County Road Commission building 8.62 Low
411313403008 1440 FRONT AVE NW 301 TCC Rose Technologies 0.78 Low411313403009 1420 FRONT AVE NW 701 TCC Transportation Depot 1.28 Low411313403010 1450 FRONT AVE NW 201 TCC Hooker Glass 0.77 Low411313403011 1400 FRONT AVE NW 201 TCC P&F Supply Co. 0.92 Low411313426002 1499 MONROE AVE NW 702 TCC City-owned open space 1.36 High411313427001 1535 MONROE AVE NW 701 TCC Creston VFW Hall 0.62 Mid411313427001 1535 MONROE AVE NW 701 TCC Creston VFW Hall 0.05 Mid411313427001 1535 MONROE AVE NW 701 TCC Creston VFW Hall 0.17 Mid
411313455001 1348 FRONT AVE NW 201 TCC
Property Management/Office Furniture 0.62 Mid
411313455005 1310 FRONT AVE NW 201 TCC Silas Distributors 0.70 Mid411313455007 1262 FRONT AVE NW 302 TCC Electricity Tower 0.08 High411313455009 1240 FRONT AVE NW 701 TCC MDOT Facility 1.49 Low
411313455011 265 LEONARD ST NW 201 TCC Sullivan Dental Products 1.05 Low411313455012 1340 FRONT AVE NW 201 TCC Warmington Industries 0.54 Low
411313455014 281 LEONARD ST NW 201 TCCGrand Rapids Building Services 1.08 Low
411313455015 1300 FRONT AVE NW 201 TCCMotown Automotive Distributing 1.01 Low
411313455016 1250 FRONT AVE NW 201 TCC Kimbow, Inc. 1.06 Low411313455017 1336 FRONT AVE NW 201 TCC Warmington Industries 0.98 Low
411313455018 1320 FRONT AVE NW 201 TCCFor-sale commercial building 0.19 Low
411313476001 1501 MONROE AVE NW 701 TCC City-owned road supply 2.63 Low411313476002 1401 MONROE AVE NW 702 TCC City-owned road supply 1.58 Low411313476003 1375 MONROE AVE NW 301 TCC City water 0.67 Low411313476006 1305 MONROE AVE NW 201 TCC T&S Concepts 0.69 Low411313476007 1247 MONROE AVE NW 201 TCC Tillmans Restaurant 0.95 Mid
411313476008 1225 MONROE AVE NW 301 TCC Open space; access road 0.32 High411313476009 1223 MONROE AVE NW 301 TCC Electricity Grid 0.55 High
411313476010 1221 MONROE AVE NW 201 TCC Train Out Pain Chiropractic 0.34 Low411313476013 1201 MONROE AVE NW 201 TCC Family Dollar 0.73 Low411313476014 1345 MONROE AVE NW 201 TCC Cooper's Landing 3.57 Mid411313502011 1529 MONROE AVE NW 702 TCC DNR-owned land 9.49 High411324202002 260 LEONARD ST NW 201 TCC Micro Visions 0.59 Low411324202007 954 FRONT AVE NW 201 TCC Young Supply Co. 1.03 Low411324202018 936 FRONT AVE NW 201 TCC Ryder Transportation 3.01 Low
411324202020 1116 FRONT AVE NW 201 TCC
Creston Industrial Sales and Trane Heating & Cooling 3.23 Low
411324202021 282 LEONARD ST NW 201 TCC Recovery Academy 0.31 Low411324202022 1060 FRONT AVE NW 201 TCC SF Supply warehouse 0.96 Low
411324202023 1054 FRONT AVE NW 201 TCC Verhey Motor Coach Co. 0.61 Low
411324202024 1010 FRONT AVE NW 201 TCCGreat Lakes EMS Academy 1.19 Mid
411324202025 974 FRONT AVE NW 201 TCCGrand River Interiors and BETA Design 2.28 Low
Anderson Economic Group, LLC C-2

TABLE CONTINUED.
Parcel Number Address
Property
Class
Zoning
Designation Landmark Total Acreage Land Utilization
411324202026 750 FRONT AVE NW 201 TCC Riverwalk and EPS Inc. 2.02 Mid411324202027 748 FRONT AVE NW 701 TCC City-owned open space 0.10 High
411324202029 830 FRONT AVE NW 301 TCC Wolverine Coil Spring Co. 2.44 Low411324226003 1101 MONROE AVE NW 701 TCC City Water 3.61 Low411324226004 1055 MONROE AVE NW 701 TCC City-owned power 0.38 High411324226005 1051 MONROE AVE NW 701 TCC City-owned parking lot 0.07 Low
411324226006 1045 MONROE AVE NW 702 TCC City-owned park buildings 0.28 Mid
411324226007 1179 MONROE AVE NW 701 TCCMonroe Avenue Fire Station 0.49 Low
411324226008 1165 MONROE AVE NW 701 TCC City Water 0.92 Low411324230006 100 COLDBROOK ST NW 301 TCC Parking lot 1.78 Low411324230007 1021 OTTAWA AVE NW 301 TCC Warehouse 0.64 Low411324230010 1009 OTTAWA AVE NW 301 TCC Bend Tooling 0.63 Low411324276003 1001 MONROE AVE NW 201 City Water 0.52 Low411324276012 905 MONROE AVE NW 702 SD-OS Canal Street Park 4.41 High411324277010 901 OTTAWA AVE NW 201 CC Parking lot 1.97 Low411324277015 1012 MONROE AVE NW 201 TCC Parking lot 0.91 Low411324277016 910 MONROE AVE NW 202 CC Open space 0.09 High411324404006 600 FRONT AVE NW 701 SD-OS City-owned parking lot 0.10 High411324404014 280 SIXTH ST NW 702 SD-OS City-owned open space 0.30 High
411324404017 678 FRONT AVE NW 201 TCC
MI Virtual Charter Academy, Aflac, K Group offices 2.12 Low
411324404018 634 FRONT AVE NW 201 TCC Plante Moran 1.17 Mid411324404019 624 FRONT AVE NW 701 SD-OS Electricity Tower 2.23 High411324426005 851 MONROE AVE NW 202 CC Parking lot 0.54 Low411324431009 601 MONROE AVE NW 701 CC Parking lot 0.87 Low411324431011 555 MONROE AVE NW 701 CC Parking lot 0.93 Low411324431012 533 MONROE AVE NW 701 CC Parking lot 0.59 Low
411324431013 525 MONROE AVE NW 702 CC County-owned open land 0.62 Mid
411324431014 519 MONROE AVE NW 701 CC County-owned open land 0.39 Mid
411324431015 511 MONROE AVE NW 701 CC County-owned open land 0.28 Mid411324431017 623 MONROE AVE NW 301 CC Electricity Grid 0.49 High411324431018 745 MONROE AVE NW 201 CC Parking lot 0.39 Low411324431019 647 MONROE AVE NW 701 SD-OS 6th Street Bridge Park 4.24 High411324432001 748 MONROE AVE NW 201 CC Future Embassy Suites 0.23 Low411324432002 720 MONROE AVE NW 201 CC Future Embassy Suites 0.57 Low411324432003 710 MONROE AVE NW 201 CC Future Embassy Suites 0.11 Low411324432014 701 BOND AVE NW 301 CC Parking lot 1.16 Low411324451015 333 BRIDGE ST NW 201 CC Bridgewater Place 3.31 High411324452018 271 BRIDGE ST NW 702 SD-OS City-owned open space 0.72 High411324476001 544 MONROE AVE NW 701 CC Parking lot 1.01 Low
411324476002 520 MONROE AVE NW 701 CC County-owned parking lot 0.62 Low411324476003 516 MONROE AVE NW 201 CC Quality Auto 0.25 Mid411324476004 510 MONROE AVE NW 701 CC Parking lot 0.09 Low411324480001 225 MICHIGAN ST NW 701 CC Post Office 4.43 Mid411324480002 201 MICHIGAN ST NW 201 CC 7-8 story brick building 0.50 Mid411324502007 1035 MONROE AVE NW 702 TCC Power lines 1.20 High
411325201010 303 PEARL ST NW 701 CCGerald R. Ford Presidential Museum 8.59 High
411325205010 220 FRONT AVE NW 701 SD-OS Ah-Nab-Awen Park 6.78 High411325207020 333 MONROE AVE #1 NW 701 CC DeVos Place 1.99 High411325207023 303 MONROE AVE NW 701 CC DeVos Place 2.91 High
411325207024 245 MONROE AVE NW 701 CC DeVos Performance Hall 6.78 High411325226004 201 MONROE AVE NW 201 CC Reserve Wine & Food 0.09 High411325251011 310 PEARL ST NW 201 CC Holiday Inn 3.55 High
411325253004 305 FULTON ST W 701 CCGrand Valley State University building 4.79 High
411325254004 60 FRONT AVE NW 701 CC GVSU-owned open space 0.46 High
411325254005 272 PEARL ST NW 701 CCGrand Rapids Public Museum 2.57 High
Anderson Economic Group, LLC C-3

TABLE CONTINUED.
Parcel Number Address
Property
Class
Zoning
Designation Landmark Total Acreage Land Utilization
411325256001 220 LYON ST NW 201 CC Grand Plaza building 0.63 High
411325257012 251 LOUIS CAMPAU PROM NW 702 CC DDA-owned open space 0.04 High411325257014 235 LOUIS ST NW 201 CC JW Marriott 1.51 High411325258012 85 CAMPAU AVE NW 201 CC Riverfront Plaza offices 0.60 High411325260012 50 CAMPAU AVE NW 701 CC City-owned 0.03 High
411325260013 289 FULTON ST W 701 CCCity-owned open space; walking path 0.06 High
411325260014 291 FULTON ST W 701 CCCity-owned open space; walking path 0.06 High
411325280021 218 PEARL ST NW 201 CC Amway parking structure 0.79 Mid
411325284008 43 MONROE AVE NW 701 CCCity-owned parking structure 0.63 Mid
411325284010 99 MONROE AVE NW 201 CC Comerica Bank 1.08 High411325330001 346 FULTON ST W 702 TCC Gas station 0.27 Mid411325330008 29 FRONT AVE SW 201 TCC Billboard 0.05 Mid411325330009 50 FRONT AVE NW 701 TCC GVSU-owned parking 6.43 High411325333004 417 WATSON ST SW 701 CC GVSU-owned parking 0.69 Low411325334011 210 FRONT AVE SW 201 TCC Feyen Zylstra 0.65 Low
411325334014 140 FRONT AVE SW 201 TCCGrand River Aseptic Manufacturing 2.09 Mid
411325378004 312 FRONT AVE SW 201 TCC Airgas Dry Ice 0.47 Low411325378005 322 FRONT AVE SW 201 TCC Exodus Place 1.48 Mid
411325378006 240 FRONT AVE SW 201 TCCCommercial, multiple occupants 1.01 Low
411325378008 300 FRONT AVE SW 201 TCC For sale/vacant property 0.86 Low411325379007 353 MARKET AVE SW 701 CC City-owned parking lot 0.07 Low
411325379009 301 MARKET AVE SW 701 CCCity-owned warehouses; Punk Island 16.35 Low
411325382006 509 WEALTHY ST SW 701 CCGrand Rapids Traffic Signals 4.30 Mid
411325401001 216 FULTON ST W 201 CC Amway-owned parking 0.17 Low411325401006 45 MARKET AVE SW 201 CC Amway-owned parking 0.14 Low411325401011 3 MARKET AVE SW 201 CC Amway-owned parking 0.24 Low411325401012 17 MARKET AVE SW 201 CC Amway-owned parking 0.10 Low411325401013 21 MARKET AVE SW 201 CC Amway-owned parking 1.78 Low411325401014 37 MARKET AVE SW 201 CC Amway-owned parking 0.49 Low411325401015 41 MARKET AVE SW 201 CC Amway-owned parking 0.37 Low411325401016 47 MARKET AVE SW 201 CC Amway-owned parking 0.51 Low411325401017 53 MARKET AVE SW 201 CC Amway-owned parking 0.90 Low411325401019 63 MARKET AVE SW 201 CC Charley's Crab 1.91 Mid
411325451001 201 MARKET AVE SW 701 CCCity of Grand Rapids Building Authority 1.72 Low
411325451002 225 MARKET AVE SW 701 CC City-owned parking lot 0.17 Low411325455005 233 MARKET AVE SW 701 CC City building 0.68 Low411325501007 242 FRONT AVE SW 301 TCC Railroad 0.67 High411325501014 355 MARKET AVE SW 701 CC Railroad 0.32 High411325501015 357 MARKET AVE SW 701 CC Railroad 0.04 High411325503008 58 FRONT AVE NW 701 CC DDA-owned, street 0.15 High411324284001-411324284004 975 OTTAWA AVE NW 201 CC
For-rent commercial building 1.06 Mid
411324285001-411324285283 940 MONROE AVE NW 201, 401 CC
Commercial on ground, residential units above 2.88 High
411324439001-411324439012 648 MONROE AVE NW 201 CC Brass Works Building 1.03 Mid411324440029-411324440068 600 MONROE AVE NW 201 CC
CSM Group, residential units above 0.50 High
411324441001-411324441027 801 MONROE AVE NW 201, 401 CC
Commercial and residential brick building 0.23 High
411324453001-411324453210 335 BRIDGE ST NW 401 CC Riverhouse Condos 0.51 High411325259016-411325259027 55 CAMPAU AVE NW 201 CC Riverfront Plaza building 0.69 High
Anderson Economic Group, LLC C-4

TABLE CONTINUED.
Source: Kent County; City of Grand Rapids; Google Maps; Anderson Economic Group, LLC
Note: Property classes are defined as follows:
• 201: Commercial Improved
• 202: Commercial Vacant
• 301: Industrial Improved
• 302: Industrial Vacant
• 401: Residential Improved
• 701: Exempt Improved
• 702: Exempt Vacant
Zoning designations are defined as follows:
• CC: City Center
• OS: Open Space
• SD: Special District
• TCC: Transitional City Center
Parcel Number Address
Property
Class
Zoning
Designation Landmark Total Acreage Land Utilization
411325262001-411325262022
252 PEARL ST NW (includes250 PEARL ST NW) 201 CC Forslund Condos 0.37 High
411325263008-411325263012
FULTON ST W (includes11 MONROE AVE NW) 201 CC
Commerical uses and parking toward river 3.31 Mid
411325264001-411325264153
CAMPAU CIR NW (includes10-158 CAMPAU CIR NW) 401 CC JW Marriott and condos 0.55 High
411325265001-411325265002 75 CAMPAU AVE NW 201 CC JW Marriott parking 0.63 High411325276022-411325276039
PEARL ST NW (includes225-259 PEARL ST) 201 CC Amway Hotel 2.13 High
411325284011-411325284015 168 LOUIS CAMPAU PROM NW 201 CC
Z's Bar and Restaurant; party store 0.09 Mid
411325297001-411325297003
MONROE AVE NW (includes161-169 MONROE AVE NW) 201 CC Mlive, Founders Bank 0.31 High
411325298001-411325298002 171 MONROE AVE NW 201 CC PNC Bank 0.46 High
Anderson Economic Group, LLC C-5

Map 7. Ann Street to Coldbrook Street
2423000624230007
24230010
24277015
13427001
13427001
13403011
13403009
13403010
13403008
13426002
13455018
13455011
13455001
13476007
13455014
13476014
13455007
13455016
13455017
13455009
13476002
13476006
13476009
13476013
13455015
13455005
13476003
13427001
13502011
13502011
13502011
13403001
13476001
13455012
13476008
13476010
13276005
13254001
13252001
13252004
13252005 13276007
13254002
13276001
13276008
13254003
24502007
24202023
24226004
24202018
2422600724202002
24202020
24202025
24276012
24202024
24226005
24226008
24202022 24226003
24202007
24226006
24202021
24276003
´0 0.15 0.3
Miles
Legend
Parcel Boundaries
Anderson Economic Group, LLC C-6

Map 8. Coldbrook Street to Lyon Street
975OttawaAve NW
940MonroeAve NW
648MonroeAve NW
600MonroeAve NW
24277010
24230006
24230007
24277016
24230010
24277015
24432001
24432002
24432014
24432003
24476002
2447600424476003
24476001
24202027
25226004
25207023
24502007
25205010
25207020
25207024
25201010
24226004
24202018
24202025
24276012
24202024
24226005
24202026
25256001
24226003
24202007
24431014
24202029
24431019
24426005
24226006
24404019
24404019
24276003
24431012
24431015
24431017
24404006
24404014
24431009
24431011
24431013
24404018
24404017
24452018
24431018
2445101524480001
24480002
´0 0.15 0.3
Miles
Legend
Parcel Boundaries
Anderson Economic Group, LLC C-7

Map 9. Lyon Street to Wealthy Street
Source: Kent County; Esri, Inc.Analysis: Anderson Economic Group
171 MonroeAve NW
MonroeAve NW
25284010
25284008
25280021
25251011
25260012
25226004
25207023
25205010
25260014
25207024
25254004
25257014
2526001325253004
25257012
25258012
25201010
25334014
25330009
2533000125330008
25334011
25254005
25401015
25256001
25401006
2540101125333004
25378008
25401014
25378006
25401019
25378005
25379009
25379009
25378004
25451002
25379007
25401016
25382006
2540101225401013
25455005
25401017
25451001
25503008
25501007
2550101425501015
252 PearlSt NW
CampauCir NW
Fulton St
PearlSt NW
75 CampauAve NW
55 CampauAve NW
´0 0.15 0.3
Miles
Legend
Parcel Boundaries
Anderson Economic Group, LLC C-8

Appendix D. Economic Impact Calculations
NET ECONOMIC IMPACT DEFINED
We define “net economic impact” as the new economic activity directly or indi-rectly caused by a project, investment, change in policy, or other such event. To quantify the economic impact of a project like the proposed Grand Rapids Whitewater project, we focus on economic activities that are likely to be real-ized as a direct result of the project being completed, while accounting for eco-nomic activities that might be displaced by the project or that would have occurred even if not for the project. Such displacement and substitution is not included as part of a net new economic impact estimate.
DETERMINATION OF NET NEW EXPENDITURES
Economic impacts stem from direct new spending that can be attributed to a project. In this project we focus specifically on expenditures that are likely to be made by new visitors who come to Grand Rapids because of new recreational and related uses of the river that are possible because of the restoration. To esti-mate the level of these expenditures, we relied on economic impact studies from other river restoration and whitewater park projects, as well as national outdoor recreation and participation surveys. This guided our estimation of users and visitors in four categories: whitewater users, other boating users, fishing users, and shore-based recreation users. We further used the economic impact studies and knowledge of the area to estimate the percent of users who would come spe-cifically for the river or parks, thus excluding residents and visitors who would come to the city even if the restoration did not take place.
We next estimated the expected spending for each user group, again relying on information in previously completed studies and national outdoor recreation surveys, as well as our own experience and knowledge of the market. When we multiplied the net new visitors for each group by the expected expenditures for each user group, we arrived at a figure for total new expenditures.
See Table 1 on page D-2 and Table 2 on page D-4 for further details.
ESTIMATING INDIRECT IMPACTS
After calculating expected net-new spending (the direct economic impact) we then estimate the level of indirect economic activity that is stimulated by the direct activity. For example, a visitors make purchases and spend money in res-taurants and hotels, the money circulates throughout the Grand Rapids econ-omy, creating a multiplier effect, generating more economic activity across the area. To estimate indirect activity produced by these expenditures, we use the U.S. Bureau of Economic Analysis RIMS II Final Demand Multipliers for Out-put, Earnings, and Employment. The multipliers used reflect Kent and Ottawa county level data, adjusted to provide estimates for the City of Grand Rapids.
See Table 3 on page D-5 for the results from our economic impact analysis.
Anderson Economic Group, LLC D-1

TABLE 1. Net New Visitorship Estimates
Whitewater Uses and Net New "Visitorship" EstimatesConservative
Scenario Potential Scenario
Expected annual whitewater usage 8,500 10,000
Share of usage from out-of-region 90% Out-of-region usage substitution 20%
Subtotal: Net new usage from out-of-region 6,120 7,200
Share of usage from in-region 10% In-region usage substitution 50%
Subtotal: Net new usage from out-of-region 425 500
Average duration of use (days) 2.00
Total: Net New Visitor Days 13,090 15,400
Non-Whitewater Boating Uses and Net New "Visitorship" EstimatesConservative
Scenario Potential Scenario
Expected annual boating usage 34,000 40,000
Share of usage from out-of-region 75% Out-of-region usage substitution 25%
Subtotal: Net new usage from out-of-region 19,125 22,500
Share of usage from in-region 25% In-region usage substitution 75%
Subtotal: Net new usage from out-of-region 2,125 2,500
Average duration of use (days) 2.00
Total: Net New Visitor Days 42,500 50,000
Anderson Economic Group, LLC D-2

TABLE CONTINUED.
Source: Anderson Economic Group, LLC
Fishing Uses and Net New "Visitorship" EstimatesConservative
Scenario Potential Scenario
Expected annual fishing usage 57,500 69,000
Share of usage from out-of-region 75% Out-of-region usage substitution 50%
Subtotal: Net new usage from out-of-region 21,563 25,875
Share of usage from in-region 25% In-region usage substitution 95%
Subtotal: Net new usage from out-of-region 719 863
Average duration of use (days) 3.00
Total: Net New Visitor Days 66,844 80,213
Shore-based Uses and Net New "Visitorship" EstimatesConservative
Scenario Potential Scenario
Expected annual shore-based usage 100,000 357,000
Share of usage from out-of-region 75% Out-of-region usage substitution 35%
Subtotal: Net new usage from out-of-region 48,750 174,038
Share of usage from in-region 25% In-region usage substitution 75%
Subtotal: Net new usage from out-of-region 6,250 22,313
Average duration of use (days) 2.00
Total: Net New Visitor Days 110,000 392,700
V. GRAND TOTAL NET NEW VISITOR DAYS 232,434 538,313
Anderson Economic Group, LLC D-3

TABLE 2. Net New Spending Estimates
Source: Anderson Economic Group, LLC
Whitewater-boating User Expenditure EstimatesConservative
ScenarioPotential Scenario
Net new whitewater visitor days 13,090 15,400
Net new daily expenditure per user 100.00$
Net new whitewater spending estimate 1,309,000$ 1,540,000$
Non-whitewater Boating User Expenditure Estimates
Net new non-whitewater boating visitor days 42,500 50,000
Net new daily expenditure per user 75.00$
Net new non-whitewater boater spending estimate 3,187,500$ 3,750,000$
Fishing User Expenditure Estimates
Net new fishing visitor days 66,844 80,213
Net new daily expenditure per user 125.00$
Net new fishing spending estimate 8,355,469$ 10,026,563$
Shore-based User Expenditure Estimates
Net new shore-based recreation visitor days 6,250 22,313
Net new daily expenditures per user 10.00$
Net new other recreation spending estimate 62,500$ 223,125$
GRAND TOTAL NET NEW EXPENDITURES 12,914,469$ 15,539,688$
Anderson Economic Group, LLC D-4

TABLE 3. Total Recreational Direct Economic Impact
Note: Multipliers are based on RIMS II multipliers for Kent and Ottawa counties, and have been adjusted by AEG to account for only the city of Grand Rapids. The adjustment is based on the ratio of the number of jobs in Grand Rapids to the number of jobs in the two-county area, and the density of jobs in Grand Rapids relative to the two-county area.
Source: Anderson Economic Group, LLC
Economic Impact CalculationConservative
ScenarioPotential Scenario
Output Multiplier 1.23Net New Economic Activity from River-User Spending 15,858,967.63$ 19,082,736.25$
Earnings Multiplier 0.15Net New Earnings to Households from River-User Spending 1,937,170.31$ 2,330,953.13$
Employment Multiplier 6.16Net New Employment from River-User Spending 80 96
Anderson Economic Group, LLC D-5

Appendix E. List of Resource Documents
“America’s Sporting Heritage: Fueling the American Economy,” Congressional Sportsmen’s Foundation, 2012.
“A Framework to Guide Future Planning and Investment,” Progressive Urban Management Associates, 2011.
Braak, Willem, “2011 Economic Impact of Kelly’s Whitewater Park in Cascade, Idaho: An Overview of the Park’s Second Year in Operation,” University of Idaho, 2012.
California State Parks, “The Health and Social Benefits of Recreation,” Califor-nia State Parks Planning Division, 2005.
Clark, Mike and Kevin Colburn, “Recreation and Economics,” Presentation at River Rally, 2005.
Daniels, Michael and Frank Lazzara, “Chattahoochee River Restoration: Columbus, Georgia and Phenix City, Alabama Market and Economic Impact Analysis,” June 3, 2005.
“Grand River Whitewater Park Preferred Alternative,” Green Grand Rapids, 2009.
Hagenstad, Marca et al, “Preliminary Evaluation of the Beneficial Value of Waters Diverted in the Clear Creek Whitewater Park in the City of Golden,” Stratus Consulting, 2000.
Hanshue, Scott and Amy Harrington, “Special Report: Draft Grand River Assessment,” Michigan Department of Natural Resources Fisheries Division, 2011.
IAFWA-ASA Data Mining Project: Initial Michigan Findings, Southwick Asso-ciates, 2011.Loomis, John and Jim McTernan, “Fort Collins Whitewater Park Economic Assessment,” Colorado State University, 2011.
Kelch, Dave et al, “The Value of Steelhead (Onochorhynchus mykiss) Angling in Lake Erie Tributaries,” Ohio State University, 2006.
Lockwood, Roger, “Sportfishing Angler Surveys on Michigan Inland Waters, 1993-99,” State of Michigan Department of Natural Resources, 2000.
O’Keefe, Damiel and Steven Miller, “2009 Michigan Charter Fishing Study,” Michigan State University, 2011.
Anderson Economic Group, LLC E-1

Outdoor Participation Report, The Outdoor Foundation, 2012
Outdoor Recreation Economy report, 2012, Outdoor Industry Association
Podolak, Kristen, “Cooling Off in Engineered River Parks: Park Use, Users’ Perceptions, and Multipurpose Design Considerations,” University of Califor-nia-Berkeley, 2011.
Responsive Management, The Economic Impact of Mountain Trout Fishing in North Carolina, 2009, <http://www.responsivemanagement.com/news_from/2009-09-09.htm>, accessed December 12, 2013.
Southwick Associates, October 10, 2011, “The Economics Associated with Outdoor Recreation, Natural Resources Conservation and Historic Preservation in the United States,” The National Fish and Wildlife Foundation.
Special Report on Paddlesports, Outdoor Industry Association and The Outdoor Foundation, 2009.
Stratus Consulting, January 30, 2002, “The Beneficial Value of Waters Diverted in the Blue River for the Breckenridge Whitewater Park and in Gore Creek for the Vail Whitewater Park.”
“Truckee River Recreation Plan,” Resource Concepts, 2004.
Anderson Economic Group, LLC E-2

Anderson Economic Group, LLC F-1
Appendix F. About AEG
Anderson Economic Group, LLC was founded in 1996 and today has offices in East Lansing, Michigan and Chicago, Illinois. AEG is a research and consulting firm that specializes in economics, public policy, financial valuation, and mar-ket research. AEG’s past clients include:
• Governments such as the states of Michigan, North Carolina, and Wisconsin; the cities of Detroit, Cincinnati, Norfolk, and Fort Wayne; counties such as Oak-land County, Michigan, and Collier County, Florida; and authorities such as the Detroit-Wayne County Port Authority.
• Corporations such as GM, Ford, Delphi, Honda, Taubman Centers, The Detroit Lions, PG&E Generating; SBC, Gambrinus, Labatt USA, and InBev USA; Spartan Stores, Nestle, automobile dealers and dealership groups representing Toyota, Honda, Chrysler, Mercedes-Benz, and other brands.
• Nonprofit organizations such as Michigan State University, Wayne State Uni-versity, University of Michigan, Van Andel Institute, the Michigan Manufactur-ers Association, United Ways of Michigan, Service Employees International Union, Automation Alley, the Michigan Chamber of Commerce, and Detroit Renaissance.
Please visit www.AndersonEconomicGroup.com for more information.