Embed Size (px)
Citation preview

Economic Analysis of Protectionist US Trade Policy on Chinese Solar Exports
Prepared by: Prepared for:
Matt Fondacaro
James Harter
Dan Matam
Sabahudin Redzepovic
Amay Sheth
Elaine Tang
Dr. George Tolley
Dr. Stephen Berry
Jing Wu
Jaeyoon Lee
Autumn 2014 – Group 15

2
Acknowledgements
We would like to thank the following people:
Dr. George Tolley, University of Chicago
Dr. R. Stephen Berry, University of Chicago
Jing Wu, University of Chicago
Jaeyoon Lee, University of Chicago

3
Table of Contents
Acknowledgments…………………………………………………………………..…… 2 Abstract…………………………………………………………………………………... 4 Timeline…….……………………………………………………………………………. 6 Part I – Pertinent Information and Analysis of Global Solar Industry and Trade Tensions
Chinese Solar Industry – Rise of Chinese Producers…………………………….. 7 Energy policy that convinced Suntech to begin manufacturing in the United States……………………………………………………………... 9
US Solar Industry……………………………………………………………….. 13 US Manufacturers………………………………………………………. 16
European Solar Industry………………………………………………………... 20 History of Solar in Europe………………………………………………20 Market Development…………………………………………………… 21 Current Market and Forecast…………………………………………… 24 Tariffs in Europe………………………………………………………... 27
US Trade Tariffs…….…………………………………………………………. 30 Chinese Counter-Trade Tariffs…………………………………………………. 38
Part II – Cost-Benefit Analysis
Data Analysis……………………………………………………………….. 40 Cost-Benefit Analysis – an Overview………………………………. 40 Tariffs……………………………………………………………….. 50 Final Notes………………………………………………………….. 53 Quantifying the Social Cost of Carbon Emission…………………... 55
Countervailing Subsidies (CVD) & Anti-Dumping Duties (AD) Impact on Domestic Employment……………………………………………………… 58
Domestic Manufacturing…………………………………………… 58 Overall Domestic Solar Employment Is Not Dependent on Manufacturing………………………………………………………. 61 Demand for Solar Products is Correlated with Employment……….. 65 Analysis of Effects on Employment……………………………...… 71
Aggregate Cost-Benefit Analysis…………………………………………... 72 Part III – Conclusion: Policy Recommendation
Repeal CVD and AD Duties on Chinese Solar Imports………………………... 74 Appendix………………………………………………………………………………... 75 Works Cited…………………………………………………………………………….. 86

4
Abstract Over the past few years, solar trade between the United States, Europe and China has
exploded into a highly contentious international trade and geopolitical issue. In 2012, the
United States Department of Commerce (DOC) imposed anti-dumping and
countervailing duties on solar cells and modules exported from China, and, in 2013, the
European Union followed suit with its own investigation into Chinese solar exports. In
retaliation, China imposed tariffs on polysilicon exports from the United States. In June
2014, the DOC and ITC released a preliminary finding that Chinese producers were
partially circumventing the 2012 tariffs by sourcing solar cells from Taiwan.
The issue of US-China solar trade policy is extremely timely and important as the United
States and China work together to confront the global climate change crisis. In his 2011
State of the Union Address, President Obama called for 80% of US energy to be derived
from clean energy sources by 2035. In November of 2014, President Obama and
President Xi reached a climate accord to reduce greenhouse gas emissions from both
nations. Solar energy could play a central role in reaching these goals if its price can
reach “grid parity,” meaning the energy source becomes cost competitive with traditional
fossil fuels without government incentives. The solar trade conflict between the United
States and China has slowed solar drive to grid parity
Proponents of countervailing and anti-dumping duties against Chinese solar exports
argued that illegal government subsidies enabled Chinese solar firms to expand rapidly
and gain market share through predatory tactics to drive competitors out of business.
5
They argued the tariffs were necessary to prevent further losses in domestic US solar
manufacturing jobs. The purpose of this paper is to determine whether the US policy has
had a net positive or net negative economic impact since the tariffs were implemented in
2012. The paper explains relevant background information on the topic, summarizes the
results of a cost-benefit analysis of the policy since 2012, and provides a forward looking
policy recommendation.
6
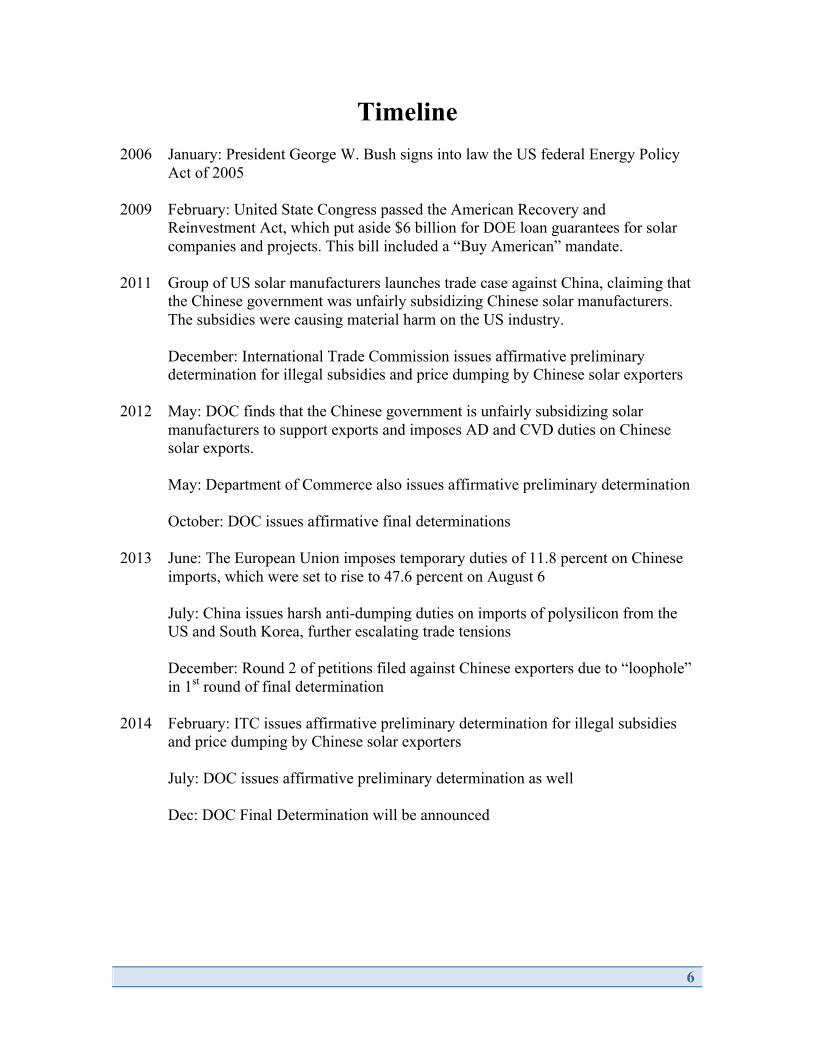
Timeline 2006 January: President George W. Bush signs into law the US federal Energy Policy
Act of 2005 2009 February: United State Congress passed the American Recovery and
Reinvestment Act, which put aside $6 billion for DOE loan guarantees for solar companies and projects. This bill included a “Buy American” mandate.
2011 Group of US solar manufacturers launches trade case against China, claiming that
the Chinese government was unfairly subsidizing Chinese solar manufacturers. The subsidies were causing material harm on the US industry.
December: International Trade Commission issues affirmative preliminary determination for illegal subsidies and price dumping by Chinese solar exporters
2012 May: DOC finds that the Chinese government is unfairly subsidizing solar
manufacturers to support exports and imposes AD and CVD duties on Chinese solar exports.
May: Department of Commerce also issues affirmative preliminary determination
October: DOC issues affirmative final determinations 2013 June: The European Union imposes temporary duties of 11.8 percent on Chinese
imports, which were set to rise to 47.6 percent on August 6
July: China issues harsh anti-dumping duties on imports of polysilicon from the US and South Korea, further escalating trade tensions December: Round 2 of petitions filed against Chinese exporters due to “loophole” in 1st round of final determination
2014 February: ITC issues affirmative preliminary determination for illegal subsidies
and price dumping by Chinese solar exporters July: DOC issues affirmative preliminary determination as well Dec: DOC Final Determination will be announced
7
Chinese Solar Industry – Rise of Chinese Producers
Suntech, a solar energy company founded in 2001, opened the door for China’s solar
revolution. The firm opened its first factory in 2002. Suntech made many breakthroughs
in terms of creating efficient crystalline-silicon solar panels, while simultaneously
discovering ways to cut costs. The success of these breakthroughs is predominantly due
to their aggressive cost-cutting, which has set an example for other Chinese producers
and has made China the largest source of solar panels across the globe.
Chinese manufacturers cut costs by relying heavily on various energy policies put into
place. For example, Suntech’s decision to expand production in the United States,
Arizona particularly, was almost entirely due to recently introduced solar energy policy.
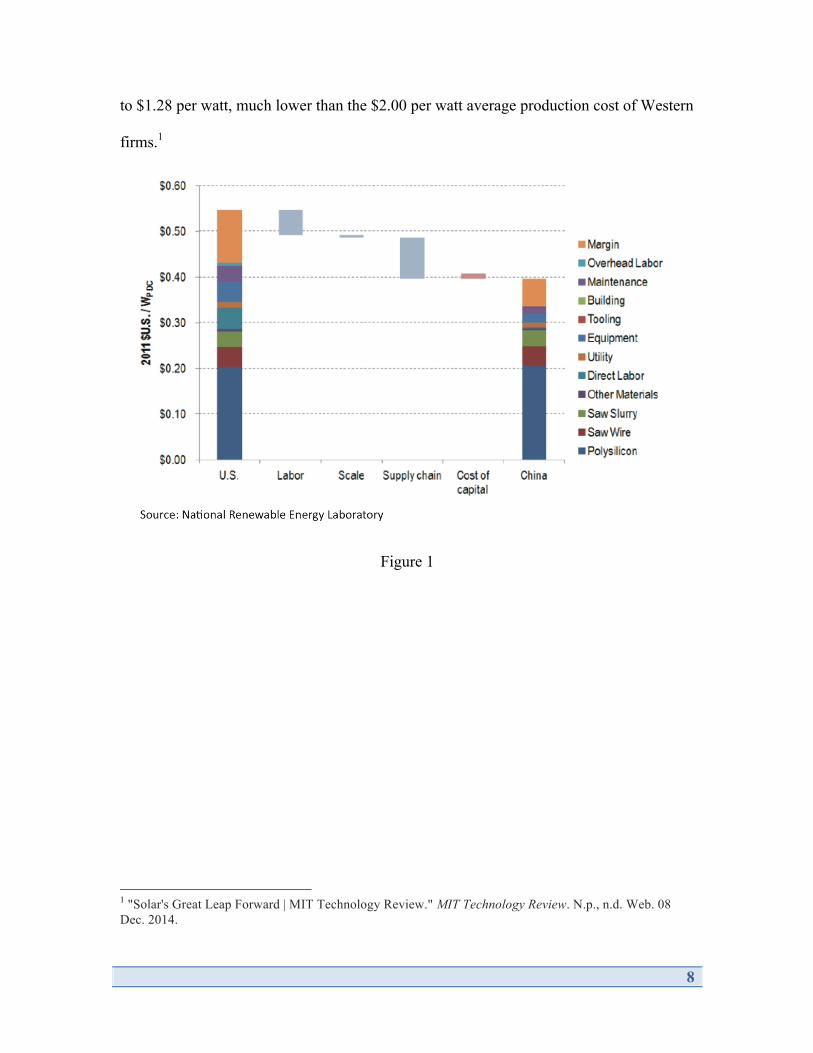
One of Suntech’s major reservations about expanding production to the U.S. was that
there was not enough of a supply network. Lack of a dense supply network would cause
Suntech to lose its price advantage. Suntech established its pricing advantage because
China had developed a very close network of suppliers, which were in close proximity to
the production facilities. As you can see in Figure 1, this agglomeration allowed Suntech
to minimize its production costs.
In 2004, silicon solar panels production cost about $3.20 per watt, on average to produce
silicon solar panels. By 2010, a Chinese manufacturer’s cost of production had declined
8
to $1.28 per watt, much lower than the $2.00 per watt average production cost of Western
firms.1
Figure 1
1 "Solar's Great Leap Forward | MIT Technology Review." MIT Technology Review. N.p., n.d. Web. 08 Dec. 2014.

9
Energy policy that convinced Suntech to begin manufacturing in the
United States
Arizona established policies to promote the use of renewable energy. In 1996, the
Arizona Corporate Commission (ACC) aimed to have a mere .2% of the state’s regulated
utility power be generated by solar energy. In 2001, the ACC created an Environmental
Portfolio Standard (EPS), which required that by 2007 1.1% of the state-regulated
utilities energy must be produced via renewable energy. In addition to this, of this 1.1%,
60% of it must come from solar power. The ACC claimed this policy would bring
economic improvements to Arizona and would also create positive environmental
impacts.
In 2006, the ACC decided to approve a new Renewable Energy Standard and Tariff
(REST). This policy mandated that 15% of the energy that regulated utilities generated
had to come from renewable resources by the year 2025. Solar energy firms like Suntech
and FirstSolar were attracted to this type of policy which is why firms were attracted to
Arizona—the solar manufacturing industry had great potential for growth there. In
addition to this, firms embraced the idea that a growing solar industry would draw in a
supply chain, thus lowering production costs. With this great potential, Suntech decided
to expand in the U.S.
President Obama signed into law the American Recovery and Reinvestment Act
(ARRA). As a part of this bill, the Advanced Energy Manufacturing Tax Credit supplied
$2.3 billion in tax credits. In addition to this, the law provided the DOE with $6 billion to
10
give out in loan guarantees for renewable energy projects. The law also incentivized solar
installation by offering a cash grant for any solar installations initiated in 2009 or 2010.
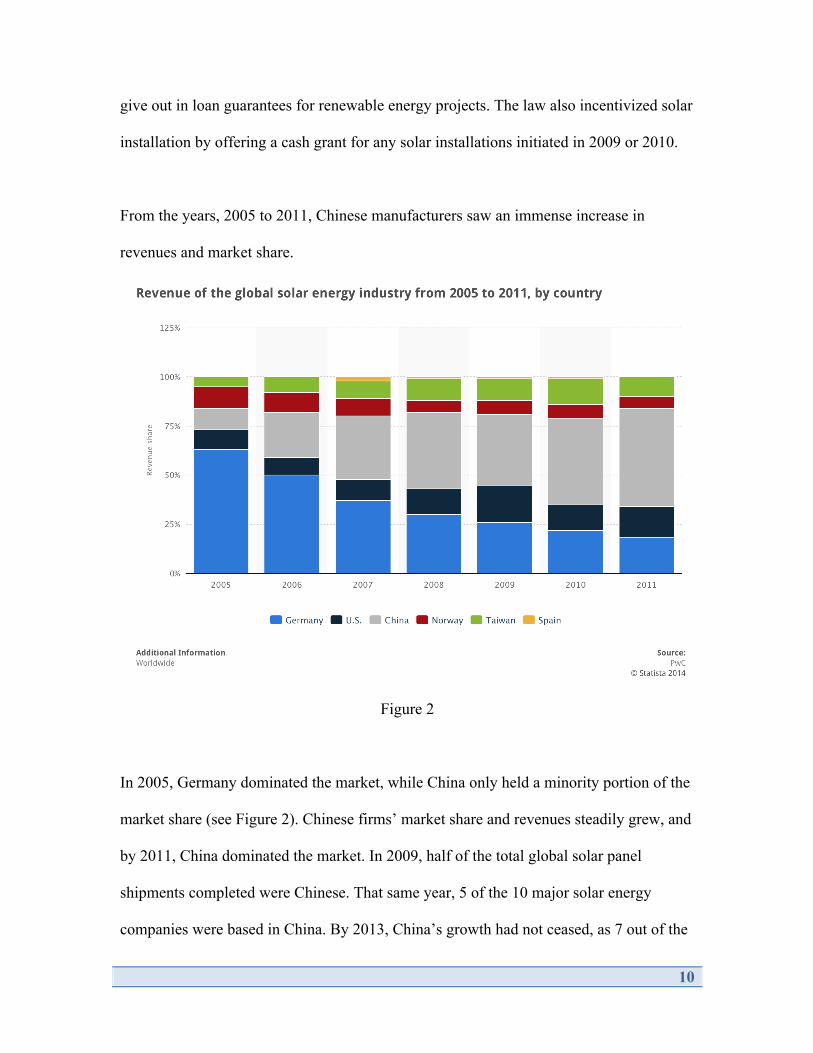
From the years, 2005 to 2011, Chinese manufacturers saw an immense increase in
revenues and market share.
Figure 2
In 2005, Germany dominated the market, while China only held a minority portion of the
market share (see Figure 2). Chinese firms’ market share and revenues steadily grew, and
by 2011, China dominated the market. In 2009, half of the total global solar panel
shipments completed were Chinese. That same year, 5 of the 10 major solar energy
companies were based in China. By 2013, China’s growth had not ceased, as 7 out of the
11
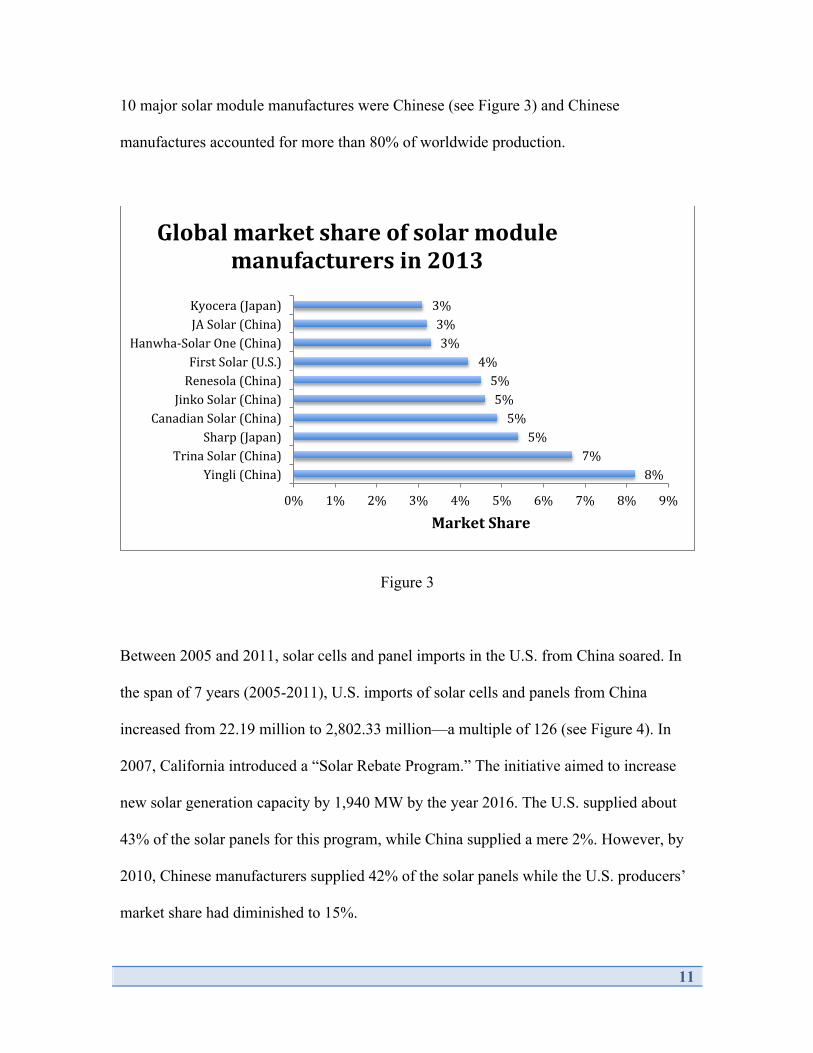
10 major solar module manufactures were Chinese (see Figure 3) and Chinese
manufactures accounted for more than 80% of worldwide production.
Figure 3
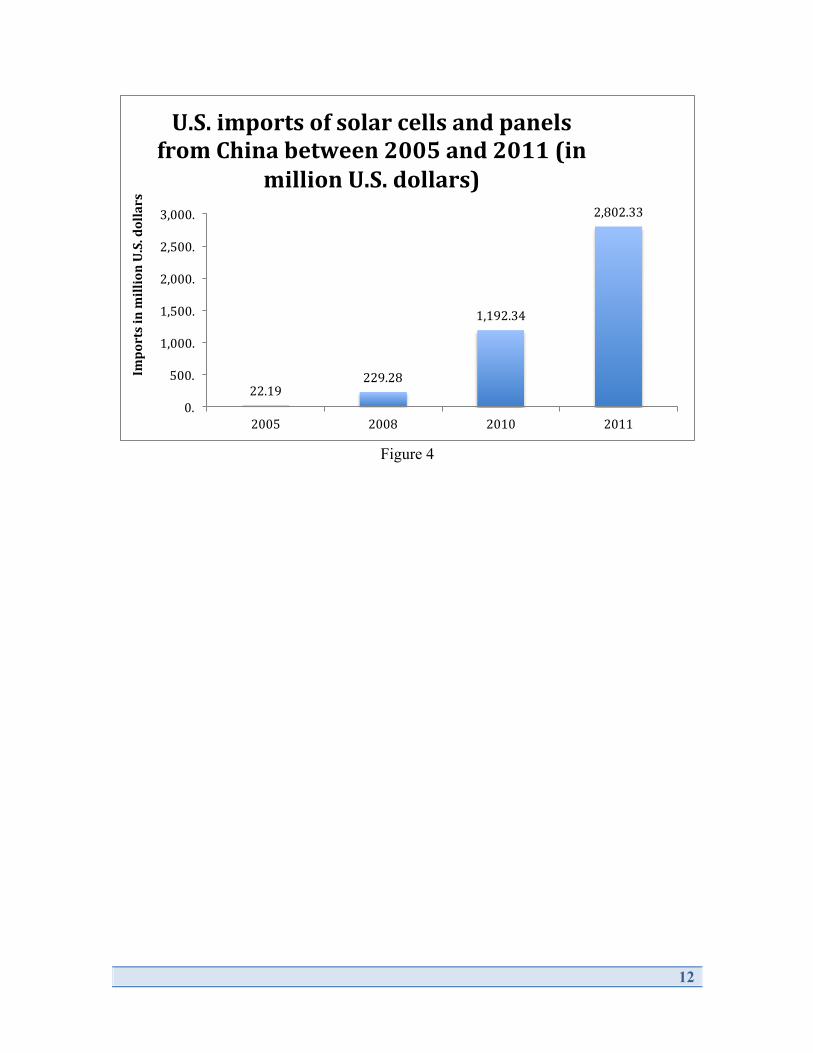
Between 2005 and 2011, solar cells and panel imports in the U.S. from China soared. In
the span of 7 years (2005-2011), U.S. imports of solar cells and panels from China
increased from 22.19 million to 2,802.33 million—a multiple of 126 (see Figure 4). In
2007, California introduced a “Solar Rebate Program.” The initiative aimed to increase
new solar generation capacity by 1,940 MW by the year 2016. The U.S. supplied about
43% of the solar panels for this program, while China supplied a mere 2%. However, by
2010, Chinese manufacturers supplied 42% of the solar panels while the U.S. producers’
market share had diminished to 15%.
8% 7%
5% 5%
5% 5%
4% 3% 3% 3%
0% 1% 2% 3% 4% 5% 6% 7% 8% 9%
Yingli (China) Trina Solar (China)
Sharp (Japan) Canadian Solar (China)
Jinko Solar (China) Renesola (China) First Solar (U.S.)
Hanwha-‐Solar One (China) JA Solar (China) Kyocera (Japan)
Market Share
Global market share of solar module manufacturers in 2013
12
Figure 4
22.19 229.28
1,192.34
2,802.33
0.
500.
1,000.
1,500.
2,000.
2,500.
3,000.
2005 2008 2010 2011
Imports in million U.S. dollars
U.S. imports of solar cells and panels from China between 2005 and 2011 (in
million U.S. dollars)

13
US Solar Industry
In the U.S., solar industry employment grew 53% from 2010-2013, creating 50,000 new
solar jobs. The installation subsector has seen the largest boom in this time frame, as
employment grew by 60% since 2010—that is an increase of 25,000 jobs. Installation
companies in the U.S. employ 69,658 workers, making installation the largest subsector
in the U.S. solar industry. In 2012, photovoltaic (PV) installations increased 41%, to
reach 4,751 MW. Solar was the second-largest source of new electricity generating
capacity, surpassed only by natural gas.
In November of 2013, employment in the U.S. solar industry totaled 142,698 workers,
representing a 20% increase from the previous year. For comparison, this is 10 times
overall growth in U.S. employment.
The solar industry is becoming a substantial source of new jobs for the U.S. economy.
77% of the 24,000 new solar workers (18, 211) workers since 2012, took new jobs and
did not fill existing job (see Figure 5).

14
Figure 5
The primary driver of industry growth has been the decreasing costs of solar products and
installations. Prices have steeply fallen by 44% from Q2 of 2011 to Q2 of 2012. Over the
course of 2012, installation prices decreased by 15%. Following this, prices have
stabilized yet are expected to keep declining regardless of the increase in worldwide
demand. The declining prices are a direct result of Chinese exports; because Chinese
firms were able to effectively cut costs, they set very competitive prices on their solar
products.
Now that the price of solar power has become more affordable, one of the main drivers
for consumer demand is not environmental, but financial. Competitive pricing has been a
key player responsible for these remarkable growth rates. In 2013, the cost of solar
modules dropped to $.70 per watt, which is less than a third of the cost in early 2010.
Solar industry jobs in 2013
Newly created positions
Existing employees given added solar responsibilities

15
Simultaneously, installed costs in the U.S. have fallen from $6.37 per watt in 2010 to
$3.00 per watt in 2012.
Figure 6
Referring to Figure 6, we see that the vast majority of American consumers are motivated
to purchase solar power to save money, while a mere 8% are motivated for environmental
reasons.
60.0% 17.2%
8.3% 3.1% 2.2% 2.2% 4.6% 2.5%
0% 10% 20% 30% 40% 50% 60% 70%
To save money Solar energy costs are now competitive with
To beneUit the environment and mitigate They know a neighbor, friend, or family To have power when the grid goes down
To make America more energy independent Other
Don't Know/Not Available
Consumer Demand Drivers
16
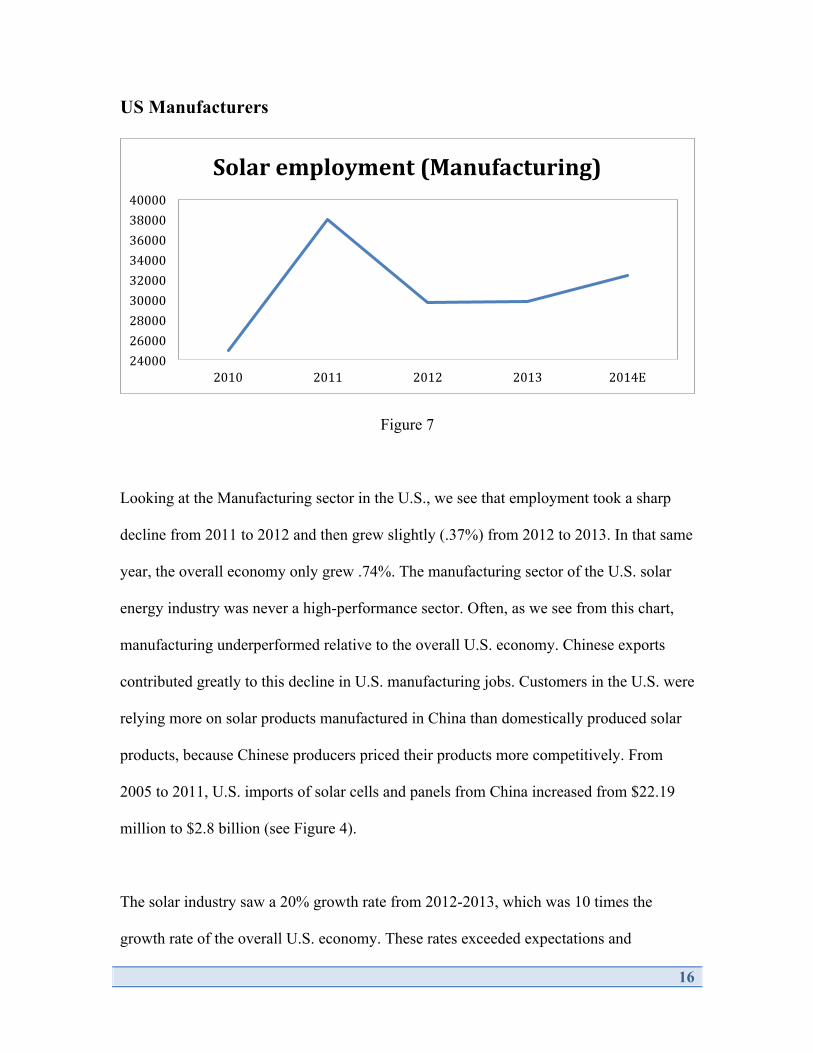
US Manufacturers
Figure 7
Looking at the Manufacturing sector in the U.S., we see that employment took a sharp
decline from 2011 to 2012 and then grew slightly (.37%) from 2012 to 2013. In that same
year, the overall economy only grew .74%. The manufacturing sector of the U.S. solar
energy industry was never a high-performance sector. Often, as we see from this chart,
manufacturing underperformed relative to the overall U.S. economy. Chinese exports
contributed greatly to this decline in U.S. manufacturing jobs. Customers in the U.S. were
relying more on solar products manufactured in China than domestically produced solar
products, because Chinese producers priced their products more competitively. From
2005 to 2011, U.S. imports of solar cells and panels from China increased from $22.19
million to $2.8 billion (see Figure 4).
The solar industry saw a 20% growth rate from 2012-2013, which was 10 times the
growth rate of the overall U.S. economy. These rates exceeded expectations and
24000 26000 28000 30000 32000 34000 36000 38000 40000
2010 2011 2012 2013 2014E
Solar employment (Manufacturing)

17
projections by a large margin and the growth rates in the U.S. are not expected to lose
momentum. The solar industry will remain to be one of the faster growing industries in
the nation and the industry will continue to play a major role in the U.S.’s economic
recovery. Referring to Figure 8, we see that going forward (through the year 2017),
revenue of the solar industry in the U.S. is expected to grow every year.
Figure 8
U.S. solar energy policy has played the key role in the development and growth of the
solar industry in the United States, both on the national and state level. In the case of
California, Governor Schwarzenegger announced a solar initiative called the “Million
Roofs Program” in 2004. Following this, in 2007 California announces the “Go Solar”
initiative.2 The initiative provided incentives for new energy efficient home construction.3
2 "About the California Solar Initiative (CSI) - Go Solar California." About the California Solar Initiative (CSI) - Go Solar California. N.p., n.d. Web. 08 Dec. 2014.
0.
50.
100.
150.
200.
250.
2007 2008 2009 2010 2011 2012 2013 2014 2015 2016 2017
Revenue in million U.S. dollars
Revenue of the solar power industry in the United States from 2007 to 2017 (in
million U.S. dollars)
18
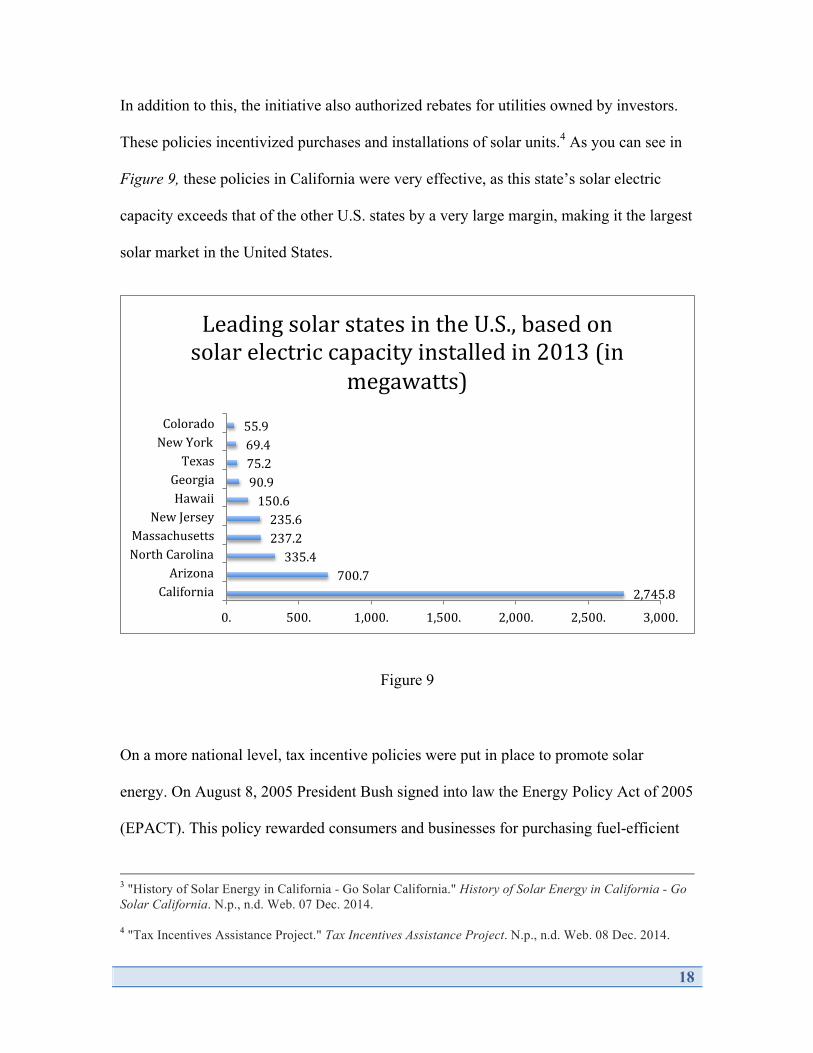
In addition to this, the initiative also authorized rebates for utilities owned by investors.
These policies incentivized purchases and installations of solar units.4 As you can see in
Figure 9, these policies in California were very effective, as this state’s solar electric
capacity exceeds that of the other U.S. states by a very large margin, making it the largest
solar market in the United States.
Figure 9
On a more national level, tax incentive policies were put in place to promote solar
energy. On August 8, 2005 President Bush signed into law the Energy Policy Act of 2005
(EPACT). This policy rewarded consumers and businesses for purchasing fuel-efficient
3 "History of Solar Energy in California - Go Solar California." History of Solar Energy in California - Go Solar California. N.p., n.d. Web. 07 Dec. 2014. 4 "Tax Incentives Assistance Project." Tax Incentives Assistance Project. N.p., n.d. Web. 08 Dec. 2014.
2,745.8 700.7
335.4 237.2 235.6
150.6 90.9 75.2 69.4 55.9
0. 500. 1,000. 1,500. 2,000. 2,500. 3,000.
California Arizona
North Carolina Massachusetts
New Jersey Hawaii Georgia Texas
New York Colorado
Leading solar states in the U.S., based on solar electric capacity installed in 2013 (in
megawatts)

19
products, by offering them federal tax credits.5 The policy restored a Federal Solar Tax
Credit, which permitted the purchaser of a solar panel to recoup up to 30 percent of the
cost of the project. The latest update on this federal tax break was announced on April 21,
2014. The federal tax incentives had expired at the end of 2013 and Congress was
debating the extension of the tax benefits. The future of the U.S. solar industry is
contingent on these policies. As we have seen, the industry will be greatly impacted
depending on how Congress ultimately votes on these policies.
5 "Energy.gov." Qualifying Advanced Energy Manufacturing Investment Tax Credit. N.p., n.d. Web. 08 Dec. 2014.

20
European Solar Industry
History of Solar in Europe
The worldwide growth of photovoltaics has increased exponentially in the last 20 years.
In 1996, the United States was the worldwide leader with installed PV capacity of about
88 megawatts. Japan eventually passed the U.S. and remained the worldwide leader until
2004, which is when Germany overtook it as the worldwide leader in installed capacity.
The passing of the German Renewable Energy Act in 2000 and the subsequent adoption
of feed-in tariffs enabled Germany to overtake Japan as the market leader. The act had
three main principles: 1. investment protection through guaranteed feed-in tariffs, 2. the
renumeration rates were not considered subsidies because they were not paid for by taxes,
but rather as a surcharge included in every consumer’s electricity bill, and 3. feed-in
tariffs in Germany would decrease in regular intervals to exert pressure on manufacturers
to innovate and create more efficient and less expensive technologies6. The German
Renewable Energy Act and the fixed feed-in tariffs associated with it provided a sense of
financial security for investors, generated more competition and was instrumental in
making Germany, and eventually Europe, the worldwide leader in the PV market. The
implementation of price incentives by Germany and other countries fueled a rapid
increase in solar installations, which led to Europe accounting for approximately 80
percent of the global demand for solar panels for much of the 2000s.
6 http://en.wikipedia.org/wiki/German_Renewable_Energy_Act
21
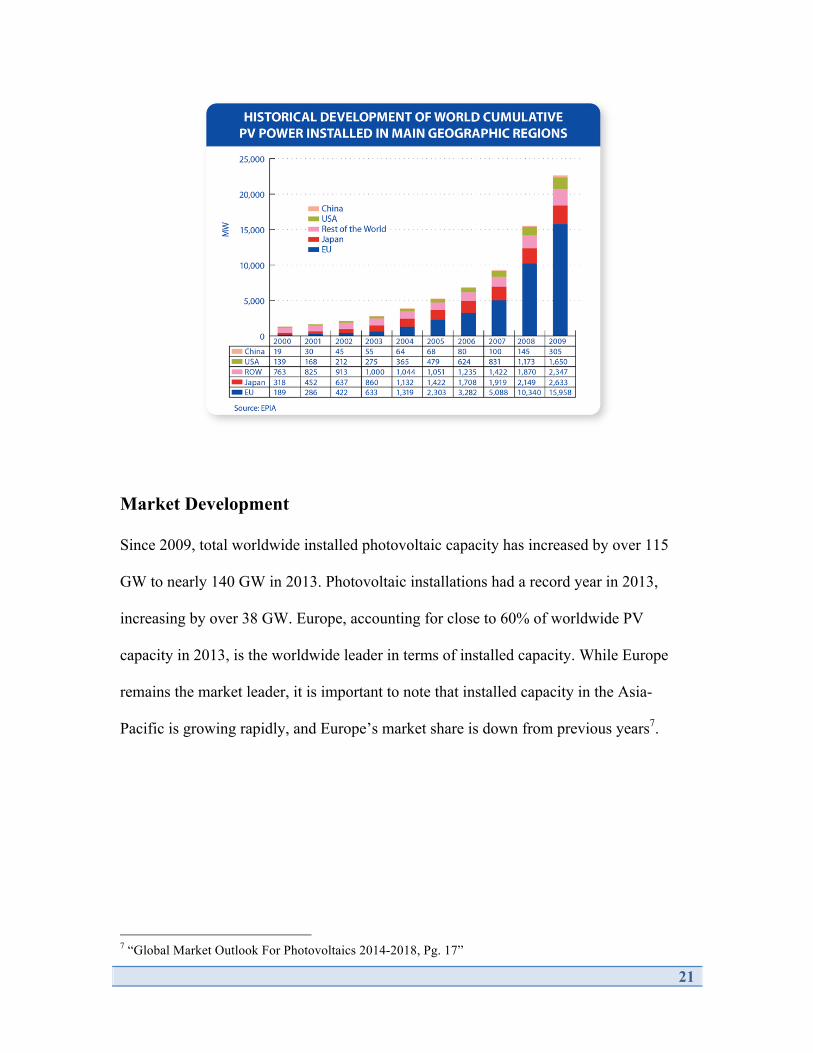
Market Development
Since 2009, total worldwide installed photovoltaic capacity has increased by over 115
GW to nearly 140 GW in 2013. Photovoltaic installations had a record year in 2013,
increasing by over 38 GW. Europe, accounting for close to 60% of worldwide PV
capacity in 2013, is the worldwide leader in terms of installed capacity. While Europe
remains the market leader, it is important to note that installed capacity in the Asia-
Pacific is growing rapidly, and Europe’s market share is down from previous years7.
7 “Global Market Outlook For Photovoltaics 2014-2018, Pg. 17”

22
8
The European market has grown rapidly in the last ten years and had a record year in
2011; it was unable to sustain that pace though due to the volatility of the economy in the
European Union and hostile policies towards PV in certain countries. This resulted in
installations of only about 11 GW in 2013, which was the lowest level since 2009.
Germany, which has been the worldwide market leader in terms of yearly PV
installations for much of the last 15 years dropped to fourth in 2013, but remained the
market leader in Europe. On a regional basis, Europe was second in the PV market
accounting for close to 30% of the installations after the Asia-Pacific Region.
The momentum of the European PV market until 2012 was the result of a few countries
spearheading installations. Due to the financial crisis, the European market stagnated
8 “Global Market Outlook For Photovoltaics 2014-2018, Pg. 17”

23
from 2008 to 2010 but began to grow rapidly again in 2010. Italy, France and Germany
accounted for much of the region’s growth in 2011, and strong installations from these
countries, as well as installations from the UK, Greece and Belgium led to continued
market development in 2012. In 2013, France and Belgium didn’t perform as well, but
development in other markets compensated for this. That same year though, a decline in
installations in Germany and Italy accounted for the contraction of the European market
to 11 GW. While Europe remains the market leader with over 80 GW of installed solar
capacity, it is clear from recent trends that the pace of installations is slowing down.
9
9 “Global Market Outlook For Photovoltaics 2014-2018, Pg. 21”

24
Current Market and Forecast
There are many market forces influencing the rate and feasibility of photovoltaic
installations. Some of these factors include government policies, and others include the
costs of PV installations compared to traditional sources of electricity. The decline in
many important European markets can be attributed to a mix of these factors, but the cuts
in government subsidies and cuts in feed-in tariffs for solar power have been a root cause
of the decline of solar in Europe.
When markets were booming, European governments were very liberal in their spending
on renewable energy and were determined to make them competitive with fossil fuels in
order to meet carbon-dioxide reduction targets. When solar panels were more expensive,
governments had to heavily subsidize the industry to incentive solar installations. But as
the cost of solar panels fell, and with the onset of the financial crisis, European
governments had no choice but to cut back on these subsides because the costs of these
subsidies were being passed on to consumers.
In 2010, Germany and Italy began pulling back on solar incentives, and then France
halted its solar feed-in tariffs that same year. While this decrease in solar subsidies
eventually led to a decrease in yearly installations and forced unprofitable firms to exit
the market, Germany cut back on these subsidies gradually to avoid a similar fate as
Spain which experienced a complete collapse of its market after it cut its subsidies. In
2008, Spain accounted for half of the world’s new solar installations in terms of wattage,
which was made possible via government subsidies. Due to the financial crisis though,
25
Spain cut back on subsidies which led to decreased demand for solar panels and resulted
in massive over supply and a decrease in prices.
Spain’s push into solar power began as an offshoot of its push to become a major player
in wind power. Because wind energy was cheaper than solar, the Spanish government
subsidized solar to make it more attractive. Spain’s spending on solar jumped from $214
million in 2007 to $1.6 billion in 2008. This resulted in a massive increase in its solar
capacity from 695 megawatts in 2007 to 3,342 megawatts in 2008. Due to the financial
crisis though, the Spanish government capped the amount of annual subsidized solar
power at 500 megawatts later that year. This resulted in a shrinking of Spain’s solar
power capacity and had ripple effects on companies that relied on Spain as an end
market. Chinese firms such as Yingli Green Energy, and LDK posted huge quarterly
losses as a result of reduced demand from Spain10.
In addition to a decrease in subsidies and cuts in feed-in tariffs, the rise of China poses a
threat to the European market. China emerged as a dominant industry player and
produced at least half of the world’s solar panels in 2010. Chinese manufacturers have
flooded the market with cheap panels which have put some European manufacturers out
of business. Because of this, European and American firms have filed complaints alleging
that the Chinese government is unfairly subsidizing Chinese manufactures with low-
interest loans and cheap power to run their plants. This has led to tensions between
European, American and Chinese authorities which have each imposed tariffs, and
counter-tariffs, respectively. 10 “http://online.wsj.com/articles/SB125193815050081615”

26
To summarize, the market for PV installations in Europe peaked in 2011 with
approximately 22 GW in installations. This was followed by 17.7 GW of installations in
2012 and 11 GW of installations in 2013, which was the lowest since 2009. Some of this
decrease can be attributed to the financial crisis and a decrease in subsidies, but what is
also clear is that Europe is a very volatile market, and outside of Germany, no European
country has managed to consistently increase annual PV installations as shown in the
above graph. Given the expectation of continued decreases in feed-in tariff programs by
some European countries, as well as the emergence of markets in the Asia-Pacific, it is
reasonable to assume that the European market will hold a smaller percentage of the
overall worldwide PV market11.
12
11 “Global Market Outlook For Photovoltaics 2014-2018, Pg. 31” 12 “Solarbuzz Regional Downstream PV Market”
27
Tariffs in Europe
In 2012, the European Union began to investigate Chinese solar manufacturers due to
allegations of dumping, which is the practice of selling a product below its fair value.
These allegations were brought forth by European solar panel producers who were
struggling to compete with Chinese producers whose panels were approximately 45%
cheaper than those made in Europe. European producers have alleged that unfair support
from the Chinese government enabled Chinese solar panel producers to capture close to
70 percent of the market in Europe. The EU’s investigation found that government aid
enabled these Chinese manufacturers to sell their products close to 90 percent below fair
market value, which enabled them to capture such a large share of the market. This led to
the imposition of duties in June of 2013 of 11.8 percent on Chinese imports, which would
have risen to 47.6 percent in August had the Chinese Chamber of Commerce and the EU
failed to negotiate a settlement. While European solar manufacturers lobbied very
aggressively for tariffs against Chinese imports and argued that tariffs would enable them
to compete more effectively in the market, others believed that tariffs on Chinese imports
would end up causing more harm to the European industry and suggested that the two
sides come to a compromise. This led to a settlement.
The Chinese Chamber of Commerce and the EU reached a two-part settlement. The first
part of the settlement initially set a minimum price floor of €0.74 per watt before a 47.6
percent anti-dumping tariff would take effect. The price was then reduced to €0.56 per
watt. The second part of the settlement set a volume limit on Chinese imports at 7 GW.
This means that the 90 Chinese companies who signed the agreement were allowed to

28
export up to 7 GW into Europe in 2013 at a minimum price of €0.56 per watt before the
tariff would take effect. The Chinese companies who did not sign the agreement have to
pay the 47.6 percent tariff but they are not subject to the minimum price. An important
thing to note from the below graph is that demand was predicted to shrink from 17 GW in
2012 to 11.6 GW in 2013. Another important thing to be aware of is that the volume cap
on Chinese imports was reduced from 7 GW to 5.8 GW after the European Photovoltaic
Industry lowered its installation forecast for 2014 from 11.5 GW to approximately 9.6
GW, and that the price floor was lowered from €0.56 per watt to €0.53 per watt due to
lower average module prices.
13
The settlement reached by the EU and the Chinese Chamber of Commerce dissatisfied
EU solar-panel producers, who wanted higher minimum import prices and a lower
volume limit. EU ProSun even resorted to filing a lawsuit to try and void the settlement.
13 “GTM Research”

29
Mike Nitzschke, President of EU ProSun said, “these EU solar tariffs are the first ray of
hope for European companies to reenter the market with high-value products”14.
Following these trade disputes, the Chinese magazine Ecns.cn reported that China’s
exports of crystalline photovoltaic products fell sharply and revenue from exported solar
cells and solar modules to Europe declined by 62 percent to $3.7 billion15. According to
GTM Research, Chinese manufacturers such as Trina and Yingli expected first quarter
2014 shipments to slump by at least 30 percent compared to the prior quarter. So far it
appears that the minimum price level and volume limits on Chinese manufacturers has
been successful in raising the price of solar panels in Europe, and it appears to be
decreasing the market power of Chinese manufacturers, but it is also having other effects.
According to Jinko Solar’s Director for Europe, Frank Niendorf, the minimum price level
is delaying grid parity in important European markets. He says that prices have actually
gone down due to the minimum price level and that grid parity in Europe would be
achievable if Jinko was able to offer modules at the same price as other markets.
14 “http://www.bloomberg.com/news/2013-12-02/u-nations-approve-pact-with-china-on-solar-panel-trade.html” 15 ” http://www.pv-magazine.com/news/details/beitrag/eu-lowers-chinese-pv-import-volume_100014771/#axzz2yUQqu22O”

30
US Trade Tariffs
Understanding Tariffs presented by Department of Commerce
The US-China Solar Trade War dates to October 2011, when the US subsidiary of
German-based SolarWorld, representing several other US solar manufacturers, filed a
petition with the Department of Commerce and (DOC) and the International Trade
Commission (ITC). SolarWorld claimed that Chinese solar manufacturers were receiving
massive illegal subsidies from the Chinese government in the form of funds for land,
electricity, material inputs, financing at below market rates, and even direct financial
support and other preferential policies. Furthermore, SolarWorld claims that Chinese
solar manufacturers were illegally “dumping” solar cells into the US market and prices
below production costs. The petitioners claimed the combination of the illegal subsidies
and dumping severely damaged employment, pricing, production, and shipment with
respect to the domestic solar industry in the United States.16 This has been followed by a
long and complicated process of administering tariffs against Chinese manufacturers who
specifically export either solar cells or solar modules17 to the US.
Essentially, the petition asked for relief for domestic manufacturers by preventing unfair
practices by Chinese producers of solar cells and modules. The Department of Commerce
(DOC) is the department of the US government tasked with promoting economic growth.
The DOC responded to the petitions by imposing tariffs against the Chinese firms
16 “U.S. Manufacturers of Solar Cells File Dumping and Subsidy Petitions Against China,” Coalition for American Solar Manufacturing, 10/19/2011 17 A solar module is an assembly of solar cells that have been electrically interconnected and encapsulated.

31
involved in the illegal subsidies and dumping provided by local Chinese governments.18
The tariffs involved include “Countervailing Duties” (CVD)19 and “Anti-dumping
Duties” (AD)20. CVDs (also known as anti-subsidy duties) are tariffs imposed under the
World Trade Organization (WTO) rules to neutralize the negative effects of subsidies
once a foreign country is found guilty of subsidizing its exports, which hurts domestic
producers in the importing country. ADs are protectionist tariffs imposed on foreign
imports that are believed to be priced below market value; in the US, they typically
exceed 100%.
The DOC can justify imposing tariffs on Chinese imports for several reasons. First and
foremost, it is undoubtedly going to aid hurting US manufactures of solar panels. If the
rapid reversal of market share gains of Chinese producers in the US market was due to
illegally subsided and dumped Chinese exports, the DOC has the prerogative to step in
and protect domestic industry. This can be seen in 2007; US manufacturers were
responsible for 43% of solar panels for the California Solar Rebate Program vs. Chinese
companies’ 2% share. However, just three years later in 2010, Chinese companies
captured a 42% market share while US firms fell down to 15%21.
18 SolarWorld provides a list of Chinese firms involved in the unfair practices to the DOC. 19 “Countervailing Duties,” Wikipedia 20“Anti-Dumping Duty,” Investopedia 21 Bullis, Kevin, “Solar’s Great Leap Forward,” MIT Technology Review, June 22, 2010
32
The first is US-based Solyndra – it received more than $500 million in a federal loan
guarantee from the Department of Energy along with a $25 million tax break from
California’s Alternative Energy and Advanced Transportation Financing Authority.
Nevertheless, it filed for Chapter 11 bankruptcy in 2011 and laid off all 1,000 of its
employees. Next is Japan-based Shar Solar – it withdrew almost entirely from solar
manufacturing after being bailed out by the Japanese government. Although it led the
world in revenue in solar production in 2009, its productions costs were still 30-40%
higher than its cheapest Chinese and Taiwanese competitors by 2011; its business was
not sustainable at this rate. It eventually closed its marketing operations in the US and
Europe22. Lastly, we have German-based Q-Cells – for years, it had been the largest
global maker of solar cells and an investor favorite, constantly meeting or exceeding Wall
Street expectations. By 2012, it filed for bankruptcy23. These scenarios are to serve as
examples that even the most well established firms could fall. In this tumultuous business
climate for the solar sector, the DOC reviewed the SolarWorld petition.
Brief History on US-imposed Tariffs on Chinese Exporters
In late 2011, the DOC and ITC began investigating claims made by SolarWorld against
Chinese solar manufacturers. By December 2011, ITC was first to issue an affirmative
preliminary determination, meaning that both the subsidies and dumping from China
indeed hurt the US solar industry. By May 2012, the DOC shortly followed suit; it issued
a preliminary finding and began imposing duties on Chinese products. By October 2012,
22 Shah, Sneha, “Sharp to Bail Out of Solar As It Gets Bailed Out by Japanese Banks,” Green World Investor, October 11, 2012 23 Schultz, Stefan, “Twilight of an Industry: Bankruptcies Have German Solar on The Ropes,” Der Speigel, April 3, 2012

33
DOC had issued its affirmative final determination and decided to continue the CVD and
AD tariffs against the Chinese exporters; DOC discovered they had “sold cells in the
United States at dumping margins ranging from 18.32 to 249.96 percent [and] Chinese
producers/exporters have received countervailable subsidies of 14.78 to 15.97 percent.”24
Nevertheless, the difficult times for US solar manufacturers reawakened shortly later; the
Chinese exporters managed to find a loophole. The final determination could be evaded
by many of the producers by “commissioning manufacturers in other countries to
partially or fully produce solar photovoltaic cells for assembly into solar panels back in
China”.25 Imports headed to the US from China contained about 70% Taiwanese cells,
according to state-controlled Chinese media. It seems that this battle would continue
indefinitely – except that SolarWorld again submitted a petition.
Just recently, measures to fix this loophole have been taken by the DOC – this past
summer, the DOC announced its affirmative preliminary determination for both CVDs
for solar products from China26 and ADs for solar products from China and Taiwan27.
The DOC calculated a preliminary subsidy rate ranging from 18.56-35.21%, depending
on the specific Chinese exporter with all those not described in the tariff having a rate of
26.89%.
24 Dept. of Commerce & Int’l Trade Admin., Fact Sheet: Commerce Finds Dumping & Subsidization of Crystalline Silicon Photovoltaic Cells, Whether or Not Assembled into Modules from the People’s Republic of China (2012) 25 Wesoff, Eric, “Big Tariffs in US-China Solar Panel Trade Case; No Settlement in Sight,” Green Tech Media, June 4, 2014 26 Dept. of Commerce & Int’l Trade Admin., Fact Sheet: Commerce Preliminarily Finds Countervailable Subsidization of Imports of Certain Crystalline Silicon Photovoltaic Products from the People’s Republic of China (June 3, 2014) 27 Dept. of Commerce & Int’l Trade Admin., Fact Sheet: Commerce Preliminarily Finds Dumping of Imports of Certain Crystalline Silicon Photovoltaic Products from China and Taiwan (July 25, 2014)
34
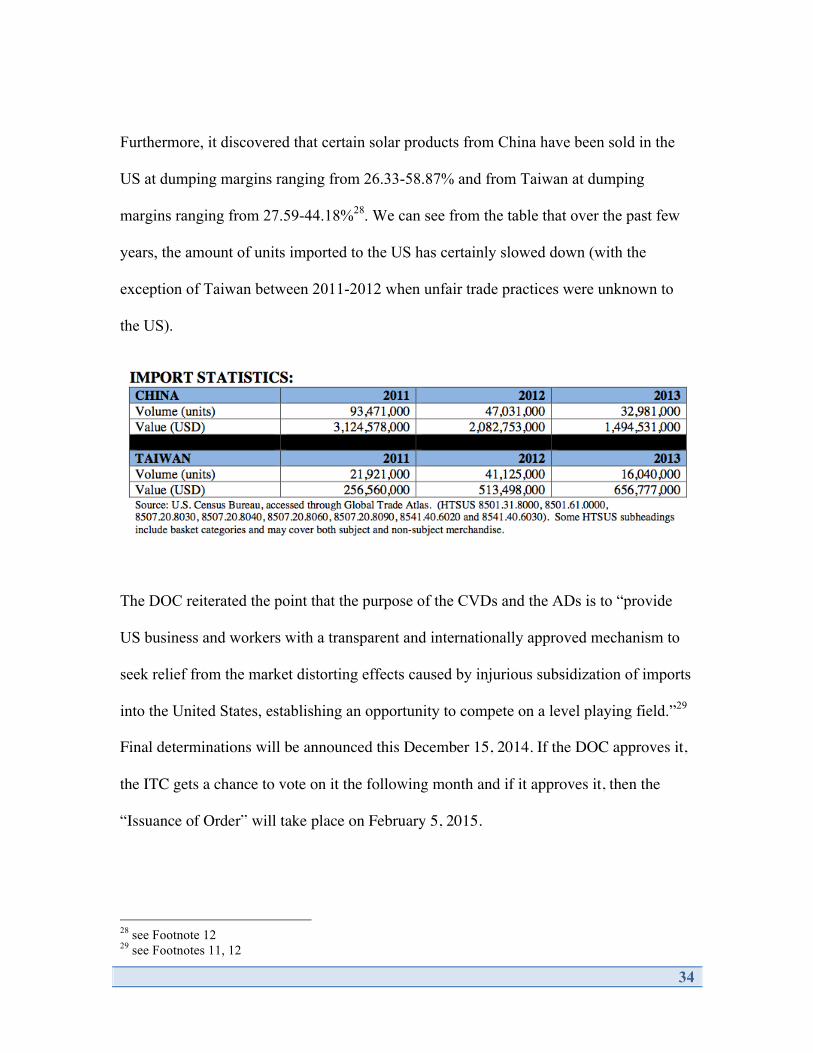
Furthermore, it discovered that certain solar products from China have been sold in the
US at dumping margins ranging from 26.33-58.87% and from Taiwan at dumping
margins ranging from 27.59-44.18%28. We can see from the table that over the past few
years, the amount of units imported to the US has certainly slowed down (with the
exception of Taiwan between 2011-2012 when unfair trade practices were unknown to
the US).
The DOC reiterated the point that the purpose of the CVDs and the ADs is to “provide
US business and workers with a transparent and internationally approved mechanism to
seek relief from the market distorting effects caused by injurious subsidization of imports
into the United States, establishing an opportunity to compete on a level playing field.”29
Final determinations will be announced this December 15, 2014. If the DOC approves it,
the ITC gets a chance to vote on it the following month and if it approves it, then the
“Issuance of Order” will take place on February 5, 2015.
28 see Footnote 12 29 see Footnotes 11, 12

35
Regarding our data, you will see shortly that we use tariff figures from 2012 and not the
more recently published 2014 for several reasons. First, the final determination hasn’t
been announced yet, so we cannot use a true, reflective figure due to this lack of
information; we are better of working with historical information. Second, we want to
anticipate changes before and after the introduction of the tariff on Chinese
manufacturers. Because these new preliminary determinations were announced so
recently, accurate and representative data revolving changes due to the new tariff rates
has been difficult to find. Lastly, the changes between the two sets of tariffs are not
expected to change much; a Vice President from GTM Research said the following in
regard to the most recent summer update about the tariffs: “Unless the DOC revises the
scope prior to its final determination, there is no question that tariffs imposed in this case
will have a larger impact than those already in place from the 2012 ruling.”30 Therefore,
we are in confident in using known, correct 2012 figures to gain us a deeper
understanding of the affect of tariffs on the pricing and demand of solar products in the
United States.
Criticism / Concerns with US Trade Tariffs
SolarWorld’s requests for the DOC to administer tariffs to Chinese exporters who
perform in unfair trade practices in the US solar market are opposed mainly by the
Coalition for Affordable Solar Energy (CASE), the Solar Energy Industries Association
(SEIA), and others who believe that the tariffs do more damage than provide well-being
for players in the US solar market. The two aforementioned organizations root their
30 Wesoff, Eric, “SolarWorld Wins Again: Big Anti-Dumping Tariffs in US-China Solar Panel Trade Case,” Green Tech Media, July 25, 2014

36
opposition to the tariffs because they believe it will immediately increase the price of
solar power and cost American jobs in one of the fastest-growing sectors of the US
economy31. After the second round of preliminary determinations for ADs occurred on
June 4, 2014, SEIA came out with the following statement:
“These damaging tariffs will increase costs for US solar consumers and, in turn, slow the adoption of solar within the United States. Ironically, the tariffs may provide little to no direct benefit to the sole petition SolarWorld, as we saw in the 2012 investigations. It’s time to end this needless litigation with a negotiated solution that addresses SolarWorld’s trade allegations while ensuring the continued growth of the US solar market”32
These organizations are more concerned with resolving the global issue of moving
towards renewable energy sources; they want everyone to work together to find a
solution that benefits all segments of the industry. Tariffs feature a dead-weight loss that
is both costly and divisive; essentially, all they do is hurt relationships among people.
Although the tariffs from 2012 and especially those from more recent times have not
fully been able to give us a clear understanding of their effects, one thing is collectively
agreed upon by everybody: “pricing for Chinese modules shipped to the US is highly
likely to increase starting in July 2014.”33 Besides the immediate effects on pricing, much
of the consequences regarding the tariffs have not yet been realized. Only time will tell us
what is to come next.
31 Wesoff, Eric, “Big Tariffs in US-China Solar Panel Trade Case; No Settlement in Sight,” Green Tech Media, June 4, 2014 32 Wesoff, Eric, “Big Tariffs in US-China Solar Panel Trade Case; No Settlement in Sight,” Green Tech Media, June 4, 2014 33 Wesoff, Eric, “SolarWorld Wins Again: Big Anti-Dumping Tariffs in US-China Solar Panel Trade Case,” Green Tech Media, July 25, 2014

37
Besides the obvious benefit of the tariffs – enhanced domestic manufacturing in the solar
space – experts have made claims on possible future negative impacts. One economic
implication the tariffs possess is trade diversion, which is described as the shift from
trade with one exporting country to trade with another exporting country34. Studies
show35 that when the US imposes CVDs and ADs against one country, other countries
begin producing the tariffed product at a higher rate, which creates a niche market for
other foreign countries to exploit the US domestic market at the expense of US
manufacturers. So, rather than motivating the US producers to manufacture the tariffed
good, it is possible that the US could turn to a different country that produces that good
since (we now assume) quantity will be readily available elsewhere. This has been seen
in 2005 with many Chinese wooden furniture manufacturers; those manufactures moved
their facilities elsewhere (Vietnam, Indonesia, etc.) in order to avoid the heavy tariffs.36
At the end of the day, trade diversion continues to harm US industry because US
consumers still receive the good but not from domestic suppliers.
34 Carrier, Paul, An Assessment of Regional Economic Integration Agreements After the Uruguay Round, 9 N.Y. Int’l L. Rev. 1, 15 (1996) 35 Higgins, Andrew, “From China, an End Run Around US Tariffs,” The Washington Post, May 23, 2011 36 see Footnote 20

38
Chinese Counter-Tariffs
Background
In May of 2012, the U.S. Department of Commerce placed a 31 percent anti-dumping
tariff on solar panels produced with solar cells made in China. This tariff was put in place
after the U.S. Trade Commission came to the conclusion that the U.S. solar industry was
being harmed by imports from Chinese manufacturers who were being subsidized by the
Chinese government. In response to this, the Chinese Ministry of Commerce announced
that it would impose counter-tariffs on imports of polysilicon from U.S. manufacturers.
Similarly, the European Union imposed tariffs on Chinese solar imports in June of 2013.
Immediately after the EU announced this, China’s commerce ministry announced that it
would launch an investigation into European wine imports.
Effect of Counter-Tariffs
While imposing tariffs on Chinese importers may make it easier for U.S. solar companies
to compete, the tariffs will also make it more expensive for U.S. consumers by pushing
up the price of solar power, which will reduce demand. This decrease in demand will
limit new solar projects, as well as lead to a reduction in jobs. Chinese counter-tariffs
have also affected U.S. exporters of polysilicon. Hemlock Semiconductor and AE
Polysilicon are just two of the U.S. polysilicon manufacturers expected to be affected by
the Chinese tariffs, which could be as high as 57 percent. In January of 2013, Hemlock
Semiconductor announced that they would lay off approximately 400 employees in

39
Michigan and Tennessee. The threat of Chinese tariffs on polysilicon was one of the
factors that led to this. Andrew Tometich, president of Hemlock Semiconductor said,
“The unresolved trade disputes among the U.S., China and Europe are a major factor in
Hemlock Semiconductor's actions as the threat of tariffs on U.S. polysilicon imported
into China has significantly decreased orders from China, which is home to one of the
largest markets for our products."37
In addition to this, the companies that the U.S. tariffs will help only represent a small
percentage of the American solar industry. Approximately 95 percent of solar industry
jobs in the U.S. are with upstream producers of capital equipment, polysilicon
manufacturers and various other manufacturers of solar components. Free trade with
China is crucial to preserving these jobs. China is the largest consumer of many of
America’s solar products. “According to a Brattle Group analysis commissioned by
Coalition for Affordable Solar Energy, America could lose 11,000 jobs if Beijing were to
impose tariffs on American polysilicon. And trade battles between these two
governments could encourage other countries to raise protectionist barriers”38.
37 “http://www.hscpoly.com/content/hsc_comp/Hemlock_Semiconductor_Announcement.aspx” 38 “http://www.wsj.com/articles/SB10001424052702303816504577304841180770350”
40
Data Analysis
Cost-Benefit Analysis – An Overview
Cost-benefit analysis includes five components:
1) The with and without principle
2) Present value
3) Whose benefits and whose costs
4) Quantifying the unquantifiable
5) Allowing for uncertainty
In our data analysis, we will weigh the benefits and costs of United States tariffs placed
on Chinese solar PV module imports.
1) We will first model the relationship between price of solar and quantity demanded
based on observed data gathered from 2004 to 2013. From the data, we will find an
equation for quantity of solar demanded as a function of price. Because the industry
average selling prices are taken from the reported selling prices of each firm’s Form 10-K
or 20-F, the prices exclude US import taxes. Using the equation we derive for quantity
demanded, we will adjust the price by the tariff for 2012 and 2013, since the tariff was
imposed starting in 2012. We will input these new prices into the equation for quantity
demanded, which allows us to calculate and compare revenues with and without tariffs in
2012 and 2013.
41
2) Because the tariffs were imposed in 2012, we will analyze data from 2012 and 2013.
The with and without principle stands on historical data - we will compare revenues with
and without tariffs, both of which can be calculated using our model, for the years 2012
and 2013. We will quantify the costs and benefits we would have received had the tariff
not been imposed at all and compare it to the costs and benefits of having the tariff.
Therefore, present value analysis is not needed for the exercise and as such, there is no
discounting involved.
3) The benefits and costs apply to United States consumers, the United States
government and Chinese producers. Change in revenue will be broken down into the
increase in US government revenue and resulting revenue foregone by Chinese
producers, which aggregates to the total change in revenue due to the imposition of
import tariffs. Other benefits and costs that need to be quantified are the social cost of
using carbon-heavy energy sources rather than solar and the dollar amount of forgone
solar employment salaries in the US, both of which stem from reduced demand due to
higher price of solar with tariffs. By summing the total costs and benefits of revenue
change, social cost of carbon, and forgone US solar job salaries, we will see the net cost
of the imposition of tariffs, in dollars, over the years 2012 and 2013, which allows us to
make an argument for their repeal.
4) Because our analysis relies on historical data, including the historical average selling
price of solar, historical capacity of solar PV modules installed, historical tariff
information and historical quantity of solar jobs, it consists of discrete numbers rather
than ranges, making it so there are no estimates used as inputs in the data analysis.

42
Regarding the social cost of carbon emission, which is seemingly unquantifiable, we use
a published average price per metric ton. We believe using an average is appropriate
because it incorporates a range of estimates from numerous established research
authorities. This idea of using an average also applies to foregone salaries from US solar
jobs, for which we use the median of a large data set of salaries from US solar.
5) Since we are using historical data, much of the uncertainty of the variables we use,
such as the price of modules, installed solar PV capacity, and US solar employment, is
removed. We choose to use past data rather than make future predictions because solar
energy is highly dependent on government incentives, consumer preferences and
geopolitical factors, making it so that it is difficult to accurately estimate future demand
for solar PV modules. This causes limitations in our model for quantity of solar
demanded as a function of its price because it is both subject to historical price trends and
uses price as its only input. Because of this the model cannot account for factors like
consumer taste and the movement for a greener world, which is illustrated in the
deviation between the output quantity demanded of our model for the year 2013,
inclusive of tariff, versus the observed quantity demanded in the US for the year 2013,
inclusive of tariff.

43
Approximating the Demand Curve
From 2004 to 2013, we will take a look at historical data on industry average selling price
of solar and quantity of solar PV module energy demanded in the US. We will then
remove the time variable, and observe how price and quantity relate to one another. We
will treat this as an approximation to the demand curve, and we will calculate a formula
for quantity demanded Q as a function of a given price P.
Price and Year
In order to quantify how tariffs affected the revenue generated from the sale of PV
modules, we must first examine the relationship between the average selling price of PV
modules and the quantity of PV modules demanded at each price level, measured by total
annual installations in the United States in watts. Due to the boom of solar in the early
2000s, many key players in the space went public, particularly Chinese firms. We can
find the average selling price of PV modules by firm within each public firm’s financial
statements. We then aggregate this data to see the trend in falling solar prices by year.
The nine largest key players we used were as follows:
• SunTech Power Holdings Co. (OTCMKTS:STPFQ)
• Trina Solar Limited (NYSE:TSL)
• Hanwha SolarOne Co. Ltd. (NASDAQ:HSOL)
• Yingli Green Energy Hold. Co. Ltd. (NYSE:YGE)
• JinkoSolar Holding Co., Ltd. (NYSE:JKS)
• Canadian Solar Inc. (NASDAQ:CSIQ)
• ReneSola Ltd. (NYSE:SOL)

44
• China Sunergy Co. Ltd. (NASDAQ:CSUN)
• JA Solar Holdings Co., Ltd. (NASDAQ:JASO)
See appendix for business overviews of each firm we analyzed as taken from the 10-
K’s39.
All PV module average selling price (ASP) data is taken from each firm’s Form 10-K or
20-F, based on which country the firm is incorporated in. The data’s range is from the
earliest year in which it is publicly filed by the SEC, typically between 2004 and 2006,
through the most recent year for which it is available.
All average selling price data is displayed in its USD equivalent. In some financial
statements, the ASP is displayed in $US/watt whereas in others it is displayed in a foreign
currency per watt. In order to make conversions where appropriate, the average exchange
rate for the relevant year was used – this number can be found in the exchange rate
section of each financial statement. For example, to convert a 2007 data point in
RMB/watt to $US/watt, we used the conversion factor listed as average “RMB per US
Dollar Noon Buying Rate” for the year 2007. We did not consider the high, low or period
end exchange rate. All numbers are in average selling price of PV modules, as these
constitute the greatest portion of revenue for each firm as compared to the sale of
individual PV wafers.
39 http://www.sec.gov/edgar/searchedgar/companysearch.html
45
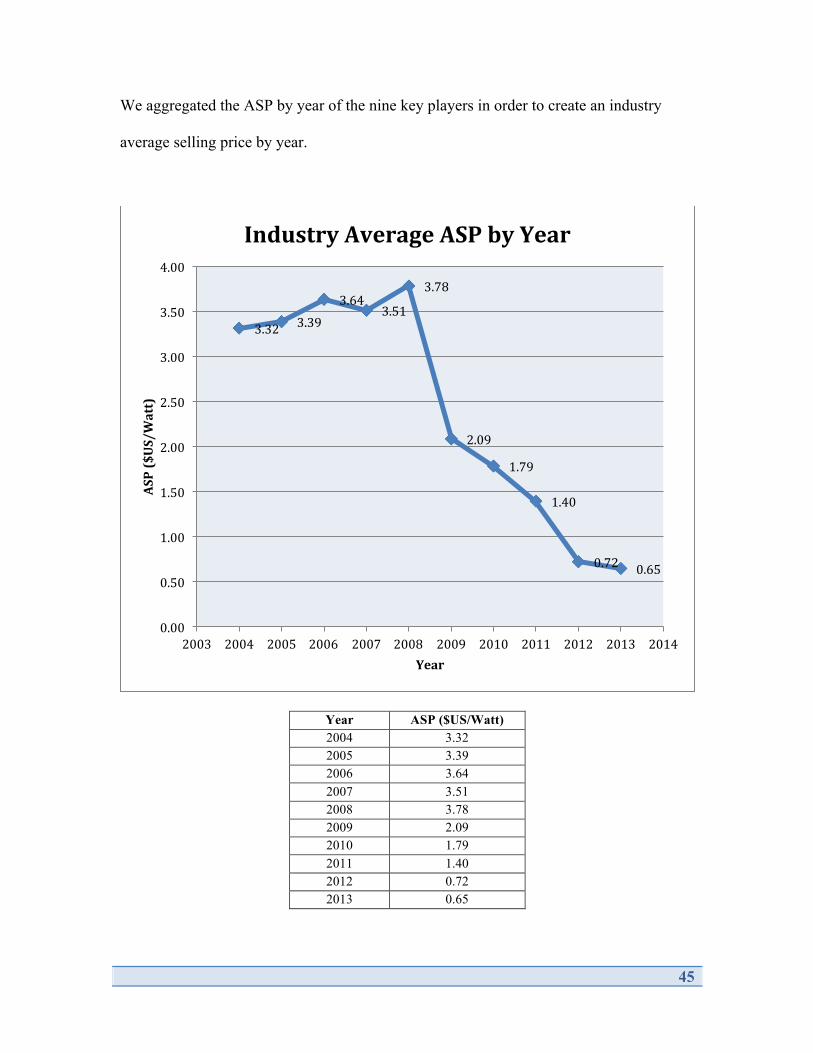
We aggregated the ASP by year of the nine key players in order to create an industry
average selling price by year.
Year ASP ($US/Watt) 2004 3.32 2005 3.39 2006 3.64 2007 3.51 2008 3.78 2009 2.09 2010 1.79 2011 1.40 2012 0.72 2013 0.65
3.32 3.39
3.64 3.51
3.78
2.09
1.79
1.40
0.72 0.65
0.00
0.50
1.00
1.50
2.00
2.50
3.00
3.50
4.00
2003 2004 2005 2006 2007 2008 2009 2010 2011 2012 2013 2014
ASP ($US/Watt)
Year
Industry Average ASP by Year
46
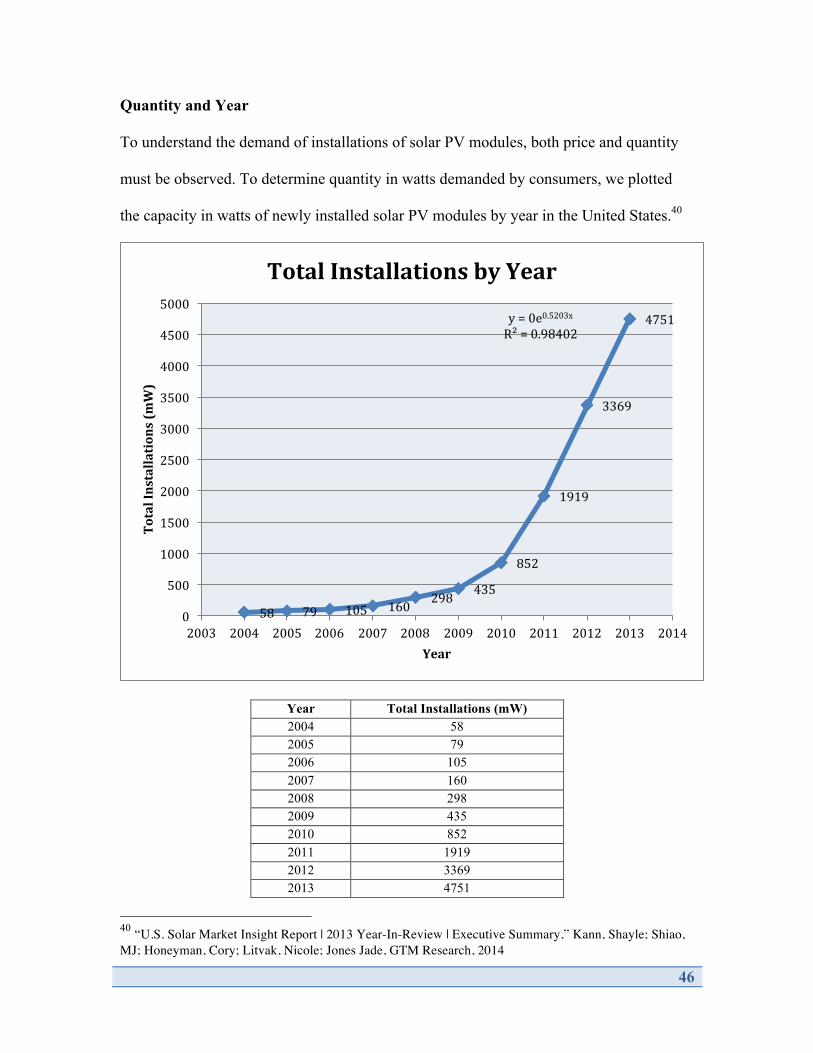
Quantity and Year
To understand the demand of installations of solar PV modules, both price and quantity
must be observed. To determine quantity in watts demanded by consumers, we plotted
the capacity in watts of newly installed solar PV modules by year in the United States.40
Year Total Installations (mW) 2004 58 2005 79 2006 105 2007 160 2008 298 2009 435 2010 852 2011 1919 2012 3369 2013 4751
40 “U.S. Solar Market Insight Report | 2013 Year-In-Review | Executive Summary,” Kann, Shayle; Shiao, MJ; Honeyman, Cory; Litvak, Nicole; Jones Jade, GTM Research, 2014
58 79 105 160 298 435
852
1919
3369
4751 y = 0e0.5203x R² = 0.98402
0
500
1000
1500
2000
2500
3000
3500
4000
4500
5000
2003 2004 2005 2006 2007 2008 2009 2010 2011 2012 2013 2014
Total Installations (mW)
Year
Total Installations by Year

47
Price and Quantity à Demand
Based on the historical data regarding the industry average selling price, we observe that
ASP trends downward as time passes. Meanwhile, as time passes, the capacity of newly
installed solar PV modules trends upward. By aligning capacity demanded and average
selling price by year, we can remove the time variable and see a trend between price and
capacity: as price decreases, the capacity in watts of PV modules demanded increases.
Thus, we have created an approximation of the demand curve of capacity of installed
solar PV modules as a function of their average selling price.
y = 3.2836e-‐4E-‐10x R² = 0.90879
0.00
0.50
1.00
1.50
2.00
2.50
3.00
3.50
4.00
0 1E+09 2E+09 3E+09 4E+09 5E+09
ASP ($US/Watt)
Solar PV Capacity (Watt)
Demand of Solar PV Capacity

48
Total Installations (W) ASP ($US/Watt) 58000000 3.32 79000000 3.39
105000000 3.64 160000000 3.51 298000000 3.78 435000000 2.09 852000000 1.79
1919000000 1.40 3369000000 0.72 4751000000 0.65
Formula of Quantity Demanded as a Function of Price
We applied an exponential regression to this approximation of the demand curve of solar
PV modules in watts because it had the highest correlation coefficient of R2 = 0.90879.
The resulting regression provided us an equation that represented the relationship
between the quantity of solar demanded, in watts, and the average selling price of solar,
in $US/watt. The equation is as follows:
Where P = Average Selling Price of Solar PV Module;
Q = Capacity of Solar PV Module Demanded
e = Euler’s number
This function models price as a function of quantity demanded. However, quantity
demanded as a function of price is more applicable to the real world, so we solve for the
inverse, which is as follows:

49
Where Q = Capacity of Solar PV Module Demanded
P = Average Selling Price of Solar PV Module
We now have quantity demanded as a function of price, so given any input price, we can
estimate the quantity demanded of solar PV capacity.

50
Tariffs
We will analyze the effect of the tariff on total revenue generated in 2012 and 2013. We
will use the tariff amount of 31% because it is about equal to the average of the
countervailing subsidy range of 14.78% – 15.97% and the antidumping subsidy of 47%;
these are the two components of the tariff.
Revenue in 2012 without Tariff
By multiplying an ASP with the quantity demanded at that ASP, we get the total revenue
generated at each selling price. We can now move forward with our analysis in
determining how total solar revenue is impacted by tariffs.
Tariffs were put into place starting in 2012, so with our model and our ASP data from
2012 and 2013, we can compare the total revenue generated in a scenario with tariffs to a
scenario without tariffs for those two years.
For 2012, we have the industry ASP of $0.72/watt. We plug this P into the Q (P) function
above and obtain the total installation amount of 3,793,611,121 watts, or approximately
3,794 megawatts. This yields the total revenue from solar sales in 2012 as
$2,731,400,007 or about $2.73 billion.

51
Revenue in 2012 with Tariff of 31%
Now we consider the case with a tariff of 31%. The average selling price published in
each 10-K and 20-F does not reflect the additional cost of the tariff, so we tack on the
tariff to the industry ASP for 2012 by using the function Q (1.31P). This yields the new
quantity of installations demanded of 3,119 megawatts, which is 17.8% lower since the
tariff causes a greater cost to consumers, driving them to demand fewer units of solar and
use other sources of energy. We then multiply the price with the tariff tacked on by the
new, lower installation quantity demanded and get the total revenue of solar sales with
tariff in 2012 as $2,941,410,020, about $2.94 billion.
Analysis of Revenue Increase
Of the $2.94 billion in revenue, 31%, or about $696 million goes to the US government,
leaving the producers with revenue of $2.25 billion. For 2012, the tariff causes the
producers to lose about $480 million relative to the total solar sales revenue without the
tariff. However, we must note that the total revenue generated with the tariff by both the
government and the producers is greater than without the tariff due to the elasticity of the
equation. We can now quantify the cost of the tariff in terms of total producer revenue
lost from the imposition of the tariff in 2012 by taking the difference of the two total
revenue numbers. Therefore we conclude that in 2012, the total foregone revenue to
producers of solar due to imposition of a tariff – i.e., the opportunity cost – is $486
million.
52
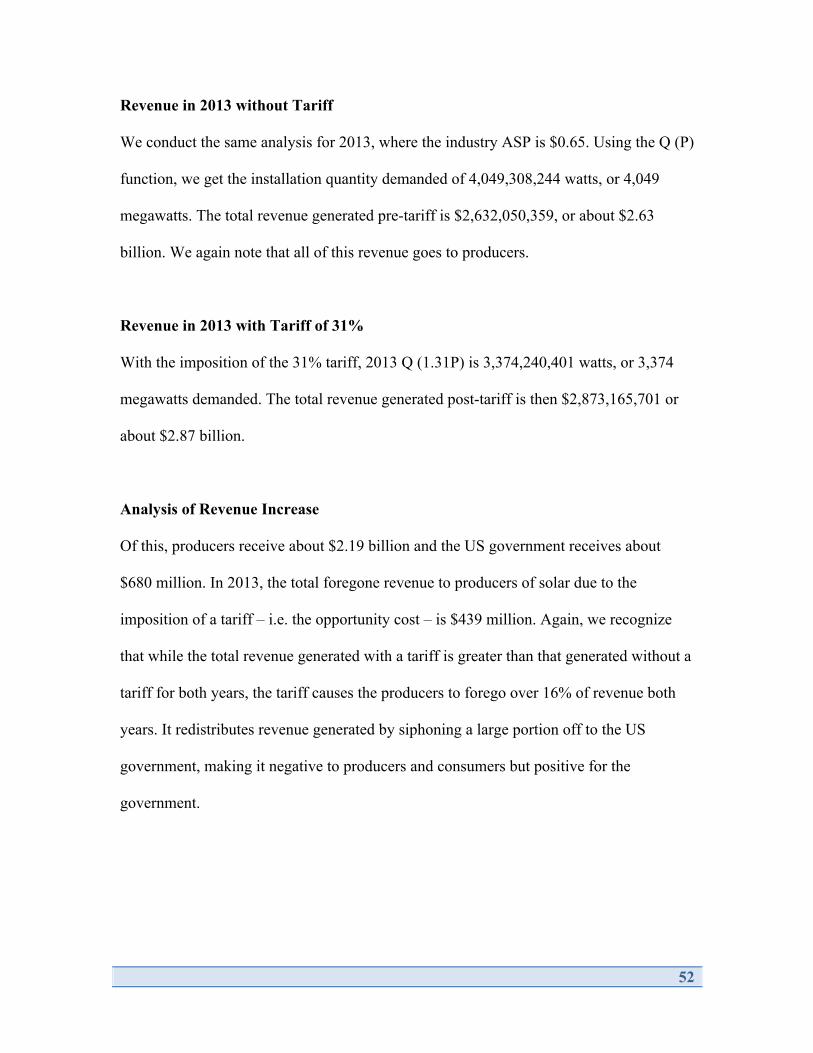
Revenue in 2013 without Tariff
We conduct the same analysis for 2013, where the industry ASP is $0.65. Using the Q (P)
function, we get the installation quantity demanded of 4,049,308,244 watts, or 4,049
megawatts. The total revenue generated pre-tariff is $2,632,050,359, or about $2.63
billion. We again note that all of this revenue goes to producers.
Revenue in 2013 with Tariff of 31%
With the imposition of the 31% tariff, 2013 Q (1.31P) is 3,374,240,401 watts, or 3,374
megawatts demanded. The total revenue generated post-tariff is then $2,873,165,701 or
about $2.87 billion.
Analysis of Revenue Increase
Of this, producers receive about $2.19 billion and the US government receives about
$680 million. In 2013, the total foregone revenue to producers of solar due to the
imposition of a tariff – i.e. the opportunity cost – is $439 million. Again, we recognize
that while the total revenue generated with a tariff is greater than that generated without a
tariff for both years, the tariff causes the producers to forego over 16% of revenue both
years. It redistributes revenue generated by siphoning a large portion off to the US
government, making it negative to producers and consumers but positive for the
government.

53
Final Notes
As a final note, in using the data collected, we must note that the industry ASPs are pre-
tariff and that the total PV capacity of installations/quantity demanded are pre-tariff from
2004 – 2011 and post-tariff for 2012 and 2013. Therefore, there are discrepancies
between the output of quantity demanded equation Q (P) and the observed quantity
demanded in 2012 and 2013. For example, while industry ASP only dropped seven cents
from 2012 to 2013, implying only a 6.7% increase in quantity demanded as per the
model, in the observed numbers of the real world, installation demand actually increased
41% from 2012 to 2013 despite a relatively small price decrease. This demonstrates that
the installation quantity demanded of solar is not only correlated to its price but is also
linked to other variables, such as consumer preferences and the movement for a greener
world.
Calculations
All calculations for years 2012 and 2013 are outlined in the tables that follow:

54
2012: 2013:
Without Tariff ASP ($US/watt) 0.72 Q (P): Installation Quantity Demanded (watts) 3,793,611,121
Revenue Generated ($) 2,731,400,007
With 31% Tariff ASP ($US/watt) 0.9432 Q (1.31 P): Installation Quantity Demanded (watts) 3,118,543,278
Revenue Generated ($) 2,941,410,020
No Tariff v. Tariff Analysis % Change in Quantity Demanded -17.79%
Revenue to producers ($) 2,245,351,160 Revenue to US Government ($) 696,058,860 Loss in Producer Revenue ($) 486,048,847 % Change Producer Revenue -17.79%
Without Tariff
ASP ($US/watt) 0.65 Q (P) - Installation Quantity Demanded (watts) 4,049,308,244
Revenue Generated ($) 2,632,050,359
With 31% Tariff ASP w/ 31% tariff ($US/watt) 0.8515 Q (1.31 P) - Installation Quantity Demanded (watts) 3,374,240,401
Revenue Generated ($) 2,873,165,701
No Tariff v. Tariff Analysis % Change in Quantity Demanded -16.67%
Revenue to producers ($) 2,193,256,261
Revenue to US Gov't ($) 679,909,441 Loss in producer Revenue ($) 438,794,098 % Change Producer Revenue -16.67%
55
Quantifying the Social Cost of Carbon Emissions
The next aspect of our data analysis involves quantifying the social cost of CO2
emissions that result from the tariff being put into place.
Assumptions
1. Whether or not there is a tariff on solar, the same amount of total energy from all
sources is expended.
2. The decrease in watts of solar quantity demanded translates directly to an increase in
the burning of fossil fuel of the same amount of watts
For the purposes of our analysis, we will use two assumptions. The first assumption is
that the same amount of total energy is expended regardless of tariff, so the loss in
quantity of solar demanded is fully replaced by other sources of energy. The second
assumption is the replacement sources of energy solely come from the burning of fossil
fuels. For example, in 2012, the quantity of solar demanded with the tariff is 675,067,843
watts, or 675 megawatts, less than that without the tariff. From Assumption 1, we take as
given the fact that 675 megawatts of energy will be expended through another or a
combination of other sources. From Assumption 2, we will assume that the only other
available source of energy is the burning of fossil fuels. Consequently, using both
assumptions, we come to the conclusion that the loss of 675 megawatts in solar
demanded due to the tariff is completely replenished by 675 megawatts sourced from
burning fossil fuel.

56
Social Cost of Carbon in 2012
For 2012, we gauge the social cost of generating 675 megawatts of energy from the
burning of fossil fuel. According to the IPCC Special Report on Renewable Energy
Sources and Climate Change Mitigation, the 50th percentile of the amount of greenhouse
gas emissions from using coal as an energy source is 1,001 g CO2/kWh, which is
equivalent to 1,001,000 g CO2/mWh. We multiply this by 8,784 hours, as that is the
amount of hours in 2012. This yields 8,792,784,000 g CO2/mW, which we multiply by
675 mW, yielding 5,935,129,200,000 g CO2, which is equivalent to 5,935,129,200 kg
CO2. According to an average of peer-reviewed estimates, the social cost of carbon is
$43/metric ton of carbon, which is equivalent to about $10.75/metric ton of CO2. We
convert 5,935,129,200 kg of CO2 to metric tons and get 5,935,129.2 metric tons. Finally,
to quantify the social cost of CO2 emissions, we multiply by $10.75 and get an answer of
$63,802,638.90 for the year 2012.
We must remember to subtract out the social cost of the emission of greenhouse gas that
comes from the 675 megawatts of solar production, which is significantly lower than that
of the burning of fossil fuel. The 50th percentile of the amount of greenhouse gas
emissions from using solar PV as an energy source is 46 g CO2/kWh41. Following the
same logic as above, we multiply 46,000 g CO2/mWh by 8,784 hours, yielding
404,064,000 g CO2/mW, which we multiply by 675 megawatts to get 272,743.2 metric
tons CO2. We multiply this by $10.75/metric ton CO2 and get an answer of
$2,931,989.40. We remove this from $63,802,638.90 and end up with a 2012 net social 41 Moomaw, W., P. Burgherr, G. Heath, M. Lenzen, J. Nyboer, A. Verbruggen, 2011: Annex II: Methodology. In IPCC: Special Report on Renewable Energy Sources and Climate Change Mitigation (ref. page 10)
57
cost of $60,870,649.50 for the carbon emissions from the burning of fossil fuels rather
than using solar.
Social Cost of Carbon in 2013
Due to the nature of the Q (P) function, for 2013 the amount of energy that needs to be
generated from the burning of fossil fuel is again 675 megawatts, giving us the same
social cost of $60,870,649.50. However, since the forgone solar modules in 2012 have
extended lifetimes, the modules could have been used in 2013. Therefore, the total social
cost of carbon in 2013 is the sum of the social cost of carbon from the loss of solar PV
module capacity demanded in 2012 and in 2013, or $60,870,649.50 + $60,870,649.50.
The total social cost of carbon in 2013, then, is $121,741,299.00.
Total Social Cost of Carbon from Tariffs Installed in 2012
The total social cost of carbon from the loss in solar demanded is the sum of social cost
of carbon in 2012 and total social cost of carbon in 2013, or $60,870,649.50 +
$121,741,299.00. Therefore, the net social cost of the burning of fossil fuels in 2012 and
2013 due to the imposition of a tariff on solar amounts to $182,611,948.50.
58
Countervailing Subsidies (CVD) & Anti-Dumping Duties (AD) Impact on Domestic Employment
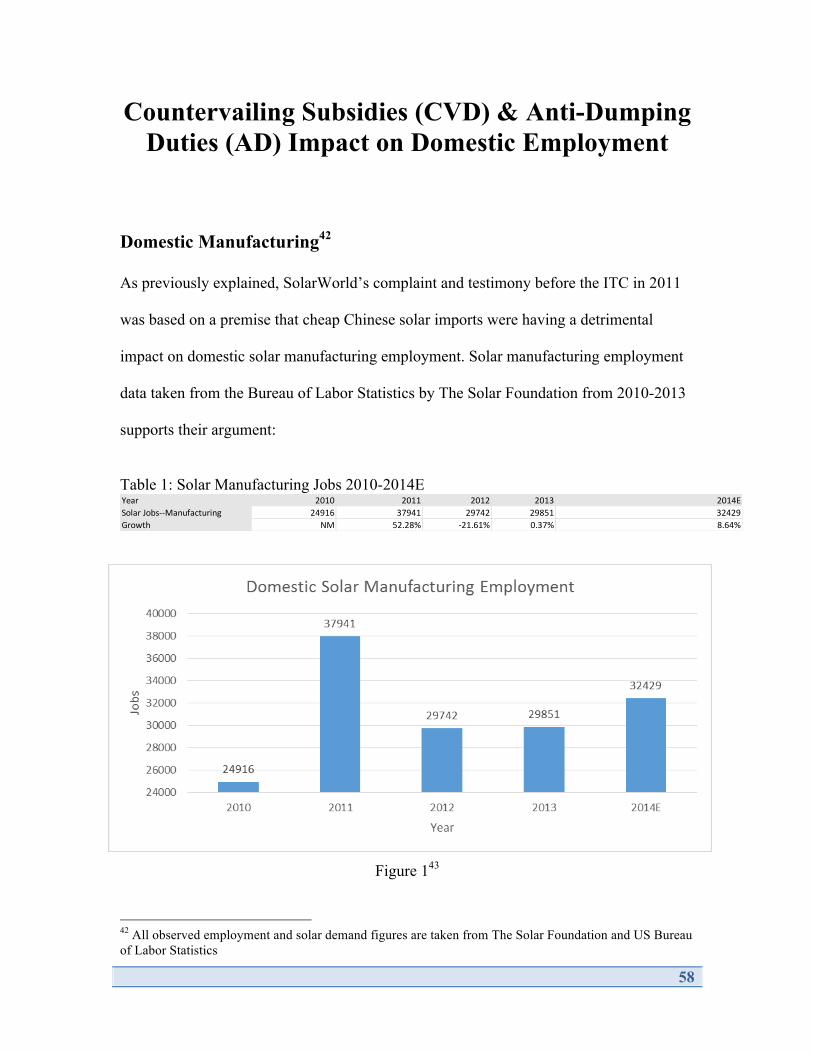
Domestic Manufacturing42
As previously explained, SolarWorld’s complaint and testimony before the ITC in 2011
was based on a premise that cheap Chinese solar imports were having a detrimental
impact on domestic solar manufacturing employment. Solar manufacturing employment
data taken from the Bureau of Labor Statistics by The Solar Foundation from 2010-2013
supports their argument:
Table 1: Solar Manufacturing Jobs 2010-2014E
Figure 143
42 All observed employment and solar demand figures are taken from The Solar Foundation and US Bureau of Labor Statistics
Year 2010 2011 2012 2013 2014ESolar Jobs-‐-‐Manufacturing 24916 37941 29742 29851 32429Growth NM 52.28% -‐21.61% 0.37% 8.64%

59
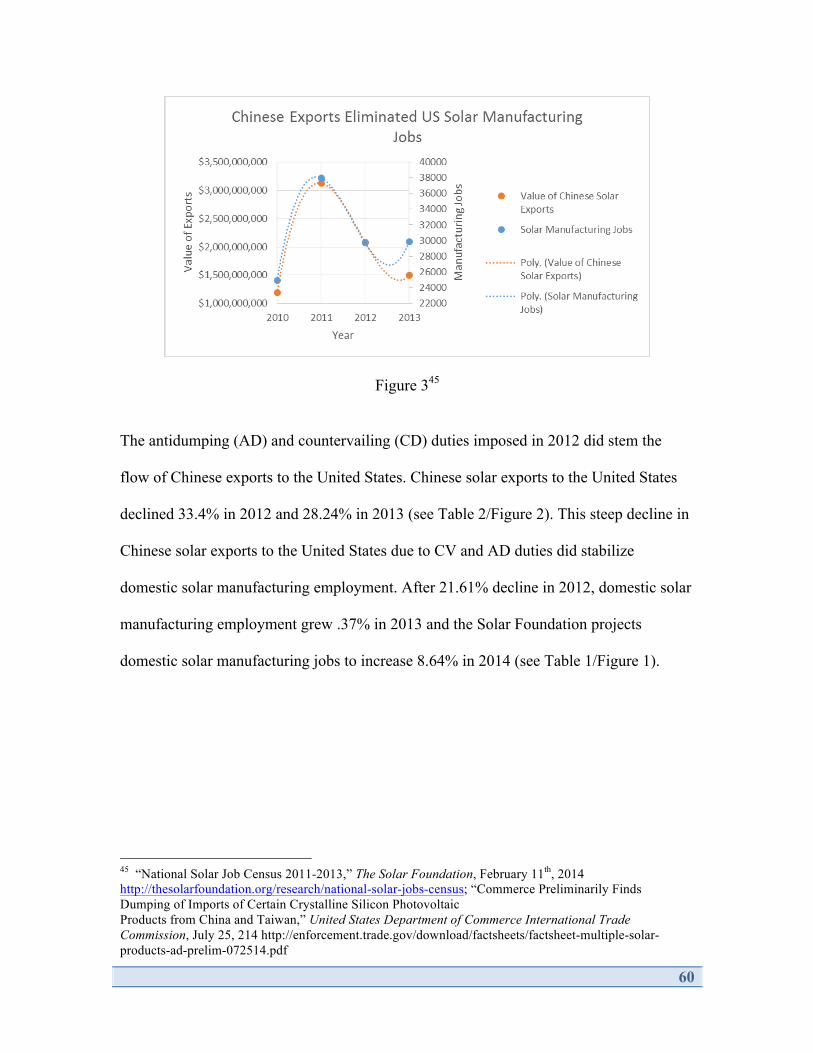
Table 2: Value of Chinese Solar Exports to the United States 2010-2013
Figure 244
Data shows the number of solar manufacturing jobs declined sharply (21.61%) between
2011 and 2012 (see Table 1/Figure 1). This reduction in employment corresponds to the
surge in Chinese exports to the United States from 2010-2011 (162.05%) (see Table
2/Figure 2/Figure 3). Domestic solar manufacturing firms shed jobs in 2011-2012 after
the sharp rise in Chinese exports the previous year and subsequent downward pricing
pressure.
43 “National Solar Job Census 2011-2013,” The Solar Foundation, February 11th, 2014 http://thesolarfoundation.org/research/national-solar-jobs-census 44 “Commerce Preliminarily Finds Dumping of Imports of Certain Crystalline Silicon Photovoltaic Products from China and Taiwan,” United States Department of Commerce International Trade Commission, July 25, 214 http://enforcement.trade.gov/download/factsheets/factsheet-multiple-solar-products-ad-prelim-072514.pdf
Year 2010 2011 2012 2013Value of Chinese Solar Exports $1,192,340,000 $3,124,578,000 $2,082,753,000 $1,494,531,000Growth NM 162.05% -‐33.34% -‐28.24%
60
Figure 345
The antidumping (AD) and countervailing (CD) duties imposed in 2012 did stem the
flow of Chinese exports to the United States. Chinese solar exports to the United States
declined 33.4% in 2012 and 28.24% in 2013 (see Table 2/Figure 2). This steep decline in
Chinese solar exports to the United States due to CV and AD duties did stabilize
domestic solar manufacturing employment. After 21.61% decline in 2012, domestic solar
manufacturing employment grew .37% in 2013 and the Solar Foundation projects
domestic solar manufacturing jobs to increase 8.64% in 2014 (see Table 1/Figure 1).
45 “National Solar Job Census 2011-2013,” The Solar Foundation, February 11th, 2014 http://thesolarfoundation.org/research/national-solar-jobs-census; “Commerce Preliminarily Finds Dumping of Imports of Certain Crystalline Silicon Photovoltaic Products from China and Taiwan,” United States Department of Commerce International Trade Commission, July 25, 214 http://enforcement.trade.gov/download/factsheets/factsheet-multiple-solar-products-ad-prelim-072514.pdf

61
Overall Domestic Solar Employment Is Not Dependent on
Manufacturing
While those advocates of AD and CV duties were correct that Chinese solar exports to
the United States were leading to many foregone domestic manufacturing jobs in the
United States, the employment argument is misleading. Even in 2011, the high-water
mark of domestic solar manufacturing, solar employment related to manufacturing
represented roughly 36% of total jobs in the solar employment sector. That same year, the
largest subsector was installation, which comprised 46.28% of total jobs in the solar
employment sector (see Figure 4).
Table 3: Solar Industry Jobs by Subsector
Subsector Installation Manufacturing Sales and Distribution Project Development Other Total2010 Jobs 43934 24916 11744 N/A 12908 935022011 Jobs 48656 37941 13000 N/A 5548 1051452012 Jobs 57177 29742 16005 7988 8105 1190172013 Jobs 69658 29851 19771 12169 11248 1426982014 Jobs (Projected) 84331 32429 22585 12529 13064 164938
62
Figure 446
Figure 5
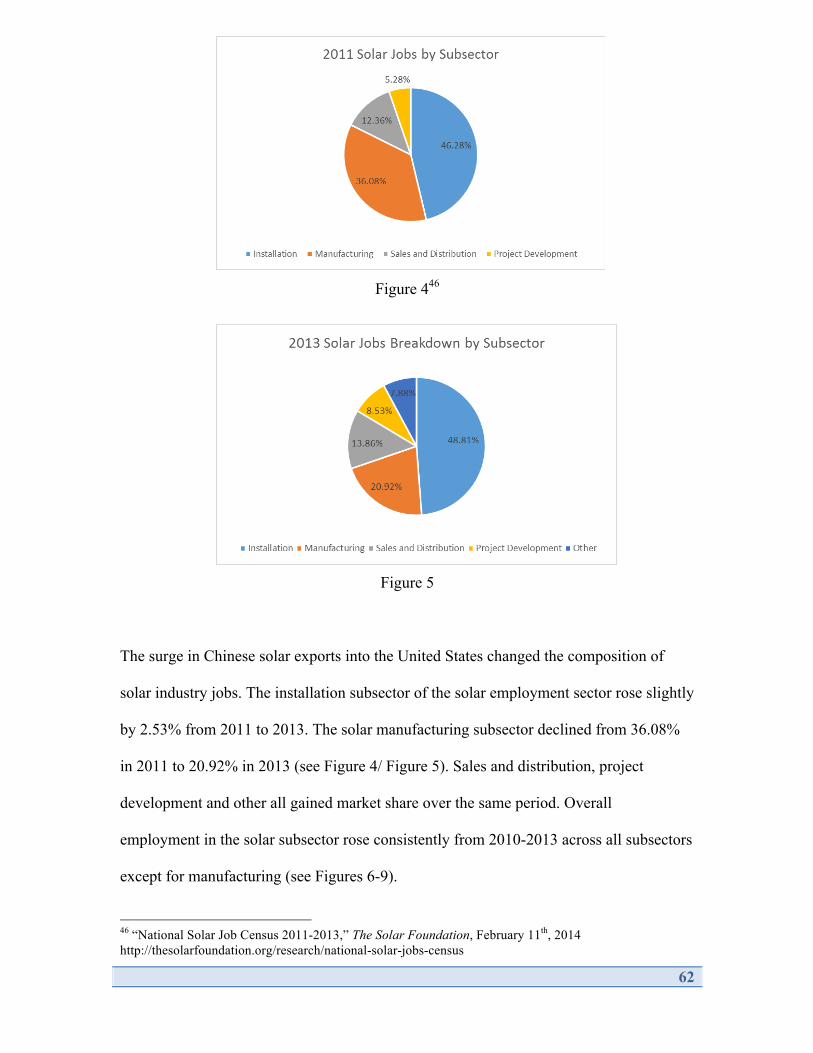
The surge in Chinese solar exports into the United States changed the composition of
solar industry jobs. The installation subsector of the solar employment sector rose slightly
by 2.53% from 2011 to 2013. The solar manufacturing subsector declined from 36.08%
in 2011 to 20.92% in 2013 (see Figure 4/ Figure 5). Sales and distribution, project
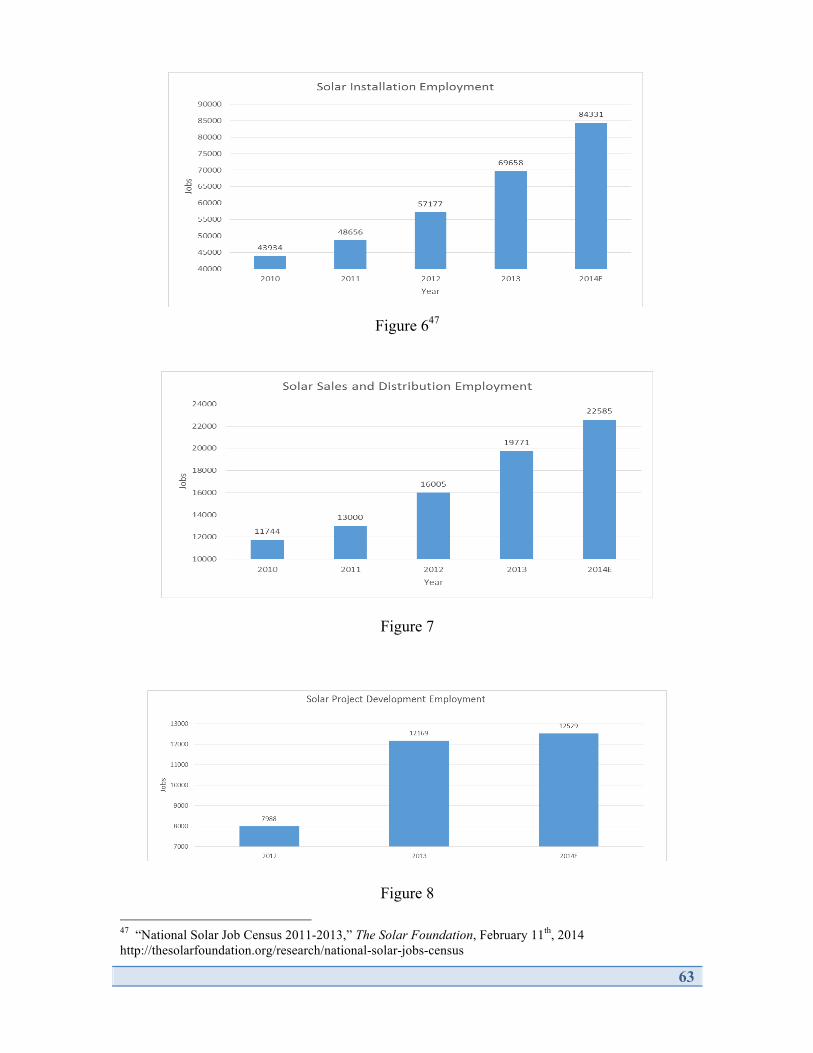
development and other all gained market share over the same period. Overall
employment in the solar subsector rose consistently from 2010-2013 across all subsectors
except for manufacturing (see Figures 6-9).
46 “National Solar Job Census 2011-2013,” The Solar Foundation, February 11th, 2014 http://thesolarfoundation.org/research/national-solar-jobs-census
63
Figure 647
Figure 7
Figure 8 47 “National Solar Job Census 2011-2013,” The Solar Foundation, February 11th, 2014 http://thesolarfoundation.org/research/national-solar-jobs-census
64
Figure 9
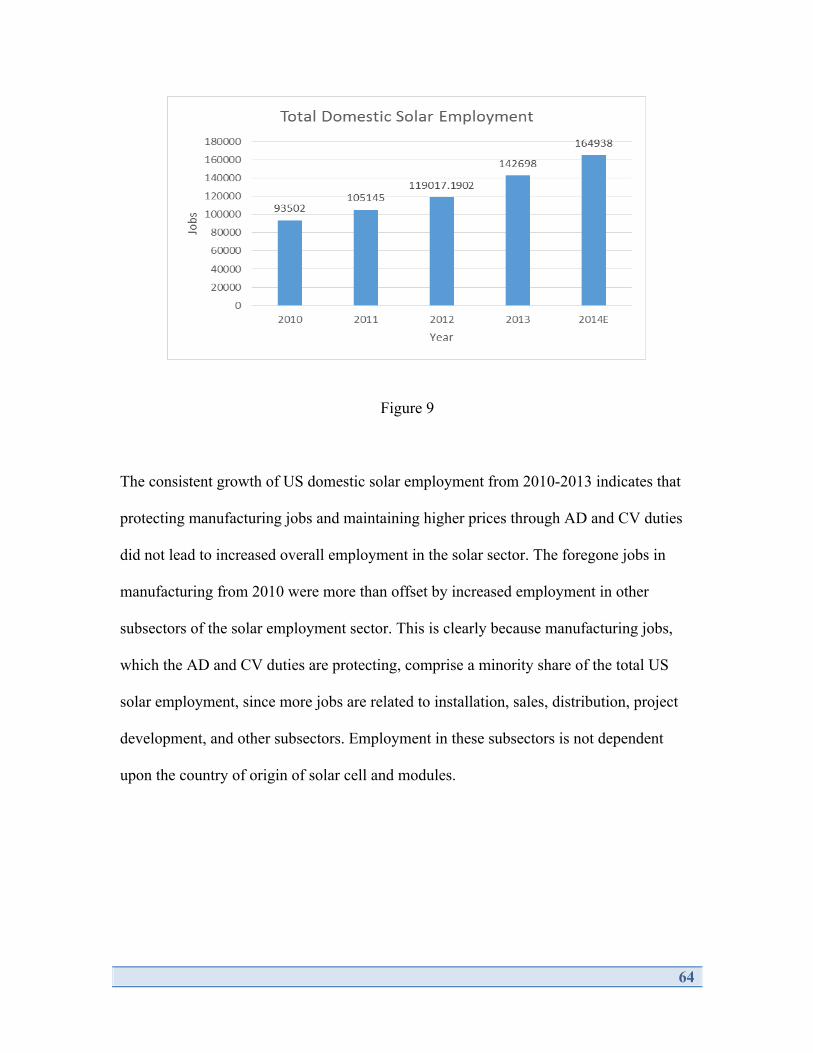
The consistent growth of US domestic solar employment from 2010-2013 indicates that
protecting manufacturing jobs and maintaining higher prices through AD and CV duties
did not lead to increased overall employment in the solar sector. The foregone jobs in
manufacturing from 2010 were more than offset by increased employment in other
subsectors of the solar employment sector. This is clearly because manufacturing jobs,
which the AD and CV duties are protecting, comprise a minority share of the total US
solar employment, since more jobs are related to installation, sales, distribution, project
development, and other subsectors. Employment in these subsectors is not dependent
upon the country of origin of solar cell and modules.

65
Demand for Solar Products is Correlated with Employment
As has been previously explained, data shows that price and demand of solar products
have an inverse relationship: the lower the cost of the products, the higher the demand (as
expected). Thus, the downward pricing pressure from Chinese products increased
demand for solar products. Section II explained that overall employment in the solar
sector is not dependent upon domestic solar manufacturing jobs.
Rather, our data analysis shows that domestic solar employment is most strongly
correlated to overall domestic demand of solar products (see Figure 10).
Figure 10
Demand for solar grew fastest in 2011 as a result of the downward pricing pressure on
solar products from the surge in Chinese exports and the addition of new solar incentive
policies. As expected, demand growth for solar slowed in 2012 and 2013 following the
imposition of AD and CV duties in 2012 (see Figure 11).
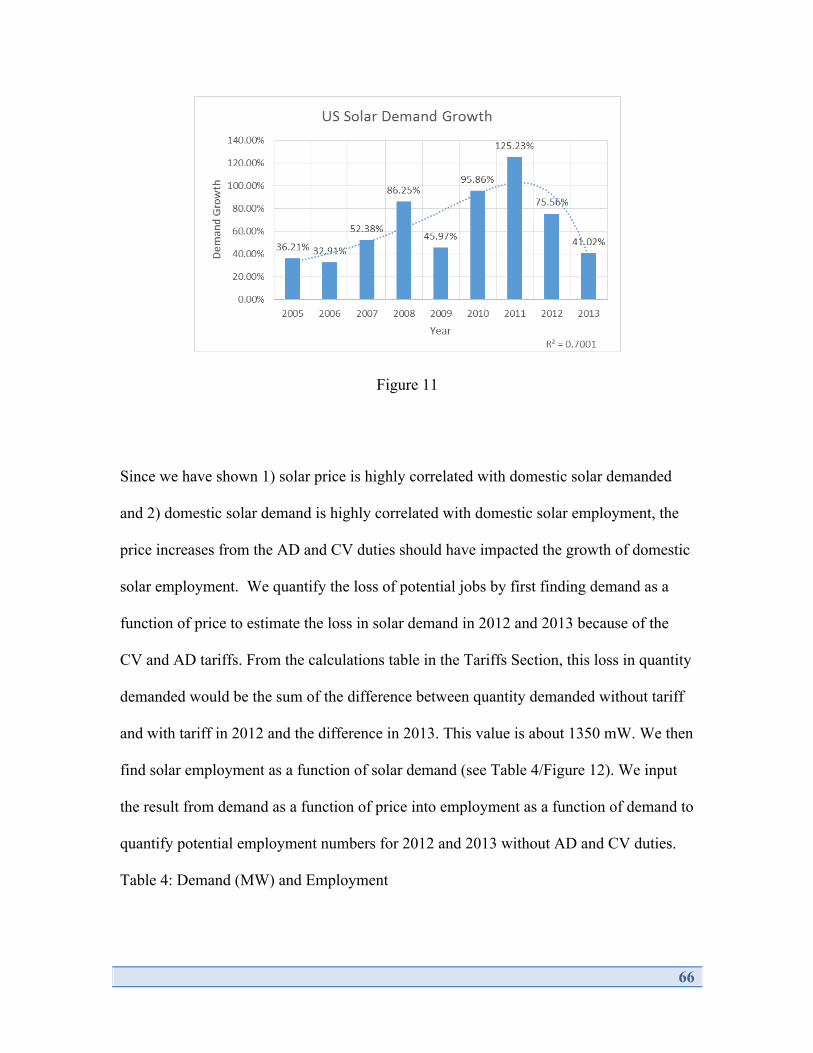
66
Figure 11
Since we have shown 1) solar price is highly correlated with domestic solar demanded
and 2) domestic solar demand is highly correlated with domestic solar employment, the
price increases from the AD and CV duties should have impacted the growth of domestic
solar employment. We quantify the loss of potential jobs by first finding demand as a
function of price to estimate the loss in solar demand in 2012 and 2013 because of the
CV and AD tariffs. From the calculations table in the Tariffs Section, this loss in quantity
demanded would be the sum of the difference between quantity demanded without tariff
and with tariff in 2012 and the difference in 2013. This value is about 1350 mW. We then
find solar employment as a function of solar demand (see Table 4/Figure 12). We input
the result from demand as a function of price into employment as a function of demand to
quantify potential employment numbers for 2012 and 2013 without AD and CV duties.
Table 4: Demand (MW) and Employment

67
Table 4: Demand (MW) and Employment
Figure 12
The demand as a function of price model projects a 31.7% demand increase for solar
panels in 2012 and a 7.60% increase in demand in 2013 (see Figure 13). These
projections differ from the observed demand increases for the same period (see Table 5).
This is likely due to the limitations of a one-variable model in predicting demand. Other
factors besides price, such as consumer taste and government regulations, have big
impacts on demand in the real world. Solar demand is especially susceptible to
government incentives/regulation and consumer taste.
2010 2011 2012 2013Demand (MW) 852 1919 3369 4751
Solar Jobs 93502 105145 119017 142698
y = 0.0013x2 + 4.8496x + 89155R² = 0.9952
90000
100000
110000
120000
130000
140000
150000
0 1000 2000 3000 4000 5000
Jobs
Demand (MW)
Employment as a Function of Demand
Solar Jobs
Poly. (Solar Jobs)

68
Figure 13
Table 5: Projected vs. Observed Soar Demand Growth (%)
To more accurately project demand, we add the difference between observed and
projected to our model’s forecasted solar demand growth for 2012 and 2013 in a scenario
with no CV and AD tariffs.
y = 3.2836e-‐4E-‐10x R² = 0.90879
0.00
0.50
1.00
1.50
2.00
2.50
3.00
3.50
4.00
0 1E+09 2E+09 3E+09 4E+09 5E+09
ASP ($US/Wa+
)
Solar PV Capacity (Wa+)
Demand of Solar PV Capacity
Projected Observed Difference2012 31.70% 75.56% 43.86%2013 7.60% 41.02% 33.42%

69
Table 6: Solar Demand (MW) Growth Assumptions
To find solar demand without AD and CV duties in 2012 and 2013, we apply solar
growth assumptions to 2010 and 2011 observed numbers. We use the results as x value
inputs for the employment as a function of demand equation (see Figure 12) to yield
estimated employment.
Table 7: Estimated Solar Demand (MW) for 2012 and 2013 without CV and AD
Measures
We then solve for the net difference in jobs due to the CV and AD measures by matching
the employment outcomes without tariffs (see Table 7) to the observed employment
outcomes with tariffs.
Projected Difference Total2012 78.0% 43.86% 121.86%2013 6.74% 33.42% 40.16%
Year Demand Growth Jobs Growth2010 852 95.86% 93502 NM2011 1919 125.23% 105145 12.45%2012 4257 121.86% 133358 26.83%2013 5967 40.16% 164379 23.26%
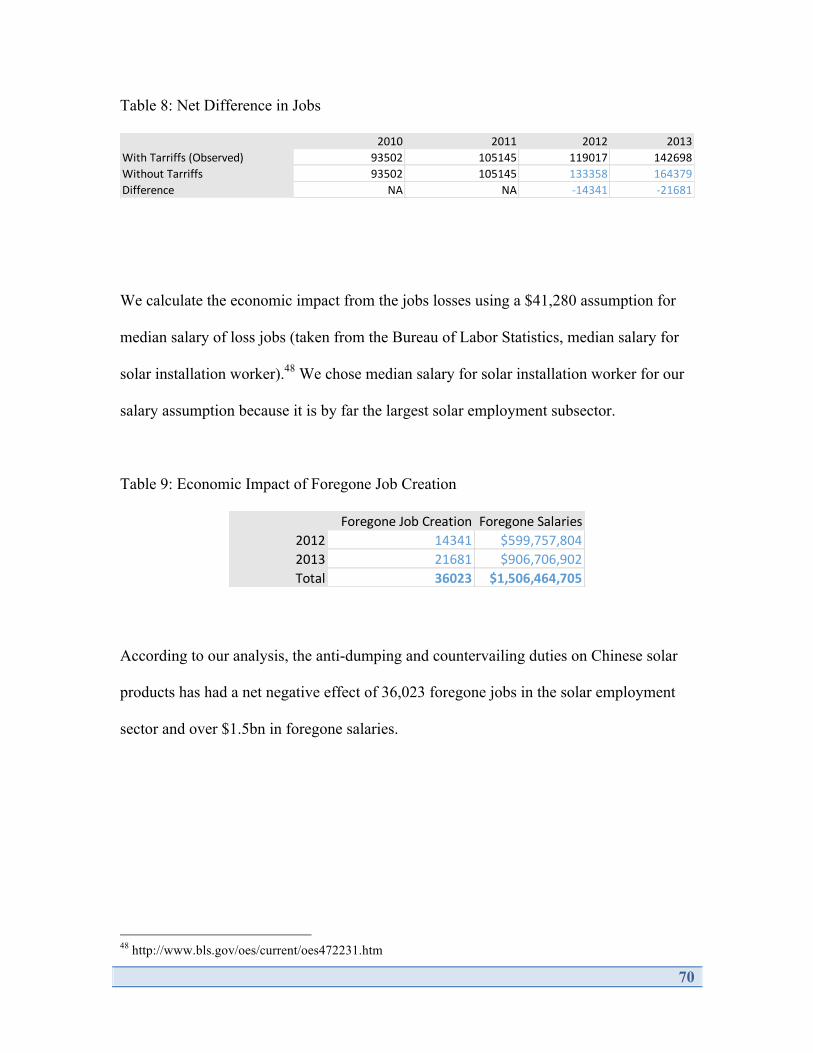
70
Table 8: Net Difference in Jobs
We calculate the economic impact from the jobs losses using a $41,280 assumption for
median salary of loss jobs (taken from the Bureau of Labor Statistics, median salary for
solar installation worker).48 We chose median salary for solar installation worker for our
salary assumption because it is by far the largest solar employment subsector.
Table 9: Economic Impact of Foregone Job Creation
According to our analysis, the anti-dumping and countervailing duties on Chinese solar
products has had a net negative effect of 36,023 foregone jobs in the solar employment
sector and over $1.5bn in foregone salaries.
48 http://www.bls.gov/oes/current/oes472231.htm
2010 2011 2012 2013With Tarriffs (Observed) 93502 105145 119017 142698Without Tarriffs 93502 105145 133358 164379Difference NA NA -‐14341 -‐21681
Foregone Job Creation Foregone Salaries2012 14341 $599,757,8042013 21681 $906,706,902Total 36023 $1,506,464,705
71
Analysis of Effects on Employment
We have shown that DOC imposed CVD and AD duties have had a net negative impact
on solar employment in the United States. We have shown why this argument is based on
a misleading premise: most solar jobs are not in manufacturing. Furthermore, they are
correlated with overall solar demand, which in turn is correlated to the price of solar. This
explains why CVD and AD duties that increase the price of solar and reduce demand
have had a net negative impact on job creation. The net negative impact on solar job
creation is even greater than the reduction in revenues from solar demand for solar cell
and module firms and the social cost of carbon emissions for 2012 and 2013.
This finding is significant and surprising because the proponents of the trade measures
main argument was the surge of low-cost Chinese solar exports to the United States was
having an adverse effect of on domestic solar employment. Instead, we have shown the
polices have protected the solar manufacturing subsector at the expense of other
subsectors of the solar employment sector, such as installation, distribution, sales, and
project development.
This paradox likely results from the power of well organized, special interest groups like
The Coalition for American Solar Manufacturing (CASM) in a democratic political
system like the United States. While the policies they advocate have a net negative
impact on the economy as a whole, they are more incentivized to commit a large portion
of their resources to favorable policy outcomes that protect domestic manufacturing than
the rest of the solar employment sector and the US economy as a whole.

72
Aggregate Cost-Benefit Analysis
With all of the above calculations, we are now able to aggregate our data to calculate the
net cost of the tariffs based on our models. After the imposition of the tariff, we examined
the total revenue lost by producers, the total revenue generated by the US government,
the social cost of carbon emissions from using fossil fuel as an energy source less the
social benefit of foregoing carbon emissions from solar and the economic impact of
foregone solar job creation in the United States due to the lower growth rate in 2012 and
2013 demand resulting from the tariffs. We quantify this below:
2012
Costs
Foregone revenue to producers: $486,048,847.00
Social cost of carbon emissions – fossil fuel: $127,605,277.80
Economic impact of foregone job creation – US solar: $599,757,804.00
Benefits
Revenue to US government: $696,058,860.00
Foregone social cost of carbon emissions – PV modules: $5,863,978.80
Total
696,058,860.00 + 5,863,978.80 – 486,048,847.00 – 127,605,277.80 – 599,757,804.00
= -$511,489,090.00 à The net effect is a cost of $511,489,090.00

73
2013
Costs
Foregone revenue to producers: $438,794,038.00
Social cost of carbon emissions – fossil fuel: $63,802,638.90
Economic impact of foregone job creation – US solar: $906,706,902.00
Benefits
Revenue to US government: $679,909,441.00
Foregone social cost of carbon emissions – PV modules: $2,931,989.40
Total
$678,909,441.00 + $2,931,989.40 - $438,794,038.00 - $63,802,638.90 - $906,706,902.00
= -$727,462,148.50 à The net effect is a cost of $727,462,148.50
Total Cost = 2012 Cost + 2013 Cost = $511,489,090.00 + $727,462,148.50
Total Cost of Tariffs = $1,238,951,238.50
74
Conclusion: Policy Recommendation
Due to these findings, we believe the tariffs on US imports of Chinese solar should be
repealed as they have a foregone economic and social benefit of about $1.24 billion in
2012 and 2013.
Additionally, as we can see from the preliminary findings by the DOC and ITA against
Chinese and now Taiwanese solar producers responses in the recent 2014 Fact Sheet49,
when Chinese manufacturers have tariffs imposed directly upon them, they have partially
circumvented them by sourcing their products from different jurisdictions (Taiwan in this
case). Prices continue rising due to the increased restrictions presented by the updated
2014 tariffs, but not enough to increase domestic manufacturing jobs. Regardless of
whether Chinese solar producers successfully circumvent the new tariffs, the new policy
will continue to slow the decline in solar prices, leading to further foregone demand and
foregone job in the solar employment sector. The foregone demand will also continue to
produce a social cost from the foregone reduction in carbon emissions.
49 Dept. of Commerce & Int’l Trade Admin., Fact Sheet: Commerce Preliminarily Finds Dumping of Imports of Certain Crystalline Silicon Photovoltaic Products from China and Taiwan (July 25, 2014)

75
Appendix
SunTech Power Holdings Co.
“We are one of the leading PV solar manufacturers in the world as measured by
production output and deliveries in 2011, with leading positions in key solar
markets. Since we commenced business operations in May 2002, we have grown rapidly
to become the world’s largest manufacturer of PV cells and modules, based on
production output and deliveries worldwide for residential, commercial, and utility-scale
power plant customers. In 2011 we sold and delivered our 25 millionth PV module. As a
key player in the PV industry, we design, develop, manufacture and market a variety of
PV modules and cells. We also provide PV system integration services to customers in
certain regions, and are expanding our support services for utility scale PV systems.
We sell our products in various key solar energy markets worldwide including
Germany, Italy, Spain, France, Benelux, Greece, the United States, Canada, China, the
Middle East, Australia and Japan. We currently sell our products primarily through a
select number of value-added resellers, such as distributors and system integrators, as
well as to end users, such as project developers, that have particular expertise and
experience in a given geographic or applications market. In addition to regional
headquarter offices in Schaffhausen, Switzerland, and San Francisco, California, we also
have sales and customer support offices in Germany, France, Italy, Spain, Netherlands,
Greece, Australia, Japan, Korea, and the United Arab Emirates. We believe that our local

76
sales offices enhance our ability to localize customer service and support, which help
foster closer relationships with our key customers.”
Trina Solar Limited
“We are a large-scale integrated solar-power products manufacturer and solar system
developer based in China with a global distribution network covering Europe, Asia,
North America, Australia and Africa. Since we began our solar-power products business
in 2004, we have integrated the manufacturing of ingots, wafers and solar cells for use in
our PV module production. Our PV modules provide reliable and environmentally
friendly electric power for residential, commercial, industrial and other applications
worldwide. We also develop, design, construct and sell solar power projects that
primarily use the solar modules we manufacture.
We produce standard monocrystalline PV modules ranging from between 205 watts, or
W, and 215 W to between 260 W and 270 W in power output and multicrystalline PV
modules ranging from 240 W to 310 W in power output. We build our PV modules to
general specifications, as well as to our customers’ and end-users’ specifications. We sell
and market our products worldwide, including China, the United States and Germany,
where government incentives have accelerated the adoption of solar power. In recent
years, we have also increased our sales in newer and emerging solar power markets,
which include the United Kingdom, India, Australia and Japan, as well as other markets
in Asia, Africa, the Middle East, Latin America, and the Caribbean Islands. We have
77
established regional headquarters and offices located in Europe, North America and Asia
to target sales and distribution in those markets. We primarily sell our products to
wholesalers, power plant developers and operators and PV system integrators, including
Solar City, TEBA Sunoasis Co., Ltd., Anesco Limited, Sanshin Electronics Co., Ltd., and
China Huadian Engineering Co., Ltd.”
Hanwha SolarOne Co. Ltd.
“We are a vertically integrated manufacturer of silicon ingots, silicon wafers, PV cells
and PV modules in China. We manufacture a variety of silicon ingots, silicon wafers, PV
cells and PV modules using advanced manufacturing process technologies that have
helped us to rapidly increase our operational efficiency. We also provide PV module
processing services. We sell PV cells and PV modules both directly to system integrators
and through third party distributors. In 2013, we sold our products to over 250 customers,
mostly in Japan, South Africa, Germany, China, the United States, Korea, Canada and the
United Kingdom. We conduct our business in China primarily through SolarOne
Qidong.”
Yingli Green Energy Hold. Co. Ltd.
“We are the largest vertically integrated photovoltaic, or PV, module supplier in the
world in terms of shipments of PV modules in 2013 based on public information. As of
the date of this annual report, we have an annual nameplate capacity of 2,450 megawatts
covering most of photovoltaic value chain from ingot casting and wafering through PV

78
cell production and PV module assembly. As a result of our efforts in continuous
technology innovations at all levels of our operation and progressive equipment upgrade,
our overall actual manufacturing utilization rate was able to exceed 100% as of the date
of this annual report based on various conditions, such as market demand and our
inventory. We believe that our actual annual manufacturing capacity for PV modules can
reach approximately 4,000 megawatts for 2014. Our current products and services
substantially cover the entire PV industry value chain, ranging from crystalline
polysilicon ingots and wafers, PV cells and PV modules to the manufacture of PV
systems and the installation of PV systems, and starting from 2012, to development and
operation of solar projects. We believe we are one of the largest PV companies in the
world to have adopted a vertically integrated business model. Our end-products include
PV modules and PV systems in different sizes and power outputs. We sell PV modules
under our own brand names, Yingli and Yingli Solar, to PV system integrators and
distributors located in various markets around the world, including China, the United
States, Germany, Greece, Spain, Italy, France, India, Japan, the Netherlands, the United
Kingdom, Israel, South Korea and Belgium.”
JinkoSolar Holding Co., Ltd.
“We are a global leader in the PV industry based in Jiangxi and Zhejiang Provinces in
China. We have built a vertically integrated solar power product value chain, from
recovering silicon materials to manufacturing solar modules and solar project
development. We sell most of our solar modules under our own “JinkoSolar” brand, with
a small portion of solar modules on an OEM basis. We also sell silicon wafers and solar

79
cells not used in our solar module production. Leveraging our expertise in manufacturing
high quality solar modules and our experience in the PV industry, we also develop PV
projects in China and provide solar system integration services. As of December 31,
2013, our share of completed solar projects amounted to 213 MW, with annual power
generation capacity approaching 324 million kWh.
We sell our products in major export markets and China. We have established
subsidiaries in a number of strategic markets, including Germany, Italy, Switzerland,
Canada, the United States, Japan, Australia, India and South Africa, to conduct sales,
marketing and brand development for our products in Europe and around the world. We
also opened offices in and began to ship our products to Japan and South Africa in 2013.
As of December 31, 2013, we had an aggregate of more than 200 customers for our solar
modules globally, including distributors, project developers and system integrators.”
Canadian Solar Inc.
“We are one of the world's largest and foremost solar power companies. We are a leading
vertically integrated provider of solar power products and system solutions with
operations in North America, South America, Europe, Africa, the Middle East, Australia
and Asia.
We design, develop, and manufacture solar wafers, cells and solar power products. Our
solar power products include standard solar modules and specialty solar products. We are

80
incorporated in Canada and conduct most of our manufacturing operations in China. Our
products include a range of solar modules built to general specifications for use in a wide
range of residential, commercial and industrial solar power generation systems. Specialty
solar products consist of customized solar modules that our customers incorporate into
their own products and complete specialty products, such as portable solar home systems.
We sell our products primarily under our "Canadian Solar" brand name.”
ReneSola Ltd.
“We are a leading global brand and technology provider as well as manufacturer of solar
power products based in China. Capitalizing on proprietary technologies, economies of
scale, low cost production capabilities, technical innovations and know-how and
leveraging our in-house polysilicon, wafer and module manufacturing capabilities, we
provide our customers with high quality, cost competitive solar power products and
processing services. We provide high quality solar power products to a global network of
suppliers and customers, which includes leading global manufacturers of solar cells and
modules and distributors, installers and end users of solar modules.
We have significantly expanded our business scope from primarily solar wafer
manufacturing to manufacturing of polysilicon and solar modules, as well as ventured
into the solar power plant business. We believe our vertically integrated model and
integrated manufacturing capabilities allow us to ensure the quality of our solar power
products and reduce our reliance on the quality assurances of third-party suppliers.
Moreover, the vertical integration allows us to gain an early understanding of trends in
81
PV products pricing, better anticipate market conditions, as well as take advantage of
market opportunities more quickly and efficiently.”
China Sunergy Co. Ltd.
“We manufacture and sell solar cell and solar module products that convert sunlight into
electricity for a variety of uses. We also invest in, develop and operate solar power
projects. Historically, we primarily manufactured solar cells from silicon wafers utilizing
crystalline silicon solar cell technology to convert sunlight directly into electricity
through a process known as the photovoltaic effect. In the fourth quarter of 2010, as part
of our business strategy to achieve more vertical integration, we acquired SST and NRE,
two solar module manufacturers, from a related party, and began engaging in
manufacturing and sales of solar modules. Since then, most of our solar cells have been
used for the production of solar modules. Solar modules are arrays of interconnected
solar cells encased in a weatherproof frame. Currently our principal end-products are
solar modules in different sizes and power outputs but we also manufacture and sell solar
cells of various specialties. Currently, we sell solar cells and modules under the brands of
“CSUN”.”
JA Solar Holdings Co., Ltd.
“Our primary business is to design, develop, manufacture and sell solar cell and module
products that convert sunlight into electricity for a variety of uses. Historically, we
primarily engaged in the manufacturing and sales of solar cells. Since 2009, we have
82
expanded our business to the manufacturing and sales of solar modules as well as silicon
wafer manufacturing. Our principal products consist of both monocrystalline and
multicrystalline solar cells and solar modules in a variety of standards and specialties. We
sell our products mainly under our “JA Solar” brand name, and also produce original
equipment for manufacturers or customers, known as OEMs, under their brand names.
We also started to engage in project development activities in 2013.
We began commercial production of solar cells in April 2006 and have since grown
rapidly to become one of the world’s largest manufacturers of solar cells, according to
NPD Solarbuzz, an independent third-party solar energy consultancy. As of
December 31, 2013, we had a solar cell manufacturing capacity of 2.5 GW per annum.
We manufacture solar cells from silicon wafers utilizing crystalline silicon technology,
which converts sunlight into electricity through a process known as PV effect.
Performance of solar cells is primarily measured by their conversion efficiency rate, the
percentage that sunlight energy is converted into electricity. As of December 31, 2013,
the average conversion efficiency rates of our mainstream monocrystalline and
multicrystalline solar cells were 19.4% and 17.9%, respectively.”
Some notable solar producers for which the relevant data was not available are:
• First Solar (NASDAQ:FSLR)
• SunEdison (NYSE:SUNE)
• SunPower (NASDAQ:SPWR)
• SolarWorld (OTCMKTS:SRWRY)
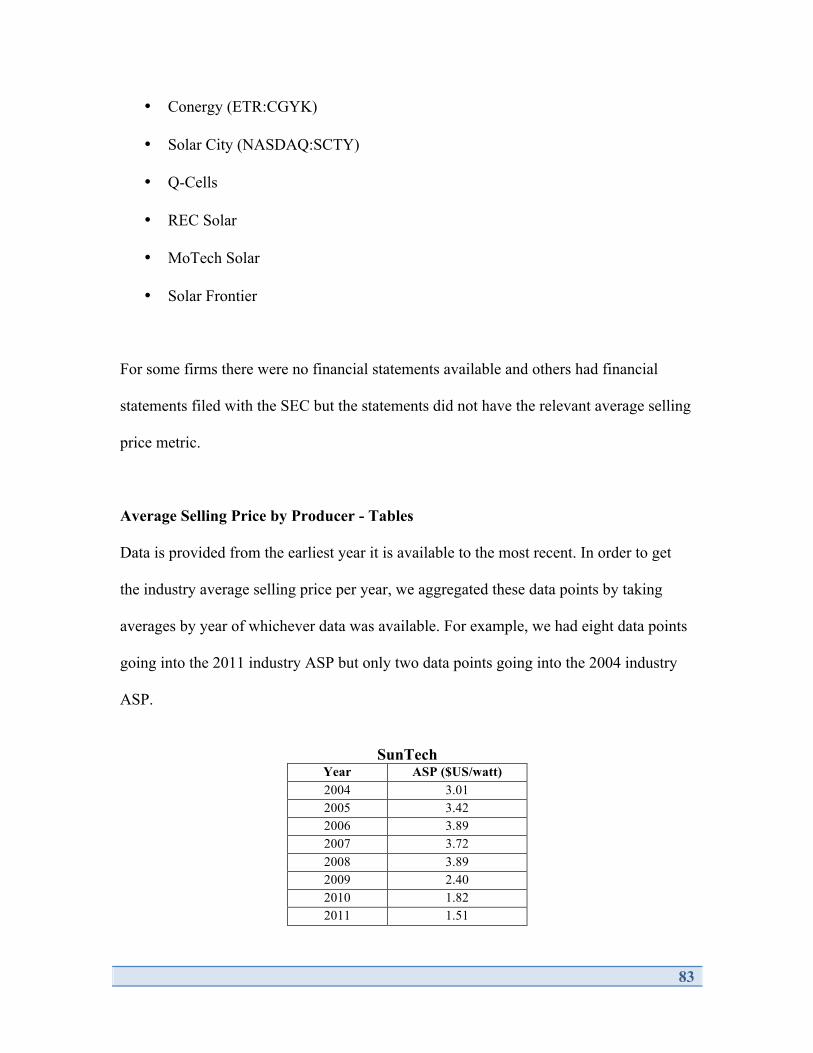
83
• Conergy (ETR:CGYK)
• Solar City (NASDAQ:SCTY)
• Q-Cells
• REC Solar
• MoTech Solar
• Solar Frontier
For some firms there were no financial statements available and others had financial
statements filed with the SEC but the statements did not have the relevant average selling
price metric.
Average Selling Price by Producer - Tables
Data is provided from the earliest year it is available to the most recent. In order to get
the industry average selling price per year, we aggregated these data points by taking
averages by year of whichever data was available. For example, we had eight data points
going into the 2011 industry ASP but only two data points going into the 2004 industry
ASP.
SunTech
Year ASP ($US/watt) 2004 3.01 2005 3.42 2006 3.89 2007 3.72 2008 3.89 2009 2.40 2010 1.82 2011 1.51

84
Trina Year ASP ($US/Watt) 2005 4.02 2006 3.98 2007 3.80 2008 3.92 2009 2.10 2010 1.75 2011 1.33 2012 0.78 2013 0.64
Hanwha SolarOne Year ASP ($US/Watt) 2005 3.93 2006 3.99 2007 3.54 2008 3.92 2009 2.24 2010 1.75 2011 1.41 2012 0.72 2013 0.68
Yingli Year ASP ($US/Watt) 2005 3.49 2006 3.82 2007 3.86 2008 3.88 2009 2.00 2010 1.75 2011 1.43 2012 0.77
Jinko Year ASP ($US/Watt) 2009 1.86 2010 1.80 2011 1.40 2012 0.69 2013 0.62
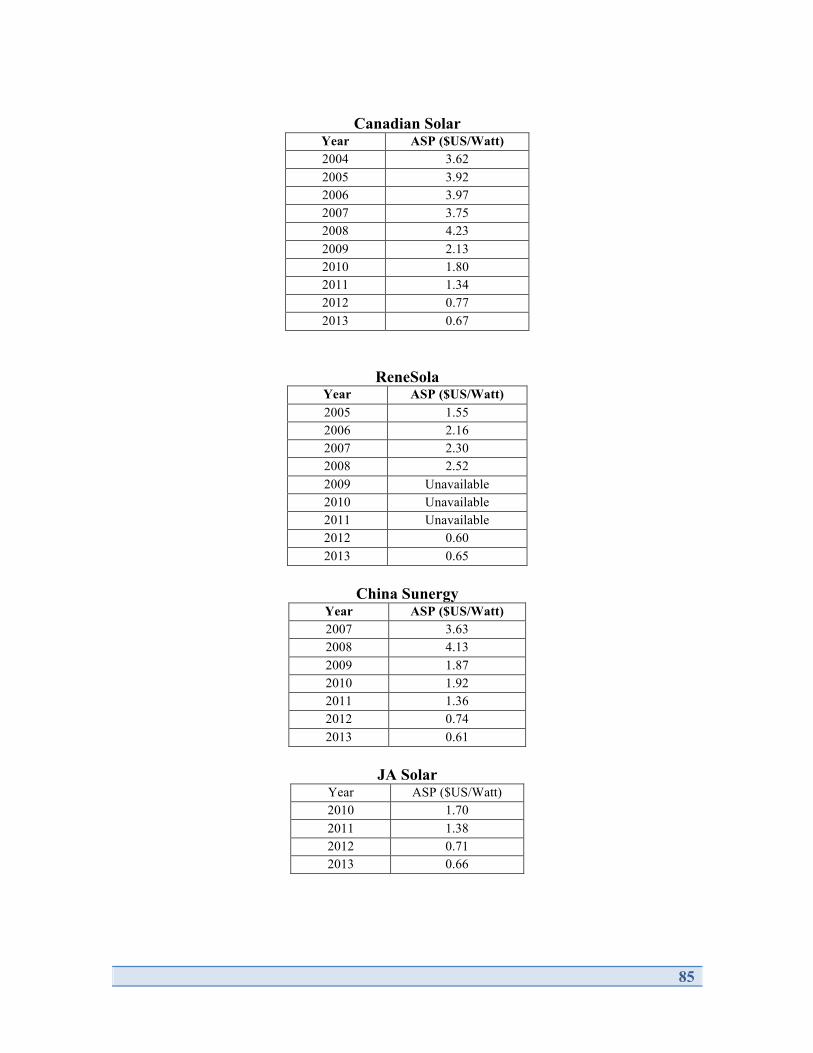
85
Canadian Solar
Year ASP ($US/Watt) 2004 3.62 2005 3.92 2006 3.97 2007 3.75 2008 4.23 2009 2.13 2010 1.80 2011 1.34 2012 0.77 2013 0.67
ReneSola Year ASP ($US/Watt) 2005 1.55 2006 2.16 2007 2.30 2008 2.52 2009 Unavailable 2010 Unavailable 2011 Unavailable 2012 0.60 2013 0.65
China Sunergy
Year ASP ($US/Watt) 2007 3.63 2008 4.13 2009 1.87 2010 1.92 2011 1.36 2012 0.74 2013 0.61
JA Solar
Year ASP ($US/Watt) 2010 1.70 2011 1.38 2012 0.71 2013 0.66
86
Works Cited
Chinese and US Solar Industry
"About the California Solar Initiative (CSI) - Go Solar California." About the California Solar Initiative (CSI) - Go Solar California. N.p., n.d. Web. 08 Dec. 2014.
"Energy.gov." Qualifying Advanced Energy Manufacturing Investment Tax Credit. N.p.,
n.d. Web. 08 Dec. 2014. "History of Solar Energy in California - Go Solar California." History of Solar Energy in
California - Go Solar California. N.p., n.d. Web. 07 Dec. 2014. "Solar's Great Leap Forward | MIT Technology Review." MIT Technology Review. N.p.,
n.d. Web. 08 Dec. 2014. "Tax Incentives Assistance Project." Tax Incentives Assistance Project. N.p., n.d. Web.
08 Dec. 2014. http://www.azcc.gov/divisions/utilities/electric/res.pdf
European Solar Industry
Cooke, Sonia Van Gilder. "Will Austerity Derail Europe's Clean-Energy Movement?" Time.
Time Inc., 10 Feb. 2012. Web. 06 Dec. 2014.
ENKHARDT, SANDRA. "EU Lowers Chinese PV Import Volume." Pv-magazine. Pv
Magazine, 8 Apr. 2014. Web. 05 Dec. 2014.
"European Solar Incentive Cuts Initiate Global Photovoltaic Market Shift." Solarbuzz. NPD
Group, 22 June 2011. Web. 08 Dec. 2014.
"German Renewable Energy Act." Wikipedia. Wikimedia Foundation, 12 Jan. 2014. Web. 08
Dec. 2014.
87
Gonzalez, Angel, and Keith Johnson. "Spain's Solar-Power Collapse Dims Subsidy
Model." The Wall Street Journal. Dow Jones & Company, 8 Sept. 2009. Web. 06 Dec.
2014.
"Historical Development of World Cumulative PV Power." SETIS. European Commission, 16
June 2010. Web. 07 Dec. 2014.
James, Adam. "The EU-China Solar Deal in 2 1/2 Charts : Greentech Media." The EU-China
Solar Deal in 2 1/2 Charts : Greentech Media. Greentech Media, 22 Aug. 2013. Web. 05
Dec. 2014.
Masson, Gaëtan, Sinead Orlandi, and Manoël Rekinger. Global Market Outlook for
Photovoltaics 2014-2018. Rep. European Photovoltaic Industry Association, n.d. Web. 6
Dec. 2014.
Parnell, John. "EU-China Price Floor Delaying European Grid Parity, Says Jinko Solar." PV-
Tech. PV Tech, 28 Aug. 2014. Web. 06 Dec. 2014.
"Solar Tariffs on China Are 'counter-productive' Say Experts | Environment | DW.DE |
04.06.2013." DW.DE. DW, Apr. 2013. Web. 06 Dec. 2014.
Stearns, Jonathan. "EU Nations Approve Pact With China on Solar-Panel
Imports." Bloomberg.com. Bloomberg, 2 Dec. 2013. Web. 05 Dec. 2014.


![The Evolution of Chinese Trade Policy[1]](https://img.pdfslide.us/doc/110x75/577ce6f61a28abf103940de5/the-evolution-of-chinese-trade-policy1.jpg)