Embed Size (px)
Citation preview
Collective Reputation in Trade:
Evidence from the Chinese Dairy Industry ∗
Jie Bai, Ludovica Gazze, Yukun Wang
February 28, 2018
Abstract
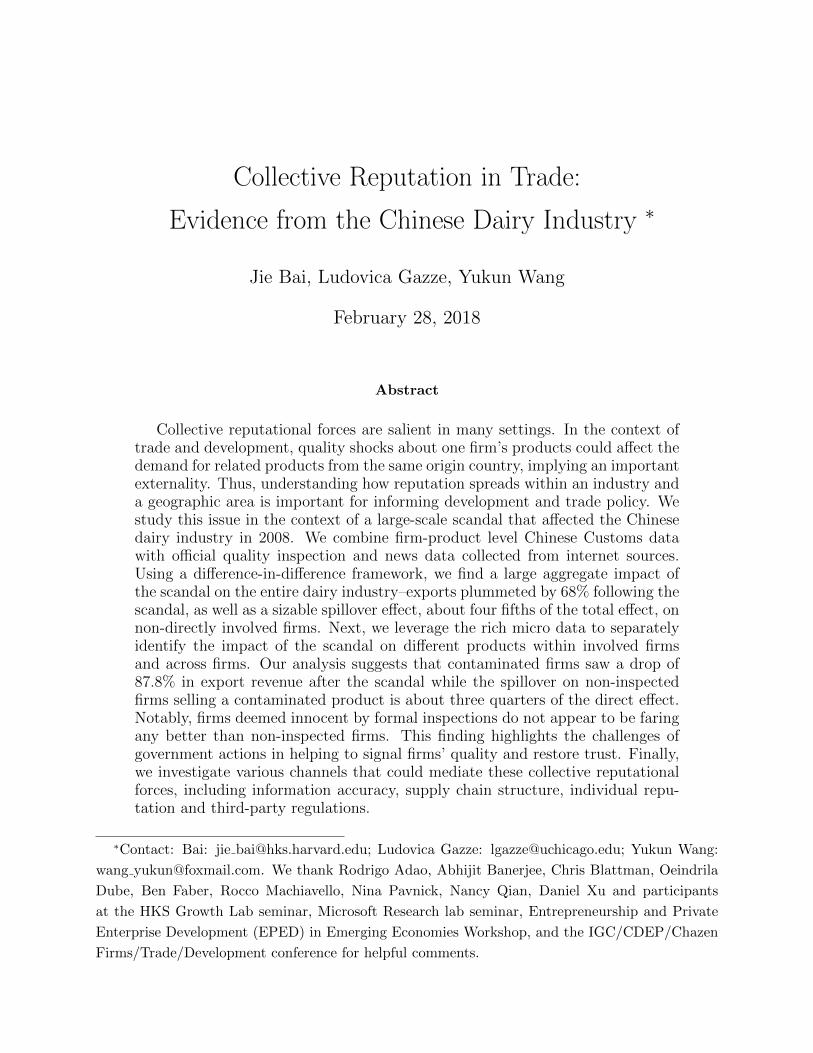
Collective reputational forces are salient in many settings. In the context oftrade and development, quality shocks about one firm’s products could affect thedemand for related products from the same origin country, implying an importantexternality. Thus, understanding how reputation spreads within an industry anda geographic area is important for informing development and trade policy. Westudy this issue in the context of a large-scale scandal that affected the Chinesedairy industry in 2008. We combine firm-product level Chinese Customs datawith official quality inspection and news data collected from internet sources.Using a difference-in-difference framework, we find a large aggregate impact ofthe scandal on the entire dairy industry–exports plummeted by 68% following thescandal, as well as a sizable spillover effect, about four fifths of the total effect, onnon-directly involved firms. Next, we leverage the rich micro data to separatelyidentify the impact of the scandal on different products within involved firmsand across firms. Our analysis suggests that contaminated firms saw a drop of87.8% in export revenue after the scandal while the spillover on non-inspectedfirms selling a contaminated product is about three quarters of the direct effect.Notably, firms deemed innocent by formal inspections do not appear to be faringany better than non-inspected firms. This finding highlights the challenges ofgovernment actions in helping to signal firms’ quality and restore trust. Finally,we investigate various channels that could mediate these collective reputationalforces, including information accuracy, supply chain structure, individual repu-tation and third-party regulations.
∗Contact: Bai: jie [email protected]; Ludovica Gazze: [email protected]; Yukun Wang:
wang [email protected]. We thank Rodrigo Adao, Abhijit Banerjee, Chris Blattman, Oeindrila
Dube, Ben Faber, Rocco Machiavello, Nina Pavnick, Nancy Qian, Daniel Xu and participants
at the HKS Growth Lab seminar, Microsoft Research lab seminar, Entrepreneurship and Private
Enterprise Development (EPED) in Emerging Economies Workshop, and the IGC/CDEP/Chazen
Firms/Trade/Development conference for helpful comments.
1 Introduction
In the presence of informational frictions, quality shocks about one firm’s products could
impose an externality on its peers. Specifically, if consumers cannot perfectly observe each
firm’s quality, they might use news about one firm to update their beliefs about the quality
of both that firm and related ones, giving rise to collective reputational forces. The theory
of collective reputation is formulated in Tirole (1996). In such settings, when an incident
spoils the collective reputation, it can be hard for a single firm to break away from the low
trust equilibrium and new firms are “endowed” with the damaged reputation. Furthermore,
ex-ante when a firm chooses how much to invest in quality, it would not fully internalize the
externality on their industrial counterparts, resulting in a sub-optimal level of quality.
Such collective reputational forces could be particularly relevant in the context of inter-
national trade where a longer supply chain makes it difficult to trace products to a particular
source within an origin country. Moreover, these forces may be especially pertinent for de-
veloping countries whose firms are mostly positioned at the lower end of the value-added
chain and export mainly non-branded products. Rising safety and quality concerns regard-
ing goods from developing countries in recent years could act as an important barrier that
hinders firms from moving up the quality ladder and penetrating the high-end markets.1 In
a recent survey of over 600 manufacturing firms in China, firms cited lack of reputation and
mistrust as one of the main challenges of penetrating into higher-end markets.2 Therefore,
understanding how reputation spreads within an industry and a geographic area is important
for informing development and trade policy.
In this paper, we investigate this issue in the context of a large-scale quality scandal
that affected the Chinese dairy industry in 2008. Similar to many industries in developing
countries and emerging markets, the Chinese dairy industry was dominated by a large number
of small and non-established players which exhibited rapid growth prior to the scandal. Using
administrative data on quality inspections conducted by the Chinese government following
the scandal, we identify the firms and the products at each firm that failed the inspections
(contaminated firm-product pairs) and those that passed them (which we call innocent firm-
1A list of historical and contemporary incidents on food contaminations can be found athttps://en.wikipedia.org/wiki/List of food contamination incidents#2001 to present. Some of the recentprominent cases include the Brazilian meat scandal in June 2017 (see the Economist article on the in-cidence: https://www.economist.com/news/business/21719416-chile-china-and-eu-have-banned-some-or-all-countrys-meat-meat-scandal-brazil), and the Chinese dairy scandal in 2008.
2The survey is led by Jinan Institute for Economic and Social Research (IESR) and the GuangzhouGeneral Administration of Quality Supervision, Inspection and Quarantine. We thank IESR for sharing thedata.
1
product pairs). We merge the official inspection lists with rich firm-product level Chinese
Customs data and firm-level Manufacturing Survey data to examine both the direct effects
of the scandal on contaminated firm-product pairs, as well as the effects on non-inspected
products at contaminate firms (within-firm spillovers) and the effects on non-inspected firms
selling contaminated products (across-firm spillovers).
We begin by showing that the scandal had a large impact on the export performance of
the entire Chinese dairy sector, thus providing an ideal setting for our study of within-sector
spillovers. Using a difference-in-differences framework at the industry level, we find that
the average value of dairy exports plummeted by 68% following the scandal and had not
recovered after five years. This estimate captures both the direct impact on contaminated
firm-products and the spillovers on non-contaminated firms or products. By excluding firm-
products that are identified as contaminated by government inspections from our DD anal-
ysis, we estimate that the spillover effect of the scandal on non-contaminated firm-products
led to a decrease in exports of 57%, about four fifths of the total effect of the scandal on
the dairy sector. Our estimates are robust to various empirical specifications that relax the
classic DD assumption. To the extent that these products are imperfect substitutes, these
estimates provide a lower bound on the collective reputation spillover. We then build and
estimate a structural demand model to incorporate the demand substitution across prod-
ucts and recover a perceived quality measure for each firm-product-year, after controlling for
prices.
Next, we investigate how the spillover effects of the scandal are distributed across different
Chines dairy firms and products. To do so, we leverage our detailed data on exports and
inspection reports to analyze export outcomes at the firm-product level within the Chinese
dairy sector. Our results suggest that contaminated firms saw a drop of 87.8% in export
revenue after the scandal relative to the national trend and the firms’ average performance.
These firms are also 14.7% less likely to export following the scandal. Furthermore, we
estimate that non-contaminated firms experience a decrease in export value as a result of
the scandal that is about half the size of the effect for directly involved firms. Overall,
these findings point to large within-firm and across-firm spillovers in export performance.
Moreover, a year-by-year analysis of the effects of the scandal shows that both the within-
firm and across-firm spillover effects persist over five years after the scandal and display little
sign of recovery.
Surprisingly, firms deemed innocent by formal inspections do not appear to be faring
any better than non-inspected firms. In terms of domestic performance, innocent firms in
2
fact performed worse than non-inspected firms. These findings highlight the potentially
counterproductive role of government actions in helping firms to signal quality and restore
trust.
Finally, we discuss potential mechanisms that may underlie the spillover effects. On the
demand side, consumers might use heuristics that group firms together based on industry
and/or source location. These heuristics will be based on the consumers’ information set
and will depend, for instance, on the supply chain structure. On the supply side, a more
established individual reputation could potentially mitigate the impact of a shock to the
industry collective reputation and shield firms from the collective reputation damage. Finally,
government intervention that directly affects all firms from the same origin-industry might
also cause spillovers. Clearly, these channels may interact with one another. Our analysis
aims to investigate the extent to which each of these appears to play a role in the aftermath
of the scandal.
First, to study the information channel, we construct measures of consumers’ knowledge
about the scandal across different export destinations, using Google Trends Search indices
for phrases that reflect a more or less accurate understanding of the parties directly involved.
We find smaller spillover effects in export destinations where people exhibit more accurate
search behavior. Second, to examine the role of supply chain structure, we use the transac-
tion level trade information to identify firms’ major source location. We find no evidence that
non-inspected firms sourcing from contaminated provinces suffer from larger spillovers than
other firms, suggesting that market competition forces might countervail the reputational
spillovers. Third, new firms appear to be more vulnerable to the collective reputation shock
compared to more experienced firms, suggesting that individual reputation mitigates collec-
tive reputation forces. Finally, blanket-style third-party regulations cannot fully explain the
estimated spillover effects–we find an equally large and significant spillover effect even when
excluding countries that imposed explicit regulatory hurdles on Chinese dairy imports.
Our paper highlights the importance of understanding collective reputational forces in
the context of international trade. The most closely related work is Macchiavello (2010)
which examines the empirical relevance of reputation for firms that enter into new export
markets in the context of the Chilean wine industry. The paper points to the importance
of buyers’ beliefs about the industry-country pair and conjectures that such beliefs may
derive from buyers’ experiences with early entrants from the same country. Our results
explicitly identify this important externality, and address the potential role and challenges
of government actions in helping to certify quality and (re)establish trust.
3
A growing empirical literature studies firm reputation and quality provision in mar-
kets with information frictions (Banerjee and Duflo, 2000; Jin and Leslie, 2009; Macchi-
avello, 2010; List, 2006; Bjorkman-Nyqvist, Svensson, and Yanagizawa-Drott, 2013; Bard-
han, Mookherjee, and Tsumagari, 2013; Macchiavello and Morjaria, 2015). Prior studies
have also shown that information frictions play an important role in international trade
(Allen, 2014; Macchiavello and Morjaria, 2015; Startz, 2017). We build upon this body of
research by examining the importance of “group” reputation (be it industry or country) in
international trade. Our results demonstrate that these group reputational forces can have
important implications on a country’s trade patterns, and may act as an underlying source
of a country’s comparative advantage.
Finally, the study relates to the broad literature on firm performance and quality upgrad-
ing in development and trade.3 Previous studies have examined: (1) supply side constraints,
including credit access, lack of quality inputs, and managerial constraints (e.g., De Mel,
McKenzie, and Woodruff (2008); Harrison and Rodrıguez-Clare (2009); Kugler and Ver-
hoogen (2012); Banerjee (2013); Bloom, Eifert, Mahajan, McKenzie, and Roberts (2013)),
and (2) demand side factors, including access to high-income markets (e.g., Verhoogen (2008);
Park, Yang, Shi, and Jiang (2010); Manova and Zhang (2012); Atkin, Khandelwal, and Os-
man (2017)). This study highlights information frictions and low collective reputation as
another potential barrier.4
The remainder of the paper is organized as follows. Section 2 provides background
information on the 2008 Chinese dairy scandal and Section 3 describes the data. Section 4
presents motivating evidence on the aggregate impact of the scandal on the dairy industry.
Section 5 investigates heterogeneity in spillover effects across different firms and products
within the dairy industry. Section 6 examines mechanisms that could mediate the observed
spillover effects. Section 7 concludes.
3See De Loecker and Goldberg (2014) for a comprehensive review of the empirical literature.4This paper also speaks to the literature on quality scandals and product recalls. Most of the previous
studies have either relied on lab experiments to examine consumer reactions to hypothetical product scandals(Ahluwalia, Burnkrant, and Unnava, 2000; Dawar and Pillutla, 2000)), or focused primarily on stock marketoutcomes using an event-study approach (Davidson and Worrell, 1992; Marcus, Swidler, and Zivney, 1987;Zhao, Lee, Ng, and Flynn, 2009)). Furthermore, most studies focus on losses in own sales and stock marketprice (Van Heerde, Helsen, and Dekimpe, 2007), rather than across-firm and products spillovers, and fewstudy this topic in the context of international trade.
4
2 Background on the 2008 Chinese Dairy Scandal
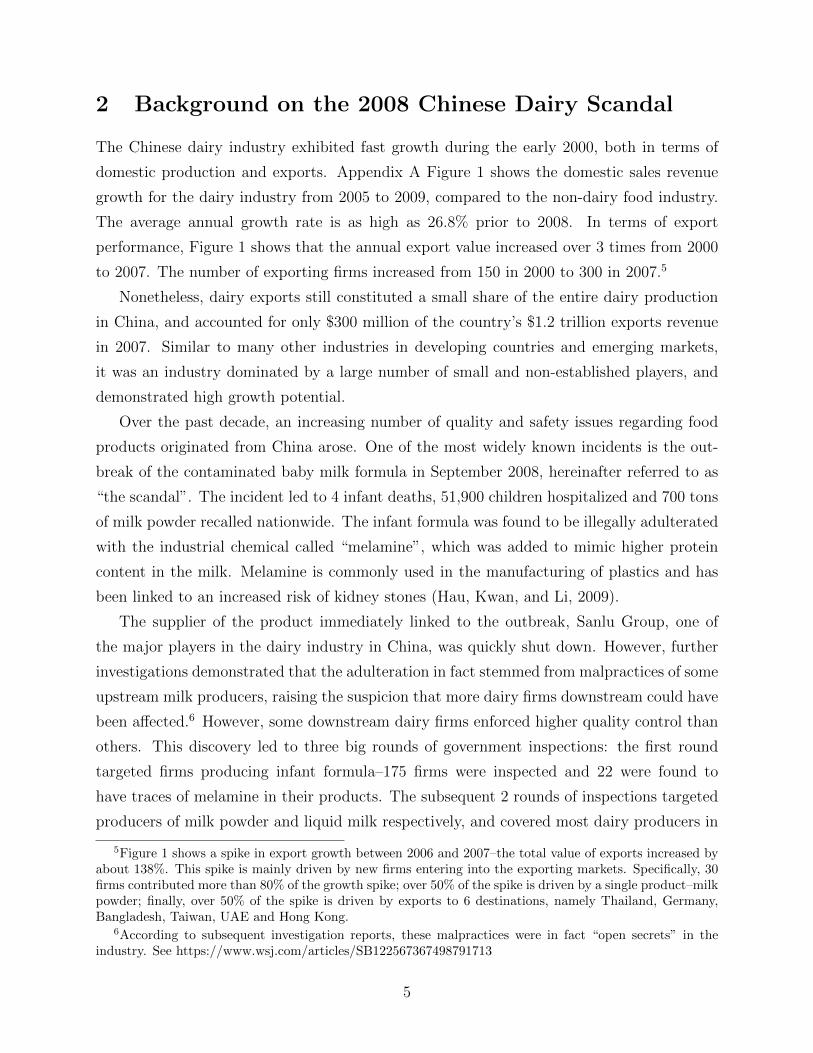
The Chinese dairy industry exhibited fast growth during the early 2000, both in terms of
domestic production and exports. Appendix A Figure 1 shows the domestic sales revenue
growth for the dairy industry from 2005 to 2009, compared to the non-dairy food industry.
The average annual growth rate is as high as 26.8% prior to 2008. In terms of export
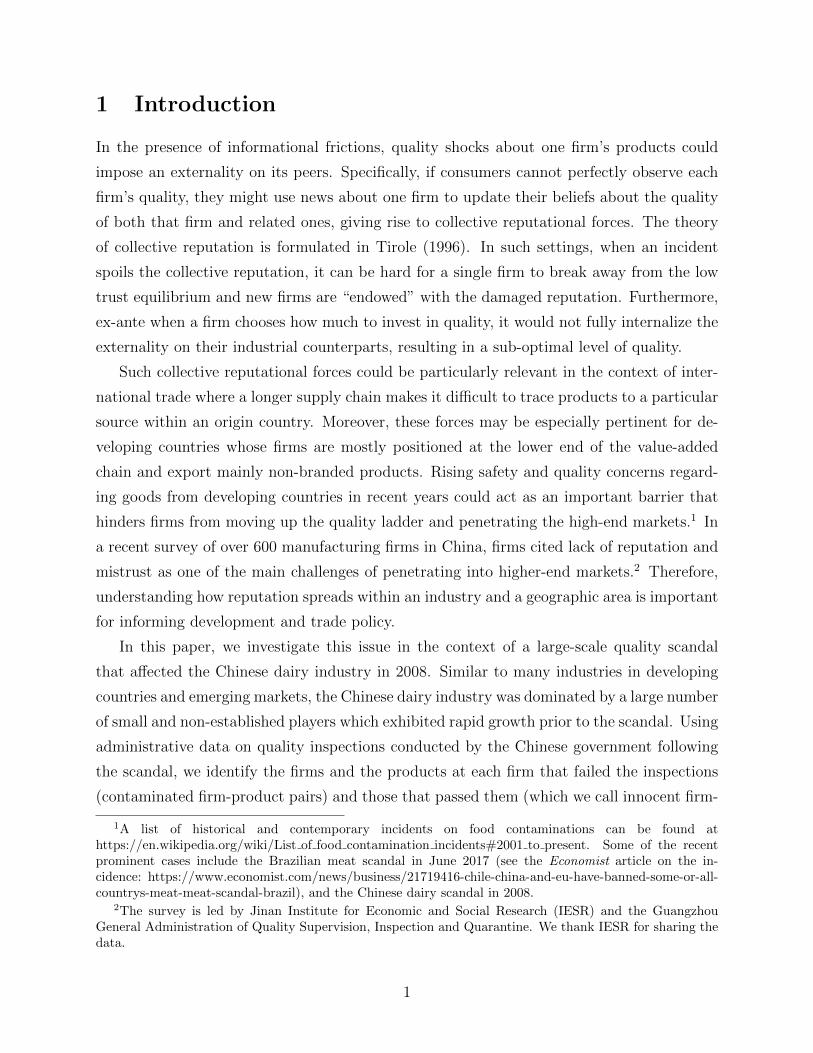
performance, Figure 1 shows that the annual export value increased over 3 times from 2000
to 2007. The number of exporting firms increased from 150 in 2000 to 300 in 2007.5
Nonetheless, dairy exports still constituted a small share of the entire dairy production
in China, and accounted for only $300 million of the country’s $1.2 trillion exports revenue
in 2007. Similar to many other industries in developing countries and emerging markets,
it was an industry dominated by a large number of small and non-established players, and
demonstrated high growth potential.
Over the past decade, an increasing number of quality and safety issues regarding food
products originated from China arose. One of the most widely known incidents is the out-
break of the contaminated baby milk formula in September 2008, hereinafter referred to as
“the scandal”. The incident led to 4 infant deaths, 51,900 children hospitalized and 700 tons
of milk powder recalled nationwide. The infant formula was found to be illegally adulterated
with the industrial chemical called “melamine”, which was added to mimic higher protein
content in the milk. Melamine is commonly used in the manufacturing of plastics and has
been linked to an increased risk of kidney stones (Hau, Kwan, and Li, 2009).
The supplier of the product immediately linked to the outbreak, Sanlu Group, one of
the major players in the dairy industry in China, was quickly shut down. However, further
investigations demonstrated that the adulteration in fact stemmed from malpractices of some
upstream milk producers, raising the suspicion that more dairy firms downstream could have
been affected.6 However, some downstream dairy firms enforced higher quality control than
others. This discovery led to three big rounds of government inspections: the first round
targeted firms producing infant formula–175 firms were inspected and 22 were found to
have traces of melamine in their products. The subsequent 2 rounds of inspections targeted
producers of milk powder and liquid milk respectively, and covered most dairy producers in
5Figure 1 shows a spike in export growth between 2006 and 2007–the total value of exports increased byabout 138%. This spike is mainly driven by new firms entering into the exporting markets. Specifically, 30firms contributed more than 80% of the growth spike; over 50% of the spike is driven by a single product–milkpowder; finally, over 50% of the spike is driven by exports to 6 destinations, namely Thailand, Germany,Bangladesh, Taiwan, UAE and Hong Kong.
6According to subsequent investigation reports, these malpractices were in fact “open secrets” in theindustry. See https://www.wsj.com/articles/SB122567367498791713
5
China. We describe the three rounds of inspections in greater detail in Section 3.3. These
inspections uncovered contamination in more dairy and dairy-related products, including
yogurt, milk, cheese, baby food with milk traces, chocolate, and cake. Product recalls were
immediately issued. By the end of 2008, the Chinese government issued an official statement
that the issue was addressed and proper measures have been put in place to ensure the safety
of the dairy products on the market.7
Despite the reassuring statement, the scandal triggered widespread fears over food safety
in China. Thousands of Chinese dairy-related products were pulled from supermarket shelves
across the world. Some countries strenghtened inspections for Chinese imports, while others
issued explicit import bans for products containing Chinese dairy ingredients. For instance,
the EU authorities stipulated tests for Chinese products containing more than 15 percent
of milk powder and announced a ban on all products for children coming from China that
contain milk; the US Food and Drug Administration (FDA) restricted imports of all Chinese
food products containing milk; India imposed a temporary ban on import of milk and all
milk-related products from China and has extended this ban till this year. Our news search
has identified 45 countries (out of 163) that imposed temporary bans on certain Chinese
dairy products (see Appendix B Table 1).
The scandal has had a long-lasting impact on the Chinese dairy industry. The General
Administration of Quality Supervision, Inspection and Quarantine (GAQSIQ) stopped is-
suing national exemption status to domestic food producers8 and tightened inspections on
domestically produced food products. Dairy firms also tightened their standards for pur-
chased raw milk and some started to build their own upstream milk farms or vertically
integrate in order to better monitor and control quality. Despite these actions to rectify the
situation, the scandal came as a devastating blow to the Chinese dairy industry and almost
entirely wiped out the country’s dairy exports in the ensuing years. As shown in Figure
1, Chinese dairy exports sharply collapsed after 2008 and did not recover untill the end of
2013, the last year in our data. At the same time, Chinese dairy imports rose rapidly after
the scandal (Appendix A Figure 2), suggesting that domestic consumers switched to foreign
dairy products in response to safety concerns around domestic brands.
7http://www.telegraph.co.uk/news/worldnews/3079146/China-claims-tainted-milk-scandal-is-over.html8This was previously known as the “inspection-free” program, which gave exemption status to qualified
food producers and waived various quality inspections for them.
6
3 Data
For this study, we assemble data from three micro-level data sources: the Chinese Customs
Database, the Chinese Manufacturing Survey, and the list of inspections conducted by the
Chinese government following the scandal. We merge together the three datasets using
detailed firm and product identifiers.
3.1 Chinese Customs Database (2000-2013)
The Chinese Customs Database provides transaction level trade flows information on the
universe of China’s exports and imports over the time period. The data is collected and
made available by the Chinese Customs Office. For the analysis in this study, we focus on
exports. For each transaction, we observe the exporting firm ID, firm name, trade type,
value and quantity of the exports, the HS eight-digit code which we use to define products,
the region or city in China where the product is exported from, the customs office where
the transaction is processed and its final destination. For each firm, the data also provides
information on its ownership type and location (the first five digits of the firm ID). We
compute unit prices for exported products by dividing value of exports by quantity. While
the data is available at daily frequency, for our analysis we aggregate the data to firm-
product-year level. Appendix A Figure 3 plots China’s export growth by year. Exports grew
rapidly during the early 2000s following China’s entry into the World Trade Organization
(WTO).
We define “dairy industry” using the HS eight-digit product information. Most of the
dairy products fall under the HS two-digit code 04, while infant dairy products fall under
19 and milk protein products extracted from raw milk fall under 35. Appendix B Table 2
provides the full list of the HS eight-digit codes and descriptions for dairy products.
3.2 Chinese Manufacturing Survey (2005-2009)
The Chinese Manufacturing Survey data are compiled from annual surveys conducted by
the National Bureau of Statistics (NBS), and include all industrial firms that are identified
as being either state-owned or non-state firms with sales revenue above 5 million RMB.
As described in previous studies (e.g., Brandt, Van Biesebroeck, and Zhang (2012)), even
though a large number of small to medium industrial firms (80%) are excluded from the
sample, they account for only a small fraction of the total economic and export activities in
China. In particular, the excluded firms employ 28.8% of the industrial workforce, but only
7

produce 9.3% of the total output and generate 2.5% of the export revenue. The analysis in
this paper focuses on the dairy industry within the manufacturing sector. For each firm-year
observation, we observe basic production and financial information, including firms’ 4-digit
industry ID, years of operation, firm location, total sales revenue, employment, and export
revenue. We identify the dairy and food industry according the observed industry ID.
3.3 Government Inspection Lists
The Chinese government implemented three rounds of inspections after the scandal broke
out in late 2008. The three rounds of inspections focused respectively on producers of infant
formula, milk powder, and liquid milk. In the first round, the government inspected all 109
infant formula producers in China and 22 were found to be contaminated. The second round
inspected 154 randomly sampled milk powder producers (together making up over 70% of
the market share) out of 290 producers nationwide and 20 were found to be contaminated.
The third round targeted 466 more established dairy brands with large market shares, and
found 9 firms of 3 major brands to be contaminated.
For each round of inspection, the Chinese government released the full list of firm names,
each firm’s products being inspected and the corresponding batch codes. We obtained the
inspection lists at the firm-product level from the official GAQSIQ website. A news search
through Lexis Nexis found that most of the reported cases of contamination were covered in
the Chinese official inspection lists.
We merge the firm-product level inspection lists and outcomes with the Customs data
using firm names and product information, and with the Manufacturing Survey data using
firm names only (since we do not observe product information in the Manufacturing Sur-
vey). Based on the firm-product level inspection information, we classify firms in one of the
following categories: contaminated, innocent, and non-inspected firms. The first is defined
as firms with at least one product found to be contaminated during one or more rounds of
the inspections. The second is defined as firms whose products passed all of the tests for
their inspected products. The third group includes firms that were never inspected.
Using these definitions, in the Customs data we identify 49 contaminated firm-product
pairs in 41 contaminated firms, and 31 innocent firm-product pairs in 45 innocent firms. In
the Manufacturing Survey data, we identify 65 contaminated and 369 innocent firms.
8
3.4 Summary Statistics
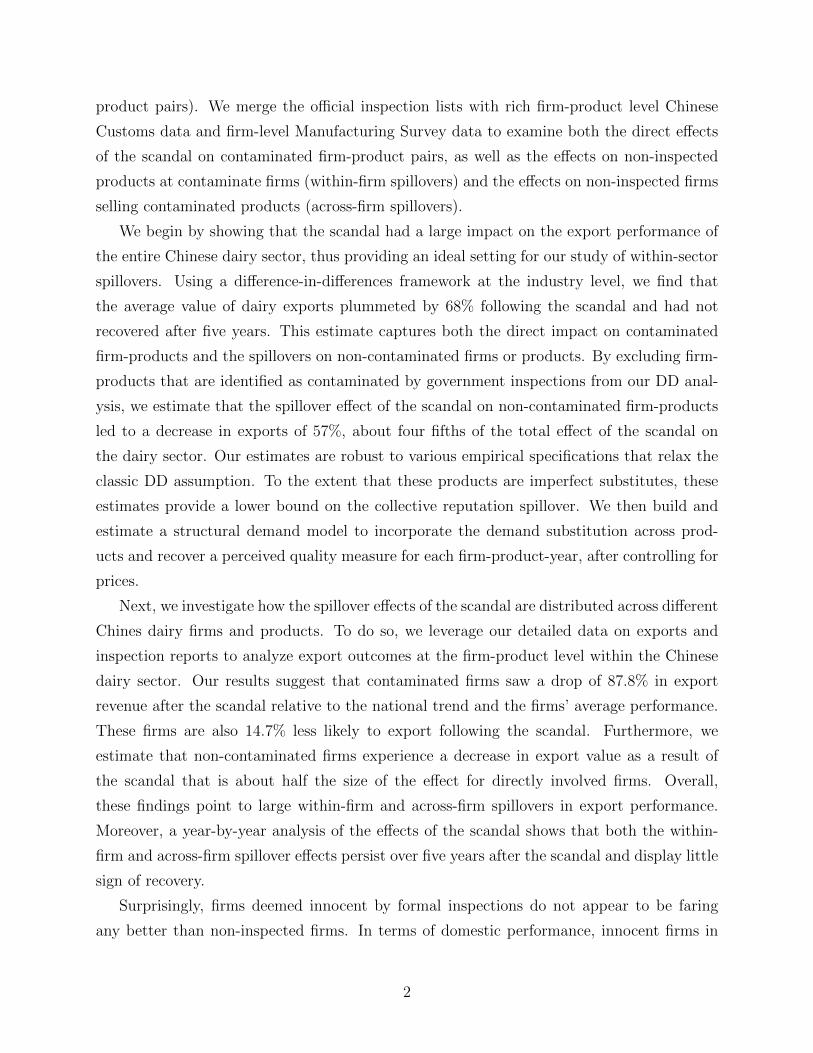
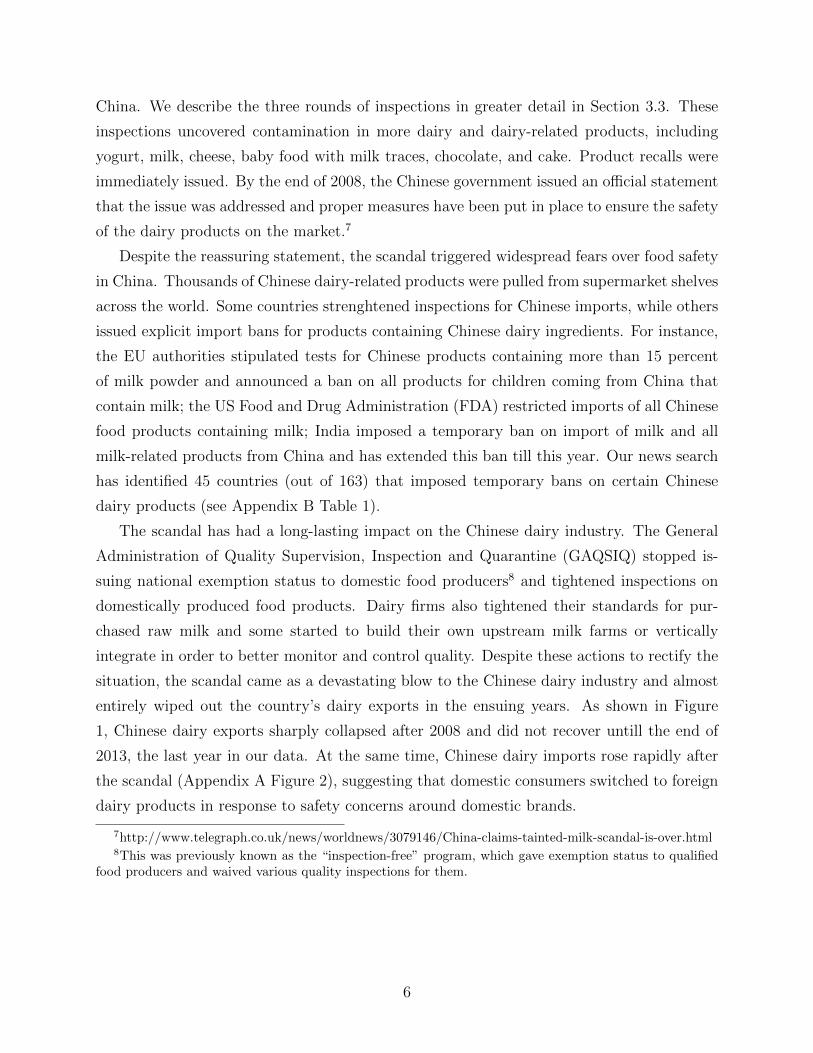
Figure 2 plots the number of exporting products and destinations for contaminated and non-
contaminated firms from 2000 to 2007 (for firms exporting in multiple years, we calculate
the median value across the 8 years). The graphs show that most firms exported a single
product and to a single destination prior to the scandal.Appendix A Figure 4 shows similar
patterns after the scanda. We discuss how these patterns determine the variation in the data
we exploit in the firm-product level analysis in greater detail in Section 5.
Table 1 presents firm-level baseline (2000-2007) summary statistics for the dairy industry.
It reports the number of non-missing observations, mean and standard deviation for a set of
key performance measures for exports (Panel A), and employment and total sales revenue
(Panel B). Column 7 calculates the difference in means between the contaminated and non-
inspected firms (Column 2 and 6) and Column 8 reports the p-value of the difference. Panel
A shows that on average, contaminated firms have larger exporting revenue and are more
experienced compared to innocent firms; however, they are not systematically different from
the non-inspected firms. Panel B reinforces that contaminated firms are larger in terms both
of employment and of sales revenue than innocent firms and non-inspected firms. This is
consistent with the fact that the Chinese government targeted larger firms in the third round
inspection.9
Table 2 presents product-level baseline (2000-2007) summary statistics for the same ex-
port performance measures. Panel A shows that on average contaminated products are
larger in terms of exporting revenue and have been exported for more years comparing to
uncontaminated products. Contaminated products also appear to be exported less to the
member countries of the Organization for Economic Cooperation and Development (OECD)
although the difference is not significant. Panel B presents the same summary statistics for
non-dairy food products.
4 Industry Level Analysis
This section estimates the impact of the scandal on the export performance of the entire
Chinese dairy sector. Specifically, Section 4.1 discusses our preferred empirical specification
as well as threats to the validity of the DD assumptions and additional tests we perform that
relax these assumptions. Section 4.2 presents our DD estimates, and Section 4.3 investigates
the extent to which the scandal affected different dairy products, as measured at the six-digit
9Appendix A Table 1 presents the same baseline summary statistics for non-dairy food industries.
9
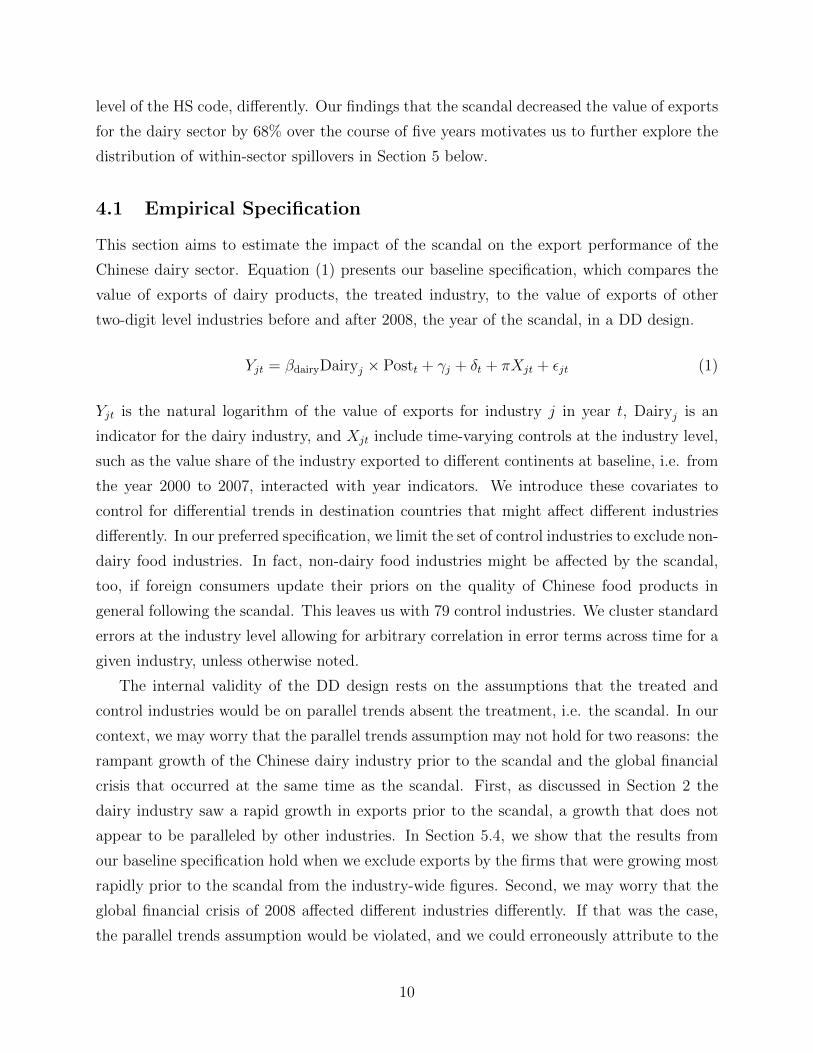
level of the HS code, differently. Our findings that the scandal decreased the value of exports
for the dairy sector by 68% over the course of five years motivates us to further explore the
distribution of within-sector spillovers in Section 5 below.
4.1 Empirical Specification
This section aims to estimate the impact of the scandal on the export performance of the
Chinese dairy sector. Equation (1) presents our baseline specification, which compares the
value of exports of dairy products, the treated industry, to the value of exports of other
two-digit level industries before and after 2008, the year of the scandal, in a DD design.
Yjt = βdairyDairyj × Postt + γj + δt + πXjt + εjt (1)
Yjt is the natural logarithm of the value of exports for industry j in year t, Dairyj is an
indicator for the dairy industry, and Xjt include time-varying controls at the industry level,
such as the value share of the industry exported to different continents at baseline, i.e. from
the year 2000 to 2007, interacted with year indicators. We introduce these covariates to
control for differential trends in destination countries that might affect different industries
differently. In our preferred specification, we limit the set of control industries to exclude non-
dairy food industries. In fact, non-dairy food industries might be affected by the scandal,
too, if foreign consumers update their priors on the quality of Chinese food products in
general following the scandal. This leaves us with 79 control industries. We cluster standard
errors at the industry level allowing for arbitrary correlation in error terms across time for a
given industry, unless otherwise noted.
The internal validity of the DD design rests on the assumptions that the treated and
control industries would be on parallel trends absent the treatment, i.e. the scandal. In our
context, we may worry that the parallel trends assumption may not hold for two reasons: the
rampant growth of the Chinese dairy industry prior to the scandal and the global financial
crisis that occurred at the same time as the scandal. First, as discussed in Section 2 the
dairy industry saw a rapid growth in exports prior to the scandal, a growth that does not
appear to be paralleled by other industries. In Section 5.4, we show that the results from
our baseline specification hold when we exclude exports by the firms that were growing most
rapidly prior to the scandal from the industry-wide figures. Second, we may worry that the
global financial crisis of 2008 affected different industries differently. If that was the case,
the parallel trends assumption would be violated, and we could erroneously attribute to the
10
scandal an export decline in dairy products that might in fact be due to the crisis.
To assuage these concerns, we show that our estimates of the impact of the crisis are
robust to several specifications that relax the parallel trends assumption. Specifically, we
perform robustness checks on our baseline specification in Equation (1) that include a vector
of industry-specific linear time trends in the vector Xjt. In addition, Appendix C shows that
the interactive fixed effects design discussed in Gobillon and Magnac (2016) and synthetic
control methods produce similar estimates to our DD design.
4.2 Results: Difference-in-Difference
Table 3 presents estimates of Equation (1). The baseline specification in Column 1 includes
only year and industry fixed effects, and estimates a decline in the value of Chinese dairy
exports following the scandal of 65.5% (= (e−1.065 − 1) × 100%). Columns 3 and 4 build on
this specification by adding time-varying controls for the value share of the industry exported
to different continents at baseline interacted with year indicators and industry-specific linear
trends, respectively.10 While the effect of the scandal is estimated more imprecisely in
Column 3, our preferred estimate in Column 4 is not statistically distinguishable from the
baseline estimate in Column 1. Therefore, we conclude that the value of dairy exports
plummeted by 68% following the scandal.
Finally, Column 2 expands our sample to include non-dairy food industries. The coef-
ficient on the interaction between the indicator for food industry and the indicator for the
post-scandal period suggests that the scandal did not affect these non-dairy food industries
in an economically or statistically significant way. Section 5 analyzes the patterns of spillover
effects of the scandal in greater details.
So far, we have estimated the impact of the scandal on the whole Chinese dairy industry.
Estimates in Table 3 capture both the direct impact on contaminated firm-products, as
well as the spillovers on non-contaminated firms or products. We can gauge the extent to
which the direct effect dominates the indirect effect by performing our analysis on the dairy
industry excluding contaminated firm-products. Table 4 shows that the indirect effect on
this non-contaminated sample appears to be slightly smaller than the total effect, although
this difference is only statistically significant in our preferred specification in Column 4 that
controls for product-year fixed effects. Specifically, we estimate a spillover effect of the
scandal on non-contaminated firm-products leading to a decrease in exports of 57%, about
10Column 3 drops one industry, with two-digit level HS code equal to 77, because it has no exports duringour baseline period.
11
four fifths of the total effect of the scandal on the dairy sector.
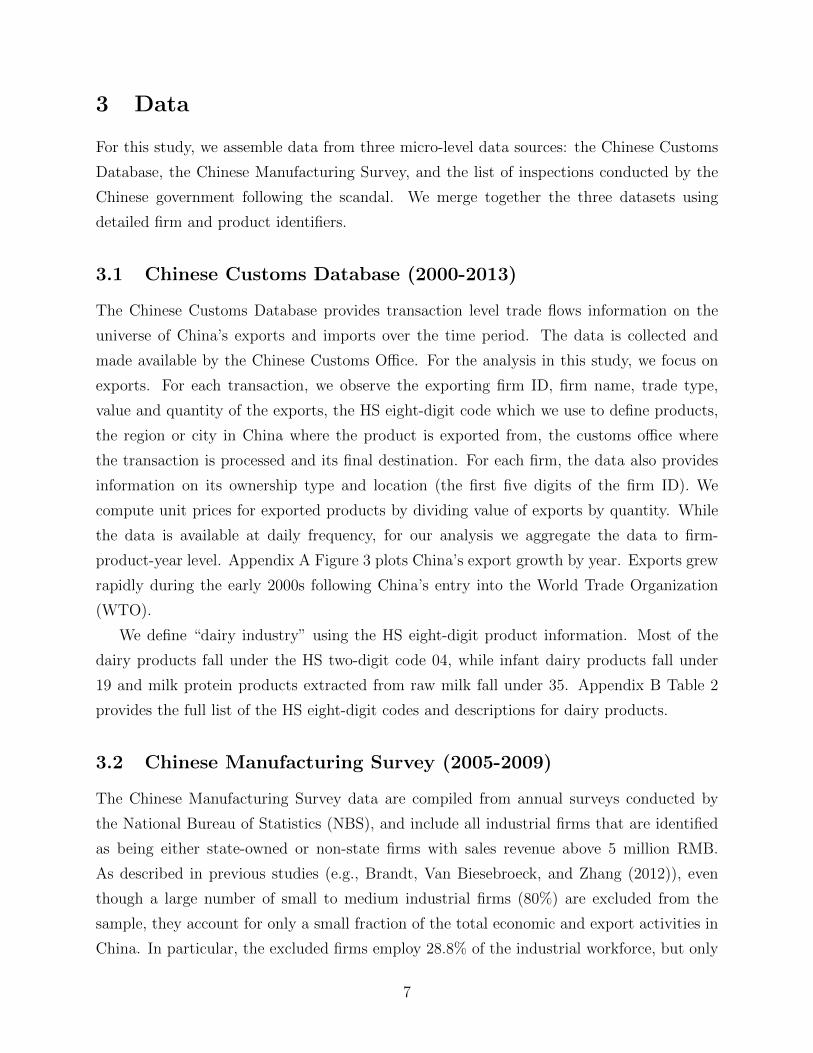
4.3 Heterogeneous Effects across Dairy Products
In this Section we investigate the extent to which the scandal affects different products within
the Chinese dairy industry differently. Specifically, we examine the export performance of
25 dairy product categories as defined by their six-digit level HS code, shown in Appendix B
Table 2. To do so, we estimate a DD model at the six-digit level, as described in Equation (2).
The sample of control industries includes 5889 HS six-digit industries excluding non-dairy
food-related industries.
Yjt = βjIndustryj × Postt + γj + δt + εjt (2)
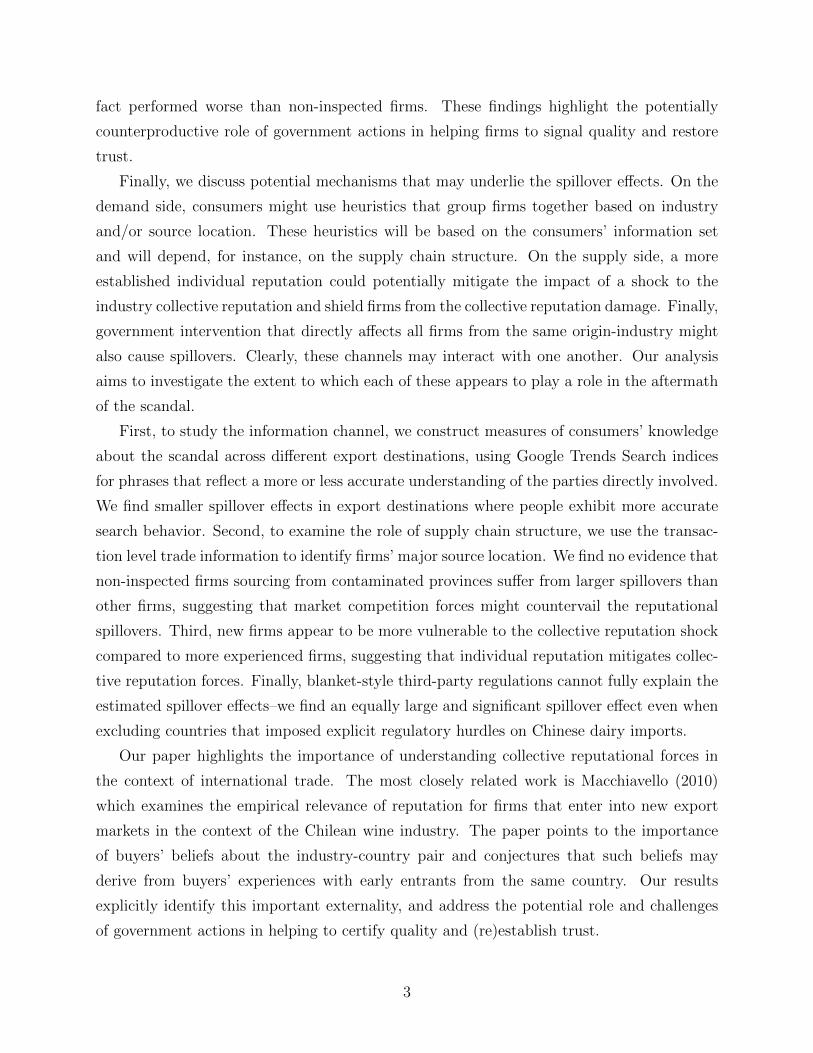
Figure 3 plots the βj coefficients estimated from Equation (2) ordered from the most
negative to the most positive, together with 95% confidence intervals estimated from robust
standard errors. While some of these coefficients are estimated imprecisely, the figure shows
that the scandal appears to have had heterogeneous effects on different dairy products,
damaging the exporting performance of some, while boosting the exporting performance of
others. One potential explanation is the positive countervailing market competition effect
besides the negative collective reputation effect. We discuss this point further in Section 6.2.
To provide further insights on the heterogeneous effects of the scandal and the mechanisms
through which it affects firms’ performance, the next section studies the impact of the scandal
at the firm-product level.
5 Firm-Product Level Analysis
This section investigates the impact of the scandal on export performance at the firm-product
level. We restrict the analysis to the dairy industry. We are interested in examining both
the direct impact on contaminated firm-products, as well as the spillover effects within firms
and across firms in the industry. To do so, we take advantage of the rich microdata on
export activities at the firm-product level, as well as the firm-level performance measures,
and merge them with inspection outcomes as described in Section 3. Our main regression
12

specification is as follows:
Yfpt = βdirectContaminatedFirmProductfp × Postt
+ βwithin-firmContaminatedFirmf × Postt
+ βacross-firmContaminatedProductp × Postt
+ λ1InnocentFirmProductfp × Postt
+ λ2InnocentFirmf × Postt
+ γfp + δt + εfpt (3)
The dependent variable Yfpt is an outcome for firm f product p at year t, including log
(export revenue), log (export quantity), log (price), and a dummy variable for exporting.
Except for the price outcome, we first rectangularize the data at firm-product and year
level in order to capture extensive margin responses (i.e., entry and exit into exporting).
ContaminatedFirmProductfp is an indicator for firm-product pairs directly involved in the
scandal: the indicator equals 1 if a given product of a firm was inspected and failed the
quality test. ContaminatedFirmf is an indicator for firms involved in the scandal: the in-
dicator equals 1 if a firm was inspected and at least one of its products failed the test.
ContaminatedProductp is an indicator for products involved in the scandal: the indicator
equals 1 if at least one of the inspected firms failed the quality test for the given product.
InnocentFirmProductfp and InnocentFirmf are defined similarly: InnocentFirmProductfp
is an indicator for firm-product pairs that were inspected and passed the quality test.
InnocentFirmf is an indicator for firms that passed the quality test for all of their inspected
products.
Our preferred specification controls for firm-product (γfp) and year (δt) fixed effects, so
that we capture differential changes in performance across firm-products over time, net-
ting out common nationwide dairy industry time trends and different average levels by
firm-product cell. To examine the sensitivity of our estimates, we estimate two alternative
specifications exploring different identification assumptions, one controlling for firm, product
and year fixed effects, and one controlling for year fixed effects only. Results are presented in
Appendix A Tables 8 and 9. Standard errors are always two-way clustered at the product-
year and firm level allowing for arbitrary correlation in error terms across time for a given
firm and for a given product-year across firms.
To interpret the β and λ coefficients, note that the omitted group is non-contaminated
products from non-inspected firms. Therefore, βacross-firm identifies the impact on non-
13
inspected firms of selling one of the contaminated products (i.e., across-firm spillovers).
βwithin-firm identifies the overall impact on the contaminated firms (i.e., within-firm spillovers)
whereas βdirect captures the additional impact on their directly involved products. Similarly,
λ1 and λ2 capture the impact on the innocent firms and innocent firm-products relative to
the omitted group. Appendix A Table 10 examines the variation in the data in each group
that allows us to identify these various effects.
5.1 Results: Direct and Spillover Effects on Exports
Table 5 reports the main estimates from Equation (3). Column 1 examines the impact on
log export revenue and shows large within-firm and across-firm spillovers. Specifically, the
estimate for βwithin-firm is -2.1 and is significant at the 1 percent level. The magnitude suggests
that contaminated firms experienced a drop of 87.8% in export revenue after the scandal
relative to the national trend and the firms’ average performance. Within contaminated
firms, directly involved products are affected more–the estimated coefficient βdirect is large
(-0.637, or -46.8%) but quite inprecisely estimated, suggesting that there may be a lot of
heterogeneity among the subset of directly contaminated firm-products. Next, in line with
the industry-level analysis results in Section 4, we see a large and negative spillover impact
on firms selling one of the contaminated products: the estimate for βacross-firm is -1.111 (or
-67%) and is significant at the 1 percent level. Finally, the results for innocent firms and
products are very mixed: while the coefficient on InnocentFirmProduct×Post is large and
positive, the overall impact on innocent firms, relative to non-inspected firms, is negative.
Both of these estimates are statistically insignificant.
Column 2 examines log export quantity and finds similar results.11 Combining the esti-
mates of βacross-firm in Column 1 and 2, this decrease in quantity contributes to 97.5% of the
across-firm spillovers, after taking into account entry and exit.
Column 3 examines changes in unit price. The regression is estimated on the unbal-
anced panel of firm-product-year observations with positive export activity. The estimate
of βacross-firm is -0.151 (-14%) and is significant at the 5 percent level. The direct impact on
contaminated firm-products is -0.391 (-32.4%) and is significant at the 5% level, whereas the
within-firm spillover βwithin-firm is positive at 0.293 (34%) with a standard error of 0.195. The
results suggest that firms dropped prices for products that were found to be contaminated,
while at the same time they increased prices in other product lines.
Finally, Column 4 examines the impact of the scandal on the extensive margin, and finds
11There are very few changes in unit within a HS eight-digit industry in the Customs data.
14
that contaminated firms are 14.7% less likely to export after the scandal. The estimate for
βwithin-firm is significant at 1 percent level, whereas that for βdirect is non-distinguishable from
0. All Chinese dairy firms, regardless of whether innocent, contaminated or not inspected, are
8.5% less likely to export contaminated products, and the estimate of βacross-firm is significant
at the 1 percent level. The results on innocent firms and products are again inconclusive.
5.2 Interpretation: The Role of Government Inspections
Overall, the results show large within-firm and across-firm spillovers in export performance:
both the non-inspected products of contaminated firms and the contaminated products of
non-inspected firms were significantly adversely affected by the scandal. On the other hand,
the effects on innocent firms and products are highly mixed. The inspection outcomes
released by the Chinese government could be regarded as a form of government signaling
or certification. This section discusses two potential explanations for our mixed results on
innocent firms and products.
The first explanation is that the public might perceive government inspections as a bad
signal for potential quality violations. The fact that a firm went under inspection may
indicate that something was not right, even though some of the inspections were claimed to
be targeted at random (see discussions in Section 2). An alternative explanation is that any
firm that appears in the post-scandal news reports is associated implicitly with the scandal
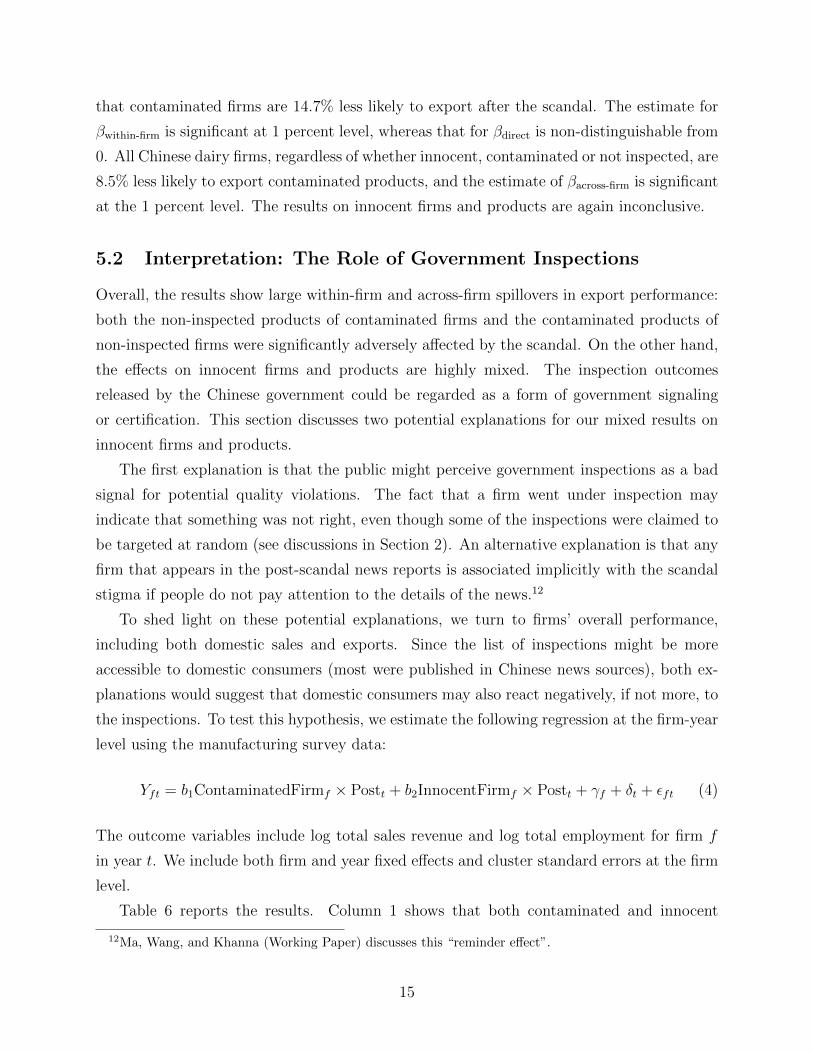
stigma if people do not pay attention to the details of the news.12
To shed light on these potential explanations, we turn to firms’ overall performance,
including both domestic sales and exports. Since the list of inspections might be more
accessible to domestic consumers (most were published in Chinese news sources), both ex-
planations would suggest that domestic consumers may also react negatively, if not more, to
the inspections. To test this hypothesis, we estimate the following regression at the firm-year
level using the manufacturing survey data:
Yft = b1ContaminatedFirmf × Postt + b2InnocentFirmf × Postt + γf + δt + εft (4)
The outcome variables include log total sales revenue and log total employment for firm f
in year t. We include both firm and year fixed effects and cluster standard errors at the firm
level.
Table 6 reports the results. Column 1 shows that both contaminated and innocent
12Ma, Wang, and Khanna (Working Paper) discusses this “reminder effect”.
15

firms perform worse, relative to non-inspected firms, after the scandal. Total sales revenue
dropped by 42.9% for contaminated firms and 16.7% for innocent firms, and the estimates
are significant at the 1 percent and 5 percent level respectively. The effects on domestic
sales in Column 2 are qualitatively similar but noisier, whereas the effects on employment in
Column 3 are much smaller and statistically insignificant, suggesting that the hiring margin
might be more difficult to adjust.
Overall, these findings are consistent with the two potential explanations discussed above
about the potentially counterproductive role of government signaling and certification. These
results speak broadly to the importance of understanding the process of information acquisi-
tion in thinking about collective reputational forces. We come back to this point in Section
6 when we discuss the mechanisms.
5.3 Heterogeneous Effects on Sister Firms
Some non-inspected firms are are related to contaminated firms through their ownership
structure: we call these sister firms. For example, a popular dairy brand in China, Yili, has
a mother company and several regional subsidiaries that appear in our dta. The mother
company, Inner Mongolia Yili Industrial Group, is contaminated, while its subsidiary Hefei
Yili Dairy was never inspected. To the extent that sister firms share a common brand name,
one may expect larger reputational spillovers for these firms than for other non-related
non-inspected firms. We investigate this possibility by creating an indicator variable for
non-inspected sisters and estimating Equation (3) with this additional interaction. In total,
there are 45 such non-inspected sister firms in our merged Customs sample.
The results are shown in Table 7. The coefficients for log export revenue, log quantity
and exporting dummy are all negative and the magnitudes are quite large; however, the
effects appear to vary tremendously among firms as indicated by the large standard errors.
Table 8 examines firms’ domestic performance among sisters and non-sisters.13 Interest-
ingly, sister firms appear to perform worse than non-sister firms in terms of domestic sales.
In particular, among non-inspected firms, sister firms experience a 20.3% slower growth rate
in total sales revenue compared to the non-sister firms. Similarly, among innocent firms,
sister firms performed significantly worse than non-sister firms: a test of equality for the
two coefficient estimates is rejected at the 10 percent level (p-value=0.063). The results on
domestic sales are qualitatively similar though less precisely estimated (Column 2).
13Note that there are some innocent sister firms in the merged Manufacturing Survey data, and therefore,we create additional group dummies for these firms.
16
One explanation for the contrast between the domestic and export performance is that
domestic consumers have more knowledge about the individual brands and are thus able
to identify the contaminated brands better than foreign consumers. We investigate the
information channel further in Section 6.
5.4 Robustness Checks
This section examines the robustness of our main results in Section 5.1 to alternative spec-
ifications. In our analysis, identification relies on the assumption that unobserved firm-
product-year specific shocks that affect the outcomes are uncorrelated with the initial in-
spection status. In other words, absent the scandal, all firm-products would have seen the
same growth in export performance over time. In Section 3, we see that inspected firms are
on average larger than non-inspected firms. Therefore, one concern is that firms of different
sizes may lie on different growth trajectories. To address this concern, we allow for differ-
ential time trends across firms with different baseline characteristics, including firm’s total
sales value, firm’s year of exporting and the average exporting revenue of the HS four-digit
industry. The results, reported in Appendix A Table 11, are very similar to the results in
Table 5.
A related concern is that different sub-industries (within dairy) may be on different
growth trajectories, in particular contaminated products may grow faster or slower than
other products even absent the scandal, leading to biased estimates of the spillover effects.
Appendix A Table 12 allows in addition for differential time trends across sub-industries.
Reassuringly, the results are qualitatively similar to the results in Table 5.
Finally, as discussed in Section 2, a few predominant firms and export destinations were
behind the growth spike in the pre-scandal period (2006-2007). We examine to what ex-
tent the estimated coefficients are mechanically driven by these fast-growing parties scaling
down their production and reducing exports after the scandal by dropping these firms and
destinations. Results are shown in Appendix A Table 13.
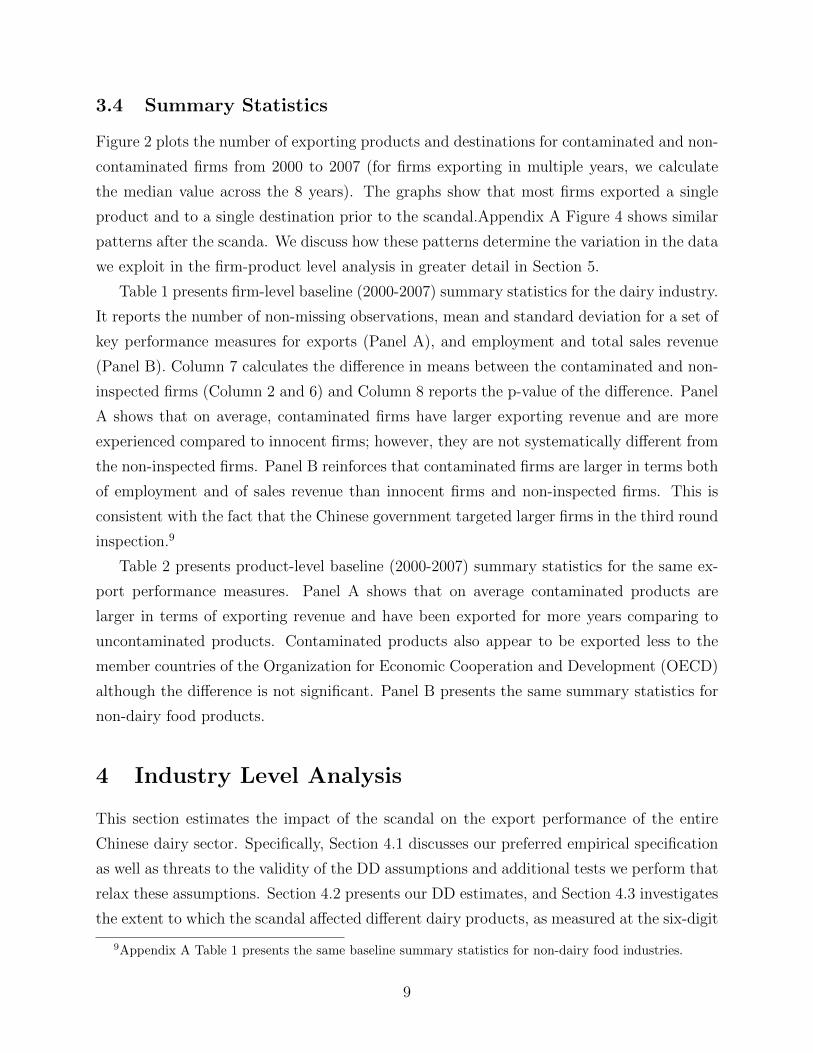
5.5 Persistent Effects Over Time
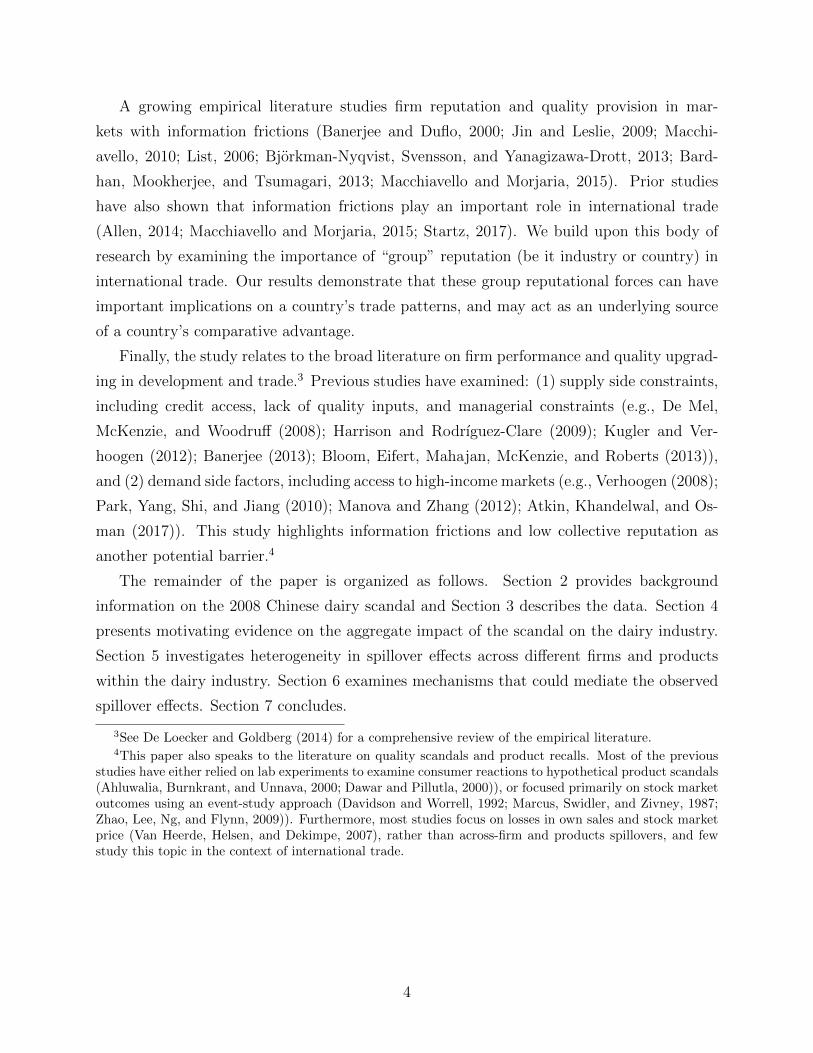
We examine how persistent the direct and spillover effects are by fully interacting the firm-
product group dummies with year dummies in Equation (3). Figure 4 plots the regression
coefficients with standard errors for two outcome variables: log value of exports and exporting
dummy. We see that both the within-firm and across-firm spillover effects persist over five
17
years after the scandal and display little sign of recovery.
6 Mechanisms
In this section, we investigate four potential mechanisms for the spillover effects documented
in Section 4 and 5, namely information accuracy, supply chain structure, individual repu-
tation and the role of third-party or government regulations. In this and other real world
contexts, all of the channels may act jointly and interact with one another. Rather than
trying to disentangle and quantify the effects of the various channels, the goal of our exercise
here is to show whether a particular channel has bite.
6.1 Information Accuracy
A producer’s reputation, broadly speaking, is consumers’ belief that it provides quality.
Hence, the ways that consumers gather information and learn crucially matter for the extent
of reputational spillovers. We can imagine two scenarios: one in which consumers perfectly
understand the evolution of the scandal and are able to closely keep track of the inspection
outcomes, and the other in which consumers have trouble identifying the contaminated
firms and begin to worry about Chinese dairy products in general as a result of the scandal.
Collective reputational forces would be stronger in the latter scenario compared to the former.
To construct a systematic measure of consumers’ information accuracy across different
export destinations, we leverage Google Trends data. Google Trends is a public web facility
providing time series indices based on Google Search data, which capture how often a search
term is entered relative to the total search volume in a given geographical area. To compare
relative popularity across search terms, each data point of Google Trend indices is divided by
the total searches of the geographical area and time range it represents, and scales on a range
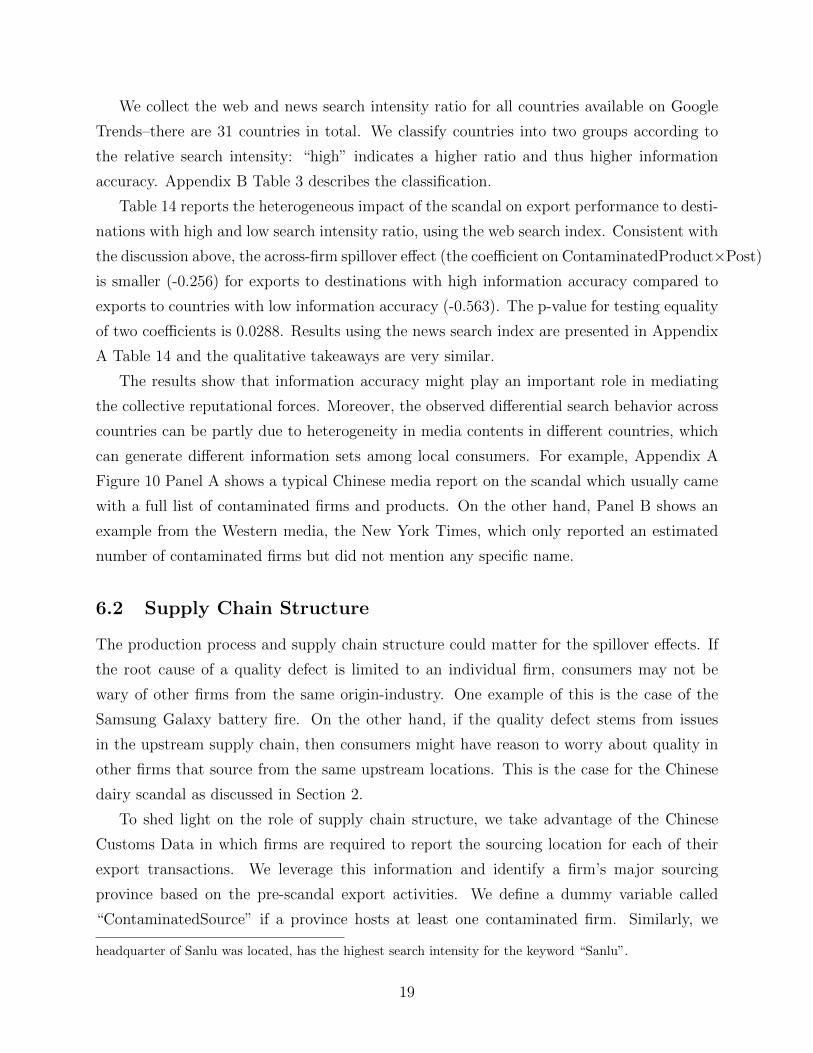
of 0 to 100 for any given period. We collect two types of search indices, a web search index
and a news search index, for different countries. For each index, we constructed the relative
search intensity ratio for the two keywords, “Sanlu” versus “2008 Chinese milk scandal”.
Figure 5 displays the relative search intensity for several countries. It shows that web users
in countries on the left panel–China, Hong Kong and New Zealand–search “Sanlu” much
more than the generic phrase, suggesting that consumers in these countries may be more
informed about the parties involved in the scandal. In comparison, information appears to
be much less specific in countries on the right panel–the US, Canada and UK.14
14Appendix A Figure 9 shows the search behavior across provinces in China. Hebei province, where the
18
We collect the web and news search intensity ratio for all countries available on Google
Trends–there are 31 countries in total. We classify countries into two groups according to
the relative search intensity: “high” indicates a higher ratio and thus higher information
accuracy. Appendix B Table 3 describes the classification.
Table 14 reports the heterogeneous impact of the scandal on export performance to desti-
nations with high and low search intensity ratio, using the web search index. Consistent with
the discussion above, the across-firm spillover effect (the coefficient on ContaminatedProduct×Post)
is smaller (-0.256) for exports to destinations with high information accuracy compared to
exports to countries with low information accuracy (-0.563). The p-value for testing equality
of two coefficients is 0.0288. Results using the news search index are presented in Appendix
A Table 14 and the qualitative takeaways are very similar.
The results show that information accuracy might play an important role in mediating
the collective reputational forces. Moreover, the observed differential search behavior across
countries can be partly due to heterogeneity in media contents in different countries, which
can generate different information sets among local consumers. For example, Appendix A
Figure 10 Panel A shows a typical Chinese media report on the scandal which usually came
with a full list of contaminated firms and products. On the other hand, Panel B shows an
example from the Western media, the New York Times, which only reported an estimated
number of contaminated firms but did not mention any specific name.
6.2 Supply Chain Structure
The production process and supply chain structure could matter for the spillover effects. If
the root cause of a quality defect is limited to an individual firm, consumers may not be
wary of other firms from the same origin-industry. One example of this is the case of the
Samsung Galaxy battery fire. On the other hand, if the quality defect stems from issues
in the upstream supply chain, then consumers might have reason to worry about quality in
other firms that source from the same upstream locations. This is the case for the Chinese
dairy scandal as discussed in Section 2.
To shed light on the role of supply chain structure, we take advantage of the Chinese
Customs Data in which firms are required to report the sourcing location for each of their
export transactions. We leverage this information and identify a firm’s major sourcing
province based on the pre-scandal export activities. We define a dummy variable called
“ContaminatedSource” if a province hosts at least one contaminated firm. Similarly, we
headquarter of Sanlu was located, has the highest search intensity for the keyword “Sanlu”.
19
define a dummy variable called “ContaminatedSourceProduct” if a province hosts at least
one contaminated firm for a given contaminated product.
Table 10 reports the impact of being in a contaminated sourcing location, separately
for innocent and non-inspected firms. The results are quite mixed. In particular, being
in the same sourcing location as the contaminated firms does not necessarily lead to lower
performance.
One challenge for the power of this test is that foreign consumers might not be aware
of the sourcing location of Chinese dairy firms. Another challeng is that in many cases,
a firm’s sourcing location coincides with its physical location: for instance, Sanlu, located
in Hebei province, primarily sourced from milk farmers in Hebei. To the extent that local
dairy products are imperfect substitutes and firms in one location compete in the same
labor market and for the same upstream suppliers, there is a countervailing market share
reallocation effect that would benefit the non-contaminated firms. This may explain the
mixed results in Table 10 as well as the results in Appendix A Table 15 on the overall and
domestic performance of firms sourcing in different areas.
6.3 Individual Reputation
Individual reputation can mitigate the impact of a shock to the industry collective reputa-
tion. In light of a collective reputation shock, a more established individual reputation can
(partially) shield firms from the collective stigma. As many industries in developing coun-
tries, most of the Chinese dairy exporters lack established international brand. However,
some have exported for more years than others before the scandal broke out in 2008. We use
a firm’s exporting experiences (years) as a proxy for its accumulated reputational stock. We
define “new” firms as firms that just entered into exporting in 2008 and define “established”
firms as firms that had exported for one or more years prior to 2008. Table 11 examines the
heterogeneous impact of the scandal on new firms and established firms. In line with the
discussion, the across-firm spillover effect is larger among new exporters. A test of equality
between βacross-firm in Column 1 and 2 has p-value 0.0475, and that for testing the equality
of βacross-firm in Column 3 and 4 has p-value 0.0609.
6.4 Government Regulations
Another important channel for the observed spillover effects is government or third-party
regulations, which can directly affect all firms from the same origin-industry. As we discussed
20
in Section 2, in the context of the 2008 Chinese dairy scandal, several countries imposed
explicit import bans for Chinese dairy products. Appendix B Table 1 list these destinations
by their value share of the total Chinese dairy exports. Most of the bans were lifted in 2015.
One way to think about these trade policy changes is that foreign governments react
on behalf of domestic consumers as concerns regarding quality and safety issues arise about
products from a particular country. These blanket-style reactions are part of the spillovers
created by collective reputation. However, an alternative interpretation is that these trade-
related regulatory hurdles arise from protectionist motives. In other words, foreign gov-
ernment would take advantage of the scandal to raise protectionist barriers. Empirically
it is very difficult to distinguish these two stories. Table 12 presents results obtained by
restricting the sample to only destinations without explicit import bans. These estimates
are very similar to the findings in our main analysis, which suggests that while explicit gov-
ernment regulations might matter for the observed spillovers, they are cannot explain the
spillovers in full. Market-based forces responding to the collective reputation shock also play
an important role.
Summary: To summarize the discussion in this section, first, information accuracy plays
an important role in mediating the collective reputational foces–the spillover effects are
smaller in countries where people exhibited more targeted search behavior and thus better
information about parties involved in the scandal. Second, supply chain structures may
also matter; however, the reputational effect is confounded empirically by the standard
market competition effect. Third, individual reputation can mitigate collective reputation
shocks, and new firms may be the most vulnerable to collective reputation damage. Finally,
while country-specific and industry-wide regulations may explain part of the observed effects,
market-based forces via reputational spillovers also play an important role.
7 Conclusion
Understanding how reputation spreads within an industry or a geographic area is impor-
tant for informing development policy, because collective reputation implies an important
externality. This paper analyzes collective reputational forces in the context of Chinese
dairy firms’ exports following the 2008 scandal. To do so, we combine rich administrative
and survey firm data on exports, domestic production, and quality inspection with news
and search data collected from internet sources. Aggregating these data at the industry
level in a difference-in-differences framework, we find that the average value of dairy exports
21

plummeted by 68% following the scandal. This estimate captures both the direct impact on
contaminated firm-products, as well as the spillovers on non-contaminated firms or products.
By excluding firm-products that are identified as contaminated by government inspections
from our DD analysis, we estimate a spillover effect of the scandal on non-contaminated
firm-products leading to a decrease in exports of 57%, about four fifths of the total effect of
the scandal on the dairy sector.
Our findings highlight collective reputation as an important factor that could affect firm’s
export performance and quality upgrading incentives. Motivated by this fact, we use micro-
level firm-product data to investigate how the effects of the scandal are distributed within the
Chinese dairy sector. Our analysis suggests that contaminated firms saw a drop of 87.8%
in export revenue after the scandal relative to the national trend and the firms’ average
performance. Additionally, we estimate a spillover impact on firms selling a contaminated
product that is about half of the effect on directly contaminated firms. Finally, we were
surprised to find that firms deemed innocent by formal inspections do not appear to be
faring any better than non-inspected firms (and in fact they might be faring worse). This
finding highlights the role that government action can play in signaling firms’ quality and the
challenges governments might face in establishing the reputation needed to create credible
signals.
We further hypothesize that various channels could mediate these collective reputational
effects. Specifically, we investigate whether the following factors appear to play a role in
spreading the effects of the scandal to firms not directly contaminated: information accuracy,
supply chain structure, individual firm reputation and the role of third-party or government
regulations. We split our sample of destination countries based on the likely accuracy of
their knowledge of the firms directly involved in the scandal, and we find that the across-
firm spillover effect is smaller for exports to destinations with higher information accuracy.
Similarly, we find smaller spillovers for firms with a longer experience in exporting. In
contrast, we find less supportive evidence that the nature of the supply chain, with many
firms sourcing from the same incriminated producers, or blanket-style third-party regulation
entirely drive the spillover effects we estimate.
Our findings on the role played by information accuracy and firms’ experience confirm
that collective reputational forces might be particularly relevant for development policy.
Specifically, collective reputational forces may call for government intervention. However,
the details of how government action is carried on appear to matter for the effectiveness
of the action, as shown by the almost counterproductive signal of inspections for innocent
22
firms that we estimate. Alternatively, domestic third party and international certification
bodies might play a useful role in complementing or substituting for government quality
regulations. Yet, based on our knowledge and interviews with firms. people from the Chinese
Dairy Association and international certifiers for food and farm products, such as GlobalGap,
third-party certification has not been adopted in this market. This could be either due to high
costs and logistical hurdles of obtaining these certifications, or perceived low returns from
certification, possibly due to the difficulty of signaling one’s quality amidst the damaged
collective reputation. Understanding the barriers to certification adoption as well as the
effectiveness of these programs is crucial for designing policies that could assure a high
quality standard and lift emerging exporting industries from developing countries out of the
low reputation equilibrium.
Ultimately, the external validity of the results is an empirical question as the exact
magnitudes of spillovers vary across industries and countries. For example, our findings
might underestimate the persistence of collective reputational forces if the scandal led to
changes in the production structure, e.g. fostering vertical integration, or to long-term
quality upgrading due to tightened quality certification and quality standard (Ruan and
Zhang, 2016). The general framework and approach set out here could be used to study
similar issues in other contexts. In future work, we plan to extend the analysis to broader
product categories and market settings, to explore the role played by the salience of the
scandal and the reputational stock of locations and parties involved.
23
References
Abadie, A., A. Diamond, and J. Hainmueller (2010): “Synthetic control methods forcomparative case studies: Estimating the effect of California’s tobacco control program,”Journal of the American statistical Association, 105(490), 493–505.
Abadie, A., and J. Gardeazabal (2003): “The economic costs of conflict: A case studyof the Basque Country,” The American Economic Review, 93(1), 113–132.
Ahluwalia, R., R. E. Burnkrant, and H. R. Unnava (2000): “Consumer response tonegative publicity: The moderating role of commitment,” Journal of marketing research,37(2), 203–214.
Allen, T. (2014): “Information frictions in trade,” Econometrica, 82(6), 2041–2083.
Atkin, D., A. K. Khandelwal, and A. Osman (2017): “Exporting and firm perfor-mance: Evidence from a randomized trial,” Quarterly Journal of Economics.
Bai, J. (2009): “Panel data models with interactive fixed effects,” Econometrica, 77(4),1229–1279.
Banerjee, A. V. (2013): “Microcredit under the microscope: what have we learned in thepast two decades, and what do we need to know?,” Annu. Rev. Econ., 5(1), 487–519.
Banerjee, A. V., and E. Duflo (2000): “Reputation Effects And The Limits Of Con-tracting: A Study Of The Indian Software Industry,” The Quarterly Journal of Economics,115(3), 989–1017.
Bardhan, P., D. Mookherjee, and M. Tsumagari (2013): “Middlemen Margins andGlobalization,” American Economic Journal: Microeconomics, 5(4), 81–119.
Bjorkman-Nyqvist, M., J. Svensson, and D. Yanagizawa-Drott (2013): “Themarket for (fake) antimalarial medicine: Evidence from uganda,” .
Bloom, N., B. Eifert, A. Mahajan, D. McKenzie, and J. Roberts (2013): “DoesManagement Matter? Evidence from India*.,” Quarterly Journal of Economics, 128(1).
Brandt, L., J. Van Biesebroeck, and Y. Zhang (2012): “Creative accounting orcreative destruction? Firm-level productivity growth in Chinese manufacturing,” Journalof development economics, 97(2), 339–351.
Davidson, W. N., and D. L. Worrell (1992): “Research notes and communications:The effect of product recall announcements on shareholder wealth,” Strategic managementjournal, 13(6), 467–473.
Dawar, N., and M. M. Pillutla (2000): “Impact of product-harm crises on brandequity: The moderating role of consumer expectations,” Journal of marketing research,37(2), 215–226.
24
De Loecker, J., and P. K. Goldberg (2014): “Firm performance in a global market,”Annu. Rev. Econ., 6(1), 201–227.
De Mel, S., D. McKenzie, and C. Woodruff (2008): “Returns to capital in microen-terprises: evidence from a field experiment,” The Quarterly Journal of Economics, 123(4),1329–1372.
Gobillon, L., and T. Magnac (2016): “Regional policy evaluation: Interactive fixedeffects and synthetic controls,” Review of Economics and Statistics, 98(3), 535–551.
Harrison, A., and A. Rodrıguez-Clare (2009): “Trade, foreign investment, and indus-trial policy for developing countries,” Handbook of Development Economics, 5, 4039–4214.
Hau, A. K.-c., T. H. Kwan, and P. K.-t. Li (2009): “Melamine toxicity and thekidney,” Journal of the American Society of Nephrology, 20(2), 245–250.
Jin, G. Z., and P. Leslie (2009): “Reputational incentives for restaurant hygiene,”American Economic Journal: Microeconomics, 1(1), 237–267.
Kugler, M., and E. Verhoogen (2012): “Prices, plant size, and product quality,” TheReview of Economic Studies, 79(1), 307–339.
List, J. A. (2006): “The Behavioralist Meets the Market: Measuring Social Preferencesand Reputation Effects in Actual Transactions,” Journal of Political Economy, 114(1),1–37.
Ma, J., Z. Wang, and T. Khanna (Working Paper): “Milk Safety in China: A FieldExperiment,” .
Macchiavello, R. (2010): “Development uncorked: Reputation acquisition in the newmarket for Chilean wines in the UK,” .
Macchiavello, R., and A. Morjaria (2015): “The value of relationships: evidencefrom a supply shock to Kenyan rose exports,” The American Economic Review, 105(9),2911–2945.
Manova, K., and Z. Zhang (2012): “Export prices across firms and destinations,” TheQuarterly Journal of Economics, p. qjr051.
Marcus, R. D., S. Swidler, and T. L. Zivney (1987): “An explanation of why share-holders’ losses are so large after drug recalls,” Managerial and Decision Economics, 8(4),295–300.
Park, A., D. Yang, X. Shi, and Y. Jiang (2010): “Exporting and firm performance:Chinese exporters and the Asian financial crisis,” The Review of Economics and Statistics,92(4), 822–842.
Ruan, J., and X. Zhang (2016): “Low-Quality Crisis and Quality Improvement: TheCase of Industrial Clusters in Zhejiang Province,” Industrial Districts in History and theDeveloping World, pp. 169–189.
25
Startz, M. (2017): “The value of face-to-face: Search and contracting problems in Nigeriantrade,” Discussion paper.
Van Heerde, H., K. Helsen, and M. G. Dekimpe (2007): “The impact of a product-harm crisis on marketing effectiveness,” Marketing Science, 26(2), 230–245.
Verhoogen, E. A. (2008): “Trade, quality upgrading, and wage inequality in the Mexicanmanufacturing sector,” The Quarterly Journal of Economics, 123(2), 489–530.
Zhao, X., Y. Lee, S. Ng, and B. B. Flynn (2009): “The impact of product re-call announcements on stock market reaction: a study of Chinese listed companies,”US-China Business Cooperation in the 21st Century: Opportunities and Challenges forEnterpreneurs, p. 28.
26

Figure 1: Event Study Graph: China’s Dairy Exports
Note: This figure plots Chinese dairy annual exporting value and quantity from 2000 to 2013.
27
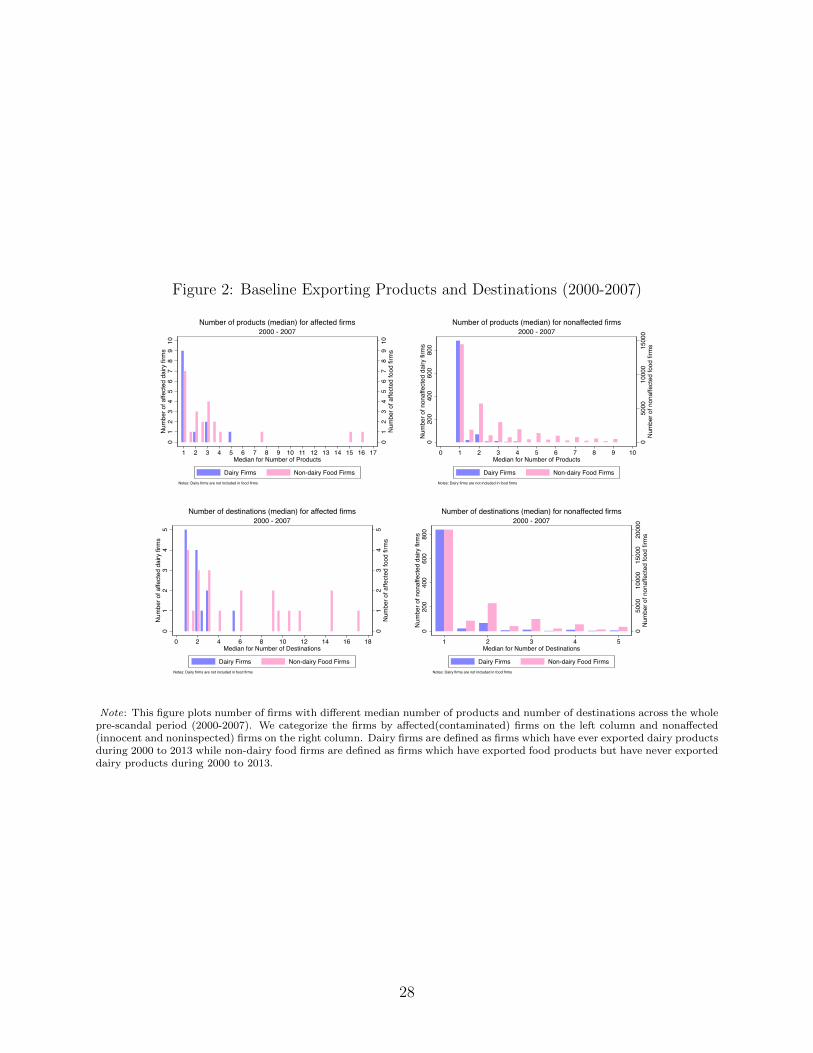
Figure 2: Baseline Exporting Products and Destinations (2000-2007)
01
23
45
67
89
10N
umbe
r of a
ffect
ed fo
od fi
rms
01
23
45
67
89
10N
umbe
r of a
ffect
ed d
airy
firm
s
1 2 3 4 5 6 7 8 9 10 11 12 13 14 15 16 17Median for Number of Products
Dairy Firms Non-dairy Food FirmsNotes: Dairy firms are not included in food firms
2000 - 2007Number of products (median) for affected firms
050
0010
000
1500
0N
umbe
r of n
onaf
fect
ed fo
od fi
rms
020
040
060
080
0N
umbe
r of n
onaf
fect
ed d
airy
firm
s
0 1 2 3 4 5 6 7 8 9 10Median for Number of Products
Dairy Firms Non-dairy Food FirmsNotes: Dairy firms are not included in food firms
2000 - 2007Number of products (median) for nonaffected firms
01
23
45
Num
ber o
f affe
cted
food
firm
s
01
23
45
Num
ber o
f affe
cted
dai
ry fi
rms
0 2 4 6 8 10 12 14 16 18Median for Number of Destinations
Dairy Firms Non-dairy Food FirmsNotes: Dairy firms are not included in food firms
2000 - 2007Number of destinations (median) for affected firms
050
0010
000
1500
020
000
Num
ber o
f non
affe
cted
food
firm
s
020
040
060
080
0N
umbe
r of n
onaf
fect
ed d
airy
firm
s
1 2 3 4 5Median for Number of Destinations
Dairy Firms Non-dairy Food FirmsNotes: Dairy firms are not included in food firms
2000 - 2007Number of destinations (median) for nonaffected firms
Note: This figure plots number of firms with different median number of products and number of destinations across the wholepre-scandal period (2000-2007). We categorize the firms by affected(contaminated) firms on the left column and nonaffected(innocent and noninspected) firms on the right column. Dairy firms are defined as firms which have ever exported dairy productsduring 2000 to 2013 while non-dairy food firms are defined as firms which have exported food products but have never exporteddairy products during 2000 to 2013.
28
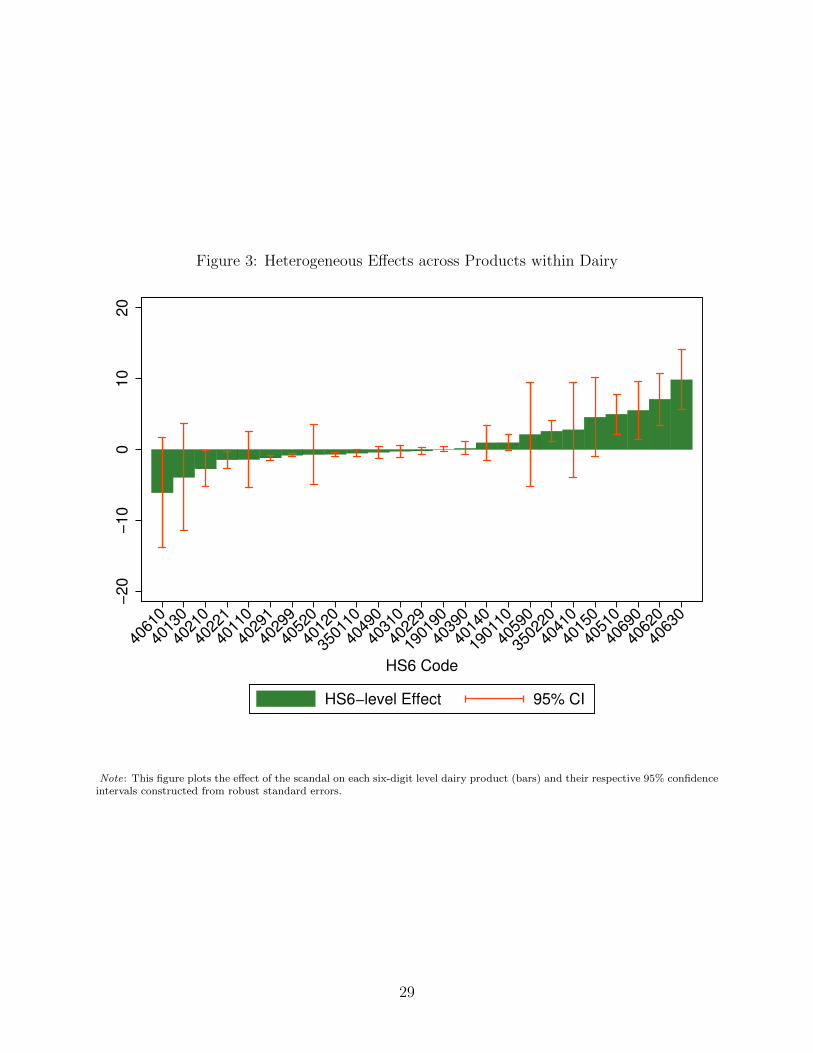
Figure 3: Heterogeneous Effects across Products within Dairy
−2
0−
10
01
02
0
40610
40130
40210
40221
40110
40291
40299
40520
40120
350110
40490
40310
40229
190190
40390
40140
190110
40590
350220
40410
40150
40510
40690
40620
40630
HS6 Code
HS6−level Effect 95% CI
Note: This figure plots the effect of the scandal on each six-digit level dairy product (bars) and their respective 95% confidenceintervals constructed from robust standard errors.
29
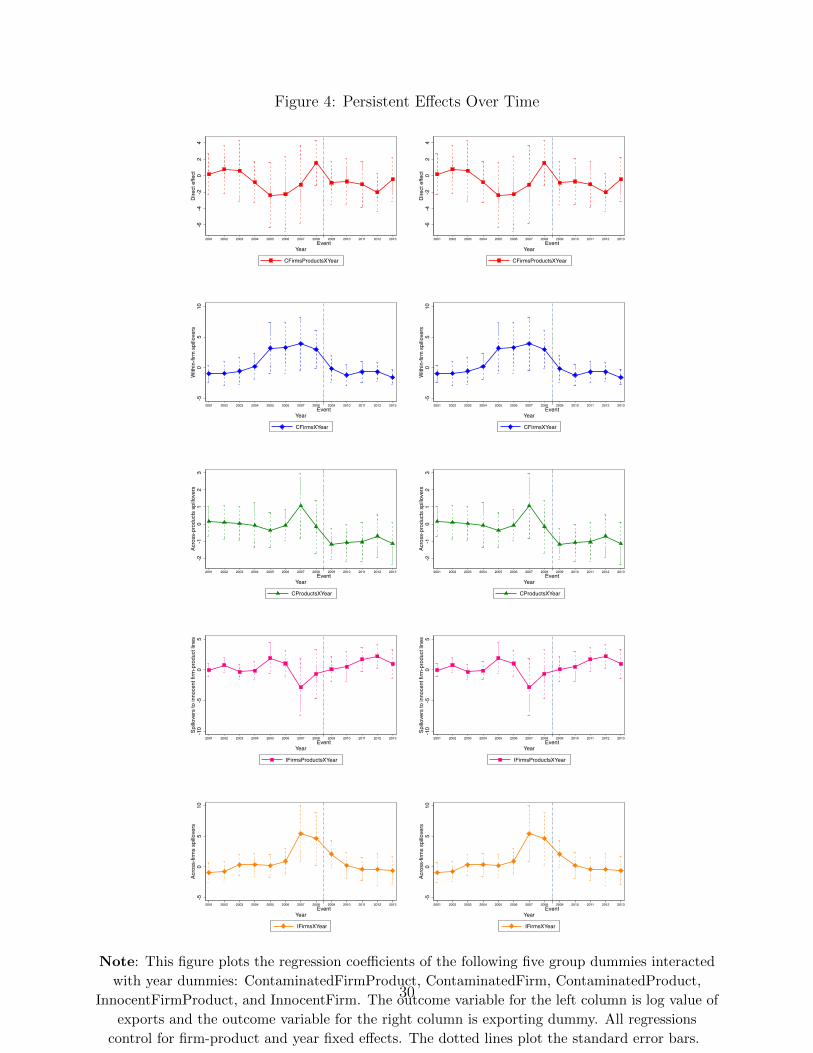
Figure 4: Persistent Effects Over Time
-6-4
-20
24
Dire
ct e
ffect
2001 2002 2003 2004 2005 2006 2007 2008 2009 2010 2011 2012 2013Event
Year
CFirmsProductsXYear
-6-4
-20
24
Dire
ct e
ffect
2001 2002 2003 2004 2005 2006 2007 2008 2009 2010 2011 2012 2013Event
Year
CFirmsProductsXYear
-50
510
With
in-fi
rm s
pillo
vers
2001 2002 2003 2004 2005 2006 2007 2008 2009 2010 2011 2012 2013Event
Year
CFirmsXYear-5
05
10W
ithin
-firm
spi
llove
rs
2001 2002 2003 2004 2005 2006 2007 2008 2009 2010 2011 2012 2013Event
Year
CFirmsXYear
-2-1
01
23
Acro
ss-p
rodu
cts
spillo
vers
2001 2002 2003 2004 2005 2006 2007 2008 2009 2010 2011 2012 2013Event
Year
CProductsXYear
-2-1
01
23
Acro
ss-p
rodu
cts
spillo
vers
2001 2002 2003 2004 2005 2006 2007 2008 2009 2010 2011 2012 2013Event
Year
CProductsXYear
-10
-50
5Sp
illove
rs to
inno
cent
firm
-pro
duct
line
s
2001 2002 2003 2004 2005 2006 2007 2008 2009 2010 2011 2012 2013Event
Year
IFirmsProductsXYear
-10
-50
5Sp
illove
rs to
inno
cent
firm
-pro
duct
line
s
2001 2002 2003 2004 2005 2006 2007 2008 2009 2010 2011 2012 2013Event
Year
IFirmsProductsXYear
-50
510
Acro
ss-fi
rms
spillo
vers
2001 2002 2003 2004 2005 2006 2007 2008 2009 2010 2011 2012 2013Event
Year
IFirmsXYear
-50
510
Acro
ss-fi
rms
spillo
vers
2001 2002 2003 2004 2005 2006 2007 2008 2009 2010 2011 2012 2013Event
Year
IFirmsXYear
Note: This figure plots the regression coefficients of the following five group dummies interacted
with year dummies: ContaminatedFirmProduct, ContaminatedFirm, ContaminatedProduct,
InnocentFirmProduct, and InnocentFirm. The outcome variable for the left column is log value of
exports and the outcome variable for the right column is exporting dummy. All regressions
control for firm-product and year fixed effects. The dotted lines plot the standard error bars.
30
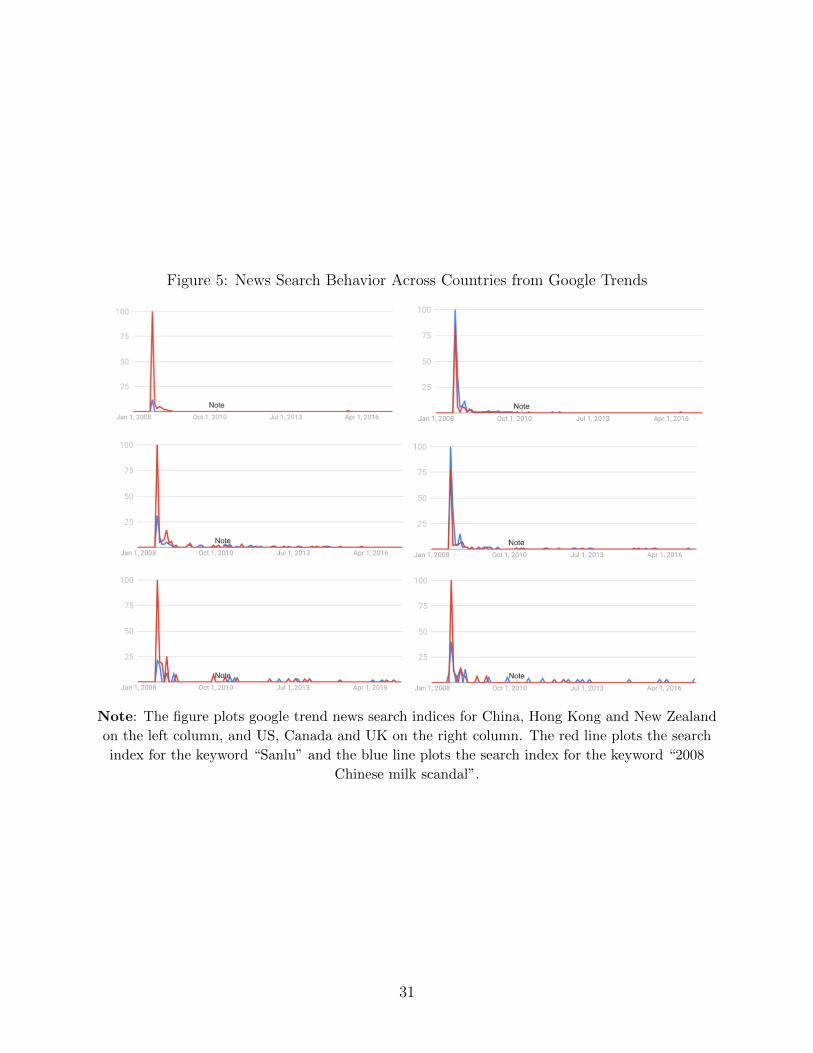
Figure 5: News Search Behavior Across Countries from Google Trends
Note: The figure plots google trend news search indices for China, Hong Kong and New Zealand
on the left column, and US, Canada and UK on the right column. The red line plots the search
index for the keyword “Sanlu” and the blue line plots the search index for the keyword “2008
Chinese milk scandal”.
31
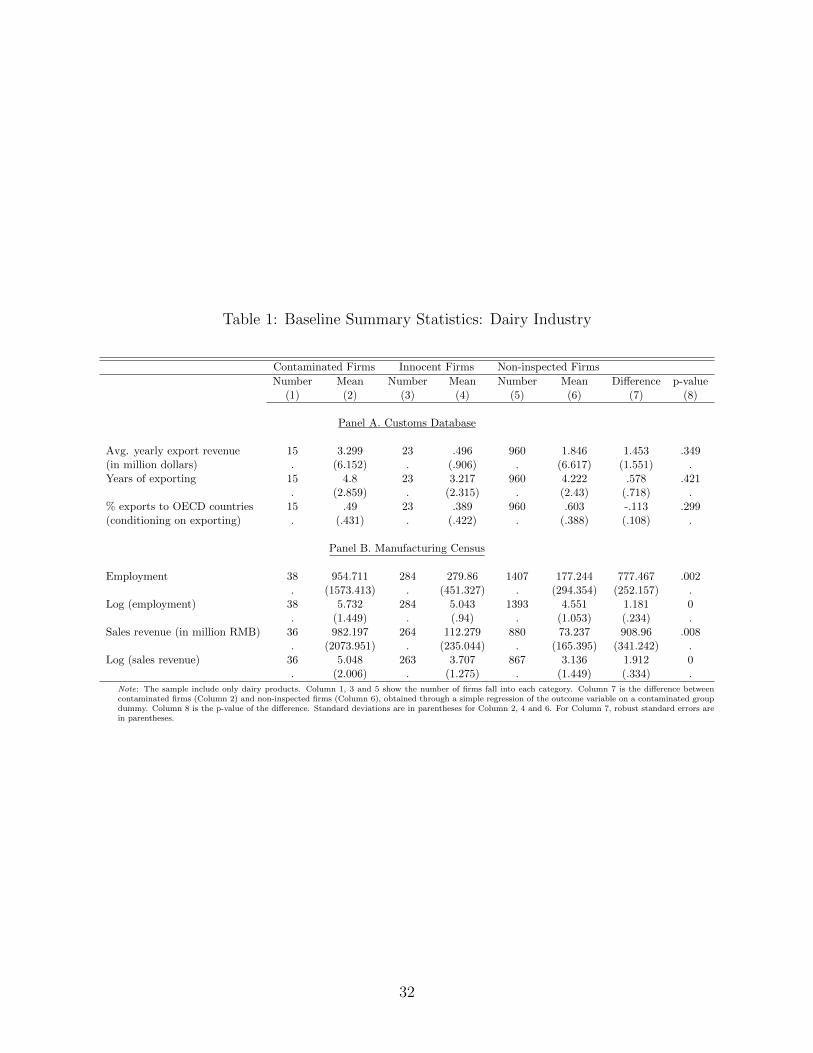
Table 1: Baseline Summary Statistics: Dairy Industry
Contaminated Firms Innocent Firms Non-inspected Firms
Number Mean Number Mean Number Mean Difference p-value(1) (2) (3) (4) (5) (6) (7) (8)
Panel A. Customs Database
Avg. yearly export revenue 15 3.299 23 .496 960 1.846 1.453 .349(in million dollars) . (6.152) . (.906) . (6.617) (1.551) .Years of exporting 15 4.8 23 3.217 960 4.222 .578 .421
. (2.859) . (2.315) . (2.43) (.718) .% exports to OECD countries 15 .49 23 .389 960 .603 -.113 .299(conditioning on exporting) . (.431) . (.422) . (.388) (.108) .
Panel B. Manufacturing Census
Employment 38 954.711 284 279.86 1407 177.244 777.467 .002. (1573.413) . (451.327) . (294.354) (252.157) .
Log (employment) 38 5.732 284 5.043 1393 4.551 1.181 0. (1.449) . (.94) . (1.053) (.234) .
Sales revenue (in million RMB) 36 982.197 264 112.279 880 73.237 908.96 .008. (2073.951) . (235.044) . (165.395) (341.242) .
Log (sales revenue) 36 5.048 263 3.707 867 3.136 1.912 0. (2.006) . (1.275) . (1.449) (.334) .
Note: The sample include only dairy products. Column 1, 3 and 5 show the number of firms fall into each category. Column 7 is the difference betweencontaminated firms (Column 2) and non-inspected firms (Column 6), obtained through a simple regression of the outcome variable on a contaminated groupdummy. Column 8 is the p-value of the difference. Standard deviations are in parentheses for Column 2, 4 and 6. For Column 7, robust standard errors arein parentheses.
32
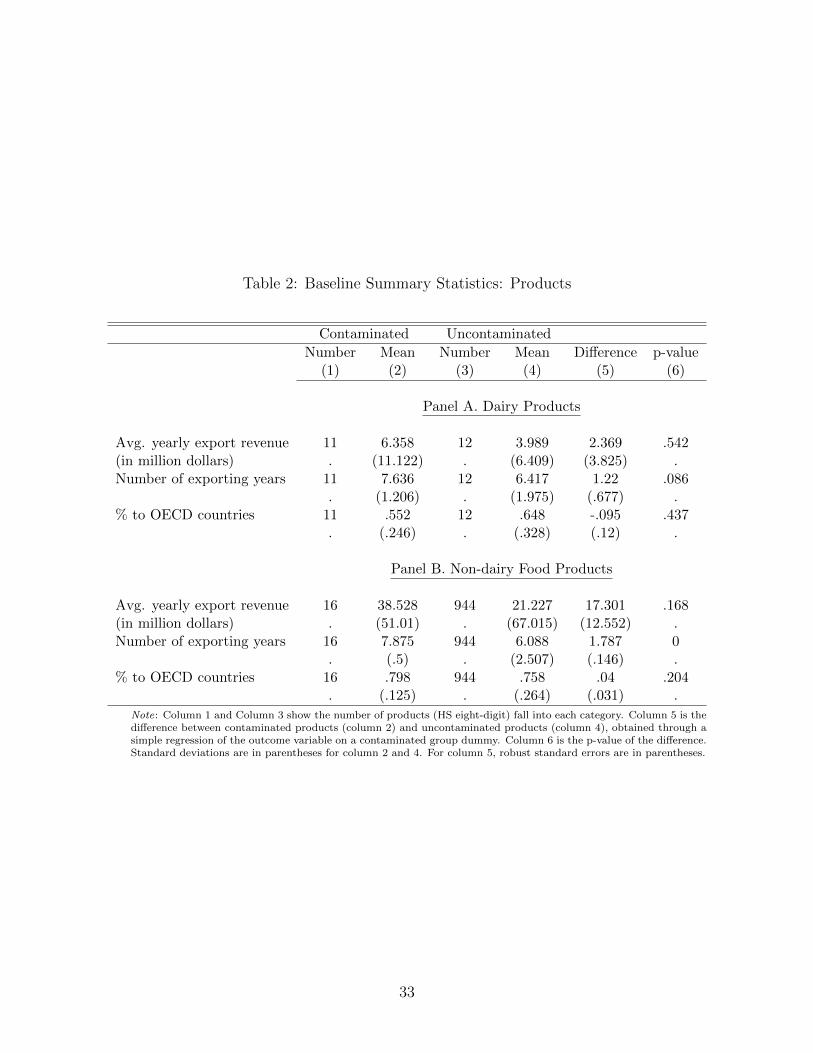
Table 2: Baseline Summary Statistics: Products
Contaminated Uncontaminated
Number Mean Number Mean Difference p-value(1) (2) (3) (4) (5) (6)
Panel A. Dairy Products
Avg. yearly export revenue 11 6.358 12 3.989 2.369 .542(in million dollars) . (11.122) . (6.409) (3.825) .Number of exporting years 11 7.636 12 6.417 1.22 .086
. (1.206) . (1.975) (.677) .% to OECD countries 11 .552 12 .648 -.095 .437
. (.246) . (.328) (.12) .
Panel B. Non-dairy Food Products
Avg. yearly export revenue 16 38.528 944 21.227 17.301 .168(in million dollars) . (51.01) . (67.015) (12.552) .Number of exporting years 16 7.875 944 6.088 1.787 0
. (.5) . (2.507) (.146) .% to OECD countries 16 .798 944 .758 .04 .204
. (.125) . (.264) (.031) .
Note: Column 1 and Column 3 show the number of products (HS eight-digit) fall into each category. Column 5 is thedifference between contaminated products (column 2) and uncontaminated products (column 4), obtained through asimple regression of the outcome variable on a contaminated group dummy. Column 6 is the p-value of the difference.Standard deviations are in parentheses for column 2 and 4. For column 5, robust standard errors are in parentheses.
33
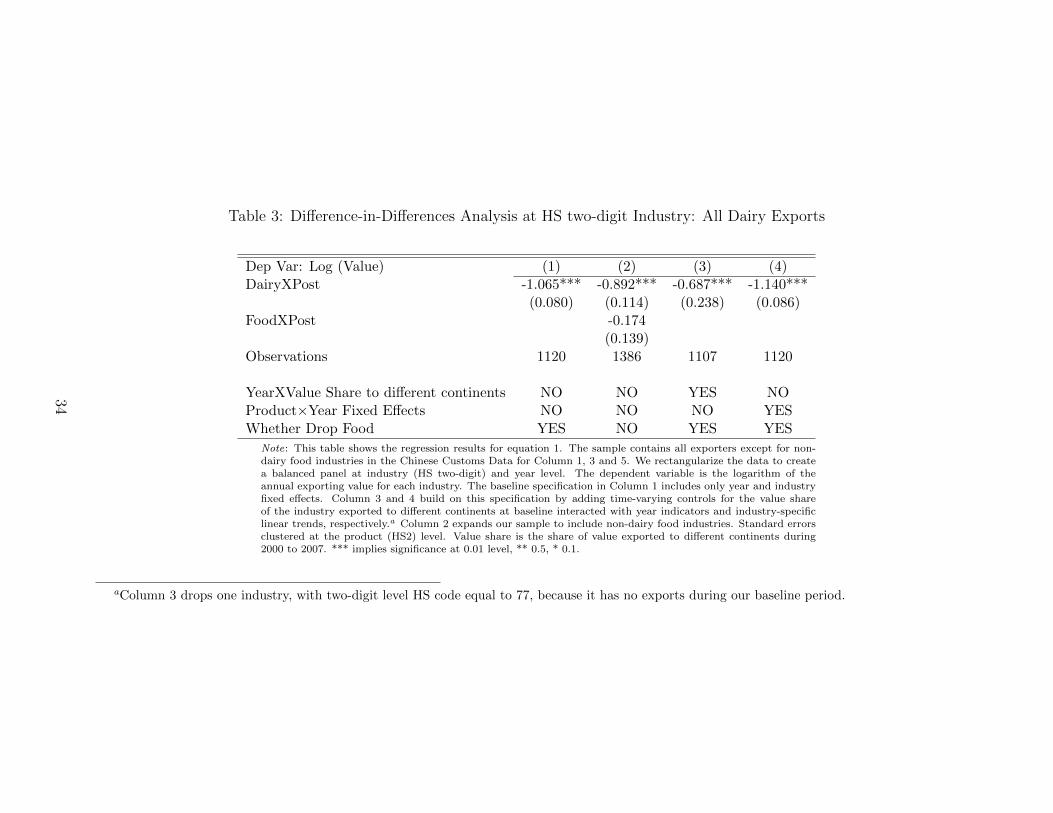
Table 3: Difference-in-Differences Analysis at HS two-digit Industry: All Dairy Exports
Dep Var: Log (Value) (1) (2) (3) (4)DairyXPost -1.065*** -0.892*** -0.687*** -1.140***
(0.080) (0.114) (0.238) (0.086)FoodXPost -0.174
(0.139)Observations 1120 1386 1107 1120
YearXValue Share to different continents NO NO YES NOProduct×Year Fixed Effects NO NO NO YESWhether Drop Food YES NO YES YES
Note: This table shows the regression results for equation 1. The sample contains all exporters except for non-dairy food industries in the Chinese Customs Data for Column 1, 3 and 5. We rectangularize the data to createa balanced panel at industry (HS two-digit) and year level. The dependent variable is the logarithm of theannual exporting value for each industry. The baseline specification in Column 1 includes only year and industryfixed effects. Column 3 and 4 build on this specification by adding time-varying controls for the value shareof the industry exported to different continents at baseline interacted with year indicators and industry-specificlinear trends, respectively.a Column 2 expands our sample to include non-dairy food industries. Standard errorsclustered at the product (HS2) level. Value share is the share of value exported to different continents during2000 to 2007. *** implies significance at 0.01 level, ** 0.5, * 0.1.
aColumn 3 drops one industry, with two-digit level HS code equal to 77, because it has no exports during our baseline period.
34
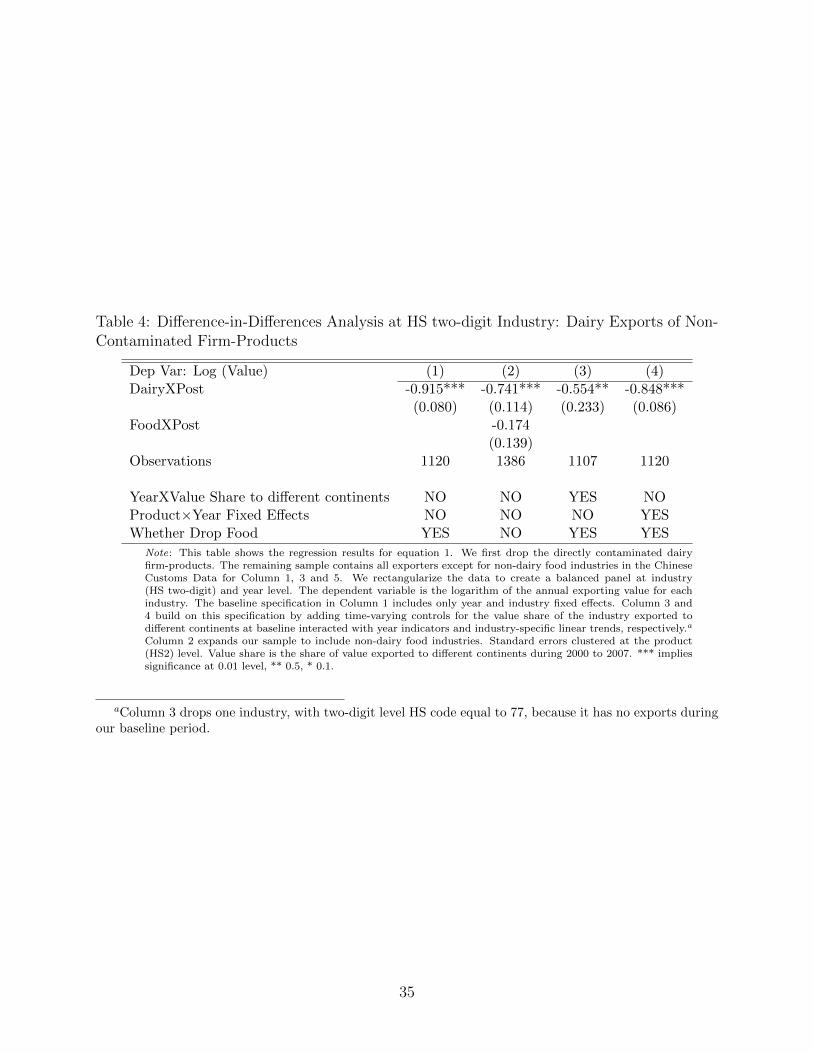
Table 4: Difference-in-Differences Analysis at HS two-digit Industry: Dairy Exports of Non-Contaminated Firm-Products
Dep Var: Log (Value) (1) (2) (3) (4)DairyXPost -0.915*** -0.741*** -0.554** -0.848***
(0.080) (0.114) (0.233) (0.086)FoodXPost -0.174
(0.139)Observations 1120 1386 1107 1120
YearXValue Share to different continents NO NO YES NOProduct×Year Fixed Effects NO NO NO YESWhether Drop Food YES NO YES YES
Note: This table shows the regression results for equation 1. We first drop the directly contaminated dairyfirm-products. The remaining sample contains all exporters except for non-dairy food industries in the ChineseCustoms Data for Column 1, 3 and 5. We rectangularize the data to create a balanced panel at industry(HS two-digit) and year level. The dependent variable is the logarithm of the annual exporting value for eachindustry. The baseline specification in Column 1 includes only year and industry fixed effects. Column 3 and4 build on this specification by adding time-varying controls for the value share of the industry exported todifferent continents at baseline interacted with year indicators and industry-specific linear trends, respectively.a
Column 2 expands our sample to include non-dairy food industries. Standard errors clustered at the product(HS2) level. Value share is the share of value exported to different continents during 2000 to 2007. *** impliessignificance at 0.01 level, ** 0.5, * 0.1.
aColumn 3 drops one industry, with two-digit level HS code equal to 77, because it has no exports duringour baseline period.
35

Table 5: Firm-Product Level Analysis: Impact of the Scandal on Export Performance
Sample: Dairy exporters (Chinese Customs Data 2000-2013)
Log (Value) Log (Quantity) Log (Price) Exporting
(1) (2) (3) (4)CFirm-ProductXPost -0.637 -0.427 -0.393** -0.032
(1.362) (1.347) (0.173) (0.082)CFirmXPost -2.097*** -2.141*** 0.293 -0.147***
(0.507) (0.534) (0.195) (0.034)CProductXPost -1.111*** -1.063*** -0.147** -0.085***
(0.285) (0.262) (0.072) (0.021)IFirm-ProductXPost 1.124 1.040 -0.302* 0.077
(1.114) (1.062) (0.173) (0.071)IFirmXPost -0.932 -0.866 0.178 -0.072
(0.811) (0.755) (0.149) (0.058)
Firm-product FE YES YES YES YESYear FE YES YES YES YES
Note: This table shows the regression results for the effects of the scandal on exports. The samplecontains all dairy exporters in the Chinese Customs Data. We rectangularize the data to create abalanced panel at firm-product (HS eight-digit) and year level for outcomes in Column 1, 2 and 4.We do so by filling in a small value for missing year observations before taking log. The interactionterms are the products of the post-scandal dummy (2009-2013) with the following five group indica-tors: ContaminatedFirmProduct, ContaminatedFirm, ContaminatedProduct, InnocentFirmProduct,and InnocentFirm. The omitted group is non-contaminated products from non-inspected firms. Allregressions control for firm-product and year fixed effects. Standard errors are two-way clustered atthe firm and product-year level. *** implies significance at 0.01 level, ** 0.5, * 0.1.
36
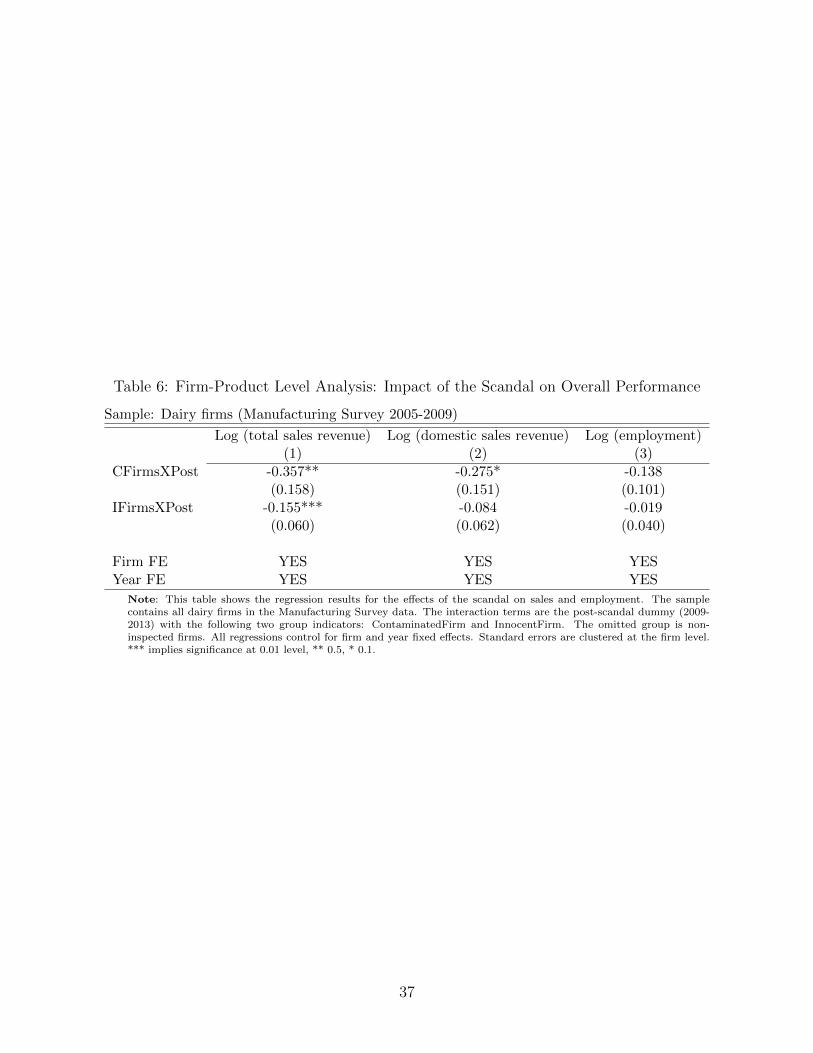
Table 6: Firm-Product Level Analysis: Impact of the Scandal on Overall Performance
Sample: Dairy firms (Manufacturing Survey 2005-2009)
Log (total sales revenue) Log (domestic sales revenue) Log (employment)(1) (2) (3)
CFirmsXPost -0.357** -0.275* -0.138(0.158) (0.151) (0.101)
IFirmsXPost -0.155*** -0.084 -0.019(0.060) (0.062) (0.040)
Firm FE YES YES YESYear FE YES YES YES
Note: This table shows the regression results for the effects of the scandal on sales and employment. The samplecontains all dairy firms in the Manufacturing Survey data. The interaction terms are the post-scandal dummy (2009-2013) with the following two group indicators: ContaminatedFirm and InnocentFirm. The omitted group is non-inspected firms. All regressions control for firm and year fixed effects. Standard errors are clustered at the firm level.*** implies significance at 0.01 level, ** 0.5, * 0.1.
37
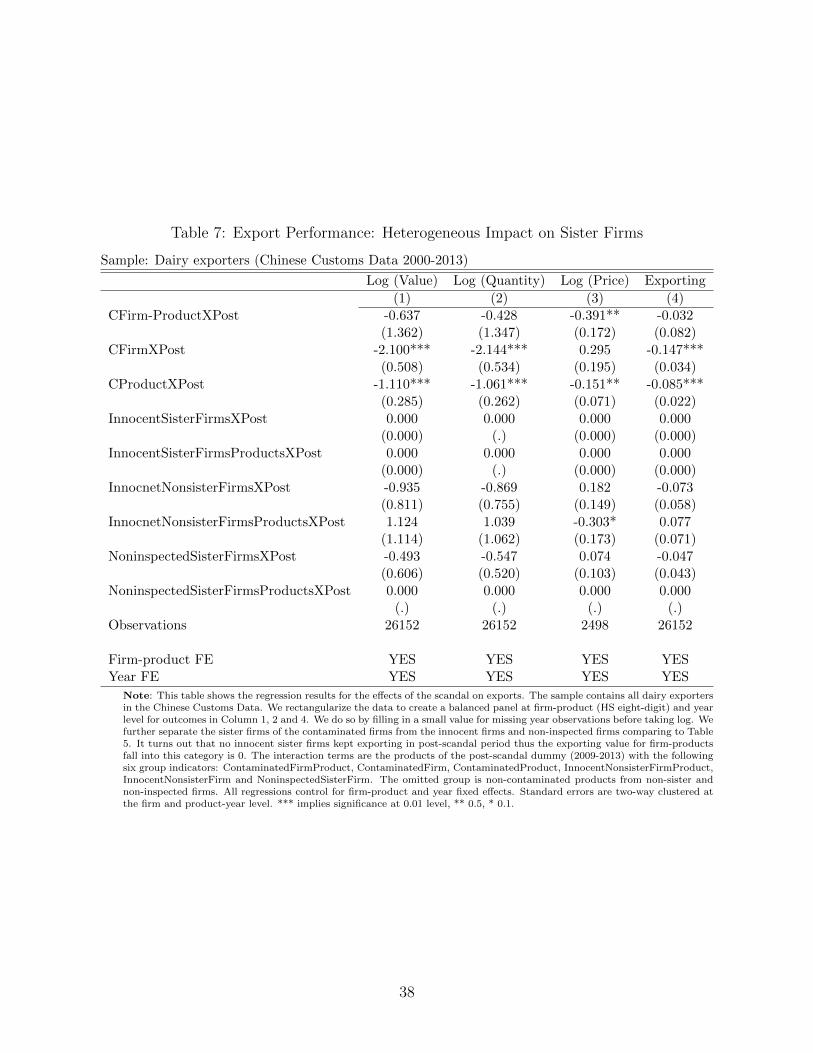
Table 7: Export Performance: Heterogeneous Impact on Sister Firms
Sample: Dairy exporters (Chinese Customs Data 2000-2013)
Log (Value) Log (Quantity) Log (Price) Exporting
(1) (2) (3) (4)CFirm-ProductXPost -0.637 -0.428 -0.391** -0.032
(1.362) (1.347) (0.172) (0.082)CFirmXPost -2.100*** -2.144*** 0.295 -0.147***
(0.508) (0.534) (0.195) (0.034)CProductXPost -1.110*** -1.061*** -0.151** -0.085***
(0.285) (0.262) (0.071) (0.022)InnocentSisterFirmsXPost 0.000 0.000 0.000 0.000
(0.000) (.) (0.000) (0.000)InnocentSisterFirmsProductsXPost 0.000 0.000 0.000 0.000
(0.000) (.) (0.000) (0.000)InnocnetNonsisterFirmsXPost -0.935 -0.869 0.182 -0.073
(0.811) (0.755) (0.149) (0.058)InnocnetNonsisterFirmsProductsXPost 1.124 1.039 -0.303* 0.077
(1.114) (1.062) (0.173) (0.071)NoninspectedSisterFirmsXPost -0.493 -0.547 0.074 -0.047
(0.606) (0.520) (0.103) (0.043)NoninspectedSisterFirmsProductsXPost 0.000 0.000 0.000 0.000
(.) (.) (.) (.)Observations 26152 26152 2498 26152
Firm-product FE YES YES YES YESYear FE YES YES YES YES
Note: This table shows the regression results for the effects of the scandal on exports. The sample contains all dairy exportersin the Chinese Customs Data. We rectangularize the data to create a balanced panel at firm-product (HS eight-digit) and yearlevel for outcomes in Column 1, 2 and 4. We do so by filling in a small value for missing year observations before taking log. Wefurther separate the sister firms of the contaminated firms from the innocent firms and non-inspected firms comparing to Table5. It turns out that no innocent sister firms kept exporting in post-scandal period thus the exporting value for firm-productsfall into this category is 0. The interaction terms are the products of the post-scandal dummy (2009-2013) with the followingsix group indicators: ContaminatedFirmProduct, ContaminatedFirm, ContaminatedProduct, InnocentNonsisterFirmProduct,InnocentNonsisterFirm and NoninspectedSisterFirm. The omitted group is non-contaminated products from non-sister andnon-inspected firms. All regressions control for firm-product and year fixed effects. Standard errors are two-way clustered atthe firm and product-year level. *** implies significance at 0.01 level, ** 0.5, * 0.1.
38
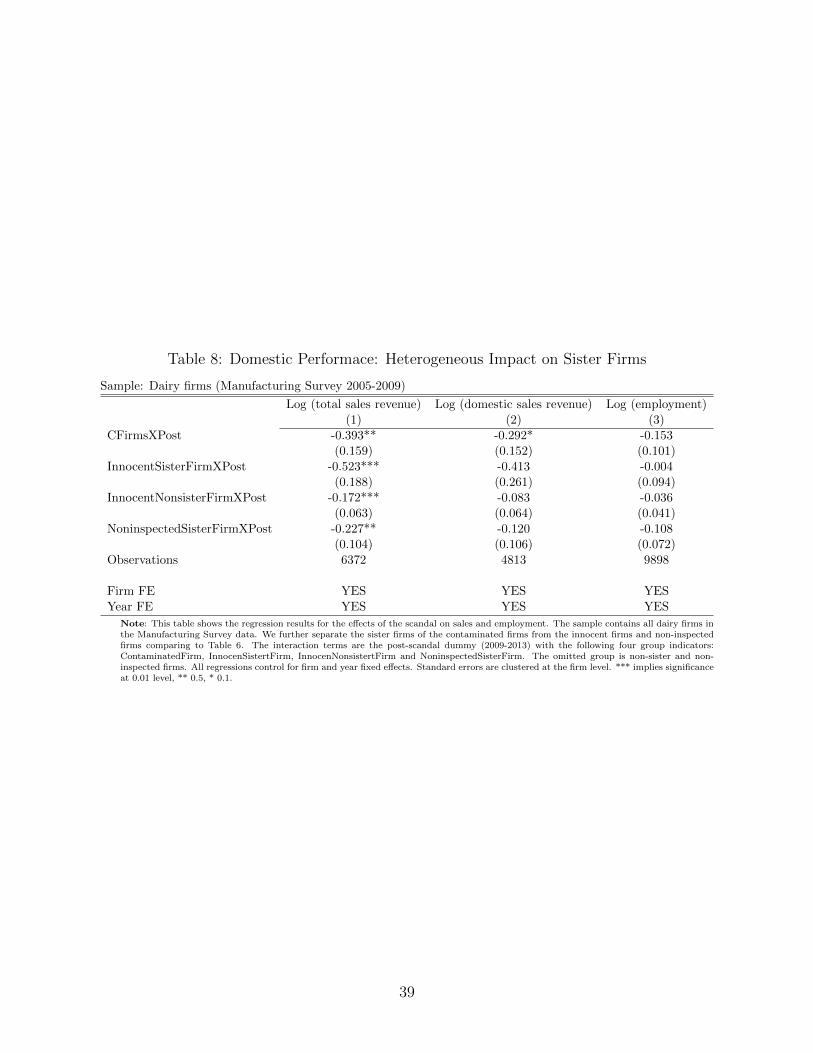
Table 8: Domestic Performace: Heterogeneous Impact on Sister Firms
Sample: Dairy firms (Manufacturing Survey 2005-2009)
Log (total sales revenue) Log (domestic sales revenue) Log (employment)(1) (2) (3)
CFirmsXPost -0.393** -0.292* -0.153(0.159) (0.152) (0.101)
InnocentSisterFirmXPost -0.523*** -0.413 -0.004(0.188) (0.261) (0.094)
InnocentNonsisterFirmXPost -0.172*** -0.083 -0.036(0.063) (0.064) (0.041)
NoninspectedSisterFirmXPost -0.227** -0.120 -0.108(0.104) (0.106) (0.072)
Observations 6372 4813 9898
Firm FE YES YES YESYear FE YES YES YES
Note: This table shows the regression results for the effects of the scandal on sales and employment. The sample contains all dairy firms inthe Manufacturing Survey data. We further separate the sister firms of the contaminated firms from the innocent firms and non-inspectedfirms comparing to Table 6. The interaction terms are the post-scandal dummy (2009-2013) with the following four group indicators:ContaminatedFirm, InnocenSistertFirm, InnocenNonsistertFirm and NoninspectedSisterFirm. The omitted group is non-sister and non-inspected firms. All regressions control for firm and year fixed effects. Standard errors are clustered at the firm level. *** implies significanceat 0.01 level, ** 0.5, * 0.1.
39
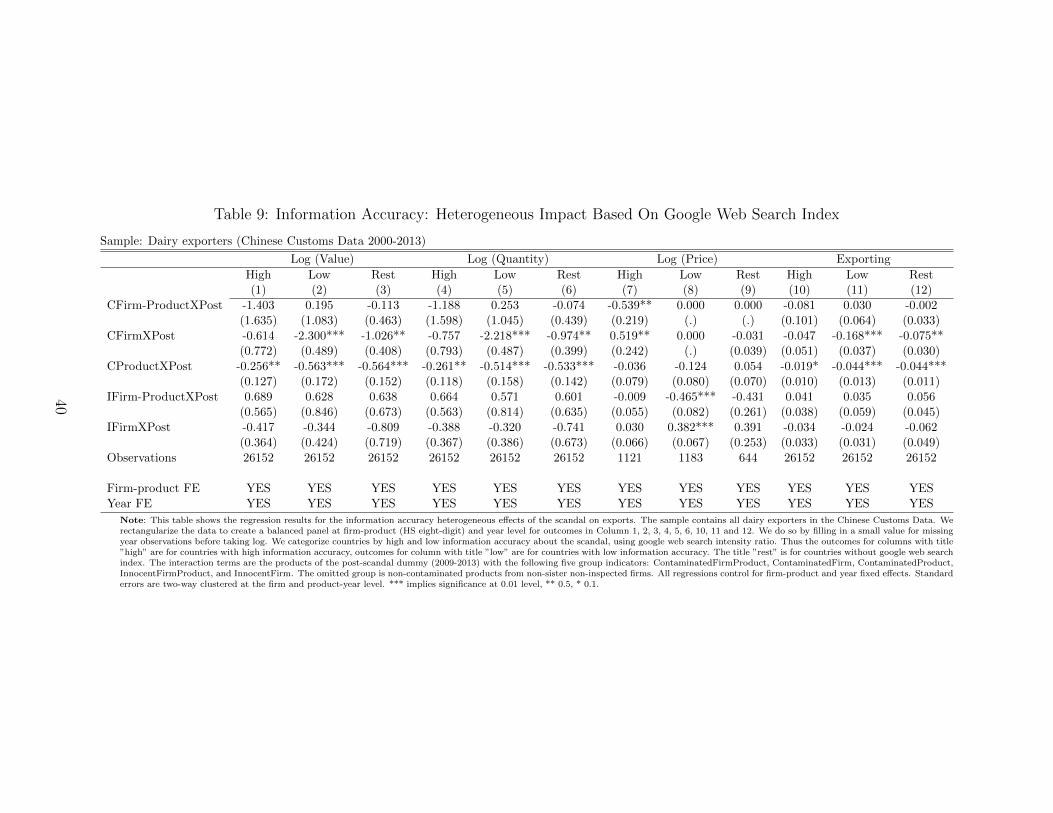
Table 9: Information Accuracy: Heterogeneous Impact Based On Google Web Search Index
Sample: Dairy exporters (Chinese Customs Data 2000-2013)
Log (Value) Log (Quantity) Log (Price) Exporting
High Low Rest High Low Rest High Low Rest High Low Rest(1) (2) (3) (4) (5) (6) (7) (8) (9) (10) (11) (12)
CFirm-ProductXPost -1.403 0.195 -0.113 -1.188 0.253 -0.074 -0.539** 0.000 0.000 -0.081 0.030 -0.002(1.635) (1.083) (0.463) (1.598) (1.045) (0.439) (0.219) (.) (.) (0.101) (0.064) (0.033)
CFirmXPost -0.614 -2.300*** -1.026** -0.757 -2.218*** -0.974** 0.519** 0.000 -0.031 -0.047 -0.168*** -0.075**(0.772) (0.489) (0.408) (0.793) (0.487) (0.399) (0.242) (.) (0.039) (0.051) (0.037) (0.030)
CProductXPost -0.256** -0.563*** -0.564*** -0.261** -0.514*** -0.533*** -0.036 -0.124 0.054 -0.019* -0.044*** -0.044***(0.127) (0.172) (0.152) (0.118) (0.158) (0.142) (0.079) (0.080) (0.070) (0.010) (0.013) (0.011)
IFirm-ProductXPost 0.689 0.628 0.638 0.664 0.571 0.601 -0.009 -0.465*** -0.431 0.041 0.035 0.056(0.565) (0.846) (0.673) (0.563) (0.814) (0.635) (0.055) (0.082) (0.261) (0.038) (0.059) (0.045)
IFirmXPost -0.417 -0.344 -0.809 -0.388 -0.320 -0.741 0.030 0.382*** 0.391 -0.034 -0.024 -0.062(0.364) (0.424) (0.719) (0.367) (0.386) (0.673) (0.066) (0.067) (0.253) (0.033) (0.031) (0.049)
Observations 26152 26152 26152 26152 26152 26152 1121 1183 644 26152 26152 26152
Firm-product FE YES YES YES YES YES YES YES YES YES YES YES YESYear FE YES YES YES YES YES YES YES YES YES YES YES YES
Note: This table shows the regression results for the information accuracy heterogeneous effects of the scandal on exports. The sample contains all dairy exporters in the Chinese Customs Data. Werectangularize the data to create a balanced panel at firm-product (HS eight-digit) and year level for outcomes in Column 1, 2, 3, 4, 5, 6, 10, 11 and 12. We do so by filling in a small value for missingyear observations before taking log. We categorize countries by high and low information accuracy about the scandal, using google web search intensity ratio. Thus the outcomes for columns with title”high” are for countries with high information accuracy, outcomes for column with title ”low” are for countries with low information accuracy. The title ”rest” is for countries without google web searchindex. The interaction terms are the products of the post-scandal dummy (2009-2013) with the following five group indicators: ContaminatedFirmProduct, ContaminatedFirm, ContaminatedProduct,InnocentFirmProduct, and InnocentFirm. The omitted group is non-contaminated products from non-sister non-inspected firms. All regressions control for firm-product and year fixed effects. Standarderrors are two-way clustered at the firm and product-year level. *** implies significance at 0.01 level, ** 0.5, * 0.1.
40
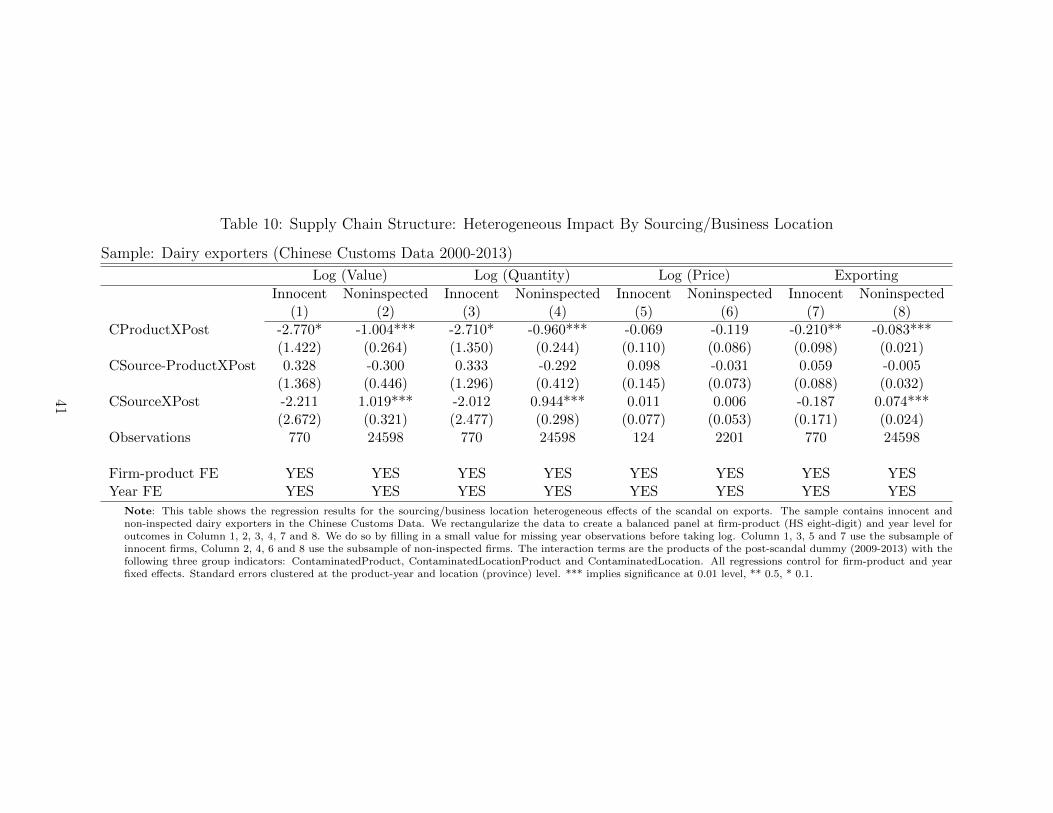
Table 10: Supply Chain Structure: Heterogeneous Impact By Sourcing/Business Location
Sample: Dairy exporters (Chinese Customs Data 2000-2013)
Log (Value) Log (Quantity) Log (Price) Exporting
Innocent Noninspected Innocent Noninspected Innocent Noninspected Innocent Noninspected(1) (2) (3) (4) (5) (6) (7) (8)
CProductXPost -2.770* -1.004*** -2.710* -0.960*** -0.069 -0.119 -0.210** -0.083***(1.422) (0.264) (1.350) (0.244) (0.110) (0.086) (0.098) (0.021)
CSource-ProductXPost 0.328 -0.300 0.333 -0.292 0.098 -0.031 0.059 -0.005(1.368) (0.446) (1.296) (0.412) (0.145) (0.073) (0.088) (0.032)
CSourceXPost -2.211 1.019*** -2.012 0.944*** 0.011 0.006 -0.187 0.074***(2.672) (0.321) (2.477) (0.298) (0.077) (0.053) (0.171) (0.024)
Observations 770 24598 770 24598 124 2201 770 24598
Firm-product FE YES YES YES YES YES YES YES YESYear FE YES YES YES YES YES YES YES YES
Note: This table shows the regression results for the sourcing/business location heterogeneous effects of the scandal on exports. The sample contains innocent andnon-inspected dairy exporters in the Chinese Customs Data. We rectangularize the data to create a balanced panel at firm-product (HS eight-digit) and year level foroutcomes in Column 1, 2, 3, 4, 7 and 8. We do so by filling in a small value for missing year observations before taking log. Column 1, 3, 5 and 7 use the subsample ofinnocent firms, Column 2, 4, 6 and 8 use the subsample of non-inspected firms. The interaction terms are the products of the post-scandal dummy (2009-2013) with thefollowing three group indicators: ContaminatedProduct, ContaminatedLocationProduct and ContaminatedLocation. All regressions control for firm-product and yearfixed effects. Standard errors clustered at the product-year and location (province) level. *** implies significance at 0.01 level, ** 0.5, * 0.1.
41
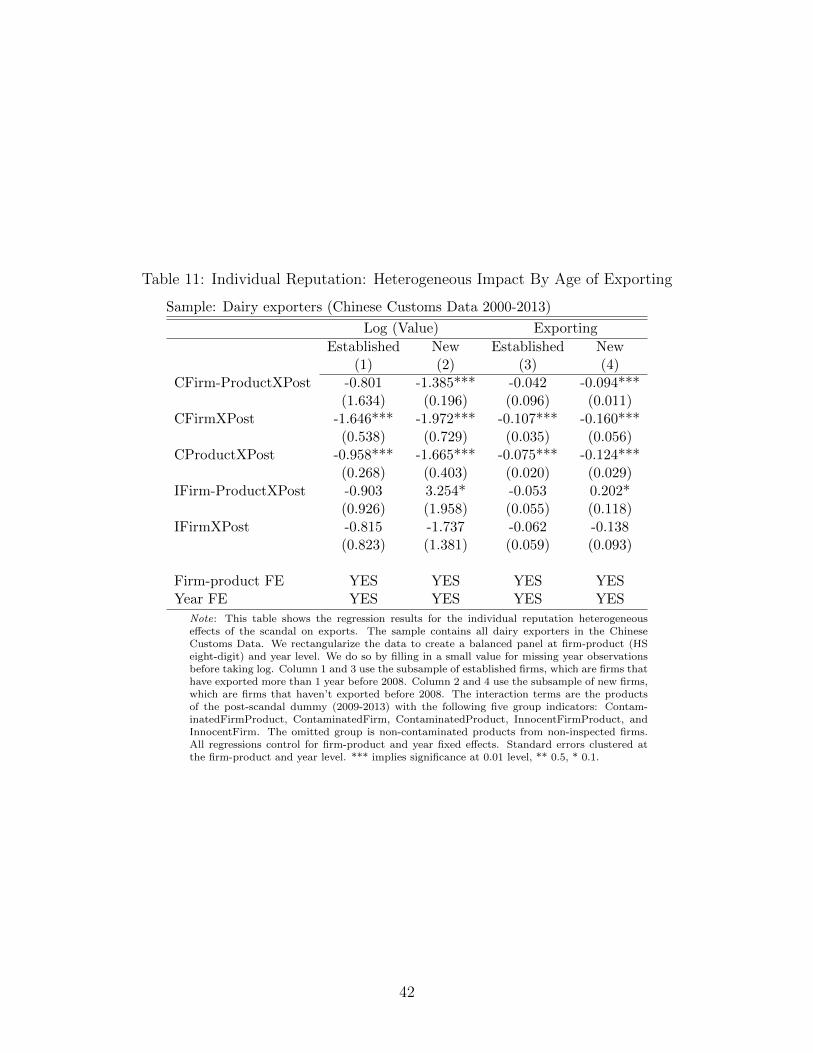
Table 11: Individual Reputation: Heterogeneous Impact By Age of Exporting
Sample: Dairy exporters (Chinese Customs Data 2000-2013)
Log (Value) Exporting
Established New Established New(1) (2) (3) (4)
CFirm-ProductXPost -0.801 -1.385*** -0.042 -0.094***(1.634) (0.196) (0.096) (0.011)
CFirmXPost -1.646*** -1.972*** -0.107*** -0.160***(0.538) (0.729) (0.035) (0.056)
CProductXPost -0.958*** -1.665*** -0.075*** -0.124***(0.268) (0.403) (0.020) (0.029)
IFirm-ProductXPost -0.903 3.254* -0.053 0.202*(0.926) (1.958) (0.055) (0.118)
IFirmXPost -0.815 -1.737 -0.062 -0.138(0.823) (1.381) (0.059) (0.093)
Firm-product FE YES YES YES YESYear FE YES YES YES YES
Note: This table shows the regression results for the individual reputation heterogeneouseffects of the scandal on exports. The sample contains all dairy exporters in the ChineseCustoms Data. We rectangularize the data to create a balanced panel at firm-product (HSeight-digit) and year level. We do so by filling in a small value for missing year observationsbefore taking log. Column 1 and 3 use the subsample of established firms, which are firms thathave exported more than 1 year before 2008. Column 2 and 4 use the subsample of new firms,which are firms that haven’t exported before 2008. The interaction terms are the productsof the post-scandal dummy (2009-2013) with the following five group indicators: Contam-inatedFirmProduct, ContaminatedFirm, ContaminatedProduct, InnocentFirmProduct, andInnocentFirm. The omitted group is non-contaminated products from non-inspected firms.All regressions control for firm-product and year fixed effects. Standard errors clustered atthe firm-product and year level. *** implies significance at 0.01 level, ** 0.5, * 0.1.
42
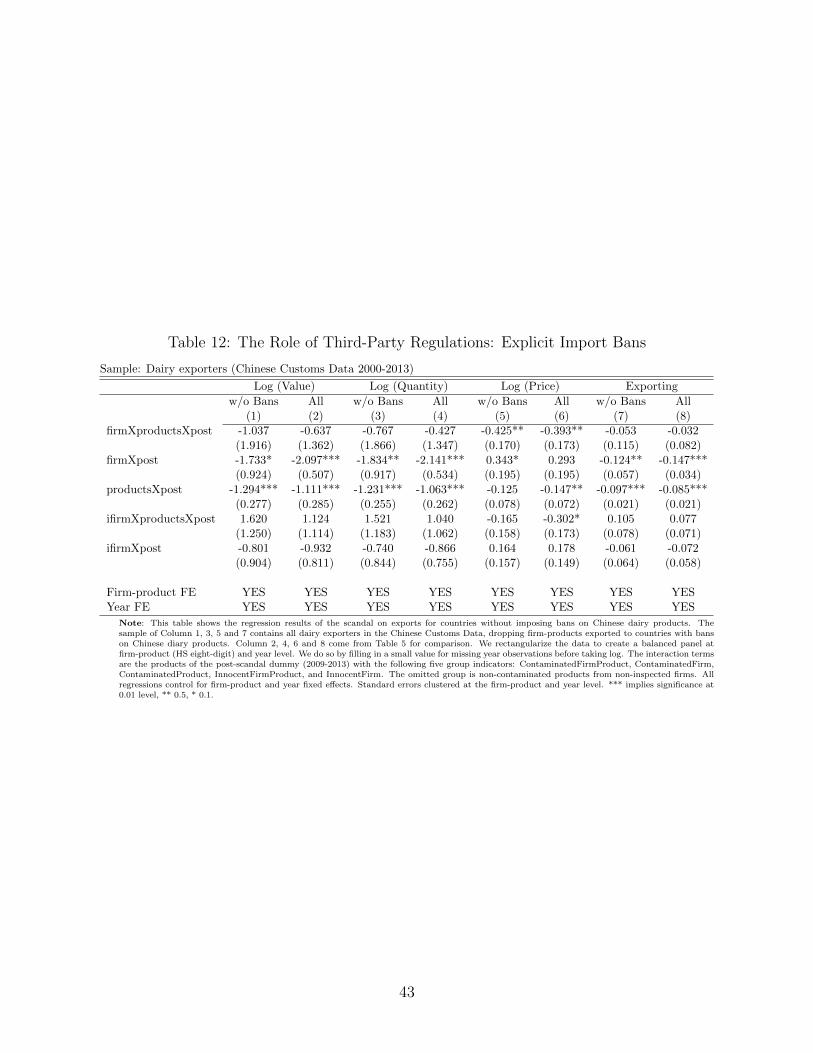
Table 12: The Role of Third-Party Regulations: Explicit Import Bans
Sample: Dairy exporters (Chinese Customs Data 2000-2013)
Log (Value) Log (Quantity) Log (Price) Exporting
w/o Bans All w/o Bans All w/o Bans All w/o Bans All(1) (2) (3) (4) (5) (6) (7) (8)
firmXproductsXpost -1.037 -0.637 -0.767 -0.427 -0.425** -0.393** -0.053 -0.032(1.916) (1.362) (1.866) (1.347) (0.170) (0.173) (0.115) (0.082)
firmXpost -1.733* -2.097*** -1.834** -2.141*** 0.343* 0.293 -0.124** -0.147***(0.924) (0.507) (0.917) (0.534) (0.195) (0.195) (0.057) (0.034)
productsXpost -1.294*** -1.111*** -1.231*** -1.063*** -0.125 -0.147** -0.097*** -0.085***(0.277) (0.285) (0.255) (0.262) (0.078) (0.072) (0.021) (0.021)
ifirmXproductsXpost 1.620 1.124 1.521 1.040 -0.165 -0.302* 0.105 0.077(1.250) (1.114) (1.183) (1.062) (0.158) (0.173) (0.078) (0.071)
ifirmXpost -0.801 -0.932 -0.740 -0.866 0.164 0.178 -0.061 -0.072(0.904) (0.811) (0.844) (0.755) (0.157) (0.149) (0.064) (0.058)
Firm-product FE YES YES YES YES YES YES YES YESYear FE YES YES YES YES YES YES YES YES
Note: This table shows the regression results of the scandal on exports for countries without imposing bans on Chinese dairy products. Thesample of Column 1, 3, 5 and 7 contains all dairy exporters in the Chinese Customs Data, dropping firm-products exported to countries with banson Chinese diary products. Column 2, 4, 6 and 8 come from Table 5 for comparison. We rectangularize the data to create a balanced panel atfirm-product (HS eight-digit) and year level. We do so by filling in a small value for missing year observations before taking log. The interaction termsare the products of the post-scandal dummy (2009-2013) with the following five group indicators: ContaminatedFirmProduct, ContaminatedFirm,ContaminatedProduct, InnocentFirmProduct, and InnocentFirm. The omitted group is non-contaminated products from non-inspected firms. Allregressions control for firm-product and year fixed effects. Standard errors clustered at the firm-product and year level. *** implies significance at0.01 level, ** 0.5, * 0.1.
43
APPENDICES
• Appendix A: Additional Tables and Figures
• Appendix B: Data Appendix and Codebooks
44
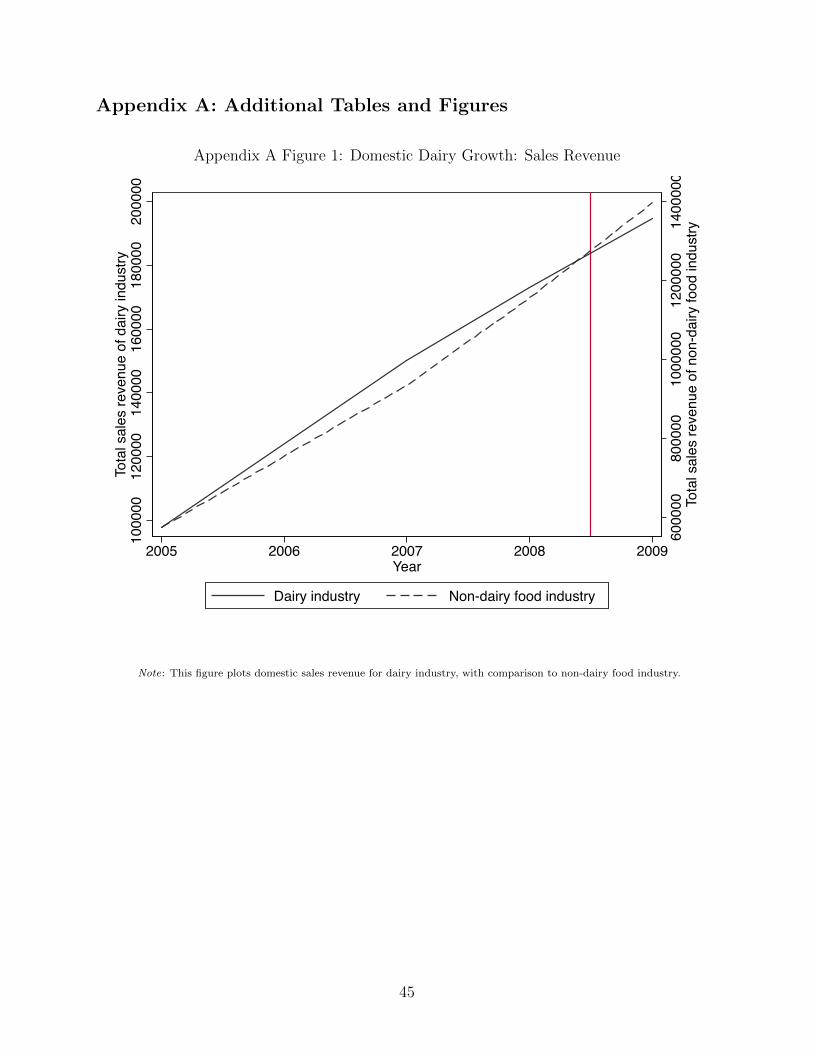
Appendix A: Additional Tables and Figures
Appendix A Figure 1: Domestic Dairy Growth: Sales Revenue
6000
0080
0000
1000
000
1200
000
1400
000
Tota
l sal
es re
venu
e of
non
-dai
ry fo
od in
dust
ry
1000
0012
0000
1400
0016
0000
1800
0020
0000
Tota
l sal
es re
venu
e of
dai
ry in
dust
ry
2005 2006 2007 2008 2009Year
Dairy industry Non-dairy food industry
Note: This figure plots domestic sales revenue for dairy industry, with comparison to non-dairy food industry.
45
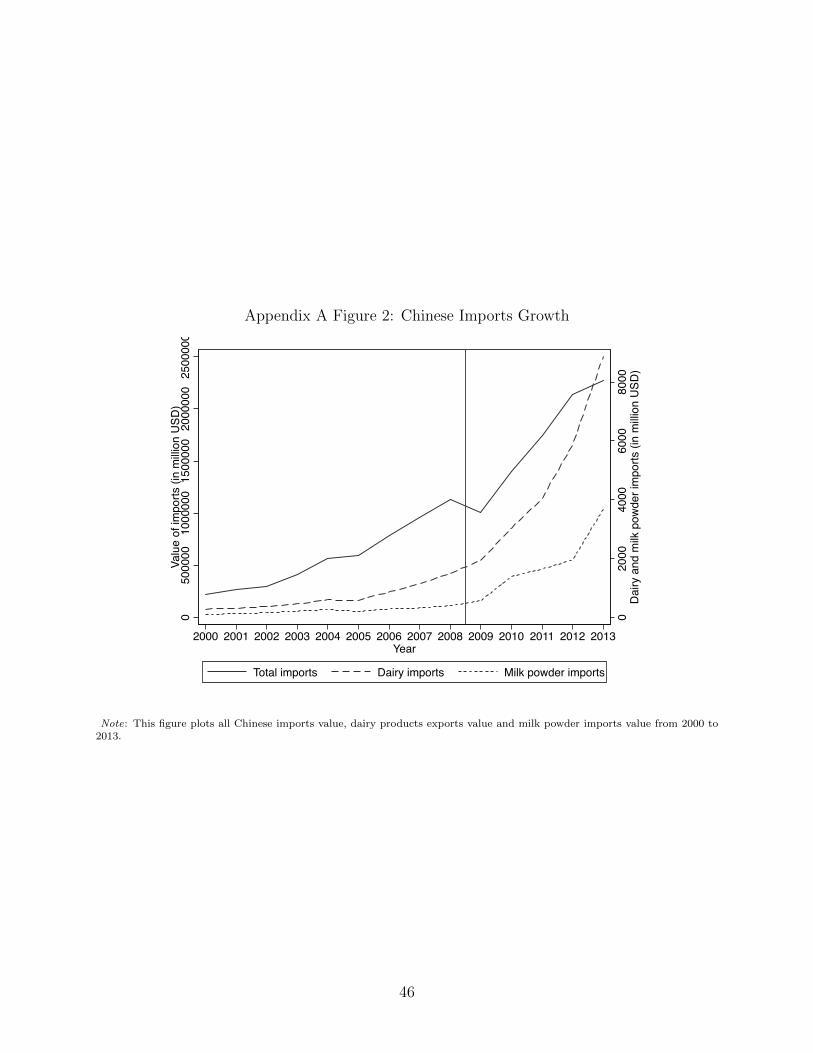
Appendix A Figure 2: Chinese Imports Growth
020
0040
0060
0080
00D
airy
and
milk
pow
der i
mpo
rts (i
n m
illion
USD
)
050
0000
1000
000
1500
000
2000
000
2500
000
Valu
e of
impo
rts (i
n m
illion
USD
)
2000 2001 2002 2003 2004 2005 2006 2007 2008 2009 2010 2011 2012 2013Year
Total imports Dairy imports Milk powder imports
Note: This figure plots all Chinese imports value, dairy products exports value and milk powder imports value from 2000 to2013.
46

Appendix A Figure 3: Chinese Exports Growth
010
0000
020
0000
030
0000
0Va
lue
of e
xpor
ts (i
n m
illion
USD
)
2000 2001 2002 2003 2004 2005 2006 2007 2008 2009 2010 2011 2012 2013Year
Total exports Exports to major dairy destinations
Note: This figure plots all Chinese exports value and exports value to major dairy products destinations from 2000 to 2013.
47

Appendix A Figure 4: Post-scandal Exporting Products and Destinations (2009-2013)
01
23
45
67
8N
umbe
r of a
ffect
ed fo
od fi
rms
01
23
45
67
8N
umbe
r of a
ffect
ed d
airy
firm
s
0 1 2 3 4 5 6 7 8 9Median for Number of Products
Dairy Firms Non-dairy Food FirmsNotes: Dairy firms are not included in food firms
2009 - 2013Number of products (median) for affected firms
050
0010
000
1500
0N
umbe
r of n
onaf
fect
ed fo
od fi
rms
010
020
030
040
050
0N
umbe
r of n
onaf
fect
ed d
airy
firm
s
0 1 2 3 4 5 6 7 8Median for Number of Products
Dairy Firms Non-dairy Food FirmsNotes: Dairy firms are not included in food firms
2009 - 2013Number of products (median) for nonaffected firms
01
23
45
Num
ber o
f affe
cted
food
firm
s
01
23
45
Num
ber o
f affe
cted
dai
ry fi
rms
0 2 4 6 8 10 12 14 16 18 20 22 24Median for Number of Destinations
Dairy Firms Non-dairy Food FirmsNotes: Dairy firms are not included in food firms
2009 - 2013Number of destinations (median) for affected firms
050
0010
000
1500
0N
umbe
r of n
onaf
fect
ed fo
od fi
rms
010
020
030
040
050
0N
umbe
r of n
onaf
fect
ed d
airy
firm
s
0 1 2 3 4 5 6 7 8Median for Number of Destinations
Dairy Firms Non-dairy Food FirmsNotes: Dairy firms are not included in food firms
2009 - 2013Number of destinations (median) for nonaffected firms
Note: This figure plots number of firms with different median number of products and number of destinations across the wholepost-scandal period (2009-2013). We categorize the firms by affected(contaminated) firms on the left column and nonaffected(innocent and noninspected) firms on the right column. Dairy firms are defined as firms which have ever exported dairy productsduring 2000 to 2013 while non-dairy food firms are defined as firms which have exported food products but have never exporteddairy products during 2000 to 2013.
48
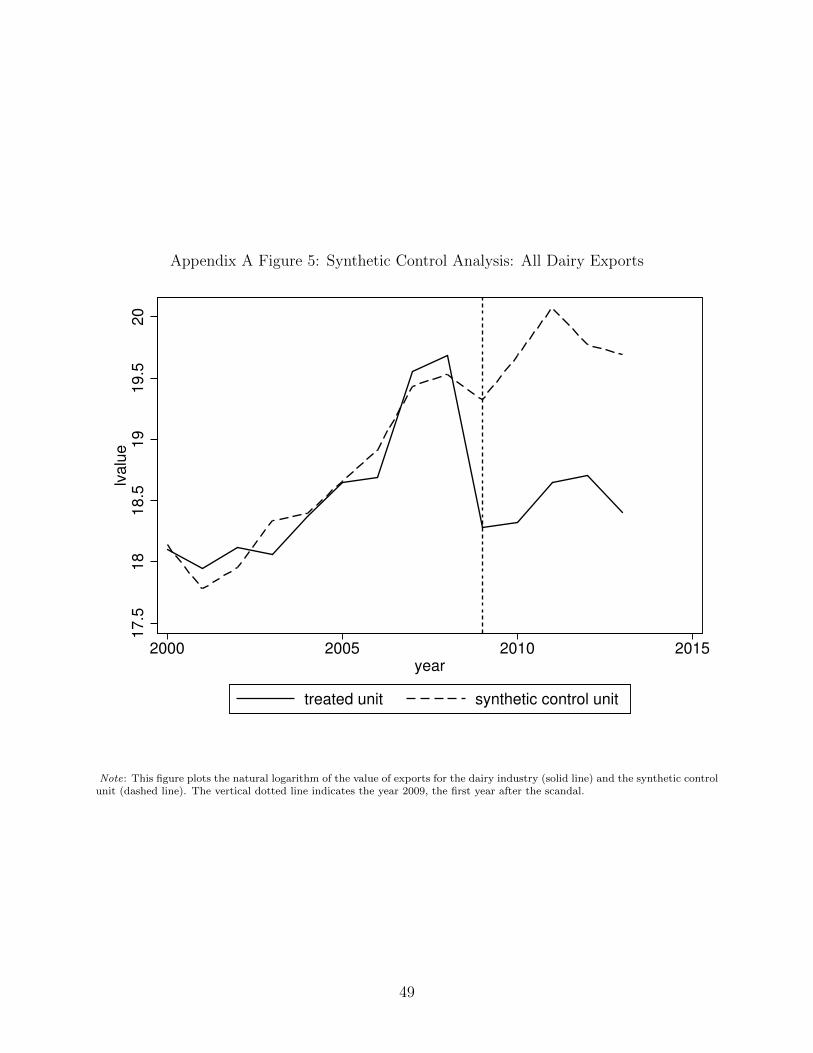
Appendix A Figure 5: Synthetic Control Analysis: All Dairy Exports
17
.51
81
8.5
19
19
.52
0lv
alu
e
2000 2005 2010 2015year
treated unit synthetic control unit
Note: This figure plots the natural logarithm of the value of exports for the dairy industry (solid line) and the synthetic controlunit (dashed line). The vertical dotted line indicates the year 2009, the first year after the scandal.
49
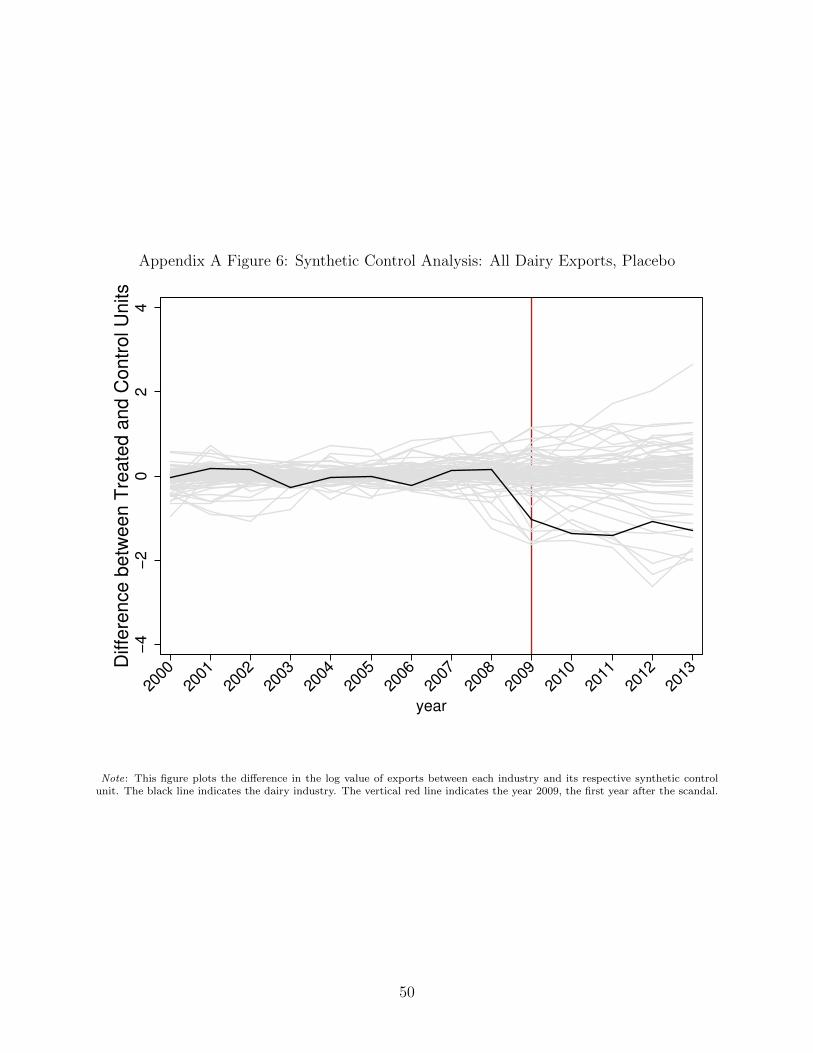
Appendix A Figure 6: Synthetic Control Analysis: All Dairy Exports, Placebo
−4
−2
02
4D
iffe
rence b
etw
een T
reate
d a
nd C
ontr
ol U
nits
2000
2001
2002
2003
2004
2005
2006
2007
2008
2009
2010
2011
2012
2013
year
Note: This figure plots the difference in the log value of exports between each industry and its respective synthetic controlunit. The black line indicates the dairy industry. The vertical red line indicates the year 2009, the first year after the scandal.
50
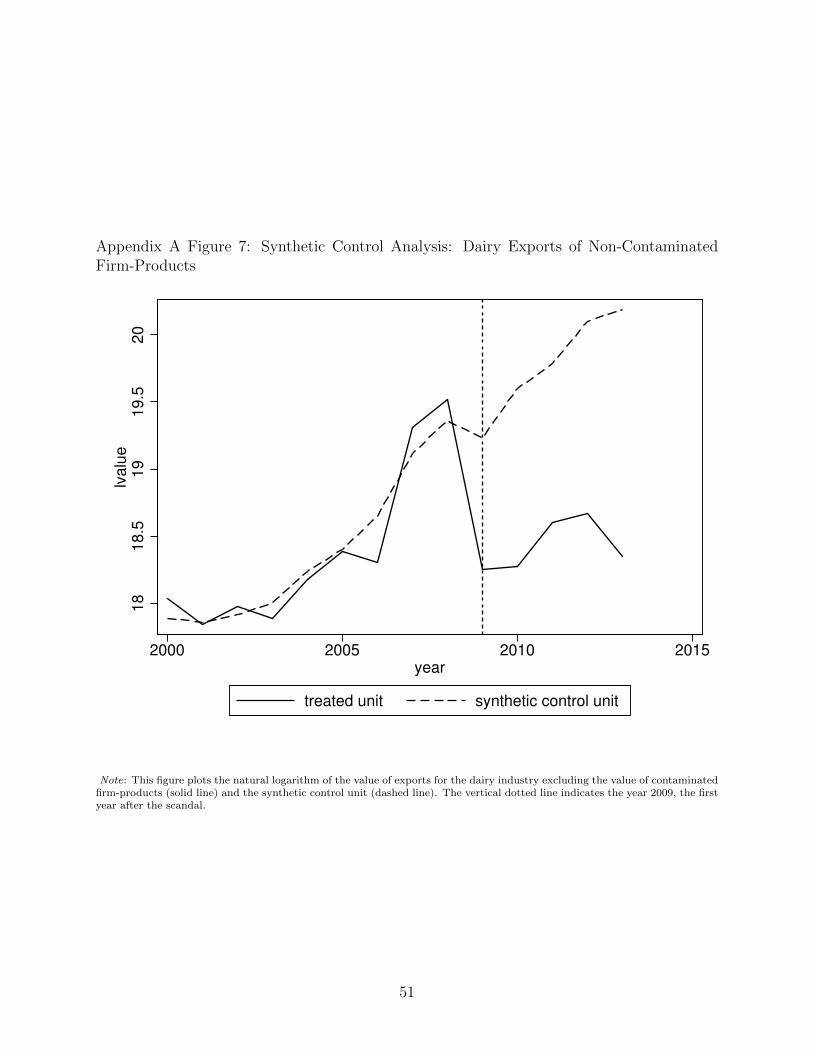
Appendix A Figure 7: Synthetic Control Analysis: Dairy Exports of Non-ContaminatedFirm-Products
18
18
.51
91
9.5
20
lva
lue
2000 2005 2010 2015year
treated unit synthetic control unit
Note: This figure plots the natural logarithm of the value of exports for the dairy industry excluding the value of contaminatedfirm-products (solid line) and the synthetic control unit (dashed line). The vertical dotted line indicates the year 2009, the firstyear after the scandal.
51
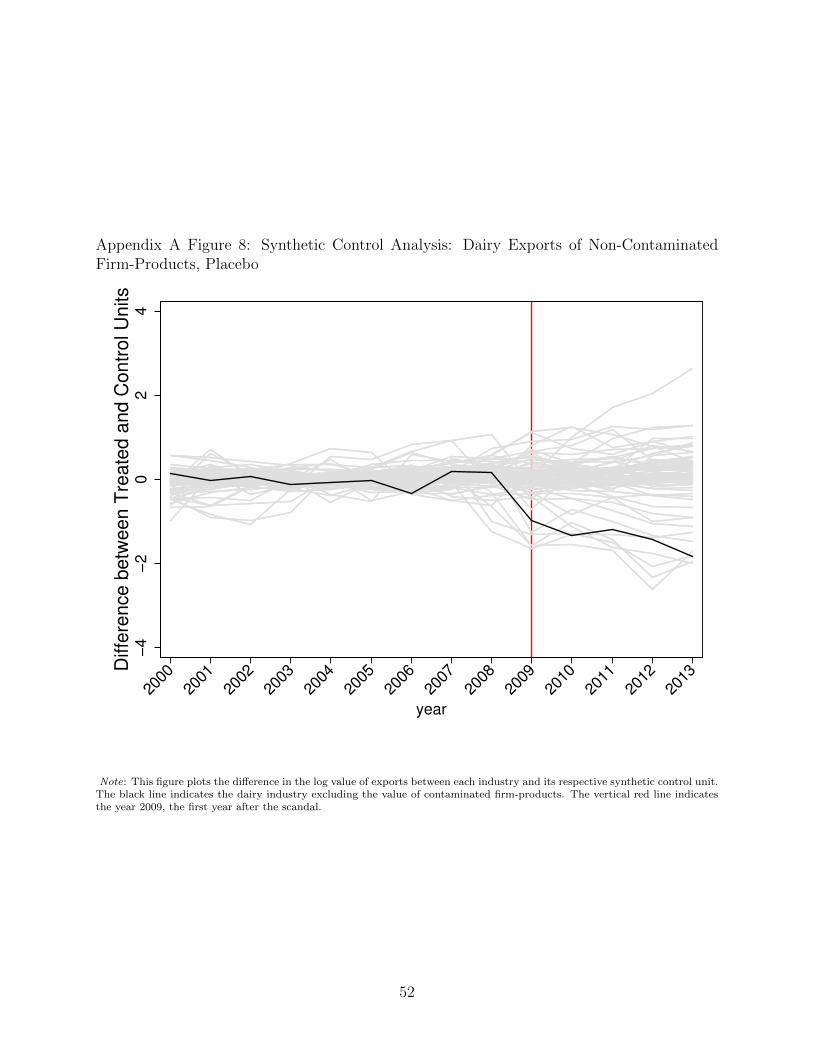
Appendix A Figure 8: Synthetic Control Analysis: Dairy Exports of Non-ContaminatedFirm-Products, Placebo
−4
−2
02
4D
iffe
rence b
etw
een T
reate
d a
nd C
ontr
ol U
nits
2000
2001
2002
2003
2004
2005
2006
2007
2008
2009
2010
2011
2012
2013
year
Note: This figure plots the difference in the log value of exports between each industry and its respective synthetic control unit.The black line indicates the dairy industry excluding the value of contaminated firm-products. The vertical red line indicatesthe year 2009, the first year after the scandal.
52
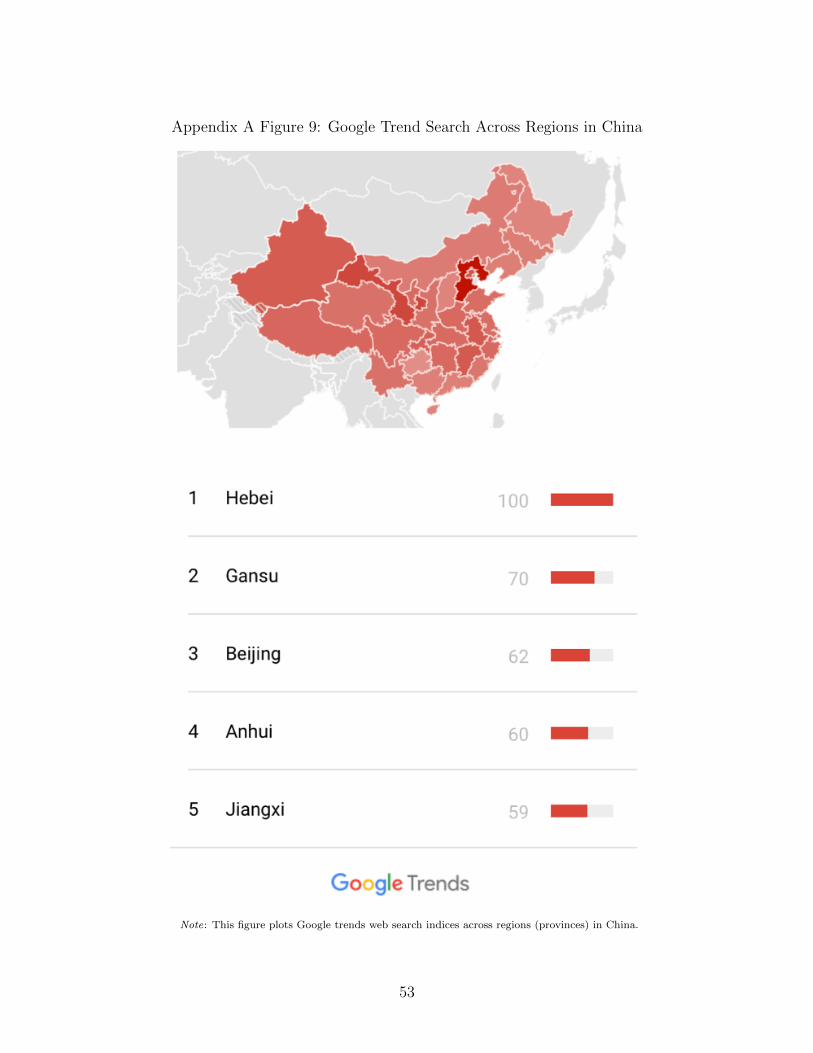
Appendix A Figure 9: Google Trend Search Across Regions in China
Note: This figure plots Google trends web search indices across regions (provinces) in China.
53
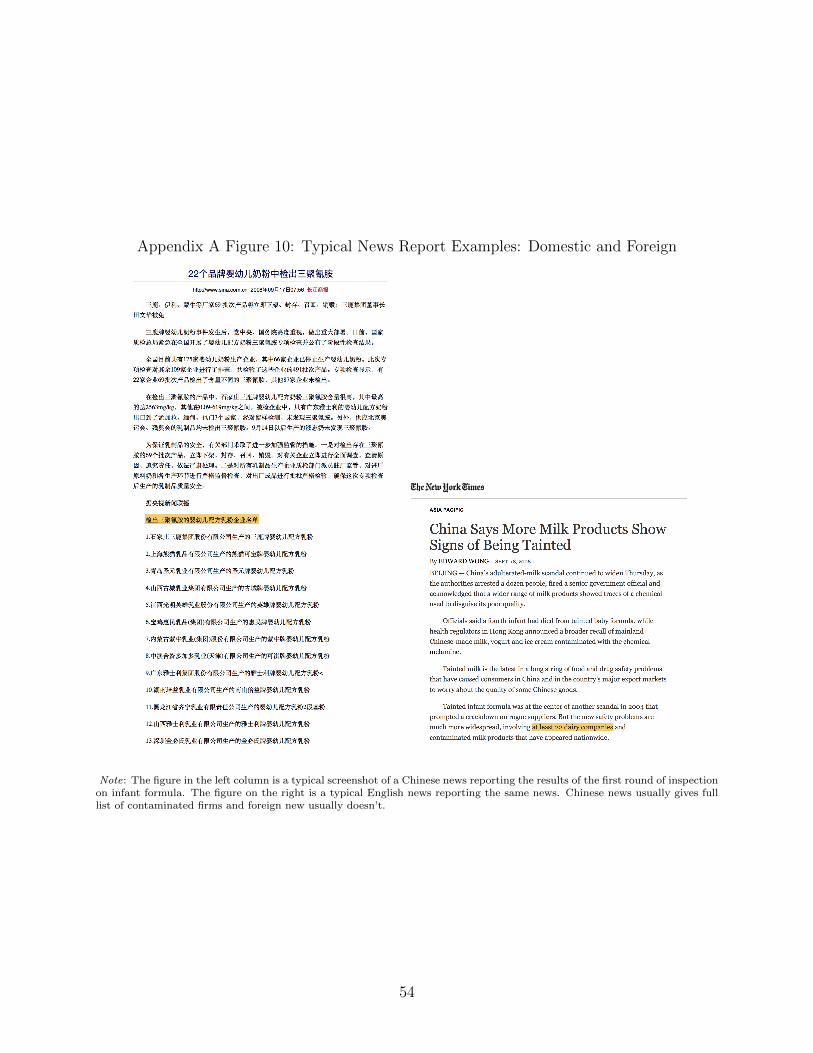
Appendix A Figure 10: Typical News Report Examples: Domestic and Foreign
Note: The figure in the left column is a typical screenshot of a Chinese news reporting the results of the first round of inspectionon infant formula. The figure on the right is a typical English news reporting the same news. Chinese news usually gives fulllist of contaminated firms and foreign new usually doesn’t.
54
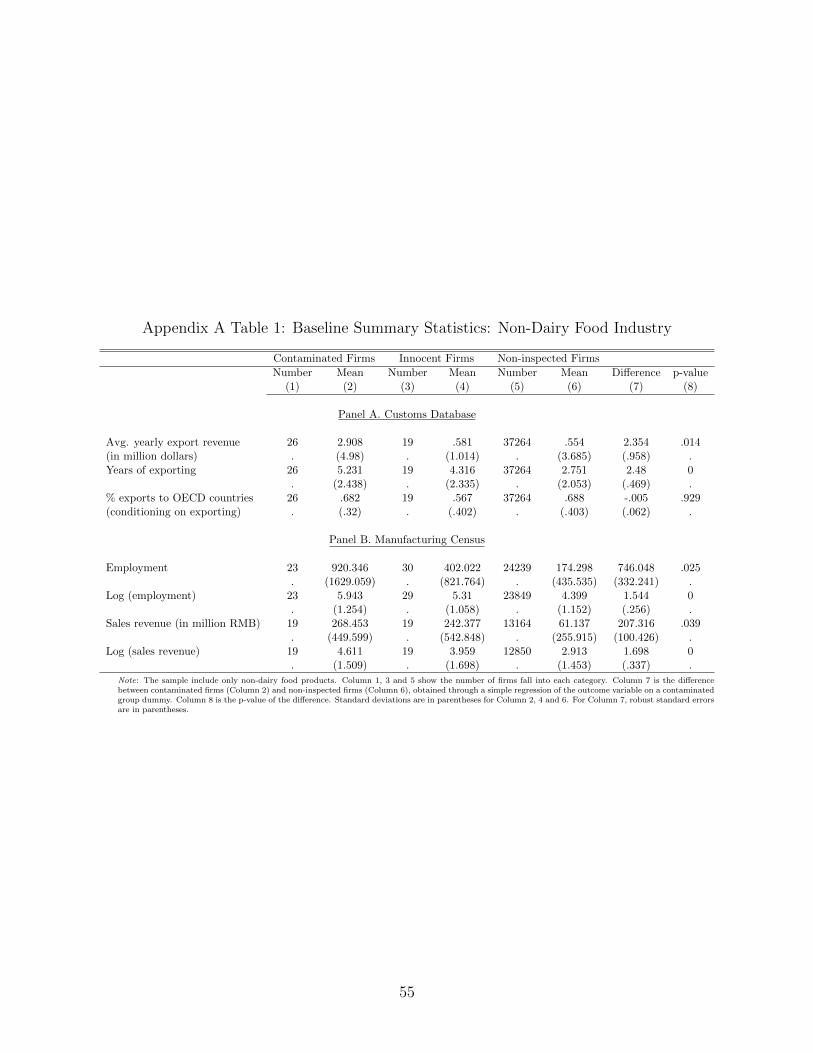
Appendix A Table 1: Baseline Summary Statistics: Non-Dairy Food Industry
Contaminated Firms Innocent Firms Non-inspected Firms
Number Mean Number Mean Number Mean Difference p-value(1) (2) (3) (4) (5) (6) (7) (8)
Panel A. Customs Database
Avg. yearly export revenue 26 2.908 19 .581 37264 .554 2.354 .014(in million dollars) . (4.98) . (1.014) . (3.685) (.958) .Years of exporting 26 5.231 19 4.316 37264 2.751 2.48 0
. (2.438) . (2.335) . (2.053) (.469) .% exports to OECD countries 26 .682 19 .567 37264 .688 -.005 .929(conditioning on exporting) . (.32) . (.402) . (.403) (.062) .
Panel B. Manufacturing Census
Employment 23 920.346 30 402.022 24239 174.298 746.048 .025. (1629.059) . (821.764) . (435.535) (332.241) .
Log (employment) 23 5.943 29 5.31 23849 4.399 1.544 0. (1.254) . (1.058) . (1.152) (.256) .
Sales revenue (in million RMB) 19 268.453 19 242.377 13164 61.137 207.316 .039. (449.599) . (542.848) . (255.915) (100.426) .
Log (sales revenue) 19 4.611 19 3.959 12850 2.913 1.698 0. (1.509) . (1.698) . (1.453) (.337) .
Note: The sample include only non-dairy food products. Column 1, 3 and 5 show the number of firms fall into each category. Column 7 is the differencebetween contaminated firms (Column 2) and non-inspected firms (Column 6), obtained through a simple regression of the outcome variable on a contaminatedgroup dummy. Column 8 is the p-value of the difference. Standard deviations are in parentheses for Column 2, 4 and 6. For Column 7, robust standard errorsare in parentheses.
55
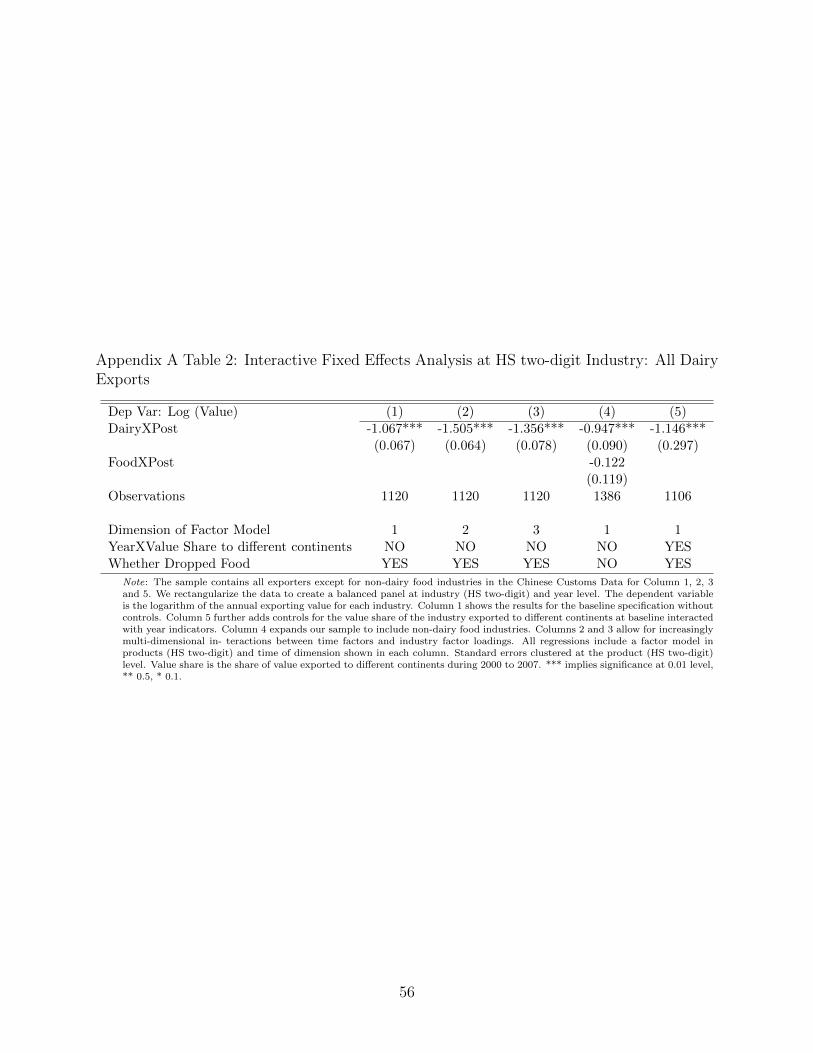
Appendix A Table 2: Interactive Fixed Effects Analysis at HS two-digit Industry: All DairyExports
Dep Var: Log (Value) (1) (2) (3) (4) (5)DairyXPost -1.067*** -1.505*** -1.356*** -0.947*** -1.146***
(0.067) (0.064) (0.078) (0.090) (0.297)FoodXPost -0.122
(0.119)Observations 1120 1120 1120 1386 1106
Dimension of Factor Model 1 2 3 1 1YearXValue Share to different continents NO NO NO NO YESWhether Dropped Food YES YES YES NO YES
Note: The sample contains all exporters except for non-dairy food industries in the Chinese Customs Data for Column 1, 2, 3and 5. We rectangularize the data to create a balanced panel at industry (HS two-digit) and year level. The dependent variableis the logarithm of the annual exporting value for each industry. Column 1 shows the results for the baseline specification withoutcontrols. Column 5 further adds controls for the value share of the industry exported to different continents at baseline interactedwith year indicators. Column 4 expands our sample to include non-dairy food industries. Columns 2 and 3 allow for increasinglymulti-dimensional in- teractions between time factors and industry factor loadings. All regressions include a factor model inproducts (HS two-digit) and time of dimension shown in each column. Standard errors clustered at the product (HS two-digit)level. Value share is the share of value exported to different continents during 2000 to 2007. *** implies significance at 0.01 level,** 0.5, * 0.1.
56
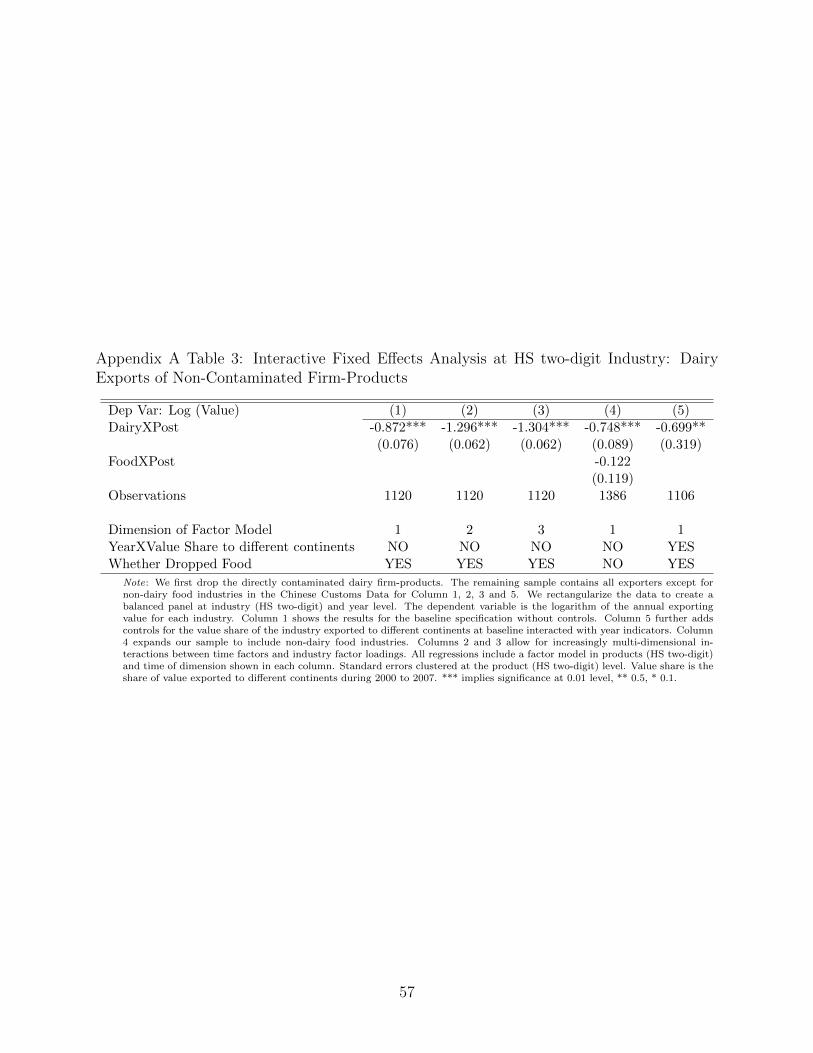
Appendix A Table 3: Interactive Fixed Effects Analysis at HS two-digit Industry: DairyExports of Non-Contaminated Firm-Products
Dep Var: Log (Value) (1) (2) (3) (4) (5)DairyXPost -0.872*** -1.296*** -1.304*** -0.748*** -0.699**
(0.076) (0.062) (0.062) (0.089) (0.319)FoodXPost -0.122
(0.119)Observations 1120 1120 1120 1386 1106
Dimension of Factor Model 1 2 3 1 1YearXValue Share to different continents NO NO NO NO YESWhether Dropped Food YES YES YES NO YES
Note: We first drop the directly contaminated dairy firm-products. The remaining sample contains all exporters except fornon-dairy food industries in the Chinese Customs Data for Column 1, 2, 3 and 5. We rectangularize the data to create abalanced panel at industry (HS two-digit) and year level. The dependent variable is the logarithm of the annual exportingvalue for each industry. Column 1 shows the results for the baseline specification without controls. Column 5 further addscontrols for the value share of the industry exported to different continents at baseline interacted with year indicators. Column4 expands our sample to include non-dairy food industries. Columns 2 and 3 allow for increasingly multi-dimensional in-teractions between time factors and industry factor loadings. All regressions include a factor model in products (HS two-digit)and time of dimension shown in each column. Standard errors clustered at the product (HS two-digit) level. Value share is theshare of value exported to different continents during 2000 to 2007. *** implies significance at 0.01 level, ** 0.5, * 0.1.
57
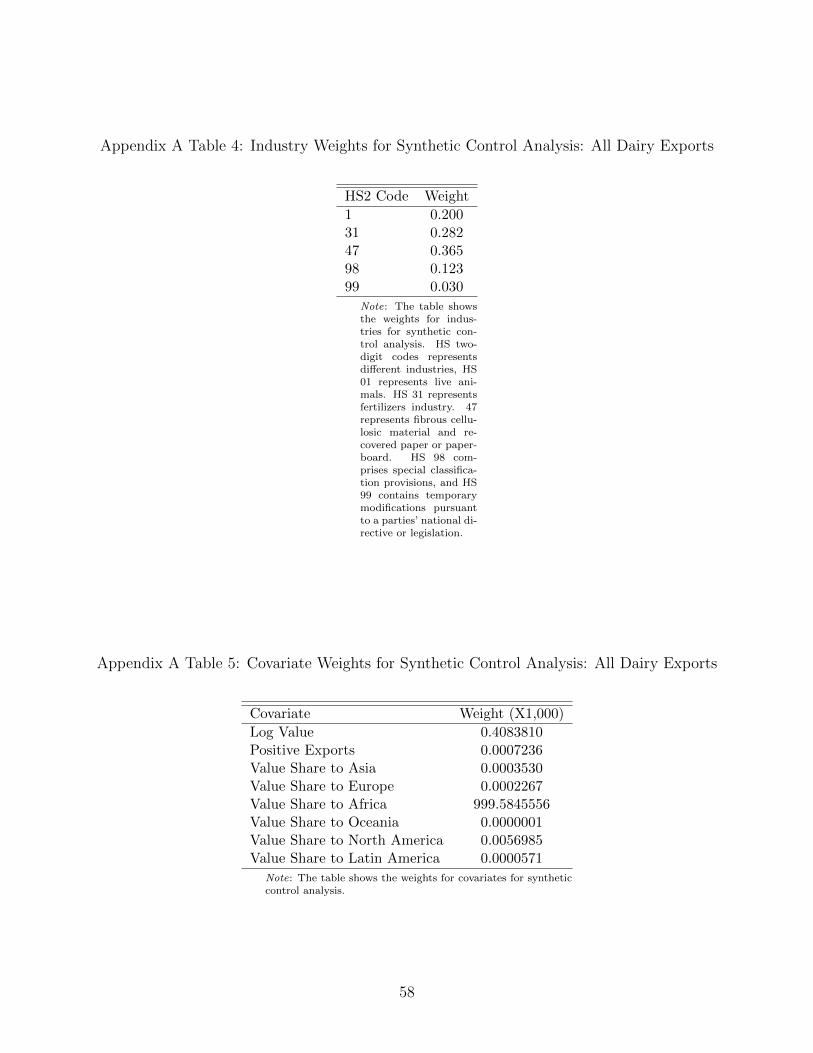
Appendix A Table 4: Industry Weights for Synthetic Control Analysis: All Dairy Exports
HS2 Code Weight
1 0.20031 0.28247 0.36598 0.12399 0.030
Note: The table showsthe weights for indus-tries for synthetic con-trol analysis. HS two-digit codes representsdifferent industries, HS01 represents live ani-mals. HS 31 representsfertilizers industry. 47represents fibrous cellu-losic material and re-covered paper or paper-board. HS 98 com-prises special classifica-tion provisions, and HS99 contains temporarymodifications pursuantto a parties’ national di-rective or legislation.
Appendix A Table 5: Covariate Weights for Synthetic Control Analysis: All Dairy Exports
Covariate Weight (X1,000)
Log Value 0.4083810Positive Exports 0.0007236Value Share to Asia 0.0003530Value Share to Europe 0.0002267Value Share to Africa 999.5845556Value Share to Oceania 0.0000001Value Share to North America 0.0056985Value Share to Latin America 0.0000571
Note: The table shows the weights for covariates for syntheticcontrol analysis.
58

Appendix A Table 6: Industry Weights for Synthetic Control Analysis: Dairy Exports ofNon-Contaminated Firm-Products
HS2 Code Weight
23 0.15931 0.09247 0.01860 0.20293 0.50299 0.026
Note: The tableshows the weights forindustries for syntheticcontrol analysis.HS two-digit codesrepresents differentindustries, HS 23 rep-resents food industriesproducing residuesand wastes thereof orprepared animal fod-der. HS 31 representsfertilizers industry. HS47 represents fibrouscellulosic materialand recovered paperor paperboard. HS60 represents fabricsindustry. HS 93 is forarms and ammunitionindustry and HS 99is for special importreporting provisions.
Appendix A Table 7: Covariate Weights for Synthetic Control Analysis: Dairy Exports ofNon-Contaminated Firm-Products
Covariate Weight (X1,0000)
Log Value 5126.6235Positive Exports 56.7377Value Share to Asia 3.1233Value Share to Europe 133.4432Value Share to Africa 4617.8919Value Share to Oceania 25.3966Value Share to North America 0.0001Value Share to Latin America 36.7834
Note: The table shows the weights for covariates for syntheticcontrol analysis.
59
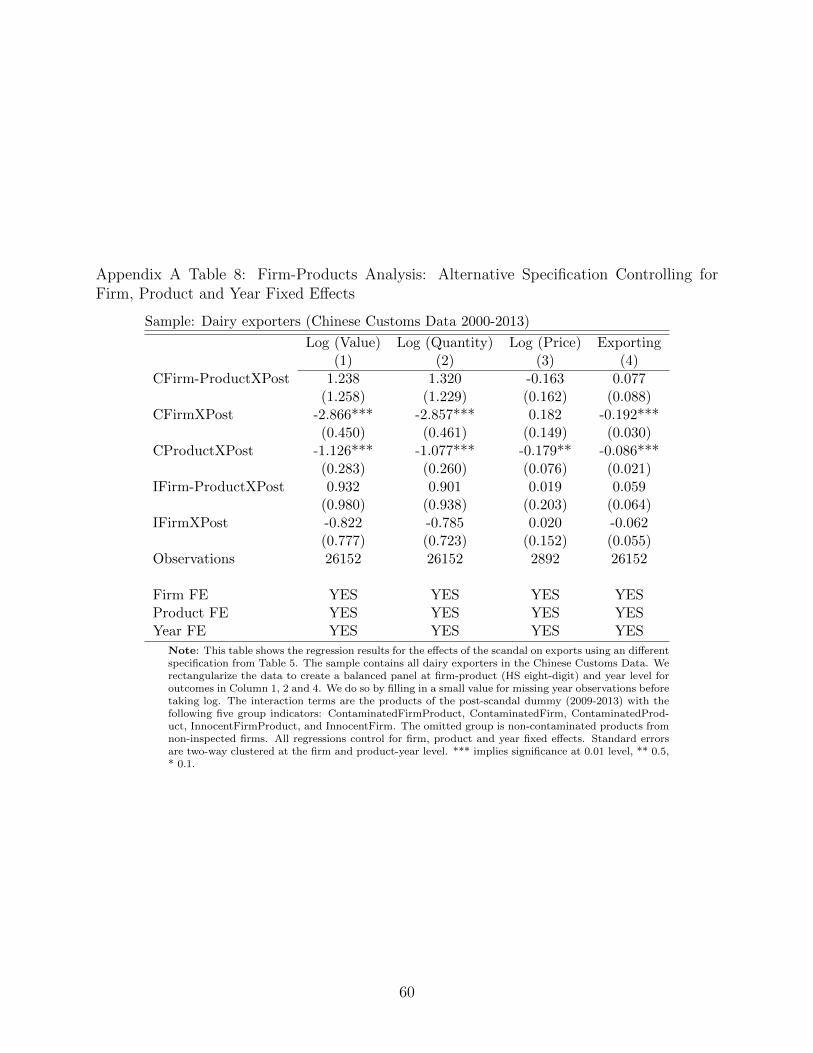
Appendix A Table 8: Firm-Products Analysis: Alternative Specification Controlling forFirm, Product and Year Fixed Effects
Sample: Dairy exporters (Chinese Customs Data 2000-2013)
Log (Value) Log (Quantity) Log (Price) Exporting(1) (2) (3) (4)
CFirm-ProductXPost 1.238 1.320 -0.163 0.077(1.258) (1.229) (0.162) (0.088)
CFirmXPost -2.866*** -2.857*** 0.182 -0.192***(0.450) (0.461) (0.149) (0.030)
CProductXPost -1.126*** -1.077*** -0.179** -0.086***(0.283) (0.260) (0.076) (0.021)
IFirm-ProductXPost 0.932 0.901 0.019 0.059(0.980) (0.938) (0.203) (0.064)
IFirmXPost -0.822 -0.785 0.020 -0.062(0.777) (0.723) (0.152) (0.055)
Observations 26152 26152 2892 26152
Firm FE YES YES YES YESProduct FE YES YES YES YESYear FE YES YES YES YES
Note: This table shows the regression results for the effects of the scandal on exports using an differentspecification from Table 5. The sample contains all dairy exporters in the Chinese Customs Data. Werectangularize the data to create a balanced panel at firm-product (HS eight-digit) and year level foroutcomes in Column 1, 2 and 4. We do so by filling in a small value for missing year observations beforetaking log. The interaction terms are the products of the post-scandal dummy (2009-2013) with thefollowing five group indicators: ContaminatedFirmProduct, ContaminatedFirm, ContaminatedProd-uct, InnocentFirmProduct, and InnocentFirm. The omitted group is non-contaminated products fromnon-inspected firms. All regressions control for firm, product and year fixed effects. Standard errorsare two-way clustered at the firm and product-year level. *** implies significance at 0.01 level, ** 0.5,* 0.1.
60
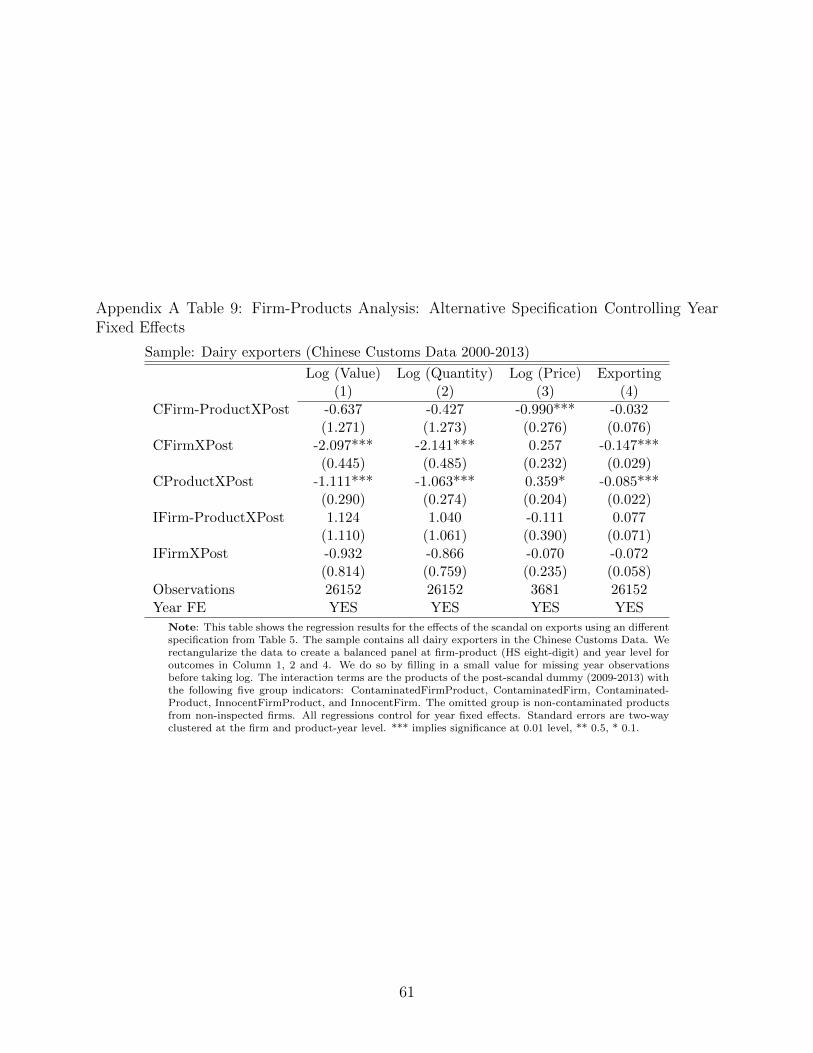
Appendix A Table 9: Firm-Products Analysis: Alternative Specification Controlling YearFixed Effects
Sample: Dairy exporters (Chinese Customs Data 2000-2013)
Log (Value) Log (Quantity) Log (Price) Exporting(1) (2) (3) (4)
CFirm-ProductXPost -0.637 -0.427 -0.990*** -0.032(1.271) (1.273) (0.276) (0.076)
CFirmXPost -2.097*** -2.141*** 0.257 -0.147***(0.445) (0.485) (0.232) (0.029)
CProductXPost -1.111*** -1.063*** 0.359* -0.085***(0.290) (0.274) (0.204) (0.022)
IFirm-ProductXPost 1.124 1.040 -0.111 0.077(1.110) (1.061) (0.390) (0.071)
IFirmXPost -0.932 -0.866 -0.070 -0.072(0.814) (0.759) (0.235) (0.058)
Observations 26152 26152 3681 26152Year FE YES YES YES YES
Note: This table shows the regression results for the effects of the scandal on exports using an differentspecification from Table 5. The sample contains all dairy exporters in the Chinese Customs Data. Werectangularize the data to create a balanced panel at firm-product (HS eight-digit) and year level foroutcomes in Column 1, 2 and 4. We do so by filling in a small value for missing year observationsbefore taking log. The interaction terms are the products of the post-scandal dummy (2009-2013) withthe following five group indicators: ContaminatedFirmProduct, ContaminatedFirm, Contaminated-Product, InnocentFirmProduct, and InnocentFirm. The omitted group is non-contaminated productsfrom non-inspected firms. All regressions control for year fixed effects. Standard errors are two-wayclustered at the firm and product-year level. *** implies significance at 0.01 level, ** 0.5, * 0.1.
61
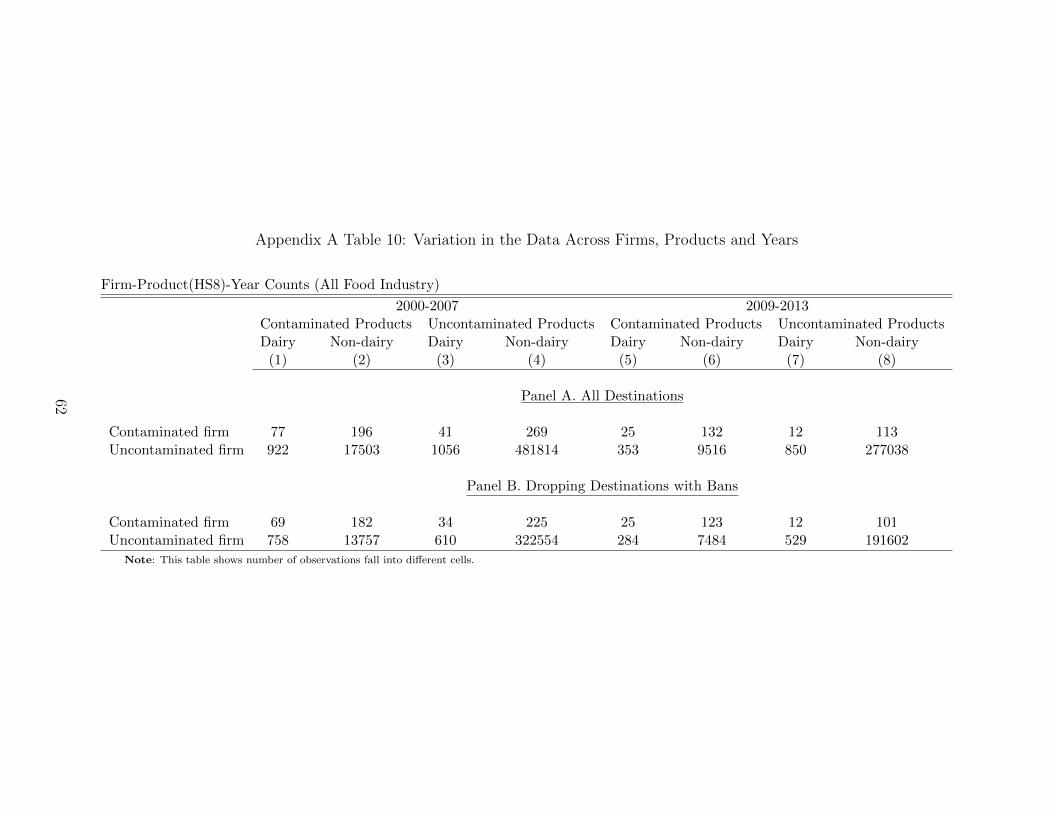
Appendix A Table 10: Variation in the Data Across Firms, Products and Years
Firm-Product(HS8)-Year Counts (All Food Industry)
2000-2007 2009-2013Contaminated Products Uncontaminated Products Contaminated Products Uncontaminated ProductsDairy Non-dairy Dairy Non-dairy Dairy Non-dairy Dairy Non-dairy
(1) (2) (3) (4) (5) (6) (7) (8)
Panel A. All Destinations
Contaminated firm 77 196 41 269 25 132 12 113Uncontaminated firm 922 17503 1056 481814 353 9516 850 277038
Panel B. Dropping Destinations with Bans
Contaminated firm 69 182 34 225 25 123 12 101Uncontaminated firm 758 13757 610 322554 284 7484 529 191602
Note: This table shows number of observations fall into different cells.
62

Appendix A Table 11: Robustness Check: Baseline Characteristics × Post
Sample: Dairy exporters (Chinese Customs Data 2000-2013)
Log (Value) Log (Quantity) Log (Price) Exporting
(1) (2) (3) (4)CFirm-ProductXPost -0.632 -0.422 -0.407** -0.031
(1.414) (1.390) (0.174) (0.083)CFirmXPost -1.308* -1.413** 0.267 -0.088*
(0.726) (0.706) (0.209) (0.050)CProductXPost -0.549** -0.558** -0.195** -0.052***
(0.253) (0.232) (0.083) (0.020)IFirm-ProductXPost 0.972 0.895 -0.269 0.063
(1.017) (0.972) (0.182) (0.062)IFirmXPost -1.437** -1.340** 0.173 -0.114**
(0.680) (0.631) (0.157) (0.047)Observations 26152 26152 2498 26152
Firm-product FE YES YES YES YESYear FE YES YES YES YESBaselineChar×Post YES YES YES YES
Note: This table shows the regression results for the effects of the scandal on exports using an differentspecification from Table 5. The sample contains all dairy exporters in the Chinese Customs Data. Werectangularize the data to create a balanced panel at firm-product (HS eight-digit) and year level foroutcomes in Column 1, 2 and 4. We do so by filling in a small value for missing year observations beforetaking log. The interaction terms are the products of the post-scandal dummy (2009-2013) with thefollowing five group indicators: ContaminatedFirmProduct, ContaminatedFirm, ContaminatedProd-uct, InnocentFirmProduct, and InnocentFirm. The omitted group is non-contaminated products fromnon-inspected firms. All regressions control for firm-product fixed effects, year fixed effects and somebaseline characteristics of the outcomes. Baseline characteristics include firm’s total sales value, firm’syear of exporting and the average exporting revenue of the HS4 industry. Standard errors are two-wayclustered at the firm and product-year level. *** implies significance at 0.01 level, ** 0.5, * 0.1.
63

Appendix A Table 12: Robustness Check: Time Trends
Sample: Dairy exporters (Chinese Customs Data 2000-2013)
Log (Value) Log (Quantity) Log (Price) Exporting
(1) (2) (3) (4) (5) (6) (7) (8)CFirm-ProductXPost -0.686 -0.707 -0.468 -0.492 -0.461** -0.368 -0.037 -0.038
(1.396) (1.394) (1.373) (1.371) (0.183) (0.224) (0.082) (0.082)CFirmXPost -1.362* -1.367* -1.465** -1.464** 0.296 0.218 -0.091* -0.092*
(0.716) (0.713) (0.695) (0.693) (0.198) (0.232) (0.050) (0.049)CProductXPost -0.388 -0.330 -0.419* -0.356 -0.121 -0.249 -0.035** -0.032*
(0.235) (0.250) (0.216) (0.227) (0.126) (0.179) (0.018) (0.019)IFirm-ProductXPost 0.937 0.920 0.865 0.845 -0.255 -0.265 0.059 0.058
(1.022) (1.025) (0.976) (0.979) (0.172) (0.193) (0.062) (0.062)IFirmXPost -1.420** -1.406** -1.327** -1.309** 0.188 0.158 -0.111** -0.111**
(0.682) (0.683) (0.632) (0.633) (0.137) (0.166) (0.046) (0.046)Observations 26152 26152 26152 26152 2498 2498 26152 26152
Firm-product FE YES YES YES YES YES YES YES YESYear FE YES YES YES YES YES YES YES YESBaselineChar×Post YES YES YES YES YES YES YES YES
HS2digit×Year YES NO YES NO YES NO YES NOH2digit×Post NO YES NO YES NO YES NO YES
Note: This table shows the regression results for the effects of the scandal on exports using an different specification from Table 5. Thesample contains all dairy exporters in the Chinese Customs Data. We rectangularize the data to create a balanced panel at firm-product(HS eight-digit) and year level for outcomes in Column 1, 2 and 4. We do so by filling in a small value for missing year observationsbefore taking log. The interaction terms are the products of the post-scandal dummy (2009-2013) with the following five group indicators:ContaminatedFirmProduct, ContaminatedFirm, ContaminatedProduct, InnocentFirmProduct, and InnocentFirm. The omitted groupis non-contaminated products from non-inspected firms. All regressions control for firm-product fixed effects, year fixed effects andsome baseline characteristics of the outcomes. Baseline characteristics include firm’s total sales value, firm’s year of exporting and theaverage exporting revenue of the HS4 industry. In this specification, we further allow in addition for differential time trends acrosssub-industries by adding interactions between dummies for industries and year dummies, or interactions between dummies for industriesand post-scandal dummy. Standard errors are two-way clustered at the firm and product-year level. *** implies significance at 0.01level, ** 0.5, * 0.1.
64

Appendix A Table 13: Robustness Check: Dropping Firms and Destinations for the Spike
Sample: Dairy exporters (Chinese Customs Data 2000-2013)
Log (Value) Log (Quantity) Log (Price) Exporting
(1) (2) (3) (4) (5) (6) (7) (8) (9) (10) (11) (12)firmXproductsXpost 0.988 0.363 1.009 1.264 0.474 1.207 -0.508* 0.000 0.000 0.070 0.021 0.087
(1.298) (0.689) (1.022) (1.273) (0.671) (1.015) (0.270) (.) (.) (0.095) (0.051) (0.080)firmXpost -2.486*** -2.014*** -1.910** -2.605*** -1.985*** -1.965** 0.351 0.597 1.099*** -0.180*** -0.143*** -0.143**
(0.606) (0.549) (0.871) (0.642) (0.545) (0.887) (0.278) (0.439) (0.372) (0.041) (0.042) (0.073)productsXpost -1.092*** -1.416*** -1.452*** -1.045*** -1.306*** -1.343*** -0.146* -0.221** -0.189* -0.085*** -0.119*** -0.123***
(0.273) (0.310) (0.294) (0.251) (0.285) (0.272) (0.077) (0.104) (0.104) (0.021) (0.024) (0.023)ifirmXproductsXpost 0.963 -0.581 -0.819 0.880 -0.617 -0.860 -0.248 -0.718*** -0.914*** 0.067 -0.040 -0.062
(1.270) (0.822) (0.846) (1.210) (0.789) (0.828) (0.181) (0.143) (0.132) (0.083) (0.054) (0.057)ifirmXpost -0.474 -0.177 0.154 -0.434 -0.118 0.209 0.111 0.521*** 0.714*** -0.051 -0.010 0.006
(0.828) (0.604) (0.551) (0.782) (0.551) (0.504) (0.160) (0.124) (0.116) (0.062) (0.043) (0.040)Observations 25074 13552 12782 25074 13552 12782 2265 1248 1111 25074 13552 12782
Firm-product FE YES YES YES YES YES YES YES YES YES YES YES YESYear FE YES YES YES YES YES YES YES YES YES YES YES YES
Note: This table shows the main results dropping the driving firms and destinations (contributed to over 1% of the growth in 2007) of spike in dairy product exports growth between 2006 and 2007. Thesample of Column 1, 4, 7 and 10 contains all dairy exporters in the Chinese Customs Data, dropping driving firms. Column 2, 5, 8 and 11 drop driving exporting destinations. Column 3, 6, 9 and 12 drop bothdriving firms and destinations. We rectangularize the data to create a balanced panel at firm-product (HS eight-digit) and year level. We do so by filling in a small value for missing year observations beforetaking log. The interaction terms are the products of the post-scandal dummy (2009-2013) with the following five group indicators: ContaminatedFirmProduct, ContaminatedFirm, ContaminatedProduct,InnocentFirmProduct, and InnocentFirm. The omitted group is non-contaminated products from non-inspected firms. All regressions control for firm-product and year fixed effects. Standard errors clusteredat the firm-product and year level. *** implies significance at 0.01 level, ** 0.5, * 0.1.
65
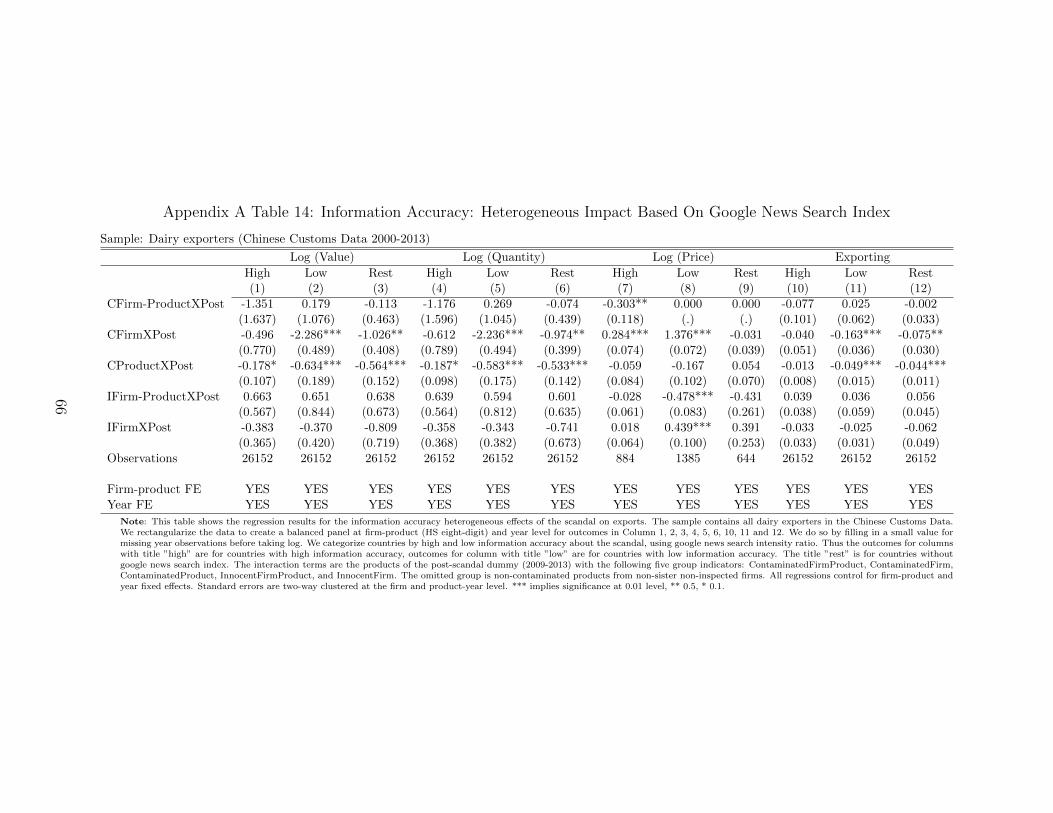
Appendix A Table 14: Information Accuracy: Heterogeneous Impact Based On Google News Search Index
Sample: Dairy exporters (Chinese Customs Data 2000-2013)
Log (Value) Log (Quantity) Log (Price) Exporting
High Low Rest High Low Rest High Low Rest High Low Rest(1) (2) (3) (4) (5) (6) (7) (8) (9) (10) (11) (12)
CFirm-ProductXPost -1.351 0.179 -0.113 -1.176 0.269 -0.074 -0.303** 0.000 0.000 -0.077 0.025 -0.002(1.637) (1.076) (0.463) (1.596) (1.045) (0.439) (0.118) (.) (.) (0.101) (0.062) (0.033)
CFirmXPost -0.496 -2.286*** -1.026** -0.612 -2.236*** -0.974** 0.284*** 1.376*** -0.031 -0.040 -0.163*** -0.075**(0.770) (0.489) (0.408) (0.789) (0.494) (0.399) (0.074) (0.072) (0.039) (0.051) (0.036) (0.030)
CProductXPost -0.178* -0.634*** -0.564*** -0.187* -0.583*** -0.533*** -0.059 -0.167 0.054 -0.013 -0.049*** -0.044***(0.107) (0.189) (0.152) (0.098) (0.175) (0.142) (0.084) (0.102) (0.070) (0.008) (0.015) (0.011)
IFirm-ProductXPost 0.663 0.651 0.638 0.639 0.594 0.601 -0.028 -0.478*** -0.431 0.039 0.036 0.056(0.567) (0.844) (0.673) (0.564) (0.812) (0.635) (0.061) (0.083) (0.261) (0.038) (0.059) (0.045)
IFirmXPost -0.383 -0.370 -0.809 -0.358 -0.343 -0.741 0.018 0.439*** 0.391 -0.033 -0.025 -0.062(0.365) (0.420) (0.719) (0.368) (0.382) (0.673) (0.064) (0.100) (0.253) (0.033) (0.031) (0.049)
Observations 26152 26152 26152 26152 26152 26152 884 1385 644 26152 26152 26152
Firm-product FE YES YES YES YES YES YES YES YES YES YES YES YESYear FE YES YES YES YES YES YES YES YES YES YES YES YES
Note: This table shows the regression results for the information accuracy heterogeneous effects of the scandal on exports. The sample contains all dairy exporters in the Chinese Customs Data.We rectangularize the data to create a balanced panel at firm-product (HS eight-digit) and year level for outcomes in Column 1, 2, 3, 4, 5, 6, 10, 11 and 12. We do so by filling in a small value formissing year observations before taking log. We categorize countries by high and low information accuracy about the scandal, using google news search intensity ratio. Thus the outcomes for columnswith title ”high” are for countries with high information accuracy, outcomes for column with title ”low” are for countries with low information accuracy. The title ”rest” is for countries withoutgoogle news search index. The interaction terms are the products of the post-scandal dummy (2009-2013) with the following five group indicators: ContaminatedFirmProduct, ContaminatedFirm,ContaminatedProduct, InnocentFirmProduct, and InnocentFirm. The omitted group is non-contaminated products from non-sister non-inspected firms. All regressions control for firm-product andyear fixed effects. Standard errors are two-way clustered at the firm and product-year level. *** implies significance at 0.01 level, ** 0.5, * 0.1.
66
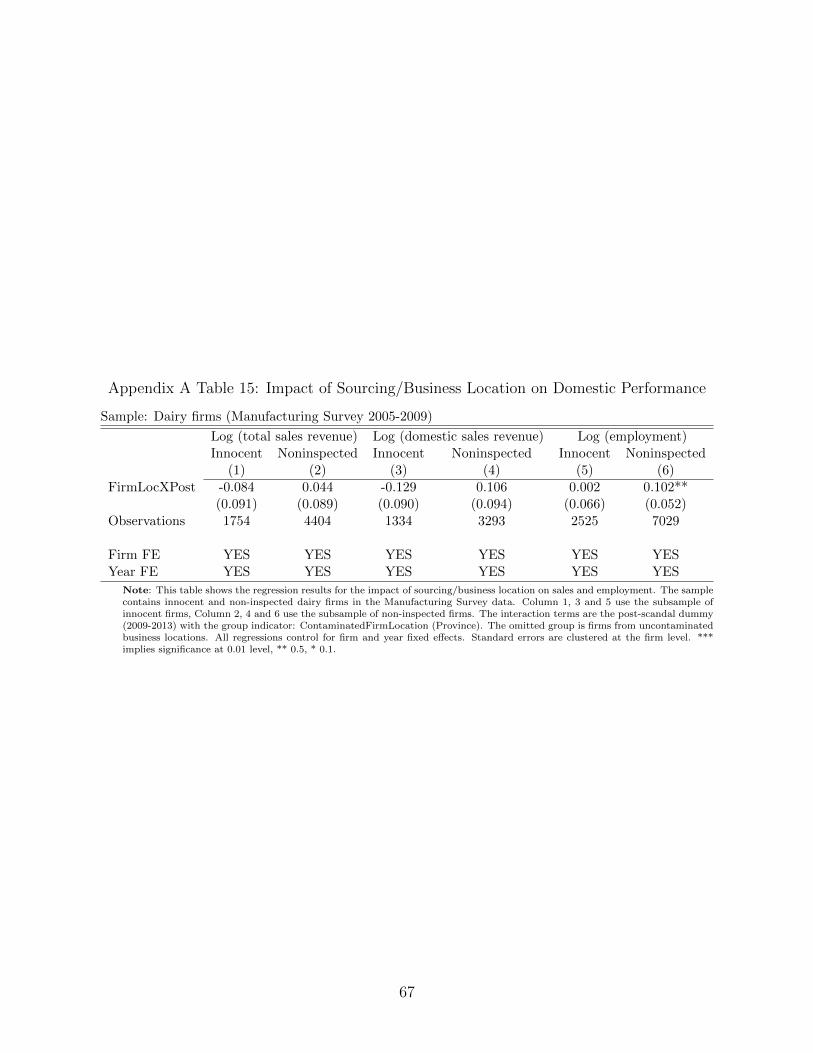
Appendix A Table 15: Impact of Sourcing/Business Location on Domestic Performance
Sample: Dairy firms (Manufacturing Survey 2005-2009)
Log (total sales revenue) Log (domestic sales revenue) Log (employment)Innocent Noninspected Innocent Noninspected Innocent Noninspected
(1) (2) (3) (4) (5) (6)FirmLocXPost -0.084 0.044 -0.129 0.106 0.002 0.102**
(0.091) (0.089) (0.090) (0.094) (0.066) (0.052)Observations 1754 4404 1334 3293 2525 7029
Firm FE YES YES YES YES YES YESYear FE YES YES YES YES YES YES
Note: This table shows the regression results for the impact of sourcing/business location on sales and employment. The samplecontains innocent and non-inspected dairy firms in the Manufacturing Survey data. Column 1, 3 and 5 use the subsample ofinnocent firms, Column 2, 4 and 6 use the subsample of non-inspected firms. The interaction terms are the post-scandal dummy(2009-2013) with the group indicator: ContaminatedFirmLocation (Province). The omitted group is firms from uncontaminatedbusiness locations. All regressions control for firm and year fixed effects. Standard errors are clustered at the firm level. ***implies significance at 0.01 level, ** 0.5, * 0.1.
67
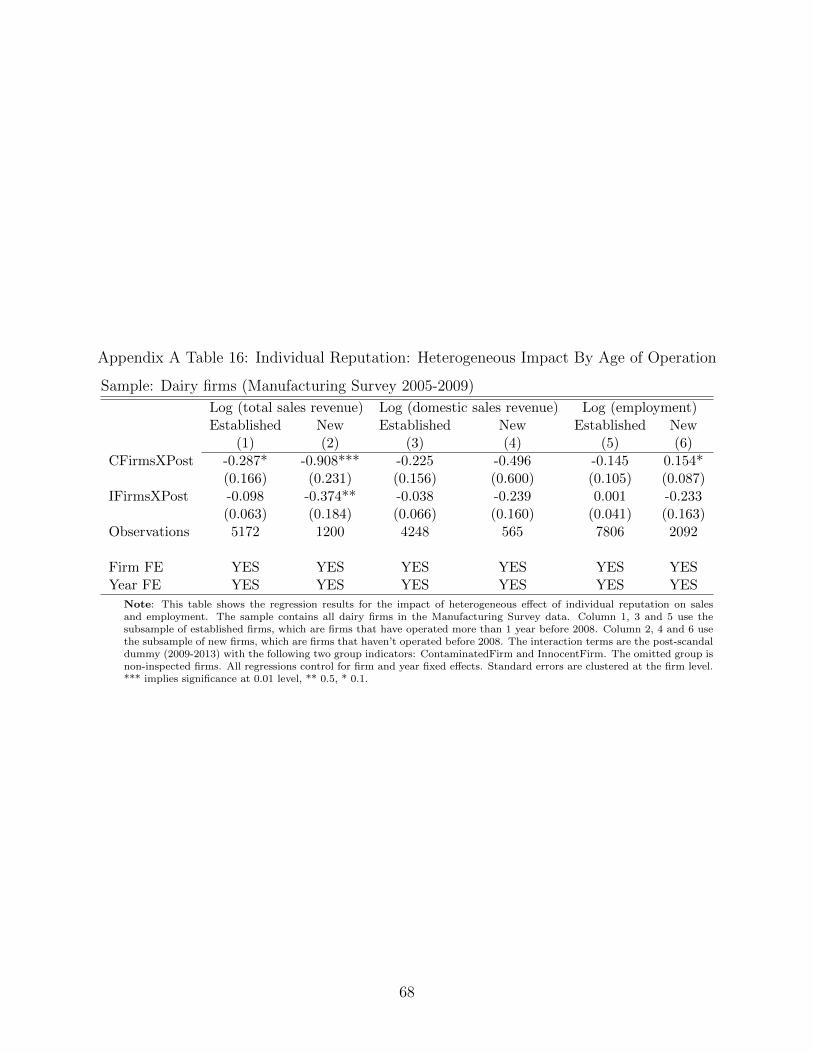
Appendix A Table 16: Individual Reputation: Heterogeneous Impact By Age of Operation
Sample: Dairy firms (Manufacturing Survey 2005-2009)
Log (total sales revenue) Log (domestic sales revenue) Log (employment)Established New Established New Established New
(1) (2) (3) (4) (5) (6)CFirmsXPost -0.287* -0.908*** -0.225 -0.496 -0.145 0.154*
(0.166) (0.231) (0.156) (0.600) (0.105) (0.087)IFirmsXPost -0.098 -0.374** -0.038 -0.239 0.001 -0.233
(0.063) (0.184) (0.066) (0.160) (0.041) (0.163)Observations 5172 1200 4248 565 7806 2092
Firm FE YES YES YES YES YES YESYear FE YES YES YES YES YES YES
Note: This table shows the regression results for the impact of heterogeneous effect of individual reputation on salesand employment. The sample contains all dairy firms in the Manufacturing Survey data. Column 1, 3 and 5 use thesubsample of established firms, which are firms that have operated more than 1 year before 2008. Column 2, 4 and 6 usethe subsample of new firms, which are firms that haven’t operated before 2008. The interaction terms are the post-scandaldummy (2009-2013) with the following two group indicators: ContaminatedFirm and InnocentFirm. The omitted group isnon-inspected firms. All regressions control for firm and year fixed effects. Standard errors are clustered at the firm level.*** implies significance at 0.01 level, ** 0.5, * 0.1.
68
Appendix B: Data Appendix and Codebooks
69
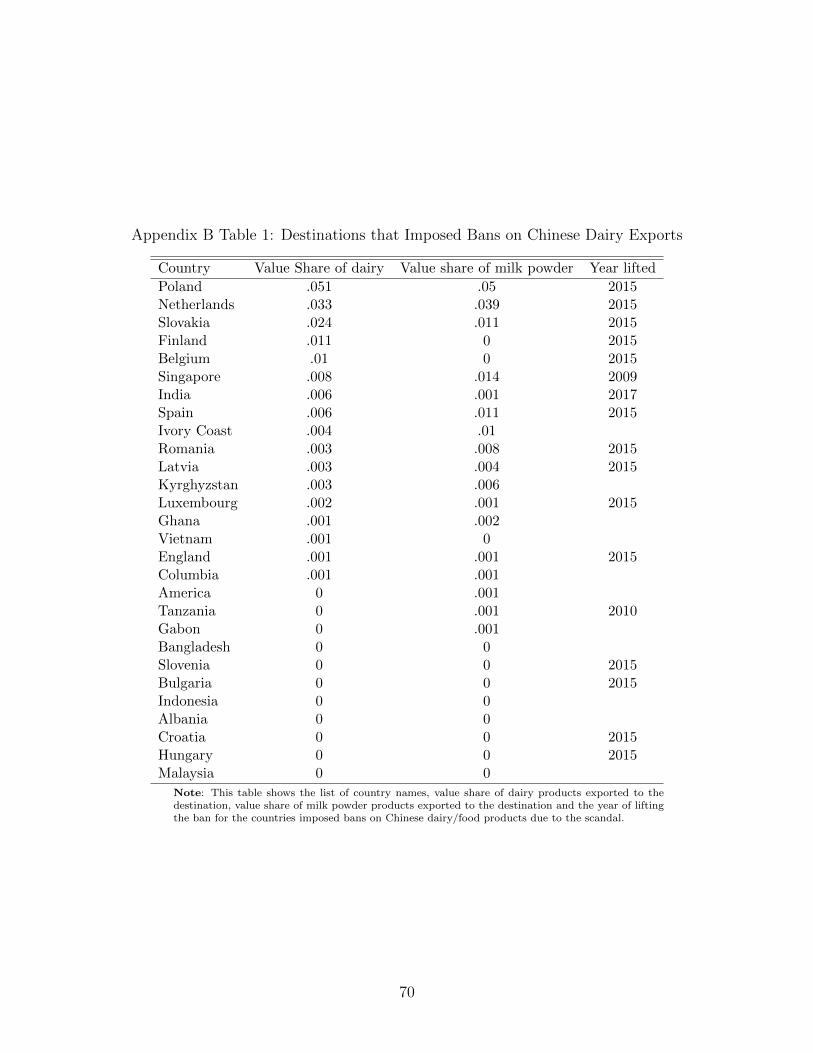
Appendix B Table 1: Destinations that Imposed Bans on Chinese Dairy Exports
Country Value Share of dairy Value share of milk powder Year lifted
Poland .051 .05 2015Netherlands .033 .039 2015Slovakia .024 .011 2015Finland .011 0 2015Belgium .01 0 2015Singapore .008 .014 2009India .006 .001 2017Spain .006 .011 2015Ivory Coast .004 .01Romania .003 .008 2015Latvia .003 .004 2015Kyrghyzstan .003 .006Luxembourg .002 .001 2015Ghana .001 .002Vietnam .001 0England .001 .001 2015Columbia .001 .001America 0 .001Tanzania 0 .001 2010Gabon 0 .001Bangladesh 0 0Slovenia 0 0 2015Bulgaria 0 0 2015Indonesia 0 0Albania 0 0Croatia 0 0 2015Hungary 0 0 2015Malaysia 0 0
Note: This table shows the list of country names, value share of dairy products exported to thedestination, value share of milk powder products exported to the destination and the year of liftingthe ban for the countries imposed bans on Chinese dairy/food products due to the scandal.
70
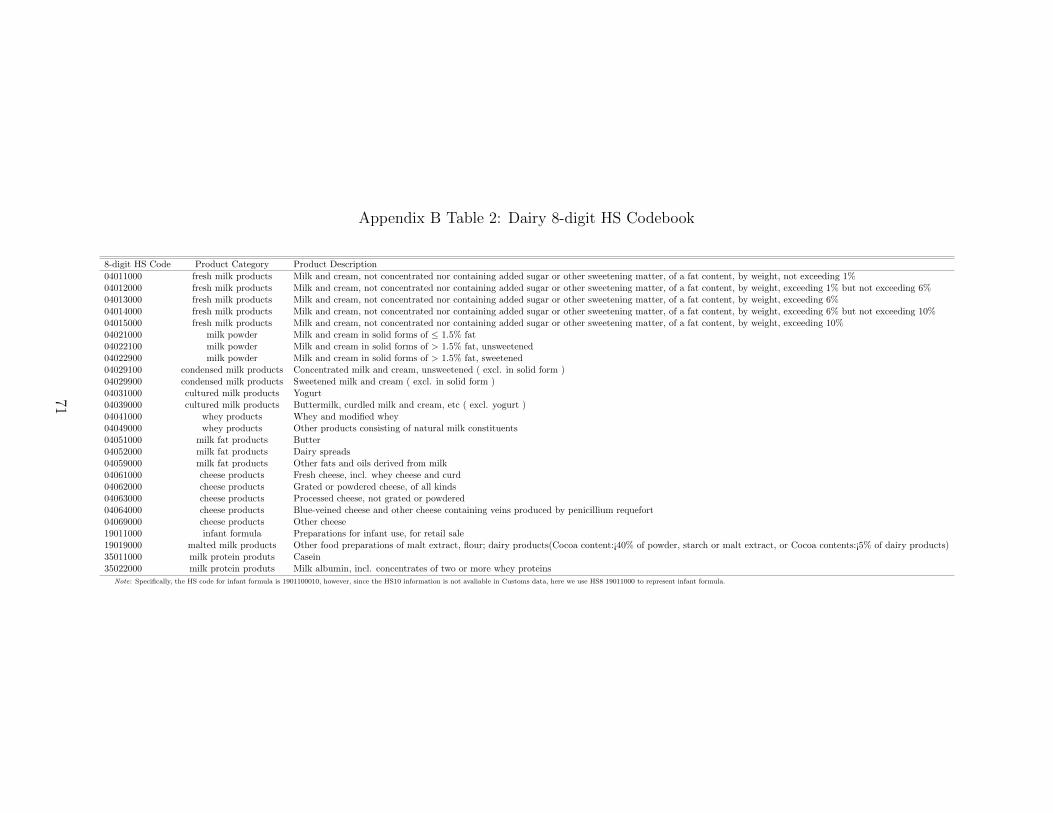
Appendix B Table 2: Dairy 8-digit HS Codebook
8-digit HS Code Product Category Product Description
04011000 fresh milk products Milk and cream, not concentrated nor containing added sugar or other sweetening matter, of a fat content, by weight, not exceeding 1%04012000 fresh milk products Milk and cream, not concentrated nor containing added sugar or other sweetening matter, of a fat content, by weight, exceeding 1% but not exceeding 6%04013000 fresh milk products Milk and cream, not concentrated nor containing added sugar or other sweetening matter, of a fat content, by weight, exceeding 6%04014000 fresh milk products Milk and cream, not concentrated nor containing added sugar or other sweetening matter, of a fat content, by weight, exceeding 6% but not exceeding 10%04015000 fresh milk products Milk and cream, not concentrated nor containing added sugar or other sweetening matter, of a fat content, by weight, exceeding 10%04021000 milk powder Milk and cream in solid forms of ≤ 1.5% fat04022100 milk powder Milk and cream in solid forms of > 1.5% fat, unsweetened04022900 milk powder Milk and cream in solid forms of > 1.5% fat, sweetened04029100 condensed milk products Concentrated milk and cream, unsweetened ( excl. in solid form )04029900 condensed milk products Sweetened milk and cream ( excl. in solid form )04031000 cultured milk products Yogurt04039000 cultured milk products Buttermilk, curdled milk and cream, etc ( excl. yogurt )04041000 whey products Whey and modified whey04049000 whey products Other products consisting of natural milk constituents04051000 milk fat products Butter04052000 milk fat products Dairy spreads04059000 milk fat products Other fats and oils derived from milk04061000 cheese products Fresh cheese, incl. whey cheese and curd04062000 cheese products Grated or powdered cheese, of all kinds04063000 cheese products Processed cheese, not grated or powdered04064000 cheese products Blue-veined cheese and other cheese containing veins produced by penicillium requefort04069000 cheese products Other cheese19011000 infant formula Preparations for infant use, for retail sale19019000 malted milk products Other food preparations of malt extract, flour; dairy products(Cocoa content:¡40% of powder, starch or malt extract, or Cocoa contents:¡5% of dairy products)35011000 milk protein produts Casein35022000 milk protein produts Milk albumin, incl. concentrates of two or more whey proteins
Note: Specifically, the HS code for infant formula is 1901100010, however, since the HS10 information is not avaliable in Customs data, here we use HS8 19011000 to represent infant formula.
71

Appendix B Table 3: Destinations with Google trends info
Country Ratio of Google Web Search index Ratio of Google News Search index
China High HighHong Kong High HighMacao High HighJapan High HighNew Zealand High HighNetherlands High HighSweden High HighSouth Africa High LowSouth Korea High LowPakistan Low LowMalaysia Low LowSwitzerland Low LowBurma Low LowIndia Low LowAustria Low LowUK Low LowFrance Low LowIndonesia Low LowBelgium Low LowSpain Low LowCanada Low LowItaly Low LowUAE Low LowUS Low LowGerman Low LowAustralia Low LowPhilippines Low LowTaiwan Low LowSingapore Low LowThailand Low LowVetnam Low Low
Note: This table shows the list of countries which we have the Google trends indices and the category oftheir ratios of Google trends indices. Column 2 shows the category for ratio of Google web search index,Column 3 shows the category for ratio of Google news search index. For each index, we constructed a relativesearch intensity ratio for the two keywords, “Sanlu” versus “2008 Chinese milk scandal” during 09/01/2008 and10/31/2008, which is the outbreak period of the scandal.
72

Appendix C: Industry Level Analysis: Robustness Checks
As discussed in Section 4.1, this section investigates whether the results obtained in the
DD framework are robust to relaxing the parallel trends assumption at the industry level.
Specifically, C.1 and C.2 allows for unobserved interactions between time-varying factors and
industry fixed effects (FE) using interactive fixed effects (IFE). Gobillon and Magnac (2016)
discuss how the IFE method generalizes the synthetic control design when the matching
variables (i.e. factor loadings and exogenous covariates) of the treated unit do not belong
to the convexified support of the matching variables of the control units, which they call
the extrapolation case. Given the unique growth path of the Chinese dairy industry prior
to the scandal, we might very well find ourselves in the extrapolation case. Nonetheless, the
synthetic control analysis reassuringly confirms both our baseline and IFE estimates. Given
this battery of robustness checks, we are confident that our DD estimates capture the true
effect of the scandal on the export performance of the Chinese dairy industry, and we report
these DD estimates as our preferred ones.
C.1 Interactive Fixed Effects
Following Gobillon and Magnac (2016), we use least squares minimization to estimate Equa-
tion (5) where δt is an L×1 vector of time factors and γj is an L×1 vector of factor loadings
(Bai, 2009). The IFE models assumes that the interaction term δ′t ∗ γj fully describes the
unobserved heterogeneity and that the dimension of the time factors and factor loadings, L
is known. Our estimates are robust to different values of L.
Yjt = βdairyDairyj × Postt + δ′
t ∗ γj + πXjt + εjt (5)
Our estimates of Equation (5) show that the DD estimates are virtually identical to the
equivalent IFE models of dimension one. For example, the baseline specification without
controls in Column 1 of Appendix A Table 2 estimates that the scandal decreased the value
of Chinese dairy exports by 65.6%. Adding controls for the value share of the industry
exported to different continents at baseline interacted with year indicators in Column 5
yields an estimated decrease in the export value of 68.2%, very similar to our preferred
estimate in Column 4 of Table 3 which controlled for industry-specific linear trend in the
DD setting. Similarly, Column 4 of Appendix A Table 2 can be compared to Column 2 of
Table 3 to confirm that the scandal did not significantly affect non-dairy food exports.
Finally, Columns 2 and 3 of Appendix A Table 2 allow for increasingly multi-dimensional
73
interactions between time factors and industry factor loadings. These models estimate an
impact of the scandal on dairy exports that is larger in magnitude than the one we estimate in
the classic DD model. Because the dimension of these IFE models is set somewhat arbitrarily
or assumed to be known (Gobillon and Magnac, 2016), our preferred estimate remains the
more conservative one in Column 4 of Table 3, of a 68% decrease in the value of dairy exports
following the scandal.
Appendix A Table 3 confirm the patterns shown in Table 4: the spillover effect of the
scandal leads to a decrease in exports of non-contaminated firm-products that is smaller
than the total effect of the scandal on the dairy sector. Specifically, using IFE we estimate
spillover effects ranging between a decrease in exports of 50 to 73%.
C.2 Synthetic Control
In the case of a single treated unit, synthetic control methods can successfully construct a
vector of weights such that a weighted combination of control units closely matches the time-
series of the outcome variable for the treated unit in the pre-period (Abadie and Gardeazabal,
2003; Abadie, Diamond, and Hainmueller, 2010). We estimate the impact of the scandal as
the difference between the value of exports in the dairy industry and the synthetic unit
before and after the scandal, as given by Equation (6).
β =2013∑
t=2009
(Y1t −
N∑i=2
w∗i (V
∗)Yit
)−
2008∑t=2000
(Y1t −
N∑i=2
w∗i (V
∗)Yit
)(6)
We denote the dairy industry with index 1, w∗i are the optimal weights on control units,
and V ∗ minimizes the distance between the predicted pre-treatment outcomes of the treated
and synthetic control unit, with predictions based on an arbitrary set of baseline covariates.
Specifically, we use an indicator for whether an industry was exporting in a given year and
the value share of the industry exported to different continents as the baseline covariates to
predict outcomes.
The solid line in Appendix A Figure 5 plots the natural logarithm of value of exports for
the Chinese dairy industry over our sample period. As discussed in Section 2, we observe
that Chinese dairy exports grow substantially prior to the scandal. The dashed line plots the
natural logarithm of the value of exports for the synthetic control unit, created using industry
and covariate weights specified in Appendix A Tables 4 and 5 respectively.15 Reassuringly,
15These tables show that the weights selected by the data-driven algorithm in the synthetic control method-ology appear to be somewhat disconnected from economic theory, leaving doubts as to the interpretation of
74
the synthetic control unit mimics the growth of the dairy sector quite closely prior to 2009,
the first year after the scandal. Starting in 2009, while the synthetic control unit continues
to grow through 2011, the dairy industry experiences a drop in exports that persists through
2010, stabilizing around value levels observed in 2004-2006. Averaging the difference between
the logarithm of the value of exports of the dairy industry and the synthetic control unit
before and after the scandal, as described in Equation (6), we obtain an estimated impact
of the scandal of −71%, in line with our DD estimate.
Abadie, Diamond, and Hainmueller (2010) prove that the bias of the synthetic control
estimator can be bounded by a function that goes to zero as the number of pretreatment
periods increases. Intuitively, a longer baseline allows for a more precise calibration of the
weights, which improves the match between the treated and control outcomes. As our sample
only provides eight years of pre-scandal data, we might worry that the estimated impact of
the scandal is confounded by residual unobserved differences between the dairy industry and
the synthetic control unit. To assuage this concern, we perform inference by permuting the
treatment to each unit in our donor pool of control industries, following Abadie, Diamond,
and Hainmueller (2010). Appendix A Figure 6 plots the difference in the logarithm of the
value of exports between each industry and its synthetic control unit over time. We can
contrast all the placebo differences (in grey) with the difference for the dairy industry (in
black), and we can observe that the dairy industry synthetic control provides a good match
in the pre-scandal period, i.e. the pre-scandal difference lies comfortably within the placebo
band. Moreover, there are only five other industries that display a larger treatment effect
in the post-scandal period. Given that we have 76 placebo differences, the p-value on our
estimate, i.e. likelihood that of erroneously rejecting the hypothesis of a null effect of the
scandal on the dairy industry, is 6/76, or 0.08.16
Analogous to the analysis in Table 4, Appendix A Figure 7 shows the spillover effect of
the scandal on the sample of non-contaminated dairy firm-products. Differently from the DD
and IFE estimates, however, the synthetic control methodology estimates an indirect effect
of −74%, with a point estimate that is larger than the total effect of −71%.17 Nonetheless,
Appendix A Figure 8 shows that there are four industries with a larger placebo difference
than the dairy industry, implying a p-value on our estimate of 5/76, or 0.06. Therefore
the results.16The algorithm for the construction of the synthetic control unit for industries with HS codes 28, 32, and
99 fails to converge.17Industry and covariate weights used to select the synthetic control unit plotted in Appendix A Figure 7
are shown in Appendix A Tables 6 and 7 respectively.
75
we cannot reject the hypothesis that the indirect effect of the scandal on non-contaminated
firm-products is as large as the total effect on the entire dairy industry.
76