Embed Size (px)
Citation preview
4795
ISSN 2286-4822
www.euacademic.org
EUROPEAN ACADEMIC RESEARCH
Vol. I, Issue 11/ February 2014
Impact Factor: 3.1 (UIF)
DRJI Value: 5.9 (B+)
Economic Analysis of Hydro Power Generation in
the State of Jammu and Kashmir, India
IMTIYAZ UL HAQ P.G. Department of Economics
University of Kashmir
Srinagar, J&K
India
Abstract: The state of Jammu and Kashmir, although bestowed with
substantial water resources with the capability to generate about
20,000 MW of hydroelectric power, is experiencing worst power crises. Out of 20,000 MW capacity 16,000 MW have been identified
economically and technically feasible. Currently the state is able to
harness only about 15 per cent of this potential with a total installed capacity of around 2438.70MW, out of which more than 1500MW are
under central ownership and control, leaving only about 5 percent,
that is 758.70 MW with the state. In this way the J&K state has been converted into serious energy deficient economy with repercussions on
various sectors, especially industrial sector, of the economy. To meet its
restricted power demand of 10370 MUs, the state power projects generate only 1692.5 MUs. Consequently, the state is forced to
purchase the rest of the electricity, generated from its own water
recourses, from the central projects worth about 2000 cr. rupees
annually comprising half of State’s tax and non tax base. There are
problems also associated with transmission and distribution processes.
According to the statistics transmission and distribution losses alone account for more than 60 per cent of total power generation which
means more than half of the energy generated is actually lost. In this
paper an attempt has been made to give an account of hydro power potential of the state along with certain constraints leading to the
suboptimal capacity utilization. The paper also draws a picture of the
State Power Development Department’s financial management affairs. Finally, a modest attempt has been made to show if the power sector is
allowed to operate at its full potential, by removing the constraints,
how it will help the state economy to come out of backwardness.
Imtyiaz ul Haq- Economic Analysis of Hydro Power Generation in the State of
Jammu and Kashmir, India
EUROPEAN ACADEMIC RESEARCH - Vol. I, Issue 11 / February 2014
4796
Key words: Jammu and Kashmir, State Power Development, Indus
Water Treaty, Financial Management, Transmission and Distribution
Losses, Economic Potential
1. Introduction
1.1 Background
Importance of energy in the growth and development of an
economy hardly requires any elaboration, especially in the
context of Indian fast growing economy requiring about 112
million tonnes of hydrocarbon energy (2002), which is
projected to rise up to 190 million tonnes in 2025. (Vision
Document 2025) which means a share of 45% in India’s total
energy consumption.[1] But given all the importance of energy
derived from fossil fuels, it has also resulted in a major problem
that is conflict between economic growth and quality of
environment. Greater reliance on fossil fuels to accelerate
growth has given rise to environmental depletion largely on two
counts i.e. green house effect and ozone layer depletion. Given
this trade off between environment and growth, and the fact
that fossils fuel resources are non- renewable and hence
exhaustible, there is a growing felt need all over the world to
search for alternative renewable environment friendly sources
of energy.
The energy sector of J&K economy though not rich in
fossil fuels, is bestowed with substantial water resources with a
capacity of 20,000MW of energy. But due to some political and
economic factors, that have got its roots in the conflict between
two neighbouring countries India and Pakistan and also conflict
within the state of J&K, this sector has received a serious
setback. This can be imagined from the fact that although more
than 16000 MW have been found technically and economically
feasible, the state and the Centre have jointly been able to
harness only about 2438.70MW, which constitutes only 14 per
cent of identified capacity. Out of the total utilized capacity of
Imtyiaz ul Haq- Economic Analysis of Hydro Power Generation in the State of
Jammu and Kashmir, India
EUROPEAN ACADEMIC RESEARCH - Vol. I, Issue 11 / February 2014
4797
2438.70MW, more than 1500MW are under central ownership
and control, leaving only 4 percent i.e. only 758.70MW with the
state. In this way the J&K economy has been reduced to serious
energy deficient sector with the repercussions on industrial and
agriculture sectors of the economy as well. It is pertinent to
note here that if the energy sector in J&K is allowed to operate
at its full potential, the state will not only become an energy
surplus self sufficient state, but would also export hydro electric
power to whole northern states to end the power crises. Some of
the major reasons for this very low utilization of water
resources are:
i. Indus Water Treaty of 1960 – A macro water sharing
arrangement between India & Pakistan over the rivers
flowing across the states of Punjab and J&K. Because
of this treaty many power projects are caught up in
disputes.
ii. Most of the projects are operating at sub optimal
potential because of administrative inertia, inefficiency,
corruption and bad governance.
iii. Poor economic status of the state of J&K is also one
major impediment to the large scale investment in this
sector.
iv. Conflict situation between the two neighboring countries
India and Pakistan, and within the J&Ks has given a
big blow to the suitable investment climate in
exploiting the water resources.
v. The state of J&K across both sides of LOC does not
possess economic sovereignty over its water resources.
There are disputes between the Centre and the State in
utilizing the water resources for power generation.
1.2 Indus Water Treaty
The major source of hydroelectricity in the state of J&K is the
western Indus river basin comprising Jhelum, Indus, Chenab,
and Ravi. The Indus River and its system of upper tributaries
Imtyiaz ul Haq- Economic Analysis of Hydro Power Generation in the State of
Jammu and Kashmir, India
EUROPEAN ACADEMIC RESEARCH - Vol. I, Issue 11 / February 2014
4798
are spread over the whole North-West Indian subcontinent.
Originating about 17,000 feet (518m) above sea level in a spring
near Lake Manasarovar at Mt. Kailash, the Indus river is fed
by massive Tibetan glacial waters and becomes a mighty river
with further feeds from other glacial catchment areas in
Karakorum and Zanaskar ]ranges. After traversing a distance
of 1800 miles (2900 Km) through India, Tibet, Pakistan
occupied Kashmir (PoK), and Pakistan it finally culminates into
the Arabian Sea south of Karachi. On its way, it is further
enriched by the waters of several tributaries, the most
important are Beas, Sutlej, Ravi, Chenab, and Jhelum rivers. [2]
Immediately after independence in 1947 that lead to
formation of two independent countries India and Pakistan,
Pakistan had a fear that since the source of Indus water system
was in India, it could potentially harm their interests. Several
rounds of negotiations between the two countries, however,
finally culminated into what is famously called the “Indus
Water Treaty”- a water-sharing treaty between the Government
of India and the Government of Pakistan, brokered by the
World Bank. The treaty was signed in Karachi on September
19, 1960 by Indian Prime Minister Jawaharlal Nehru and
President of Pakistan Mohammad Ayub Khan.
According to the provisions of this treaty India has got
exclusive rights on the usage of waters, for whatsoever purpose,
of three main eastern rivers i.e. Ravi, Beas, and Sutlej flowing
through Punjab state of India; while as Pakistan shall have
complete rights on the waters of the three major western rivers
i.e. Chenab, Jhelum, and Indus flowing through J&K. India is
supposed not to obstruct free flow of water to Pakistan
especially by way of building dams and reservoirs for electricity
generation on its western rivers. However the treaty does allow
India to construct water storages for various purposes,
including storage for general purpose, floods and power, up to
3.6 MAF only. The treaty does not disallow generation of
electricity from the running waters of these rivers. Also
Imtyiaz ul Haq- Economic Analysis of Hydro Power Generation in the State of
Jammu and Kashmir, India
EUROPEAN ACADEMIC RESEARCH - Vol. I, Issue 11 / February 2014
4799
according to the provisions of the treaty while India is under
obligation to let the flow of the waters of these western rivers to
Pakistan, it could, however, make use of these for the domestic
purpose, non-consumptive use, and irrigation of agriculture[3]
(Tables 1,2 & 3)
1.3 Objectives
To make an assessment of existing and actual
hydropower potential of J&K State
.To analyse financial management efficiency of Power
Development Department.
To capture the impact of hydropower potential on the
economy of the state.
2. Power Sector in J&K- An Overview
Hydro power generation in the state of Jammu and Kashmir
comprises power projects under the control and possession of
the Central and the State governments. The State Power
Development Department (J&K PDD) purchases the power
from these projects and is responsible for transmission and
distribution among the consumers.
Table-4 gives a clear picture of river-wise hydel power
potential of different rivers passing through the territory of
Jammu and Kashmir. Out of a total potential of 16,243.33 MW,
found economically and technically viable, more than 60 per
cent i.e, 10,375.33 MW is contributed by Chenab river alone.
The other major contributors being Jhelum and Indus with
3576.55 MW and 2066.81 MW respectively. Although, capacity
utilization of 484.30 MW from Chenab is largest, yet in relative
terms it constitutes only 4.66 per cent of its identified potential.
While on the other hand with an installed capacity of 252.60
MW only constituting about 7.0 per cent of the identified
potential, it is the river Jhelum standing a significant
contributory in relative terms. In case of river Indus less than 1
Imtyiaz ul Haq- Economic Analysis of Hydro Power Generation in the State of
Jammu and Kashmir, India
EUROPEAN ACADEMIC RESEARCH - Vol. I, Issue 11 / February 2014
4800
per cent of the identified potential has only been harnessed so
far. Thus total installed capacity of the state sector is 956.20
MW including 195.74 MW thermal power (Table 5). Availability
of hydro power is to the extent of about 700 MW in summer but
decreases to 240 MW in winter because of depleting river
discharge.[4]
In the Central sector, during the first year of 11th five
year plan i.e. 2007-08, Dulhusti Power Project, Kishtwar with
the capacity of 390 MW and 120 MW Sewa II were
commissioned which increased the power generation in central
sector from 1170 MW to 1680 MW(Table 6). Out of this State
has a firm allocation of around 1249 MW including 12% free
power from NHPC’s power houses of Salal, Uri and Dulhusti,
besides a share of 105.3 MW as Non-Firm share from
unallocated quota which varies from time to time. But the
effective availability depends upon the de-rating of machines
and river discharge. Power is also received by the state through
what is known as banking arrangements. (Table 7). During the
summer when there are abundant water flows in the rivers, the
state government banks power with NVVN, Punjab, Haryana
and Chhattisgarh and receives back during winters. In addition
the state receives some power from the unallocated quota
during peak requirement [5]
3. Demand and Supply Analysis
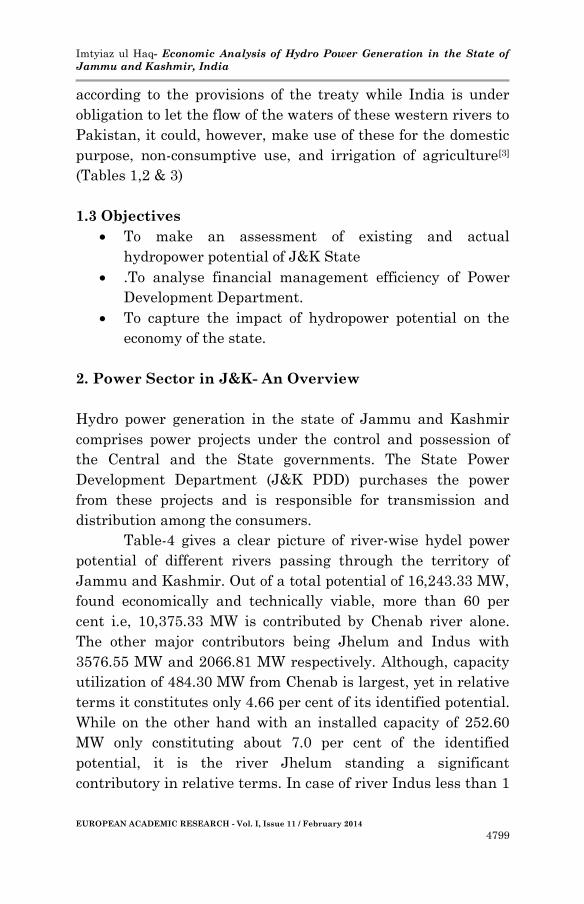
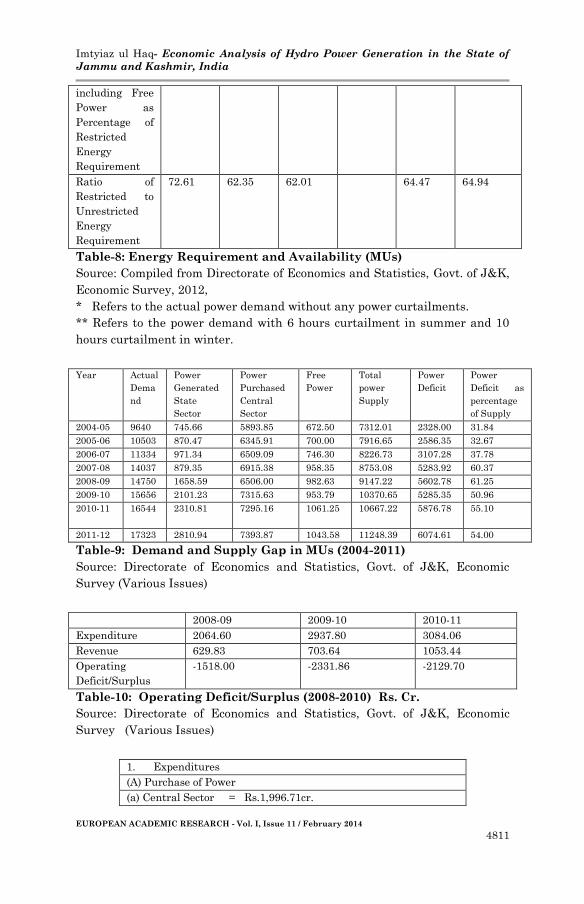
The figures in table 8 clearly highlight that the total
availability of power generated from own sources is meagre and
the free power also accounts very little. Both these contribute
just around one-third of the total restricted electricity
requirement and the rest two-third is purchased from the other
sources.
Imtyiaz ul Haq- Economic Analysis of Hydro Power Generation in the State of
Jammu and Kashmir, India
EUROPEAN ACADEMIC RESEARCH - Vol. I, Issue 11 / February 2014
4801
Figure-1: Showing the widening gap between actual demand and
State’s own supplies.
Source: Table 9
This purchased portion still does not fulfil complete
requirements, hence there are frequent power cuts ranging
from 8 to 10 hours per day (Economic Survey, 2012). Both
purchased as well as self generated power fulfil just around
two-third of (65 per cent approximately) of total requirement
only, while as self generated power including free power availed
from CPSUs is sufficient to feed only 20 per cent of complete
requirements.(Tables-7&8)
Despite the fact that the State has huge hydroelectricity
potential sufficient not only to satisfy its all requirements but
also end the power crises of whole northern states, the State’s
own generation has lagged far behind to meet its own demand.
Over the years gap between supply and demand has widened
considerably. In order to fill up this mounting gap the State
uses to purchase the power from Centrally owned units which,
however, seems to be pretty ordinary to plug the gap. The
power deficit is rising at a very rapid pace as can be seen from
the table-9. In a span of just 8 years from 2004-05 to 2011-12
the power deficit as a percentage of total supply has increased
from about 31 per cent to 54 per cent.
4. Financial Management Efficiency
Financial management of any organization determines its
Imtyiaz ul Haq- Economic Analysis of Hydro Power Generation in the State of
Jammu and Kashmir, India
EUROPEAN ACADEMIC RESEARCH - Vol. I, Issue 11 / February 2014
4802
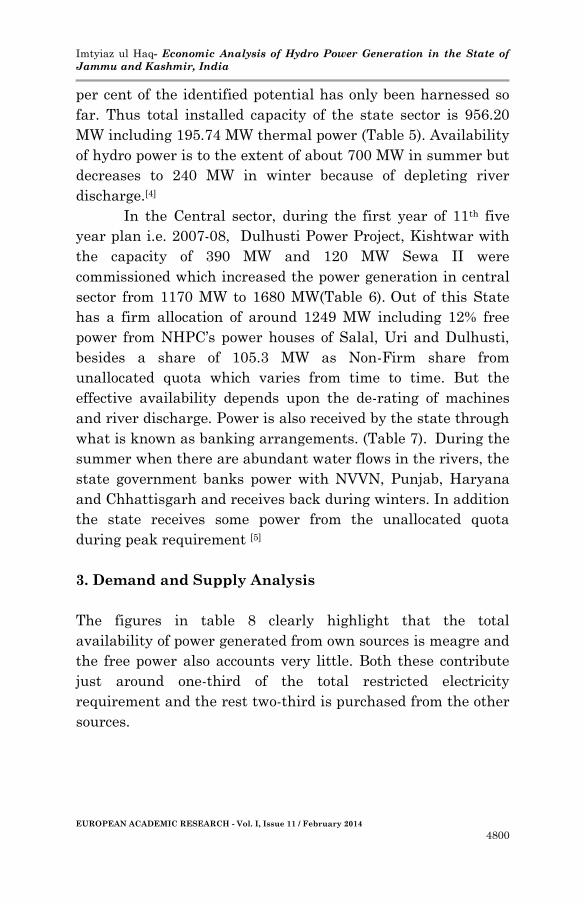
health and soundness. From the examination of statistical facts
and figures the financial mess of the department is quite clear.
The Power Development Department (PDD) is continuously
showing the losses of increasing magnitude.
Figure-2: Showing Accumulating Operational Deficits
Source: Table 10
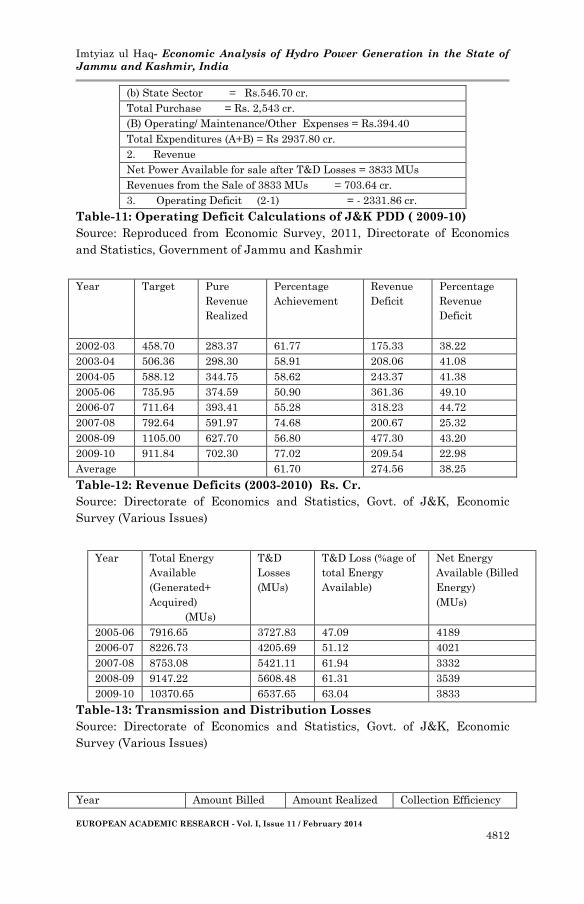
4.1 Operations and Maintenance
Due to heavy transmission and distribution losses owing to
outdated technology, commercial losses due to unaccounted and
uncontrolled consumption of power beyond agreement load,
unregistered consumers, lesser agreement loads etc.(Economic
Survey J&K,2012) the operating deficits have shown a rising
trend (Table 10). These operating deficits constitute about half
of the tax and non tax base of the state budget and a main
reason for the under development of power sector. The figure
above reveals the departmental financial affairs for the years
2008-10.
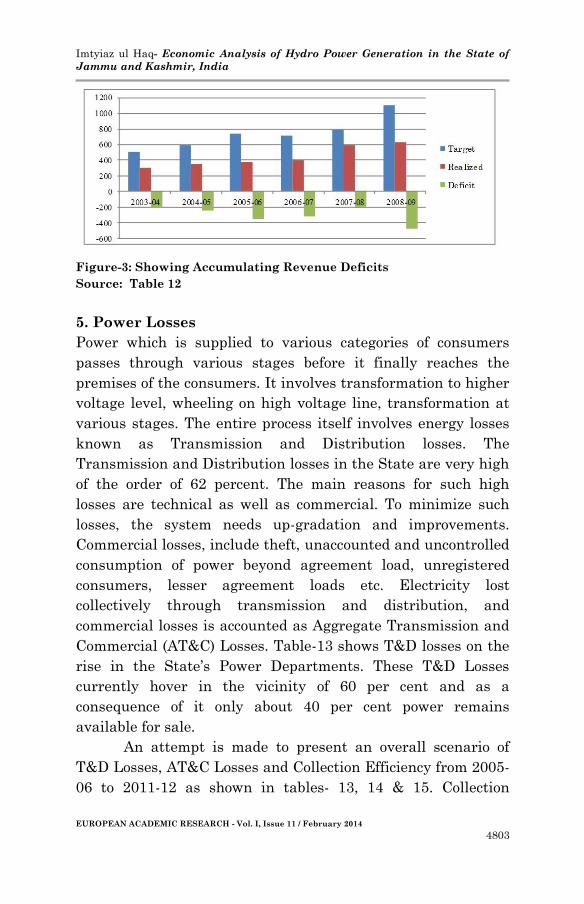
4.2 Revenue realization
Figures given in table-12 reveal a poor picture of revenue
realization. Over a period from 2003 to 2009,on an average, the
concerned department has shown a revenue deficit of Rs.274
crore amounting to 38 per cent in relative terms. In other words
the department is able to realize only about 60 per cent of the
revenues.
Imtyiaz ul Haq- Economic Analysis of Hydro Power Generation in the State of
Jammu and Kashmir, India
EUROPEAN ACADEMIC RESEARCH - Vol. I, Issue 11 / February 2014
4803
Figure-3: Showing Accumulating Revenue Deficits
Source: Table 12
5. Power Losses
Power which is supplied to various categories of consumers
passes through various stages before it finally reaches the
premises of the consumers. It involves transformation to higher
voltage level, wheeling on high voltage line, transformation at
various stages. The entire process itself involves energy losses
known as Transmission and Distribution losses. The
Transmission and Distribution losses in the State are very high
of the order of 62 percent. The main reasons for such high
losses are technical as well as commercial. To minimize such
losses, the system needs up-gradation and improvements.
Commercial losses, include theft, unaccounted and uncontrolled
consumption of power beyond agreement load, unregistered
consumers, lesser agreement loads etc. Electricity lost
collectively through transmission and distribution, and
commercial losses is accounted as Aggregate Transmission and
Commercial (AT&C) Losses. Table-13 shows T&D losses on the
rise in the State’s Power Departments. These T&D Losses
currently hover in the vicinity of 60 per cent and as a
consequence of it only about 40 per cent power remains
available for sale.
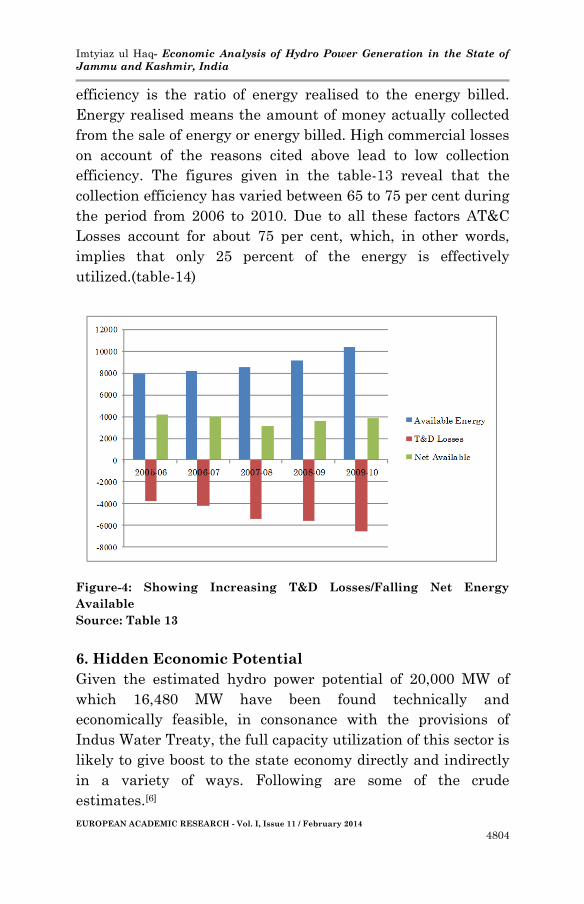
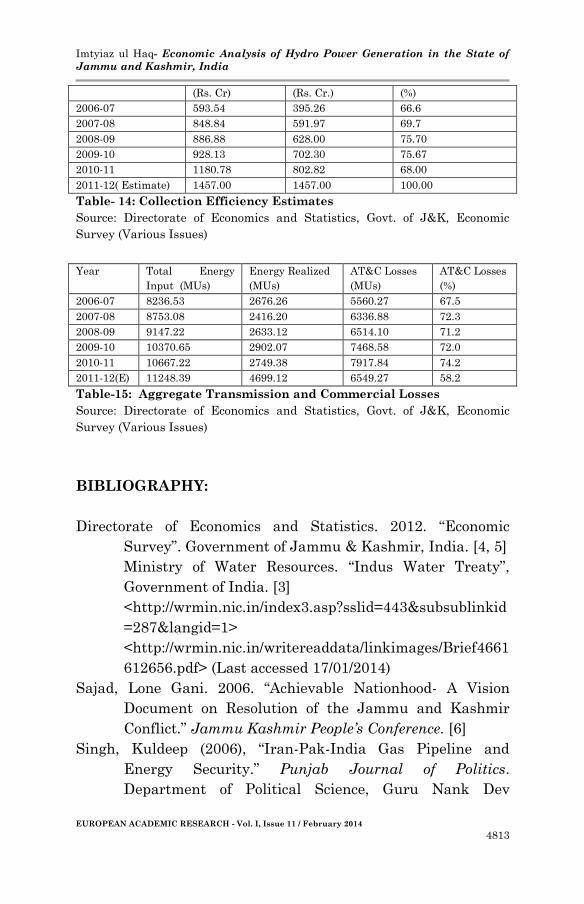
An attempt is made to present an overall scenario of
T&D Losses, AT&C Losses and Collection Efficiency from 2005-
06 to 2011-12 as shown in tables- 13, 14 & 15. Collection
Imtyiaz ul Haq- Economic Analysis of Hydro Power Generation in the State of
Jammu and Kashmir, India
EUROPEAN ACADEMIC RESEARCH - Vol. I, Issue 11 / February 2014
4804
efficiency is the ratio of energy realised to the energy billed.
Energy realised means the amount of money actually collected
from the sale of energy or energy billed. High commercial losses
on account of the reasons cited above lead to low collection
efficiency. The figures given in the table-13 reveal that the
collection efficiency has varied between 65 to 75 per cent during
the period from 2006 to 2010. Due to all these factors AT&C
Losses account for about 75 per cent, which, in other words,
implies that only 25 percent of the energy is effectively
utilized.(table-14)
Figure-4: Showing Increasing T&D Losses/Falling Net Energy
Available
Source: Table 13
6. Hidden Economic Potential
Given the estimated hydro power potential of 20,000 MW of
which 16,480 MW have been found technically and
economically feasible, in consonance with the provisions of
Indus Water Treaty, the full capacity utilization of this sector is
likely to give boost to the state economy directly and indirectly
in a variety of ways. Following are some of the crude
estimates.[6]
Imtyiaz ul Haq- Economic Analysis of Hydro Power Generation in the State of
Jammu and Kashmir, India
EUROPEAN ACADEMIC RESEARCH - Vol. I, Issue 11 / February 2014
4805
6.1 Revenue
These calculations assume the cost of a unit of energy to be
Rs.2.56 at which the state government used to purchase
electricity previously from the central power projects.
20,000 MW for 12 hours per day round the year, @ Rs.
2.56 per Unit
= Rs. 22,425.6cr.
20,000 MW for 8 hours per day round the year, @ Rs. 2.56
per Unit
= Rs. 14,950.0 cr.
Calculations
1KW load used for 1 hour consumes = 1Unit of energy
1000KW load(1MW) used for 1 hour = 1000 Units
1000 MW load used for 1 hour consumes = 1000×1000 =
10,00000 Units=1MUs
20,000 MW load used for 1 hour consumes = 20 MUs
20,000 MW load used for 12 hours consumes = 20×12
= 240 MUs
20,000 MW load used for 12 hours for 365 days
consumes = 240×365=87,600 MUs
87,600 MUs @ Rs. 2.56 per unit = 87,600×2.56 =
Rs..2,24,256 million
=Rs.22,425 cr.
6.2 Employment
Employment generation from 20,000 MW @ 8
skilled/unskilled persons per one MW =1,60,000 persons
Based on national average, with emphasis towards optimal
efficiency on the minimum requirement basis.
6.3 Income
After adding the revenue of Rs.22, 425cr.
NSDP expected to rise from Rs.27,099 cr. to Rs. 46,639
Imtyiaz ul Haq- Economic Analysis of Hydro Power Generation in the State of
Jammu and Kashmir, India
EUROPEAN ACADEMIC RESEARCH - Vol. I, Issue 11 / February 2014
4806
cr.
Per capita income expected to rise from Rs.26,715 to
Rs. 45,978
Calculations
Total Population of the State (2001) =1,01,43,700
Actual NSDP at current prices (2007-08 =Rs.27,099 cr.
Actual Per capita income (2007-08) = Rs.26,715
6.4 Investment
On an average infrastructure cost, in J&K, of setting up of
hydel project per one MW is Rs. 6.0 cr.
Investment required to exploit 20,000 MW = Rs.
1,20,000 cr.
Investment in dollar terms (assuming exchange rate Rs.
50 = $1) = $4 billion
On an average about 60-70 percent of the project cost is
spent locally especially on civil works including
compensation for land acquisition and employment.
Therefore, spillover effect on local economy at 65% =Rs.
80,000 cr. ($2.5billion) which can generate a stream of
perpetual incomes through multiplier effect
Out of 20,000 MW, 4000 MW capacity utilization can
feed the local actual demand for power equal to 17,520
MUs. Rest of 16,000 MW can be exported to northern
neighboring states sufficient to end the power crises.
Calculations
1000 MW load used for 1 hour can generate energy =
1MUs
1000 MW load used per hour per day can generate
energy = 12 MUs
1000 MW load used per hour per day for 1 year can
generate (12×365) = 4380MUs
4000MW load used per hour per day for 1 year can
generate (4380×4) =17,520MUs.
Imtyiaz ul Haq- Economic Analysis of Hydro Power Generation in the State of
Jammu and Kashmir, India
EUROPEAN ACADEMIC RESEARCH - Vol. I, Issue 11 / February 2014
4807
7. Conclusion
The State of Jammu and Kashmir bestowed with substantial
water resources has the potential to generate hydel electricity
sufficient to meet its whole power requirement, along with
satisfying the needs of northern Indian states. But due to
various political, economic, and administrative reasons this
important economic resource has received a serious setback.
Some of the main reasons being that the State of Jammu and
Kashmir does not possess sovereignty over its water resources
due to which major power houses are owned by the centre
government, forcing the state governments to purchase power
generated from its own resources at exorbitant price. Secondly,
because of administrative inertia and corruption the power
development departments have become complete loss making
enterprises and a burden on the state exchequer. Thirdly, due
to unhealthy economic position of the State, power generation
has remained a very weak area. Outdated machines and
technology continue to be in operation. Fourthly, civil
disturbances have also contributed to unfavorable investment
climate and, last but not the least, Indus Water Treaty between
two neighboring countries India and Pakistan have had a
significant impact on the exploitation of water resources.
However, exploitation of 20,000 MW is possible on the run of
the river waters without violating the provisions of the treaty.
Imtyiaz ul Haq- Economic Analysis of Hydro Power Generation in the State of
Jammu and Kashmir, India
EUROPEAN ACADEMIC RESEARCH - Vol. I, Issue 11 / February 2014
4808
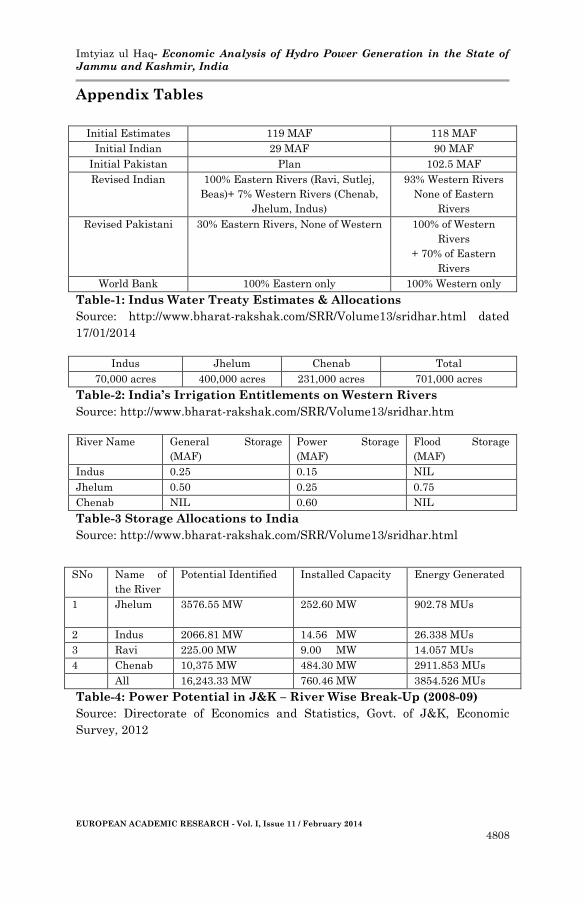
Appendix Tables
Initial Estimates 119 MAF 118 MAF
Initial Indian 29 MAF 90 MAF
Initial Pakistan Plan 102.5 MAF
Revised Indian 100% Eastern Rivers (Ravi, Sutlej,
Beas)+ 7% Western Rivers (Chenab,
Jhelum, Indus)
93% Western Rivers
None of Eastern
Rivers
Revised Pakistani 30% Eastern Rivers, None of Western 100% of Western
Rivers
+ 70% of Eastern
Rivers
World Bank 100% Eastern only 100% Western only
Table-1: Indus Water Treaty Estimates & Allocations
Source: http://www.bharat-rakshak.com/SRR/Volume13/sridhar.html dated
17/01/2014
Table-2: India’s Irrigation Entitlements on Western Rivers
Source: http://www.bharat-rakshak.com/SRR/Volume13/sridhar.htm
Table-3 Storage Allocations to India
Source: http://www.bharat-rakshak.com/SRR/Volume13/sridhar.html
Table-4: Power Potential in J&K – River Wise Break-Up (2008-09)
Source: Directorate of Economics and Statistics, Govt. of J&K, Economic
Survey, 2012
Indus Jhelum Chenab Total
70,000 acres 400,000 acres 231,000 acres 701,000 acres
River Name General Storage
(MAF)
Power Storage
(MAF)
Flood Storage
(MAF)
Indus 0.25 0.15 NIL
Jhelum 0.50 0.25 0.75
Chenab NIL 0.60 NIL
SNo Name of
the River
Potential Identified Installed Capacity Energy Generated
1 Jhelum 3576.55 MW 252.60 MW 902.78 MUs
2 Indus 2066.81 MW 14.56 MW 26.338 MUs
3 Ravi 225.00 MW 9.00 MW 14.057 MUs
4 Chenab 10,375 MW 484.30 MW 2911.853 MUs
All 16,243.33 MW 760.46 MW 3854.526 MUs
Imtyiaz ul Haq- Economic Analysis of Hydro Power Generation in the State of
Jammu and Kashmir, India
EUROPEAN ACADEMIC RESEARCH - Vol. I, Issue 11 / February 2014
4809
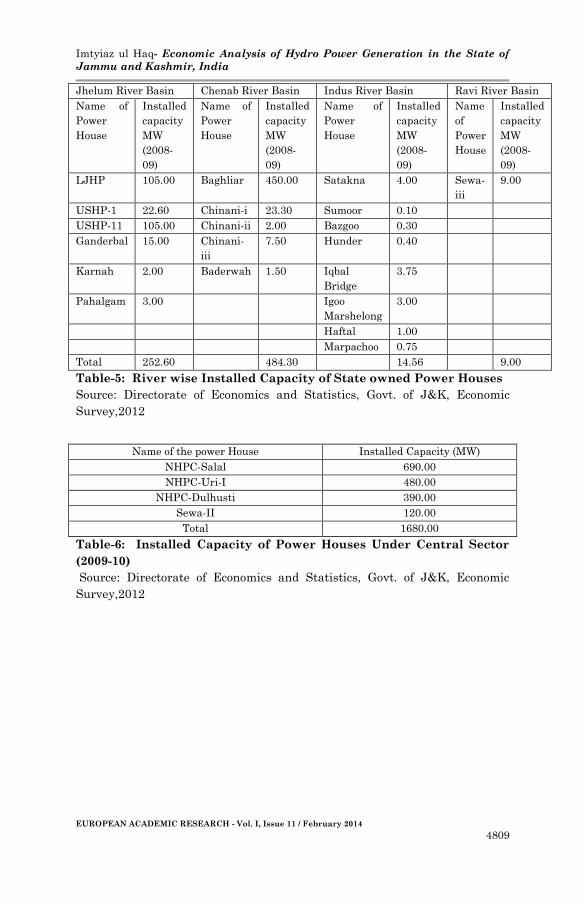
Table-5: River wise Installed Capacity of State owned Power Houses
Source: Directorate of Economics and Statistics, Govt. of J&K, Economic
Survey,2012
Table-6: Installed Capacity of Power Houses Under Central Sector
(2009-10)
Source: Directorate of Economics and Statistics, Govt. of J&K, Economic
Survey,2012
Jhelum River Basin Chenab River Basin Indus River Basin Ravi River Basin
Name of
Power
House
Installed
capacity
MW
(2008-
09)
Name of
Power
House
Installed
capacity
MW
(2008-
09)
Name of
Power
House
Installed
capacity
MW
(2008-
09)
Name
of
Power
House
Installed
capacity
MW
(2008-
09)
LJHP 105.00 Baghliar 450.00 Satakna 4.00 Sewa-
iii
9.00
USHP-1 22.60 Chinani-i 23.30 Sumoor 0.10
USHP-11 105.00 Chinani-ii 2.00 Bazgoo 0.30
Ganderbal 15.00 Chinani-
iii
7.50 Hunder 0.40
Karnah 2.00 Baderwah 1.50 Iqbal
Bridge
3.75
Pahalgam 3.00 Igoo
Marshelong
3.00
Haftal 1.00
Marpachoo 0.75
Total 252.60 484.30 14.56 9.00
Name of the power House Installed Capacity (MW)
NHPC-Salal 690.00
NHPC-Uri-I 480.00
NHPC-Dulhusti 390.00
Sewa-II 120.00
Total 1680.00
Imtyiaz ul Haq- Economic Analysis of Hydro Power Generation in the State of
Jammu and Kashmir, India
EUROPEAN ACADEMIC RESEARCH - Vol. I, Issue 11 / February 2014
4810
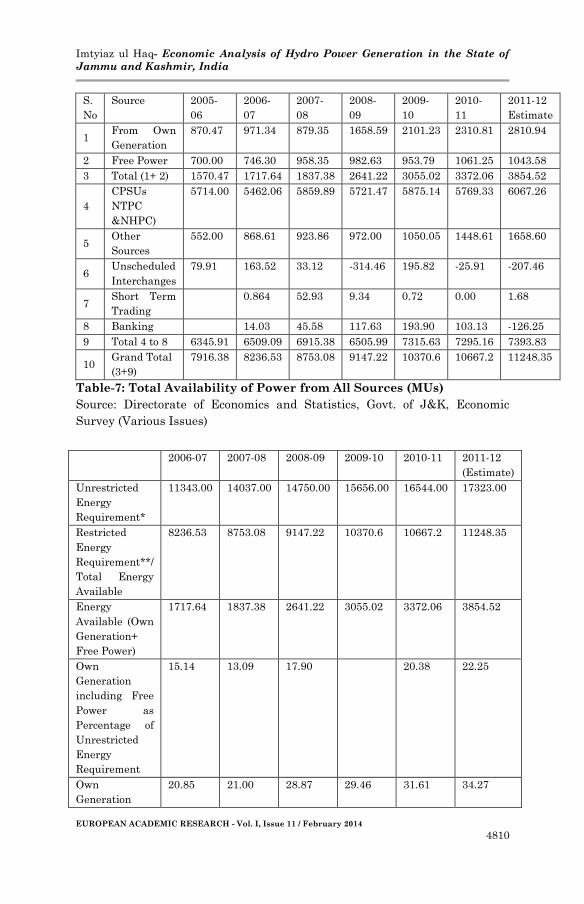
Table-7: Total Availability of Power from All Sources (MUs)
Source: Directorate of Economics and Statistics, Govt. of J&K, Economic
Survey (Various Issues)
2006-07 2007-08 2008-09 2009-10 2010-11 2011-12
(Estimate)
Unrestricted
Energy
Requirement*
11343.00 14037.00 14750.00 15656.00 16544.00 17323.00
Restricted
Energy
Requirement**/
Total Energy
Available
8236.53 8753.08 9147.22 10370.6 10667.2 11248.35
Energy
Available (Own
Generation+
Free Power)
1717.64 1837.38 2641.22 3055.02 3372.06 3854.52
Own
Generation
including Free
Power as
Percentage of
Unrestricted
Energy
Requirement
15.14 13.09 17.90 20.38 22.25
Own
Generation
20.85 21.00 28.87 29.46 31.61 34.27
S.
No
Source 2005-
06
2006-
07
2007-
08
2008-
09
2009-
10
2010-
11
2011-12
Estimate
1 From Own
Generation
870.47 971.34 879.35 1658.59 2101.23 2310.81 2810.94
2 Free Power 700.00 746.30 958.35 982.63 953.79 1061.25 1043.58
3 Total (1+ 2) 1570.47 1717.64 1837.38 2641.22 3055.02 3372.06 3854.52
4
CPSUs
NTPC
&NHPC)
5714.00 5462.06 5859.89 5721.47 5875.14 5769.33 6067.26
5 Other
Sources
552.00 868.61 923.86 972.00 1050.05 1448.61 1658.60
6 Unscheduled
Interchanges
79.91 163.52 33.12 -314.46 195.82 -25.91 -207.46
7 Short Term
Trading
0.864 52.93 9.34 0.72 0.00 1.68
8 Banking 14.03 45.58 117.63 193.90 103.13 -126.25
9 Total 4 to 8 6345.91 6509.09 6915.38 6505.99 7315.63 7295.16 7393.83
10 Grand Total
(3+9)
7916.38 8236.53 8753.08 9147.22 10370.6 10667.2 11248.35
Imtyiaz ul Haq- Economic Analysis of Hydro Power Generation in the State of
Jammu and Kashmir, India
EUROPEAN ACADEMIC RESEARCH - Vol. I, Issue 11 / February 2014
4811
including Free
Power as
Percentage of
Restricted
Energy
Requirement
Ratio of
Restricted to
Unrestricted
Energy
Requirement
72.61 62.35 62.01 64.47 64.94
Table-8: Energy Requirement and Availability (MUs)
Source: Compiled from Directorate of Economics and Statistics, Govt. of J&K,
Economic Survey, 2012,
* Refers to the actual power demand without any power curtailments.
** Refers to the power demand with 6 hours curtailment in summer and 10
hours curtailment in winter.
Year Actual
Dema
nd
Power
Generated
State
Sector
Power
Purchased
Central
Sector
Free
Power
Total
power
Supply
Power
Deficit
Power
Deficit as
percentage
of Supply
2004-05 9640 745.66 5893.85 672.50 7312.01 2328.00 31.84
2005-06 10503 870.47 6345.91 700.00 7916.65 2586.35 32.67
2006-07 11334 971.34 6509.09 746.30 8226.73 3107.28 37.78
2007-08 14037 879.35 6915.38 958.35 8753.08 5283.92 60.37
2008-09 14750 1658.59 6506.00 982.63 9147.22 5602.78 61.25
2009-10 15656 2101.23 7315.63 953.79 10370.65 5285.35 50.96
2010-11 16544 2310.81 7295.16 1061.25
10667.22 5876.78 55.10
2011-12 17323 2810.94 7393.87 1043.58 11248.39 6074.61 54.00
Table-9: Demand and Supply Gap in MUs (2004-2011)
Source: Directorate of Economics and Statistics, Govt. of J&K, Economic
Survey (Various Issues)
2008-09 2009-10 2010-11
Expenditure 2064.60 2937.80 3084.06
Revenue 629.83 703.64 1053.44
Operating
Deficit/Surplus
-1518.00 -2331.86 -2129.70
Table-10: Operating Deficit/Surplus (2008-2010) Rs. Cr.
Source: Directorate of Economics and Statistics, Govt. of J&K, Economic
Survey (Various Issues)
1. Expenditures
(A) Purchase of Power
(a) Central Sector = Rs.1,996.71cr.
Imtyiaz ul Haq- Economic Analysis of Hydro Power Generation in the State of
Jammu and Kashmir, India
EUROPEAN ACADEMIC RESEARCH - Vol. I, Issue 11 / February 2014
4812
(b) State Sector = Rs.546.70 cr.
Total Purchase = Rs. 2,543 cr.
(B) Operating/ Maintenance/Other Expenses = Rs.394.40
Total Expenditures (A+B) = Rs 2937.80 cr.
2. Revenue
Net Power Available for sale after T&D Losses = 3833 MUs
Revenues from the Sale of 3833 MUs = 703.64 cr.
3. Operating Deficit (2-1) = - 2331.86 cr.
Table-11: Operating Deficit Calculations of J&K PDD ( 2009-10)
Source: Reproduced from Economic Survey, 2011, Directorate of Economics
and Statistics, Government of Jammu and Kashmir
Year Target Pure
Revenue
Realized
Percentage
Achievement
Revenue
Deficit
Percentage
Revenue
Deficit
2002-03 458.70 283.37 61.77 175.33 38.22
2003-04 506.36 298.30 58.91 208.06 41.08
2004-05 588.12 344.75 58.62 243.37 41.38
2005-06 735.95 374.59 50.90 361.36 49.10
2006-07 711.64 393.41 55.28 318.23 44.72
2007-08 792.64 591.97 74.68 200.67 25.32
2008-09 1105.00 627.70 56.80 477.30 43.20
2009-10 911.84 702.30 77.02 209.54 22.98
Average 61.70 274.56 38.25
Table-12: Revenue Deficits (2003-2010) Rs. Cr.
Source: Directorate of Economics and Statistics, Govt. of J&K, Economic
Survey (Various Issues)
Table-13: Transmission and Distribution Losses
Source: Directorate of Economics and Statistics, Govt. of J&K, Economic
Survey (Various Issues)
Year Amount Billed Amount Realized Collection Efficiency
Year Total Energy
Available
(Generated+
Acquired)
(MUs)
T&D
Losses
(MUs)
T&D Loss (%age of
total Energy
Available)
Net Energy
Available (Billed
Energy)
(MUs)
2005-06 7916.65 3727.83 47.09 4189
2006-07 8226.73 4205.69 51.12 4021
2007-08 8753.08 5421.11 61.94 3332
2008-09 9147.22 5608.48 61.31 3539
2009-10 10370.65 6537.65 63.04 3833
Imtyiaz ul Haq- Economic Analysis of Hydro Power Generation in the State of
Jammu and Kashmir, India
EUROPEAN ACADEMIC RESEARCH - Vol. I, Issue 11 / February 2014
4813
(Rs. Cr) (Rs. Cr.) (%)
2006-07 593.54 395.26 66.6
2007-08 848.84 591.97 69.7
2008-09 886.88 628.00 75.70
2009-10 928.13 702.30 75.67
2010-11 1180.78 802.82 68.00
2011-12( Estimate) 1457.00 1457.00 100.00
Table- 14: Collection Efficiency Estimates
Source: Directorate of Economics and Statistics, Govt. of J&K, Economic
Survey (Various Issues)
Year Total Energy
Input (MUs)
Energy Realized
(MUs)
AT&C Losses
(MUs)
AT&C Losses
(%)
2006-07 8236.53 2676.26 5560.27 67.5
2007-08 8753.08 2416.20 6336.88 72.3
2008-09 9147.22 2633.12 6514.10 71.2
2009-10 10370.65 2902.07 7468.58 72.0
2010-11 10667.22 2749.38 7917.84 74.2
2011-12(E) 11248.39 4699.12 6549.27 58.2
Table-15: Aggregate Transmission and Commercial Losses
Source: Directorate of Economics and Statistics, Govt. of J&K, Economic
Survey (Various Issues)
BIBLIOGRAPHY:
Directorate of Economics and Statistics. 2012. “Economic
Survey”. Government of Jammu & Kashmir, India. [4, 5]
Ministry of Water Resources. “Indus Water Treaty”,
Government of India. [3]
<http://wrmin.nic.in/index3.asp?sslid=443&subsublinkid
=287&langid=1>
<http://wrmin.nic.in/writereaddata/linkimages/Brief4661
612656.pdf> (Last accessed 17/01/2014)
Sajad, Lone Gani. 2006. “Achievable Nationhood- A Vision
Document on Resolution of the Jammu and Kashmir
Conflict.” Jammu Kashmir People’s Conference. [6]
Singh, Kuldeep (2006), “Iran-Pak-India Gas Pipeline and
Energy Security.” Punjab Journal of Politics.
Department of Political Science, Guru Nank Dev
Imtyiaz ul Haq- Economic Analysis of Hydro Power Generation in the State of
Jammu and Kashmir, India
EUROPEAN ACADEMIC RESEARCH - Vol. I, Issue 11 / February 2014
4814
University, Amritsar, India. 30(1):7. [1]
Subrahmanyam, Sridhar. 2005. “The Indus Water Treaty.”
Security Research Review 1(3). http://www.bharat-
rakshak.com/SRR/Volume13/sridhar.html (Last accessed
17/01/2014) [2]