Embed Size (px)
Citation preview
BC Hydro
BC Hydro Renewable Generation Market Competitiveness Report
FINAL REPORT B&V Project Number: 172047
July 2011
Black & Veatch Corporation 11401 Lamar Avenue Overland Park, Kansas 66211 Tel: (913) 458‐2000 www.bv.com
BUILDING A WORLD OF DIFFERENCE®

BC Hydro BC Hydro Renewable Generation Market Competitiveness Report Table of Contents
July 2011 Black & Veatch TC1
Table of Contents
1.0 Introduction ............................................................................................................ 1‐1
2.0 Renewable Energy Market Size .............................................................................. 2‐1
2.1 RPS Demand and Supply ............................................................................... 2‐1
2.2 Low Carbon Electricity Demand and Supply ................................................. 2‐8
2.3 Firmed and Shaped Product ....................................................................... 2‐10
3.0 BC Hydro Renewable Generation Competitiveness ............................................... 3‐1
3.1 Competitiveness Sensitivities ....................................................................... 3‐1
3.2 Competitiveness in Carbon Only Market...................................................... 3‐7
3.3 US Policy toward Canadian Renewables ...................................................... 3‐8
4.0 Summary of Findings .............................................................................................. 4‐9
List of Tables
Table 2‐1 California RPS Market Potential. ..................................................................... 2‐4 Table 2‐2 Washington RPS Market Potential. ................................................................. 2‐6 Table 2‐3 Oregon RPS Market Potential. ........................................................................ 2‐8 Table 3‐1 Market Scenario for Sensitivity Tests. ............................................................. 3‐1
List of Figures
Figure 2‐1 California RPS Demand and Supply View ....................................................... 2‐3 Figure 2‐2. Washington RPS Demand and Supply View .................................................. 2‐5 Figure 2‐3. Oregon RPS Demand and Supply View .......................................................... 2‐7 Figure 3‐1 Sensitivity 1 (No PTC/No ACP) REC Prices ...................................................... 3‐2 Figure 3‐2 Sensitivity 1 (No PTC/No ACP) RPS Capacity Build ......................................... 3‐3 Figure 3‐3 Cost and Value of 1500 MW Block of Energy ................................................. 3‐4 Figure 3‐4 Sensitivity 2 (1500 MW Block Product) REC Prices ........................................ 3‐5 Figure 3‐5 Sensitivity 2 (1500 MW Block Product) RPS Capacity Build ........................... 3‐5 Figure 3‐6 Sensitivity 3 (Block/No PTC/No ACP) REC Price .............................................. 3‐6 Figure 3‐7 Sensitivity 3 (Block/No PTC/No ACP) RPS Capacity Build .............................. 3‐7

BC Hydro BC Hydro Renewable Generation Market Competitiveness Report 1.0 Introduction
July 2011 Black & Veatch 11
1.0 Introduction
This report examines the market competitiveness and acceptance of BC
renewable energy products in the focused markets of California, Washington, Oregon,
and Alberta. Black & Veatch assessed the potential demand for renewable energy to
meet both Renewable Portfolio Standard (RPS) requirements, as well as carbon markets
in Alberta and the U.S. Furthermore, several market and product sensitivities were
tested for competitiveness of BC Hydro renewable energy products, using Black &
Veatch’s Renewable Energy Market (REM) model.

BC Hydro BC Hydro Renewable Generation Market Competitiveness Report 2.0 Renewable Energy Market Size
July 2011 Black & Veatch 21
2.0 Renewable Energy Market Size
This chapter examines the total RPS demand and low carbon demand for
renewable energy in Washington, Oregon, California, and Alberta. RPS demand is
associated with state mandated renewable energy targets that utilities and electric
suppliers must meet by certain dates. In addition, state‐level greenhouse gas (GHG) or
carbon reduction goals may also prompt additional renewable energy demand, since
renewable energy options are often non‐emitters or considered carbon‐neutral.
2.1 RPS Demand and Supply This section reviews the future RPS demand market size for California,
Washington, and Oregon, taking into account existing and future supply. The market
size potential is presented as a range, based on scenario assumptions of demand growth
in the future.
2.1.1 California In California, there has been progress recently to codify the 33% RPS Goal
through legislation (SBX1‐2).1 The 33% RPS Goal in California translates to an overall
RPS demand of 86,500 – 128,300 GWh by 2020, depending on the demand growth
scenario. The CPUC, in its 33% RPS analysis, estimates a total demand of about 101,700
GWh. Load growth in the future will have a large effect on overall market size.
Additionally, based on recent 2010 status reports by California utilities (both investor‐
owned utilities (IOUs) and municipal utilities), the state has a total of about 40,000 GWh
of renewable energy for 2010 compliance. This brings the state close to its 20% by 2010
RPS target. There are a number of approaches to estimating the size of the remaining
RPS market for BC resources.
As part of SBX1‐2, there are limitations on the use of firmed and shaped
products, as well as REC‐only transactions, from eligible renewable energy resources.
The limitations are as follows:
1SBX1‐2 passed both houses on March 29, 2011 and was signed by the Governor on April 12, 2011 and becomes effective on the 91st day after the close of the special session. http://leginfo.ca.gov/pub/11‐12/bill/sen/sb_0001‐0050/sb_23_bill_20101206_introduced.pdf

BC Hydro BC Hydro Renewable Generation Market Competitiveness Report 2.0 Renewable Energy Market Size
July 2011 Black & Veatch 22
1. Renewable resources directly connected, or dynamically transferred,2 to a
California balancing authority without substitution from another energy
source (minimum of 50% by 2013, 65% by 2016, 75% by 2020);
2. Firmed and shaped energy scheduled into a California balancing authority;
and
3. Any eligible renewable energy not meeting the requirements of the first two
categories including unbundled renewable energy credits (maximum of 25%
by 2013, 15% by 2016, 10% by 2020).
Due to the minimum requirement in SBX1‐2 that specifies renewable energy
projects must be connected, or dynamically transferred, to a California balancing
authority, without substitutions, for a minimum of 75% of the RPS by 2020, this could
limit the market potential for BC Hydro firmed/shaped products to California to only
15%‐25% of the RPS.3
There are already an estimated 10,500 GWh of approved IOU contracts (on‐line
and planned) with out‐of‐state wind and solar projects that are likely to be
firmed/shaped products or REC‐only projects. About 3,300 GWh of the 10,500 GWh are
short‐term contracts with states such as Washington and Oregon and may revert back
to those states when these contracts expire, which could expand the market
opportunity somewhat. It is assumed that 50% of these contracts revert back to the
originating states for their RPS requirements and the remaining contracts are re‐
negotiated. This leaves a market potential for firmed/shaped and REC‐only products of
12,800 to 23,200 GWh, as shown in Table 2‐1. There are about 2,600 GWh of
firmed/shaped renewable energy contracts awaiting approval at the CPUC.
Furthermore, according to SBX1‐2, 8,650 to 12,800 GWh of the remaining market share
can be REC‐only products. This leaves little opportunity for additional firmed/shaped
products from BC, unless there is high load growth in California.
2 The California ISO (CAISO) is working on revising tariffs for dynamic transfer between balancing authorities outside of CAISO and within CAISO to accommodate intermittent renewable resources. http://www.caiso.com/2476/24768d0a2efd0.html 3 In theory, there could still be a limited opportunity for BC renewable resources to qualify for the 75% portion by being: (i) provided without substitution from another energy source; or (ii) dynamically scheduled directly from the renewable generator in BC into California. This would be limited by transmission constraints and the amount of dynamic transfer capability available in the Bonneville Power Administration (BPA) Balancing Authority area. It also presumes that this would be the best use of scarce dynamic transfer capability which is unlikely.

BC Hydro BC Hydro Renewable Generation Market Competitiveness Report 2.0 Renewable Energy Market Size
July 2011 Black & Veatch 23
Figure 2‐1 California RPS Demand and Supply View
If BC Hydro can deliver renewable energy in real time, the incremental market
for delivered bundled energy would be the difference of the overall target and the
combination of existing generation and planned developments in California and other
WECC states and Canadian provinces supplying California. Two sets of information
sources are examined.
One approach is to use data developed by the WECC Studies Work Group (SWG)
that is studying the long‐term transmission needs of the region. The SWG compiled and
categorized renewable generation as existing, planned, and future projects. The SWG
also specified which states each project is earmarked for, so out‐of‐state projects may
be allocated to specific states based on contractual arrangements. In the Figure 2‐1,
only 50% of the planned projects are shown, since not all projects at this phase would
be completed. This results in a range of market sizes of 39,000 to 80,800 GWh,
depending on load growth.
A second approach is to review the contracts that California IOUs have signed.
These are categorized as on‐line, on‐schedule, delayed, and pending approval. Not all

BC Hydro BC Hydro Renewable Generation Market Competitiveness Report 2.0 Renewable Energy Market Size
July 2011 Black & Veatch 24
projects with PPAs with IOUs have resulted in completed projects, so projects that are
not on‐line yet have been risk adjusted by Black & Veatch accordingly:
On‐schedule: 80%
Delayed: 60%
Pending approval: 40%
By applying these probability factors to the IOU contracts, the resulting contracted
projects that are yet to come on‐line total 22,000 GWh. These assumptions result in a
lower market potential range of 31,500 to 73,200 GWh. The market potential is likely
even lower than this estimate since the large municipal utilities also have signed long‐
term contracts for renewable energy that are not necessarily all public. However, since
IOUs have signed a large number of contracts to meet their 33% RPS targets already and
IOUs will now be allowed to own and operate renewable energy projects up to 8.25% of
their load under SBX1‐2, greater marketing opportunities may exist with public utilities
and ESPs.
While these estimates provide a range of additional renewable energy that California
utilities may need, there are a number of additional constraints that may limit
participation of BC resources and the size of the additional market. For example, run‐of‐
river hydro from BC will need to undergo special review by the California Public Utility
Commission (CPUC) per SBX1‐2 to determine whether these projects would qualify as an
eligible renewable resource under the 33% RPS.4 Also, there are additional legislation
and state initiatives to promote a significant amount of in‐state solar and other small
renewable generation that would also displace a portion of the incremental demand.
Table 2‐1 California RPS Market Potential.
CPUC 33%
RPS by 2020 High Growth
Scenario Baseline Scenario
Flat Growth Scenario
Total RPS Demand (33%) 101,700 128,300 109,600 86,500 SBX1-2 (25% Limit on Firming/Shaping) 1 16,600 23,200 18,500 12,800 Incremental Market Potential (WECC Study) 54,200 80,800 62,100 39,000
4 (SBX1‐2) SEC. 7. Section 25741.5 (a) By June 30, 2011, after providing public notice and an opportunity for public comment, including holding at least one public workshop, and following consultation with interested governmental entities, the commission shall study and provide a report to the Legislature that analyzes run‐of‐river hydroelectric generating facilities in British Columbia, including whether these facilities are, or should be, included as renewable electrical generation facilities pursuant to Section 25741 or eligible renewable energy resources.

BC Hydro BC Hydro Renewable Generation Market Competitiveness Report 2.0 Renewable Energy Market Size
July 2011 Black & Veatch 25
Incremental Market Potential (IOU Contracts)2
46,700 73,200 54,500 31,500
Notes:
1Assumes all out‐of‐state contracts signed by IOUs and approved by CPUC to date would be counted as REC‐only or shaped/firmed product. The estimate is the remaining market share of the 25% limit. 2Discounts applied to different projects as described in text.
2.1.2 Washington Washington’s RPS program has not officially started. The first year of
compliance is 2012. In the mean time, the output from wind projects already on‐line in
Washington are either supplying California under short‐term contracts or the RECs are
being banked for future compliance. By 2020, the overall RPS demand in the state will
be about 11,200‐14,100 GWh, depending on load growth scenario. The state has not
developed its own estimate for overall RPS demand.
Figure 2‐2. Washington RPS Demand and Supply View

BC Hydro BC Hydro Renewable Generation Market Competitiveness Report 2.0 Renewable Energy Market Size
July 2011 Black & Veatch 26
The renewable energy development in Washington is a mix of utility‐build projects and
PPAs. There are some uncertainties regarding whether the output from short‐term
contracts with California will be used to meet Washington’s RPS requirement after these
contracts expire. In this estimate, it is assumed that half of these contracts are not
renewed with California utilities and, thus, used to satisfy Washington’s RPS. Using the
same set of WECC Study Group data, the resulting RPS market potential in Washington
is about 6,000‐8,800 GWh. It is important to point out that Washington requires
delivery on a real‐time basis for out‐of‐state renewable resources.
Table 2‐2 Washington RPS Market Potential.
High Growth
Scenario Baseline Scenario
Flat Growth Scenario
Total RPS Demand (15% by 2020) 14,100 12,600 11,200 Market Potential (WECC Study) 1 8,800 7,400 6,000
Notes:
1 Discounts “Future” projects from WECC study to 25%
2.1.3 Oregon The first year of compliance for Oregon’s RPS program is 2011. Prior to 2011,
the output from wind projects already on‐line in Oregon are either supplying California
under short‐term contracts or the RECs are being banked for future compliance. The
overall RPS demand of 25% by 2025 in the state is about 9,700‐14,300 GWh, depending
on the load growth scenario.

BC Hydro BC Hydro Renewable Generation Market Competitiveness Report 2.0 Renewable Energy Market Size
July 2011 Black & Veatch 27
Figure 2‐3. Oregon RPS Demand and Supply View
The existing renewable generation in Oregon easily surpasses the 2011 goal of
5%. After accounting for short‐term contracts with California, projects under
construction, and planned projects, that leaves about 3,500‐8,100 GWh of market
potential. Oregon allows some flexibility in the use of un‐bundled RECs. Projects can be
located anywhere in the WECC. However, unbundled RECs can only meet 20% of a large
IOU's compliance obligation and 50% of a large consumer‐owned utility's obligation.
The market segment that would allow BC Hydro resources to qualify would be between
2,800‐4,200 GWh for unbundled RECs. Bundled RECs, on the other hand, must be from
projects located within the U.S, so there is no opportunity for BC Hydro for this portion.

BC Hydro BC Hydro Renewable Generation Market Competitiveness Report 2.0 Renewable Energy Market Size
July 2011 Black & Veatch 28
Table 2‐3 Oregon RPS Market Potential.
High Growth
Scenario Baseline Scenario Flat Growth
Scenario Total RPS Demand (25% by 2025) 14,300 12,200 9,700 Market Potential (WECC Study) 1 8,100 6,000 3,500 Unbundled RECs Potential (20%-50% allowed) 2 4,200 3,500 2,800
Notes:
1 Discounts “Future” projects from WECC study to 25% 2Assumes IOUs (70% of applicable load) allowed to meet only 20% of RPS with RECs and public utilities (30% of applicable load) allowed to meet 50%.
2.1.4 Alberta Alberta does not have a renewable energy portfolio standard at this time and
no requirements are anticipated in the near future. Current wind projects being
developed in Alberta are selling into wholesale power markets. Some projects are selling
RECs to California.
2.2 Low Carbon Electricity Demand and Supply This section examines the supply and demand potential for low carbon
renewable resources from BC for export to states/provinces with carbon reduction
goals.
2.2.1 California
The largest demand for low carbon generation in the Western Interconnect is
created by California’s Global Warming Solutions Act (AB 32), where the state plans to
reduce state GHG emissions to 1990 levels by 2020. To help meet this goal, California
recently codified the RPS of 33% by 2020. Even with the 33% RPS requirements,
California needs to reduce it carbon emissions further in order to meet the GHG goal for
the year 2020. California intends to institute a cap‐and‐trade market on January 1, 2012
to allow it to meet its GHG goals for 2020. A cap‐and‐trade market will tend to increase
the cost of generation for fossil‐fueled options, since generators will need to value
carbon allowances, which in turn will increase the price of electricity. This increases the
BC Hydro BC Hydro Renewable Generation Market Competitiveness Report 2.0 Renewable Energy Market Size
July 2011 Black & Veatch 29
energy value of renewable energy generation that are non‐emitting or carbon neutral.
If carbon prices reach high enough levels, some renewable energy generation may be
directly competitive with conventional generation. One caveat with the California cap‐
and‐trade program is that any imports into California will be required to be based on the
average GHG emissions from all power supplies in the Northwest with a capacity factor
of less than 60%.
2.2.2 Oregon and Washington While Oregon and Washington also have RPS goals, and are Partners to the
Western Climate Initiative (WCI), they are not currently planning to participate in the
WCI in the near term5. A search of the Integrated Resource Plans for Portland General
Electric and Puget Sound Energy did not provide any indication that Oregon and
Washington have other carbon reduction goals that might be met with purchase of low
carbon supplies.
In Oregon, while there are state GHG reduction goals in law, the Legislature is
still working on implementation. They considered, but did not adopt, several pieces of
climate legislation including a state‐based mandatory carbon cap and trade intended to
fit within the WCI context, a cap only program, and a bill that would have provided for
an assessment, ranking and planning process for obtaining reductions. The State
Legislature also adopted a number of other measures that would help to limit
greenhouse gas emissions in the State. First, an emissions performance standard has
been adopted (SB101), setting a limit on new investments in base load generation
sources and prohibiting emissions from those sources that exceed 1,100 lbs CO2/MWh.
Second, a low‐carbon fuel standard has been adopted (HB2186). The standard would
require the carbon content of motor vehicle fuels to be reduced by 10% by 2020.
In Washington, the state has developed GHG reduction goals and is working on
how they might meet those goals.6 While there may be some ability for BC renewables
to contribute toward meeting those Washington goals in the future, it does not appear
that any program currently exists for that to happen.
5 California, for example, is intending to start its cap and trade program January 1, 2012 and would link with other WCI jurisdictions that have similar programs. Most other partners have indicated they will not have cap and trade legislation ready in time for January 1, 2012. 6 http://www.ecy.wa.gov/climatechange/laws.htm
BC Hydro BC Hydro Renewable Generation Market Competitiveness Report 2.0 Renewable Energy Market Size
July 2011 Black & Veatch 210
2.2.3 Alberta Alberta’s climate change initiatives are more focused on encouraging
technological improvements that would allow continued burning of coal while reducing
carbon emissions, since Alberta has considerable coal fired generation. As such, Alberta
has set a carbon emission “intensity” reduction goal. In other words, the CO2 emissions
per MWh from Alberta power plants must be reduced over time. Alberta does allow
“offsets” to be used to reduce the carbon emission intensity. For example, a utility can
build a wind plant in Alberta and count resulting carbon emissions reductions as offsets
to other power plant emissions. Renewable projects located in BC, however, cannot be
counted as offsets since the Alberta rules require that the renewables be located in
Alberta in order to be used as carbon emissions offsets. As a result, BC renewable
energy has no obvious competitive advantage with renewable energy produced in
Alberta.
2.3 Firmed and Shaped Product California appears to be the primary market for BC firmed and shaped renewable
products. Other states in the Western Interconnect appear to be well prepared to
meet their state goals with in‐state resources or from adjacent states. California
recently passed legislation (SBX1‐2) governing what can be used to meet renewable
goals. Firmed/Shaped and REC‐only products are allowed to make up to 25% of RPS
requirements.
The preferred shape for firmed and shaped renewable products for California would
be summer peaking. The California demand for electricity is considerably higher in
the summer months (e.g. May‐Sept) than in the other months. In addition,
California’s electricity needs in the summer months are considerably higher in the
hours from noon‐6 PM Monday through Friday.

BC Hydro BC Hydro Renewable Generation Market Competitiveness Report
3.0 BC Hydro Renewable Generation Competitiveness
July 2011 Black & Veatch 31
3.0 BC Hydro Renewable Generation Competitiveness
3.1 Competitiveness Sensitivities Using the REM model, Black & Veatch tested the competitiveness of BC Hydro
renewable energy products under a number of market sensitivities, using Market
Scenario 3 as the test base case.7 The assumptions for Market Scenario 3 are outlined in
Table 3‐1.
Table 3‐1 Market Scenario for Sensitivity Tests.
Market Scenario 3
Global Economic Growth Medium
Government Policy Maker Reg/Nat
Gas Prices EMP
Load Growth EMP
RE Incentives in US (ITC through 2016) PTC after
RE Cost Decline (Wind and Solar) Fast
Results 3
GHG Price Level Mid
Energy Price Level Mid
REC Price Level Mid
Using Market Scenario 3, Black & Veatch tested the following sensitivities:
1. No PTC/No ACP: For this sensitivity, the PTC is not extended beyond 2016
and Alternate Compliance Payment (ACP)8 caps are lifted for all RPS states.
By removing the ACP limitation, REC prices are allowed to exceed the cap.
2. BC Hydro Shaped Product: For this sensitivity, a 1500 MW shaped product is
added to displace several BC wind units in the REM model. The shaped
product has a 60% capacity factor, increasing the transmission utilization
from 50% to 60%. The cost of the shaped product reflects the combined
average cost of the displaced BC wind units, as well as any firming/shaping
costs.
7 Market Scenario 3 is one of five market scenarios tested in Black & Veatch’s May 2011 report, titled “REC Market Report for BC Hydro.” Scenario 3 produced moderate REC price results. 8 Alternative Compliance Payments are payments utilities can make in lieu of acquiring renewable energy to meet their RPS targets. The ACP effectively acts as a cap on REC value.
BC Hydro BC Hydro Renewable Generation Market Competitiveness Report
3.0 BC Hydro Renewable Generation Competitiveness
July 2011 Black & Veatch 32
3. No PTC/No ACP Plus BC Hydro Shaped Product: This sensitivity combines
Sensitivities 1 and 2.
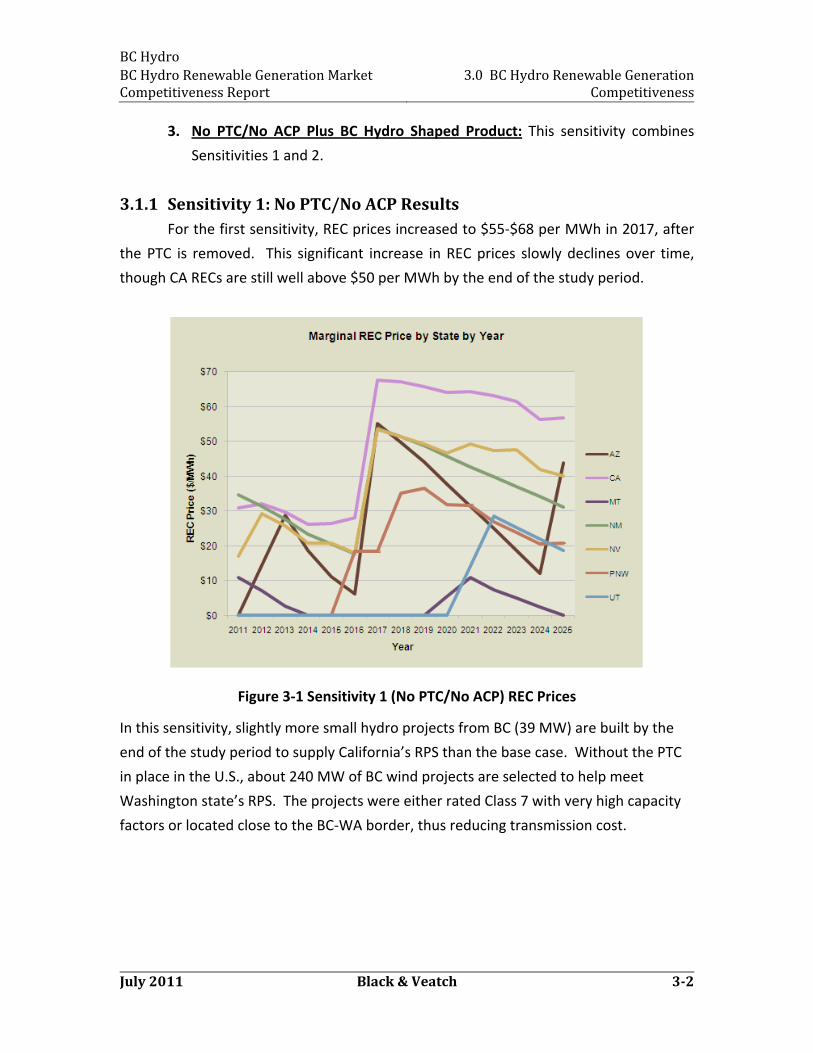
3.1.1 Sensitivity 1: No PTC/No ACP Results For the first sensitivity, REC prices increased to $55‐$68 per MWh in 2017, after
the PTC is removed. This significant increase in REC prices slowly declines over time,
though CA RECs are still well above $50 per MWh by the end of the study period.
Figure 3‐1 Sensitivity 1 (No PTC/No ACP) REC Prices
In this sensitivity, slightly more small hydro projects from BC (39 MW) are built by the
end of the study period to supply California’s RPS than the base case. Without the PTC
in place in the U.S., about 240 MW of BC wind projects are selected to help meet
Washington state’s RPS. The projects were either rated Class 7 with very high capacity
factors or located close to the BC‐WA border, thus reducing transmission cost.

BC Hydro BC Hydro Renewable Generation Market Competitiveness Report
3.0 BC Hydro Renewable Generation Competitiveness
July 2011 Black & Veatch 33
Figure 3‐2 Sensitivity 1 (No PTC/No ACP) RPS Capacity Build
3.1.2 Sensitivity 2: BC Hydro Shaped Product A 1500 MW firmed/shaped block product with a 60% capacity factor was
introduced in this scenario. This is equivalent to about 7,880 GWh of annual energy
deliveries. As a point of reference, the estimated incremental market demand for
firmed/shaped products in California, as discussed in section 2.1 is estimated to be
12,800 to 23,200 GWh by 2025. Overall, the REC prices in this sensitivity did not change
from the base scenario with the addition of the firmed/shaped block product. The block
product did not get selected, since it was more expensive than other U.S. options,
especially with the PTC in place. Only 11 MW of BC small hydro was exported to
California in later years.
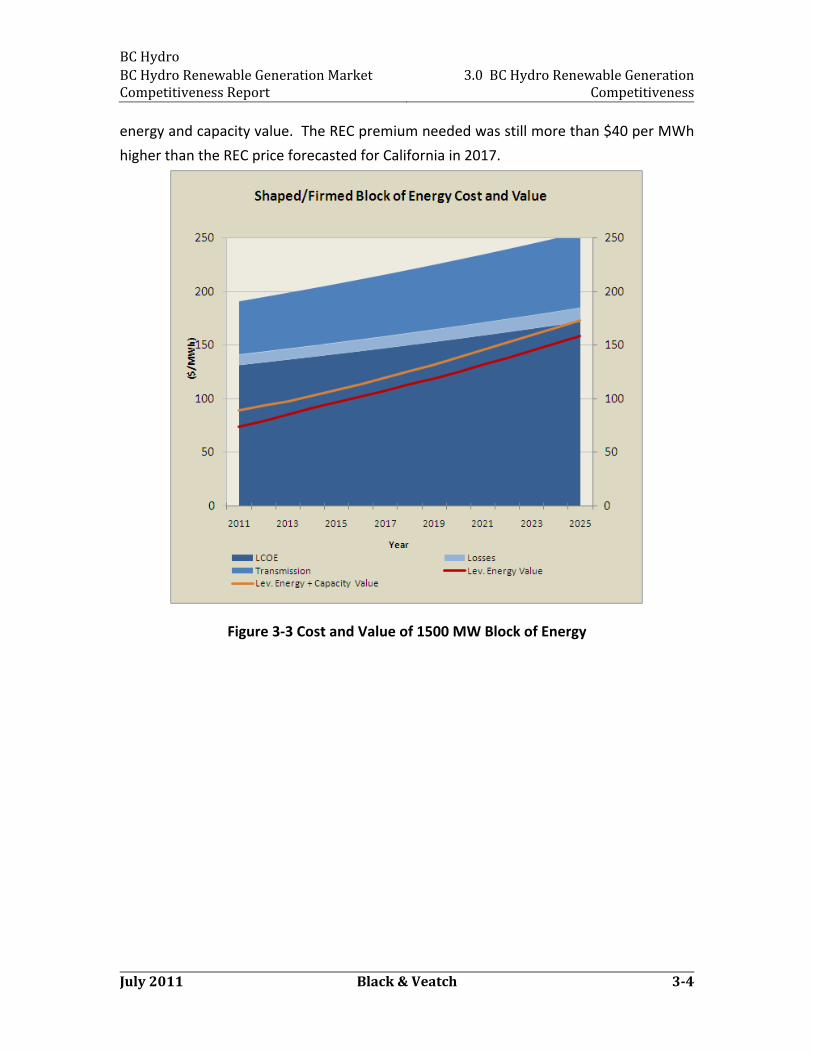
The higher utilization of the transmission line (60%) helped to decrease
transmission costs by around $10 per MWh. However, that was not enough to offset
the high levelized cost of the block. The levelized cost of energy of the combined wind
resources plus firming/shaping costs was $124.00 per MWh in 2017, which was too high
to be competitive with wind projects closer to California. Accounting for a transmission
cost of $58 per MWh and losses of $14 per MWh, the REC premium required for the BC
block product was almost $73 per MWh, after subtracting out the underlying delivered
BC Hydro BC Hydro Renewable Generation Market Competitiveness Report
3.0 BC Hydro Renewable Generation Competitiveness
July 2011 Black & Veatch 34
energy and capacity value. The REC premium needed was still more than $40 per MWh
higher than the REC price forecasted for California in 2017.
Figure 3‐3 Cost and Value of 1500 MW Block of Energy

BC Hydro BC Hydro Renewable Generation Market Competitiveness Report
3.0 BC Hydro Renewable Generation Competitiveness
July 2011 Black & Veatch 35
Figure 3‐4 Sensitivity 2 (1500 MW Block Product) REC Prices
Figure 3‐5 Sensitivity 2 (1500 MW Block Product) RPS Capacity Build
BC Hydro BC Hydro Renewable Generation Market Competitiveness Report
3.0 BC Hydro Renewable Generation Competitiveness
July 2011 Black & Veatch 36
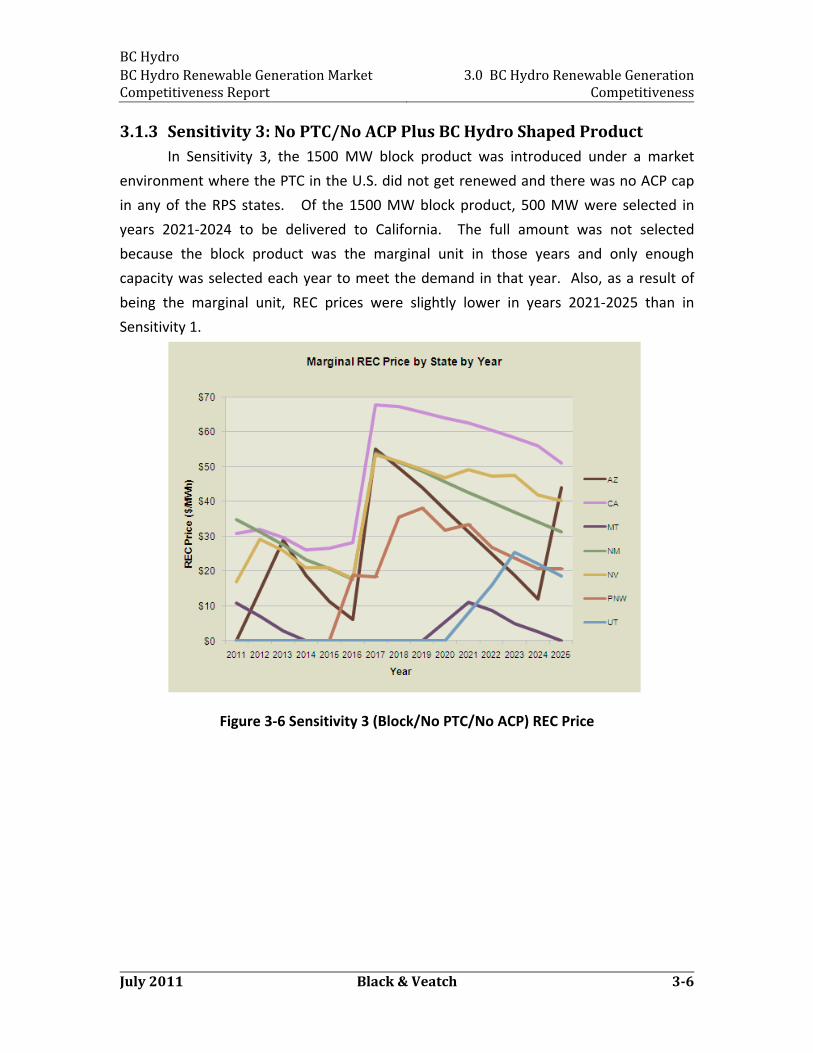
3.1.3 Sensitivity 3: No PTC/No ACP Plus BC Hydro Shaped Product In Sensitivity 3, the 1500 MW block product was introduced under a market
environment where the PTC in the U.S. did not get renewed and there was no ACP cap
in any of the RPS states. Of the 1500 MW block product, 500 MW were selected in
years 2021‐2024 to be delivered to California. The full amount was not selected
because the block product was the marginal unit in those years and only enough
capacity was selected each year to meet the demand in that year. Also, as a result of
being the marginal unit, REC prices were slightly lower in years 2021‐2025 than in
Sensitivity 1.
Figure 3‐6 Sensitivity 3 (Block/No PTC/No ACP) REC Price
BC Hydro BC Hydro Renewable Generation Market Competitiveness Report
3.0 BC Hydro Renewable Generation Competitiveness
July 2011 Black & Veatch 37
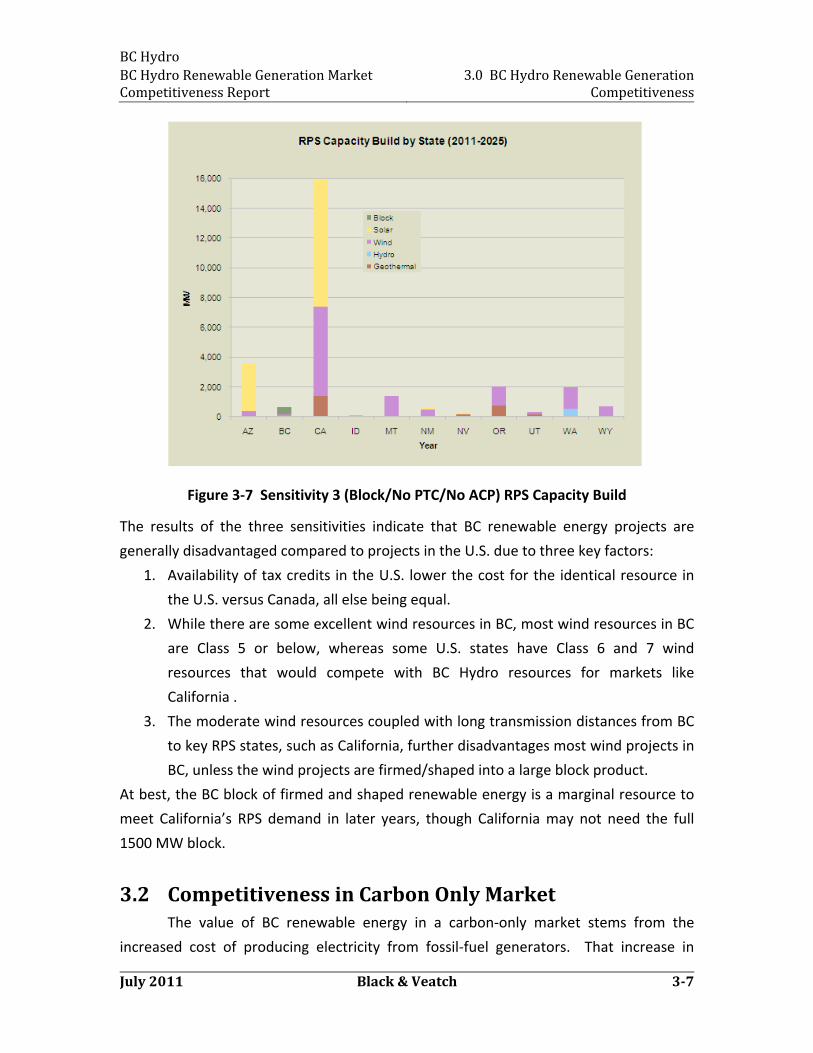
Figure 3‐7 Sensitivity 3 (Block/No PTC/No ACP) RPS Capacity Build
The results of the three sensitivities indicate that BC renewable energy projects are
generally disadvantaged compared to projects in the U.S. due to three key factors:
1. Availability of tax credits in the U.S. lower the cost for the identical resource in
the U.S. versus Canada, all else being equal.
2. While there are some excellent wind resources in BC, most wind resources in BC
are Class 5 or below, whereas some U.S. states have Class 6 and 7 wind
resources that would compete with BC Hydro resources for markets like
California .
3. The moderate wind resources coupled with long transmission distances from BC
to key RPS states, such as California, further disadvantages most wind projects in
BC, unless the wind projects are firmed/shaped into a large block product.
At best, the BC block of firmed and shaped renewable energy is a marginal resource to
meet California’s RPS demand in later years, though California may not need the full
1500 MW block.
3.2 Competitiveness in Carbon Only Market The value of BC renewable energy in a carbon‐only market stems from the
increased cost of producing electricity from fossil‐fuel generators. That increase in
BC Hydro BC Hydro Renewable Generation Market Competitiveness Report
3.0 BC Hydro Renewable Generation Competitiveness
July 2011 Black & Veatch 38
electricity price can help make BC renewable energy projects, which are non‐emitting,
more attractive and competitive with conventional options. If the BC renewable energy
was firmed and shaped by BC Hydro, it would have additional value in ordinary power
markets.
3.3 US Policy toward Canadian Renewables At the present, there are some concerns in the US about purchasing renewables
from Canada, though most would be eligible as long as those renewable purchases
comply with existing state RPS rules. For example, California’s new RPS law requires
the CPUC to review and determine the eligibility of run‐of‐river hydro from BC for RPS
compliance purposes. In Oregon, bundled RECs must come from within the U.S. and not
Canada, though some REC‐only transactions may be allowed from Canada. In general,
most states are more concerned about being able to economically meet their RPS
requirements and carbon goals. If BC Hydro can provide renewables that are cost
competitive and consistent with state RPS rules, it would be generally considered
helpful. Any concerns that Canada may be providing too much of the renewable
resource has already been addressed in the state RPS rules that govern how much
renewables can be brought in from out of state and the delivery requirements.
BC Hydro BC Hydro Renewable Generation Market Competitiveness Report 4.0 Summary of Findings
July 2011 Black & Veatch 49
4.0 Summary of Findings
Demand for BC resources would increase if (i) overall demand for renewables in the
western interconnection increases or, (ii) the relative competitiveness of BC resources
improves. The overall demand may increase if there are changes in one or more market
conditions. Similarly, there are a number of factors that could change the relative
competitiveness of BC resources.
Market Conditions
Ccertain scenarios show that REC prices may increase higher than currently
established ACP levels if either (i) the PTC goes away, (ii) energy prices are
relatively low, or (iii) there is a strong RPS demand due to high load growth. In
some states, utilities have the option to pay the ACP in lieu of procuring
renewable energy or do not have to procure renewable energy if the rate impact
limit is exceeded. In order for renewable energy projects to be built under these
particular market conditions, there must be strong political will by states to
achieve RPS targets at any cost by setting aside ACP caps or rate impact limits.
If BC Hydro could demonstrate direct connection to California balancing
authorities or be able to dynamically transfer more energy, the province would
qualify for a larger market segment, instead of just the firmed/shaped product
portion. This could be achieved through building additional transmission
capacity or increasing the utilization of existing transmission to the U.S.
Limitations on the amount of shaped/firmed products that can be sold into
markets like California need to be lifted, though this alone does not determine
whether BC projects can be competitive with projects from Washington and
Oregon state that are also supplying shaped/firmed products to California.
Relative Cost of BC Resources
The scenario in which U.S. projects receive no special tax incentives provides a
level playing field for BC renewable resources compared to US renewable
resources. The ACP caps or rate impact limits currently in many of the RPS states
would also need to be lifted or increased.
Some higher class resources in Montana and Wyoming appear to be more
attractive than wind from BC. Thus, in order for BC resources to compete, there

BC Hydro BC Hydro Renewable Generation Market Competitiveness Report 4.0 Summary of Findings
July 2011 Black & Veatch 410
need to be change in the assumptions about the costs of developing remote
resources in Montana and Wyoming. For example, a lack of development of
transmission capacity to deliver remote resources to load could make access to
the very best resources in MT and WY more difficult or costly than expected9.
If the cost for solar PV projects after 10 years does not drop as significantly as
assumed in the REM model and solar PV projects are not developed to the level
modeled, especially in California, this would potentially be of benefit to the
competitiveness of BC resources.
BC Hydro can try to sell REC‐only products, though this market segment is expected to
be highly competitive and much lower value, since there is no delivery requirement and
is limited to 10% of the total RPS for CA.
As for using BC renewables to address the carbon market in the U.S., there is
considerable uncertainty as to how that will play out in the future since carbon markets
in the west (including California) are either not well defined (outside of California) or
details are still being developed (in California). Alberta will not be an export market for
carbon offsets, given restrictions on imported offsets.
9 Wind projects in MO & WY that were selected by the model in this study were of the highest wind
class categories, which may not be a realistic representation of how projects are developed. As large
wind projects or groups of wind projects are not comprised of a single class of wind resource, the
average capacity factor of aggregated wind projects from these states may not reach the levels of the
highest wind classes, allowing BC resources to potentially compete.