Embed Size (px)
Citation preview
1
Spring 2015Instructor: Kai Sun
ECE 422 Power System Operations & Planning
3 –Load Modeling
2
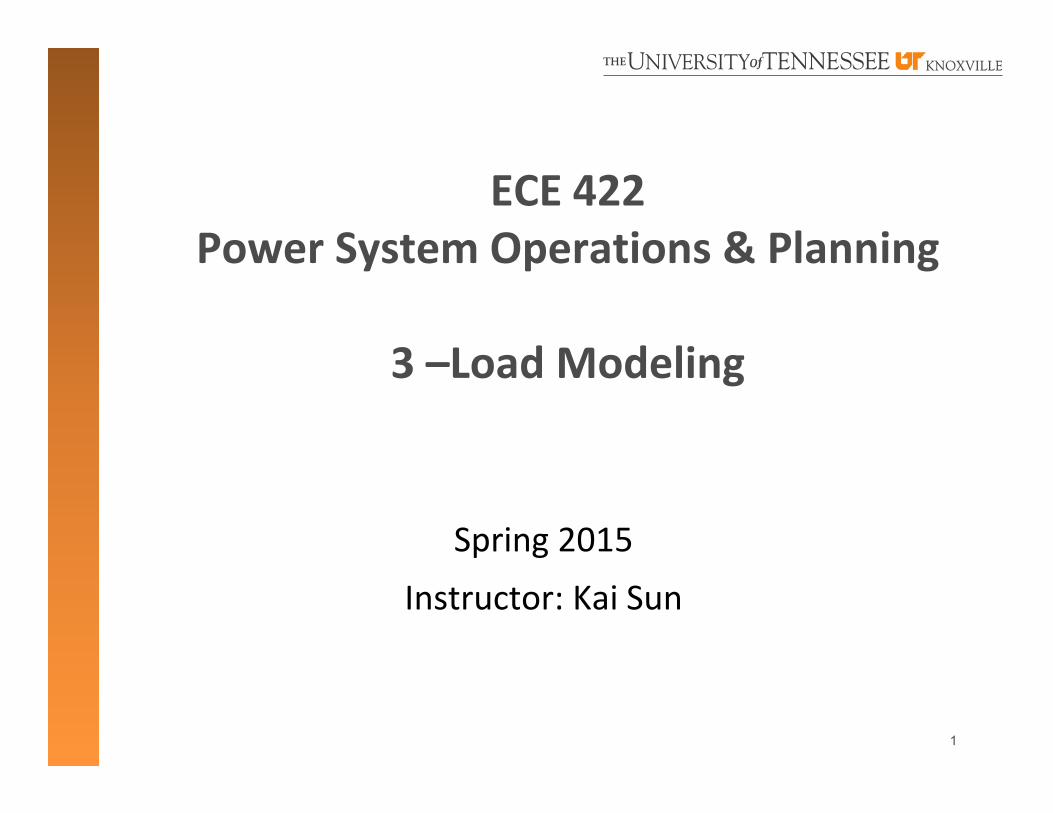
References
1. Chapter 7 of Kundur’s book 2. Load Performance for Dynamic Performance Analysis, IEEE Committee Report, IEEE Trans. on
Power Systems, Vol. 8, No. 2, pp. 472‐482, May 1993.3. Bibliography on Load Models for Power Flow and Dynamic Performance Simulation, Vol. 10, No.
1, pp. 523‐538, Feb. 1995.4. Standard Load Models for Power Flow and Dynamic Performance Simulation, IEEE Trans. on
Power Systems, Vol. 10, No. 2, pp. 1302‐1313, Aug. 19955. EPRI Report: Load Modeling for Power Flow and Transient Stability Computer Studies, Vol. 2:
Load‐Modeling Reference Manual, Product ID: EL‐5003‐CCMV2, 1987 http://www.epri.com/abstracts/Pages/ProductAbstract.aspx?ProductId=EL‐5003‐CCMV2
6. EPRI Report: Measurement‐Based Load Modeling, Product ID:1014402, 2006 http://www.epri.com/abstracts/Pages/ProductAbstract.aspx?ProductId=000000000001014402
3
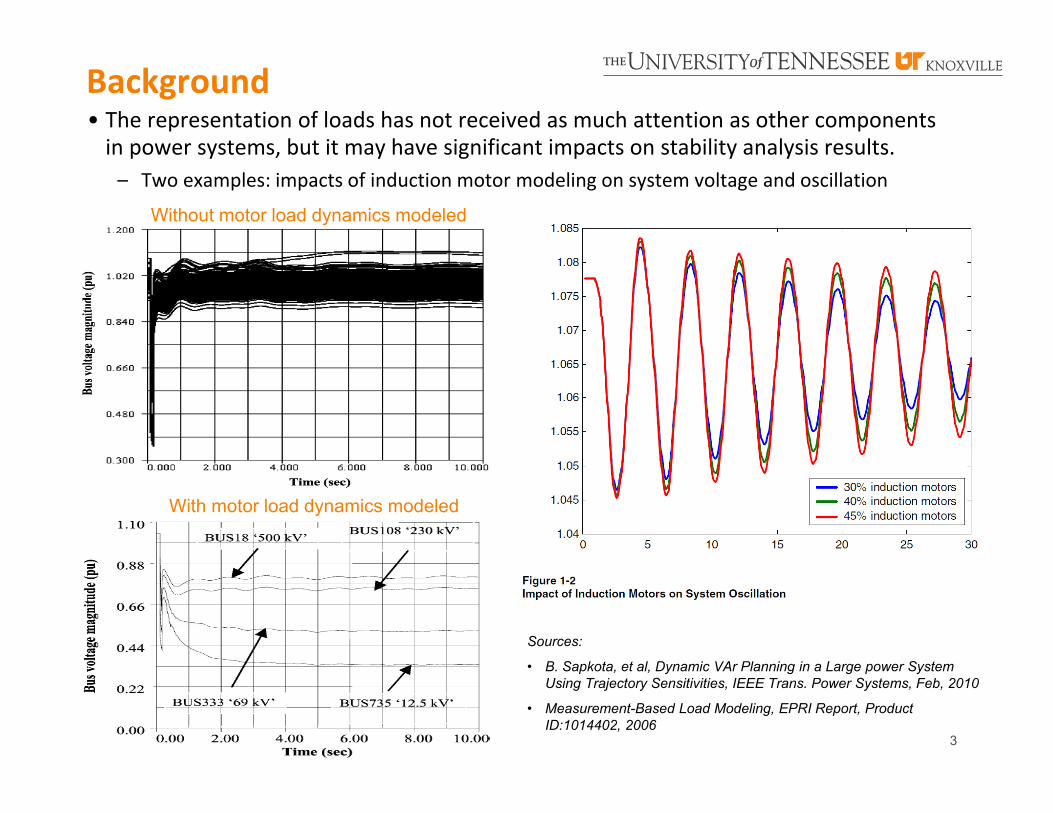
Background• The representation of loads has not received as much attention as other components in power systems, but it may have significant impacts on stability analysis results.– Two examples: impacts of induction motor modeling on system voltage and oscillation
Sources:
• B. Sapkota, et al, Dynamic VAr Planning in a Large power System Using Trajectory Sensitivities, IEEE Trans. Power Systems, Feb, 2010
• Measurement-Based Load Modeling, EPRI Report, Product ID:1014402, 2006
Without motor load dynamics modeled
With motor load dynamics modeled
4
Background (cont’d)
•Accurate load modeling is difficult because:– at high‐voltage levels, loads must be aggregated for stability studies,– a power system has a large number of diverse load components,– ownerships and locations of load devices are not directly accessible to the electricity utility (e.g. transmission and distribution are owned by different companies)
– there is no precise information on load composition, which changes with time of day and week, seasons and weather, and
– load characteristics are uncertain, particularly for large voltage or frequency variations
5
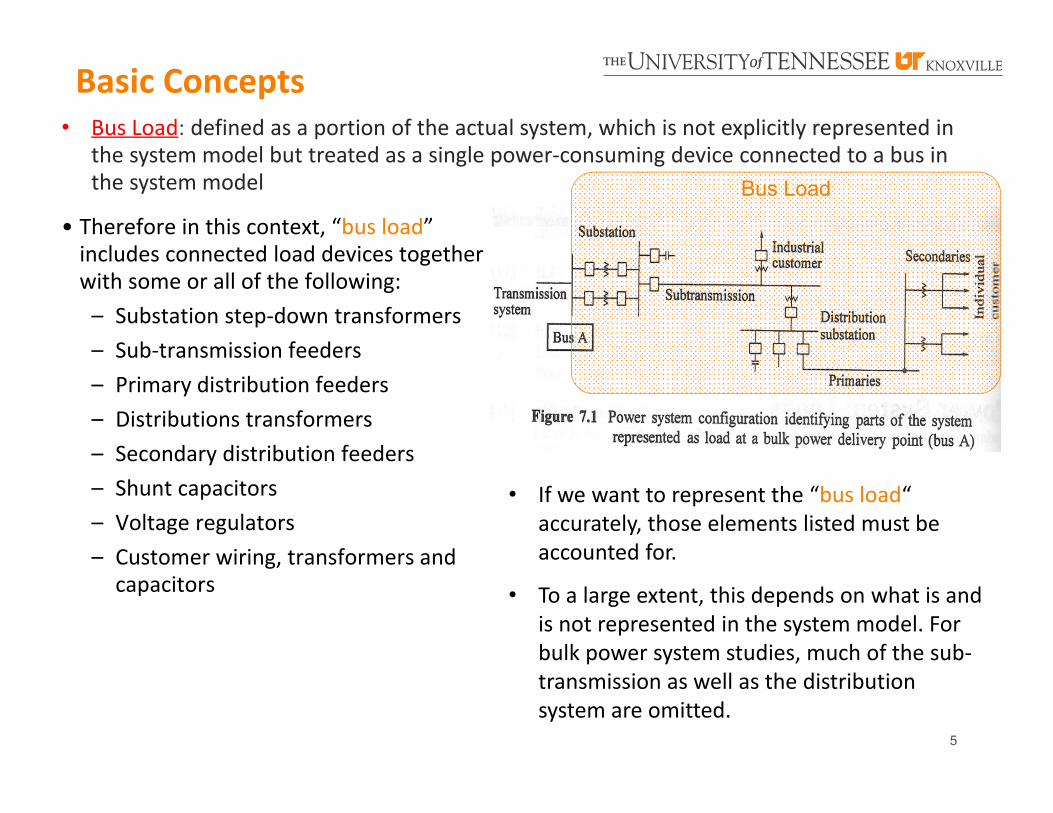
• Therefore in this context, “bus load” includes connected load devices together with some or all of the following:– Substation step‐down transformers– Sub‐transmission feeders– Primary distribution feeders– Distributions transformers– Secondary distribution feeders– Shunt capacitors– Voltage regulators– Customer wiring, transformers and capacitors
• If we want to represent the “bus load“ accurately, those elements listed must be accounted for.
• To a large extent, this depends on what is and is not represented in the system model. For bulk power system studies, much of the sub‐transmission as well as the distribution system are omitted.
Basic Concepts• Bus Load: defined as a portion of the actual system, which is not explicitly represented in
the system model but treated as a single power‐consuming device connected to a bus in the system model Bus Load
6
Basic Concepts (cont’d)
7
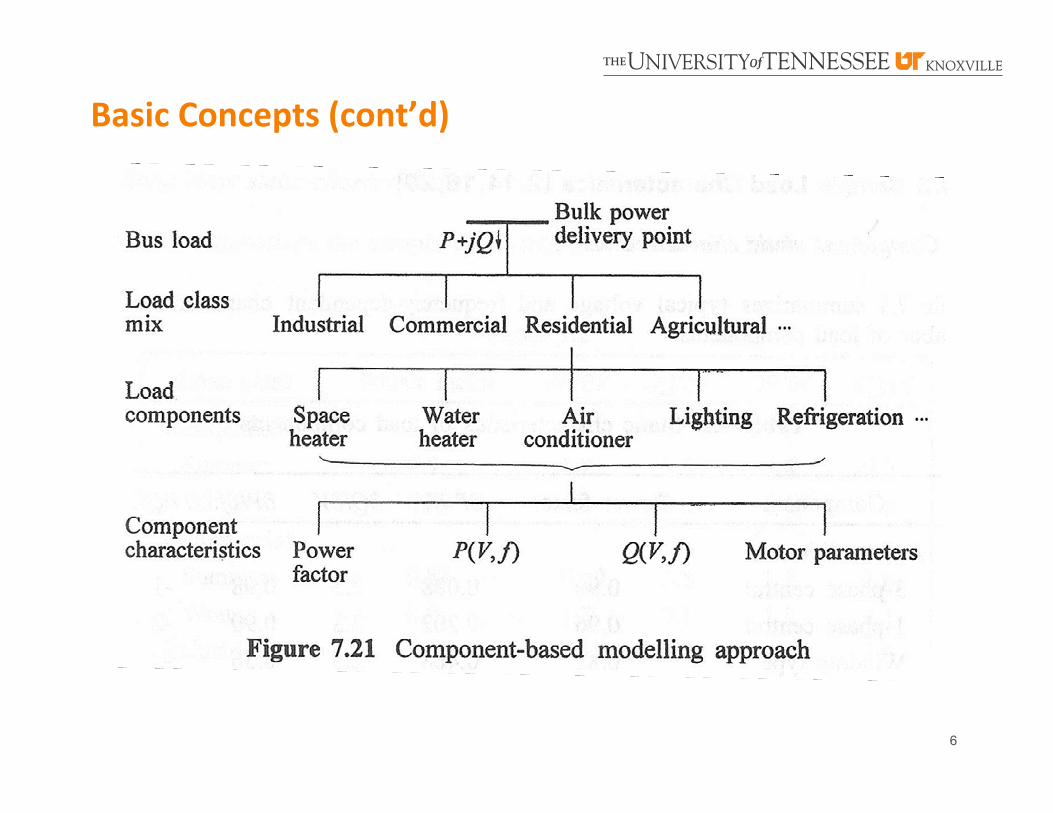
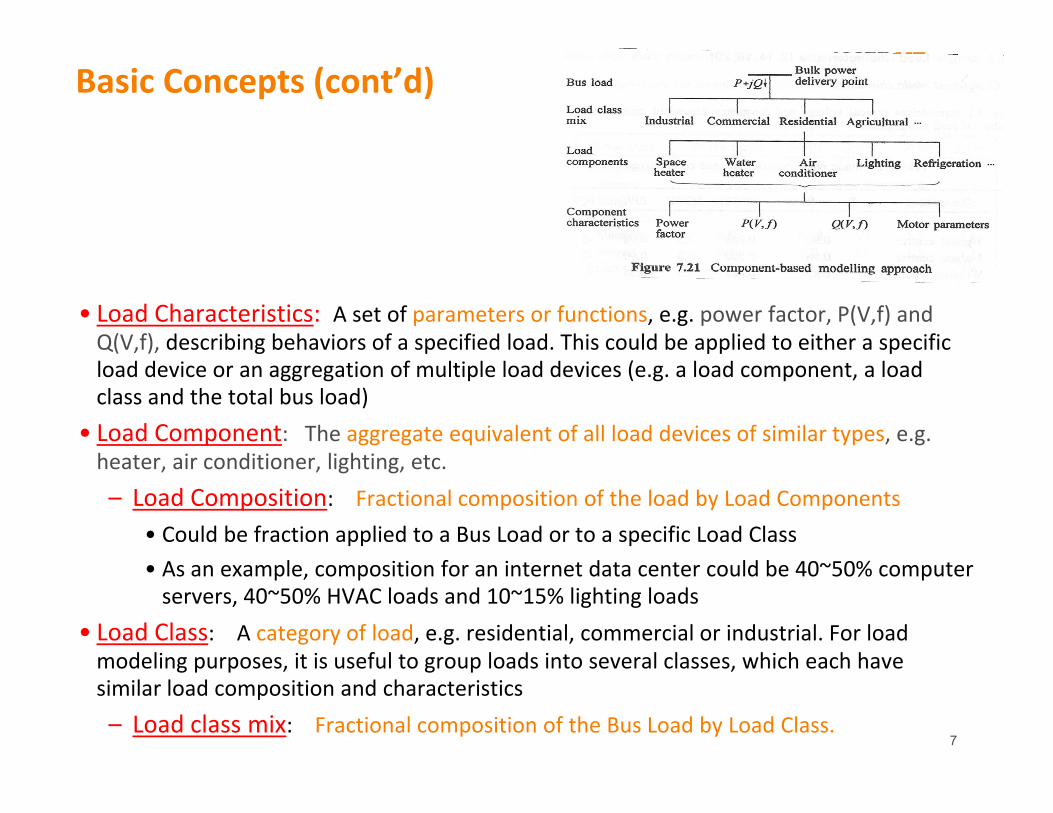
• Load Characteristics: A set of parameters or functions, e.g. power factor, P(V,f) and Q(V,f), describing behaviors of a specified load. This could be applied to either a specific load device or an aggregation of multiple load devices (e.g. a load component, a load class and the total bus load)
• Load Component: The aggregate equivalent of all load devices of similar types, e.g. heater, air conditioner, lighting, etc. – Load Composition: Fractional composition of the load by Load Components
• Could be fraction applied to a Bus Load or to a specific Load Class• As an example, composition for an internet data center could be 40~50% computer servers, 40~50% HVAC loads and 10~15% lighting loads
• Load Class: A category of load, e.g. residential, commercial or industrial. For load modeling purposes, it is useful to group loads into several classes, which each have similar load composition and characteristics– Load class mix: Fractional composition of the Bus Load by Load Class.
Basic Concepts (cont’d)
8
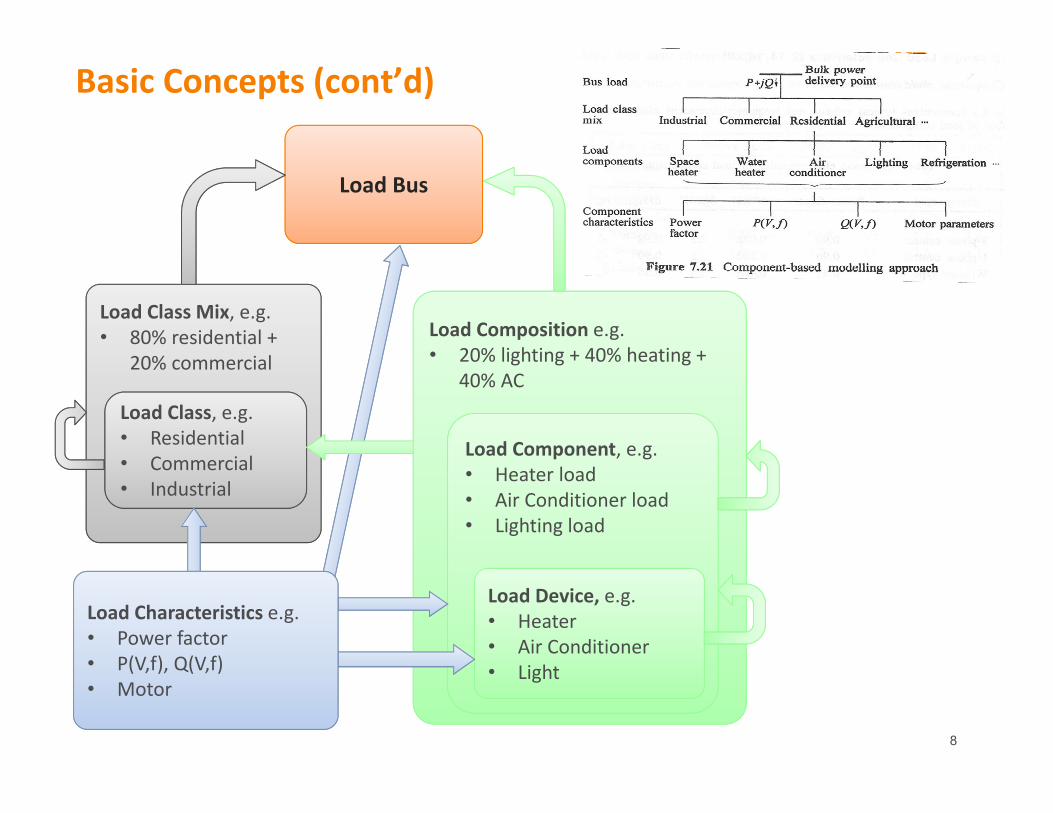
Load Composition e.g.• 20% lighting + 40% heating +
40% AC
Load Component, e.g.• Heater load• Air Conditioner load• Lighting load
Load Class Mix, e.g.• 80% residential +
20% commercial
Load Bus
Load Device, e.g.• Heater• Air Conditioner• Light
Load Class, e.g.• Residential• Commercial• Industrial
Load Characteristics e.g.• Power factor• P(V,f), Q(V,f)• Motor
Basic Concepts (cont’d)
9
Load Model
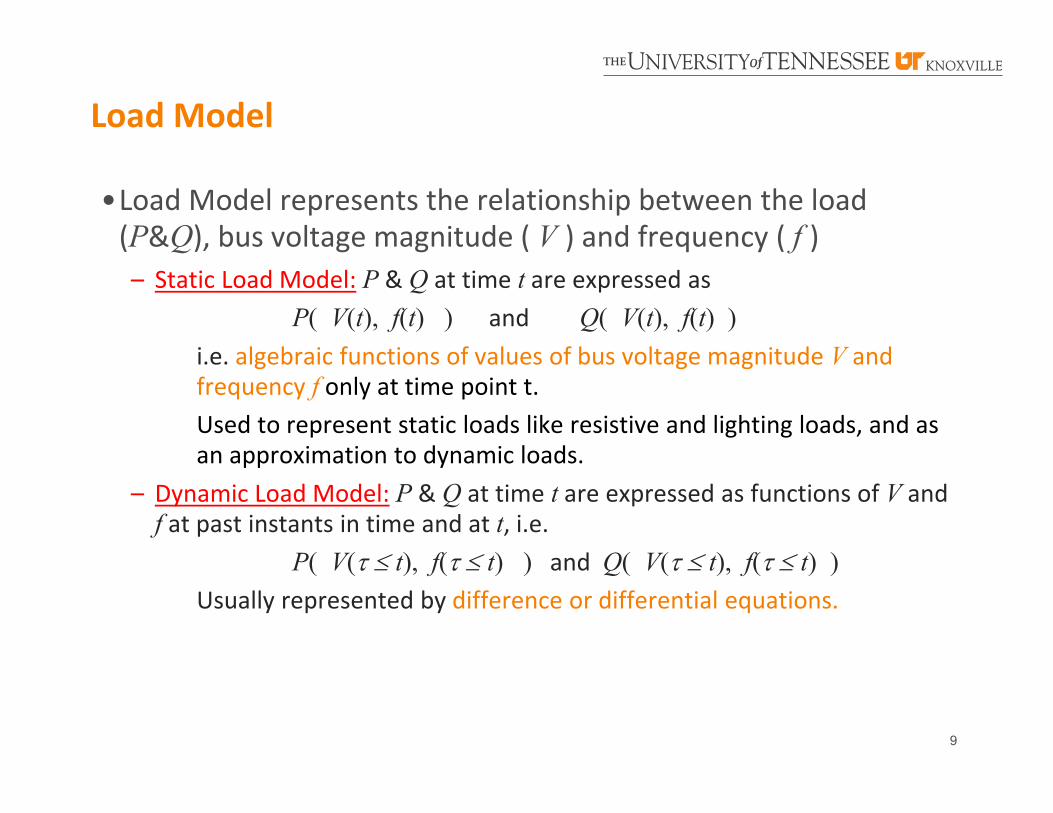
•Load Model represents the relationship between the load (P&Q), bus voltage magnitude ( V ) and frequency ( f )– Static Load Model: P & Q at time t are expressed as
P( V(t), f(t) ) and Q( V(t), f(t) )i.e. algebraic functions of values of bus voltage magnitude V and frequency f only at time point t.Used to represent static loads like resistive and lighting loads, and as an approximation to dynamic loads.
– Dynamic Load Model: P & Q at time t are expressed as functions of V and f at past instants in time and at t, i.e.
P( V( t), f( t) ) and Q( V( t), f( t) )Usually represented by difference or differential equations.
10
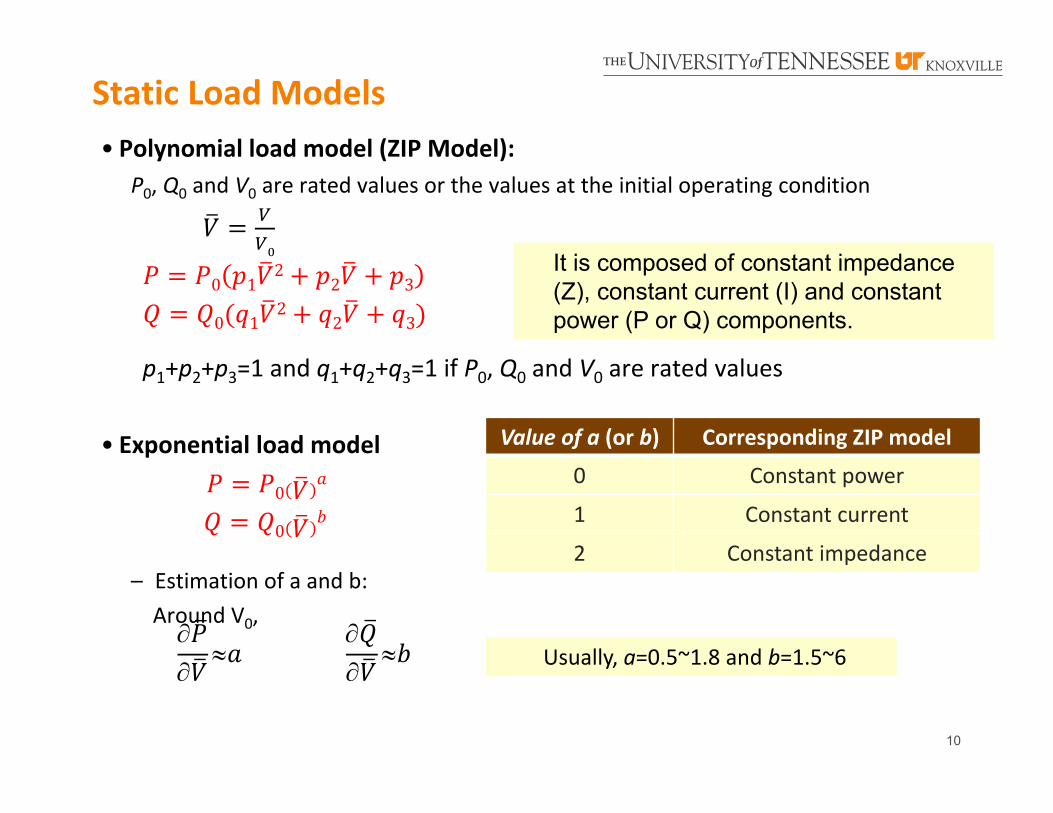
Static Load Models• Polynomial load model (ZIP Model):
P0, Q0 and V0 are rated values or the values at the initial operating condition
0 12
2 3
0 12
2 3
p1+p2+p3=1 and q1+q2+q3=1 if P0, Q0 and V0 are rated values
• Exponential load model 0
0
– Estimation of a and b:Around V0,
It is composed of constant impedance (Z), constant current (I) and constant power (P or Q) components.
Usually, a=0.5~1.8 and b=1.5~6
Value of a (or b) Corresponding ZIP model
0 Constant power
1 Constant current
2 Constant impedance
11
Frequency Dependency
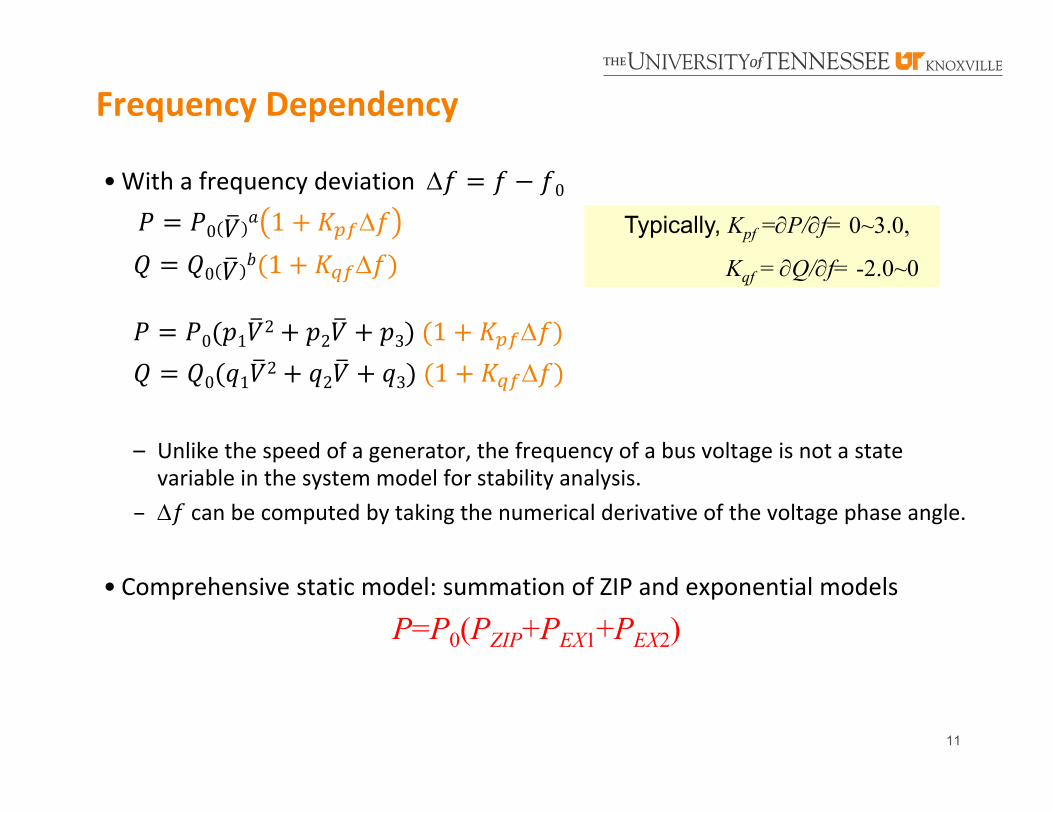
•With a frequency deviation 0
0 1
0 1
0 12
2 3 1
0 12
2 3 1
– Unlike the speed of a generator, the frequency of a bus voltage is not a state variable in the system model for stability analysis.
– can be computed by taking the numerical derivative of the voltage phase angle.
• Comprehensive static model: summation of ZIP and exponential models
P=P0(PZIP+PEX1+PEX2)
Typically, Kpf =P/f= 0~3.0,
Kqf = Q/f= -2.0~0
12
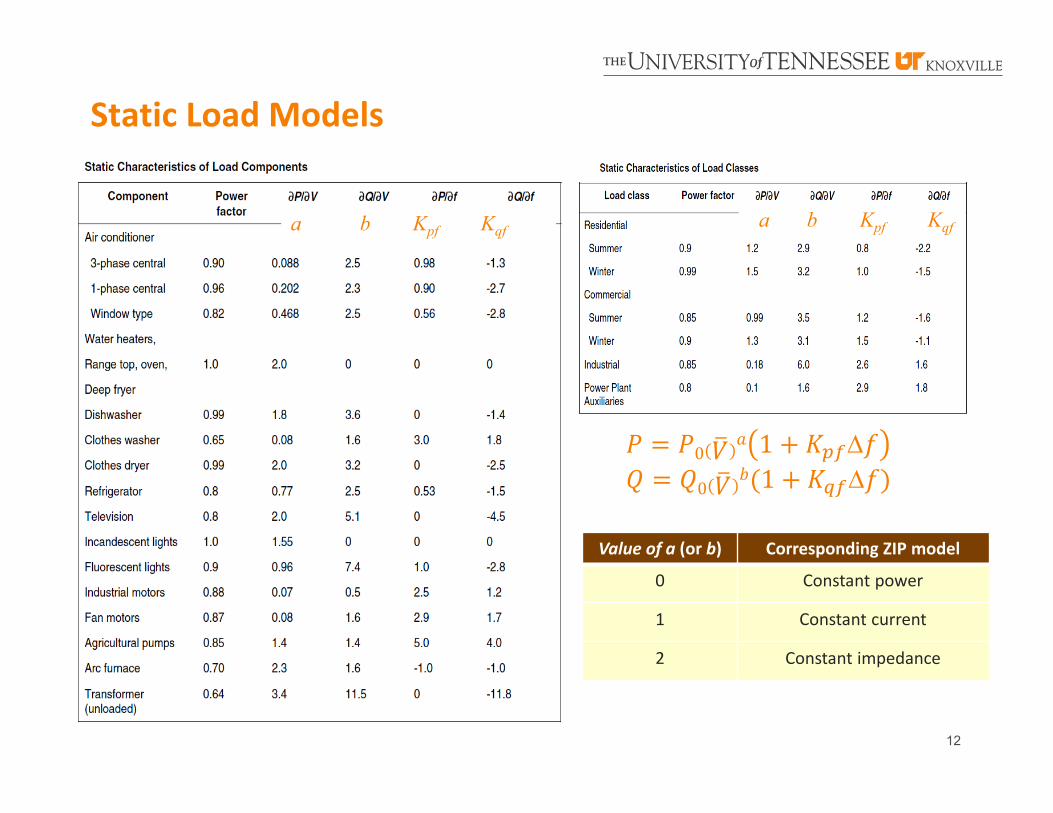
Static Load Models
a b Kpf Kqf
0 1
0 1
a b Kpf Kqf
Value of a (or b) Corresponding ZIP model
0 Constant power
1 Constant current
2 Constant impedance
1313
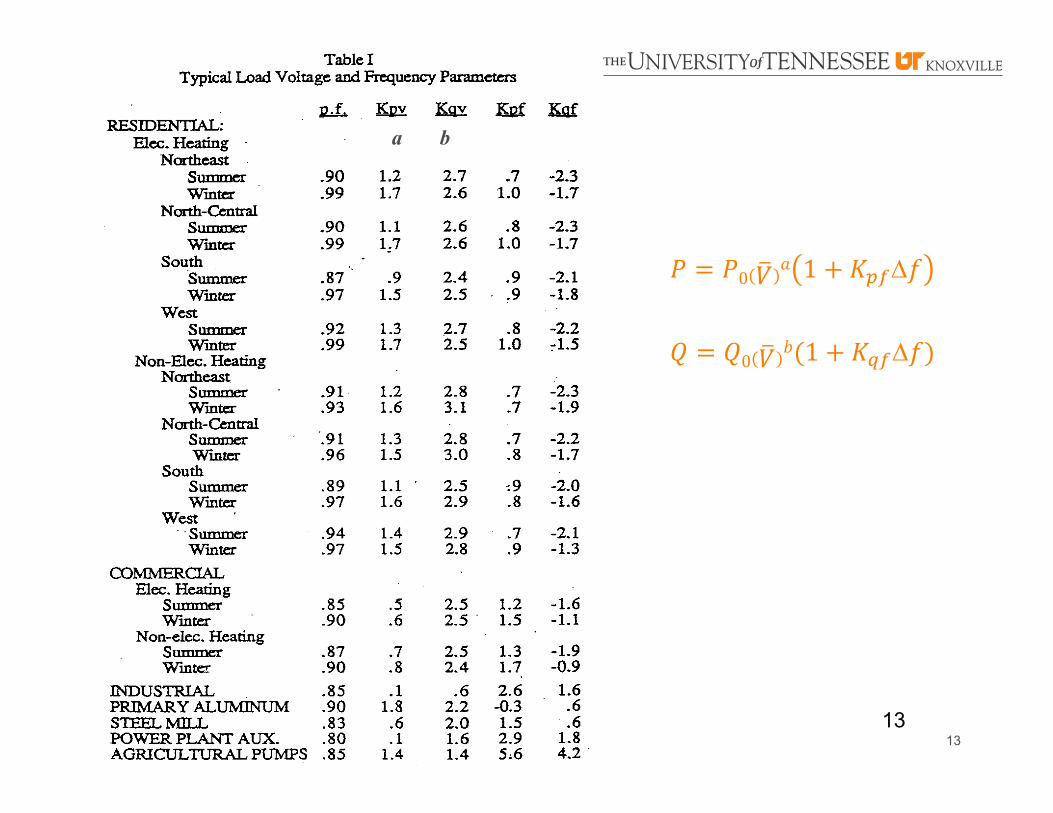
a b
0 1
0 1
14
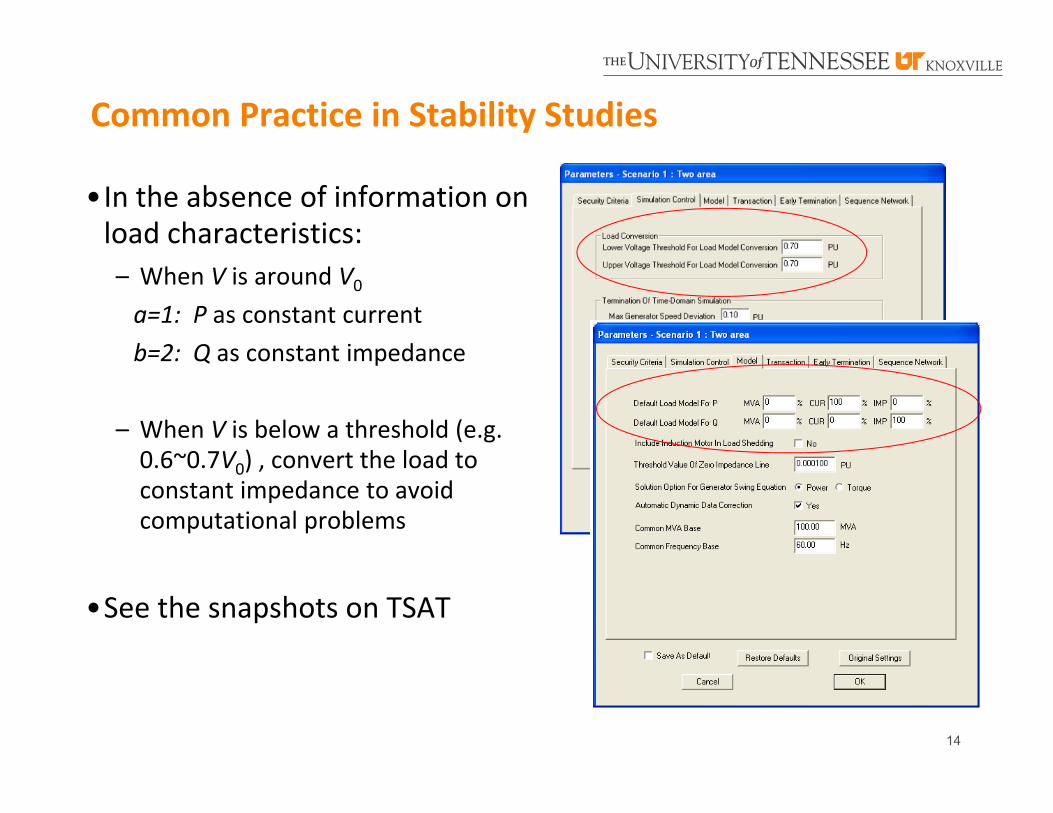
Common Practice in Stability Studies
•In the absence of information on load characteristics:– When V is around V0
a=1: P as constant currentb=2: Q as constant impedance
– When V is below a threshold (e.g. 0.6~0.7V0) , convert the load to constant impedance to avoid computational problems
•See the snapshots on TSAT
15
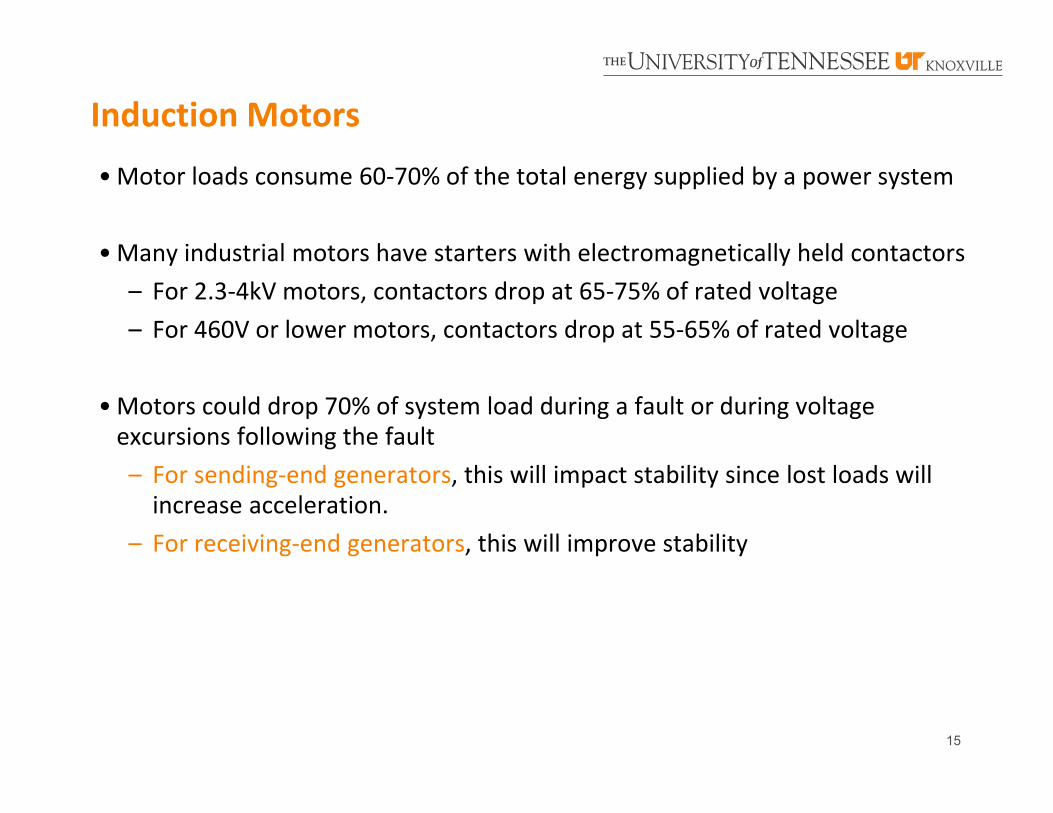
Induction Motors•Motor loads consume 60‐70% of the total energy supplied by a power system
•Many industrial motors have starters with electromagnetically held contactors– For 2.3‐4kV motors, contactors drop at 65‐75% of rated voltage– For 460V or lower motors, contactors drop at 55‐65% of rated voltage
•Motors could drop 70% of system load during a fault or during voltage excursions following the fault – For sending‐end generators, this will impact stability since lost loads will increase acceleration.
– For receiving‐end generators, this will improve stability
16
Air‐Conditioner Compressor Motors• Up to 50% of system load in summer
• Referred to as a “prone to stall” motor with low inertia.– Similar to a standard induction motor under normal operating conditions– It stalls if the voltage is low (e.g. 50~65% of the nominal voltage for 3 cycles) due to a fault
– Once stalled, it behaves like a constant impedance load (with a low power factor) drawing 2‐3 times of the rated current.
– The thermal overload protection disconnects the motor if it remains stalled for considerable amount of time (typically, 15s if stalled at 50% voltage)
– It recovers if voltage goes back to 70% of the nominal voltage. That delays the voltage recovery.
• In areas with a high percentage of air conditioner loads, delayed voltage recovery, short‐term voltage stability and fast voltage collapse are main stability concerns.
17
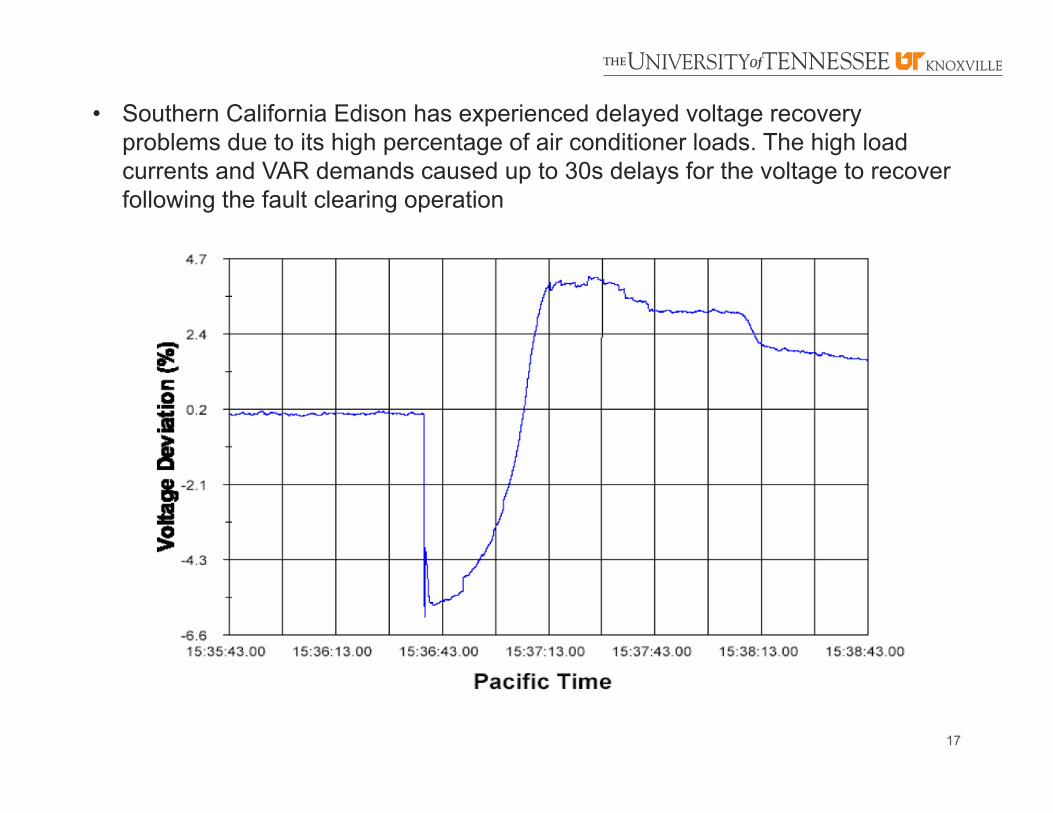
• Southern California Edison has experienced delayed voltage recovery problems due to its high percentage of air conditioner loads. The high load currents and VAR demands caused up to 30s delays for the voltage to recover following the fault clearing operation
18
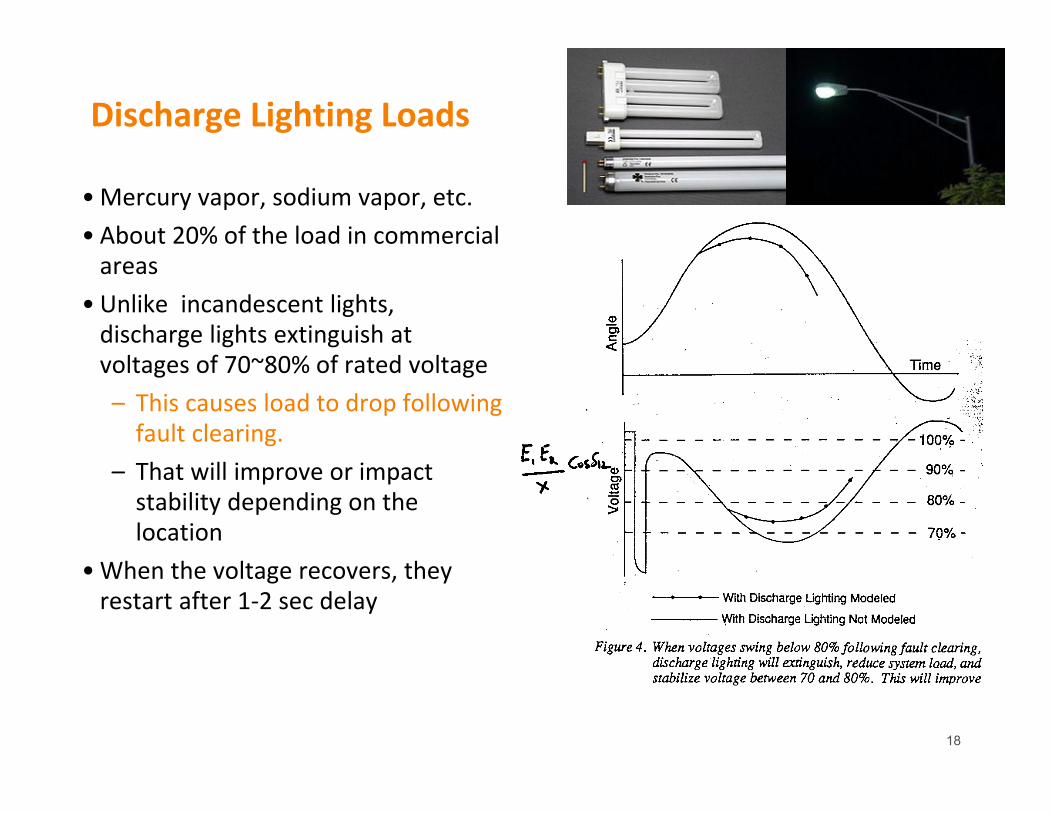
Discharge Lighting Loads
•Mercury vapor, sodium vapor, etc.• About 20% of the load in commercial areas
• Unlike incandescent lights, discharge lights extinguish at voltages of 70~80% of rated voltage– This causes load to drop following fault clearing.
– That will improve or impact stability depending on the location
•When the voltage recovers, they restart after 1‐2 sec delay
19
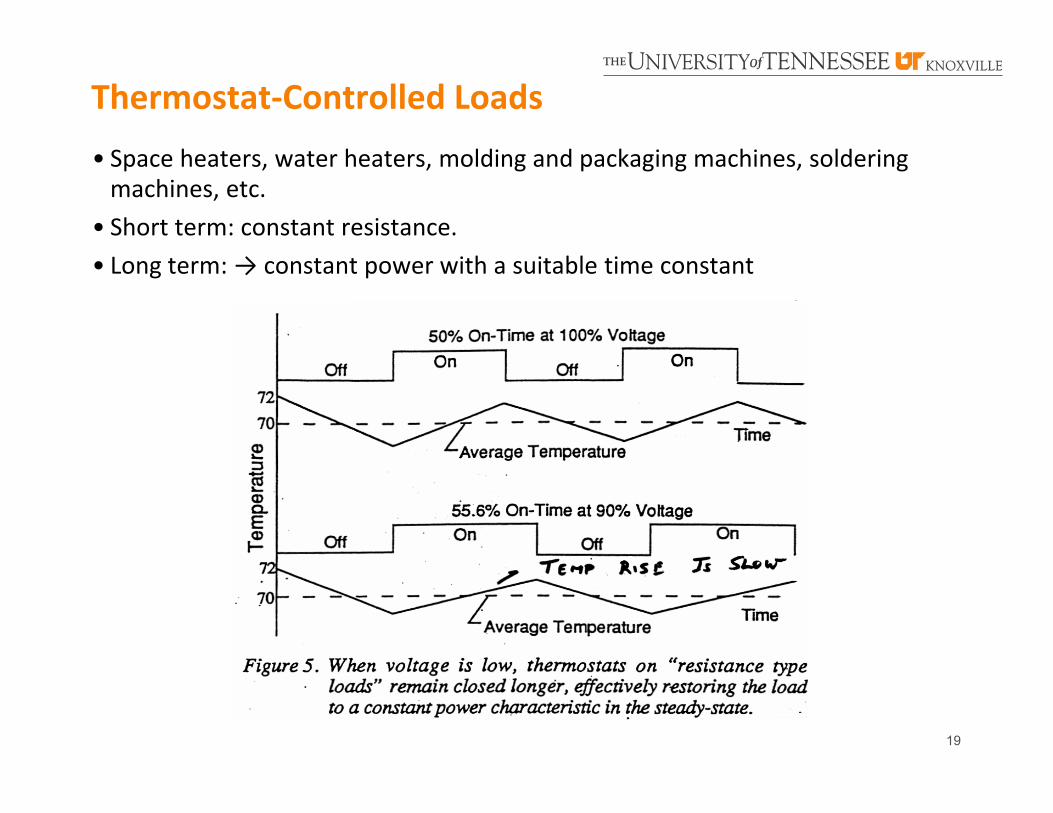
Thermostat‐Controlled Loads• Space heaters, water heaters, molding and packaging machines, soldering machines, etc.
• Short term: constant resistance. • Long term: → constant power with a suitable time constant
20
Approaches for Load Modeling
•Load aggregation can be performed in two ways– “Bottom‐up” (theoretical aggregation):
•Analytically, by lumping similar loads based on the load type and then using pre‐determined values for each parameter of the load
• Referred to as “component‐based approach”
– “Top‐down” (identification):• Selecting a load model structure and then performing parameter estimation using an appropriate identification technique based on field measurements
• Referred to as “measurement‐based approach”
21
Component‐based Approach for Load Modeling
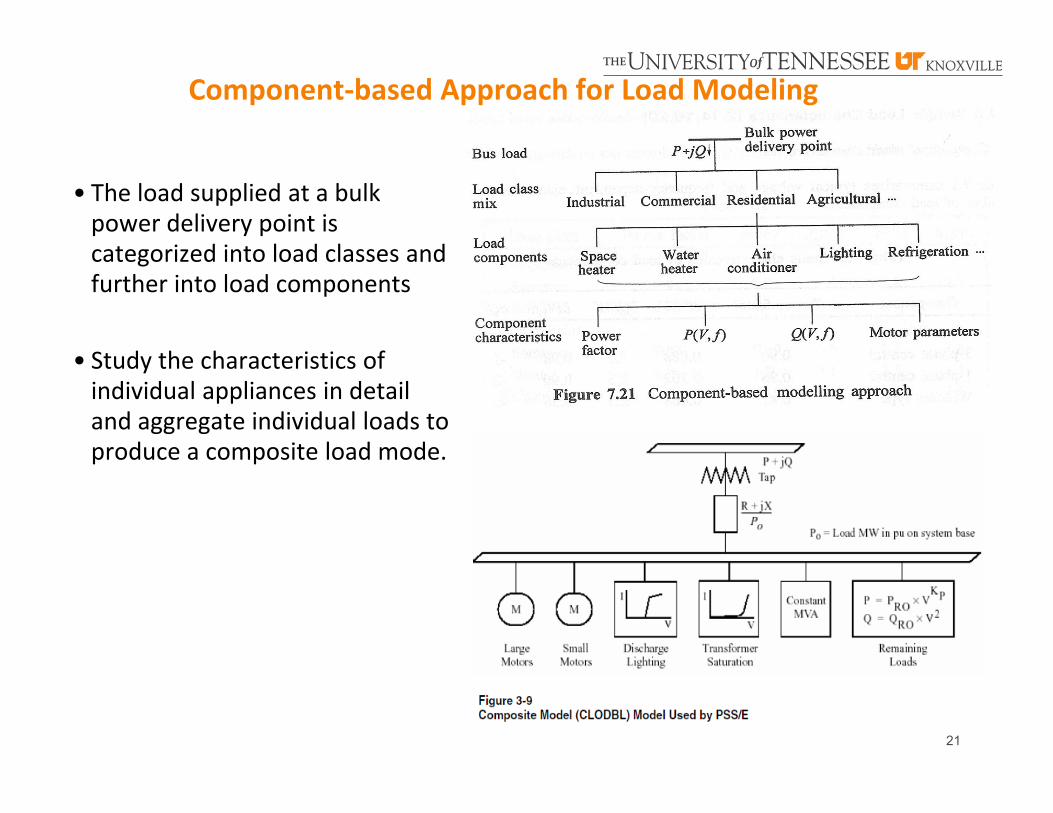
• The load supplied at a bulk power delivery point is categorized into load classes and further into load components
• Study the characteristics of individual appliances in detail and aggregate individual loads to produce a composite load mode.
22
Measurement‐based Approach for Load Modeling
•Load characteristics are measured at representative substations and feeders at selected times of the day and season. – Steady‐state P/V, P/f, Q/V and Q/f– Dynamic load‐voltage characteristics
•These are used to extrapolate the parameters of loads throughout the system
23
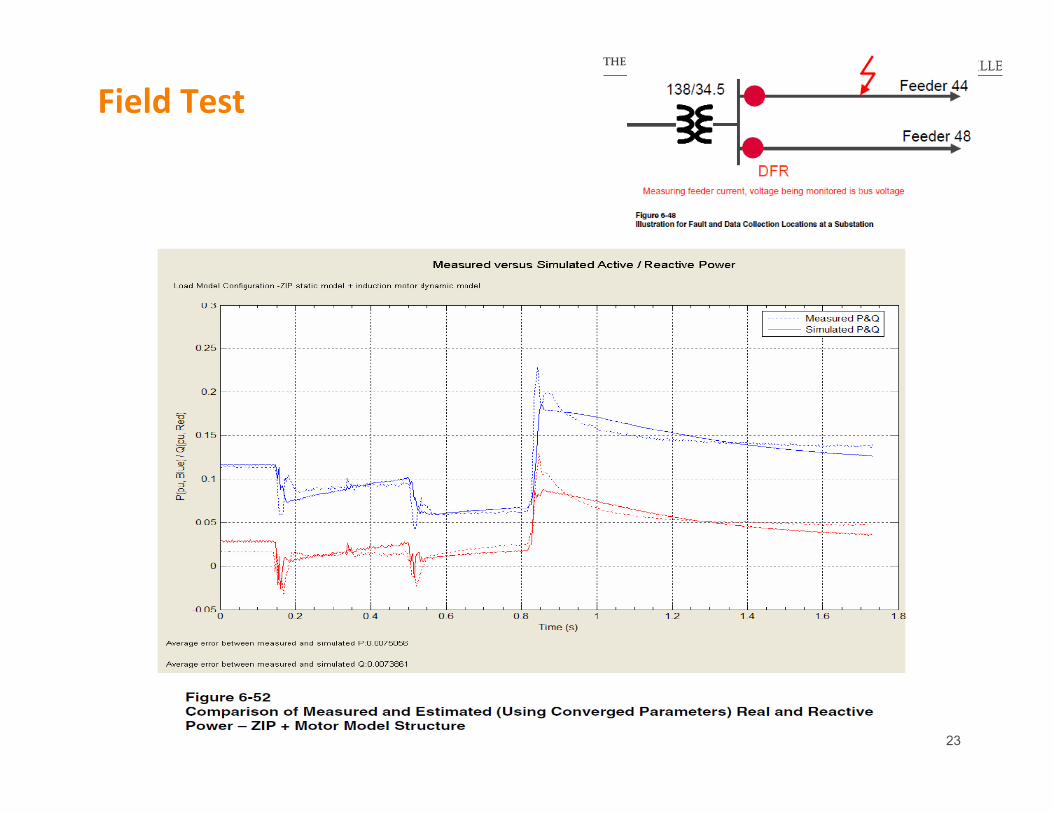
Field Test
24
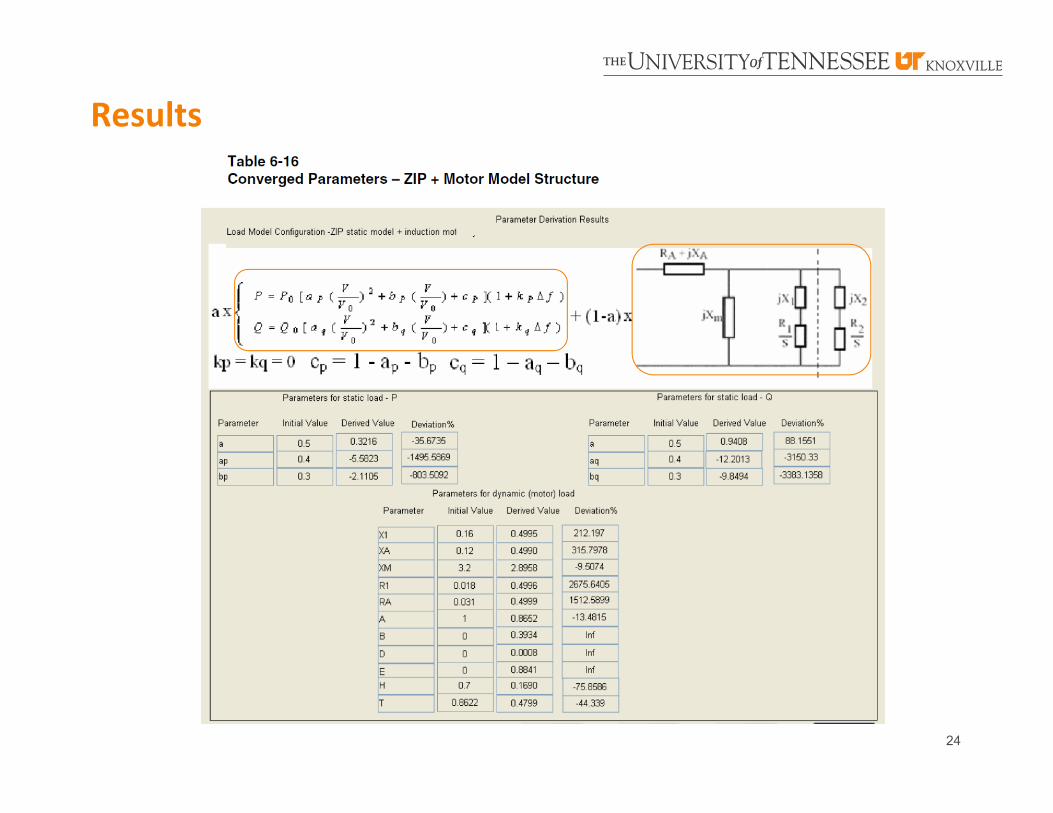
Results