Embed Size (px)
Citation preview

Journal of Applied Finance & Banking, vol. 5, no. 3, 2015, 27-45
ISSN: 1792-6580 (print version), 1792-6599 (online)
Scienpress Ltd, 2015
Ebitda as a Criterion for Assessment of the Banks System:
The Case of Deutesche Bank, Generali and Unicredit
Antonino Buscemi1
Abstract
This work describes and analyzes the validity of some economic indicators about
companies or groups of companies that use capital intensive as a factor of production. In
particular, the study aims to investigate the way in which services provided to high capital
intensity (capital intensive) and then the profit and profitability reached by some groups
in banking, finance and insurance, can be evaluated using the Ebitda criterion (Ebitda
Earnings before tax, Depretiation and Ammortization) or other economic indicators that
will be analyzed during the work. Economic indicators have often an advantage, but they
also have critical issues that will be described during the exposure and depth of work. In
addition, the analysis of statistical and macro-econometric relative to Ebitda of three
comparable groups of intermediaries sector under consideration (Deutesche Bank,
Generali and Unicredit) using a sample of 10 periods (from 2000 to 2009), utilizing the
Cobb-Douglas production function, and considering the excessive volatility of some data,
allows us to obtain a forecast of the increase of the output to vary the amount of input in
terms of physical capital and human capital.
JEL classification numbers: F1, F4, D2, D9, M2, M4;
Keywords: Ebitda, Capital intensive, International trade, Production Function,
Accounting;
1 Introduction
In the research that follows will be used instrumentally theory of factor endowments of
capital and labor, the Heckscher-Ohlin, Salvatore (2002), rearranged according to the
needs and objectives to be achieved in order to define the validity of the indicator of
profitability observed, namely Ebitda. Heckscher-Ohlin, in his theory, is based on a
number of simplifying assumptions such as the use of data from two countries, two goods
1University of International Study of Rome UNINT.
Article Info: Received : December 27, 2014. Revised : January 21, 2015.
Published online : May 1, 2015

28 Antonino Buscemi
products, the analysis of the allocation of two factors of production which are the capital
and labor. In addition, the two countries considered using the same production technology
and the good X is good for labor-intensive and good Y is an asset to capital-intensive in
both countries.
Finally, the two goods are produced under constant returns to scale in both countries. In
our case, the study will be based on the fact that the reference countries are Germany and
Italy we call capital intensive, the good X we define functions with the symbol L, is a key
product-intensive work, will taken as a constant value and calculated as the product of the
average income of the financial sector in each country, multiplied by the number of
workers employed in individual companies.
Good Y will call K, will be defined by the values of Ebitda in the period under review.
While as regards the elasticity of demand for capital or labor, we define α = 0.6 and β =
0.4. This choice stems from the fact that in countries where capital intensive businesses
selected for the research, are also capital intensive, and then using the factor endowment
capital predominantly, there is a difference in increase of 20% compared to the use of the
equipment factorial work. In consideration of the variables mentioned, you will get the
total production factor Y is calculated with the function Cobb-Douglas:
𝑌 = 𝐴 ∗ 𝐾𝛼 ∗ 𝐿𝛽, the individual components of the function will be analyzed in the
following paragraphs, but basically the function does is to estimate the amount of
endowment of physical capital 𝐾𝛼 used to produce, from the countries or in our case by
the companies, with respect to human capital 𝐿𝛽.
2 Selection of Literature
Hence Ebitda’s popularity during the internet boom, when investors used it to compare
the performance of technology companies in different industries or sectors. Because it is
relatively easy to calculate, Ebitda is too often used instead of measures relying on
operating cash flow. It can be dangerous to rely too heavily on Ebitda and ignore changes
in a company’s working capital (Gibson, 2003).
The multiple currents are influenced by general market and expectations of growth in
specific sectors.
The multiples represented by the following relations Enterprice Value and Equity Value
are typically used in industry but in the last twenty years, the trend is to use them in the
banking and financial sector. A study of the second half of the nineties (1995-2001)
involving 22 Italian banks described the evolution of multiple considering the multiples
used those defined.
Massari and Zanetti (2008) analyzed the performance of one of the multiple P/BV
(price/book value) of the banks considered for the reference period.
Fang at al. (2010) suggest that there are risks in combining banking and private equity
investing. This resercher compares various transaction and target-firm characteristics of
bank deals and non-bank deals. In this research the transaction characteristics are
generally similar between the two samples, with the exception that the implied EV/Ebitda
ratio is lower in the bank sample, which means that bank-affiliated groups tend to pay a
lower valuation.
Fang at al (2012) find that both the estimated parent bank’s (individual) share, as well as
all banks’ total share of the loans backing affiliated private equity transactions, are

Ebitda as a Criterion for Assessment of the Banks System 29
significantly lower during market peaks. The parent bank’s individual share is also
significantly lower for highly priced deals, as measured by the ratio of enterprise value to
Ebitda.
These patterns are consistent with market timing and the notion that banks take advantage
of their ability to raise more outside financing when market conditions are favorable, as
suggested by Shleifer and Vishny (2010).
The considerations drawn from the literature on the subject of evaluation and efficiency
are the basis quantitative analysis developed in order to identify an equivalence scale for
the credit sector. The analyzes were conducted using a sample of observations for the
period 2000-2009. This set consists of the three companies for which the period under
review were available financial statement data and reclassified comparable. The data
related to the reporting of the banks have been derived from the base data made available
by the Italian Banking Association (ABI). With regard to the estimate of production in
terms of efficiency, it is preferred to use a function of Cobb-Douglas. The choice comes
from the analysis of the previous results obtained by some researchers who have shown
that, with reference to the banking sector, the use of alternative functional forms, such as
the multi-model transcendental logarithmic translog (Conigliani, De Bonis, Motta, Parigi,
1991; Goisis, Parravicini, Porrini, 1992) or generalized functional form that uses the
procedure Box-Cox (Clark, 1984; Lanciotti and Raganelli, 1988), no results significantly
different from those obtained with a traditional Cobb-Douglas function (Ciocca, Giussani,
Lanciotti, 1974; Conigliani, 1983). This study, together with the estimate of the
parameters that the Cobb-Douglas function allows you to analyze, make it even among
the most frequently used functions by many researchers (Tambucci, 1995).
3 Critical Points and Limitations in the Use of Ebitda
Ebitda is an economical enterprise increasingly used in the analysis of financial
statements to measure the business cash flow, Ebitda or actually if we want the MOL
(Italian acronym) has many critical points, according to many analysts is a valuable tool
to measure the cash flows. And necessary to affirm that the different schools of thought of
many business economists interpret differently this aspect, then there are various theories
on the subject. For example, Fred Hickey, editor of “The High-Tech Strategist”, responds
to criticism that see Ebitda as a false representation of cash flow business.
Experts do not believe in this interpretation, but thinks that in order to evaluate the cash
flows, profits and turnover cannot be removed interest and tangible and intangible assets
(Buscemi and Yallwe, 2014). Other economists think that it is possible to accurately
measure the flow of cash through the Ebitda, if a company engages a part availability
interest expense or equipment purchases. This same economic indicator, is often used as
an accounting device to show the longevity and productivity, sometimes at odds with
reality accounting, to demonstrate to investors the good performance of the company on
the market. This interpretation has its basis in companies listed on a stock market, where
it is retrieved capital through the sale of part of its own shares for investors who believe in
the growth of analyzing the financial statements disclosed by the same (this aspect was
represented even in a report by Moody’s Investors Service in New York Pamela Stumpp).
Ebitda, as mentioned, is an easy to manipulate using accounting techniques that alter the
costs, revenues and the depreciation of fixed assets over time. Thus, as can be seen from
the report “Putting Ebitda Into Perspective”, it is not always useful to use Ebitda to

30 Antonino Buscemi
determine the cash flows, but often you have to use economic indicators more complex
but with higher reliability rate.
Other critical issues stem from the fact that in business, Ebitda does not measure net
income, do not measure liquidity and is not recognized as a tool for analysis of corporate
financial statements in IFRS. For example, Ebitda is an inadequate tool for many
industries, because it ignores the value attributed to brand that values the uniqueness of
the company, according to the report by Moodys cited, cannot be a tool for assessing the
potential profitability of a firm to produce is bound to use new technologies in the short
term might otherwise go out of business.
Ebitda is now used by all companies also by small company, but unfortunately, the use of
Ebitda has evolved and is often used as the only tool for measuring the business cycle of
companies, first was used for evaluate a high rate of receivables, secondly as an analytical
tool for companies long-lived (Stumpp at Moody’s Investors Service in New York).
Of the 147 companies that have declared bankruptcy in 1999 and monitored by Moody’s,
many of these had received bank loans or other financing based on the volume of Ebitda.
An interpretation given in the report that relates Ebit with Ebitda is defined by the large
amount of operating profit (Ebit) contained in gross operating profit (Ebitda), the higher
this ratio the more the cash flow is high. These are the main results of the paper.
4 Indicators of Analysis of the Growth Rate of the Company (ARRs
Method Accounting Rates of Returns)
This method of economic analysis developed by two economists Resende and Zeidan
(2006) used nine economic indicators to test the growth rate of the company or sector.
The work written by two economists is cited as the conclusions are the same of the critical
points of which were mentioned in the previous section, namely, that the indicator Ebitda
considered as a single reference data is not always expressed the ability to create profit,
profitability, and therefore the real economic conditions, financial and accounting firm,
but sometimes, to get consistent estimates and actually attributable to real growth rate
and/or longevity company should be changed to more complex indicators. In our case, to
study empirically the data of the three banking groups, financial and insurance in
reference will use economic indicators chosen methodically, which will be described later
both theoretically and used in estimating data for the three institutions took in reference
research.
5 The Cost of Equity and the Method of Multiple
The cost of equity can be determined either by referring to a type indicator mainly
accounting which the ROE (Return On Equity) is through the use of more complex, but
more reliable economic models, such as, for example, the CAPM (Capital Asset Pricing
Model), market multiples or the APT (Arbitrage Pricing Theory). The model to be used
more time in the practice of large financial institutions is certainly the CAPM, which
binds the expected return of any financial asset that has a market (or an investment project)
to its systematic risk component, namely that no further eliminated using the portfolio
diversification.

Ebitda as a Criterion for Assessment of the Banks System 31
In the work that follows will not use the CAPM, because besides being a very complex
indicator to which we should devote an entire work, the same does not use in its
formulations economic indicators related to our original study, and in particular in the
lead is not used Ebitda.
The multiples method involves the determination of the value of the capital of an
enterprise on the basis of negotiated prices (in organized markets or M&A) for securities
representing shares in the capital of comparable companies.
This method involves building relationships (multiples) that are based on a relationship
between the prices of shares of comparable companies and an economic variable
company (net income, Ebitda, turnover etc.). Such relationships are then applied to the
same economic variable to be evaluated to determine the company, depending on the
approach used, the enterprise value or the equity value. In fact, as in the case of the
evaluation with the DCF, even in market multiples will have two distinct approaches: the
first is the Asset Side, leading to estimated enterprise value and subtracting the net debt,
to that of the Equity Value; the second is the Equity Side, which leads directly to the
estimate of the Equity Value. Belong to the first approach multiples such as EV/Sales,
EV/Ebitda and EV/Ebit; belong to the second, however, multiple such as Price/Earnings
or Price/Book Value. The multiples are determined with reference or a sample of listed
companies homogeneous than that to be evaluated (approach of comparable companies)
or M&A made in the past involving comparable approach (comparable transactions). The
empirical part of this paper will focus on the first approach, namely, the Asset Side. In a
first step we will address three or multiple multipliers and an economic indicator
calculated according to the following relationships:
EV/Ebitda
EV/Ebit
EV/Sales
Ebitda Margin (%) = Ebitda (MOL)/Profit
From the foregoing emerges the criticality, in applying the multiples method, the selection
of comparable, which may differ from the company to be assessed for size, activity,
profitability, leverage and risk profile. Given the fact you state that the choice of the three
banking groups/insurance analyzed below, namely, Deutesche Bank, Generali and
Unicredit.
5.1 Study of the Indicators of Profit and Profitability
A study conducted by a researcher named Celia (2004) on some economic indicators of
profit and profitability for companies Italian champion has announced the results
considered interesting from a scientific point of view. The sample, relative to companies
not listed on a financial market with a turnover of between 25-50 million eur and with
sales of over 50 million eur; while for those listed on a financial market there was no limit
turnover. For the three broad groups of companies were analyzed, for what interests our
elaborate indicators of profitability: Ebit margin, Ebitda margin and Net margin and
profitability indicators: ROI and ROE. The absolute values obtained, starting from
profitability, allow us to say that there is a higher operating efficiency of listed firms than
in non-listed companies.
In particular, the Ebitda margin, recording a best condition of listed firms (median 11.8%,

32 Antonino Buscemi
mean 13.7%) compared to non-listed companies (median 7.7%, average 9.1%). With
regard to non-listed companies, are the small firms to have higher operating efficiency,
both in terms of data that median average. In detail, the Ebitda margin was 7.7% for the
enterprise median entire sample (the average is equal to 9.1%), to 10.7% for the median
firm small business size (the average is equal to 11.4%) and to 6.5% for the enterprise
median of those with a turnover exceeding 50 million eur (the average is equal to 8.4%).
As for the return on investment, the results are amazing, despite the increased operational
efficiency listed companies remunerate their capital invested less than do the non-listed
companies. The median value of the ROI, the indicator of total return on invested capital,
is equal to 1.6% for listed companies and to 2.5% for non-listed companies and the
situation is even more striking and paradoxical in the case of the average values (- 5.6%
for listed, + 4.9% for non-listed). Within the sample of non-listed companies are once
again the small firms to record the highest values with an average ROI equal to 6.9%
(since the median is equal to 4.7%). The ROE indicator of the return on equity,
confirming the lower return on the capital of listed companies (median 3.6% and average
-2.9%) compared to non-listed (median 6.1% and average 7.7%).
Assuming that the macro analysis conducted was not just about a sector but all sectors of
the marked (manufacturing, utilities, financial, industrial, etc.), the findings show a
comparison in terms of capitalization, profitability and profitability of listed companies in
a market and of unlisted companies. From this emerges a greater profitability and better
management of the financial aspects by the companies listed.
6 Data Selection
The review that follows will function as to describe the construction of the data used in
paragraph 7 to implement the model. The sample for the empirical study refers to a
sample consisting of ten year periods intervening between 2000 and 2009. The study
covers three main groups of banking, finance and insurance, and working in the field of
service provision. The decision stems from the fact that these companies operate in the
market by providing services, and then using to produce a major amount of the capital
factor. The three companies are analyzed: a German, namely Deutesche Bank and the
other two Italian, namely Unicredit and Generali. The research data comes from a choice
of homogenize the same in order to observe the oscillations Ebitda or indicators
Economic and business relationships built through that link Ebitda with other balance
sheet values.
Much of the data were extrapolated from the budgets of the companies examined by the
use of databases ABI, other data such as wages and salaries, to avoid distortions arising
from the analysis of budget data incorporating awards productive or other benefits, were
taken from the OECD database by country of origin. For example, as can be deduced in
the following paragraphs, to build the amount of labor employed L, as a factor of
production, so part of our input in the production function, we used the values of wages
and salaries arising from the national average of individual states Germany and Italy.
The rationale for this choice is the fact that observing the aggregate data entry wages and
salaries in the budget of the three companies, it should be noted that in some easily
annuity there is a distorted representation of the number of workers and therefore not in
line with the trend data. For example, if the ratio wages/workers for the year 2006
amounted to 30 thousand eur and in the following year amounted to 60 thousand eur,

Ebitda as a Criterion for Assessment of the Banks System 33
clearly in 2007, in the item wages and salaries, there is an additional component that not
the result of the increase in income of workers but dispensing awards or benefits which in
our case should be empirical to distort the results themselves.
Finally, in the description of the data, when we refer to companies in question: Deutesche
Bank, Unicredit and Generali, when possible, to avoid being repetitive, it is called
“Groups”.
6.1 Productivity per Worker
In the representation will be analyzed following the trend in productivity of each worker
in terms of Ebitda for the three groups studied specifically. The analysis covers the years
intervening between the 2000-2009 and tends to highlight the relationship between Ebitda
and the number of workers using the ratio 𝐸𝑏𝑖𝑡𝑑𝑎
𝑛. 𝑤𝑜𝑟𝑘𝑒𝑟. The graph n. 1 it should be noted
immediately that the performance of Generali and Unicredit is very similar and at levels
lower than that of Deutesche Bank. The statistical analysis of the sample of 30
observations, showed interesting results that will be detailed later. As can be noted,
examining the graph n. 1 Deutesche Bank reaches peak productivity per worker in terms
of Ebitda in 2007, reaching 213,856 € against the minimum reached by Generali in 2002
amounted to € 5,268. The average value of output per worker is equal to € 92,396 and the
sampling distribution has greater frequency in a range between 50,000 and 100,000 €, so
with a median value of € 72,038. Also the values of Moda<Median<Media shows that the
distribution is positively skewed to the right and presenting a lower frequency of middle
and extreme, with a higher frequency of the intermediate, is also platykurtic or
hyponormal, this aspect is highlighted also on the value of Kurtosis = 2.62 less than 3.
More simply we can say that in this case the curve of kurtosis is compressed downwards.
Summarizing the results, we can say that companies that produce industry, in terms of
Ebitda, a smaller amount of approximately € 50,000 per worker/year, are not efficient. It
may be observed that outcome values, apparent hereinafter, relative to average wages and
salaries that are below the threshold of 50,000 €, if not the company would produce a
loss.

34 Antonino Buscemi
Figure 1: Productivity per worker (in terms of Ebitda)
Figure 2: Descriptive statistics of the ratio Ebitda/
6.2 Ebitda Margin Analysis
The Ebitda margin is the ratio between Ebitda in our case Ebitda and revenues. Having an
intermediate result in the numerator is not influenced by fiscal policy and financial
decisions, this indicator is in the practice of business valuation the most widely used
indicator to understand the operating profitability of the company, separating it from the
financial and investment. So this indicator measures the percentage of operating income
in terms of Ebitda compared to revenues of a company. Over the Ebitda margin is higher,
the company has a high productivity. This means that the company is able to produce
more profits in proportion to their turnover. From the graph n. 3 shows clearly that
Deutesche Bank from 2000 to 2005 at a level of Ebitda margin higher Generali and
Unicredit, then proceeding with a dramatic decline until 2008 when the trend reverses, but
basically cannot get over the other two groups until 2009. By referring to the chart

Ebitda as a Criterion for Assessment of the Banks System 35
analysis n. 3, which highlighted the fact that Deutesche Bank had increased production in
terms of Ebitda per employee, we need to think again noting clearly that by introducing
revenues to calculate the Ebitda margin, the situation changes dramatically. Furthermore,
from the graph n. 4 which shows changes in Ebitda of the three groups from 2000 to 2009
it is clear that the General has minimal levels of productivity than the other two groups
when, looking at the graph n. 3, we can say that from 2000 to 2005 is in line with
Unicredit and since 2007 has even margins above Deutesche Bank. This means that the
significance of the technical indicators can be manipulated with the individual work items
that are used to represent the profitability or profitability of the business with the most
varied formulations.
Figure 3: Incidence Ebitda/Profit or Ebitda margin
Figure 4: Ebitda trend from 2000 to 2009 of the three groups (data in millions of Euro)
6.3 The Method of Multiple
The multipliers referred to as “equity side” includes interest expense (initial configuration
is represented by net income – “levered”) and can be expressed in absolute terms or per
share value. These indicators will be used to avoid moving away from crucial

36 Antonino Buscemi
representation of the results. The study will cover only multipliers defined “asset side”
who pose the numerator is the difference between the market value of equity and net debt
(debt - cash) which, in turn, took the name of “enterprise value” (EV), while the
denominator is contextualised one of the following business variables:
a) Ebit = (operating income - operating costs)
b) Ebitda = (Ebit + Depreciation)
c) NOPAT = Ebit * (1-t) at t = tax rate
d) UFCF = Ebitda - maintenance investments
e) S = sales
f) R = operating income
Is correct to know all the indicators, but those analyzed concern the relationship between
EV (enterprise value) and Ebit, as well as the ratio between Ebitda and revenue.
Denominators “asset side” exclude interest expense (starting from the operating result –
“unlevered”) and are expressed in absolute value. Another precaution to be followed in
the construction of multiple (or “asset” and “equity”) lies in the fact that the quantities
company that are in the denominator, to be truly meaningful, they must first be purged of
balance sheet items extraordinary and non-recurring, that is will operate the process of
“normalization”. Then, once identified and calculated the multiplier, or the group of
multipliers, which is believed to be more representative, as the evaluation of the validity
of the data through different tests. The final value will be given by the product of the
multiplier chosen for the economic variable of each company for which you want to
determine the validity of the indicator Ebitda. You will also be asked, of course, due care
in maintaining the necessary consistency between the multiplier and economic variable
(example: EV/Sales Average, resulting from comparable firms, must be multiplied by the
value S (sales) company for which you want to operate the estimate). However, you can
achieve that, from the results of two or more multipliers obtained from the average of the
data related to companies defined as “comparable” may derive results very far from each
other after application of the multiple economic variables corresponding to the company
under study. Our empirical case has as its primary objective is to find the values of the
multiplier ideal for the “bank-finance and insurance” refer to companies whose securities
are listed on a stock market. To produce this result is necessary prior to the choice of the
reference companies asking, therefore, considerable care to identify those characteristics
that must have similar businesses, and in particular a clear and necessary degree of
similarity with the other companies in the sector to evaluate. In our case, the investigation
has turned to companies characterized not only by the corresponding productive sector,
too, from the Eurpean geographical context, size and degree of development, and, by
some elements for which it is possible to identify an effective relationship comparison
and analogy, including:
a) the growth rate of cash flows;
b) degree of risk;
c) level of indebtedness;
d) rate of variability of corporate performance choice.
The objective at this stage of data analysis is to build a special table that are listed
comparable companies, the evaluation of the three economic indicators containing real
data (EV/Ebit, EV/Ebit, EV/Sales), and as a final result to obtain a range, in
correspondence with each indicator/bank, that is an ideal value that would allow an
economist to evaluate the productivity and profitability of a hypothetical entity of the
same field taken into consideration. After the statistical manipulation of the data, shown

Ebitda as a Criterion for Assessment of the Banks System 37
in the graphs n. 5, 6, 7, 8, 9, 10 and by performing an analysis of the results mean, median
and standard deviation was possible to obtain an ideal evaluation of multiple specially
constructed for our research. The first result that can be seen from the statistics of the
three multipliers, since the asymmetry is positive, then the right, which characterizes the
sampling distributions. In particular, the single data analysis will be used to correlate the
data thus obtained, giving rise to the standard values of multipliers which will serve for
the evaluation of the company “x” chosen. It will be necessary to check the table and
possibly exclude those companies (and their data) that although characterized, at least at
first glance, to be elements of comparability, in the present reality of the multipliers are
very distant from the general average, but above all values of (multiple) relating to the
company under study. The sample for the observation of each indicator/multiple consists
of 30 observations. In particular, as shown in the graph n. 5 is from n. 8, Generali has a
level EV/Ebit minimal compared to Deutesche Bank and Unicredit, which essentially
have a remarkably similar pattern, except in the period after 2007 and until 2009.
Figure 5: Analysis by the method of multiple (EBIT)
Figure 8: Descriptive statistics EV/Ebit
The multiple given by the relation EV/Ebitda presents a slightly different situation. We
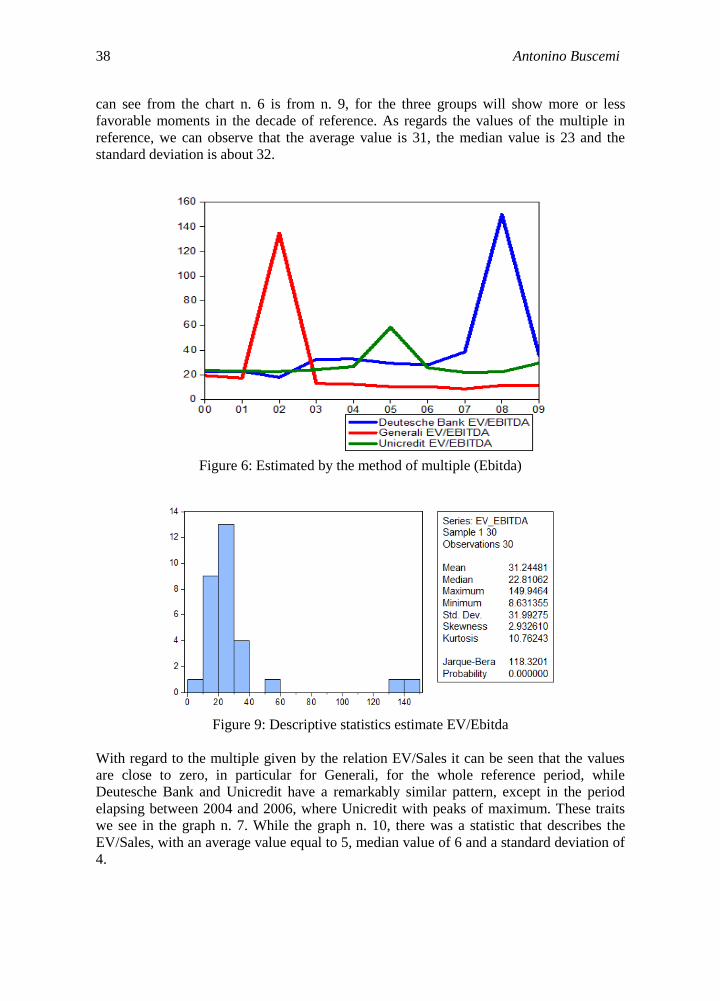
38 Antonino Buscemi
can see from the chart n. 6 is from n. 9, for the three groups will show more or less
favorable moments in the decade of reference. As regards the values of the multiple in
reference, we can observe that the average value is 31, the median value is 23 and the
standard deviation is about 32.
Figure 6: Estimated by the method of multiple (Ebitda)
Figure 9: Descriptive statistics estimate EV/Ebitda
With regard to the multiple given by the relation EV/Sales it can be seen that the values
are close to zero, in particular for Generali, for the whole reference period, while
Deutesche Bank and Unicredit have a remarkably similar pattern, except in the period
elapsing between 2004 and 2006, where Unicredit with peaks of maximum. These traits
we see in the graph n. 7. While the graph n. 10, there was a statistic that describes the
EV/Sales, with an average value equal to 5, median value of 6 and a standard deviation of
4.

Ebitda as a Criterion for Assessment of the Banks System 39
Figure 7: Estimated by the method of multiple (EV/Sales)
Figure 10: Descriptive statistics estimate EV/Sales
7 The Model
In the empirical part to analyze our data we use an estimate of the output of the
production function Cobb-Douglas, starting with the following wording:
𝑌 = 𝐴 ∗ 𝐾𝛼 ∗ 𝐿𝛽, and log-linearizing and including a stochastic disturbance, we can
estimate by the following derivation:
𝑙𝑛𝑌 = 𝛽0 + 𝛽1 𝑙𝑛𝐾 + 𝛽2 𝑙𝑛𝐿 + 𝑢
where the estimated parameters are: 𝛽0 = 𝑙𝑛𝐴; 𝛽1 = 𝛼; 𝛽2 = 𝛽
To normalize the data will use the logarithmic transformation of the whole time series. To
analyze the parameters related to the production of the three groups (Deutesche Bank,

40 Antonino Buscemi
Generali and Unicredit) and to calculate the total factor productivity for the sample
2000-2009, taking as reference the data in two countries, Germany and Italy was used the
function production of Cobb-Douglas formulated according to the description that
follows:
𝑌𝑖𝑡 = 𝐴𝑖𝑡 ∗ 𝐾𝛼𝑖𝑡 ∗ 𝐿𝛽
𝑖𝑡
where:
𝑌𝑖𝑡 is the value added in terms of output produced by the group i at time t;
𝐾𝛼𝑖𝑡 is the stock of physical capital in terms of Ebitda used group i at time t;
𝐿𝛽𝑖𝑡 is the amount of the factor of production in terms of work done by the group i at
time t, calculated by multiplying the number of employees by the average per capita
income in the country of origin;
𝐴𝑖𝑡 is a constant value that expresses the second Hicks technological change and
introduces a stochastic component in the model.
Technological change is represented by the following equation:
𝐴𝑖𝑡 = 𝜌𝑎𝑖 ϓ𝑡𝜉𝑖𝑡
then our log-function is the following:
𝑙𝑛𝑌𝑖𝑡 = 𝑎𝑖 + ϓ𝑡 + 𝛼𝑙𝑛𝐾𝑖𝑡 + 𝛽𝐿𝑖𝑡 + 𝜉𝑖𝑡
Really in our model will adopt a number of assumptions that are likely to significantly
reduce the applicability to all circumstances, an example certain limits are as follows:
- the elasticity of substitution between labor and capital is equal to one;
- to changes in relative prices, the capital intensity varies in the same way, that is a
limitation to the use of the function in economic analysis;
- is a static function and does not include, therefore, the technical progress.
Such criticism is overcome by modifying the function through the insertion of a trend t, in
our case exponential, as described before:
- assumes the unrealistic assumptions of perfect competition;
- very often assumes the hypothesis of constant returns to scale. Consequently, the
Cobb-Douglas is a linear function homogeneous of degree α + β = 1.
In empirical tests that sum is, however, often be significantly different from 1.
Overcoming the assumption of constant returns to scale occurs through specific
production functions, such as the CES function (Constant Elasticity of Substitution).
That said, the function will use to process the data and analyze the results, with the
limitations that follow, will be as follows:
𝑙𝑛𝑌 = 𝛽0 + 𝛽1 𝑙𝑛𝐾 + 𝛽2 𝑙𝑛𝐿 + 𝑢
7.1 𝑹𝟐 and the Standard Error of the Regression
The descriptive statistics commonly used in multiple regression are (Stock and Watson
2005): the standard error of regression, the regression 𝑅2 and 𝑅2 correct. All three

Ebitda as a Criterion for Assessment of the Banks System 41
statistics measure the goodness with which the OLS estimation of the regression line or
multiple describes fits the data. The 𝑅2 and the standard error of the regression are two
measures of goodness with which the regression line of OLS interpolates the data. The
𝑅2 varies between zero and one, and measuring the fraction of the variance of Yit that is
explained by the fluctuation of the input. The standard error of the regression measures
the distance of Yit from its predicted value. In our case the values of regression of Yit is
equal to: Bank Deutesche 𝑅2= 0.582, 𝑅2= 0.299 Unicredit and Generali 𝑅2= 0.491. In
view of the fact that a value of 𝑅2 close to one indicates that the regressor and able to
predict well Yit, output, while a 𝑅2 close to zero indicates that the regressor and not
able to predict so Yit reliable, we can say that the prediction of output Deutesche Bank
and Generali is moderately reliable, while the Unicredit being very close to 0 is not
trusted. The standard error of the regression, or SER (Standard Error of Regression), and
an estimator of the standard deviation del’errore regression. Since the regression errors
are not observed, calculated using the SER and their corresponding samples, the OLS
residuals. The values of the standard deviation of the regression are equal to: Deutesche
Bank SE= 0.660, SE= 0.716 Unicredit and General SE= 0.727. The reasons for a standard
error so high are described by the fact that the sample size is very small. 𝑅2 grows every
time you add a new variable to the regression, an increase in 𝑅2 does not mean that
adding a variable actually improves the model fit. In this sense, the 𝑅2 gives an
overestimate of the goodness of the regression. A solution to correct this effect is given by
deflation or reduction of 𝑅2. This is the function that performs the 𝑅2 correct. The
values of 𝑅2 correct, relevant to our empirical case are: Deutesche Bank 𝑅2 correct=
0.462, Unicredit 𝑅2 correct= 0.099 and Generali 𝑅2 correct= 0.346.
7.2 The Production of the Three Groups of Banks
In this case the output or production calculated with the criterion described up to now, we
can highlight from the graph n. 11 that, in spite of the fluctuations of the indicators that
we met during the analytical and descriptive of our dat. The production of the three
business realities is represented by a remarkably similar pattern in the decade under
consideration. In more detail, we can observe from the graph n. 11 that the values of
production, in absolute terms, oscillate between a minimum of 15 and a maximum of 17
during the reference period. This means that regardless of the number of employees in
each individual situation, regardless of the geographic location of the business, in
consideration of a fluctuation in salaries and wages calculated according to the statistical
average of the country/reference year, and in consideration of a process production
characterized by many similar elements (capital intensive, the same production sector,
etc.), the productivity potential and profitability of firms in question is not significantly
different, in fact the trend is almost in line with expectations stated. To investigate the
relationship between input and output in our production function is Cobb-Douglas test
was used for statistical Wald, placing a restriction, namely, that the use of capital K is
equal to 60% (3/5) compared to productive work factor L which is equal to 40% (2/5).
The Wald test is a statistical test, typically used to determine whether an effect exists or
not. Therefore, it is examined whether an independent variable has a statistically
significant relationship with the dependent variable, in our case has been correlated with
the production Y inputs K and L in consideration of the use of the elasticity of the two

42 Antonino Buscemi
inputs, then inserting the restriction above. The results will be exposed in the following
conclusions.
Figure 11: Trend productivity of the three groups
8 Conclusion
The study carried out to indicate that the financial ratios can provide useful signals about
the behavior of the banking group and its results but not completely suitable to detect the
relative position of a company compared to other companies in the same sector without
adopting specific measures.
These indexes do not allow to properly compare the results achieved by the banks because
they do not take account of their diversity, the economic environment of the country,
origin of the structural profile, geographical location and financial aspects of the company.
The study of the assessment tool companies has allowed us to analyze the reliability and
the critical methods to assess and to identify the trend of a company. During the research
it became clear that a single assessment tool cannot be highly representative of the
economic situation of a company. The problem stems from the fact that to achieve a level
of optimal evaluation tools require complex analysis, but sometimes only the knowledge
of these tools requires a heavy commitment to the management and to the company in
terms of cost as investors are not able and do not have the tools to be able to do this
analysis. In summary we can say that for a correct use of a tool such as Ebitda we have to
find a confidence interval constructed by a range of similar indicators from the analysis in
context of companies with same characteristics than to compare. To operate in this sense
it is necessary to take care in the choice of the productive sector, size, growth rate, level
of indebtedness, geographical location, listing on the stock market. Moreover, it is
important to make an analysis of all variables that apparently represent the company in a
situation that often does not correspond to the economic reality of reference. Carried out
this operation, you can proceed extrapolation of business data to be analyzed and they can
be compared with those of another company. Basically, if a company is found with high
levels of Ebitda and other indicators of profitability or profit, does not mean that reality is

Ebitda as a Criterion for Assessment of the Banks System 43
operating according to a logic aimed at growth, or at least in the short term cannot be said
with certainty are produced profits. The Wald test used in the paper allows us to state that
the relationship between input and output, in the proportions assumed by Y = 3
5 K
2
5 L,
is reliable for the values of the Generali Group, moderately reliable for values of
Unicredit and not very reliable for the values of Deutesche Bank. The project highlights
the relationship between the values being tested and those of alter reality similar company.
This aspect is confirmed by the estimates of the production function and values of
residuals. In the proposed results, the residual values can be considered “white noise”, and
acceptable, because the trend is contained within the confidence bands or confidence
intervals. While the other observed values have a remarkably similar pattern, therefore
suitable to estimate our sample
References
[1] Berger A. N. (1991), The Profit-Concentration relationship in Banking, in Finance
and Economics Discussion Series, FEDS, n. 176, Board of Governors of the Federal
Reserve System, November.
[2] Berger A. N. (1993), Distribution-Free Estimates of Efficiency in the U.S. Banking
Industry and Tests of the Standard Distributional Assumptions, in Journal of
Productivity Analysis, September.
[3] Berger A. N. - Hannan T. H. (1997), Using efficiency measures to distinguish
among alternative explanations of the structure-performance relationship in Banking,
in Managerial Finance, vol. 23 n. 1.
[4] Berger A. N. - DeYoung R. (1997), Problem loans and cost efficiency in
commercial banks, in Journal of Banking and Finance, 21.
[5] Berger A. N. - Humphrey D. B. (1993), Efficiency of financial institutions:
international survey and direction for future research, in Eurpean Journal of
Operational Research, 98.
[6] Berger A. N. - Leusner J. H. - Mingo J. J. (1997), The efficiency of bank branches,
in Journal of Monetary Economics, 40.
[7] Buscemi A. - Yallwe A. H. (2014), An Era of Intangible Assets, in Journal of
Applied Finance & Banking, vol. 4, n. 5, 17-26.
[8] Cassandro P. E. (1969), Reddito e valore aggiunto nell’impresa bancaria, Scritti in
onore di G. Dell’Amore, Milano, Giuffrè ed.
[9] Celia P. (2004), Redditività, struttura finanziaria e capitalizzazione di mercato delle
principali imprese italiane, Dip.to Scienze Economiche Università di Verona, 22
dicembre, pag. 8.
[10] Champernowne D. G - Cowell F. A. (1998), Economic Inequality and Income
Distribution, Cambridge, Cambridge University Press.
[11] Charnes A. - Cooper W.W. - Rhodes E. (1978), Measuring the efficiency of decision
making units, in Eurpean Journal of Operational Research, 2.
[12] Clark J. (1984), Estimation of Economies of Scale in Banking Using a Generalized
Functional Form, in The Journal of Money, Credit and Banking, February.
[13] Cobb, C.W. & Douglas, P.H. (1928), “A Theory of Production”, American
Economic Review, 18(1), 139-165.

44 Antonino Buscemi
[14] Coda V. (1982), Gli indici significativi e l’espressione della misura e della
composizione dei flussi finanziari, in AA.VV., Il bilancio di esercizio delle aziende
di credito, Assbank Milano, ICEB.
[15] Conigliani C. (1983), Dimensioni aziendali, costi ed efficienza nel sistema bancario
italiano, in Temi di discussione, n. 20, Roma, Banca d’Italia, giugn.
[16] Conigliani C. - De Bonis R. - Motta G. - Parigi G. (1991), Economie di scala e di
diversificazione nel sistema bancario italiano, in Temi di discussione, n. 150, Roma,
Banca d’Italia.
[17] Douglas, P.H. (1976), “The Cobb-Douglas Production Function Once Again: Its
History, Its Testing, and Some New Empirical Values”, Journal of Political
Economy, 84(5), 903-916;
[18] Deaton A. - Muellbauer J. (1980), Economics and Consumer Behaviour, Cambridge,
Cambridge University Press.
[19] Engel E. (1895), Die lebenskosten belgischer arbeiter-family fruher und jetzt,
International Statistical Institute Bulletin, vol. 9.
[20] Fang L., Ivashina V. and Lerner J. (2012) Combining Banking with Private Equity
Investing, Harvard School Finance, working paper, 10-1006.
[21] Fang L., Ivashina V. and Lerner J. (2010), “An Unfair Advantage”? Combining
Banking with Private Equity Investing, Harvard School Finance, working paper,
10-1006.
[22] Farrell M. J. (1957), The measurement of productive efficiency, in Journal of Royal
Statistical Society, 120 Sec A.
[23] Ferrero G. - Dezzani F. - Pisoni P. - Puddu L. (1994), Le Analisi di Bilancio - Indici
e Flussi, Milano, Giuffrè.
[24] Forestieri G. (1977), Analisi dei bilanci delle aziende di credito - Aspetti teorici e
verifica empirica, Giuffrè.
[25] Førsund F. R. - Lovell C. A. K. - Schmidt P. (1980), A survey of frontier production
functions and of their relationship to efficiency measurement, in Journal of
Econometrics, 13.
[26] Gibson N. (2003 ), Essential Finance, The Economist.
[27] Goisis G. - Parravicini P. - Porrini D. (1992), Le economie di scala nel settore
bancario: il caso della banche popolari, in Il Risparmio, n. 3.
[28] Gorman W.M. (1976), Tricks with utility functions. Essay, in Economic Analysis,
eds Artis M. J., Nobay A. R., Cambridge University Press.
[29] Greene W. H. (1990), A gamma-distributed stochastic frontier model, in Journal of
Econometrics, 46.
[30] Heathfield D. F. - Wibe S. (1987), An introduction to cost and production functions,
London, Macmillan Educational Ltd.
[31] Konus A. A. (1958), Consumer Price Indexes and Demand Functions, in Revue
Institut International Statistique, 26, 1/3.
[32] Leibenstein H. (1966), Allocative efficiency vs X-efficiency, in American Economic
Journal, June.
[33] Leontief W. (1951), “Domestic production and foreign trade: the american capital
position re-examined”, Intern. Econ., pagg. 3-32.
[34] Massari M. (1998), Finanza aziendale: valutazione, McGraw Hill libri Italia, Milan.
[35] Massari M., Zanetti L. (2008), Valutazione. Fondamenti teorici e best practice nel
settore industriale e finanziario, McGraw Hill, Milano, Chapter 10.

Ebitda as a Criterion for Assessment of the Banks System 45
[36] Nicholson J. L. (1976), Appraisal of Different Methods of Estimating Equivalence
Scales and Their Results, in The Review of Income and Wealth, January.
[37] Nenna E. - Santini I. (1995), La misura statistica della produttività nelle aziende di
credito: una rassegna critica, Scritti in ricordo di Carlo Fabrizi, Cedam ed.
[38] OECD Organisation for economic co-operation and development.
[39] Salvatore D. (2002), International Economics, Etas, 138-232.
[40] Santini I. (2002), Le scale di equivalenza per la valutazione comparativa delle
performance aziendali, Studi e note di economia, n. 2/02.
[41] Shleifer, A., and Vishny R. (2010), Unstable Banking, Journal of Financial
Economics 97, 306-318.
[42] Sylos-Labini, P. (1995), “Why the Interpretation of the Cobb-Douglas Production
Function must be Radically Changed”, Structural Change and Economic Dynamics,
6, 485-504.
[43] Stock J. H., Watson M. W. (2005), Introduzione all’econometria, Pearson
Education.
[44] Viviani A. - Gazzei S. D. (2001), L’analisi dell’efficienza nel mondo bancario.
Dall’approccio macro all’approccio micro, in Studi e Note di Economia, 2, Firenze.
[45] Zeidan R. M., Resende M. (2006), Accounting and Economic Rates of Return: a
Dynamic Econometric Investigation, Eurpean University Institute, Working Paper n.
7, pag. 12.