Embed Size (px)
Citation preview
Coega Development Corporation
Eastern Cape Socio-Economic Consultative Council
Eastern Cape Development Corporation
Economic Development, Environmental Affairs and Tourism
Neil Aggett Labour Studies Unit
EASTERN CAPE Economic Review 2016 Quarters 1&2
2
Table of Contents 1. Introducing the Eastern Cape Economic Review ............................................................................. 5
1.1 About the publication ......................................................................................................................... 5
1.2 About the authors ............................................................................................................................... 5
2. Global Review and Outlook .................................................................................................................. 8
2.1 Global Growth Trends ................................................................................................................. 8
2.2 Industrialised Economies ............................................................................................................. 9
2.3 Emerging Economies ................................................................................................................. 10
2.4 Global Outlook ........................................................................................................................... 11
3. Commodities .................................................................................................................................. 13
3.1 World Commodity Indices ......................................................................................................... 13
3.2 Brent Crude Oil .......................................................................................................................... 14
3.3 Gold and Platinum ..................................................................................................................... 15
4. Economic growth ........................................................................................................................... 17
4.1 Gross Domestic Product Growth Trend ..................................................................................... 17
4.2 Regional Comparisons ............................................................................................................... 18
4.3 Eastern Cape Sectoral GDP Growth Drivers .............................................................................. 19
5. Inflation .............................................................................................................................................. 21
5.1 Regional inflation ....................................................................................................................... 21
5.2 Exchange Rates .......................................................................................................................... 23
6. Trade ................................................................................................................................................... 24
6.1 South African trade .................................................................................................................... 24
6.2 Eastern Cape Trade .................................................................................................................... 27
7. South African Ports’ Performance ...................................................................................................... 30
8. National and Regional Investment ...................................................................................................... 33
8.1 Global Foreign Direct Investment climate ................................................................................. 33
8.2 Foreign Direct Investment flows into South Africa from the world, 2015Q2 – 2016Q3 ........... 34
8.3 Foreign Direct Investment flows into Eastern Cape from the world, 2015Q2 – 2016Q3 ......... 36
8.4 South African Gross Fixed Capital Formation (GFCF) ................................................................ 38
9. Labour Market Analysis....................................................................................................................... 40
9.1 Unemployment by age and gender ........................................................................................... 44
9.2 Provincial employment shares by sector, industry and occupation ......................................... 46
3
List of Tables
Table 1: South African trade balance, 2015Q2 – 2016Q2........................................................................... 25
Table 2: South African trade balance by regions, 2016Q1 – 2016Q2 ......................................................... 25
Table 3: Eastern Cape trade balance, 2000 – 2015..................................................................................... 28
Table 4: Foreign direct investment into South Africa by capital investment, jobs created & number of
projects, 2015Q2-2016Q3 ........................................................................................................................... 35
Table 5: Foreign direct investment into country by province measure in millions of US dollars, 2015Q2-
2016Q3 ........................................................................................................................................................ 36
Table 6: Foreign direct investment into Eastern Cape by Sector, no of projects, jobs and capital
Investment, 2012Q2 – 2016Q3 ................................................................................................................... 38
Table 7: South African Gross Fixed Capital Formation by Sector in rand millions (constant 2010 prices),
2015Q1-2016Q2 .......................................................................................................................................... 38
Table 8: Employment by Province, 2015Q1 – 2016Q2 ............................................................................... 40
Table 9: Official Unemployment Rate by Province, 2015Q1 – 2016Q2 ...................................................... 41
4
List of Figures
Figure 1: Growth Trends in Industrialized Economies, 2014Q1 –2016Q2 .................................................. 10
Figure 2: Growth Trends in Emerging Economies, 2014Q1 – 2016Q2 ....................................................... 11
Figure 3: Quarterly World Commodity Indices, 2014Q1 – 2016Q2 ............................................................ 14
Figure 4 Quarterly price of Brent Crude Oil Price, 2014Q1 – 2016Q2 ........................................................ 15
Figure 5: Gold Price, 2014Q1 – 2016Q2 ...................................................................................................... 16
Figure 6: Platinum Price, 2014Q1 – 2016Q2 ............................................................................................... 16
Figure 7: GDP growth for South Africa and for the Eastern Cape at constant 2010 prices, 2014Q1-2016Q2
.................................................................................................................................................................... 17
Figure 8: Comparative regional growth rates for 2010Q1- 2016Q2 ........................................................... 18
Figure 9: GDP growth at constant 2010 prices for 2016Q2 ........................................................................ 21
Figure 10: Inflation Trends for SA and EC, 2014Q1 - 2016Q2 ..................................................................... 22
Figure 11: CPI by Province, 2015Q4 – 2016Q2 ........................................................................................... 23
Figure 12: Trends in South African nominal exchange rates, 2014Q1 – 2016Q2 ....................................... 24
Figure 13: South African exports to African regions & BRIC, 2016Q1 – 2016Q2 ........................................ 26
Figure 14: South African imports from African regions & BRIC, 2016Q1 – 2016Q2 ................................... 27
Figure 15: Eastern Cape export value share by African regions, 2014 – 2015 ........................................... 28
Figure 16: Eastern Cape Top 5 exported commodities to Africa, 2014 – 2015 .......................................... 29
Figure 17: Eastern Cape import value share by African regions, 2014 – 2015 ........................................... 29
Figure 18: Eastern Cape top 5 imported commodities from Africa, 2014 – 2015 ...................................... 30
Figure 19: Cargo handled by province, 2016Q2.......................................................................................... 31
Figure 20: Cargo handled by Eastern Cape ports, 2016Q2 ......................................................................... 31
Figure 21: Cargo handled by province, 2015Q2.......................................................................................... 32
Figure 22: Cargo handled by Eastern Cape ports, 2015Q2 ......................................................................... 32
Figure 23: Foreign direct investment into South Africa by capital Investment and job creation, 2015Q2-
2016Q3 ........................................................................................................................................................ 34
Figure 24: Foreign direct investment into Eastern Cape by capital Investment and job creation, 2015Q2-
2016Q3 ........................................................................................................................................................ 37
Figure 25: South African Gross Fixed Capital Formation by Sector percentage share, 2016Q2 ................ 39
Figure 26: Eastern Cape Quarterly Official and Expanded Unemployment Rates, 2014Q1-2016Q2 ......... 43
Figure 27: Eastern Cape Quarterly Absorption and Expanded Labour Force Participation Rates, 2014Q1-
2016Q2 ........................................................................................................................................................ 44
Figure 28: Eastern Cape Quarterly Official and Expanded Unemployment Rates Among the Youth (19-
24), 2014Q1-2016Q2................................................................................................................................... 45
Figure 29: Eastern Cape Quarterly Official and Expanded Unemployment Rates by Gender, 2014Q1-
2016Q2 ........................................................................................................................................................ 46
Figure 30: Industry Employment Share in the Eastern Cape (2015Q2 – 2016Q2) ..................................... 47
Figure 31: Occupational Employment Share in the Eastern Cape, 2015Q2 – 2016Q2 ............................... 48
5
1. Introducing the Eastern Cape Economic Review
1.1 About the publication
The Eastern Cape Economic Review provides a bi-annual economic overview of the performance
of the Eastern Cape economy. The intention is for readers to be taken on a guided tour of the
latest ‘facts and figures’ of the provincial economy. The publication provides a concise but broad
overview of the provincial socio-economic landscape.
The data used is from a range of sources, but mostly from Statistics South Africa and the South
African Reserve Bank. At times, regionally forecasted data is drawn from Quantec and Global
Insights databases. Every effort has been made to provide the reader with the latest data available.
1.2 About the authors
This publication represents a collaborative research effort from a range of stakeholders within
provincial government. Contributions were received from:
Department of Economic Development Environmental Affairs and Tourism
(DEDEAT)
DEDEAT forms part of the provincial government’s intent to spearhead growth and development
of the provincial economy. Economic development is primarily responsible for administering
sustainable economic policies and developing appropriate strategies to promote business
development and job creation. The Research and Economic Planning Unit develops evidence
based provincial research which informs decision making processes and also ensures accessible
statistical information to inform economic policy and planning processes.
http://www.dedea.gov.za/
Coega Development Corporation (CDC)
The Coega Research unit (CDC-RU) was formed in 2008 initially to provide insight and foresight
to the Coega Development Corporation (CDC) in attracting investors to the Coega IDZ with a
view to attract Foreign Direct Investment (FDI) and improve SA’s balance of trade
6
and competitiveness. Aligned to the CDC vision of bringing economic development to the Eastern
Cape, the CDC-RU has extended its service offering to partner with public entities. CDC-RU
comprises a blend of experienced team with extensive and deep knowledge on global and local
economic and financial issues. The CDC-RU service offering is equally segmented between
internal and external services. http://www.coega.co.za/
Eastern Cape Development Corporation (ECDC)
ECDC is the official economic development and investment agency for the Eastern Cape
Province. It draws its mandate directly from the Eastern Cape Development Corporation Act
(Act 2 of 1997) and is led by the economic development priorities of the provincial government:
to promote sustainable economic development in the Eastern Cape through focusing on
provision of innovative development finance and Leveraging of resources, strategic alliances,
investment and partnerships.
Section 3 of the ECDC Act states that the Corporation shall “plan, finance, co-ordinate, market,
promote and implement development of the Province and its people in the field of industry,
commerce, agriculture, transport and finance.
ECDC renders a variety of services related to the following operational areas:
Property Investments and Development
Business Finance
Risk Capital Facility
Government Funded Programmes (Administered Funds)
Imvaba Co-operative Fund
Business support
Investment and Trade Promotion
Integrated Social Infrastructure Delivery Programme (ISIDP)
For more information visit our website at: http://www.ecdc.co.za/ or call 043 704 5600
Eastern Cape Socio-Economic Consultative Council (ECSECC),
Information and Knowledge Management Programme's main responsibility is to ensure that staff,
stakeholders and the public has access to statistical information, journals, publications
7
and specialist databases to carry out high quality work with maximum impact in the Eastern Cape
and South Africa. The programme also aims to provide access to government information such
as annual and strategic plans, annual reports, Integrated Development Plans and other strategic
documents from municipalities. This information is obtained through networks and partnerships
with government institutions. ECSECC seeks to be a portal for its stakeholders to socio-
economic information about the Eastern Cape and provide cutting edge analysis in all out fields
of work. The Information and Knowledge Management programme is responsible for ensuring
that the necessary systems and platforms are in place for staff and stakeholders to access data
and information from ECSECC. http://www.ecsecc.org/
Neil Aggett Labour Studies Unit, Rhodes University
The Neil Aggett Labour Studies Unit (NALSU) was established in the Institute of Social and
Economic Research (ISER) at Rhodes University as a partnership with the Eastern Cape
Department of Economic Development, Environmental Affairs and Tourism (DEDEAT). NALSU
is an independent, university-based research unit, but contributes to policy development.
Although focused on the Eastern Cape, NALSU actively engages with the wider South African
political economy. The unit operates with a keen awareness of the spatio-temporal context of
the Eastern Cape economy and labour market, including the Eastern Cape’s historical role in the
reproduction of labour for the broader South African economy. NALSU is committed to high-
quality empirical research that deepens our collective understanding of poverty, unemployment
and inequality, and contributes to the building of social agency.
NALSU is actively building and contributing to national and provincial research networks that
straddle labour market research and labour studies. Through critical and engaged scholarship
NALSU hopes to contribute to the building of a more equitable society and a more inclusive form
of social citizenship based on social solidarity.
We hope that the Eastern Cape Economic Review becomes the provincial benchmark for access
to insightful commentary and reliable data on the performance of the provincial economy
8
2. Global Review and Outlook
2.1 Global Growth Trends
The IMF has cut the global forecast for 2017 by 0.1%, to 3.4%. Had it not been for Brexit (Britain’s
exit from the EU), the global forecast would have been slightly higher. Brexit caused a substantial
increase in economic, political and institutional uncertainty for advanced economies, as well as
emerging markets and developing economies, for 2016 and 2017. Global growth is expected to
expand 3.1% in 2016 (IMF, 2016).
Among advanced economies, the UK experienced the largest downward revision in forecasted
growth. While growth in the first part of 2016 appears to have been slightly stronger than
expected, the increase in uncertainty following the referendum is projected to significantly
weaken domestic demand relative to previous forecasts, with growth revised down by about 0.2
percentage points for 2016 and by close to 1% in 2017 (IMF, 2016).
In the Euro area, growth was higher than expected at 2.2% in the first quarter, reflecting strong
domestic demand, including some rebound in investment. While high-frequency indicators point
to some moderation ahead, the growth outlook would have been revised up slightly relative to
April for both 2016 and 2017 were it not for the fallout from the UK referendum (IMF, 2016).
First quarter activity in Japan came in slightly better than expected even though the underlying
momentum in domestic demand remains weak and inflation has dropped. The further
appreciation of the yen in recent months is expected to take a toll on growth in both 2016 and
2017, as a result, the growth forecast for 2016 has been reduced by about 0.2 percentage points,
and the upward revision to growth in 2017 is now projected to be only 0.2 percentage points.
Japan’s growth in 2017 could be higher if, as expected, a supplementary budget for fiscal year
2016 is passed, providing more fiscal support (IMF, 2016).
9
2.2 Industrialised Economies
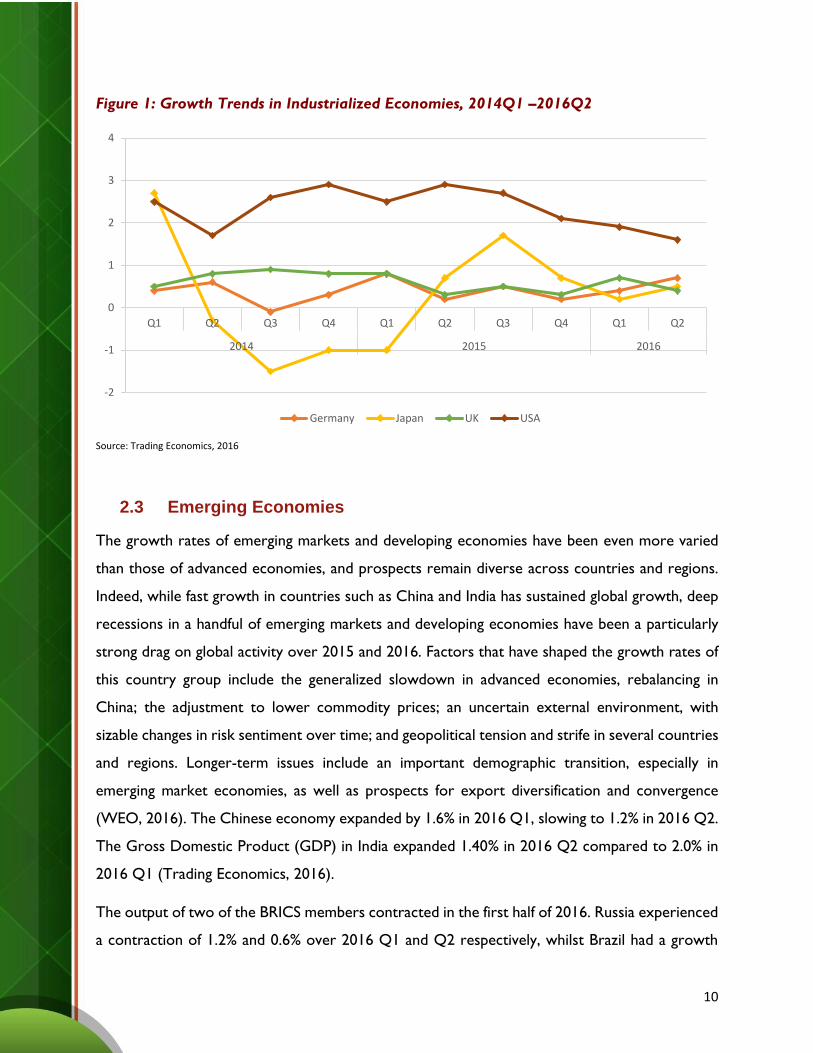
Growth in the US in 2016 Q1 fell to 1.9% from 2.2% in 2015 Q4. In 2016 Q2, the US grew by
1.6%. Global industrial production declined significantly in 2015, contracting 2.5% in Q3 and Q4.
Global industrial production remained subdued but has shown signs of picking-up in recent
months, although trade volumes retreated in the quarter through June after several months of
sustained recovery from the trough of early 2015 (WEO, 2016).
The US economy has lost momentum over the past few quarters, and the expectation of a pick-
up in the second quarter of 2016 has not been realized, with growth estimated at 1.1% at a
seasonally adjusted annual rate. Consumption growth (at about 3.0% on average in the first half
of the year) has remained strong, supported by a firm labour market and expanding payrolls, but
continued weakness in non-residential investment together with a sizable drawdown of
inventories has weighed on the headline growth number. The weakness in business fixed
investment appears to reflect the continued decline in capital spending in the energy sector.
Growth in the Euro area declined to 1.2% at a seasonally adjusted annualized rate in 2016 Q2,
after mild weather and consequent strong construction activity helped boost growth in 2016 Q1
to 2.1 percent (WEO, 2016)
In emerging Asia, robust consumption and a further rotation in activity from industry to services
indicate that rebalancing is progressing along the dimensions of internal demand and supply-side
structure. India’s economy continued to recover strongly, benefiting from a large improvement
in the terms of trade, effective policy actions and stronger external buffers, which have helped
boost sentiment. Activity weakened in sub-Saharan Africa, led by Nigeria, where production was
disrupted by shortages of foreign exchange, militant activity in the Niger Delta, and electricity
blackouts. Momentum in SA was flat, despite the improvements in the external environment,
notably stabilization in China (WEO, 2016).
10
Figure 1: Growth Trends in Industrialized Economies, 2014Q1 –2016Q2
Source: Trading Economics, 2016
2.3 Emerging Economies
The growth rates of emerging markets and developing economies have been even more varied
than those of advanced economies, and prospects remain diverse across countries and regions.
Indeed, while fast growth in countries such as China and India has sustained global growth, deep
recessions in a handful of emerging markets and developing economies have been a particularly
strong drag on global activity over 2015 and 2016. Factors that have shaped the growth rates of
this country group include the generalized slowdown in advanced economies, rebalancing in
China; the adjustment to lower commodity prices; an uncertain external environment, with
sizable changes in risk sentiment over time; and geopolitical tension and strife in several countries
and regions. Longer-term issues include an important demographic transition, especially in
emerging market economies, as well as prospects for export diversification and convergence
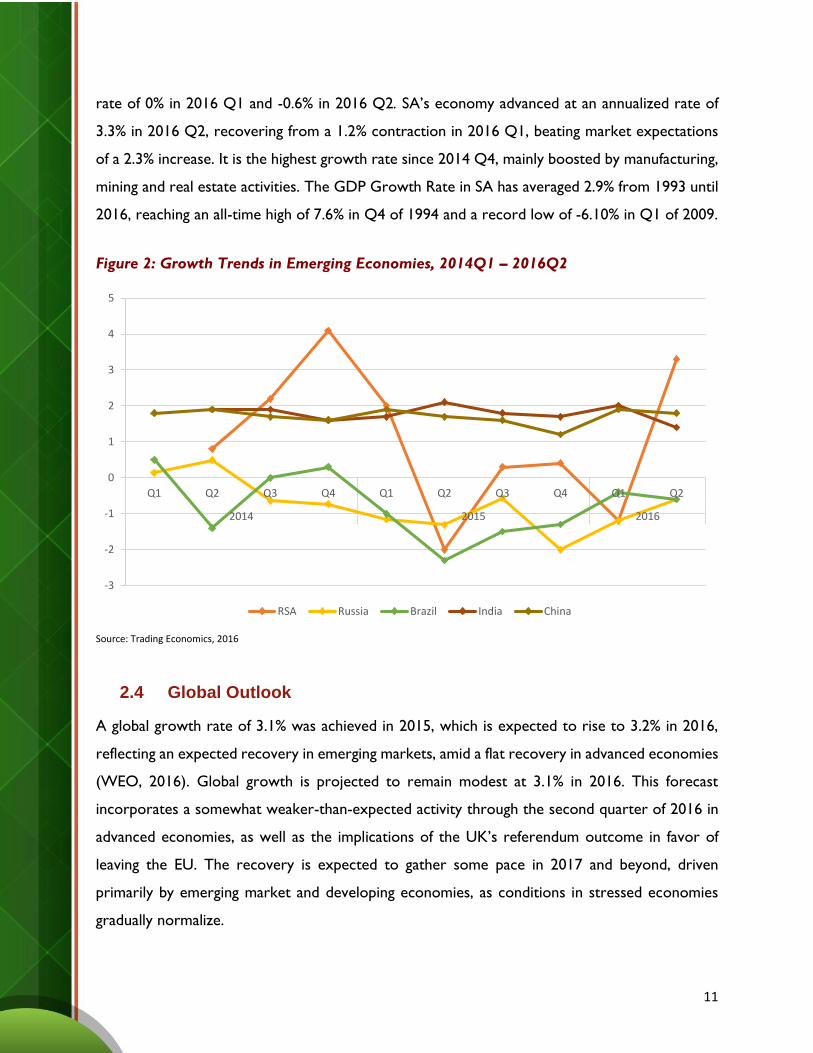
(WEO, 2016). The Chinese economy expanded by 1.6% in 2016 Q1, slowing to 1.2% in 2016 Q2.
The Gross Domestic Product (GDP) in India expanded 1.40% in 2016 Q2 compared to 2.0% in
2016 Q1 (Trading Economics, 2016).
The output of two of the BRICS members contracted in the first half of 2016. Russia experienced
a contraction of 1.2% and 0.6% over 2016 Q1 and Q2 respectively, whilst Brazil had a growth
-2
-1
0
1
2
3
4
Q1 Q2 Q3 Q4 Q1 Q2 Q3 Q4 Q1 Q2
2014 2015 2016
Germany Japan UK USA
11
rate of 0% in 2016 Q1 and -0.6% in 2016 Q2. SA’s economy advanced at an annualized rate of
3.3% in 2016 Q2, recovering from a 1.2% contraction in 2016 Q1, beating market expectations
of a 2.3% increase. It is the highest growth rate since 2014 Q4, mainly boosted by manufacturing,
mining and real estate activities. The GDP Growth Rate in SA has averaged 2.9% from 1993 until
2016, reaching an all-time high of 7.6% in Q4 of 1994 and a record low of -6.10% in Q1 of 2009.
Figure 2: Growth Trends in Emerging Economies, 2014Q1 – 2016Q2
Source: Trading Economics, 2016
2.4 Global Outlook
A global growth rate of 3.1% was achieved in 2015, which is expected to rise to 3.2% in 2016,
reflecting an expected recovery in emerging markets, amid a flat recovery in advanced economies
(WEO, 2016). Global growth is projected to remain modest at 3.1% in 2016. This forecast
incorporates a somewhat weaker-than-expected activity through the second quarter of 2016 in
advanced economies, as well as the implications of the UK’s referendum outcome in favor of
leaving the EU. The recovery is expected to gather some pace in 2017 and beyond, driven
primarily by emerging market and developing economies, as conditions in stressed economies
gradually normalize.
-3
-2
-1
0
1
2
3
4
5
Q1 Q2 Q3 Q4 Q1 Q2 Q3 Q4 Q1 Q2
2014 2015 2016
RSA Russia Brazil India China

12
Growth in emerging market and developing economies is expected to strengthen in 2016 to 4.2%
after five consecutive years of decline, accounting for over three-quarters of projected world
growth in 2016. However, despite an improvement in external financing conditions, their outlook
is uneven and generally weaker than in the past. A combination of factors can account for this
weakness: a slowdown in China, whose spillovers are magnified by its lower reliance on import-
and resource-intensive investment; continued adjustment to structurally lower commodity
revenues in a number of commodity exporters; spillovers from persistently weak demand from
advanced economies; and domestic strife, political discord and geopolitical tensions in a number
of countries (WEO, 2016).
According to the WEO projections, growth in advanced economies is expected to remain at
1.9% in 2016. Output will rise in emerging markets and developing economies over 2016 and
2017 from 4.1% to 4.6%, up from 4.0% in 2015 according to the WEO. In major advanced
economies, the recovery is forecast to slow this year, with growth projected at 1.6% in 2016,
0.5% lower than in 2015. This subdued outlook is shaped by a number of common forces,
including legacies of the 2008 global financial crisis. Economic, political and institutional
uncertainty following the Brexit vote is also expected to have some negative macro-economic
consequences, especially in advanced European economies (WEO, 2016).
The projected increase in global growth in 2017 to 3.4% hinges crucially on rising growth in
emerging markets and developing economies, where the waning of downward pressures on
activity in countries in recession in 2016, such as Brazil, Nigeria, and Russia, is expected to more
than make up for the steady slowdown in growth in China. In advanced economies, growth is
projected to pick up modestly to 1.8%, reflecting primarily a strengthening of the recovery in the
US and Canada and a rebound in Japan due to the recent fiscal stimulus. In contrast, growth is
projected to be lower in the Euro area and the UK, due to the macro-economic repercussions
of heightened uncertainty in the aftermath of the UK referendum (WEO, 2016).
13
3. Commodities
3.1 World Commodity Indices
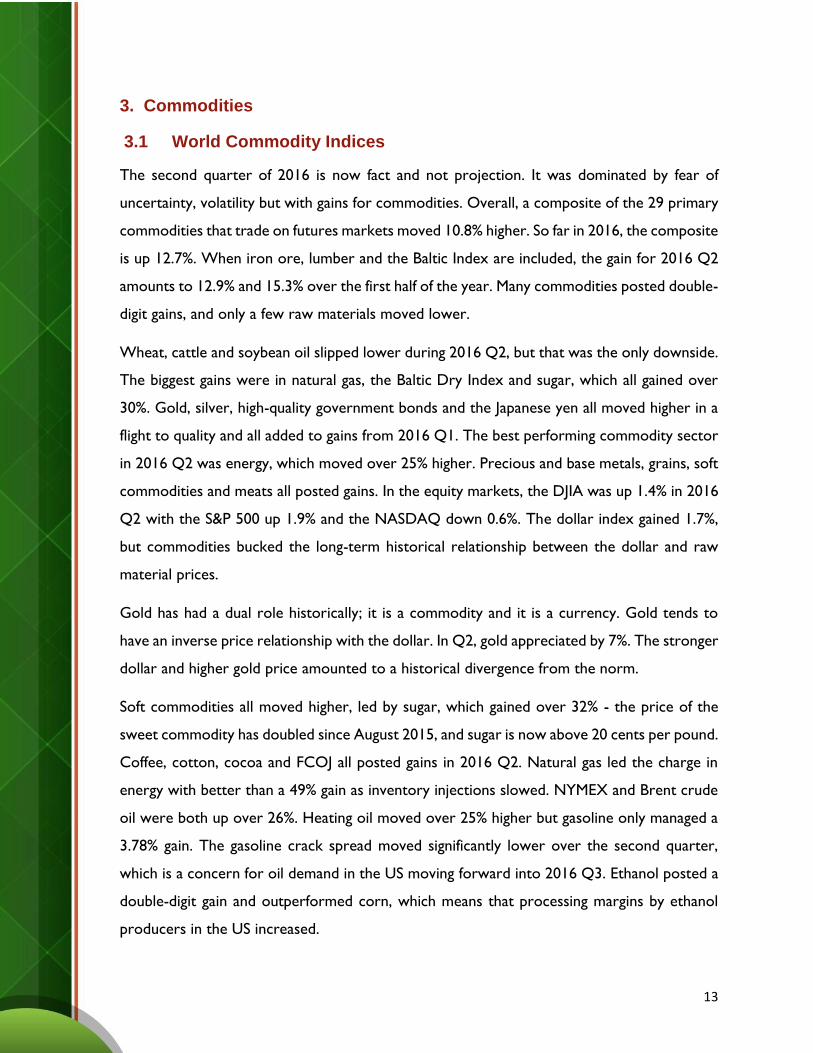
The second quarter of 2016 is now fact and not projection. It was dominated by fear of
uncertainty, volatility but with gains for commodities. Overall, a composite of the 29 primary
commodities that trade on futures markets moved 10.8% higher. So far in 2016, the composite
is up 12.7%. When iron ore, lumber and the Baltic Index are included, the gain for 2016 Q2
amounts to 12.9% and 15.3% over the first half of the year. Many commodities posted double-
digit gains, and only a few raw materials moved lower.
Wheat, cattle and soybean oil slipped lower during 2016 Q2, but that was the only downside.
The biggest gains were in natural gas, the Baltic Dry Index and sugar, which all gained over
30%. Gold, silver, high-quality government bonds and the Japanese yen all moved higher in a
flight to quality and all added to gains from 2016 Q1. The best performing commodity sector
in 2016 Q2 was energy, which moved over 25% higher. Precious and base metals, grains, soft
commodities and meats all posted gains. In the equity markets, the DJIA was up 1.4% in 2016
Q2 with the S&P 500 up 1.9% and the NASDAQ down 0.6%. The dollar index gained 1.7%,
but commodities bucked the long-term historical relationship between the dollar and raw
material prices.
Gold has had a dual role historically; it is a commodity and it is a currency. Gold tends to
have an inverse price relationship with the dollar. In Q2, gold appreciated by 7%. The stronger
dollar and higher gold price amounted to a historical divergence from the norm.
Soft commodities all moved higher, led by sugar, which gained over 32% - the price of the
sweet commodity has doubled since August 2015, and sugar is now above 20 cents per pound.
Coffee, cotton, cocoa and FCOJ all posted gains in 2016 Q2. Natural gas led the charge in
energy with better than a 49% gain as inventory injections slowed. NYMEX and Brent crude
oil were both up over 26%. Heating oil moved over 25% higher but gasoline only managed a
3.78% gain. The gasoline crack spread moved significantly lower over the second quarter,
which is a concern for oil demand in the US moving forward into 2016 Q3. Ethanol posted a
double-digit gain and outperformed corn, which means that processing margins by ethanol
producers in the US increased.
14
Figure 3: Quarterly World Commodity Indices, 2014Q1 – 2016Q2
Source: Quantec Easydat
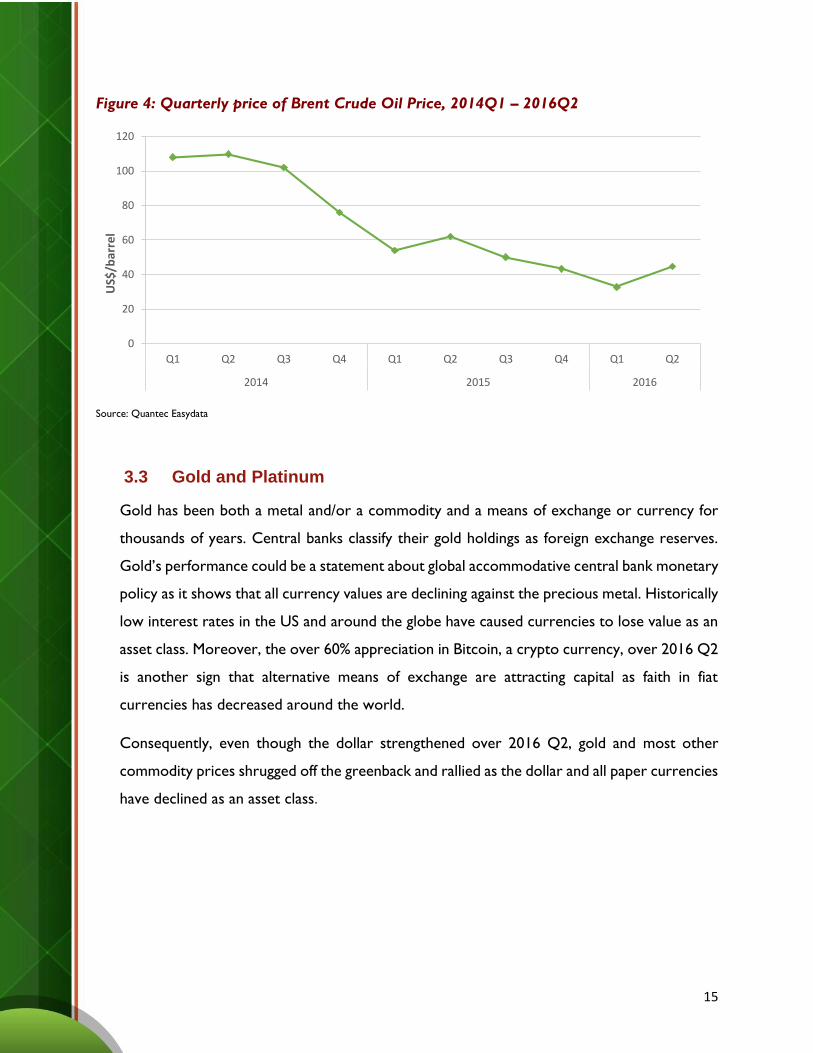
3.2 Brent Crude Oil
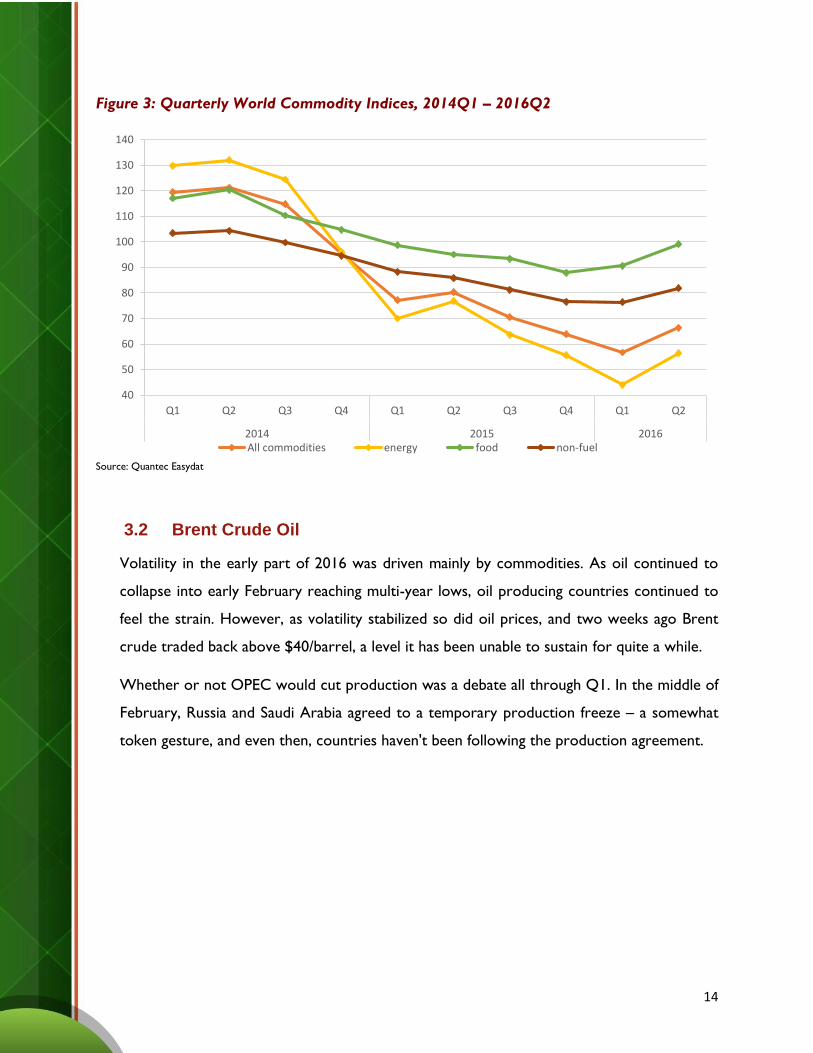
Volatility in the early part of 2016 was driven mainly by commodities. As oil continued to
collapse into early February reaching multi-year lows, oil producing countries continued to
feel the strain. However, as volatility stabilized so did oil prices, and two weeks ago Brent
crude traded back above $40/barrel, a level it has been unable to sustain for quite a while.
Whether or not OPEC would cut production was a debate all through Q1. In the middle of
February, Russia and Saudi Arabia agreed to a temporary production freeze – a somewhat
token gesture, and even then, countries haven't been following the production agreement.
40
50
60
70
80
90
100
110
120
130
140
Q1 Q2 Q3 Q4 Q1 Q2 Q3 Q4 Q1 Q2
2014 2015 2016All commodities energy food non-fuel
15
Figure 4: Quarterly price of Brent Crude Oil Price, 2014Q1 – 2016Q2
Source: Quantec Easydata
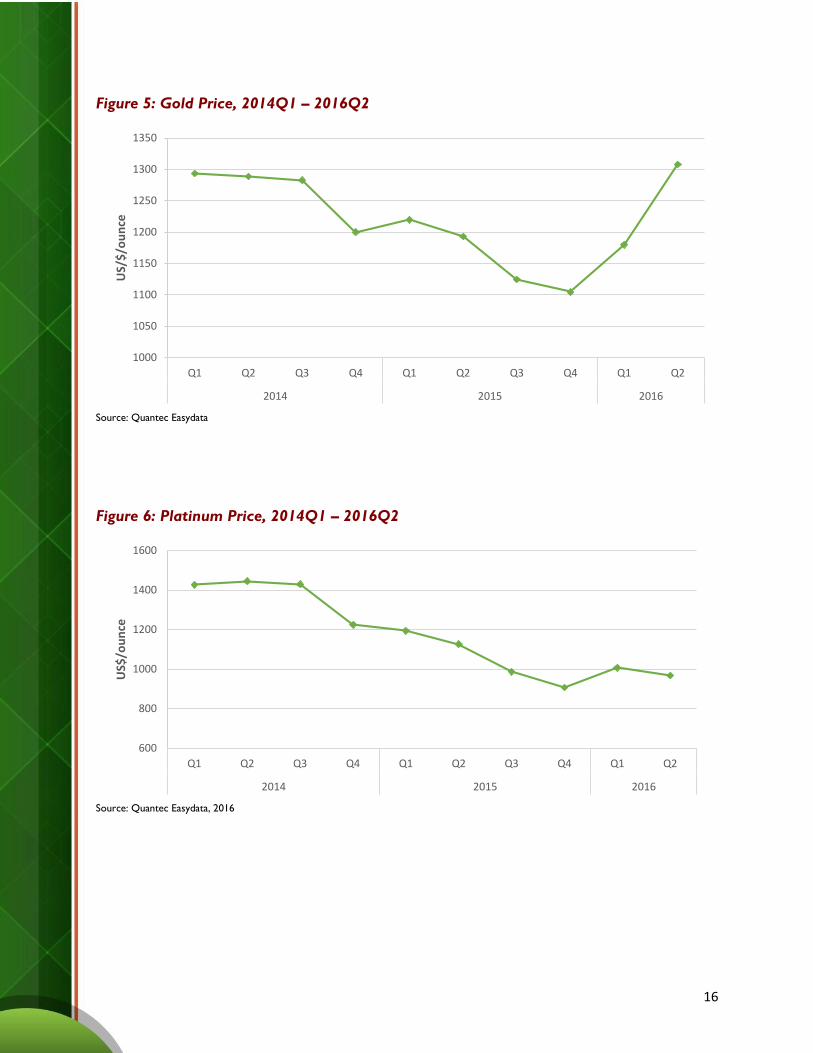
3.3 Gold and Platinum
Gold has been both a metal and/or a commodity and a means of exchange or currency for
thousands of years. Central banks classify their gold holdings as foreign exchange reserves.
Gold’s performance could be a statement about global accommodative central bank monetary
policy as it shows that all currency values are declining against the precious metal. Historically
low interest rates in the US and around the globe have caused currencies to lose value as an
asset class. Moreover, the over 60% appreciation in Bitcoin, a crypto currency, over 2016 Q2
is another sign that alternative means of exchange are attracting capital as faith in fiat
currencies has decreased around the world.
Consequently, even though the dollar strengthened over 2016 Q2, gold and most other
commodity prices shrugged off the greenback and rallied as the dollar and all paper currencies
have declined as an asset class.
0
20
40
60
80
100
120
Q1 Q2 Q3 Q4 Q1 Q2 Q3 Q4 Q1 Q2
2014 2015 2016
US$
/bar
rel
16
Figure 5: Gold Price, 2014Q1 – 2016Q2
Source: Quantec Easydata
Figure 6: Platinum Price, 2014Q1 – 2016Q2
Source: Quantec Easydata, 2016
1000
1050
1100
1150
1200
1250
1300
1350
Q1 Q2 Q3 Q4 Q1 Q2 Q3 Q4 Q1 Q2
2014 2015 2016
US/
$/o
un
ce
600
800
1000
1200
1400
1600
Q1 Q2 Q3 Q4 Q1 Q2 Q3 Q4 Q1 Q2
2014 2015 2016
US$
/ou
nce
17
4. Economic growth
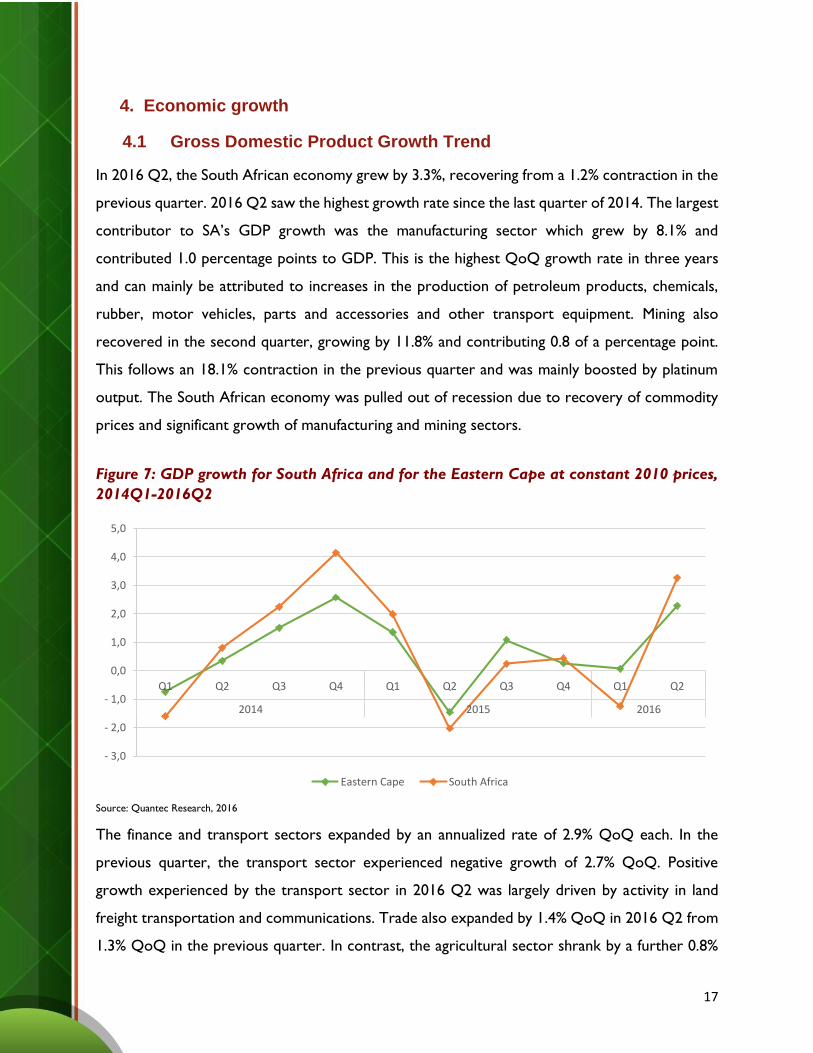
4.1 Gross Domestic Product Growth Trend
In 2016 Q2, the South African economy grew by 3.3%, recovering from a 1.2% contraction in the
previous quarter. 2016 Q2 saw the highest growth rate since the last quarter of 2014. The largest
contributor to SA’s GDP growth was the manufacturing sector which grew by 8.1% and
contributed 1.0 percentage points to GDP. This is the highest QoQ growth rate in three years
and can mainly be attributed to increases in the production of petroleum products, chemicals,
rubber, motor vehicles, parts and accessories and other transport equipment. Mining also
recovered in the second quarter, growing by 11.8% and contributing 0.8 of a percentage point.
This follows an 18.1% contraction in the previous quarter and was mainly boosted by platinum
output. The South African economy was pulled out of recession due to recovery of commodity
prices and significant growth of manufacturing and mining sectors.
Figure 7: GDP growth for South Africa and for the Eastern Cape at constant 2010 prices,
2014Q1-2016Q2
Source: Quantec Research, 2016
The finance and transport sectors expanded by an annualized rate of 2.9% QoQ each. In the
previous quarter, the transport sector experienced negative growth of 2.7% QoQ. Positive
growth experienced by the transport sector in 2016 Q2 was largely driven by activity in land
freight transportation and communications. Trade also expanded by 1.4% QoQ in 2016 Q2 from
1.3% QoQ in the previous quarter. In contrast, the agricultural sector shrank by a further 0.8%
- 3,0
- 2,0
- 1,0
0,0
1,0
2,0
3,0
4,0
5,0
Q1 Q2 Q3 Q4 Q1 Q2 Q3 Q4 Q1 Q2
2014 2015 2016
Eastern Cape South Africa
18
QoQ, following a 6.5% decline in the previous period. This was the sixth consecutive quarter of
contraction due to the severe droughts.
The EC GDP expanded by an annualized rate of 2.3% QoQ in 2016 Q2, following a 0.1% QoQ
growth in the previous quarter. This was the highest GDP growth since the last quarter of 2014.
However, growth in the EC was below that of SA as a whole. The largest contributions to the
2.3% QoQ expansion in GDP in the EC economy were: the manufacturing sector contributing
1.1 percentage points based on a growth of 8.2%; the finance sector contributing 0.5 of a
percentage point based on a growth of 2.3%, and the transport sector contributing 0.3 of a
percentage point based on a growth of 3.0%. The sectors that contributed negatively to GDP
growth were electricity (-1.1%) and construction (-0.1%). However, year on year (yoy), GDP
growth for the EC experienced a positive growth of 0.9% in 2Q2016, up from 0.0% in 2016 Q1.
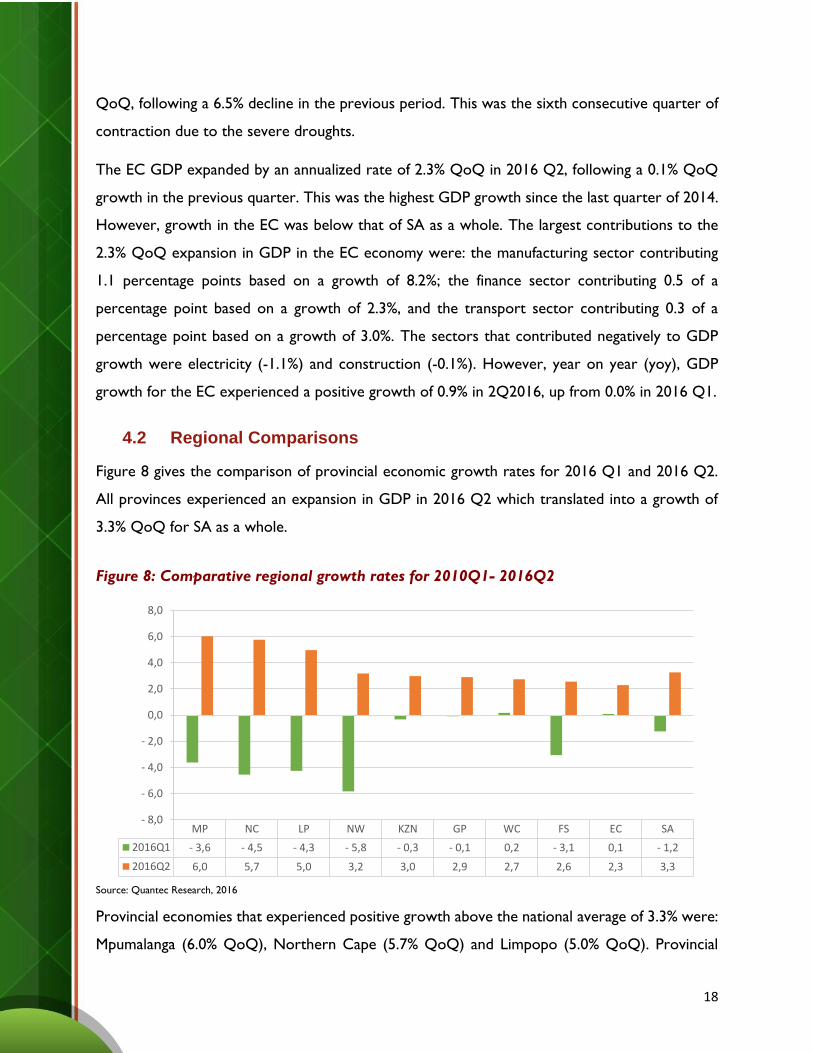
4.2 Regional Comparisons
Figure 8 gives the comparison of provincial economic growth rates for 2016 Q1 and 2016 Q2.
All provinces experienced an expansion in GDP in 2016 Q2 which translated into a growth of
3.3% QoQ for SA as a whole.
Figure 8: Comparative regional growth rates for 2010Q1- 2016Q2
Source: Quantec Research, 2016
Provincial economies that experienced positive growth above the national average of 3.3% were:
Mpumalanga (6.0% QoQ), Northern Cape (5.7% QoQ) and Limpopo (5.0% QoQ). Provincial
MP NC LP NW KZN GP WC FS EC SA
2016Q1 - 3,6 - 4,5 - 4,3 - 5,8 - 0,3 - 0,1 0,2 - 3,1 0,1 - 1,2
2016Q2 6,0 5,7 5,0 3,2 3,0 2,9 2,7 2,6 2,3 3,3
- 8,0
- 6,0
- 4,0
- 2,0
0,0
2,0
4,0
6,0
8,0
19
economies that experienced positive growth below the national average of 3.3% were: North
West (3.2% QoQ), Kwa-Zulu Natal (3.0% QoQ), Gauteng (2.9% QoQ), Western Cape (2.7%),
Free State (2.6% QoQ) and EC (2.3% QoQ). Mpumalanga recorded the highest GDP growth of
6.0% QoQ and the EC recorded the lowest GDP growth of 2.3%.
4.3 Eastern Cape Sectoral GDP Growth Drivers
In 2016 Q2, GDP growth QoQ in the EC was driven by all three major sectors, the primary
sector, the secondary sector and the tertiary sector.
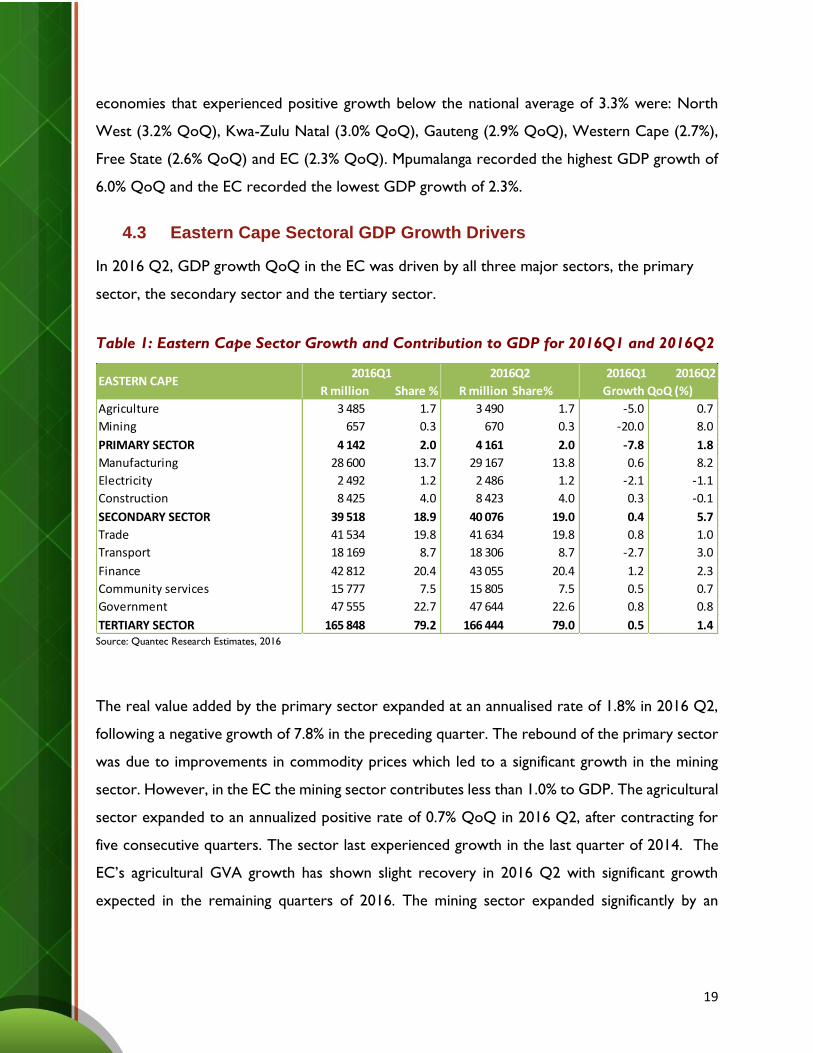
Table 1: Eastern Cape Sector Growth and Contribution to GDP for 2016Q1 and 2016Q2
Source: Quantec Research Estimates, 2016
The real value added by the primary sector expanded at an annualised rate of 1.8% in 2016 Q2,
following a negative growth of 7.8% in the preceding quarter. The rebound of the primary sector
was due to improvements in commodity prices which led to a significant growth in the mining
sector. However, in the EC the mining sector contributes less than 1.0% to GDP. The agricultural
sector expanded to an annualized positive rate of 0.7% QoQ in 2016 Q2, after contracting for
five consecutive quarters. The sector last experienced growth in the last quarter of 2014. The
EC’s agricultural GVA growth has shown slight recovery in 2016 Q2 with significant growth
expected in the remaining quarters of 2016. The mining sector expanded significantly by an
2016Q1 2016Q2
R million Share % R million Share%
Agriculture 3 485 1.7 3 490 1.7 -5.0 0.7
Mining 657 0.3 670 0.3 -20.0 8.0
PRIMARY SECTOR 4 142 2.0 4 161 2.0 -7.8 1.8
Manufacturing 28 600 13.7 29 167 13.8 0.6 8.2
Electricity 2 492 1.2 2 486 1.2 -2.1 -1.1
Construction 8 425 4.0 8 423 4.0 0.3 -0.1
SECONDARY SECTOR 39 518 18.9 40 076 19.0 0.4 5.7
Trade 41 534 19.8 41 634 19.8 0.8 1.0
Transport 18 169 8.7 18 306 8.7 -2.7 3.0
Finance 42 812 20.4 43 055 20.4 1.2 2.3
Community services 15 777 7.5 15 805 7.5 0.5 0.7
Government 47 555 22.7 47 644 22.6 0.8 0.8
TERTIARY SECTOR 165 848 79.2 166 444 79.0 0.5 1.4
EASTERN CAPE2016Q1 2016Q2
Growth QoQ (%)
20
annualize rate of 8.0% QoQ in 2016 Q2, following a negative growth of 20.0% QoQ in the
preceding quarter.
The secondary sector expanded by an annualize rate of 5.7% QoQ in 2016 Q2, following a low
growth of 0.4% QoQ in the previous quarter. This sector experienced the highest growth out of
the three main sectors. The main driver of the secondary sector was the manufacturing sector,
whereas the electricity and construction sectors contracted. The real value added by the
manufacturing sector expanded by 8.2% in 2016 Q2, following growth of only 0.6% in the
preceding quarter. The tertiary sector grew at an annualized rate of 1.4% QoQ in 2016 Q2, up
from a growth of 0.5% QoQ in the preceding quarter. The real value added by the transport
sector expanded at an annualized rate of 3.0% QoQ in 2016 Q2, up from a negative growth of
2.7% QoQ in 2016 Q1.
The finance sector grew by 2.3% QoQ in 2016 Q2 compared to a low 1.2% growth in the
preceding quarter. Growth in the real value added by the trade and community services sectors
expanded at an annualized rate of 1.0% QoQ and 0.7% QoQ respectively. The government sector
was the only sector within the tertiary sector where growth remained the same as in the previous
quarter, at a positive 0.8% QoQ. The sectors that contributed the most towards GDP in the EC
economy in 2016 Q2 were the government sector (22.6%), followed by the finance sector
(20.4%), trade sector (19.8%) and manufacturing sector (13.8%).
21
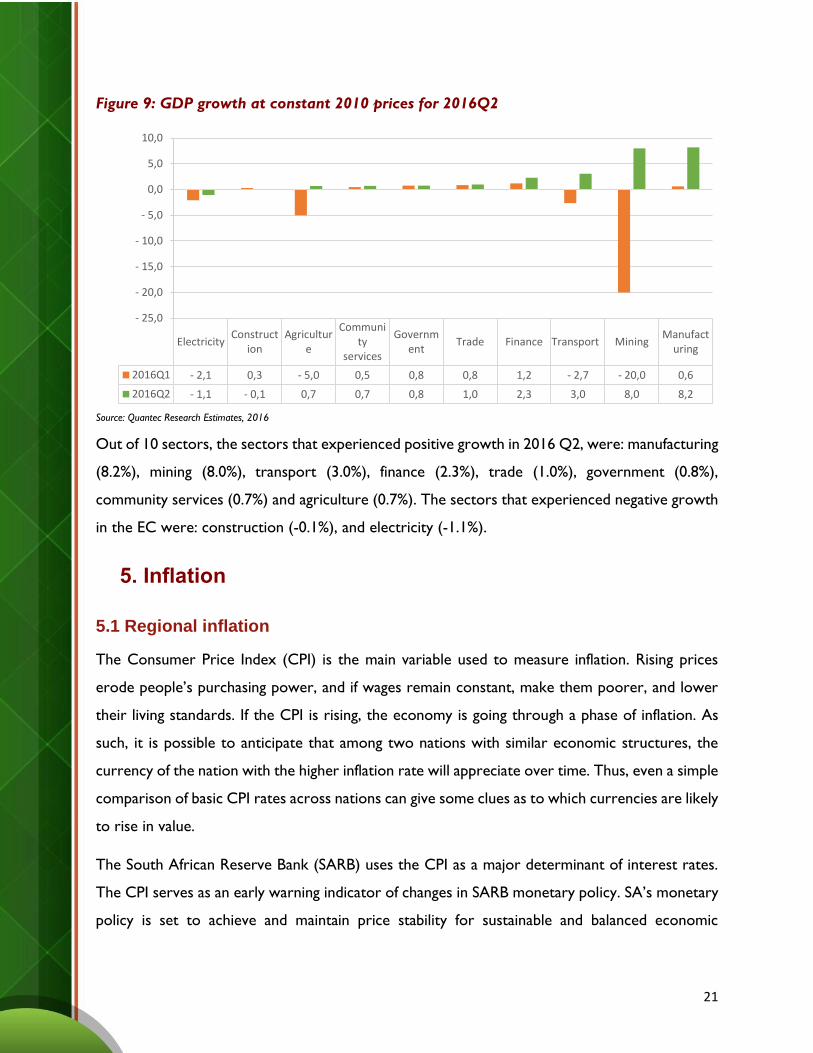
Figure 9: GDP growth at constant 2010 prices for 2016Q2
Source: Quantec Research Estimates, 2016
Out of 10 sectors, the sectors that experienced positive growth in 2016 Q2, were: manufacturing
(8.2%), mining (8.0%), transport (3.0%), finance (2.3%), trade (1.0%), government (0.8%),
community services (0.7%) and agriculture (0.7%). The sectors that experienced negative growth
in the EC were: construction (-0.1%), and electricity (-1.1%).
5. Inflation
5.1 Regional inflation
The Consumer Price Index (CPI) is the main variable used to measure inflation. Rising prices
erode people’s purchasing power, and if wages remain constant, make them poorer, and lower
their living standards. If the CPI is rising, the economy is going through a phase of inflation. As
such, it is possible to anticipate that among two nations with similar economic structures, the
currency of the nation with the higher inflation rate will appreciate over time. Thus, even a simple
comparison of basic CPI rates across nations can give some clues as to which currencies are likely
to rise in value.
The South African Reserve Bank (SARB) uses the CPI as a major determinant of interest rates.
The CPI serves as an early warning indicator of changes in SARB monetary policy. SA’s monetary
policy is set to achieve and maintain price stability for sustainable and balanced economic
ElectricityConstruct
ionAgricultur
e
Community
services
Government
Trade Finance Transport MiningManufact
uring
2016Q1 - 2,1 0,3 - 5,0 0,5 0,8 0,8 1,2 - 2,7 - 20,0 0,6
2016Q2 - 1,1 - 0,1 0,7 0,7 0,8 1,0 2,3 3,0 8,0 8,2
- 25,0
- 20,0
- 15,0
- 10,0
- 5,0
0,0
5,0
10,0
22
development and growth. When SARB maintains price stability, uncertainty is reduced in the
economy and this provides a favourable environment for growth and employment creation.
SARB’s monetary policy is based on an inflation target of 3.0% to 6.0%. Lower inflation contributes
to the protection of the purchasing power of all South Africans, particularly the poor who have
no means of defending themselves against continually rising prices.
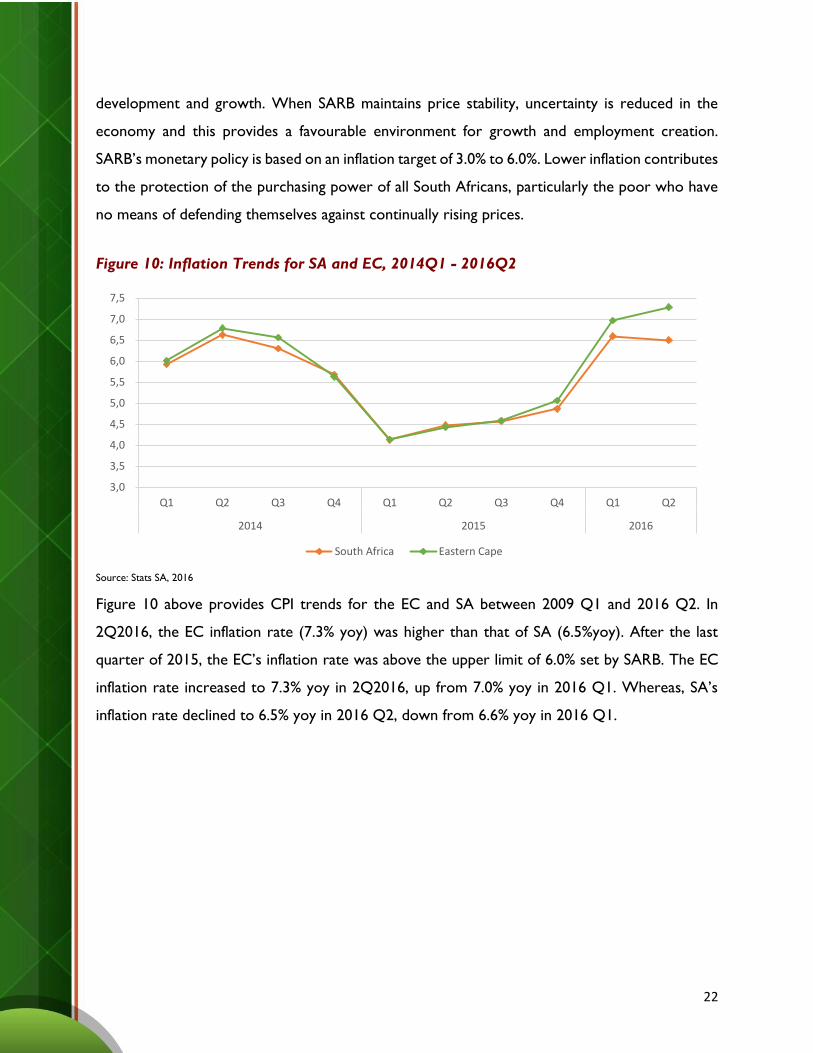
Figure 10: Inflation Trends for SA and EC, 2014Q1 - 2016Q2
Source: Stats SA, 2016
Figure 10 above provides CPI trends for the EC and SA between 2009 Q1 and 2016 Q2. In
2Q2016, the EC inflation rate (7.3% yoy) was higher than that of SA (6.5%yoy). After the last
quarter of 2015, the EC’s inflation rate was above the upper limit of 6.0% set by SARB. The EC
inflation rate increased to 7.3% yoy in 2Q2016, up from 7.0% yoy in 2016 Q1. Whereas, SA’s
inflation rate declined to 6.5% yoy in 2016 Q2, down from 6.6% yoy in 2016 Q1.
3,0
3,5
4,0
4,5
5,0
5,5
6,0
6,5
7,0
7,5
Q1 Q2 Q3 Q4 Q1 Q2 Q3 Q4 Q1 Q2
2014 2015 2016
South Africa Eastern Cape
23
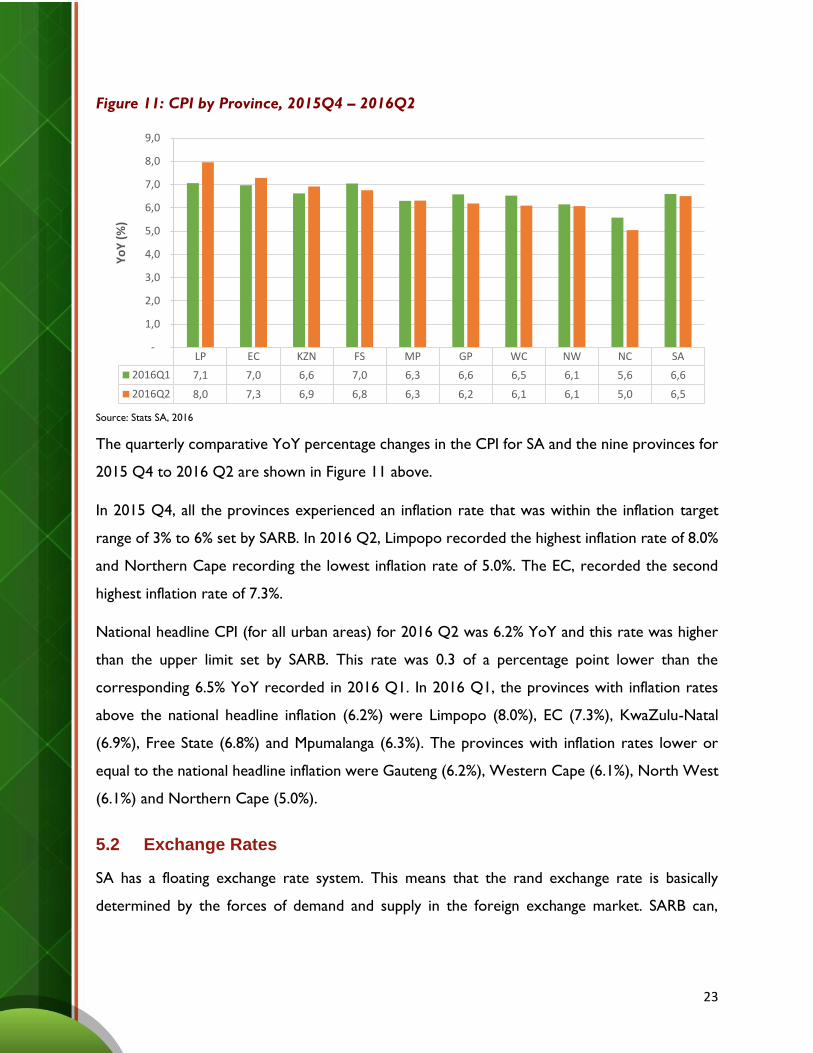
Figure 11: CPI by Province, 2015Q4 – 2016Q2
Source: Stats SA, 2016
The quarterly comparative YoY percentage changes in the CPI for SA and the nine provinces for
2015 Q4 to 2016 Q2 are shown in Figure 11 above.
In 2015 Q4, all the provinces experienced an inflation rate that was within the inflation target
range of 3% to 6% set by SARB. In 2016 Q2, Limpopo recorded the highest inflation rate of 8.0%
and Northern Cape recording the lowest inflation rate of 5.0%. The EC, recorded the second
highest inflation rate of 7.3%.
National headline CPI (for all urban areas) for 2016 Q2 was 6.2% YoY and this rate was higher
than the upper limit set by SARB. This rate was 0.3 of a percentage point lower than the
corresponding 6.5% YoY recorded in 2016 Q1. In 2016 Q1, the provinces with inflation rates
above the national headline inflation (6.2%) were Limpopo (8.0%), EC (7.3%), KwaZulu-Natal
(6.9%), Free State (6.8%) and Mpumalanga (6.3%). The provinces with inflation rates lower or
equal to the national headline inflation were Gauteng (6.2%), Western Cape (6.1%), North West
(6.1%) and Northern Cape (5.0%).
5.2 Exchange Rates
SA has a floating exchange rate system. This means that the rand exchange rate is basically
determined by the forces of demand and supply in the foreign exchange market. SARB can,
LP EC KZN FS MP GP WC NW NC SA
2016Q1 7,1 7,0 6,6 7,0 6,3 6,6 6,5 6,1 5,6 6,6
2016Q2 8,0 7,3 6,9 6,8 6,3 6,2 6,1 6,1 5,0 6,5
-
1,0
2,0
3,0
4,0
5,0
6,0
7,0
8,0
9,0
Yo
Y (
%)
24
however, participate in this market by buying or selling other currencies. At present, the policy
is generally to stay out of the market and to allow market forces to determine the exchange rate.
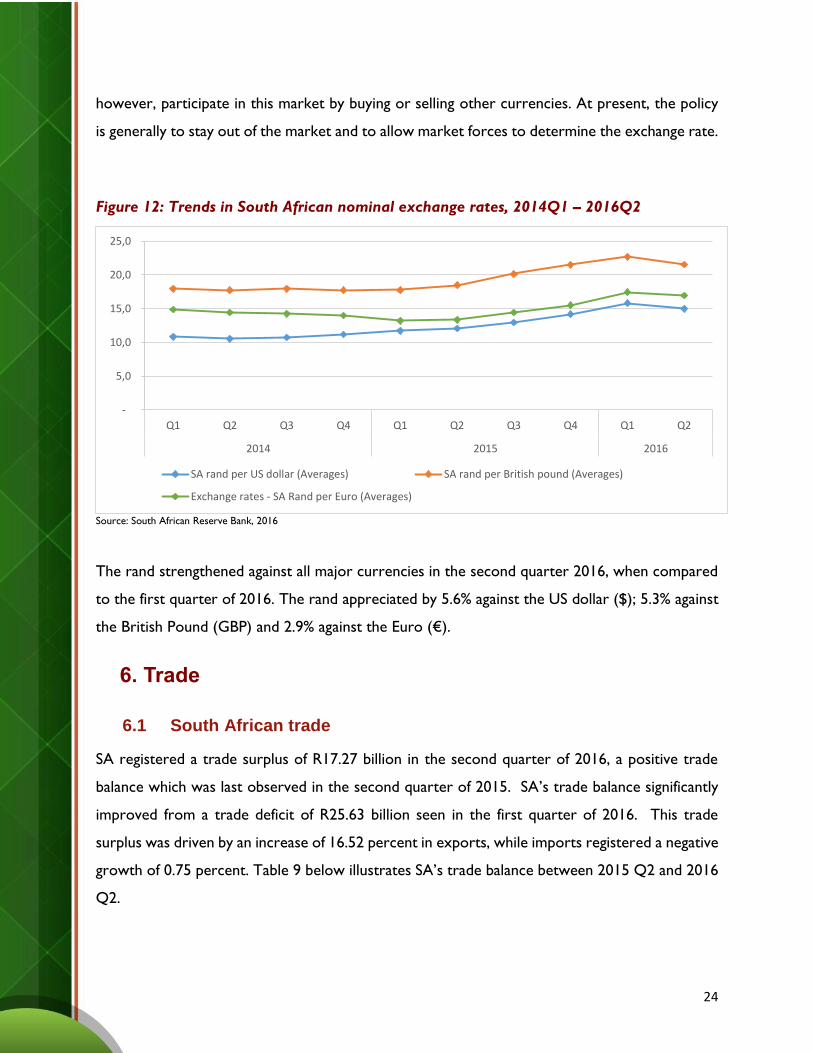
Figure 12: Trends in South African nominal exchange rates, 2014Q1 – 2016Q2
Source: South African Reserve Bank, 2016
The rand strengthened against all major currencies in the second quarter 2016, when compared
to the first quarter of 2016. The rand appreciated by 5.6% against the US dollar ($); 5.3% against
the British Pound (GBP) and 2.9% against the Euro (€).
6. Trade
6.1 South African trade
SA registered a trade surplus of R17.27 billion in the second quarter of 2016, a positive trade
balance which was last observed in the second quarter of 2015. SA’s trade balance significantly
improved from a trade deficit of R25.63 billion seen in the first quarter of 2016. This trade
surplus was driven by an increase of 16.52 percent in exports, while imports registered a negative
growth of 0.75 percent. Table 9 below illustrates SA’s trade balance between 2015 Q2 and 2016
Q2.
-
5,0
10,0
15,0
20,0
25,0
Q1 Q2 Q3 Q4 Q1 Q2 Q3 Q4 Q1 Q2
2014 2015 2016
SA rand per US dollar (Averages) SA rand per British pound (Averages)
Exchange rates - SA Rand per Euro (Averages)
25
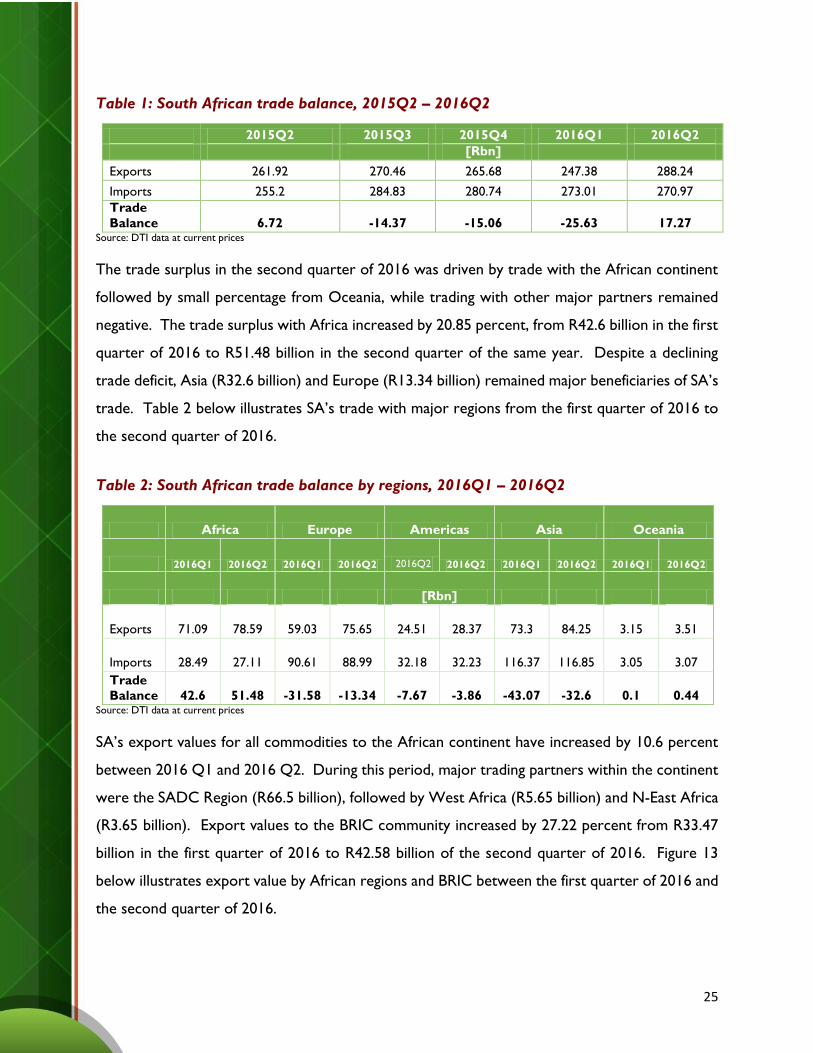
Table 1: South African trade balance, 2015Q2 – 2016Q2
2015Q2 2015Q3 2015Q4 2016Q1 2016Q2
[Rbn]
Exports 261.92 270.46 265.68 247.38 288.24
Imports 255.2 284.83 280.74 273.01 270.97
Trade
Balance 6.72 -14.37 -15.06 -25.63 17.27 Source: DTI data at current prices
The trade surplus in the second quarter of 2016 was driven by trade with the African continent
followed by small percentage from Oceania, while trading with other major partners remained
negative. The trade surplus with Africa increased by 20.85 percent, from R42.6 billion in the first
quarter of 2016 to R51.48 billion in the second quarter of the same year. Despite a declining
trade deficit, Asia (R32.6 billion) and Europe (R13.34 billion) remained major beneficiaries of SA’s
trade. Table 2 below illustrates SA’s trade with major regions from the first quarter of 2016 to
the second quarter of 2016.
Table 2: South African trade balance by regions, 2016Q1 – 2016Q2
Africa Europe Americas Asia Oceania
2016Q1 2016Q2 2016Q1 2016Q2 2016Q2 2016Q2 2016Q1 2016Q2 2016Q1 2016Q2
[Rbn]
Exports 71.09 78.59 59.03 75.65 24.51 28.37 73.3 84.25 3.15 3.51
Imports 28.49 27.11 90.61 88.99 32.18 32.23 116.37 116.85 3.05 3.07
Trade
Balance 42.6 51.48 -31.58 -13.34 -7.67 -3.86 -43.07 -32.6 0.1 0.44 Source: DTI data at current prices
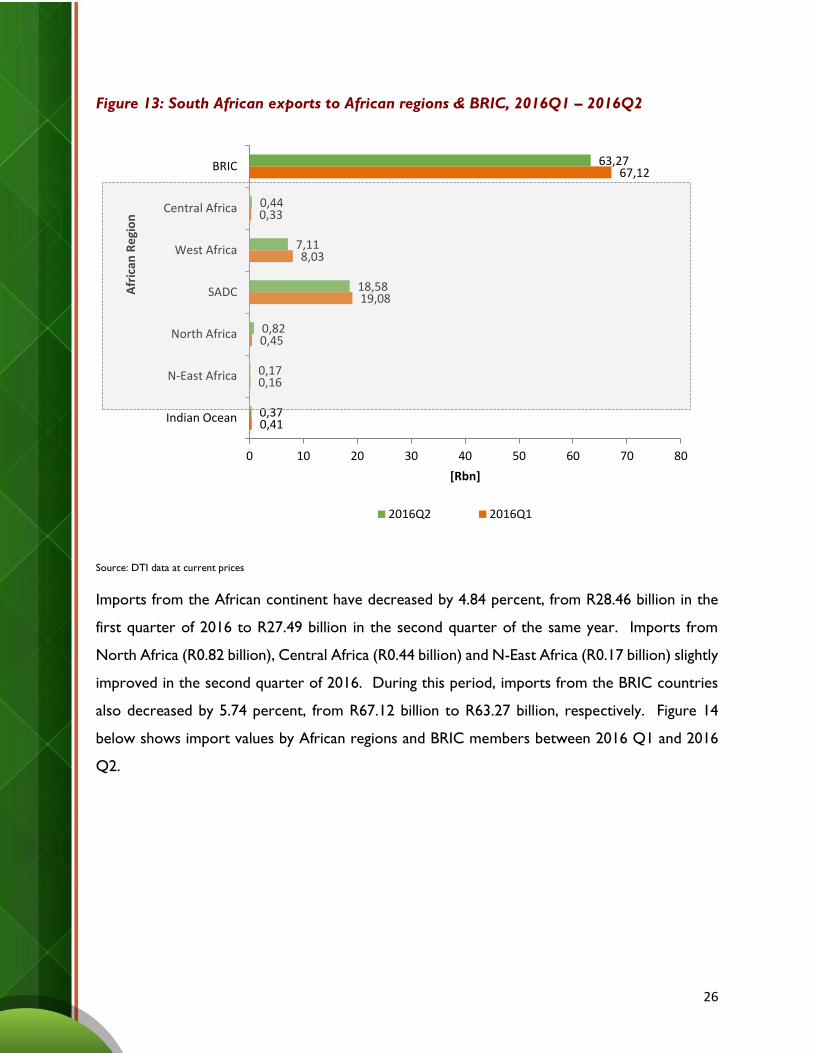
SA’s export values for all commodities to the African continent have increased by 10.6 percent
between 2016 Q1 and 2016 Q2. During this period, major trading partners within the continent
were the SADC Region (R66.5 billion), followed by West Africa (R5.65 billion) and N-East Africa
(R3.65 billion). Export values to the BRIC community increased by 27.22 percent from R33.47
billion in the first quarter of 2016 to R42.58 billion of the second quarter of 2016. Figure 13
below illustrates export value by African regions and BRIC between the first quarter of 2016 and
the second quarter of 2016.
26
Figure 13: South African exports to African regions & BRIC, 2016Q1 – 2016Q2
Source: DTI data at current prices
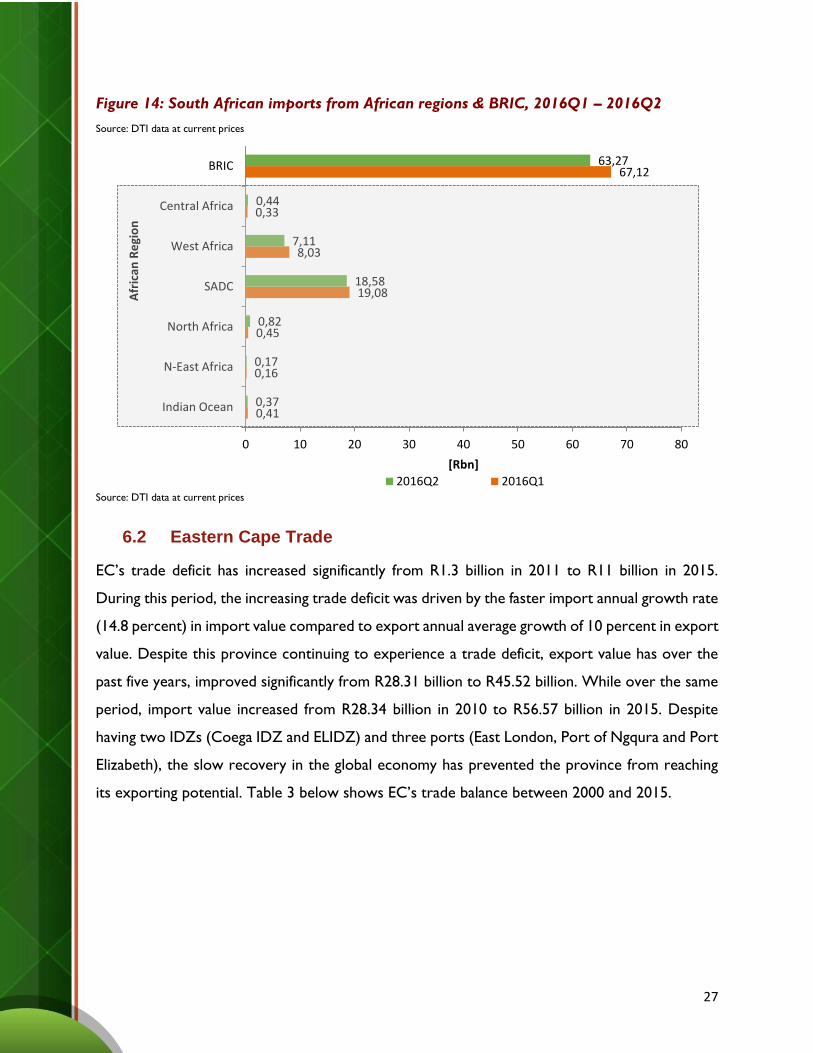
Imports from the African continent have decreased by 4.84 percent, from R28.46 billion in the
first quarter of 2016 to R27.49 billion in the second quarter of the same year. Imports from
North Africa (R0.82 billion), Central Africa (R0.44 billion) and N-East Africa (R0.17 billion) slightly
improved in the second quarter of 2016. During this period, imports from the BRIC countries
also decreased by 5.74 percent, from R67.12 billion to R63.27 billion, respectively. Figure 14
below shows import values by African regions and BRIC members between 2016 Q1 and 2016
Q2.
0,41
0,16
0,45
19,08
8,03
0,33
67,12
0,37
0,17
0,82
18,58
7,11
0,44
63,27
0 10 20 30 40 50 60 70 80
Indian Ocean
N-East Africa
North Africa
SADC
West Africa
Central Africa
BRIC
[Rbn]
Afr
ican
Re
gio
n
2016Q2 2016Q1
27
Figure 14: South African imports from African regions & BRIC, 2016Q1 – 2016Q2
Source: DTI data at current prices
Source: DTI data at current prices
6.2 Eastern Cape Trade
EC’s trade deficit has increased significantly from R1.3 billion in 2011 to R11 billion in 2015.
During this period, the increasing trade deficit was driven by the faster import annual growth rate
(14.8 percent) in import value compared to export annual average growth of 10 percent in export
value. Despite this province continuing to experience a trade deficit, export value has over the
past five years, improved significantly from R28.31 billion to R45.52 billion. While over the same
period, import value increased from R28.34 billion in 2010 to R56.57 billion in 2015. Despite
having two IDZs (Coega IDZ and ELIDZ) and three ports (East London, Port of Ngqura and Port
Elizabeth), the slow recovery in the global economy has prevented the province from reaching
its exporting potential. Table 3 below shows EC’s trade balance between 2000 and 2015.
0,41
0,16
0,45
19,08
8,03
0,33
67,12
0,37
0,17
0,82
18,58
7,11
0,44
63,27
0 10 20 30 40 50 60 70 80
Indian Ocean
N-East Africa
North Africa
SADC
West Africa
Central Africa
BRIC
[Rbn]
Afr
ican
Re
gio
n
2016Q2 2016Q1
28
Table 3: Eastern Cape trade balance, 2000 – 2015
2000 2005 2010 2015
[Rbn] [% Change] [Rbn] [% Change] [Rbn] [% Change] [Rbn] [% Change]
Exports 12.0 22.9 24.0 6.4 28.3 10.0 45.5 12.4
Imports 11.2 12.8 21.5 6.7 28.3 13.5 56.6 18.4
Trade Balance
0.8 >100 2.6 3.6 -0.02 -102.9 -11.0 51.5
Source: Quantec data at current prices
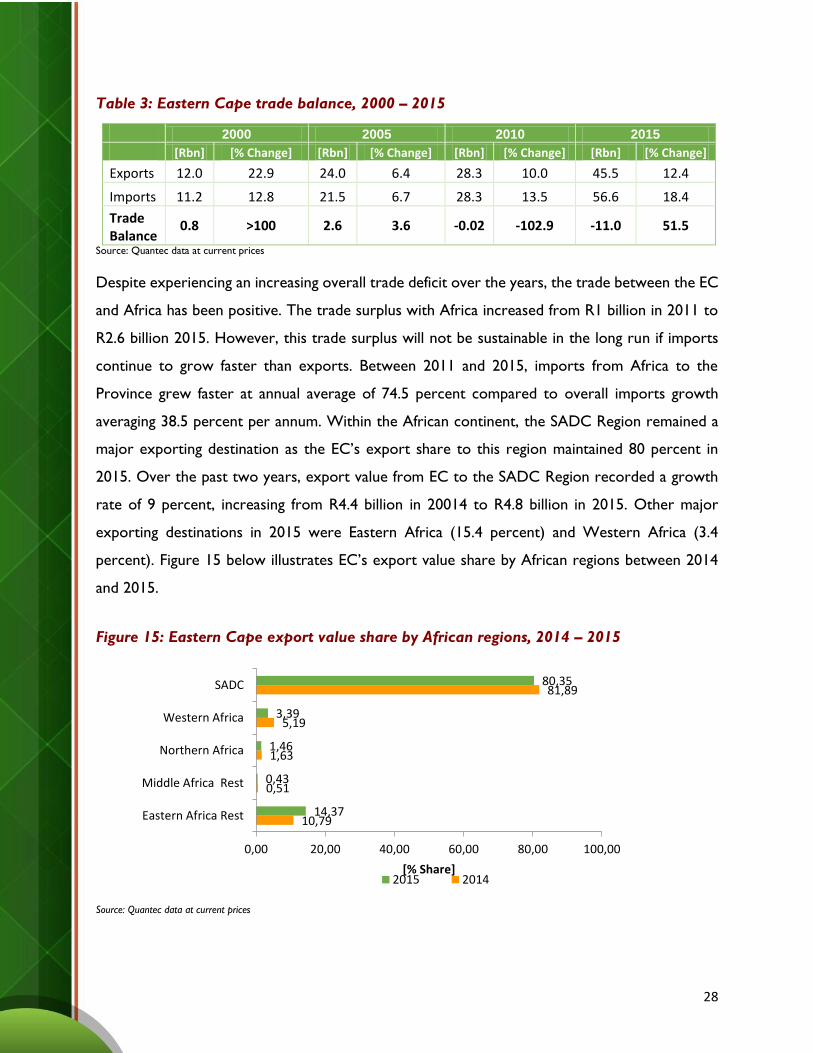
Despite experiencing an increasing overall trade deficit over the years, the trade between the EC
and Africa has been positive. The trade surplus with Africa increased from R1 billion in 2011 to
R2.6 billion 2015. However, this trade surplus will not be sustainable in the long run if imports
continue to grow faster than exports. Between 2011 and 2015, imports from Africa to the
Province grew faster at annual average of 74.5 percent compared to overall imports growth
averaging 38.5 percent per annum. Within the African continent, the SADC Region remained a
major exporting destination as the EC’s export share to this region maintained 80 percent in
2015. Over the past two years, export value from EC to the SADC Region recorded a growth
rate of 9 percent, increasing from R4.4 billion in 20014 to R4.8 billion in 2015. Other major
exporting destinations in 2015 were Eastern Africa (15.4 percent) and Western Africa (3.4
percent). Figure 15 below illustrates EC’s export value share by African regions between 2014
and 2015.
Figure 15: Eastern Cape export value share by African regions, 2014 – 2015
Source: Quantec data at current prices
10,79
0,51
1,63
5,19
81,89
14,37
0,43
1,46
3,39
80,35
0,00 20,00 40,00 60,00 80,00 100,00
Eastern Africa Rest
Middle Africa Rest
Northern Africa
Western Africa
SADC
[% Share]2015 2014
29
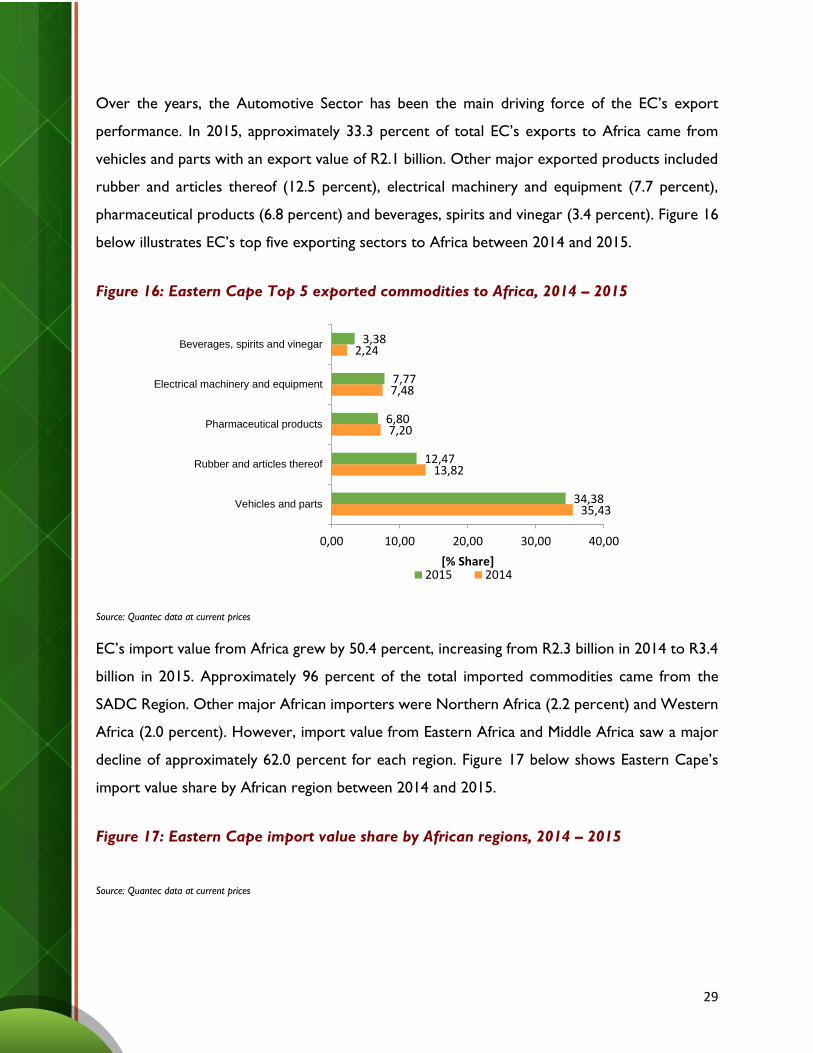
Over the years, the Automotive Sector has been the main driving force of the EC’s export
performance. In 2015, approximately 33.3 percent of total EC’s exports to Africa came from
vehicles and parts with an export value of R2.1 billion. Other major exported products included
rubber and articles thereof (12.5 percent), electrical machinery and equipment (7.7 percent),
pharmaceutical products (6.8 percent) and beverages, spirits and vinegar (3.4 percent). Figure 16
below illustrates EC’s top five exporting sectors to Africa between 2014 and 2015.
Figure 16: Eastern Cape Top 5 exported commodities to Africa, 2014 – 2015
Source: Quantec data at current prices
EC’s import value from Africa grew by 50.4 percent, increasing from R2.3 billion in 2014 to R3.4
billion in 2015. Approximately 96 percent of the total imported commodities came from the
SADC Region. Other major African importers were Northern Africa (2.2 percent) and Western
Africa (2.0 percent). However, import value from Eastern Africa and Middle Africa saw a major
decline of approximately 62.0 percent for each region. Figure 17 below shows Eastern Cape’s
import value share by African region between 2014 and 2015.
Figure 17: Eastern Cape import value share by African regions, 2014 – 2015
Source: Quantec data at current prices
35,43
13,82
7,20
7,48
2,24
34,38
12,47
6,80
7,77
3,38
0,00 10,00 20,00 30,00 40,00
Vehicles and parts
Rubber and articles thereof
Pharmaceutical products
Electrical machinery and equipment
Beverages, spirits and vinegar
[% Share]2015 2014
30
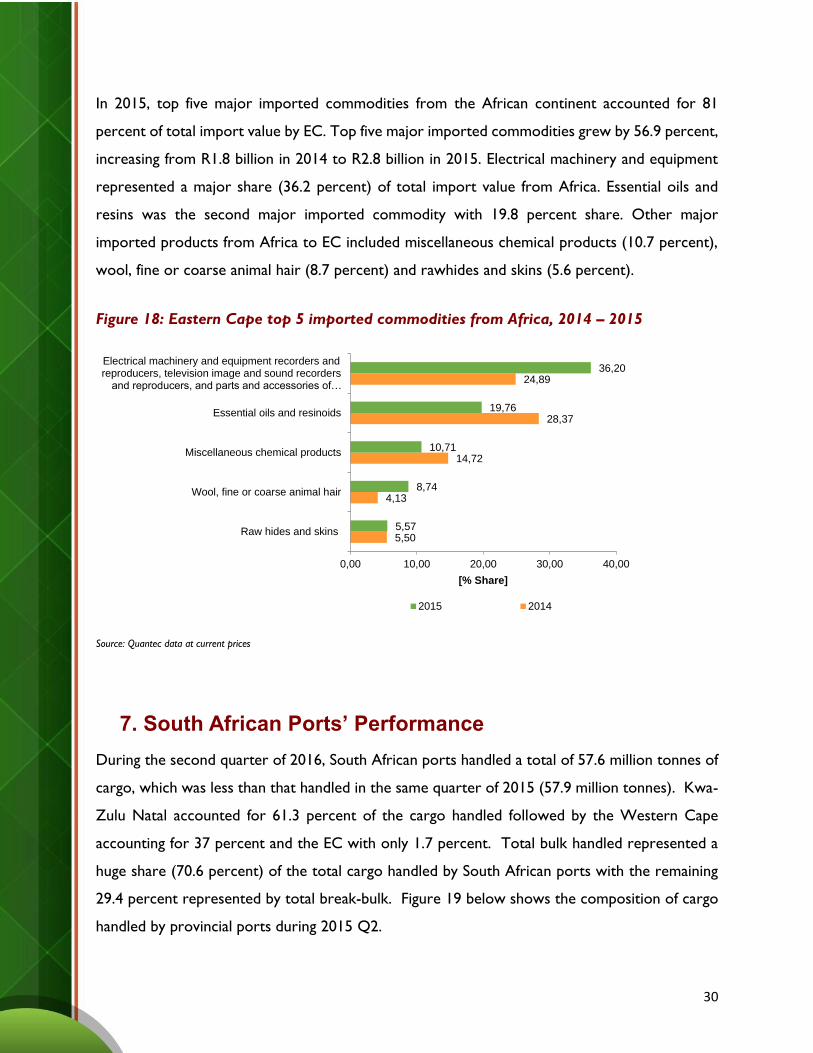
In 2015, top five major imported commodities from the African continent accounted for 81
percent of total import value by EC. Top five major imported commodities grew by 56.9 percent,
increasing from R1.8 billion in 2014 to R2.8 billion in 2015. Electrical machinery and equipment
represented a major share (36.2 percent) of total import value from Africa. Essential oils and
resins was the second major imported commodity with 19.8 percent share. Other major
imported products from Africa to EC included miscellaneous chemical products (10.7 percent),
wool, fine or coarse animal hair (8.7 percent) and rawhides and skins (5.6 percent).
Figure 18: Eastern Cape top 5 imported commodities from Africa, 2014 – 2015
Source: Quantec data at current prices
7. South African Ports’ Performance
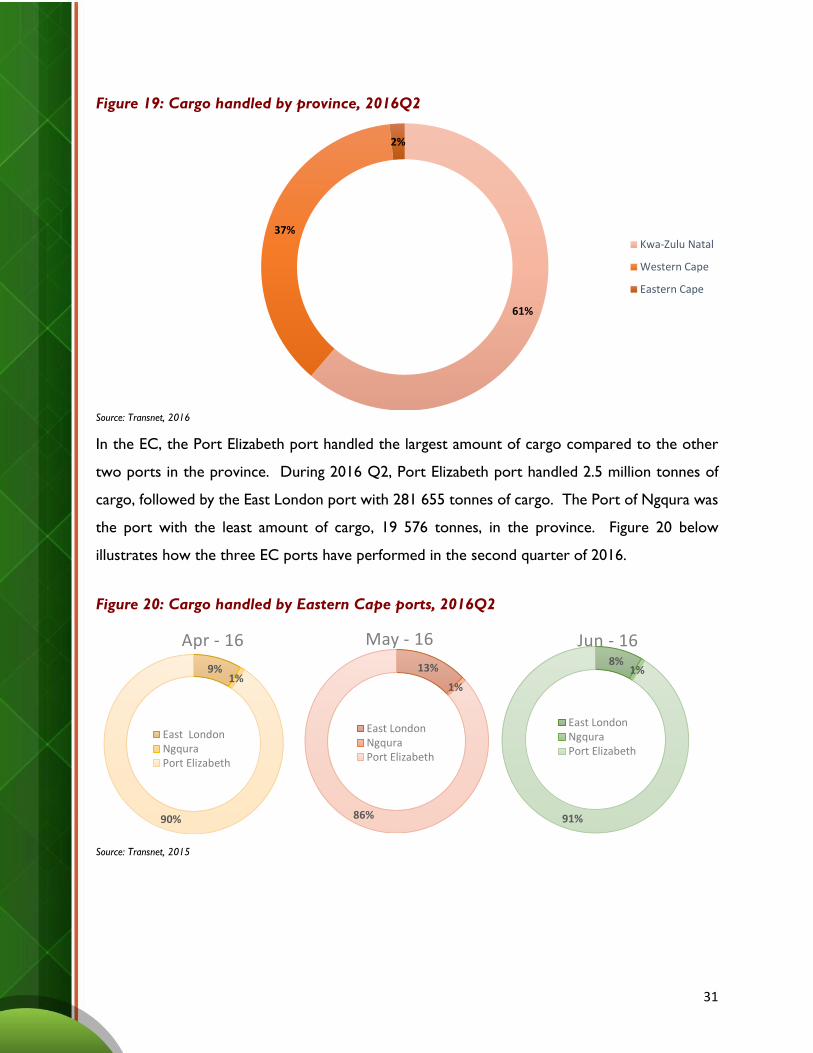
During the second quarter of 2016, South African ports handled a total of 57.6 million tonnes of
cargo, which was less than that handled in the same quarter of 2015 (57.9 million tonnes). Kwa-
Zulu Natal accounted for 61.3 percent of the cargo handled followed by the Western Cape
accounting for 37 percent and the EC with only 1.7 percent. Total bulk handled represented a
huge share (70.6 percent) of the total cargo handled by South African ports with the remaining
29.4 percent represented by total break-bulk. Figure 19 below shows the composition of cargo
handled by provincial ports during 2015 Q2.
5,50
4,13
14,72
28,37
24,89
5,57
8,74
10,71
19,76
36,20
0,00 10,00 20,00 30,00 40,00
Raw hides and skins
Wool, fine or coarse animal hair
Miscellaneous chemical products
Essential oils and resinoids
Electrical machinery and equipment recorders andreproducers, television image and sound recorders
and reproducers, and parts and accessories of…
[% Share]
2015 2014
31
Figure 19: Cargo handled by province, 2016Q2
Source: Transnet, 2016
In the EC, the Port Elizabeth port handled the largest amount of cargo compared to the other
two ports in the province. During 2016 Q2, Port Elizabeth port handled 2.5 million tonnes of
cargo, followed by the East London port with 281 655 tonnes of cargo. The Port of Ngqura was
the port with the least amount of cargo, 19 576 tonnes, in the province. Figure 20 below
illustrates how the three EC ports have performed in the second quarter of 2016.
Figure 20: Cargo handled by Eastern Cape ports, 2016Q2
Source: Transnet, 2015
61%
37%
2%
Kwa-Zulu Natal
Western Cape
Eastern Cape
9%1%
90%
Apr - 16
East LondonNgquraPort Elizabeth
13%
1%
86%
May - 16
East LondonNgquraPort Elizabeth
8%1%
91%
Jun - 16
East LondonNgquraPort Elizabeth
32
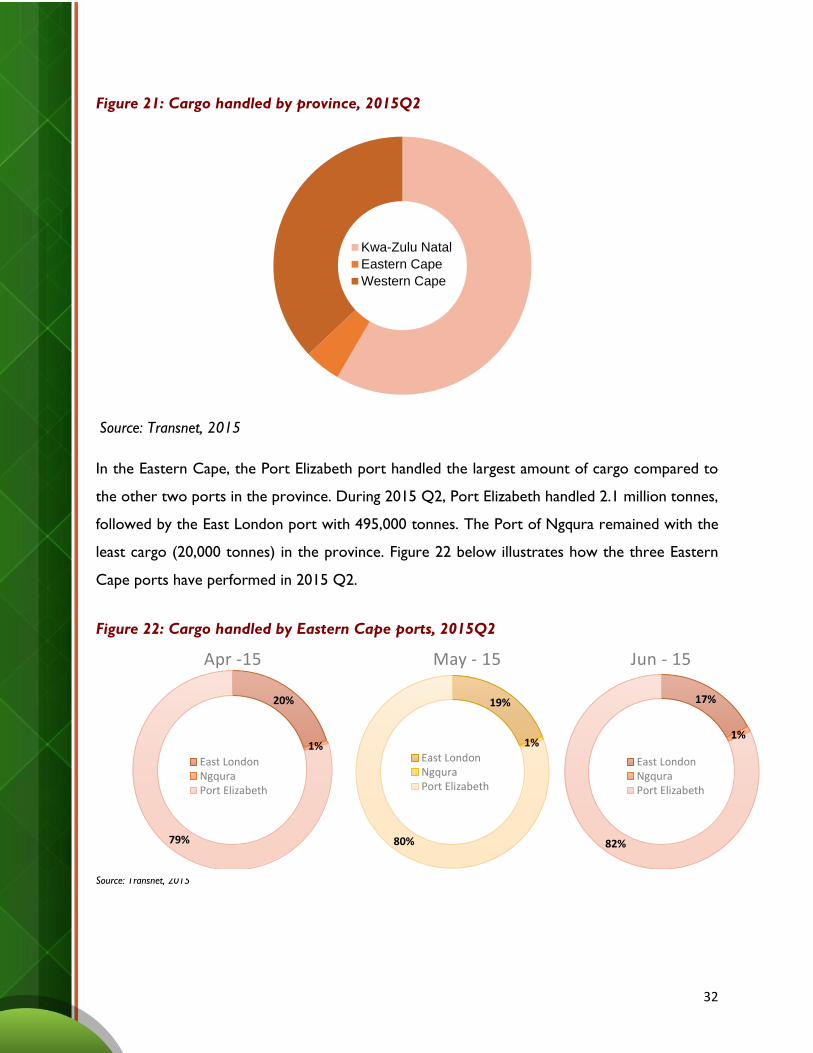
Figure 21: Cargo handled by province, 2015Q2
Source: Transnet, 2015
In the Eastern Cape, the Port Elizabeth port handled the largest amount of cargo compared to
the other two ports in the province. During 2015 Q2, Port Elizabeth handled 2.1 million tonnes,
followed by the East London port with 495,000 tonnes. The Port of Ngqura remained with the
least cargo (20,000 tonnes) in the province. Figure 22 below illustrates how the three Eastern
Cape ports have performed in 2015 Q2.
Figure 22: Cargo handled by Eastern Cape ports, 2015Q2
Source: Transnet, 2015
Kwa-Zulu Natal
Eastern Cape
Western Cape
20%
1%
79%
Apr -15
East LondonNgquraPort Elizabeth
19%
1%
80%
May - 15
East LondonNgquraPort Elizabeth
17%
1%
82%
Jun - 15
East LondonNgquraPort Elizabeth
33
8. National and Regional Investment
8.1 Global Foreign Direct Investment climate
In the first half of 2016, the global FDI flows decreased by 5%, as compared to the second half of
2015 to US$ 793 billion, but remain above half-year trends observed in 2013 and 2014. In 2016
Q1, FDI flows rose to US$ 513 billion due to large inflows to the US and to a lesser extent in
the UK after Royal Dutch Shell bought British Gas. FDI inflows then decreased by 46% to US$
279 billion in 2016 Q2. While the US continued to receive large inflows in 2016 Q2 partly due
to financial and corporate restructuring which had also boosted FDI inflows in 2014 and 2015,
this was offset by disinvestments recorded in selected European countries.
The FDI inflows into the Organisation for Economic Co-operation and Development (OECD)
increased by 14% in the first half of 2016, as compared to the second half of 2015, from US$ 499
billion to US$ 568 billion. FDI inflows to the OECD accounted for 67% of global FDI inflows,
compared to an average of 56% in 2015 and 43% in 2014. FDI inflows received by the US largely
accounted for the increased share of the OECD area. The OECD FDI outflows accounted for
70% of global FDI outflows, slightly lower than in 2015 (75% on average) but higher than in 2014
(62% on average). FDI inflows into European Union (EU) countries decreased by 39% (from US$
346 billion to US$ 210 billion) and outflows decreased by 45% (from US$ 315 billion to US$ 174
billion) and these decreases were largely driven by net disinvestments (negative inflows and
outflows) observed in 2016 Q2 when EU inflows and outflows dropped to respectively minus
USD$34 billion and minus US$15 billion. 1These net disinvestments were mostly the result of
large movements in intracompany debt flows which were not offset by high levels of equity
transactions as was the case in previous quarters. Whereas the FDI inflows to the G202as a
whole increased by 57% from US$383 billion to US$603 billion, whilst FDI outflows from the
G20 increased more modestly by 9% from US$401 billion to US$436 billion. While the increase
in FDI outflows equally affected G20, OECD and G20 non-OECD economies, this was not the
1 Source:www.oecd.org/corporate/mne/statistics,2016 2 The members of G20 countries include 19 individual countries: Argentina, Australia, Brazil, Canada, China, France, Germany, India, Indonesia, Italy, Japan, South Korea, Mexico, Russia, Saudi Arabia, South Africa, Turkey, United Kingdom and United States, along with the European Union (EU).
34
case for FDI inflows. FDI inflows to OECD G20 economies more than doubled but were partly
offset by a 28% drop in FDI inflows received by non-OECD G20 economies.
8.2 Foreign Direct Investment flows into South Africa from the world, 2015Q2 – 2016Q3
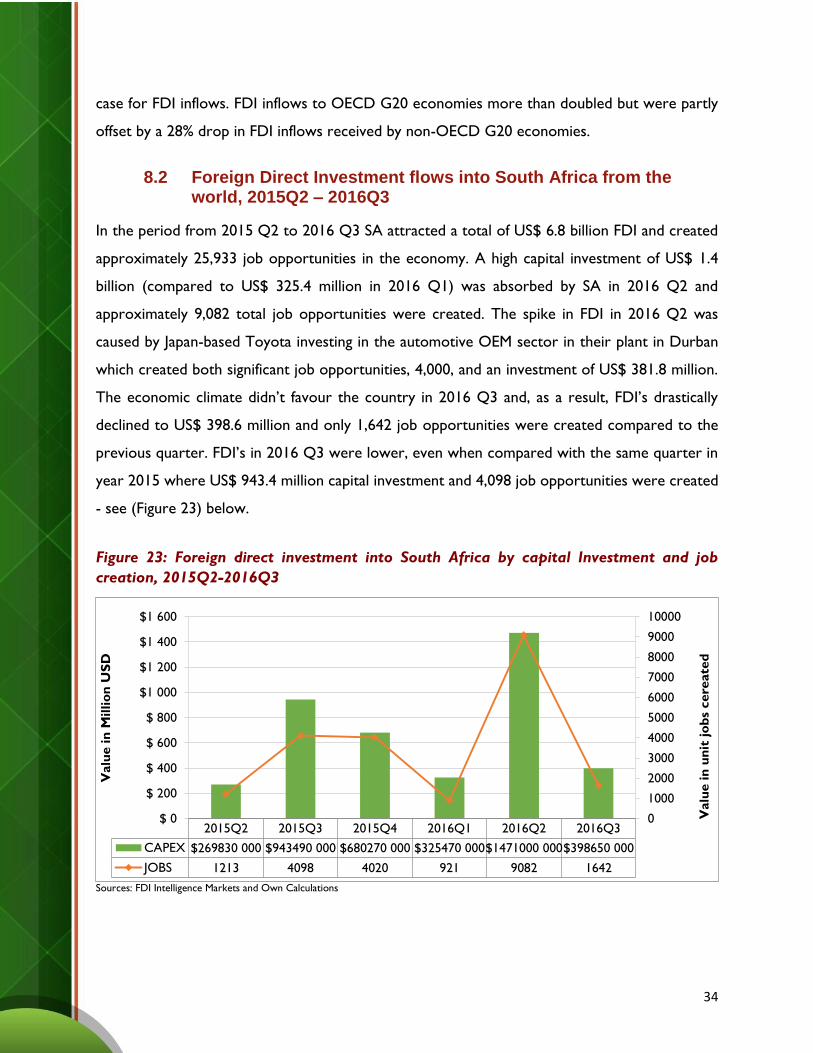
In the period from 2015 Q2 to 2016 Q3 SA attracted a total of US$ 6.8 billion FDI and created
approximately 25,933 job opportunities in the economy. A high capital investment of US$ 1.4
billion (compared to US$ 325.4 million in 2016 Q1) was absorbed by SA in 2016 Q2 and
approximately 9,082 total job opportunities were created. The spike in FDI in 2016 Q2 was
caused by Japan-based Toyota investing in the automotive OEM sector in their plant in Durban
which created both significant job opportunities, 4,000, and an investment of US$ 381.8 million.
The economic climate didn’t favour the country in 2016 Q3 and, as a result, FDI’s drastically
declined to US$ 398.6 million and only 1,642 job opportunities were created compared to the
previous quarter. FDI’s in 2016 Q3 were lower, even when compared with the same quarter in
year 2015 where US$ 943.4 million capital investment and 4,098 job opportunities were created
- see (Figure 23) below.
Figure 23: Foreign direct investment into South Africa by capital Investment and job
creation, 2015Q2-2016Q3
Sources: FDI Intelligence Markets and Own Calculations
2015Q2 2015Q3 2015Q4 2016Q1 2016Q2 2016Q3
CAPEX $269830 000 $943490 000 $680270 000 $325470 000$1471000 000$398650 000
JOBS 1213 4098 4020 921 9082 1642
0
1000
2000
3000
4000
5000
6000
7000
8000
9000
10000
$ 0
$ 200
$ 400
$ 600
$ 800
$1 000
$1 200
$1 400
$1 600
Valu
e in
Millio
n U
SD
Valu
e in
un
it j
ob
s cere
ate
d
35
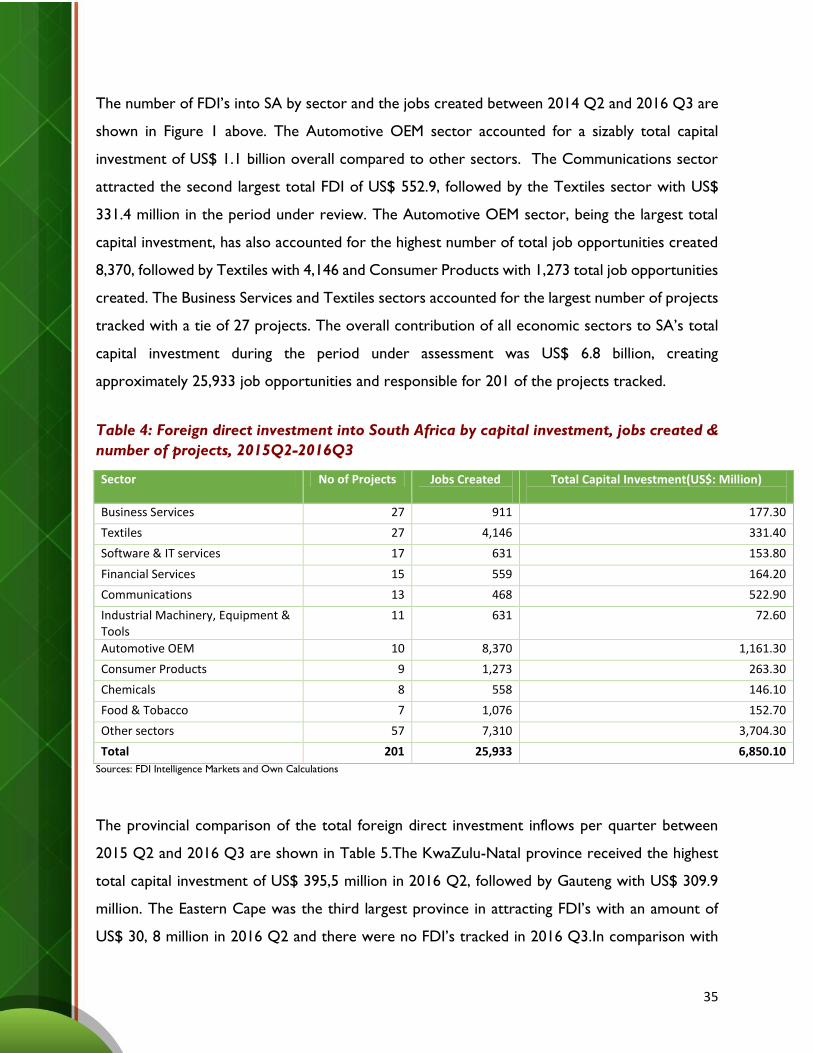
The number of FDI’s into SA by sector and the jobs created between 2014 Q2 and 2016 Q3 are
shown in Figure 1 above. The Automotive OEM sector accounted for a sizably total capital
investment of US$ 1.1 billion overall compared to other sectors. The Communications sector
attracted the second largest total FDI of US$ 552.9, followed by the Textiles sector with US$
331.4 million in the period under review. The Automotive OEM sector, being the largest total
capital investment, has also accounted for the highest number of total job opportunities created
8,370, followed by Textiles with 4,146 and Consumer Products with 1,273 total job opportunities
created. The Business Services and Textiles sectors accounted for the largest number of projects
tracked with a tie of 27 projects. The overall contribution of all economic sectors to SA’s total
capital investment during the period under assessment was US$ 6.8 billion, creating
approximately 25,933 job opportunities and responsible for 201 of the projects tracked.
Table 4: Foreign direct investment into South Africa by capital investment, jobs created &
number of projects, 2015Q2-2016Q3
Sector No of Projects Jobs Created
Total Capital Investment(US$: Million)
Business Services 27 911 177.30
Textiles 27 4,146 331.40
Software & IT services 17 631 153.80
Financial Services 15 559 164.20
Communications 13 468 522.90
Industrial Machinery, Equipment & Tools
11 631 72.60
Automotive OEM 10 8,370 1,161.30
Consumer Products 9 1,273 263.30
Chemicals 8 558 146.10
Food & Tobacco 7 1,076 152.70
Other sectors 57 7,310 3,704.30
Total 201 25,933 6,850.10
Sources: FDI Intelligence Markets and Own Calculations
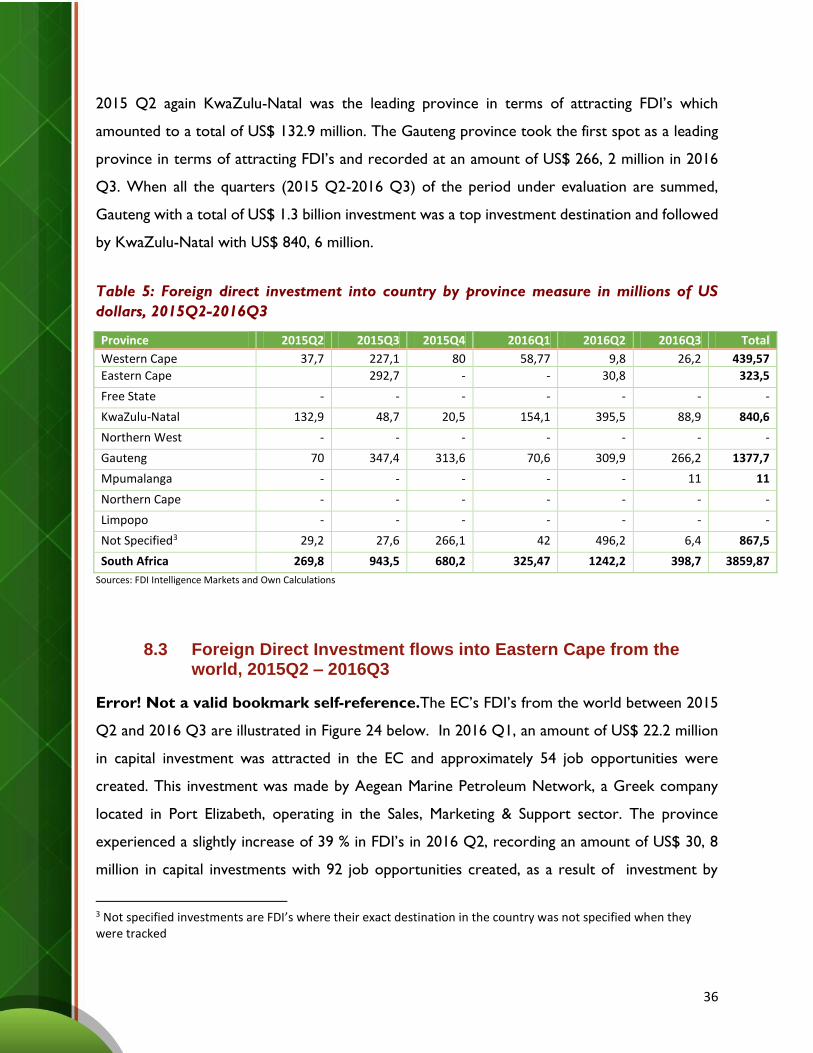
The provincial comparison of the total foreign direct investment inflows per quarter between
2015 Q2 and 2016 Q3 are shown in Table 5.The KwaZulu-Natal province received the highest
total capital investment of US$ 395,5 million in 2016 Q2, followed by Gauteng with US$ 309.9
million. The Eastern Cape was the third largest province in attracting FDI’s with an amount of
US$ 30, 8 million in 2016 Q2 and there were no FDI’s tracked in 2016 Q3.In comparison with
36
2015 Q2 again KwaZulu-Natal was the leading province in terms of attracting FDI’s which
amounted to a total of US$ 132.9 million. The Gauteng province took the first spot as a leading
province in terms of attracting FDI’s and recorded at an amount of US$ 266, 2 million in 2016
Q3. When all the quarters (2015 Q2-2016 Q3) of the period under evaluation are summed,
Gauteng with a total of US$ 1.3 billion investment was a top investment destination and followed
by KwaZulu-Natal with US$ 840, 6 million.
Table 5: Foreign direct investment into country by province measure in millions of US
dollars, 2015Q2-2016Q3
Province 2015Q2 2015Q3 2015Q4 2016Q1 2016Q2 2016Q3 Total
Western Cape 37,7 227,1 80 58,77 9,8 26,2 439,57
Eastern Cape 292,7 - - 30,8 323,5
Free State - - - - - - -
KwaZulu-Natal 132,9 48,7 20,5 154,1 395,5 88,9 840,6
Northern West - - - - - - -
Gauteng 70 347,4 313,6 70,6 309,9 266,2 1377,7
Mpumalanga - - - - - 11 11
Northern Cape - - - - - - -
Limpopo - - - - - - -
Not Specified3 29,2 27,6 266,1 42 496,2 6,4 867,5
South Africa 269,8 943,5 680,2 325,47 1242,2 398,7 3859,87
Sources: FDI Intelligence Markets and Own Calculations
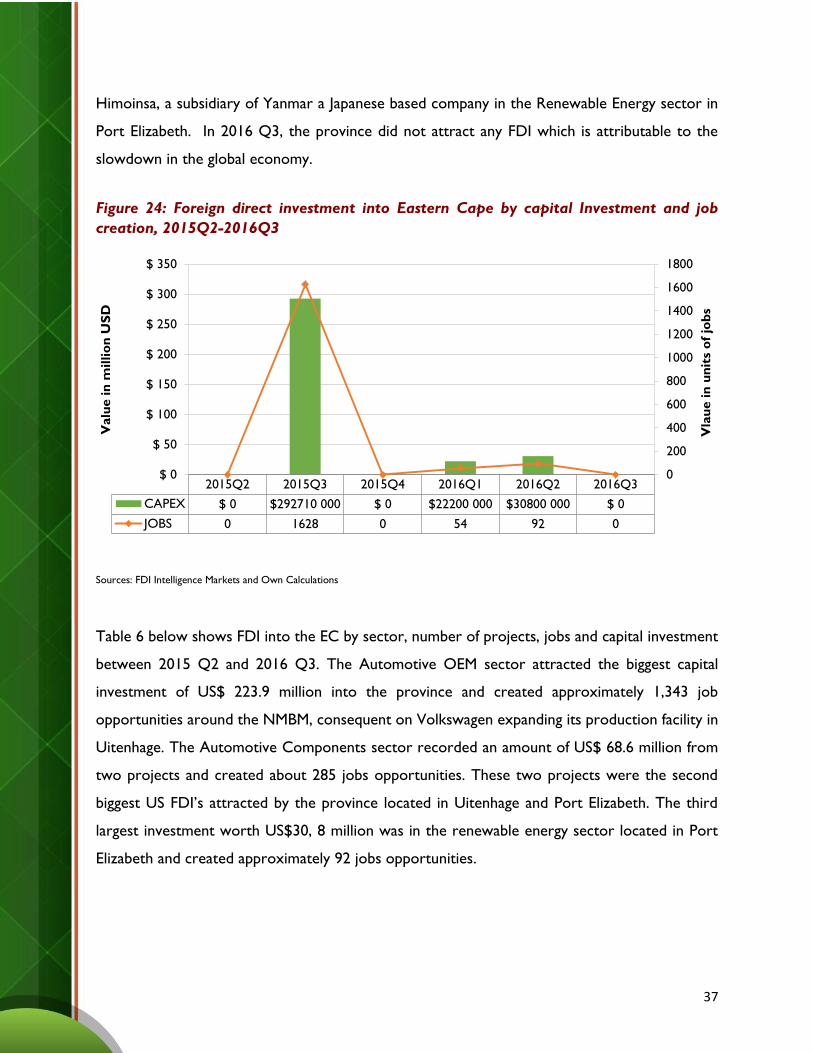
8.3 Foreign Direct Investment flows into Eastern Cape from the world, 2015Q2 – 2016Q3
Error! Not a valid bookmark self-reference.The EC’s FDI’s from the world between 2015
Q2 and 2016 Q3 are illustrated in Figure 24 below. In 2016 Q1, an amount of US$ 22.2 million
in capital investment was attracted in the EC and approximately 54 job opportunities were
created. This investment was made by Aegean Marine Petroleum Network, a Greek company
located in Port Elizabeth, operating in the Sales, Marketing & Support sector. The province
experienced a slightly increase of 39 % in FDI’s in 2016 Q2, recording an amount of US$ 30, 8
million in capital investments with 92 job opportunities created, as a result of investment by
3 Not specified investments are FDI’s where their exact destination in the country was not specified when they were tracked
37
Himoinsa, a subsidiary of Yanmar a Japanese based company in the Renewable Energy sector in
Port Elizabeth. In 2016 Q3, the province did not attract any FDI which is attributable to the
slowdown in the global economy.
Figure 24: Foreign direct investment into Eastern Cape by capital Investment and job
creation, 2015Q2-2016Q3
Sources: FDI Intelligence Markets and Own Calculations
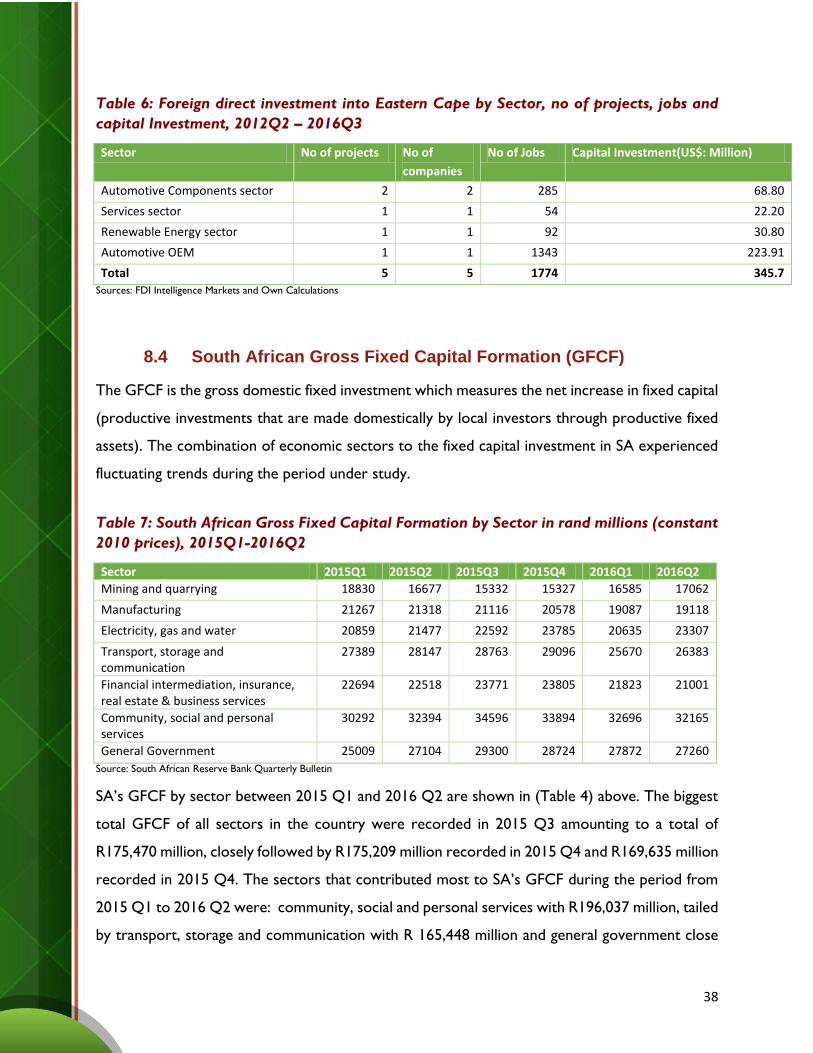
Table 6 below shows FDI into the EC by sector, number of projects, jobs and capital investment
between 2015 Q2 and 2016 Q3. The Automotive OEM sector attracted the biggest capital
investment of US$ 223.9 million into the province and created approximately 1,343 job
opportunities around the NMBM, consequent on Volkswagen expanding its production facility in
Uitenhage. The Automotive Components sector recorded an amount of US$ 68.6 million from
two projects and created about 285 jobs opportunities. These two projects were the second
biggest US FDI’s attracted by the province located in Uitenhage and Port Elizabeth. The third
largest investment worth US$30, 8 million was in the renewable energy sector located in Port
Elizabeth and created approximately 92 jobs opportunities.
2015Q2 2015Q3 2015Q4 2016Q1 2016Q2 2016Q3
CAPEX $ 0 $292710 000 $ 0 $22200 000 $30800 000 $ 0
JOBS 0 1628 0 54 92 0
0
200
400
600
800
1000
1200
1400
1600
1800
$ 0
$ 50
$ 100
$ 150
$ 200
$ 250
$ 300
$ 350
Valu
e in
millio
n U
SD
Vla
ue in
un
its
of
job
s
38
Table 6: Foreign direct investment into Eastern Cape by Sector, no of projects, jobs and
capital Investment, 2012Q2 – 2016Q3
Sector No of projects No of
companies
No of Jobs Capital Investment(US$: Million)
Automotive Components sector 2 2 285 68.80
Services sector 1 1 54 22.20
Renewable Energy sector 1 1 92 30.80
Automotive OEM 1 1 1343 223.91
Total 5 5 1774 345.7
Sources: FDI Intelligence Markets and Own Calculations
8.4 South African Gross Fixed Capital Formation (GFCF)
The GFCF is the gross domestic fixed investment which measures the net increase in fixed capital
(productive investments that are made domestically by local investors through productive fixed
assets). The combination of economic sectors to the fixed capital investment in SA experienced
fluctuating trends during the period under study.
Table 7: South African Gross Fixed Capital Formation by Sector in rand millions (constant
2010 prices), 2015Q1-2016Q2
Sector 2015Q1 2015Q2 2015Q3 2015Q4 2016Q1 2016Q2
Mining and quarrying 18830 16677 15332 15327 16585 17062
Manufacturing 21267 21318 21116 20578 19087 19118
Electricity, gas and water 20859 21477 22592 23785 20635 23307
Transport, storage and communication
27389 28147 28763 29096 25670 26383
Financial intermediation, insurance, real estate & business services
22694 22518 23771 23805 21823 21001
Community, social and personal services
30292 32394 34596 33894 32696 32165
General Government 25009 27104 29300 28724 27872 27260
Source: South African Reserve Bank Quarterly Bulletin
SA’s GFCF by sector between 2015 Q1 and 2016 Q2 are shown in (Table 4) above. The biggest
total GFCF of all sectors in the country were recorded in 2015 Q3 amounting to a total of
R175,470 million, closely followed by R175,209 million recorded in 2015 Q4 and R169,635 million
recorded in 2015 Q4. The sectors that contributed most to SA’s GFCF during the period from
2015 Q1 to 2016 Q2 were: community, social and personal services with R196,037 million, tailed
by transport, storage and communication with R 165,448 million and general government close
39
behind with a total of R 165,269 million. The country’s total GFCF fluctuated on a quarter-by-
quarter basis between 2015 Q1 and 2016 Q2 due to economic turbulence nationally and
internationally.
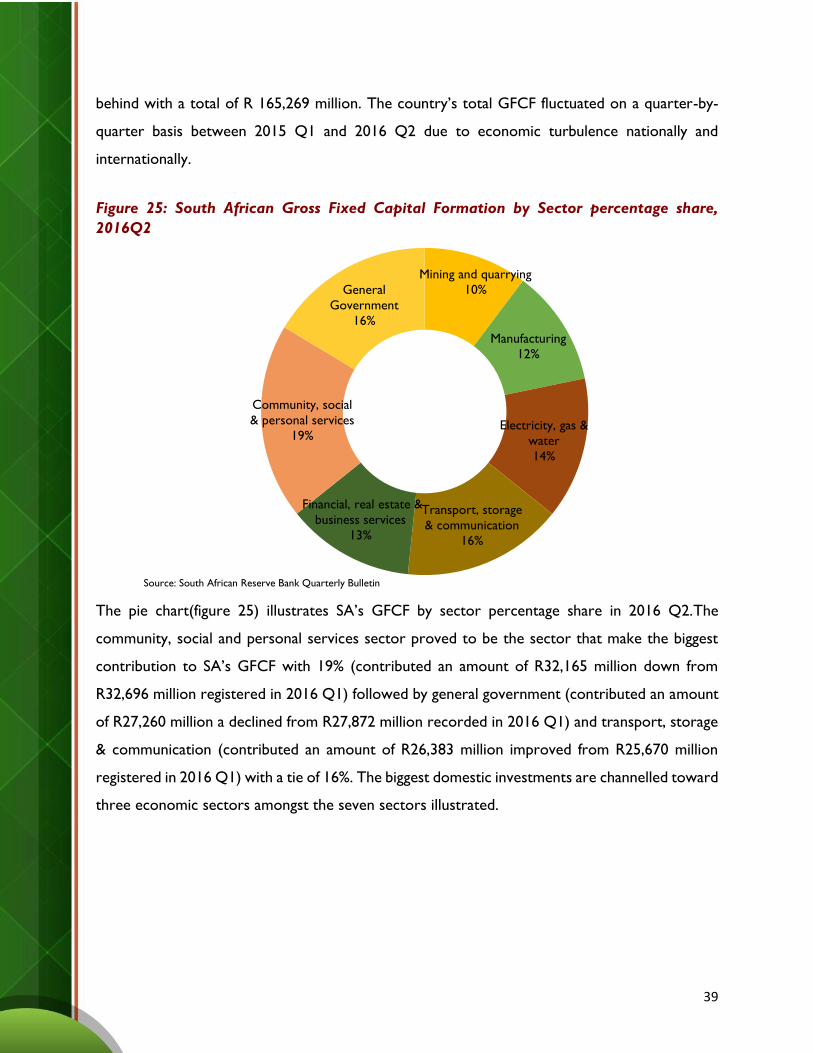
Figure 25: South African Gross Fixed Capital Formation by Sector percentage share,
2016Q2
Source: South African Reserve Bank Quarterly Bulletin
The pie chart(figure 25) illustrates SA’s GFCF by sector percentage share in 2016 Q2.The
community, social and personal services sector proved to be the sector that make the biggest
contribution to SA’s GFCF with 19% (contributed an amount of R32,165 million down from
R32,696 million registered in 2016 Q1) followed by general government (contributed an amount
of R27,260 million a declined from R27,872 million recorded in 2016 Q1) and transport, storage
& communication (contributed an amount of R26,383 million improved from R25,670 million
registered in 2016 Q1) with a tie of 16%. The biggest domestic investments are channelled toward
three economic sectors amongst the seven sectors illustrated.
Mining and quarrying
10%
Manufacturing
12%
Electricity, gas &
water
14%
Transport, storage
& communication
16%
Financial, real estate &
business services
13%
Community, social
& personal services
19%
General
Government
16%
40
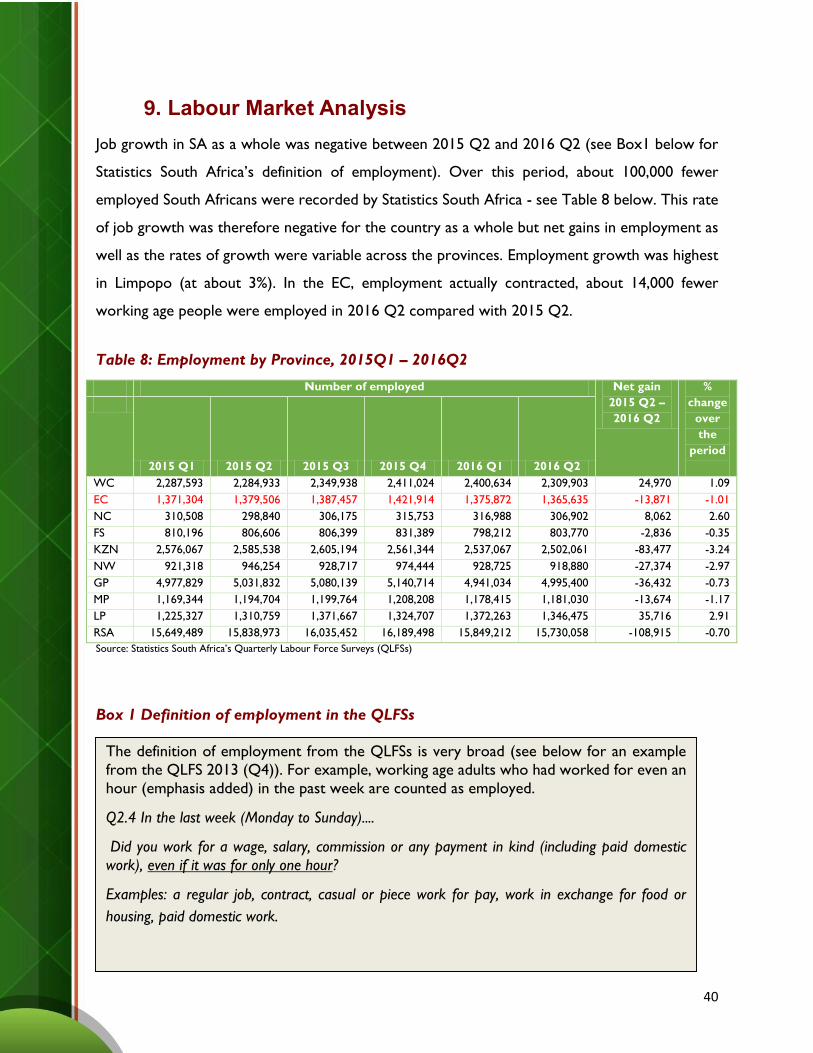
9. Labour Market Analysis
Job growth in SA as a whole was negative between 2015 Q2 and 2016 Q2 (see Box1 below for
Statistics South Africa’s definition of employment). Over this period, about 100,000 fewer
employed South Africans were recorded by Statistics South Africa - see Table 8 below. This rate
of job growth was therefore negative for the country as a whole but net gains in employment as
well as the rates of growth were variable across the provinces. Employment growth was highest
in Limpopo (at about 3%). In the EC, employment actually contracted, about 14,000 fewer
working age people were employed in 2016 Q2 compared with 2015 Q2.
Table 8: Employment by Province, 2015Q1 – 2016Q2
Number of employed Net gain
2015 Q2 –
2016 Q2
%
change
over
the
period
2015 Q1 2015 Q2 2015 Q3 2015 Q4 2016 Q1 2016 Q2
WC 2,287,593 2,284,933 2,349,938 2,411,024 2,400,634 2,309,903 24,970 1.09
EC 1,371,304 1,379,506 1,387,457 1,421,914 1,375,872 1,365,635 -13,871 -1.01
NC 310,508 298,840 306,175 315,753 316,988 306,902 8,062 2.60
FS 810,196 806,606 806,399 831,389 798,212 803,770 -2,836 -0.35
KZN 2,576,067 2,585,538 2,605,194 2,561,344 2,537,067 2,502,061 -83,477 -3.24
NW 921,318 946,254 928,717 974,444 928,725 918,880 -27,374 -2.97
GP 4,977,829 5,031,832 5,080,139 5,140,714 4,941,034 4,995,400 -36,432 -0.73
MP 1,169,344 1,194,704 1,199,764 1,208,208 1,178,415 1,181,030 -13,674 -1.17
LP 1,225,327 1,310,759 1,371,667 1,324,707 1,372,263 1,346,475 35,716 2.91
RSA 15,649,489 15,838,973 16,035,452 16,189,498 15,849,212 15,730,058 -108,915 -0.70
Source: Statistics South Africa’s Quarterly Labour Force Surveys (QLFSs)
Box 1 Definition of employment in the QLFSs
The definition of employment from the QLFSs is very broad (see below for an example
from the QLFS 2013 (Q4)). For example, working age adults who had worked for even an
hour (emphasis added) in the past week are counted as employed.
Q2.4 In the last week (Monday to Sunday)....
Did you work for a wage, salary, commission or any payment in kind (including paid domestic
work), even if it was for only one hour?
Examples: a regular job, contract, casual or piece work for pay, work in exchange for food or
housing, paid domestic work.
41
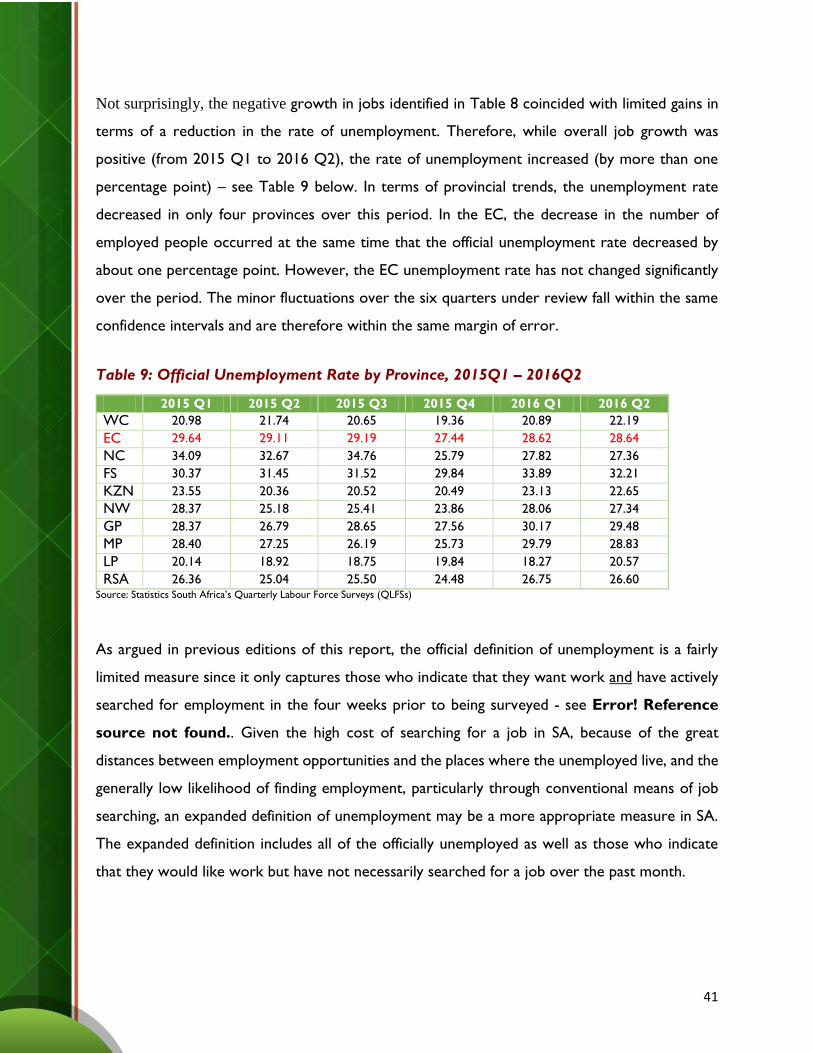
Not surprisingly, the negative growth in jobs identified in Table 8 coincided with limited gains in
terms of a reduction in the rate of unemployment. Therefore, while overall job growth was
positive (from 2015 Q1 to 2016 Q2), the rate of unemployment increased (by more than one
percentage point) – see Table 9 below. In terms of provincial trends, the unemployment rate
decreased in only four provinces over this period. In the EC, the decrease in the number of
employed people occurred at the same time that the official unemployment rate decreased by
about one percentage point. However, the EC unemployment rate has not changed significantly
over the period. The minor fluctuations over the six quarters under review fall within the same
confidence intervals and are therefore within the same margin of error.
Table 9: Official Unemployment Rate by Province, 2015Q1 – 2016Q2
2015 Q1 2015 Q2 2015 Q3 2015 Q4 2016 Q1 2016 Q2
WC 20.98 21.74 20.65 19.36 20.89 22.19
EC 29.64 29.11 29.19 27.44 28.62 28.64
NC 34.09 32.67 34.76 25.79 27.82 27.36
FS 30.37 31.45 31.52 29.84 33.89 32.21
KZN 23.55 20.36 20.52 20.49 23.13 22.65
NW 28.37 25.18 25.41 23.86 28.06 27.34
GP 28.37 26.79 28.65 27.56 30.17 29.48
MP 28.40 27.25 26.19 25.73 29.79 28.83
LP 20.14 18.92 18.75 19.84 18.27 20.57
RSA 26.36 25.04 25.50 24.48 26.75 26.60 Source: Statistics South Africa’s Quarterly Labour Force Surveys (QLFSs)
As argued in previous editions of this report, the official definition of unemployment is a fairly
limited measure since it only captures those who indicate that they want work and have actively
searched for employment in the four weeks prior to being surveyed - see Error! Reference
source not found.. Given the high cost of searching for a job in SA, because of the great
distances between employment opportunities and the places where the unemployed live, and the
generally low likelihood of finding employment, particularly through conventional means of job
searching, an expanded definition of unemployment may be a more appropriate measure in SA.
The expanded definition includes all of the officially unemployed as well as those who indicate
that they would like work but have not necessarily searched for a job over the past month.
42
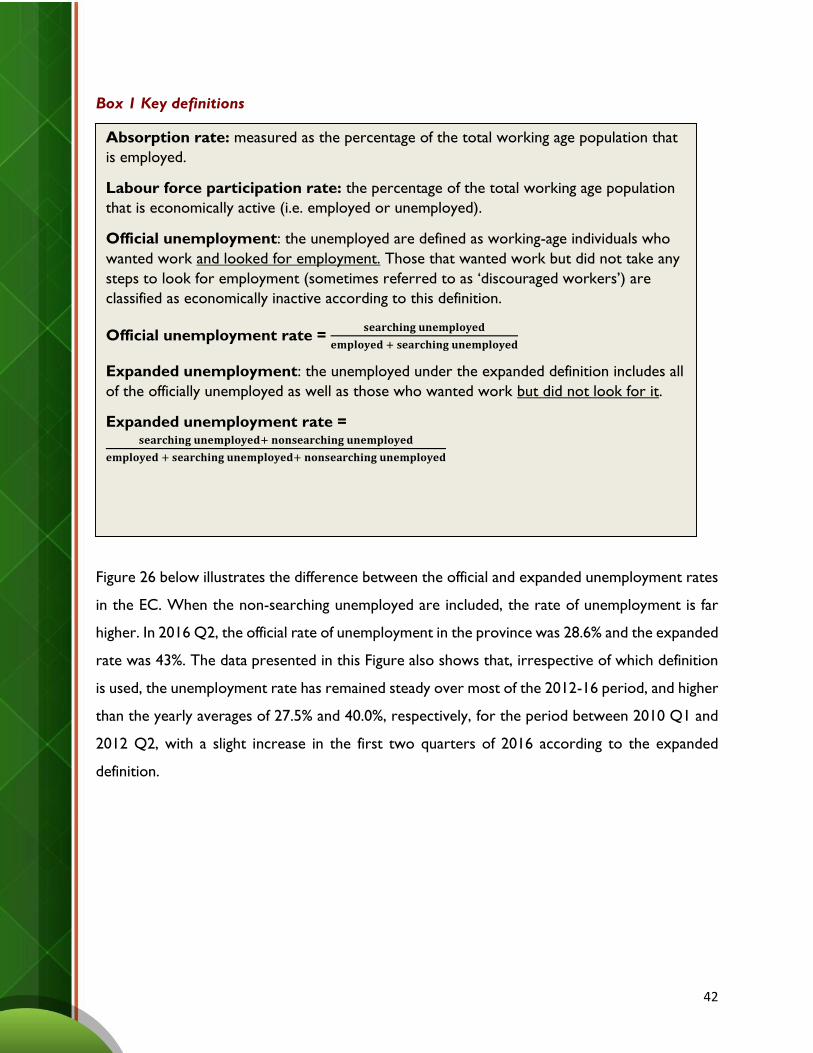
Box 1 Key definitions
Key definitions
Figure 26 below illustrates the difference between the official and expanded unemployment rates
in the EC. When the non-searching unemployed are included, the rate of unemployment is far
higher. In 2016 Q2, the official rate of unemployment in the province was 28.6% and the expanded
rate was 43%. The data presented in this Figure also shows that, irrespective of which definition
is used, the unemployment rate has remained steady over most of the 2012-16 period, and higher
than the yearly averages of 27.5% and 40.0%, respectively, for the period between 2010 Q1 and
2012 Q2, with a slight increase in the first two quarters of 2016 according to the expanded
definition.
Absorption rate: measured as the percentage of the total working age population that
is employed.
Labour force participation rate: the percentage of the total working age population
that is economically active (i.e. employed or unemployed).
Official unemployment: the unemployed are defined as working-age individuals who
wanted work and looked for employment. Those that wanted work but did not take any
steps to look for employment (sometimes referred to as ‘discouraged workers’) are
classified as economically inactive according to this definition.
Official unemployment rate = 𝐬𝐞𝐚𝐫𝐜𝐡𝐢𝐧𝐠 𝐮𝐧𝐞𝐦𝐩𝐥𝐨𝐲𝐞𝐝
𝐞𝐦𝐩𝐥𝐨𝐲𝐞𝐝 + 𝐬𝐞𝐚𝐫𝐜𝐡𝐢𝐧𝐠 𝐮𝐧𝐞𝐦𝐩𝐥𝐨𝐲𝐞𝐝
Expanded unemployment: the unemployed under the expanded definition includes all
of the officially unemployed as well as those who wanted work but did not look for it.
Expanded unemployment rate = 𝐬𝐞𝐚𝐫𝐜𝐡𝐢𝐧𝐠 𝐮𝐧𝐞𝐦𝐩𝐥𝐨𝐲𝐞𝐝+ 𝐧𝐨𝐧𝐬𝐞𝐚𝐫𝐜𝐡𝐢𝐧𝐠 𝐮𝐧𝐞𝐦𝐩𝐥𝐨𝐲𝐞𝐝
𝐞𝐦𝐩𝐥𝐨𝐲𝐞𝐝 + 𝐬𝐞𝐚𝐫𝐜𝐡𝐢𝐧𝐠 𝐮𝐧𝐞𝐦𝐩𝐥𝐨𝐲𝐞𝐝+ 𝐧𝐨𝐧𝐬𝐞𝐚𝐫𝐜𝐡𝐢𝐧𝐠 𝐮𝐧𝐞𝐦𝐩𝐥𝐨𝐲𝐞𝐝
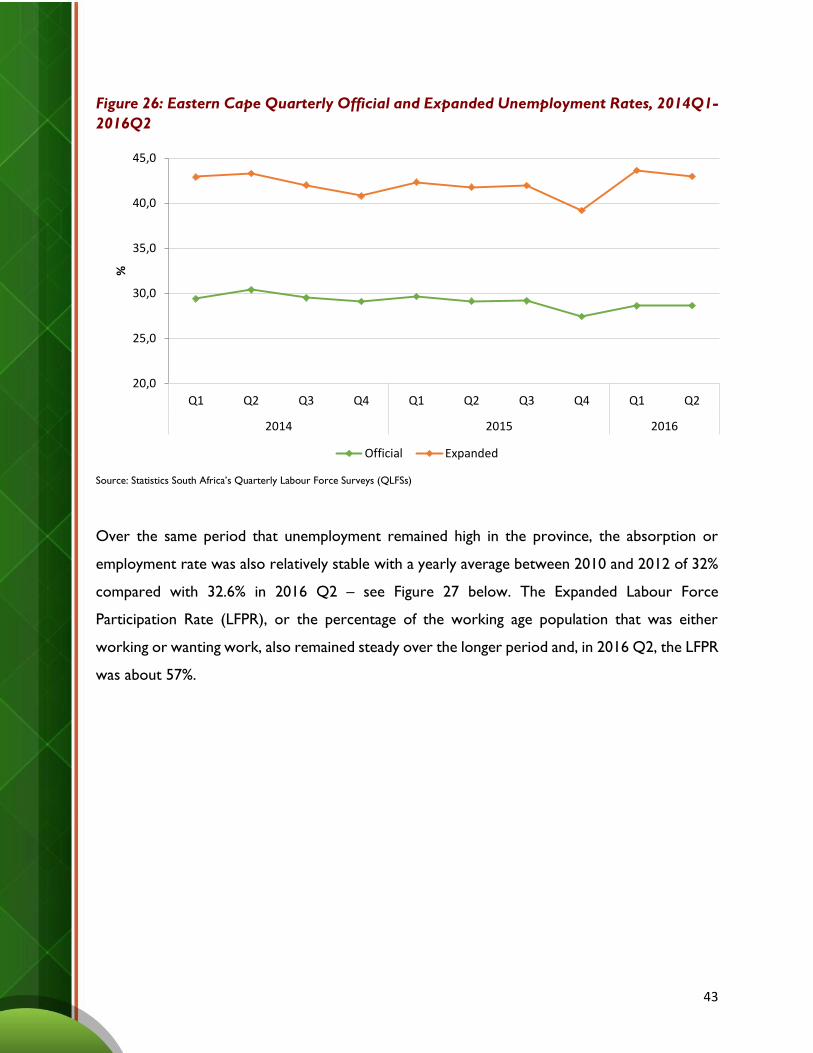
43
Figure 26: Eastern Cape Quarterly Official and Expanded Unemployment Rates, 2014Q1-
2016Q2
Source: Statistics South Africa’s Quarterly Labour Force Surveys (QLFSs)
Over the same period that unemployment remained high in the province, the absorption or
employment rate was also relatively stable with a yearly average between 2010 and 2012 of 32%
compared with 32.6% in 2016 Q2 – see Figure 27 below. The Expanded Labour Force
Participation Rate (LFPR), or the percentage of the working age population that was either
working or wanting work, also remained steady over the longer period and, in 2016 Q2, the LFPR
was about 57%.
20,0
25,0
30,0
35,0
40,0
45,0
Q1 Q2 Q3 Q4 Q1 Q2 Q3 Q4 Q1 Q2
2014 2015 2016
%
Official Expanded
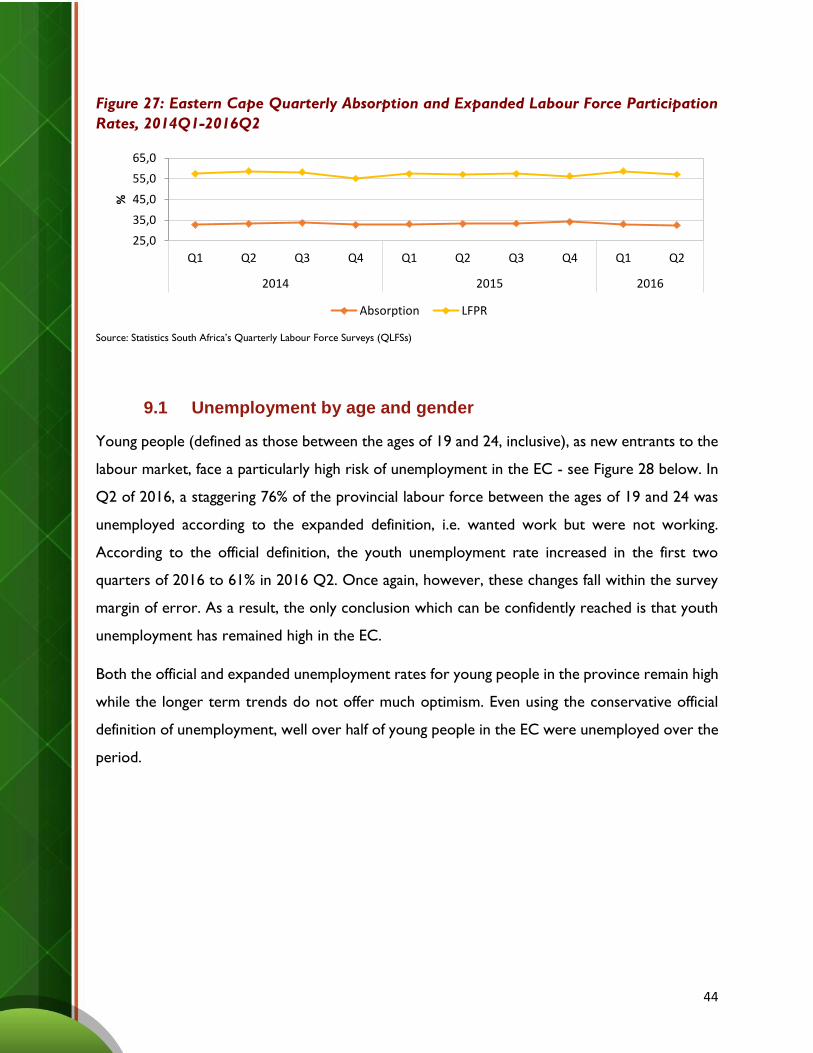
44
Figure 27: Eastern Cape Quarterly Absorption and Expanded Labour Force Participation
Rates, 2014Q1-2016Q2
Source: Statistics South Africa’s Quarterly Labour Force Surveys (QLFSs)
9.1 Unemployment by age and gender
Young people (defined as those between the ages of 19 and 24, inclusive), as new entrants to the
labour market, face a particularly high risk of unemployment in the EC - see Figure 28 below. In
Q2 of 2016, a staggering 76% of the provincial labour force between the ages of 19 and 24 was
unemployed according to the expanded definition, i.e. wanted work but were not working.
According to the official definition, the youth unemployment rate increased in the first two
quarters of 2016 to 61% in 2016 Q2. Once again, however, these changes fall within the survey
margin of error. As a result, the only conclusion which can be confidently reached is that youth
unemployment has remained high in the EC.
Both the official and expanded unemployment rates for young people in the province remain high
while the longer term trends do not offer much optimism. Even using the conservative official
definition of unemployment, well over half of young people in the EC were unemployed over the
period.
25,0
35,0
45,0
55,0
65,0
Q1 Q2 Q3 Q4 Q1 Q2 Q3 Q4 Q1 Q2
2014 2015 2016
%
Absorption LFPR
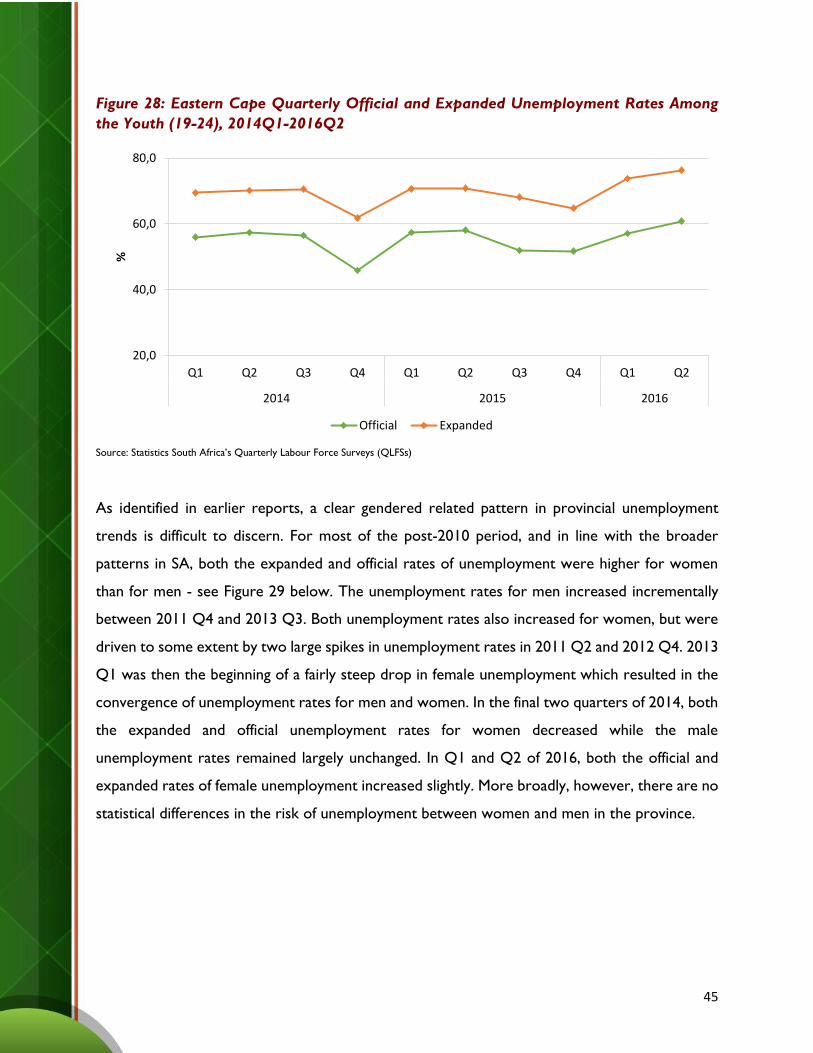
45
Figure 28: Eastern Cape Quarterly Official and Expanded Unemployment Rates Among
the Youth (19-24), 2014Q1-2016Q2
Source: Statistics South Africa’s Quarterly Labour Force Surveys (QLFSs)
As identified in earlier reports, a clear gendered related pattern in provincial unemployment
trends is difficult to discern. For most of the post-2010 period, and in line with the broader
patterns in SA, both the expanded and official rates of unemployment were higher for women
than for men - see Figure 29 below. The unemployment rates for men increased incrementally
between 2011 Q4 and 2013 Q3. Both unemployment rates also increased for women, but were
driven to some extent by two large spikes in unemployment rates in 2011 Q2 and 2012 Q4. 2013
Q1 was then the beginning of a fairly steep drop in female unemployment which resulted in the
convergence of unemployment rates for men and women. In the final two quarters of 2014, both
the expanded and official unemployment rates for women decreased while the male
unemployment rates remained largely unchanged. In Q1 and Q2 of 2016, both the official and
expanded rates of female unemployment increased slightly. More broadly, however, there are no
statistical differences in the risk of unemployment between women and men in the province.
20,0
40,0
60,0
80,0
Q1 Q2 Q3 Q4 Q1 Q2 Q3 Q4 Q1 Q2
2014 2015 2016
%
Official Expanded
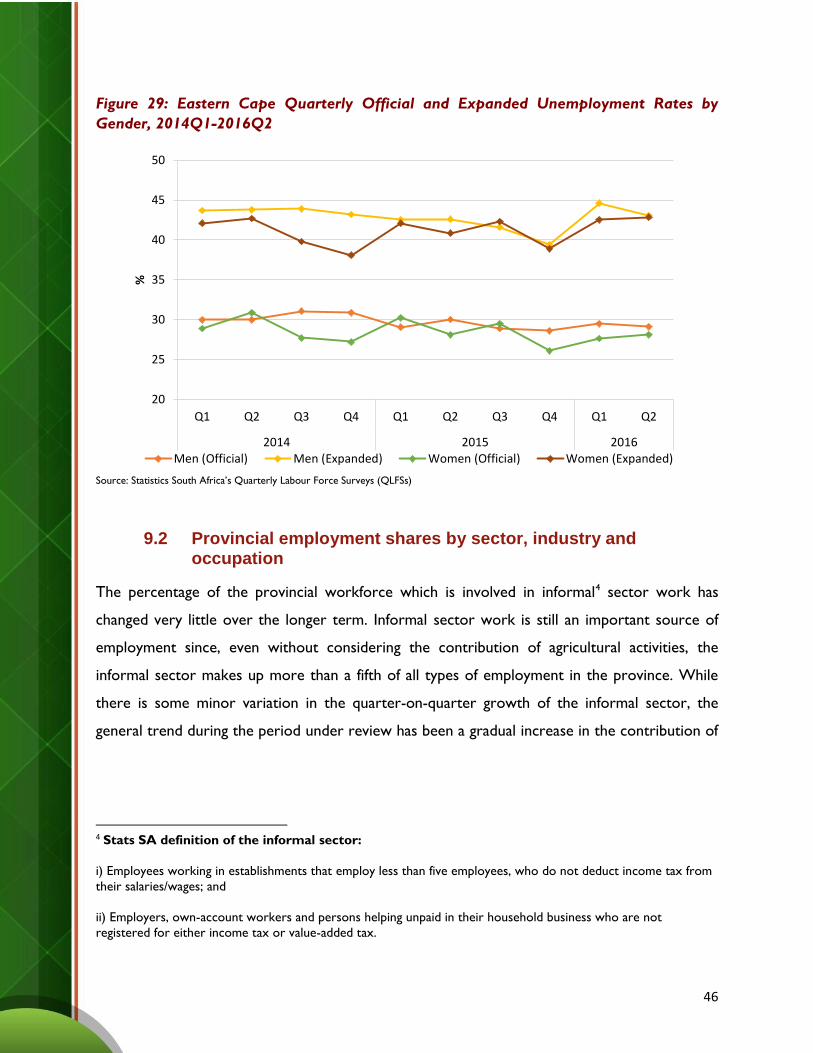
46
Figure 29: Eastern Cape Quarterly Official and Expanded Unemployment Rates by
Gender, 2014Q1-2016Q2
Source: Statistics South Africa’s Quarterly Labour Force Surveys (QLFSs)
9.2 Provincial employment shares by sector, industry and occupation
The percentage of the provincial workforce which is involved in informal4 sector work has
changed very little over the longer term. Informal sector work is still an important source of
employment since, even without considering the contribution of agricultural activities, the
informal sector makes up more than a fifth of all types of employment in the province. While
there is some minor variation in the quarter-on-quarter growth of the informal sector, the
general trend during the period under review has been a gradual increase in the contribution of
4 Stats SA definition of the informal sector:
i) Employees working in establishments that employ less than five employees, who do not deduct income tax from
their salaries/wages; and
ii) Employers, own-account workers and persons helping unpaid in their household business who are not
registered for either income tax or value-added tax.
20
25
30
35
40
45
50
Q1 Q2 Q3 Q4 Q1 Q2 Q3 Q4 Q1 Q2
2014 2015 2016
%
Men (Official) Men (Expanded) Women (Official) Women (Expanded)
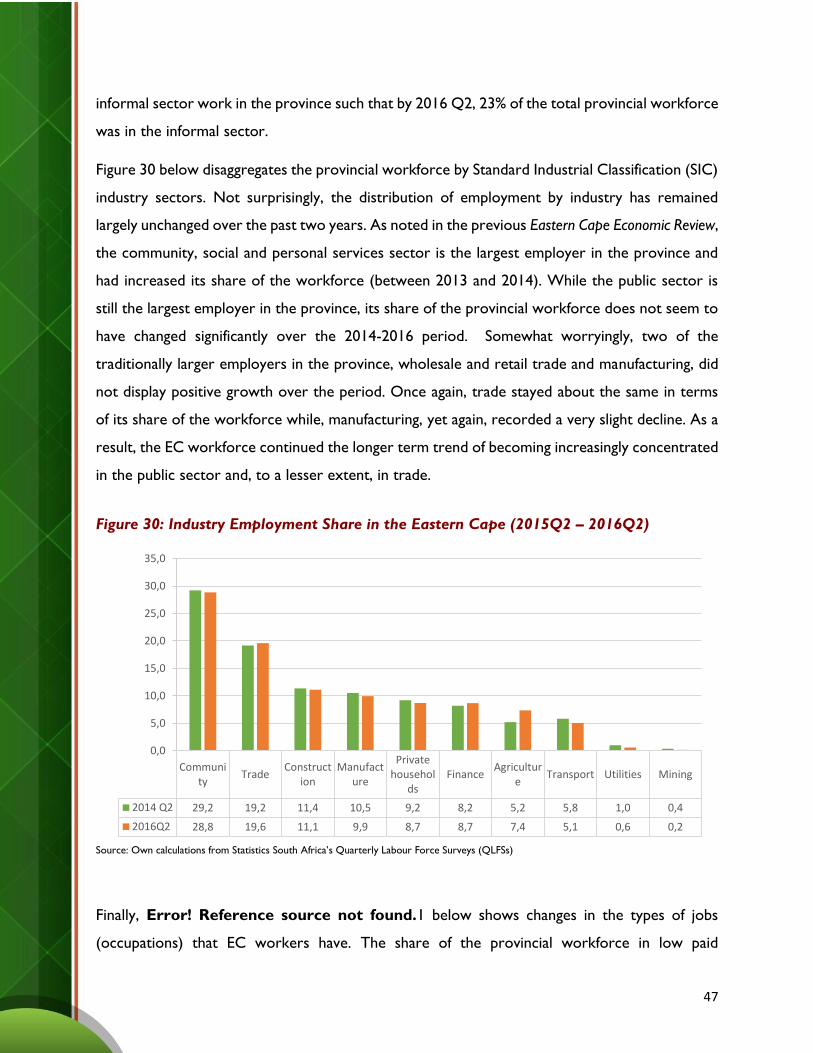
47
informal sector work in the province such that by 2016 Q2, 23% of the total provincial workforce
was in the informal sector.
Figure 30 below disaggregates the provincial workforce by Standard Industrial Classification (SIC)
industry sectors. Not surprisingly, the distribution of employment by industry has remained
largely unchanged over the past two years. As noted in the previous Eastern Cape Economic Review,
the community, social and personal services sector is the largest employer in the province and
had increased its share of the workforce (between 2013 and 2014). While the public sector is
still the largest employer in the province, its share of the provincial workforce does not seem to
have changed significantly over the 2014-2016 period. Somewhat worryingly, two of the
traditionally larger employers in the province, wholesale and retail trade and manufacturing, did
not display positive growth over the period. Once again, trade stayed about the same in terms
of its share of the workforce while, manufacturing, yet again, recorded a very slight decline. As a
result, the EC workforce continued the longer term trend of becoming increasingly concentrated
in the public sector and, to a lesser extent, in trade.
Figure 30: Industry Employment Share in the Eastern Cape (2015Q2 – 2016Q2)
Source: Own calculations from Statistics South Africa’s Quarterly Labour Force Surveys (QLFSs)
Finally, Error! Reference source not found.1 below shows changes in the types of jobs
(occupations) that EC workers have. The share of the provincial workforce in low paid
Community
TradeConstruct
ionManufact
ure
Privatehousehol
dsFinance
Agriculture
Transport Utilities Mining
2014 Q2 29,2 19,2 11,4 10,5 9,2 8,2 5,2 5,8 1,0 0,4
2016Q2 28,8 19,6 11,1 9,9 8,7 8,7 7,4 5,1 0,6 0,2
0,0
5,0
10,0
15,0
20,0
25,0
30,0
35,0
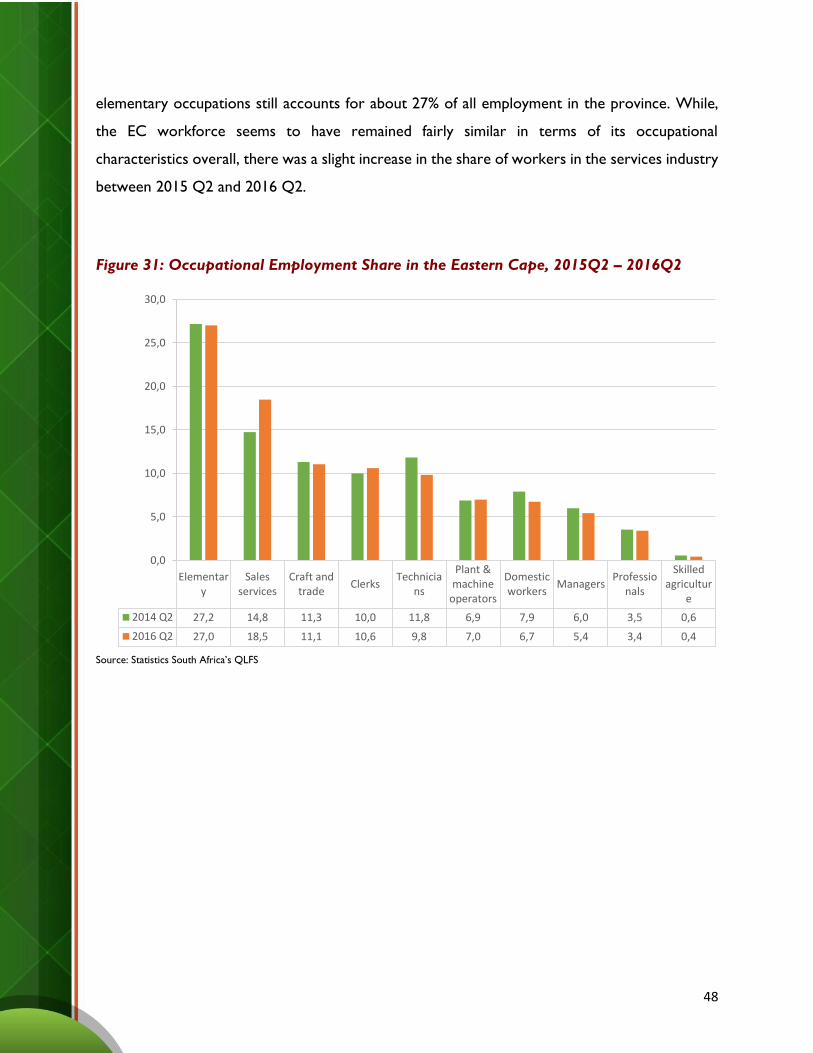
48
elementary occupations still accounts for about 27% of all employment in the province. While,
the EC workforce seems to have remained fairly similar in terms of its occupational
characteristics overall, there was a slight increase in the share of workers in the services industry
between 2015 Q2 and 2016 Q2.
Figure 31: Occupational Employment Share in the Eastern Cape, 2015Q2 – 2016Q2
Source: Statistics South Africa’s QLFS
Elementary
Salesservices
Craft andtrade
ClerksTechnicia
ns
Plant &machine
operators
Domesticworkers
ManagersProfessio
nals
Skilledagricultur
e
2014 Q2 27,2 14,8 11,3 10,0 11,8 6,9 7,9 6,0 3,5 0,6
2016 Q2 27,0 18,5 11,1 10,6 9,8 7,0 6,7 5,4 3,4 0,4
0,0
5,0
10,0
15,0
20,0
25,0
30,0
49
A collaborative publication by:
Coega Development Corporation
Economic Development, Environmental Affairs and Tourism (editorial chief)
East London IDZ
Eastern Cape Socio-Economic Consultative Council
Eastern Cape Development Corporation
Neil Aggett Labour Studies Unit, Rhodes University
Provincial Planning and Treasury
Comments? Questions?
Or would your institution like to contribute to this publication?
Contact: [email protected]