Embed Size (px)
Citation preview
276
Section B: National and District Profiles
276
Section B: Profile Eastern Cape Province
15 Eastern Cape Province
Buffalo City Metropolitan Municipality (BUF) Naomi Massyn and Pamela Groenewald
Buffalo City is situated on the east coast of the Eastern Cape Province and has a population of 757 267, with a population density of 299 people per km2. The district falls into socio-economic Quintile 4, which is among the wealthier districts.
Population distribution, sub-district boundaries and health facility locations: Buffalo City (BUF)
Broad age.. Female Male
<5 years
5-14
15-24
25-64
65+
Total 55.4%25.4%13.8%
24.4%
16.6%
15.6%
30.1%
18.7%
43.5%
82.7%
11.6%
21.0%
48.0%
38.9%
64.1%
24.5%
16.7%
12.3%
17.2%47.6%23.8%
42.9%
71.2%
17.5%
16.1%
25.8%
12.6%
40.2%
80.0%
15.3%
33.6%
64.8%
16.0%
9.5%9.6%
EC, Buffalo City: BUF
Broad age.. 2008-10 2011-13
<5 years
5-14
15-24
25-64
65+
30.7%
46.3%
11.9%
13.0%
30.9%
14.1%
39.9%
81.4%
11.5%
18.5%
28.1%
36.3%
67.0%
19.9%
11.6%
11.9%
8.5%
40.5%
49.0%
12.2%
20.8%
23.4%
16.8%
44.0%
81.7%
16.7%
25.1%
35.5%
60.2%
19.3%
9.1%
Rank.. 2008-10 2011-13
<5 y
ears
12345678910
5-14
12345678910
15-2
4
12345678910
25-6
4
12345678910
65+
12345678910
Protein-energy malnutrition (3.9%)Birth asphyxia (2.8%)
Fires, hot substances (2.6%)
Preterm birth complications (4.8%)
Accidental threats to breathing (2.7%)
Meningitis/encephalitis (2.1%)
Diarrhoeal diseases (24.3%)Lower respiratory infections (24.4%)
HIV/AIDS (7.3%)
Tuberculosis (4.4%)
Sepsis/other newborn infectious (3.1%)
Protein-energy malnutrition (3.5%)Birth asphyxia (3.4%)
Other respiratory (2.6%)
Preterm birth complications (8.4%)
Meningitis/encephalitis (2.7%)
Diarrhoeal diseases (15.7%)Lower respiratory infections (20.6%)
HIV/AIDS (6.2%)
Tuberculosis (2.9%)
Other neurological conditions (4.2%)
Drowning (12.1%)
Epilepsy (3.5%)Fires, hot substances (3.7%)
Accidental threats to breathing (4.4%)Road injuries (5.7%)Diarrhoeal diseases (6.9%)
Lower respiratory infections (4.2%)
HIV/AIDS (8.6%)Tuberculosis (11.1%)
Drowning (20.5%)
Epilepsy (4.1%)Fires, hot substances (3.7%)
Accidental threats to breathing (5.0%)Meningitis/encephalitis (6.1%)
Road injuries (12.6%)
Diarrhoeal diseases (4.9%)
Lower respiratory infections (3.6%)
HIV/AIDS (8.6%)Tuberculosis (11.3%)
Drowning (2.2%)
Fires, hot substances (4.5%)
Interpersonal violence (20.0%)
Mechanical forces (5.0%)
Accidental threats to breathing (9.6%)
Meningitis/encephalitis (2.5%)
Road injuries (3.7%)Lower respiratory infections (3.6%)
HIV/AIDS (8.1%)
Tuberculosis (20.5%)
Drowning (2.8%)
Epilepsy (1.8%)
Fires, hot substances (3.7%)
Interpersonal violence (19.9%)
Mechanical forces (6.4%)Accidental threats to breathing (8.4%)
Road injuries (5.5%)
Lower respiratory infections (2.5%)
HIV/AIDS (11.4%)Tuberculosis (14.3%)
Oesophagus (2.4%)
Interpersonal violence (3.8%)
COPD (2.6%)Diabetes mellitus (2.6%)
Ischaemic heart disease (2.6%)Diarrhoeal diseases (3.2%)
Cerebrovascular disease (4.0%)Lower respiratory infections (4.5%)
HIV/AIDS (10.3%)Tuberculosis (26.0%)
Interpersonal violence (3.1%)
Road injuries (2.6%)
COPD (2.9%)
Nephritis/nephrosis (2.8%)
Diabetes mellitus (3.0%)
Ischaemic heart disease (2.9%)
Cerebrovascular disease (4.5%)Lower respiratory infections (3.1%)
HIV/AIDS (14.7%)Tuberculosis (20.9%)
Oesophagus (4.8%)
Trachea/bronchi/lung (2.6%)Cardiomyopathy (3.8%)
COPD (6.4%)
Diabetes mellitus (4.6%)
Hypertensive heart disease (7.5%)Ischaemic heart disease (8.8%)
Cerebrovascular disease (13.7%)
Lower respiratory infections (4.4%)
Tuberculosis (6.5%)
Oesophagus (4.6%)
Cardiomyopathy (2.7%)
COPD (6.7%)
Nephritis/nephrosis (3.0%)
Diabetes mellitus (5.8%)
Hypertensive heart disease (8.0%)Ischaemic heart disease (8.0%)
Cerebrovascular disease (14.5%)
Lower respiratory infections (4.0%)
Tuberculosis (6.1%)
Prov, DistrictEC, Buffalo City: BUF
Show History
BroadcauseInjury
NCD
HIV and TB
Comm_mat_peri_nut
Percentage ofdeaths by broadcause and leadingcauses, 2008-2013
Section B: National and District Profiles
277
Section B: Profile Eastern Cape Province
277
Burden of disease profile
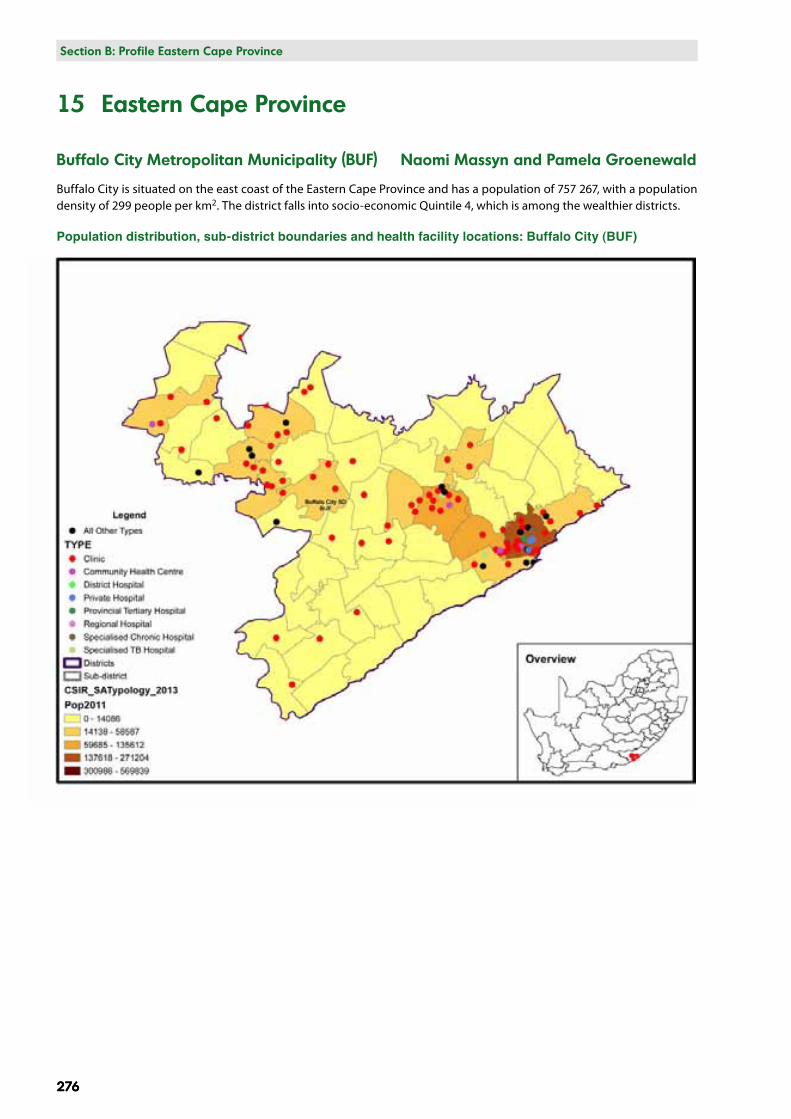
Percentage of deaths by broad cause and leading causes, 2008-2013: Buffalo City (BUF)
278
Section B: National and District Profiles
278
Section B: Profile Eastern Cape Province
Broad cause groups by age and gender
In the under-5-year age group, communicable diseases together with maternal, perinatal and nutritional conditions accounted for almost 65% of deaths. HIV and TB mortality was about 11.6% among females and 9.6% among males, and injuries accounted for around 9% of deaths.
In the 5–14-year age group there were bigger differences in the proportions of broad causes between females and males. Injuries accounted for 24.4% of deaths among females versus 42.9% of deaths among males; communicable diseases and maternal, perinatal and nutritional conditions accounted for 24.5% of deaths among females versus 16.0% among males; and HIV and TB accounted for 21.0% of deaths among females versus 15.3% among males.
In the 15–24-year age group, injury accounted for 71.2% of deaths among males compared with only 16.6% of deaths among females, while HIV and TB accounted for 48.0% of deaths among females.
In the 25–64-year age group, non-communicable diseases accounted for the largest proportion of deaths (43.5% among females and 40.2% among males). Injuries accounted for a smaller proportion of deaths in this age group, with the percentage being much higher among males (17.5%) than females (5.3%).
In the 65-years-and-older age group, non-communicable diseases accounted for the highest proportion of deaths (82.7% among females and 80.0% among males). HIV and TB deaths were higher among males than females.
Trends in broad cause groups by age
Among children under 5 years, there was a decline in deaths due to communicable diseases together with maternal, perinatal and nutritional conditions and HIV and TB, with a corresponding increase in deaths due to non-communicable diseases, and a slight increase in injury-related deaths. In the 5–14-year age group, there was a slight decrease in HIV and TB mortality, a bigger decrease in non-communicable disease mortality, and a marked increase in injury-related deaths (30.7% to 40.5%). In the 15–24, 25–64 and 65-years-and-older age groups there were no significant changes in the broad cause groups over the period.
Trends in leading causes of death by age
Under 5 years
Deaths due to lower respiratory infection, diarrhoea, and HIV and AIDS declined over this period but remained the leading causes. Tuberculosis also declined over this period, with prematurity and birth asphyxia increasing, and sepsis/other newborn infections moving into the top 10 causes of death. HIV-related mortality accounted for between 40% and 50% of mortality in this age group.
5–14 years
Drowning, road injuries, TB, and HIV and AIDS remained in the top four causes of death in this age group, with the proportion of road injuries and drowning increasing markedly. Diarrhoea and lower respiratory infections moved down in the ranking. Accidental threats to breathing, fires and epilepsy were also among the top 10 causes of death.
15–24 years
Interpersonal violence, TB, HIV and AIDS and accidental threats to breathing remained the top four causes of death over this period, with TB decreasing and moving down to second place in the ranking. Road injuries, fires, drowning and lower respiratory infections were also among the top 10 causes of death.
25–64 years
Tuberculosis, HIV and AIDS, cerebrovascular disease, lower respiratory infections and interpersonal violence remained the top five causes of death over the whole period. Diabetes mellitus, chronic obstructive pulmonary disease and ischaemic heart disease also appeared in the top 10 causes in both periods.
65 years and older
Cerebrovascular disease, hypertensive heart disease, ischaemic heart disease, chronic obstructive pulmonary disease and TB remained the leading causes of death in this age group over the whole period. Diabetes mellitus, oesophageal cancer, lower respiratory infections and cardiomyopathy remained in the top 10, with nephritis/nephrosis replacing tracheal/bronchial/lung cancer in the latter period.

Section B: National and District Profiles
279
Section B: Profile Eastern Cape Province
279
Indicator performance: Buffalo City (BUF)
District value
District ranking
Provincial average
Provincial target
Provincial target
National average
National target
National target
Category Indicator 2012/13 2013/14 2014/15 2014/15 2014/15 2014/15 2015/16 2014/15 2014/15 2015/16Management PHC
PHC supervisor visit rate (fixed clinic/CHC/CDC) [Percentage]
75.0 65.7 82.5 19 77.6 91.0 73.5
Management Inpatients
Average length of stay (district hospitals) [Days]
6.3 5.6 4.9 11 5.3 4.9 4.6
Expenditure per patient day equivalent (district hospitals) [Rand (real 2014/15 prices)]
2 099.5 2 042.8 2 066.6 9 2 005.9 2 136.4
Inpatient bed utilisation rate (district hospitals) [Percentage]
68.2 64.9 56.6 42 59.0 65.0 65.8
OPD new client not referred rate (district hospitals) [Percentage]
63.4 43.0 47.8 19 64.3 60.7
Mortality Inpatients
Child under 5 years diarrhoea case fatality rate [Percentage]
2.8 2.6 2.2 16 5.2 5.8 5.6 3.3 3.5 3.0
Child under 5 years pneumonia case fatality rate [Percentage]
1.4 2.1 2.4 21 4.2 6.0 4.0 2.9
Child under 5 years severe acute malnutrition case fatality rate [Percentage]
10.7 12.9 9.5 20 11.8 12.0 10.0 11.6 8.0 7.0
Inpatient crude death rate [Percentage]
6.9 6.4 5.8 31 6.3 5.2
Delivery Delivery by Caesarean section rate (district hospitals) [Percentage]
21.3 23.7 25.0 20.6 22.7
Delivery in facility under 18 years rate [Percentage]
6.4 6.1 5.9 8 9.6 10.3 7.4
Inpatient early neonatal death rate [per 1 000 live births]
14.0 12.8 13.1 43 13.3 12.0 10.1 0
Maternal mortality in facility ratio [per 100 000 live births]
196.9 133.3 206.7 43 148.3 114.0 112.0 132.5 100 80.0
Mother postnatal visit within 6 days rate [Percentage]
66.9 66.6 69.1 27 58.0 55.0 74.3 80.0 85.0
Stillbirth in facility rate [per 1 000 births]
22.1 23.2 21.3 27 19.6 20.7
PMTCT Antenatal 1st visit before 20 weeks rate [Percentage]
38.8 39.3 47.4 46 48.8 42.0 50.0 53.9 65.0 70.0
Antenatal client initiated on ART rate [Percentage]
69.3 79.6 98.2 5 91.7 90.0 91.2 93.0 96.0
Infant 1st PCR test around 6 weeks uptake rate [Percentage]
70.7 74.6 74.6 51 95.2 100.6
Infant 1st PCR test positive around 6 weeks rate [Percentage]
2.3 1.6 1.5 23 1.7 2.8 1.5 1.5 1.8 2.0
Child Health School Grade 1 screening coverage [Percentage]
13.2 8.0 48 13.4 70.0 27.4 23.2 30.0 35.0
Vitamin A dose 12-59 months coverage [Percentage]
32.1 33.5 41.7 49 53.0 55.0 55.0 52.2 55.0
Immunisation Immunisation coverage under 1 year [Percentage]
98.7 93.4 96.4 10 80.9 90.0 90.0 89.8 95.0 91.0
Measles 2nd dose coverage [Percentage]
73.8 72.7 79.8 25 73.6 95.0 90.0 82.8 85.0 85.0
Reproductive health
Cervical cancer screening coverage ([Percentage]
31.3 49.3 65.2 15 56.3 42.0 44.0 54.5 60.0 64.0
Couple year protection rate [Percentage]
26.7 30.6 45.2 28 39.4 60.0 46.8 55.0
TB case finding TB Rifampicin resistance confirmed client rate [Percentage]
9.8 7.9 7.9 43 6.0 6.4
HIVNon-communicable diseases
HIV testing coverage (including ANC)
24.8 31.6 35 36.0 32.1
Male condom distribution coverage
10.9 12.9 41.7 17 33.6 38.0 38.4
Hypertension incidence [per 1 000]
17.8 22.7 17.2 15.7 3.5 13.9
Mental health admission rate [Percentage]
0.3 0.4 1.3 1.2
Human Resources
PHC doctor clinical workload [Clients per doctor per day]
18.0 11.5 14.7 44 23.8 26.9
PHC professional nurse clinical workload [Clients per nurse per day]
21.4 21.4 22.5 33 33.7 29.4
280
Section B: National and District Profiles
280
Section B: Profile Eastern Cape Province
District value
District ranking
Provincial average
Provincial target
Provincial target
National average
National target
National target
Category Indicator 2011 2012 2013 2014 2013 2013 2013 2014 2013 2013 2014TB case finding
Incidence (diagnosed cases) of TB - all types [Cases per 100 000 population]
903.8 791.4 822.7 38 792.3 592.5
TB treatment outcomes
TB cure rate (new smear positive) [Percentage]
55.4 55.1 65.1 47 70.5 76.8
TB death rate (all TB) [Percentage] 9.7 8.4 6.4 13 9.3 5.9 7.4 6.0 5.0TB defaulter rate (new smear positive) [Percentage]
11.7 11.6 11.3 52 7.7 7.06.8
5.8 6.05.5
TB treatment success rate (all TB) [Percentage]
70.5 71.7 77.7 27 77.0 78.982.0
77.9 82.083.0
HIV Percentage of TB cases with known HIV status (ETR.Net) [Percentage]
86.2 87.0 90.7 40 92.3 92.8
TB/HIV co-infected client on ART rate (ETR.Net) [Percentage]
61.8 92.0 85.1 18 89.1 78.9
NCDs Hypertension prevalence rate (crude) [Percentage]
48.3 50 36.3 31.8
Burden of disease
Percentage of deaths garbage codes [Percentage]
17.3 17.3 16.8 45 13.5 14.5
Percentage of deaths ill-defined [Percentage]
6.5 7.8 8.4 17 20.7 14.0
Percentage of YLLs due to communicable, maternal, perinatal, nutrition causes [Percentage]
13.5 11.9 11.1 7 16.1 22.1
Percentage of YLLs due to HIV and TB [Percentage]
29.6 29.8 28.6 28 32.6 27.9
Percentage of YLLs due to injuries [Percentage]
15.7 13.5 15.7 44 14.2 13.1
Percentage of YLLs due to non-communicable diseases [Percentage]
41.3 44.7 44.6 43 37.1 36.9
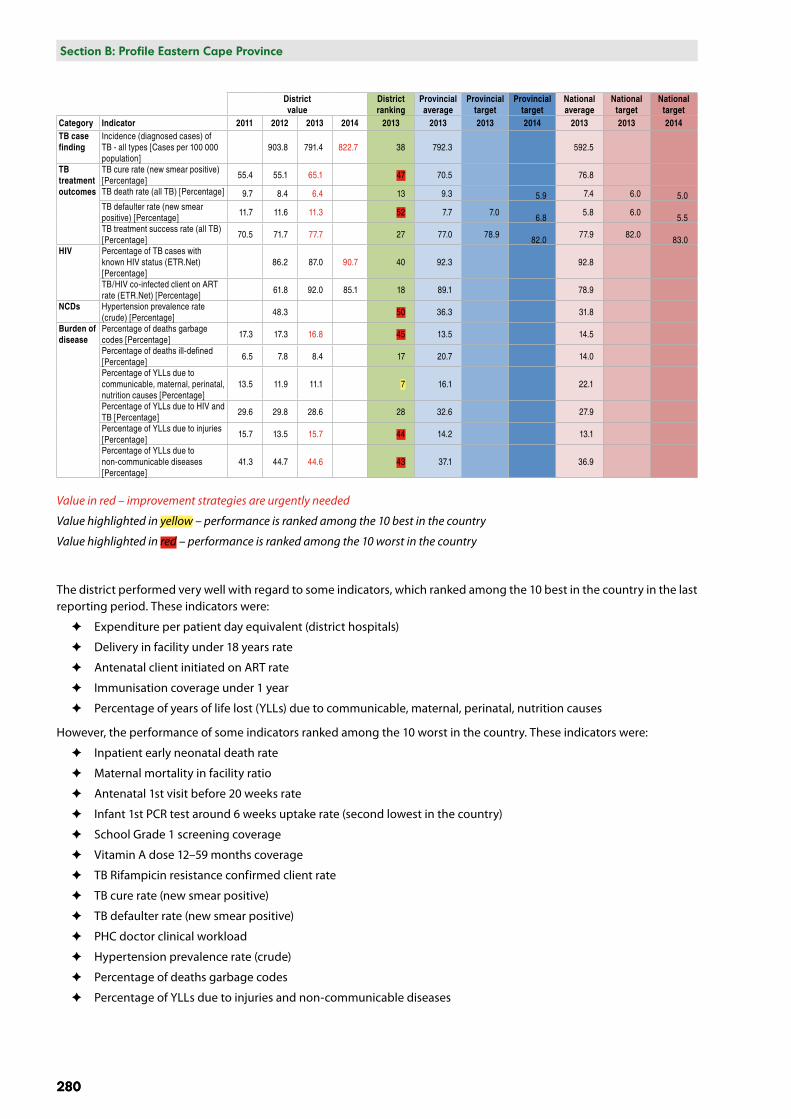
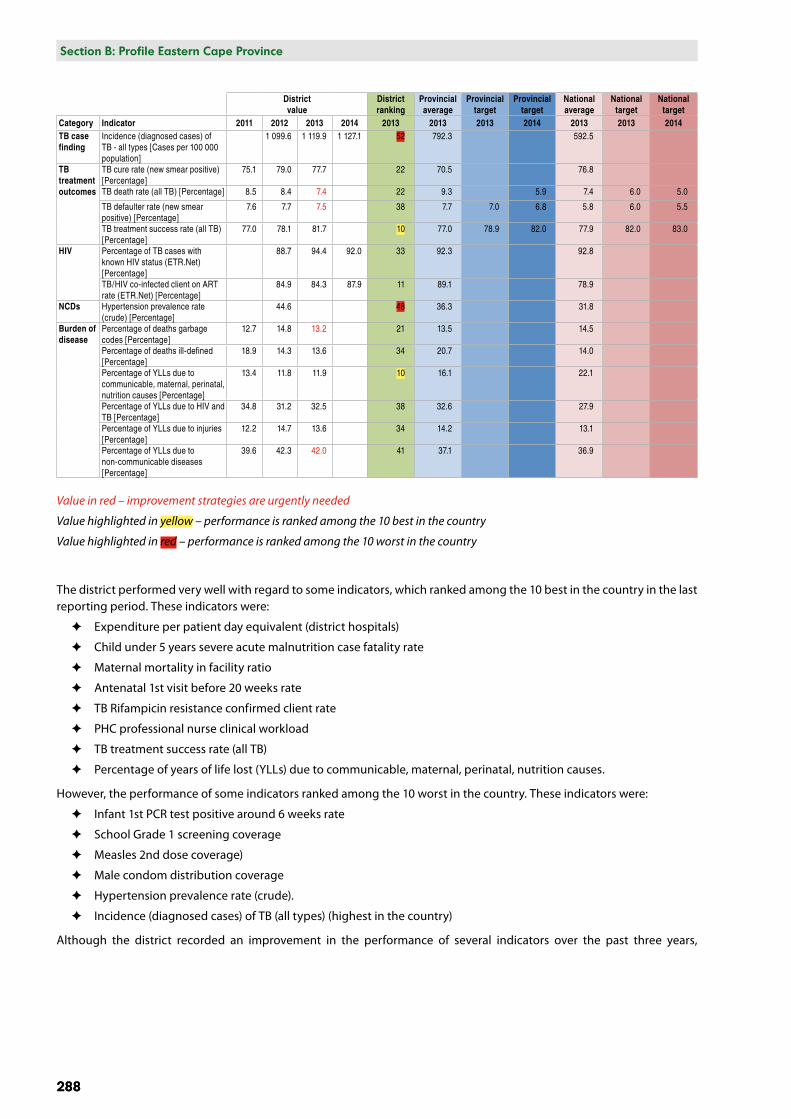
Value in red – improvement strategies are urgently needed
Value highlighted in yellow – performance is ranked among the 10 best in the country
Value highlighted in red – performance is ranked among the 10 worst in the country
The district performed very well with regard to some indicators, which ranked among the 10 best in the country in the last reporting period. These indicators were:
✦ Expenditure per patient day equivalent (district hospitals)
✦ Delivery in facility under 18 years rate
✦ Antenatal client initiated on ART rate
✦ Immunisation coverage under 1 year
✦ Percentage of years of life lost (YLLs) due to communicable, maternal, perinatal, nutrition causes
However, the performance of some indicators ranked among the 10 worst in the country. These indicators were:
✦ Inpatient early neonatal death rate
✦ Maternal mortality in facility ratio
✦ Antenatal 1st visit before 20 weeks rate
✦ Infant 1st PCR test around 6 weeks uptake rate (second lowest in the country)
✦ School Grade 1 screening coverage
✦ Vitamin A dose 12–59 months coverage
✦ TB Rifampicin resistance confirmed client rate
✦ TB cure rate (new smear positive)
✦ TB defaulter rate (new smear positive)
✦ PHC doctor clinical workload
✦ Hypertension prevalence rate (crude)
✦ Percentage of deaths garbage codes
✦ Percentage of YLLs due to injuries and non-communicable diseases
Section B: National and District Profiles
281
Section B: Profile Eastern Cape Province
281
Although the district recorded an improvement in the performance of several indicators over the past three years, improvement strategies are needed urgently for the following indicators, especially when compared with the district ranking, 2014/15 provincial and national averages, and the 2014/15 and 2015/16 provincial and national targets. These indicators are:
✦ Child under 5 years severe acute malnutrition case fatality rate
✦ Delivery by Caesarean section rate (district hospitals)
✦ PHC supervisor visit rate (fixed clinic/CHC/CDC)
✦ Inpatient bed utilisation rate (district hospitals)
✦ Inpatient early neonatal death rate
✦ Maternal mortality in facility ratio
✦ Mother postnatal visit within 6 days rate
✦ Stillbirth in facility rate
✦ Antenatal 1st visit before 20 weeks rate
✦ Infant 1st PCR test around 6 weeks uptake rate
✦ School Grade 1 screening coverage
✦ Vitamin A dose 12–59 months coverage
✦ Measles 2nd dose coverage
✦ Couple year protection rate
✦ Incidence (diagnosed cases) of TB (all types)
✦ TB Rifampicin resistance confirmed client rate
✦ TB cure rate (new smear positive)
✦ TB death rate (all TB)
✦ TB defaulter rate (new smear positive)
✦ TB treatment success rate (all TB)
✦ HIV testing coverage (including ANC)
✦ Percentage of TB cases with known HIV status
✦ Hypertension incidence
✦ Hypertension prevalence rate (crude)
✦ PHC doctor and professional nurse clinical workload
✦ Percentage of deaths garbage codes
✦ Percentage of YLLs due to injuries
✦ Percentage of YLLs due to non-communicable diseases
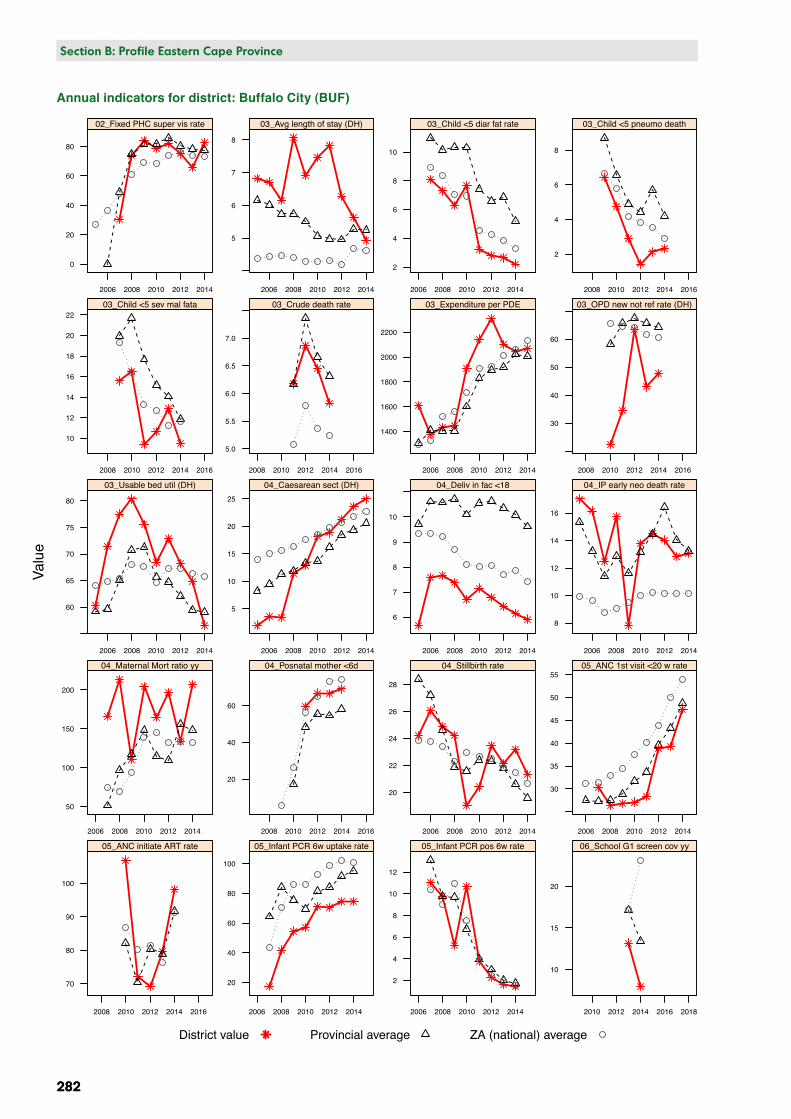
Annual indicators for district: Buffalo City: BUF
Valu
e
0
20
40
60
80
2006 2008 2010 2012 2014
02_Fixed PHC super vis rate
5
6
7
8
2006 2008 2010 2012 2014
03_Avg length of stay (DH)
2
4
6
8
10
2006 2008 2010 2012 2014
03_Child <5 diar fat rate
2
4
6
8
2008 2010 2012 2014 2016
03_Child <5 pneumo death
10
12
14
16
18
20
22
2008 2010 2012 2014 2016
03_Child <5 sev mal fata
5.0
5.5
6.0
6.5
7.0
2008 2010 2012 2014 2016
03_Crude death rate
1400
1600
1800
2000
2200
2006 2008 2010 2012 2014
03_Expenditure per PDE
30
40
50
60
2008 2010 2012 2014 2016
03_OPD new not ref rate (DH)
60
65
70
75
80
2006 2008 2010 2012 2014
03_Usable bed util (DH)
5
10
15
20
25
2006 2008 2010 2012 2014
04_Caesarean sect (DH)
6
7
8
9
10
2006 2008 2010 2012 2014
04_Deliv in fac <18
8
10
12
14
16
2006 2008 2010 2012 2014
04_IP early neo death rate
50
100
150
200
2006 2008 2010 2012 2014
04_Maternal Mort ratio yy
20
40
60
2008 2010 2012 2014 2016
04_Posnatal mother <6d
20
22
24
26
28
2006 2008 2010 2012 2014
04_Stillbirth rate
30
35
40
45
50
55
2006 2008 2010 2012 2014
05_ANC 1st visit <20 w rate
70
80
90
100
2008 2010 2012 2014 2016
05_ANC initiate ART rate
20
40
60
80
100
2006 2008 2010 2012 2014
05_Infant PCR 6w uptake rate
2
4
6
8
10
12
2006 2008 2010 2012 2014
05_Infant PCR pos 6w rate
10
15
20
2010 2012 2014 2016 2018
06_School G1 screen cov yy
District value Provincial average ZA (national) average
282
Section B: National and District Profiles
282
Section B: Profile Eastern Cape Province
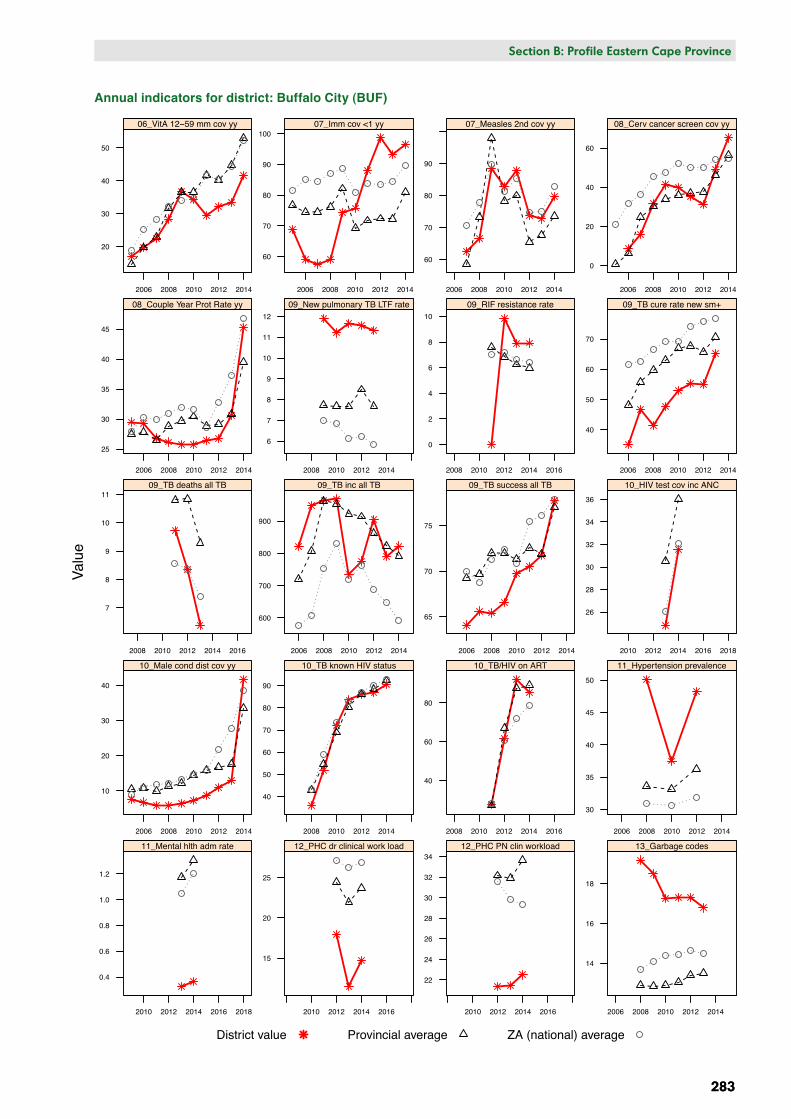
Annual indicators for district: Buffalo City (BUF)
Annual indicators for district: Buffalo City: BUFVa
lue
20
30
40
50
2006 2008 2010 2012 2014
06_VitA 12−59 mm cov yy
60
70
80
90
100
2006 2008 2010 2012 2014
07_Imm cov <1 yy
60
70
80
90
2006 2008 2010 2012 2014
07_Measles 2nd cov yy
0
20
40
60
2006 2008 2010 2012 2014
08_Cerv cancer screen cov yy
25
30
35
40
45
2006 2008 2010 2012 2014
08_Couple Year Prot Rate yy
6
7
8
9
10
11
12
2008 2010 2012 2014
09_New pulmonary TB LTF rate
0
2
4
6
8
10
2008 2010 2012 2014 2016
09_RIF resistance rate
40
50
60
70
2006 2008 2010 2012 2014
09_TB cure rate new sm+
7
8
9
10
11
2008 2010 2012 2014 2016
09_TB deaths all TB
600
700
800
900
2006 2008 2010 2012 2014
09_TB inc all TB
65
70
75
2006 2008 2010 2012 2014
09_TB success all TB
26
28
30
32
34
36
2010 2012 2014 2016 2018
10_HIV test cov inc ANC
10
20
30
40
2006 2008 2010 2012 2014
10_Male cond dist cov yy
40
50
60
70
80
90
2008 2010 2012 2014
10_TB known HIV status
40
60
80
2008 2010 2012 2014 2016
10_TB/HIV on ART
30
35
40
45
50
2006 2008 2010 2012 2014
11_Hypertension prevalence
0.4
0.6
0.8
1.0
1.2
2010 2012 2014 2016 2018
11_Mental hlth adm rate
15
20
25
2010 2012 2014 2016
12_PHC dr clinical work load
22
24
26
28
30
32
34
2010 2012 2014 2016
12_PHC PN clin workload
14
16
18
2006 2008 2010 2012 2014
13_Garbage codes
District value Provincial average ZA (national) average
Section B: National and District Profiles
283
Section B: Profile Eastern Cape Province
283
Annual indicators for district: Buffalo City (BUF)
284
Section B: National and District Profiles
284
Section B: Profile Eastern Cape Province
Sarah Baartman District Municipality (DC10) Naomi Massyn and Pamela Groenewald
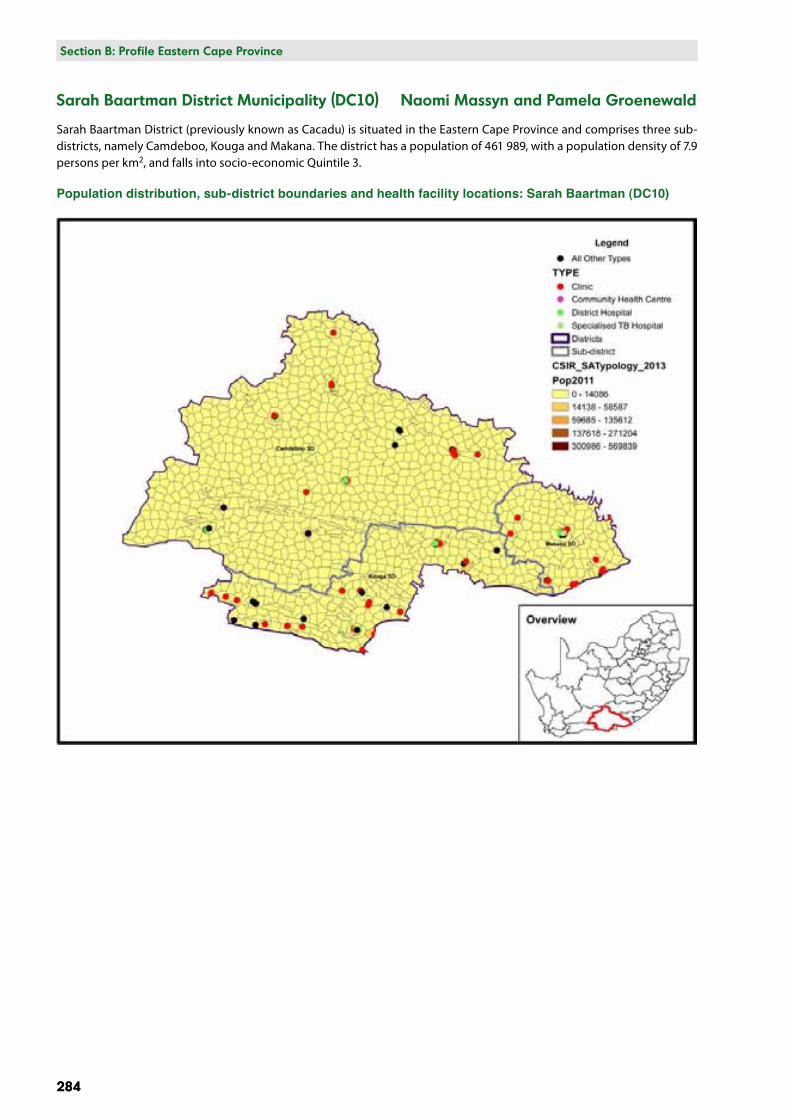
Sarah Baartman District (previously known as Cacadu) is situated in the Eastern Cape Province and comprises three sub-districts, namely Camdeboo, Kouga and Makana. The district has a population of 461 989, with a population density of 7.9 persons per km2, and falls into socio-economic Quintile 3.
Population distribution, sub-district boundaries and health facility locations: Sarah Baartman (DC10)
Broad age.. Female Male
<5 years
5-14
15-24
25-64
65+
Total 54.5%26.9%13.2%
36.7%
18.7%
21.9%
41.9%
84.3%
12.6%
19.3%
60.3%
43.1%
71.7%
22.1%
11.4% 9.7%
9.2%
14.9%46.7%26.8%11.7%
51.8%
67.9%
16.8%
18.1%
37.4%
80.8%
11.3%
20.2%
18.6%
38.2%
72.1%
9.2%
EC, S Baartman: DC10
Broad age.. 2008-10 2011-13
<5 years
5-14
15-24
25-64
65+
44.6%
43.5%
12.4%
19.2%
38.0%
82.6%
13.1%
22.5%
40.0%
40.5%
73.0%
13.7%
9.1%
9.2%
47.2%
46.3%
11.9%
12.9%
20.1%
41.1%
82.9%
16.5%
35.9%
40.1%
69.8%
16.3%
9.7%
Rank.. 2008-10 2011-13
<5 y
ears
12345678910
5-14
12345678910
15-2
4
12345678910
25-6
4
12345678910
65+
12345678910
Sepsis/other newborn infectious (2.1%)
Protein-energy malnutrition (6.9%)Birth asphyxia (5.5%)
Other respiratory (1.8%)
Preterm birth complications (10.2%)
Meningitis/encephalitis (1.6%)
Diarrhoeal diseases (22.1%)Lower respiratory infections (24.0%)
HIV/AIDS (8.2%)
Tuberculosis (5.3%)Congenital heart anomalies (3.3%)
Other perinatal conditions (2.2%)Sepsis/other newborn infectious (2.3%)
Protein-energy malnutrition (6.1%)Birth asphyxia (5.9%)
Preterm birth complications (10.6%)Diarrhoeal diseases (17.7%)
Lower respiratory infections (26.3%)
HIV/AIDS (5.6%)Tuberculosis (4.6%)
Other unintentional injuries (4.6%)
Other neurological conditions (7.3%)
Drowning (24.4%)
Epilepsy (4.9%)
Interpersonal violence (4.2%)
Road injuries (13.4%)
Diarrhoeal diseases (3.1%)
Lower respiratory infections (5.5%)
HIV/AIDS (10.2%)
Tuberculosis (16.5%)Drowning (35.5%)
Accidental threats to breathing (6.5%)
Meningitis/encephalitis (3.9%)
Road injuries (19.3%)
Diabetes mellitus (4.3%)
Lower respiratory infections (7.8%)
HIV/AIDS (14.5%)Tuberculosis (8.3%)
Drowning (4.4%)
Fires, hot substances (2.2%)
Interpersonal violence (22.8%)
Mechanical forces (2.4%)
Accidental threats to breathing (5.3%)Road injuries (7.6%)
Diarrhoeal diseases (1.8%)
Lower respiratory infections (4.6%)
HIV/AIDS (20.4%)Tuberculosis (21.3%)
Drowning (6.5%)
Fires, hot substances (2.6%)
Interpersonal violence (18.7%)
Mechanical forces (3.8%)
Accidental threats to breathing (12.7%)
Road injuries (4.4%)
Nephritis/nephrosis (1.6%)
Lower respiratory infections (3.5%)
HIV/AIDS (18.6%)
Tuberculosis (19.9%)
Trachea/bronchi/lung (2.3%)
Interpersonal violence (4.2%)
Road injuries (3.0%)COPD (2.6%)
Hypertensive heart disease (3.1%)
Ischaemic heart disease (5.2%)
Cerebrovascular disease (4.7%)Lower respiratory infections (5.2%)
HIV/AIDS (17.4%)Tuberculosis (23.3%)
Interpersonal violence (3.1%)
Road injuries (2.8%)COPD (3.0%)
Diabetes mellitus (2.6%)Hypertensive heart disease (2.8%)
Ischaemic heart disease (4.8%)Cerebrovascular disease (5.1%)
Lower respiratory infections (3.4%)
HIV/AIDS (18.9%)Tuberculosis (21.4%)
Prostate (2.8%)
Trachea/bronchi/lung (3.9%)
COPD (6.1%)
Nephritis/nephrosis (2.8%)
Diabetes mellitus (3.4%)
Hypertensive heart disease (10.0%)Ischaemic heart disease (13.7%)Cerebrovascular disease (15.3%)
Lower respiratory infections (6.7%)
Tuberculosis (5.4%)
Prostate (2.7%)Trachea/bronchi/lung (3.2%)
COPD (6.7%)
Nephritis/nephrosis (3.6%)Diabetes mellitus (4.9%)
Hypertensive heart disease (9.9%)Ischaemic heart disease (10.4%)
Cerebrovascular disease (16.5%)
Lower respiratory infections (5.4%)Tuberculosis (5.7%)
Prov, DistrictEC, S Baartman: DC10
Show History
BroadcauseInjury
NCD
HIV and TB
Comm_mat_peri_nut
Percentage ofdeaths by broadcause and leadingcauses, 2008-2013
Section B: National and District Profiles
285
Section B: Profile Eastern Cape Province
285
Burden of disease profile
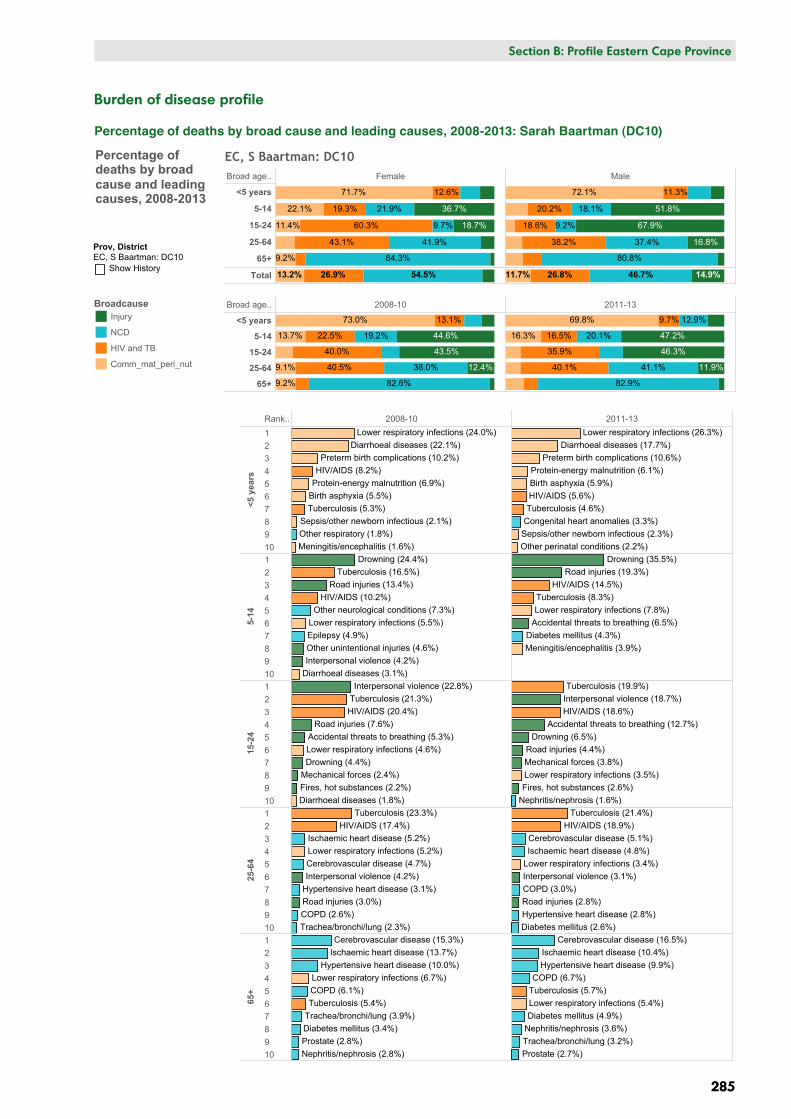
Percentage of deaths by broad cause and leading causes, 2008-2013: Sarah Baartman (DC10)
286
Section B: National and District Profiles
286
Section B: Profile Eastern Cape Province
Broad cause groups by age and gender
In the under-5-year age group, communicable diseases together with maternal, perinatal and nutritional conditions accounted for over 70% of deaths. HIV and TB accounted for about 12% of deaths, and injuries for around 5%.
In the 5–14-year age group there were bigger differences in the proportions of broad causes between males and females, with injuries accounting for 36.7% of deaths among females and 51.8% of deaths among males.
In the 15–24-year age group, injury accounted for 67.9% of deaths among males compared with only 18.7% of deaths among females, while HIV and TB accounted for 60.3% of deaths among females compared with only 18.6% among males.
In the 25–64-year age group, HIV and TB accounted for the largest proportion of deaths (38.2% among males and 43.1% among females). Injuries accounted for a small proportion of deaths in this age group, with the percentage being much higher among males than females (16.8% versus 4.8%).
In the 65-years-and-older age group, non-communicable diseases accounted for the highest proportion of deaths (84.3% among females and 80.8% among males).
Trends in broad cause groups by age
Among children under 5 years, there was a decline in deaths due to communicable diseases together with maternal, perinatal and nutritional conditions and HIV and TB. In the 5–14-year age group, there was a slight decrease in HIV and TB mortality, and a slight increase in injury-related deaths. In the 15–24-year group, deaths due to HIV and TB declined, and deaths due to non-communicable diseases and injuries increased. There was not much change in the broad cause groups over the period for the 25–64-year and the 65-years-and-older age groups.
Trends in leading causes of death by age
Under 5 years
Lower respiratory infections, diarrhoea, prematurity, protein-energy malnutrition, birth asphyxia, HIV and AIDS and TB remained the top causes of death, with HIV and AIDS moving down in the ranking slightly. HIV-related mortality accounted for almost 50% of mortality in this age group.
5–14 years
Drowning, road injuries, HIV and AIDS, and TB remained the top four causes of death in this age group. Diabetes mellitus also came up as a leading cause of death in the second period, which is unusual for this age group.
15–24 years
TB, interpersonal violence, HIV and AIDS, drowning and road injuries remained in the top seven causes of death over this period. Lower respiratory infections and fires were also among the top 10 causes.
25–64 years
TB and HIV and AIDS remained the top causes of death over the whole period. The other leading causes included cerebrovascular disease, ischaemic heart disease, lower respiratory infections, chronic obstructive pulmonary disease, road injuries, hypertensive heart disease and diabetes mellitus, which replaced lung cancer in the top 10 in the latter period.
65 years and older
Cerebrovascular disease, ischaemic heart disease, hypertensive heart disease and chronic obstructive pulmonary disease remained the leading causes of death in this age group over the whole period. Tuberculosis and lower respiratory infections, diabetes, lung cancer and prostate cancer also appeared among the leading causes.
Section B: National and District Profiles
287
Section B: Profile Eastern Cape Province
287
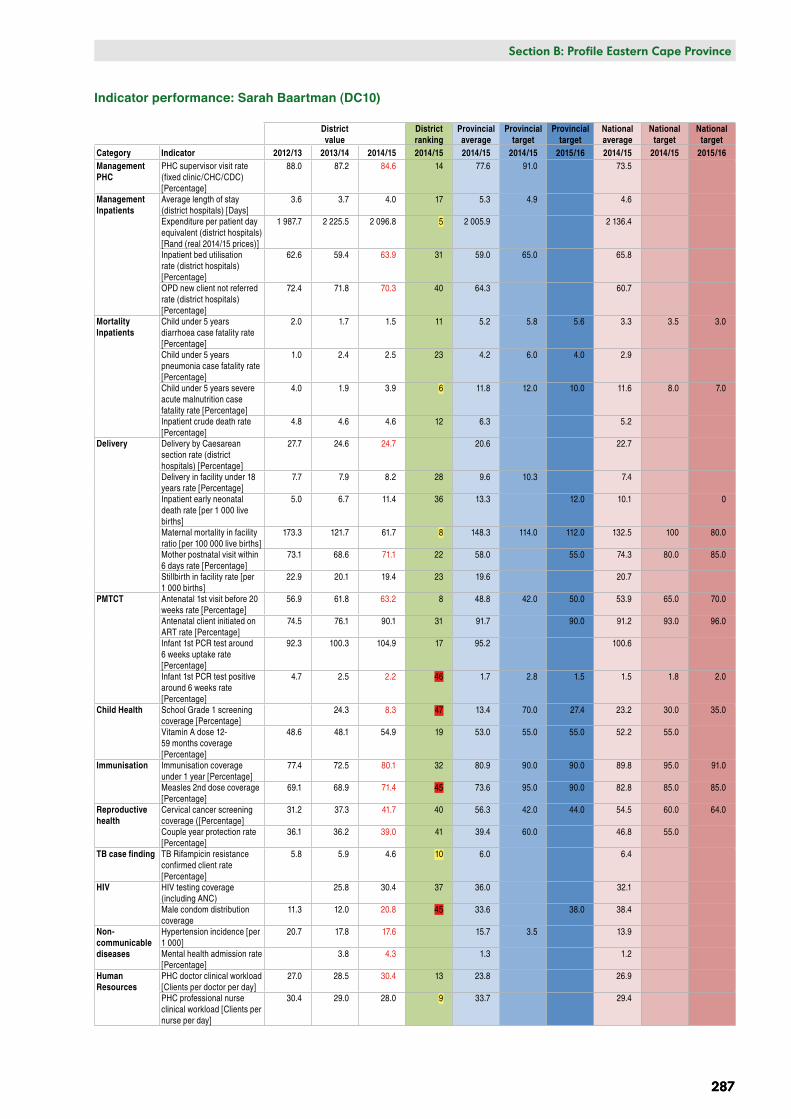
Indicator performance: Sarah Baartman (DC10)
District value
District ranking
Provincial average
Provincial target
Provincial target
National average
National target
National target
Category Indicator 2012/13 2013/14 2014/15 2014/15 2014/15 2014/15 2015/16 2014/15 2014/15 2015/16Management PHC
PHC supervisor visit rate (fixed clinic/CHC/CDC) [Percentage]
88.0 87.2 84.6 14 77.6 91.0 73.5
Management Inpatients
Average length of stay (district hospitals) [Days]
3.6 3.7 4.0 17 5.3 4.9 4.6
Expenditure per patient day equivalent (district hospitals) [Rand (real 2014/15 prices)]
1 987.7 2 225.5 2 096.8 5 2 005.9 2 136.4
Inpatient bed utilisation rate (district hospitals) [Percentage]
62.6 59.4 63.9 31 59.0 65.0 65.8
OPD new client not referred rate (district hospitals) [Percentage]
72.4 71.8 70.3 40 64.3 60.7
Mortality Inpatients
Child under 5 years diarrhoea case fatality rate [Percentage]
2.0 1.7 1.5 11 5.2 5.8 5.6 3.3 3.5 3.0
Child under 5 years pneumonia case fatality rate [Percentage]
1.0 2.4 2.5 23 4.2 6.0 4.0 2.9
Child under 5 years severe acute malnutrition case fatality rate [Percentage]
4.0 1.9 3.9 6 11.8 12.0 10.0 11.6 8.0 7.0
Inpatient crude death rate [Percentage]
4.8 4.6 4.6 12 6.3 5.2
Delivery Delivery by Caesarean section rate (district hospitals) [Percentage]
27.7 24.6 24.7 20.6 22.7
Delivery in facility under 18 years rate [Percentage]
7.7 7.9 8.2 28 9.6 10.3 7.4
Inpatient early neonatal death rate [per 1 000 live births]
5.0 6.7 11.4 36 13.3 12.0 10.1 0
Maternal mortality in facility ratio [per 100 000 live births]
173.3 121.7 61.7 8 148.3 114.0 112.0 132.5 100 80.0
Mother postnatal visit within 6 days rate [Percentage]
73.1 68.6 71.1 22 58.0 55.0 74.3 80.0 85.0
Stillbirth in facility rate [per 1 000 births]
22.9 20.1 19.4 23 19.6 20.7
PMTCT Antenatal 1st visit before 20 weeks rate [Percentage]
56.9 61.8 63.2 8 48.8 42.0 50.0 53.9 65.0 70.0
Antenatal client initiated on ART rate [Percentage]
74.5 76.1 90.1 31 91.7 90.0 91.2 93.0 96.0
Infant 1st PCR test around 6 weeks uptake rate [Percentage]
92.3 100.3 104.9 17 95.2 100.6
Infant 1st PCR test positive around 6 weeks rate [Percentage]
4.7 2.5 2.2 46 1.7 2.8 1.5 1.5 1.8 2.0
Child Health School Grade 1 screening coverage [Percentage]
24.3 8.3 47 13.4 70.0 27.4 23.2 30.0 35.0
Vitamin A dose 12-59 months coverage [Percentage]
48.6 48.1 54.9 19 53.0 55.0 55.0 52.2 55.0
Immunisation Immunisation coverage under 1 year [Percentage]
77.4 72.5 80.1 32 80.9 90.0 90.0 89.8 95.0 91.0
Measles 2nd dose coverage [Percentage]
69.1 68.9 71.4 45 73.6 95.0 90.0 82.8 85.0 85.0
Reproductive health
Cervical cancer screening coverage ([Percentage]
31.2 37.3 41.7 40 56.3 42.0 44.0 54.5 60.0 64.0
Couple year protection rate [Percentage]
36.1 36.2 39.0 41 39.4 60.0 46.8 55.0
TB case finding TB Rifampicin resistance confirmed client rate [Percentage]
5.8 5.9 4.6 10 6.0 6.4
HIV HIV testing coverage (including ANC)
25.8 30.4 37 36.0 32.1
Male condom distribution coverage
11.3 12.0 20.8 45 33.6 38.0 38.4
Non-communicable diseases
Hypertension incidence [per 1 000]
20.7 17.8 17.6 15.7 3.5 13.9
Mental health admission rate [Percentage]
3.8 4.3 1.3 1.2
Human Resources
PHC doctor clinical workload [Clients per doctor per day]
27.0 28.5 30.4 13 23.8 26.9
PHC professional nurse clinical workload [Clients per nurse per day]
30.4 29.0 28.0 9 33.7 29.4
288
Section B: National and District Profiles
288
Section B: Profile Eastern Cape Province
District value
District ranking
Provincial average
Provincial target
Provincial target
National average
National target
National target
Category Indicator 2011 2012 2013 2014 2013 2013 2013 2014 2013 2013 2014TB case finding
Incidence (diagnosed cases) of TB - all types [Cases per 100 000 population]
1 099.6 1 119.9 1 127.1 52 792.3 592.5
TB treatment outcomes
TB cure rate (new smear positive) [Percentage]
75.1 79.0 77.7 22 70.5 76.8
TB death rate (all TB) [Percentage] 8.5 8.4 7.4 22 9.3 5.9 7.4 6.0 5.0
TB defaulter rate (new smear positive) [Percentage]
7.6 7.7 7.5 38 7.7 7.0 6.8 5.8 6.0 5.5
TB treatment success rate (all TB) [Percentage]
77.0 78.1 81.7 10 77.0 78.9 82.0 77.9 82.0 83.0
HIV Percentage of TB cases with known HIV status (ETR.Net) [Percentage]
88.7 94.4 92.0 33 92.3 92.8
TB/HIV co-infected client on ART rate (ETR.Net) [Percentage]
84.9 84.3 87.9 11 89.1 78.9
NCDs Hypertension prevalence rate (crude) [Percentage]
44.6 48 36.3 31.8
Burden of disease
Percentage of deaths garbage codes [Percentage]
12.7 14.8 13.2 21 13.5 14.5
Percentage of deaths ill-defined [Percentage]
18.9 14.3 13.6 34 20.7 14.0
Percentage of YLLs due to communicable, maternal, perinatal, nutrition causes [Percentage]
13.4 11.8 11.9 10 16.1 22.1
Percentage of YLLs due to HIV and TB [Percentage]
34.8 31.2 32.5 38 32.6 27.9
Percentage of YLLs due to injuries [Percentage]
12.2 14.7 13.6 34 14.2 13.1
Percentage of YLLs due to non-communicable diseases [Percentage]
39.6 42.3 42.0 41 37.1 36.9
Value in red – improvement strategies are urgently needed
Value highlighted in yellow – performance is ranked among the 10 best in the country
Value highlighted in red – performance is ranked among the 10 worst in the country
The district performed very well with regard to some indicators, which ranked among the 10 best in the country in the last reporting period. These indicators were:
✦ Expenditure per patient day equivalent (district hospitals)
✦ Child under 5 years severe acute malnutrition case fatality rate
✦ Maternal mortality in facility ratio
✦ Antenatal 1st visit before 20 weeks rate
✦ TB Rifampicin resistance confirmed client rate
✦ PHC professional nurse clinical workload
✦ TB treatment success rate (all TB)
✦ Percentage of years of life lost (YLLs) due to communicable, maternal, perinatal, nutrition causes.
However, the performance of some indicators ranked among the 10 worst in the country. These indicators were:
✦ Infant 1st PCR test positive around 6 weeks rate
✦ School Grade 1 screening coverage
✦ Measles 2nd dose coverage)
✦ Male condom distribution coverage
✦ Hypertension prevalence rate (crude).
✦ Incidence (diagnosed cases) of TB (all types) (highest in the country)
Although the district recorded an improvement in the performance of several indicators over the past three years,
Section B: National and District Profiles
289
Section B: Profile Eastern Cape Province
289
improvement strategies are needed urgently for the following indicators, especially when compared with the district ranking, 2014/15 provincial and national averages, and the 2014/15 and 2015/16 provincial and national targets. These indicators are:
✦ PHC supervisor visit rate (fixed clinic/CHC/CDC)
✦ Inpatient bed utilisation rate
✦ OPD new client not referred rate
✦ Delivery by Caesarean section rate
✦ Antenatal client initiated on ART rate
✦ Infant 1st PCR test positive around 6 weeks rate
✦ Mother postnatal visit within 6 days rate
✦ School Grade 1 screening coverage
✦ Immunisation coverage under 1 year
✦ Measles 2nd dose coverage
✦ Cervical cancer screening coverage
✦ Couple year protection rate
✦ Hypertension incidence
✦ Mental health admission rate
✦ HIV testing coverage (including ANC)
✦ PHC doctor clinical workload
✦ Incidence (diagnosed cases) of TB (all types)
✦ TB defaulter rate (new smear positive)
✦ Hypertension prevalence rate (crude)
✦ Percentage of YLLs due to non-communicable diseases
✦ TB death rate (all TB)
Annual indicators for district: S Baartman: DC10
Valu
e
0
20
40
60
80
2006 2008 2010 2012 2014
02_Fixed PHC super vis rate
3.5
4.0
4.5
5.0
5.5
6.0
2006 2008 2010 2012 2014
03_Avg length of stay (DH)
2
4
6
8
10
2006 2008 2010 2012 2014
03_Child <5 diar fat rate
2
4
6
8
2008 2010 2012 2014 2016
03_Child <5 pneumo death
5
10
15
20
2008 2010 2012 2014 2016
03_Child <5 sev mal fata
5
6
7
2008 2010 2012 2014 2016
03_Crude death rate
1200
1400
1600
1800
2000
2200
2006 2008 2010 2012 2014
03_Expenditure per PDE
60
65
70
75
80
85
2008 2010 2012 2014 2016
03_OPD new not ref rate (DH)
60
65
70
2006 2008 2010 2012 2014
03_Usable bed util (DH)
10
15
20
25
2006 2008 2010 2012 2014
04_Caesarean sect (DH)
8
9
10
2006 2008 2010 2012 2014
04_Deliv in fac <18
4
6
8
10
12
14
16
2006 2008 2010 2012 2014
04_IP early neo death rate
50
100
150
2006 2008 2010 2012 2014
04_Maternal Mort ratio yy
20
40
60
2008 2010 2012 2014 2016
04_Posnatal mother <6d
18
20
22
24
26
28
2006 2008 2010 2012 2014
04_Stillbirth rate
30
40
50
60
2006 2008 2010 2012 2014
05_ANC 1st visit <20 w rate
50
60
70
80
90
2008 2010 2012 2014 2016
05_ANC initiate ART rate
60
80
100
2006 2008 2010 2012 2014
05_Infant PCR 6w uptake rate
2
4
6
8
10
12
2006 2008 2010 2012 2014
05_Infant PCR pos 6w rate
10
15
20
25
2010 2012 2014 2016 2018
06_School G1 screen cov yy
District value Provincial average ZA (national) average
290
Section B: National and District Profiles
290
Section B: Profile Eastern Cape Province
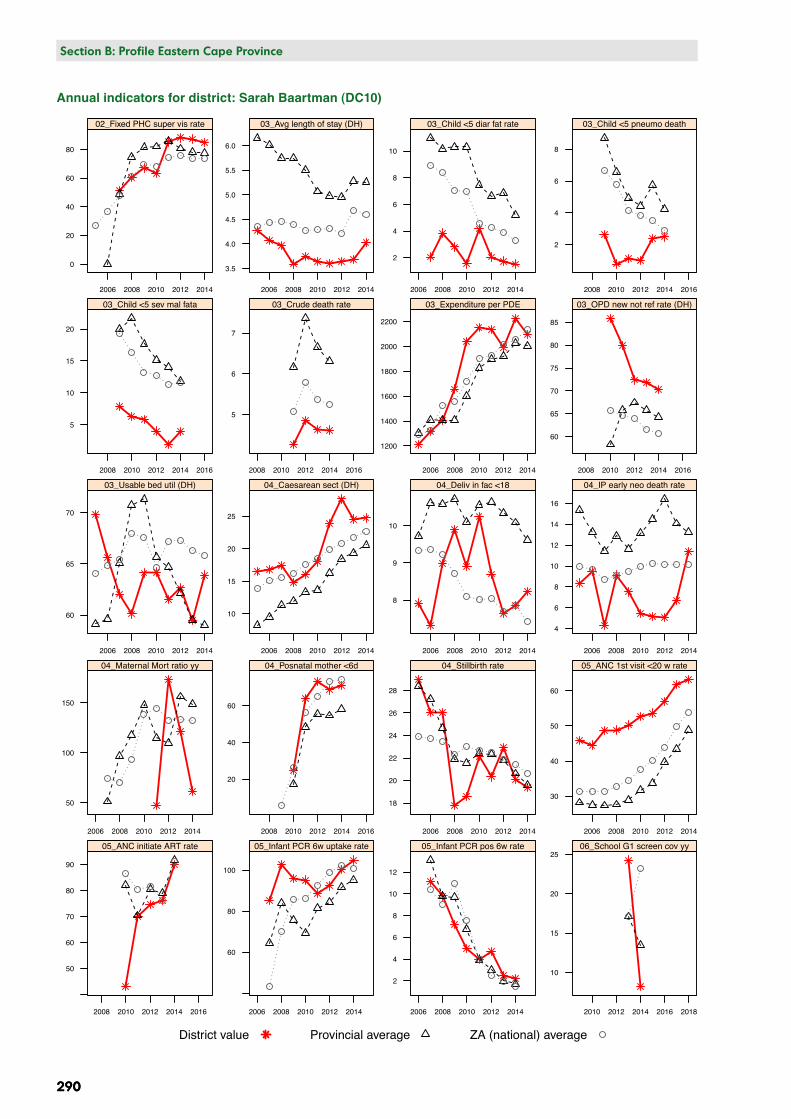
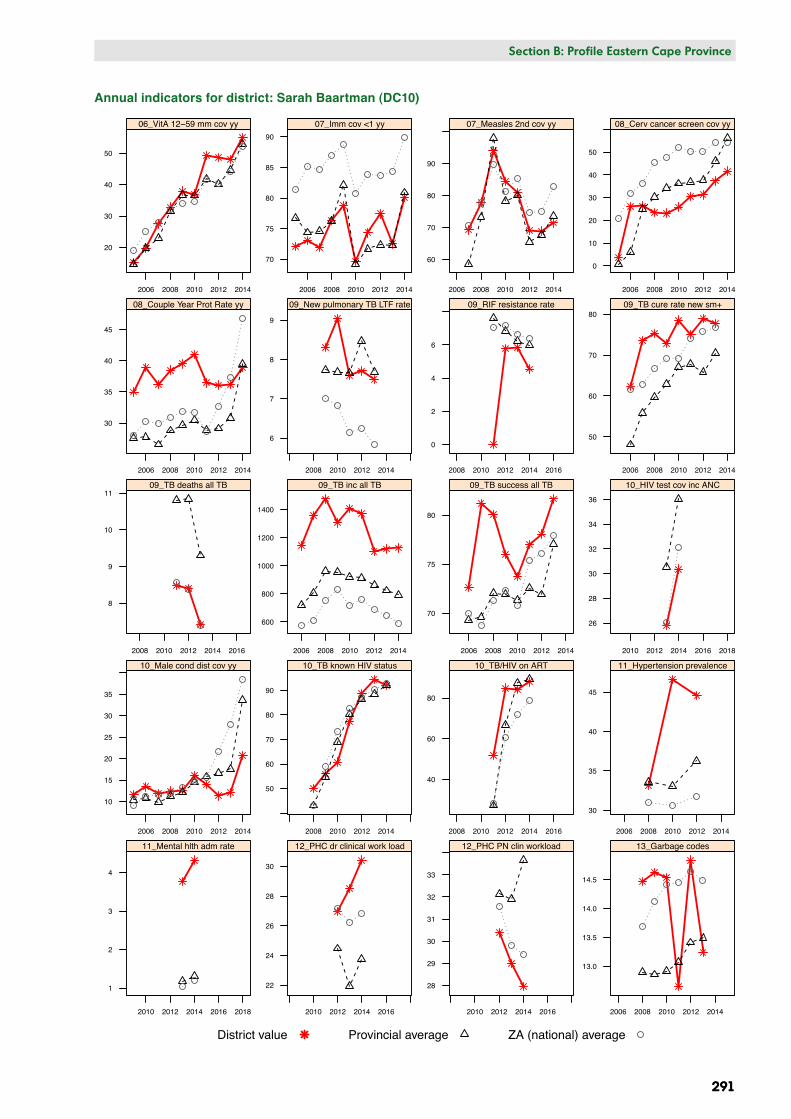
Annual indicators for district: Sarah Baartman (DC10)
Annual indicators for district: S Baartman: DC10Va
lue
20
30
40
50
2006 2008 2010 2012 2014
06_VitA 12−59 mm cov yy
70
75
80
85
90
2006 2008 2010 2012 2014
07_Imm cov <1 yy
60
70
80
90
2006 2008 2010 2012 2014
07_Measles 2nd cov yy
0
10
20
30
40
50
2006 2008 2010 2012 2014
08_Cerv cancer screen cov yy
30
35
40
45
2006 2008 2010 2012 2014
08_Couple Year Prot Rate yy
6
7
8
9
2008 2010 2012 2014
09_New pulmonary TB LTF rate
0
2
4
6
2008 2010 2012 2014 2016
09_RIF resistance rate
50
60
70
80
2006 2008 2010 2012 2014
09_TB cure rate new sm+
8
9
10
11
2008 2010 2012 2014 2016
09_TB deaths all TB
600
800
1000
1200
1400
2006 2008 2010 2012 2014
09_TB inc all TB
70
75
80
2006 2008 2010 2012 2014
09_TB success all TB
26
28
30
32
34
36
2010 2012 2014 2016 2018
10_HIV test cov inc ANC
10
15
20
25
30
35
2006 2008 2010 2012 2014
10_Male cond dist cov yy
50
60
70
80
90
2008 2010 2012 2014
10_TB known HIV status
40
60
80
2008 2010 2012 2014 2016
10_TB/HIV on ART
30
35
40
45
2006 2008 2010 2012 2014
11_Hypertension prevalence
1
2
3
4
2010 2012 2014 2016 2018
11_Mental hlth adm rate
22
24
26
28
30
2010 2012 2014 2016
12_PHC dr clinical work load
28
29
30
31
32
33
2010 2012 2014 2016
12_PHC PN clin workload
13.0
13.5
14.0
14.5
2006 2008 2010 2012 2014
13_Garbage codes
District value Provincial average ZA (national) average
Section B: National and District Profiles
291
Section B: Profile Eastern Cape Province
291
Annual indicators for district: Sarah Baartman (DC10)
292
Section B: National and District Profiles
292
Section B: Profile Eastern Cape Province
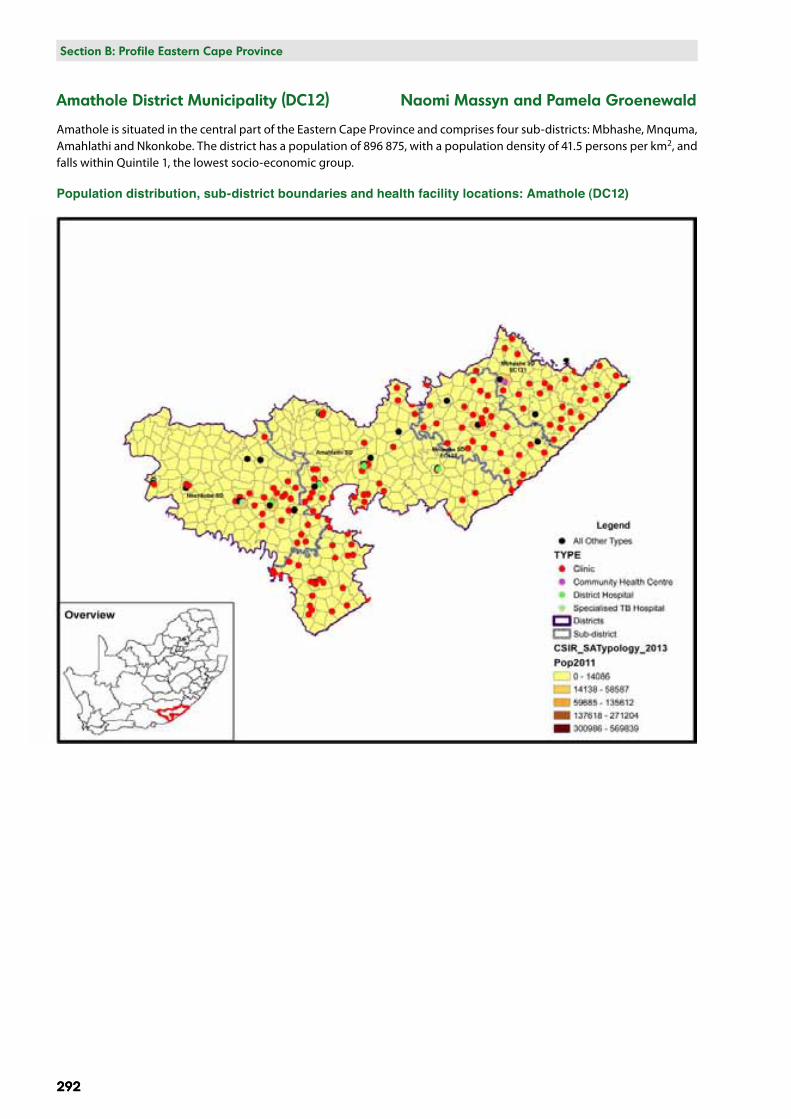
Amathole District Municipality (DC12) Naomi Massyn and Pamela Groenewald
Amathole is situated in the central part of the Eastern Cape Province and comprises four sub-districts: Mbhashe, Mnquma, Amahlathi and Nkonkobe. The district has a population of 896 875, with a population density of 41.5 persons per km2, and falls within Quintile 1, the lowest socio-economic group.
Population distribution, sub-district boundaries and health facility locations: Amathole (DC12)
Broad age.. Female Male
<5 years
5-14
15-24
25-64
65+
Total 51.2%26.3%18.0%
22.2%
14.3%
13.2%
24.1%
17.5%
35.1%
78.8%
11.4%
20.6%
47.1%
42.2%
68.7%
33.0%
21.1%
18.4%
11.4%
14.1%43.7%26.4%15.9%
38.6%
66.9%
14.5%
11.7%
19.0%
13.3%
33.0%
74.1%
17.1%
38.3%
11.8%
69.3%
25.2%
14.1%
8.8%
EC, Amathole: DC12
Broad age.. 2008-10 2011-13
<5 years
5-14
15-24
25-64
65+
31.0%
36.1%
11.5%
21.9%
15.6%
32.3%
76.9%
11.8%
21.9%
30.9%
40.6%
70.1%
25.3%
17.4%
18.3%
9.5%
32.3%
47.7%
11.4%
13.6%
20.5%
15.0%
35.9%
76.7%
15.0%
26.0%
39.4%
67.5%
32.2%
11.4%
13.3%
11.5%
9.5%9.4%
9.2%
Rank.. 2008-10 2011-13
<5 y
ears
12345678910
5-14
12345678910
15-2
4
12345678910
25-6
4
12345678910
65+
12345678910
Poisonings (including herbal) (1.7%)
Protein-energy malnutrition (5.7%)
Birth asphyxia (3.7%)
Preterm birth complications (5.4%)
Asthma (1.7%)Meningitis/encephalitis (2.1%)
Diarrhoeal diseases (32.4%)Lower respiratory infections (17.2%)
HIV/AIDS (8.1%)
Tuberculosis (3.8%)Drowning (3.7%)
Protein-energy malnutrition (6.8%)
Birth asphyxia (3.8%)
Epilepsy (2.0%)
Preterm birth complications (6.0%)
Septicaemia (2.0%)
Diarrhoeal diseases (27.4%)Lower respiratory infections (17.9%)
HIV/AIDS (7.0%)
Tuberculosis (2.5%)
Other neurological conditions (2.7%)
Drowning (10.8%)
Epilepsy (3.4%)Fires, hot substances (4.0%)
Meningitis/encephalitis (6.6%)Road injuries (8.8%)Diarrhoeal diseases (10.5%)
Lower respiratory infections (6.3%)
HIV/AIDS (10.6%)
Tuberculosis (12.7%) Drowning (13.9%)
Epilepsy (6.3%)
Asthma (2.7%)Accidental threats to breathing (3.7%)
Meningitis/encephalitis (6.9%)
Road injuries (6.0%)
Diarrhoeal diseases (9.2%)Lower respiratory infections (12.6%)
HIV/AIDS (9.2%)
Tuberculosis (6.4%)
Epilepsy (3.3%)
Interpersonal violence (15.5%)
Mechanical forces (3.7%)
Accidental threats to breathing (5.8%)
Meningitis/encephalitis (4.0%)
Road injuries (6.0%)
Diarrhoeal diseases (5.0%)Lower respiratory infections (5.5%)
HIV/AIDS (17.3%)
Tuberculosis (14.0%)
Epilepsy (3.1%)
Interpersonal violence (18.5%)
Mechanical forces (3.8%)
Accidental threats to breathing (11.4%)
Meningitis/encephalitis (2.7%)
Road injuries (7.7%)
Diarrhoeal diseases (3.2%)Lower respiratory infections (3.8%)
HIV/AIDS (14.7%)Tuberculosis (11.8%)
Asthma (3.5%)
Interpersonal violence (2.3%)
Meningitis/encephalitis (3.0%)Diabetes mellitus (2.3%)
Hypertensive heart disease (3.1%)
Diarrhoeal diseases (6.1%)Cerebrovascular disease (3.5%)
Lower respiratory infections (7.6%)HIV/AIDS (19.7%)Tuberculosis (21.0%)
Epilepsy (2.4%)Asthma (2.8%)Interpersonal violence (2.9%)Diabetes mellitus (3.0%)
Hypertensive heart disease (3.6%)Diarrhoeal diseases (3.4%)
Cerebrovascular disease (4.3%)Lower respiratory infections (6.6%)
HIV/AIDS (20.5%)Tuberculosis (19.0%)
Oesophagus (3.7%)
Cardiomyopathy (3.3%)
Asthma (7.1%)
COPD (6.9%)Diabetes mellitus (4.9%)
Hypertensive heart disease (12.7%)
Ischaemic heart disease (3.3%)
Cerebrovascular disease (13.5%)
Lower respiratory infections (7.0%)
Tuberculosis (8.6%)
Oesophagus (3.6%)
Cardiomyopathy (2.8%)
Asthma (6.5%)COPD (6.4%)Diabetes mellitus (5.8%)
Hypertensive heart disease (14.2%)
Ischaemic heart disease (2.9%)
Cerebrovascular disease (13.6%)
Lower respiratory infections (7.3%)Tuberculosis (8.1%)
Prov, DistrictEC, Amathole: DC12
Show History
BroadcauseInjury
NCD
HIV and TB
Comm_mat_peri_nut
Percentage ofdeaths by broadcause and leadingcauses, 2008-2013
Section B: National and District Profiles
293
Section B: Profile Eastern Cape Province
293
Burden of disease profile
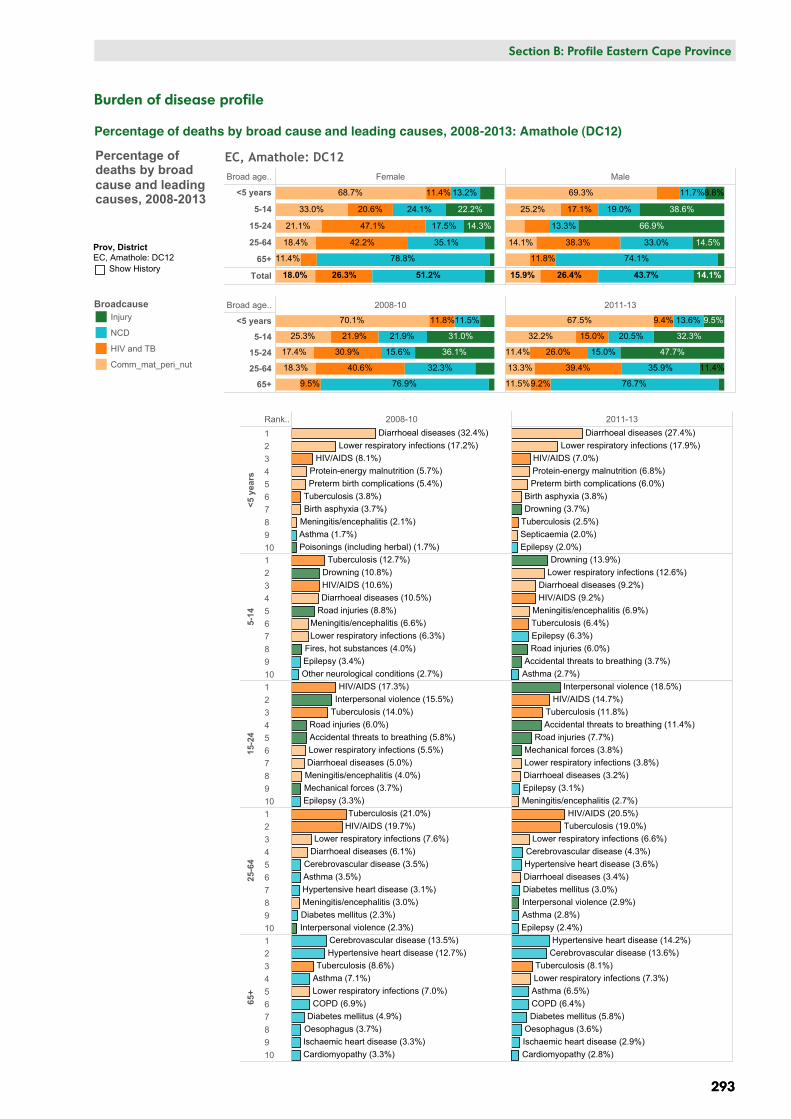
Percentage of deaths by broad cause and leading causes, 2008-2013: Amathole (DC12)
294
Section B: National and District Profiles
294
Section B: Profile Eastern Cape Province
Broad cause groups by age and gender
In the under-5-year age group, communicable diseases together with maternal, perinatal and nutritional conditions accounted for almost 70% of deaths. HIV and TB accounted for about 11% of deaths, and injuries for around 8%.
In the 5–14-year age group there were bigger differences in the proportions of broad causes between males and females. Communicable diseases together with maternal, perinatal and nutritional conditions accounted for 33.0% of deaths among females versus 25.2% of deaths among males; HIV and TB accounted for 20.6% mortality among females versus 17.1% among males; non-communicable diseases accounted for 24.1% (females) versus 19.0% (males); and injuries accounted for 22.2% (females) versus 38.6% (males).
In the 15–24-year age group, injury accounted for 66.9% of deaths among males and only 14.3% among females, while HIV and TB accounted for 47.1% of deaths among females.
In the 25–64-year age group, HIV and TB accounted for the largest proportion of deaths (42.2% among females and 38.3% among males). Deaths due to non-communicable diseases increased to 35.1% among females and 33.0% among males. Injuries accounted for a small proportion of deaths in this age group, with the percentage being much higher among males (14.5%) than females (4.3%).
In the 65-years-and-older age group, non-communicable diseases accounted for the highest proportion of deaths (78.8% among females and 74.1% among males). Communicable diseases together with maternal, perinatal and nutritional conditions accounted for around 12% of deaths. This was the only age group where deaths due to HIV and TB were higher among males than females.
Trends in broad cause groups by age
In children under 5 years, deaths due to communicable diseases and maternal, perinatal and nutritional conditions decreased from 70.1% to 67.5% between 2008–2010 and 2011–2013; HIV and TB mortality decreased from 11.8% to 9.4%; and non-communicable disease mortality and injury-related deaths increased slightly. In the 5–14-year age group, deaths due to communicable diseases and maternal, perinatal and nutritional conditions increased, while HIV and TB mortality declined over this period. In the 15–24-year age group, injury-related deaths increased markedly from 36.1% to 47.7%, while deaths due to HIV and TB and communicable diseases together with maternal, perinatal and nutritional conditions declined. Not much change was observed in the 25–64-year age group, apart from a slight decrease in deaths due to communicable diseases together with maternal, perinatal and nutritional conditions, and a slight increase in deaths due to non-communicable diseases. In the 65-years-and-older age group there was not much change in the broad cause groups over the period.
Trends in leading causes of death by age
Under 5 years
Diarrhoeal diseases, lower respiratory infections, HIV and AIDS, protein-energy malnutrition and prematurity remained the leading causes of death between 2008–2010 and 2011–2013. Birth asphyxia and drowning moved up in the rankings, and TB moved down slightly. Mortality in this age group was still largely HIV-related.
5–14 years
The top four leading causes of death in this age group shifted from TB, drowning, HIV and AIDS and diarrhoea, to drowning, lower respiratory infections, diarrhoea and HIV and AIDS. Lower respiratory infections increased markedly, while TB decreased markedly.
15–24 years
Interpersonal violence, HIV and AIDS, and TB remained the three leading causes of death in this age group, followed by road injuries, lower respiratory infections, diarrhoea, epilepsy and meningitis.
25–64 years
HIV and AIDS, TB and lower respiratory infection remained the leading causes of death, accounting for almost 50% of deaths in this age group. Cerebrovascular disease, hypertensive heart disease, diarrhoea, diabetes mellitus, interpersonal violence, asthma and epilepsy appeared in the top 10 causes of death.
65 years and older
The top 10 leading causes remained the same over this period except for hypertensive heart disease, which moved above cerebrovascular disease in 2011–13. Tuberculosis, lower respiratory infection, asthma, chronic obstructive pulmonary disease, diabetes, oesophageal cancer, ischaemic heart disease and cardiomyopathy were the remaining leading causes.

Section B: National and District Profiles
295
Section B: Profile Eastern Cape Province
295
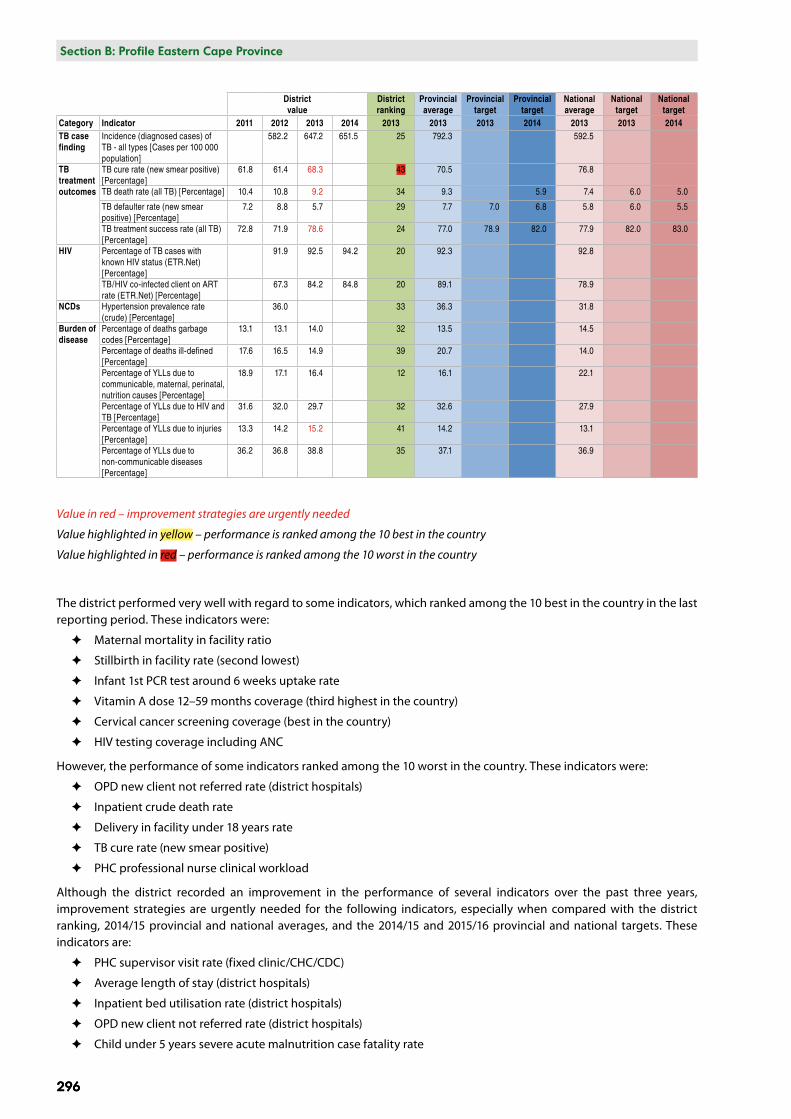
Indicator performance: Amathole (DC12)
District value
District ranking
Provincial average
Provincial target
Provincial target
National average
National target
National target
Category Indicator 2012/13 2013/14 2014/15 2014/15 2014/15 2014/15 2015/16 2014/15 2014/15 2015/16Management PHC
PHC supervisor visit rate (fixed clinic/CHC/CDC) [Percentage]
83.1 84.6 86.7 12 77.6 91.0 73.5
Management Inpatients
Average length of stay (district hospitals) [Days]
5.5 5.6 5.5 25 5.3 4.9 4.6
Expenditure per patient day equivalent (district hospitals) [Rand (real 2014/15 prices)]
1 880.8 1 948.2 1 844.1 32 2 005.9 2 136.4
Inpatient bed utilisation rate (district hospitals) [Percentage]
59.5 59.1 59.0 40 59.0 65.0 65.8
OPD new client not referred rate (district hospitals) [Percentage]
74.6 72.9 74.8 44 64.3 60.7
Mortality Inpatients
Child under 5 years diarrhoea case fatality rate [Percentage]
8.6 5.3 3.0 28 5.2 5.8 5.6 3.3 3.5 3.0
Child under 5 years pneumonia case fatality rate [Percentage]
6.6 6.1 2.6 26 4.2 6.0 4.0 2.9
Child under 5 years severe acute malnutrition case fatality rate [Percentage]
18.1 8.7 14.1 37 11.8 12.0 10.0 11.6 8.0 7.0
Inpatient crude death rate [Percentage]
7.9 7.1 6.5 43 6.3 5.2
Delivery Delivery by Caesarean section rate (district hospitals) [Percentage]
13.2 14.9 17.9 20.6 22.7
Delivery in facility under 18 years rate [Percentage]
11.8 11.7 11.3 49 9.6 10.3 7.4
Inpatient early neonatal death rate [per 1 000 live births]
10.7 10.4 10.8 31 13.3 12.0 10.1 0
Maternal mortality in facility ratio [per 100 000 live births]
18.6 86.3 58.8 5 148.3 114.0 112.0 132.5 100 80.0
Mother postnatal visit within 6 days rate [Percentage]
65.8 68.7 73.3 15 58.0 55.0 74.3 80.0 85.0
Stillbirth in facility rate [per 1 000 births]
18.2 17.1 13.4 2 19.6 20.7
PMTCT Antenatal 1st visit before 20 weeks rate [Percentage]
37.7 46.2 54.3 36 48.8 42.0 50.0 53.9 65.0 70.0
Antenatal client initiated on ART rate [Percentage]
61.9 89.4 95.9 14 91.7 90.0 91.2 93.0 96.0
Infant 1st PCR test around 6 weeks uptake rate [Percentage]
121.2 125.6 121.8 6 95.2 100.6
Infant 1st PCR test positive around 6 weeks rate [Percentage]
3.2 2.4 1.9 39 1.7 2.8 1.5 1.5 1.8 2.0
Child Health School Grade 1 screening coverage [Percentage]
11.5 14.2 38 13.4 70.0 27.4 23.2 30.0 35.0
Vitamin A dose 12-59 months coverage [Percentage]
52.7 55.7 73.6 3 53.0 55.0 55.0 52.2 55.0
Immunisation Immunisation coverage under 1 year [Percentage]
65.2 69.6 86.6 22 80.9 90.0 90.0 89.8 95.0 91.0
Measles 2nd dose coverage [Percentage]
62.9 64.8 74.8 35 73.6 95.0 90.0 82.8 85.0 85.0
Reproductive health
Cervical cancer screening coverage ([Percentage]
42.2 64.3 89.5 1 56.3 42.0 44.0 54.5 60.0 64.0
Couple year protection rate [Percentage]
27.5 29.9 46.2 25 39.4 60.0 46.8 55.0
TB case finding TB Rifampicin resistance confirmed client rate [Percentage]
7.3 6.2 5.9 26 6.0 6.4
HIV HIV testing coverage (including ANC)
36.8 51.9 3 36.0 32.1
Male condom distribution coverage
14.9 17.1 47.4 12 33.6 38.0 38.4
Non-communicable diseases
Hypertension incidence [per 1 000]
17.4 19.8 24.9 15.7 3.5 13.9
Mental health admission rate [Percentage]
0.8 0.7 1.3 1.2
Human Resources
PHC doctor clinical workload [Clients per doctor per day]
11.0 16.1 20.2 25 23.8 26.9
PHC professional nurse clinical workload [Clients per nurse per day]
27.5 30.3 41.4 49 33.7 29.4
296
Section B: National and District Profiles
296
Section B: Profile Eastern Cape Province
District value
District ranking
Provincial average
Provincial target
Provincial target
National average
National target
National target
Category Indicator 2011 2012 2013 2014 2013 2013 2013 2014 2013 2013 2014TB case finding
Incidence (diagnosed cases) of TB - all types [Cases per 100 000 population]
582.2 647.2 651.5 25 792.3 592.5
TB treatment outcomes
TB cure rate (new smear positive) [Percentage]
61.8 61.4 68.3 43 70.5 76.8
TB death rate (all TB) [Percentage] 10.4 10.8 9.2 34 9.3 5.9 7.4 6.0 5.0
TB defaulter rate (new smear positive) [Percentage]
7.2 8.8 5.7 29 7.7 7.0 6.8 5.8 6.0 5.5
TB treatment success rate (all TB) [Percentage]
72.8 71.9 78.6 24 77.0 78.9 82.0 77.9 82.0 83.0
HIV Percentage of TB cases with known HIV status (ETR.Net) [Percentage]
91.9 92.5 94.2 20 92.3 92.8
TB/HIV co-infected client on ART rate (ETR.Net) [Percentage]
67.3 84.2 84.8 20 89.1 78.9
NCDs Hypertension prevalence rate (crude) [Percentage]
36.0 33 36.3 31.8
Burden of disease
Percentage of deaths garbage codes [Percentage]
13.1 13.1 14.0 32 13.5 14.5
Percentage of deaths ill-defined [Percentage]
17.6 16.5 14.9 39 20.7 14.0
Percentage of YLLs due to communicable, maternal, perinatal, nutrition causes [Percentage]
18.9 17.1 16.4 12 16.1 22.1
Percentage of YLLs due to HIV and TB [Percentage]
31.6 32.0 29.7 32 32.6 27.9
Percentage of YLLs due to injuries [Percentage]
13.3 14.2 15.2 41 14.2 13.1
Percentage of YLLs due to non-communicable diseases [Percentage]
36.2 36.8 38.8 35 37.1 36.9
Value in red – improvement strategies are urgently needed
Value highlighted in yellow – performance is ranked among the 10 best in the country
Value highlighted in red – performance is ranked among the 10 worst in the country
The district performed very well with regard to some indicators, which ranked among the 10 best in the country in the last reporting period. These indicators were:
✦ Maternal mortality in facility ratio
✦ Stillbirth in facility rate (second lowest)
✦ Infant 1st PCR test around 6 weeks uptake rate
✦ Vitamin A dose 12–59 months coverage (third highest in the country)
✦ Cervical cancer screening coverage (best in the country)
✦ HIV testing coverage including ANC
However, the performance of some indicators ranked among the 10 worst in the country. These indicators were:
✦ OPD new client not referred rate (district hospitals)
✦ Inpatient crude death rate
✦ Delivery in facility under 18 years rate
✦ TB cure rate (new smear positive)
✦ PHC professional nurse clinical workload
Although the district recorded an improvement in the performance of several indicators over the past three years, improvement strategies are urgently needed for the following indicators, especially when compared with the district ranking, 2014/15 provincial and national averages, and the 2014/15 and 2015/16 provincial and national targets. These indicators are:
✦ PHC supervisor visit rate (fixed clinic/CHC/CDC)
✦ Average length of stay (district hospitals)
✦ Inpatient bed utilisation rate (district hospitals)
✦ OPD new client not referred rate (district hospitals)
✦ Child under 5 years severe acute malnutrition case fatality rate
Section B: National and District Profiles
297
Section B: Profile Eastern Cape Province
297
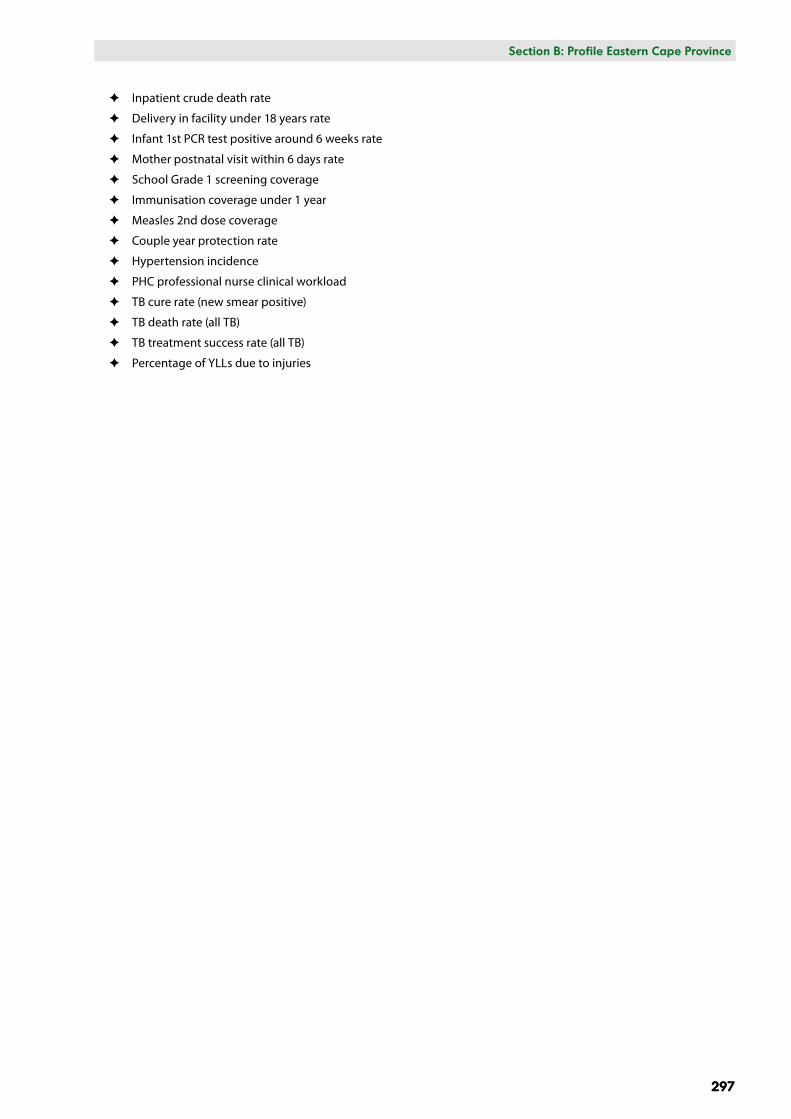
✦ Inpatient crude death rate
✦ Delivery in facility under 18 years rate
✦ Infant 1st PCR test positive around 6 weeks rate
✦ Mother postnatal visit within 6 days rate
✦ School Grade 1 screening coverage
✦ Immunisation coverage under 1 year
✦ Measles 2nd dose coverage
✦ Couple year protection rate
✦ Hypertension incidence
✦ PHC professional nurse clinical workload
✦ TB cure rate (new smear positive)
✦ TB death rate (all TB)
✦ TB treatment success rate (all TB)
✦ Percentage of YLLs due to injuries
Annual indicators for district: Amathole: DC12
Valu
e
0
20
40
60
80
2006 2008 2010 2012 2014
02_Fixed PHC super vis rate
4.5
5.0
5.5
6.0
6.5
7.0
2006 2008 2010 2012 2014
03_Avg length of stay (DH)
4
6
8
10
12
2006 2008 2010 2012 2014
03_Child <5 diar fat rate
4
6
8
2008 2010 2012 2014 2016
03_Child <5 pneumo death
10
15
20
25
2008 2010 2012 2014 2016
03_Child <5 sev mal fata
5.0
5.5
6.0
6.5
7.0
7.5
8.0
2008 2010 2012 2014 2016
03_Crude death rate
1400
1600
1800
2000
2006 2008 2010 2012 2014
03_Expenditure per PDE
50
55
60
65
70
75
2008 2010 2012 2014 2016
03_OPD new not ref rate (DH)
60
65
70
75
80
2006 2008 2010 2012 2014
03_Usable bed util (DH)
5
10
15
20
2006 2008 2010 2012 2014
04_Caesarean sect (DH)
8
9
10
11
12
2006 2008 2010 2012 2014
04_Deliv in fac <18
10
12
14
16
2006 2008 2010 2012 2014
04_IP early neo death rate
50
100
150
2006 2008 2010 2012 2014
04_Maternal Mort ratio yy
20
40
60
2008 2010 2012 2014 2016
04_Posnatal mother <6d
15
20
25
2006 2008 2010 2012 2014
04_Stillbirth rate
30
40
50
2006 2008 2010 2012 2014
05_ANC 1st visit <20 w rate
70
80
90
2008 2010 2012 2014 2016
05_ANC initiate ART rate
40
60
80
100
120
2006 2008 2010 2012 2014
05_Infant PCR 6w uptake rate
2
4
6
8
10
12
2006 2008 2010 2012 2014
05_Infant PCR pos 6w rate
12
14
16
18
20
22
2010 2012 2014 2016 2018
06_School G1 screen cov yy
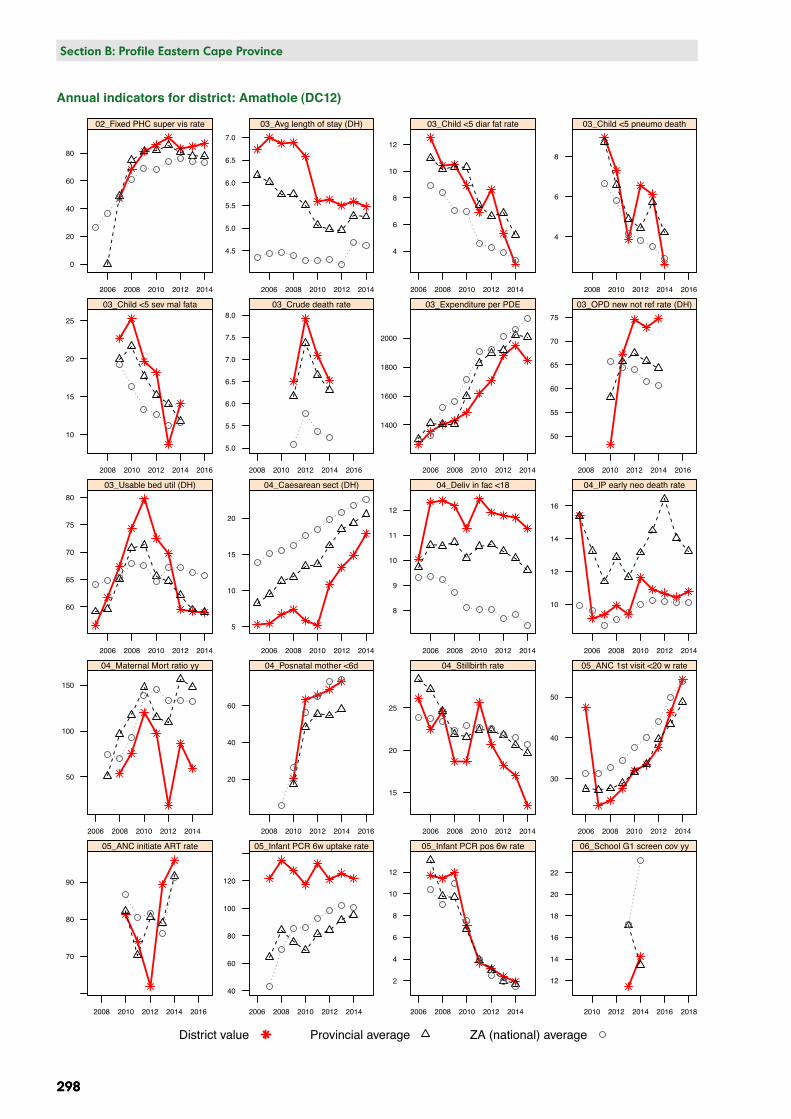
District value Provincial average ZA (national) average
298
Section B: National and District Profiles
298
Section B: Profile Eastern Cape Province
Annual indicators for district: Amathole (DC12)
Annual indicators for district: Amathole: DC12Va
lue
10
20
30
40
50
60
70
2006 2008 2010 2012 2014
06_VitA 12−59 mm cov yy
70
80
90
2006 2008 2010 2012 2014
07_Imm cov <1 yy
50
60
70
80
90
100
2006 2008 2010 2012 2014
07_Measles 2nd cov yy
0
20
40
60
80
2006 2008 2010 2012 2014
08_Cerv cancer screen cov yy
30
35
40
45
2006 2008 2010 2012 2014
08_Couple Year Prot Rate yy
6
7
8
2008 2010 2012 2014
09_New pulmonary TB LTF rate
6
7
8
9
10
11
2008 2010 2012 2014 2016
09_RIF resistance rate
50
55
60
65
70
75
2006 2008 2010 2012 2014
09_TB cure rate new sm+
8
9
10
11
2008 2010 2012 2014 2016
09_TB deaths all TB
400
500
600
700
800
900
2006 2008 2010 2012 2014
09_TB inc all TB
70
72
74
76
78
2006 2008 2010 2012 2014
09_TB success all TB
25
30
35
40
45
50
2010 2012 2014 2016 2018
10_HIV test cov inc ANC
10
20
30
40
2006 2008 2010 2012 2014
10_Male cond dist cov yy
50
60
70
80
90
2008 2010 2012 2014
10_TB known HIV status
40
60
80
2008 2010 2012 2014 2016
10_TB/HIV on ART
30
35
40
45
50
2006 2008 2010 2012 2014
11_Hypertension prevalence
0.8
0.9
1.0
1.1
1.2
1.3
2010 2012 2014 2016 2018
11_Mental hlth adm rate
15
20
25
2010 2012 2014 2016
12_PHC dr clinical work load
30
35
40
2010 2012 2014 2016
12_PHC PN clin workload
12
13
14
2006 2008 2010 2012 2014
13_Garbage codes
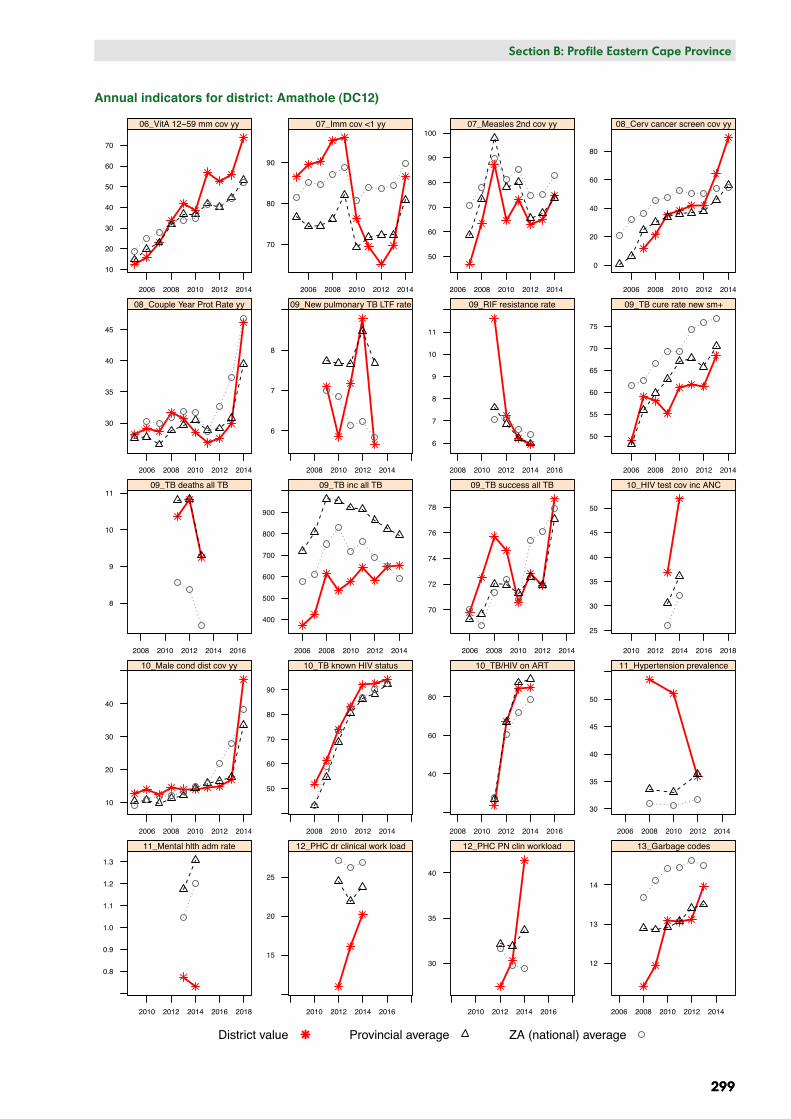
District value Provincial average ZA (national) average
Section B: National and District Profiles
299
Section B: Profile Eastern Cape Province
299
Annual indicators for district: Amathole (DC12)
300
Section B: National and District Profiles
300
Section B: Profile Eastern Cape Province
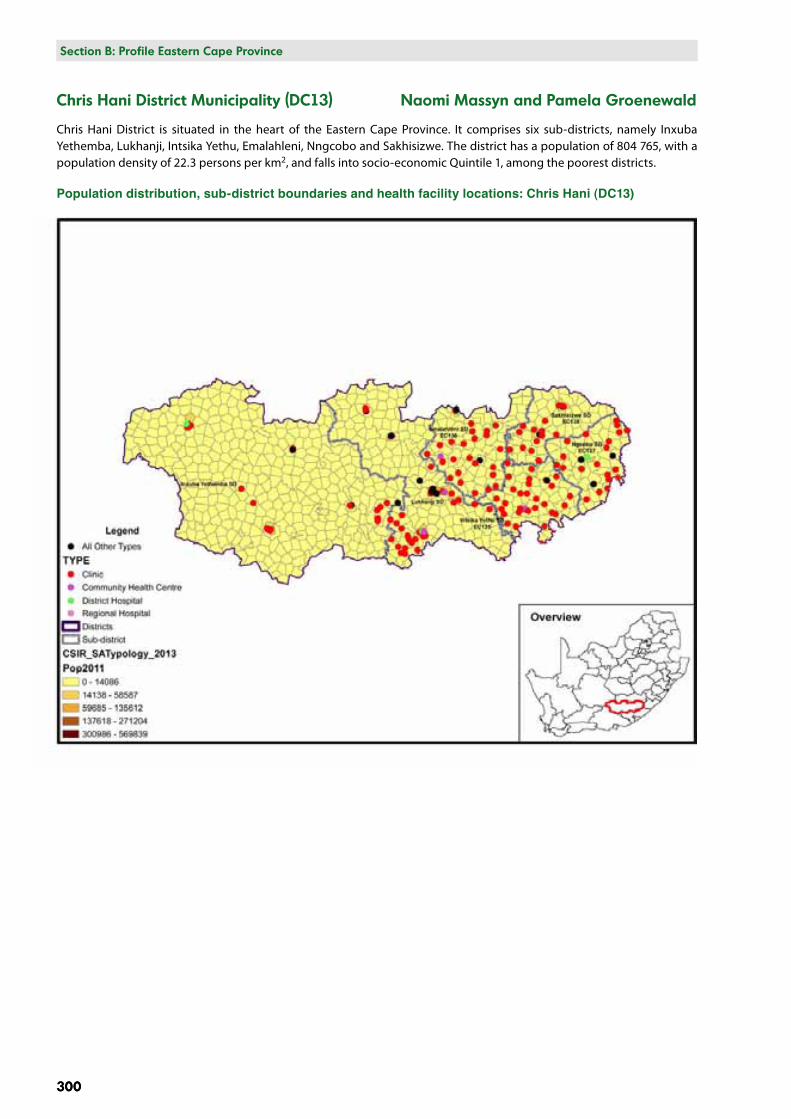
Chris Hani District Municipality (DC13) Naomi Massyn and Pamela Groenewald
Chris Hani District is situated in the heart of the Eastern Cape Province. It comprises six sub-districts, namely Inxuba Yethemba, Lukhanji, Intsika Yethu, Emalahleni, Nngcobo and Sakhisizwe. The district has a population of 804 765, with a population density of 22.3 persons per km2, and falls into socio-economic Quintile 1, among the poorest districts.
Population distribution, sub-district boundaries and health facility locations: Chris Hani (DC13)
Broad age.. Female Male
<5 years
5-14
15-24
25-64
65+
Total 48.3%25.3%21.9%
27.6%
13.1%
11.9%
19.0%
14.8%
35.0%
77.9%
17.9%
46.1%
38.8%
71.7%
35.5%
26.1%
21.7%
13.2%
9.5%
13.8%40.7%25.5%20.0%
41.2%
66.8%
13.8%
18.9%
12.5%
32.4%
71.7%
20.0%
11.4%
36.0%
72.0%
19.9%
17.8%
14.2%
9.4%
EC, C Hani: DC13
Broad age.. 2008-10 2011-13
<5 years
5-14
15-24
25-64
65+
33.3%
37.4%
18.9%
13.4%
31.9%
74.5%
20.5%
29.3%
36.1%
75.1%
27.4%
19.9%
23.1%
14.2%
9.0%
9.9%
38.2%
43.2%
10.4%
16.4%
19.0%
13.8%
35.8%
76.0%
17.4%
28.1%
38.8%
66.8%
25.4%
14.9%
15.1%
13.1%
8.8%
Rank.. 2008-10 2011-13
<5 y
ears
12345678910
5-14
12345678910
15-2
4
12345678910
25-6
4
12345678910
65+
12345678910
Poisonings (including herbal) (2.6%)Sepsis/other newborn infectious (2.0%)
Protein-energy malnutrition (5.3%)Birth asphyxia (4.0%)
Preterm birth complications (8.0%)
Septicaemia (1.9%)
Diarrhoeal diseases (30.9%)Lower respiratory infections (19.8%)
HIV/AIDS (6.8%)
Tuberculosis (3.2%)
Sepsis/other newborn infectious (2.1%)
Protein-energy malnutrition (6.7%)
Birth asphyxia (5.4%)
Preterm birth complications (9.3%)
Asthma (2.4%)
Accidental threats to breathing (2.7%)
Diarrhoeal diseases (20.7%)Lower respiratory infections (18.5%)
HIV/AIDS (5.6%)
Tuberculosis (2.6%)
Exposure to natural forces (3.6%)
Drowning (14.6%)
Epilepsy (3.5%)
Accidental threats to breathing (4.4%)Meningitis/encephalitis (5.8%)
Road injuries (8.0%)
Diarrhoeal diseases (10.7%)Lower respiratory infections (9.1%)
HIV/AIDS (6.2%)
Tuberculosis (16.2%)
Exposure to natural forces (3.6%)
Drowning (17.4%)
Epilepsy (4.3%)Accidental threats to breathing (5.3%)Meningitis/encephalitis (5.8%)
Road injuries (8.6%)Diarrhoeal diseases (7.1%)
Lower respiratory infections (11.6%)
HIV/AIDS (9.0%)Tuberculosis (10.2%)
Epilepsy (2.8%)
Interpersonal violence (18.4%)
Mechanical forces (3.5%)
Accidental threats to breathing (6.2%)
Meningitis/encephalitis (3.4%)
Road injuries (3.9%)Diarrhoeal diseases (6.0%)
Lower respiratory infections (7.5%)HIV/AIDS (13.7%)
Tuberculosis (16.4%)
Epilepsy (3.2%)
Interpersonal violence (21.3%)
Mechanical forces (3.6%)
Accidental threats to breathing (8.0%)
Meningitis/encephalitis (3.5%)
Road injuries (4.6%)
Diarrhoeal diseases (3.5%)
Lower respiratory infections (5.3%)
HIV/AIDS (15.1%)Tuberculosis (14.0%)
Asthma (2.6%)
Interpersonal violence (2.5%)Meningitis/encephalitis (2.5%)
Hypertensive heart disease (2.5%)Ischaemic heart disease (2.3%)
Diarrhoeal diseases (6.5%)Cerebrovascular disease (3.4%)
Lower respiratory infections (12.2%)HIV/AIDS (13.8%)
Tuberculosis (22.4%)
Asthma (2.7%)
Interpersonal violence (2.8%)Diabetes mellitus (2.7%)
Hypertensive heart disease (2.5%)
Ischaemic heart disease (2.9%)Diarrhoeal diseases (4.0%)Cerebrovascular disease (4.4%)
Lower respiratory infections (8.0%)HIV/AIDS (19.1%)Tuberculosis (19.7%)
Oesophagus (3.6%)
Cardiomyopathy (5.4%)Asthma (6.6%)
COPD (5.0%)Diabetes mellitus (5.3%)
Hypertensive heart disease (9.8%)
Ischaemic heart disease (4.4%)
Cerebrovascular disease (12.1%)
Lower respiratory infections (9.3%)Tuberculosis (7.9%)
Oesophagus (3.1%)
Cardiomyopathy (7.2%)Asthma (6.5%)
COPD (4.8%)Diabetes mellitus (6.2%)
Hypertensive heart disease (10.4%)
Ischaemic heart disease (3.7%)
Cerebrovascular disease (13.3%)
Lower respiratory infections (8.9%)Tuberculosis (7.3%)
Prov, DistrictEC, C Hani: DC13
Show History
BroadcauseInjury
NCD
HIV and TB
Comm_mat_peri_nut
Percentage ofdeaths by broadcause and leadingcauses, 2008-2013
Section B: National and District Profiles
301
Section B: Profile Eastern Cape Province
301
Burden of disease profile
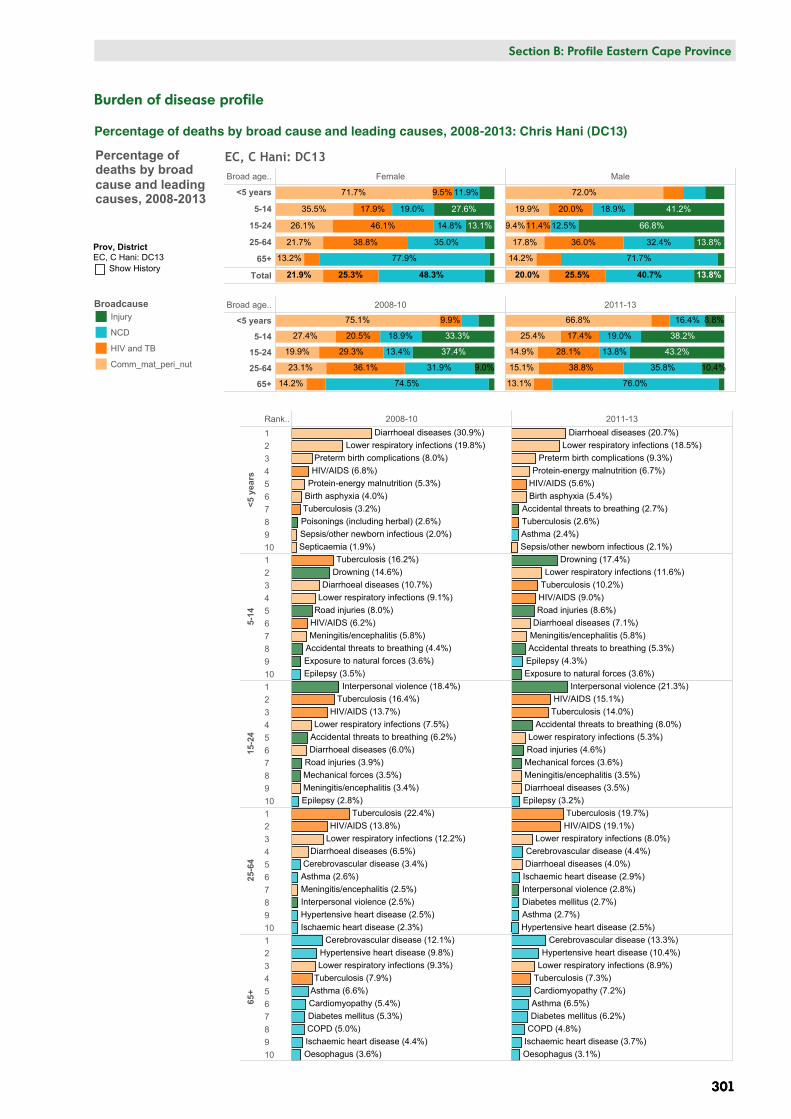
Percentage of deaths by broad cause and leading causes, 2008-2013: Chris Hani (DC13)
302
Section B: National and District Profiles
302
Section B: Profile Eastern Cape Province
Broad cause groups by age and gender
In the under-5-year age group, communicable diseases together with maternal, perinatal and nutritional conditions accounted for more than 70% of deaths. HIV and TB accounted for about 10% of deaths, and injuries for around 8%.
In the 5–14-year age group there were bigger differences in the proportions of broad causes between males and females. Communicable diseases together with maternal, perinatal and nutritional conditions accounted for 35.5% of deaths among females versus 19.9% of deaths among males, while injuries accounted for 27.6% of deaths among females versus 41.2% of deaths among males.
In the 15–24-year age group, injury accounted for 66.8% of deaths among males compared with only 13.1% among females, while HIV and TB accounted for 46.1% of deaths among females compared with only 11.4% among males. Communicable diseases together with maternal, perinatal and nutritional conditions accounted for 26.1% among female deaths and only 9.4% among male deaths.
In the 25–64-year age group, HIV and TB accounted for the largest proportion of deaths (38.8% among females and 36.0% among males). Deaths due to non-communicable diseases increased to 35.0% among females and 32.4% among males. Injuries accounted for a small proportion of deaths in this age group, with the percentage being much higher among males (13.8%) than females (4.5%).
In the 65-years-and-older age group, non-communicable diseases accounted for the highest proportion of deaths (77.9% among females and 71.7% among males). Communicable diseases together with maternal, perinatal and nutritional conditions accounted for more than 13% of deaths. This was the only age group where deaths due to HIV and TB were higher among males than females.
Trends in broad cause groups by age
In children under 5 years, there was a marked decline in deaths due to communicable diseases together with maternal, perinatal and nutritional conditions and HIV and TB between 2008–2010 and 2011–2013, while the proportion of deaths due to non-communicable diseases and injuries increased. In the 5–14-year age group, injury-related deaths increased, while deaths due to HIV, TB and communicable diseases together with maternal, perinatal and nutritional conditions declined over this period. In the 15–24-year age group, injury-related deaths increased slightly, while HIV, TB and communicable diseases together with maternal, perinatal and nutritional conditions declined. In the 25–64- year age group, a decrease was observed in deaths due to communicable diseases together with maternal, perinatal and nutritional conditions, and a slight increase was observed in deaths due to TB, HIV and non-communicable diseases. In the 65-years-and-older age group there was not much change in the broad cause groups over the period.
Trends in leading causes of death by age
Under 5 years
Diarrhoeal diseases, lower respiratory infections, prematurity, HIV and AIDS, protein-energy malnutrition, birth asphyxia and TB remained the leading causes of death between 2008–2010 and 2011–2013. Mortality in this age group was still largely HIV-related.
5–14 years
Drowning, lower respiratory infection, TB, HIV and AIDS, road injuries, diarrhoeal disease and meningitis remained the leading causes of death in this age group.
15–24 years
Interpersonal violence, HIV and AIDS, TB and lower respiratory infections remained the leading causes of death in this age group, followed by road injuries, meningitis, diarrhoea and epilepsy.
25 – 64 years
Tuberculosis, HIV and AIDS, lower respiratory infection, cerebrovascular disease and diarrhoea remained the leading causes of death, accounting for over the 50% of deaths in this age group. Ischaemic heart disease, interpersonal violence, diabetes mellitus, asthma and hypertensive heart disease also appeared in the top 10 causes of death.
65 years and older
The top 10 leading causes of death remained the same over this period. Cerebrovascular disease, hypertensive heart disease, lower respiratory infection and TB were the top causes. Asthma, diabetes, chronic obstructive pulmonary disease, ischaemic heart disease and oesophageal cancer were the remaining leading causes.
Section B: National and District Profiles
303
Section B: Profile Eastern Cape Province
303
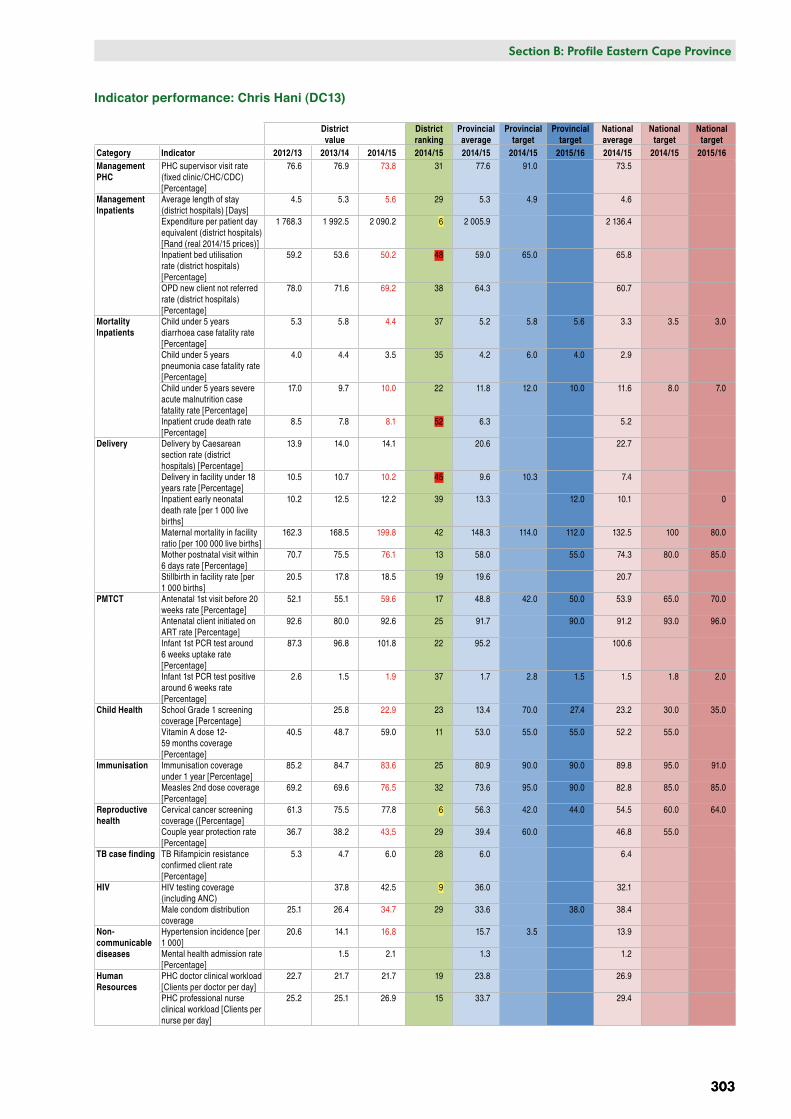
Indicator performance: Chris Hani (DC13)
District value
District ranking
Provincial average
Provincial target
Provincial target
National average
National target
National target
Category Indicator 2012/13 2013/14 2014/15 2014/15 2014/15 2014/15 2015/16 2014/15 2014/15 2015/16Management PHC
PHC supervisor visit rate (fixed clinic/CHC/CDC) [Percentage]
76.6 76.9 73.8 31 77.6 91.0 73.5
Management Inpatients
Average length of stay (district hospitals) [Days]
4.5 5.3 5.6 29 5.3 4.9 4.6
Expenditure per patient day equivalent (district hospitals) [Rand (real 2014/15 prices)]
1 768.3 1 992.5 2 090.2 6 2 005.9 2 136.4
Inpatient bed utilisation rate (district hospitals) [Percentage]
59.2 53.6 50.2 48 59.0 65.0 65.8
OPD new client not referred rate (district hospitals) [Percentage]
78.0 71.6 69.2 38 64.3 60.7
Mortality Inpatients
Child under 5 years diarrhoea case fatality rate [Percentage]
5.3 5.8 4.4 37 5.2 5.8 5.6 3.3 3.5 3.0
Child under 5 years pneumonia case fatality rate [Percentage]
4.0 4.4 3.5 35 4.2 6.0 4.0 2.9
Child under 5 years severe acute malnutrition case fatality rate [Percentage]
17.0 9.7 10.0 22 11.8 12.0 10.0 11.6 8.0 7.0
Inpatient crude death rate [Percentage]
8.5 7.8 8.1 52 6.3 5.2
Delivery Delivery by Caesarean section rate (district hospitals) [Percentage]
13.9 14.0 14.1 20.6 22.7
Delivery in facility under 18 years rate [Percentage]
10.5 10.7 10.2 45 9.6 10.3 7.4
Inpatient early neonatal death rate [per 1 000 live births]
10.2 12.5 12.2 39 13.3 12.0 10.1 0
Maternal mortality in facility ratio [per 100 000 live births]
162.3 168.5 199.8 42 148.3 114.0 112.0 132.5 100 80.0
Mother postnatal visit within 6 days rate [Percentage]
70.7 75.5 76.1 13 58.0 55.0 74.3 80.0 85.0
Stillbirth in facility rate [per 1 000 births]
20.5 17.8 18.5 19 19.6 20.7
PMTCT Antenatal 1st visit before 20 weeks rate [Percentage]
52.1 55.1 59.6 17 48.8 42.0 50.0 53.9 65.0 70.0
Antenatal client initiated on ART rate [Percentage]
92.6 80.0 92.6 25 91.7 90.0 91.2 93.0 96.0
Infant 1st PCR test around 6 weeks uptake rate [Percentage]
87.3 96.8 101.8 22 95.2 100.6
Infant 1st PCR test positive around 6 weeks rate [Percentage]
2.6 1.5 1.9 37 1.7 2.8 1.5 1.5 1.8 2.0
Child Health School Grade 1 screening coverage [Percentage]
25.8 22.9 23 13.4 70.0 27.4 23.2 30.0 35.0
Vitamin A dose 12-59 months coverage [Percentage]
40.5 48.7 59.0 11 53.0 55.0 55.0 52.2 55.0
Immunisation Immunisation coverage under 1 year [Percentage]
85.2 84.7 83.6 25 80.9 90.0 90.0 89.8 95.0 91.0
Measles 2nd dose coverage [Percentage]
69.2 69.6 76.5 32 73.6 95.0 90.0 82.8 85.0 85.0
Reproductive health
Cervical cancer screening coverage ([Percentage]
61.3 75.5 77.8 6 56.3 42.0 44.0 54.5 60.0 64.0
Couple year protection rate [Percentage]
36.7 38.2 43.5 29 39.4 60.0 46.8 55.0
TB case finding TB Rifampicin resistance confirmed client rate [Percentage]
5.3 4.7 6.0 28 6.0 6.4
HIV HIV testing coverage (including ANC)
37.8 42.5 9 36.0 32.1
Male condom distribution coverage
25.1 26.4 34.7 29 33.6 38.0 38.4
Non-communicable diseases
Hypertension incidence [per 1 000]
20.6 14.1 16.8 15.7 3.5 13.9
Mental health admission rate [Percentage]
1.5 2.1 1.3 1.2
Human Resources
PHC doctor clinical workload [Clients per doctor per day]
22.7 21.7 21.7 19 23.8 26.9
PHC professional nurse clinical workload [Clients per nurse per day]
25.2 25.1 26.9 15 33.7 29.4
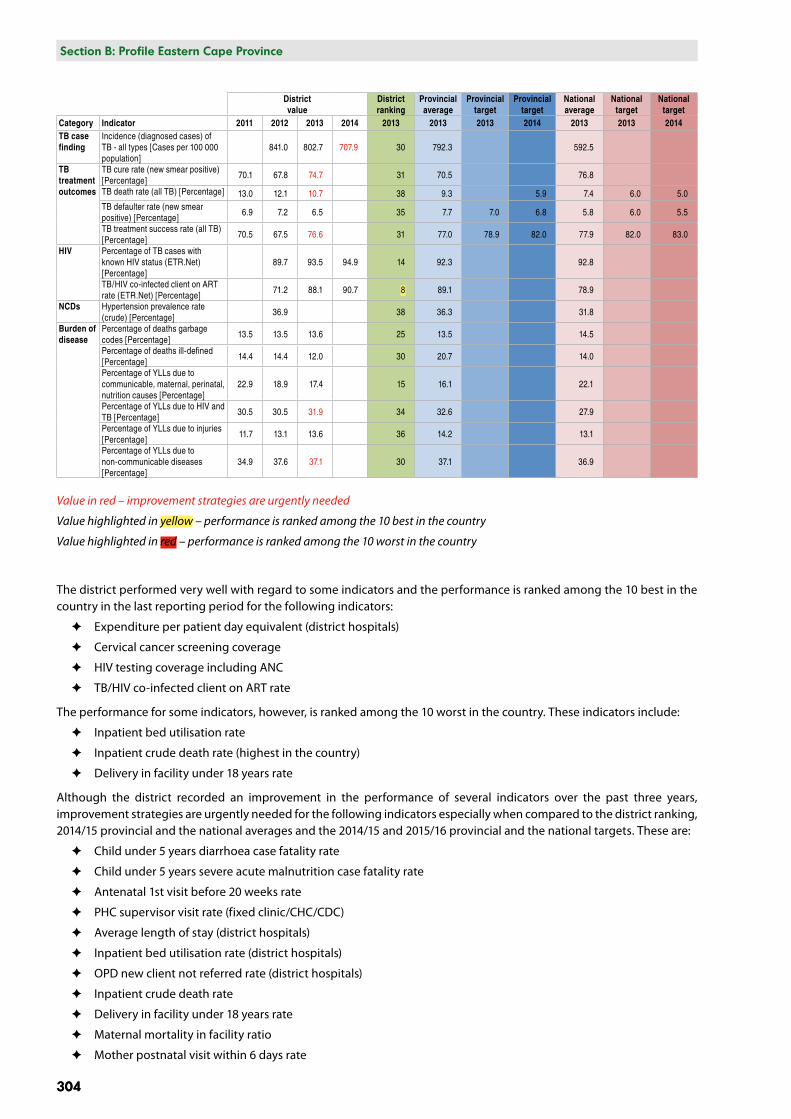
304
Section B: National and District Profiles
304
Section B: Profile Eastern Cape Province
District value
District ranking
Provincial average
Provincial target
Provincial target
National average
National target
National target
Category Indicator 2011 2012 2013 2014 2013 2013 2013 2014 2013 2013 2014TB case finding
Incidence (diagnosed cases) of TB - all types [Cases per 100 000 population]
841.0 802.7 707.9 30 792.3 592.5
TB treatment outcomes
TB cure rate (new smear positive) [Percentage]
70.1 67.8 74.7 31 70.5 76.8
TB death rate (all TB) [Percentage] 13.0 12.1 10.7 38 9.3 5.9 7.4 6.0 5.0TB defaulter rate (new smear positive) [Percentage]
6.9 7.2 6.5 35 7.7 7.0 6.8 5.8 6.0 5.5
TB treatment success rate (all TB) [Percentage]
70.5 67.5 76.6 31 77.0 78.9 82.0 77.9 82.0 83.0
HIV Percentage of TB cases with known HIV status (ETR.Net) [Percentage]
89.7 93.5 94.9 14 92.3 92.8
TB/HIV co-infected client on ART rate (ETR.Net) [Percentage]
71.2 88.1 90.7 8 89.1 78.9
NCDs Hypertension prevalence rate (crude) [Percentage]
36.9 38 36.3 31.8
Burden of disease
Percentage of deaths garbage codes [Percentage]
13.5 13.5 13.6 25 13.5 14.5
Percentage of deaths ill-defined [Percentage]
14.4 14.4 12.0 30 20.7 14.0
Percentage of YLLs due to communicable, maternal, perinatal, nutrition causes [Percentage]
22.9 18.9 17.4 15 16.1 22.1
Percentage of YLLs due to HIV and TB [Percentage]
30.5 30.5 31.9 34 32.6 27.9
Percentage of YLLs due to injuries [Percentage]
11.7 13.1 13.6 36 14.2 13.1
Percentage of YLLs due to non-communicable diseases [Percentage]
34.9 37.6 37.1 30 37.1 36.9
Value in red – improvement strategies are urgently needed
Value highlighted in yellow – performance is ranked among the 10 best in the country
Value highlighted in red – performance is ranked among the 10 worst in the country
The district performed very well with regard to some indicators and the performance is ranked among the 10 best in the country in the last reporting period for the following indicators:
✦ Expenditure per patient day equivalent (district hospitals)
✦ Cervical cancer screening coverage
✦ HIV testing coverage including ANC
✦ TB/HIV co-infected client on ART rate
The performance for some indicators, however, is ranked among the 10 worst in the country. These indicators include:
✦ Inpatient bed utilisation rate
✦ Inpatient crude death rate (highest in the country)
✦ Delivery in facility under 18 years rate
Although the district recorded an improvement in the performance of several indicators over the past three years, improvement strategies are urgently needed for the following indicators especially when compared to the district ranking, 2014/15 provincial and the national averages and the 2014/15 and 2015/16 provincial and the national targets. These are:
✦ Child under 5 years diarrhoea case fatality rate
✦ Child under 5 years severe acute malnutrition case fatality rate
✦ Antenatal 1st visit before 20 weeks rate
✦ PHC supervisor visit rate (fixed clinic/CHC/CDC)
✦ Average length of stay (district hospitals)
✦ Inpatient bed utilisation rate (district hospitals)
✦ OPD new client not referred rate (district hospitals)
✦ Inpatient crude death rate
✦ Delivery in facility under 18 years rate
✦ Maternal mortality in facility ratio
✦ Mother postnatal visit within 6 days rate
Section B: National and District Profiles
305
Section B: Profile Eastern Cape Province
305
✦ Infant 1st PCR test positive around 6 weeks rate
✦ School Grade 1 screening coverage
✦ Immunisation coverage under 1 year
✦ Measles 2nd dose coverage
✦ Couple year protection rate
✦ Male condom distribution coverage
✦ Hypertension incidence
✦ Mental health admission rate
✦ Incidence (diagnosed cases) of TB (all types)
✦ TB cure rate (new smear positive)
✦ TB death rate (all TB)
✦ TB treatment success rate (all TB)
✦ Hypertension prevalence rate (crude)
✦ Percentage of YLLs due to HIV and TB
✦ Percentage of YLLs due to non-communicable diseases
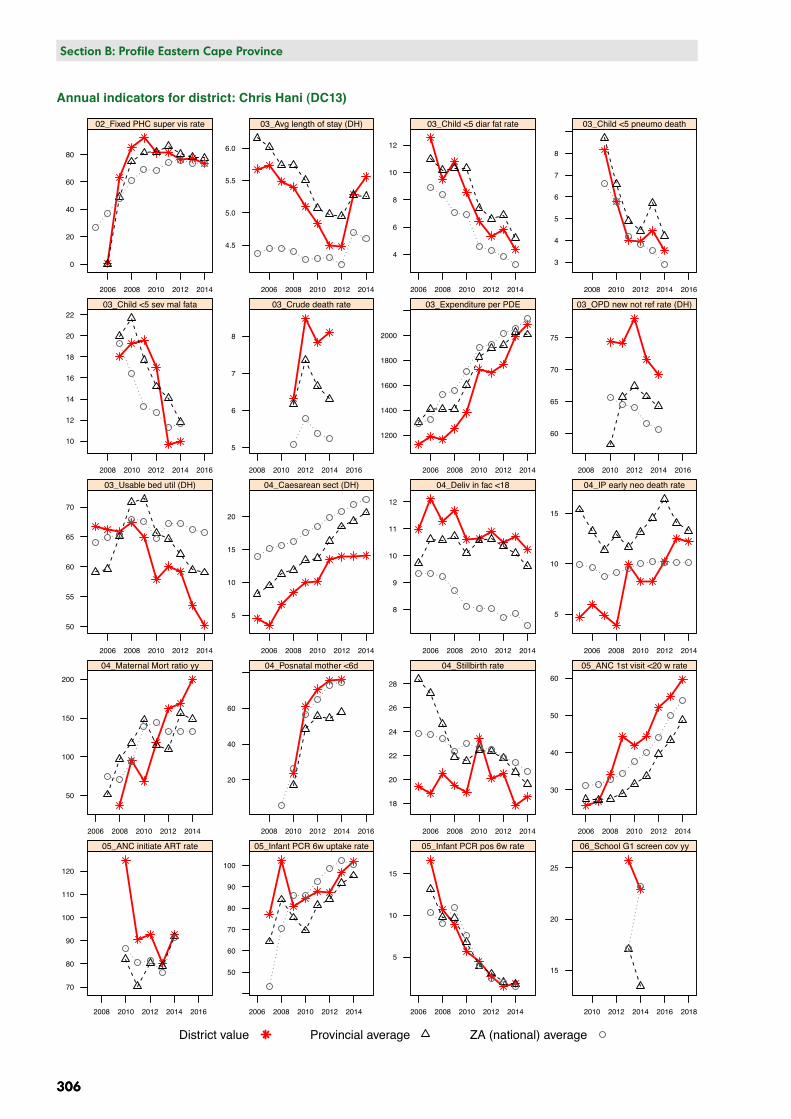
Annual indicators for district: C Hani: DC13
Valu
e
0
20
40
60
80
2006 2008 2010 2012 2014
02_Fixed PHC super vis rate
4.5
5.0
5.5
6.0
2006 2008 2010 2012 2014
03_Avg length of stay (DH)
4
6
8
10
12
2006 2008 2010 2012 2014
03_Child <5 diar fat rate
3
4
5
6
7
8
2008 2010 2012 2014 2016
03_Child <5 pneumo death
10
12
14
16
18
20
22
2008 2010 2012 2014 2016
03_Child <5 sev mal fata
5
6
7
8
2008 2010 2012 2014 2016
03_Crude death rate
1200
1400
1600
1800
2000
2006 2008 2010 2012 2014
03_Expenditure per PDE
60
65
70
75
2008 2010 2012 2014 2016
03_OPD new not ref rate (DH)
50
55
60
65
70
2006 2008 2010 2012 2014
03_Usable bed util (DH)
5
10
15
20
2006 2008 2010 2012 2014
04_Caesarean sect (DH)
8
9
10
11
12
2006 2008 2010 2012 2014
04_Deliv in fac <18
5
10
15
2006 2008 2010 2012 2014
04_IP early neo death rate
50
100
150
200
2006 2008 2010 2012 2014
04_Maternal Mort ratio yy
20
40
60
2008 2010 2012 2014 2016
04_Posnatal mother <6d
18
20
22
24
26
28
2006 2008 2010 2012 2014
04_Stillbirth rate
30
40
50
60
2006 2008 2010 2012 2014
05_ANC 1st visit <20 w rate
70
80
90
100
110
120
2008 2010 2012 2014 2016
05_ANC initiate ART rate
50
60
70
80
90
100
2006 2008 2010 2012 2014
05_Infant PCR 6w uptake rate
5
10
15
2006 2008 2010 2012 2014
05_Infant PCR pos 6w rate
15
20
25
2010 2012 2014 2016 2018
06_School G1 screen cov yy
District value Provincial average ZA (national) average
306
Section B: National and District Profiles
306
Section B: Profile Eastern Cape Province
Annual indicators for district: Chris Hani (DC13)
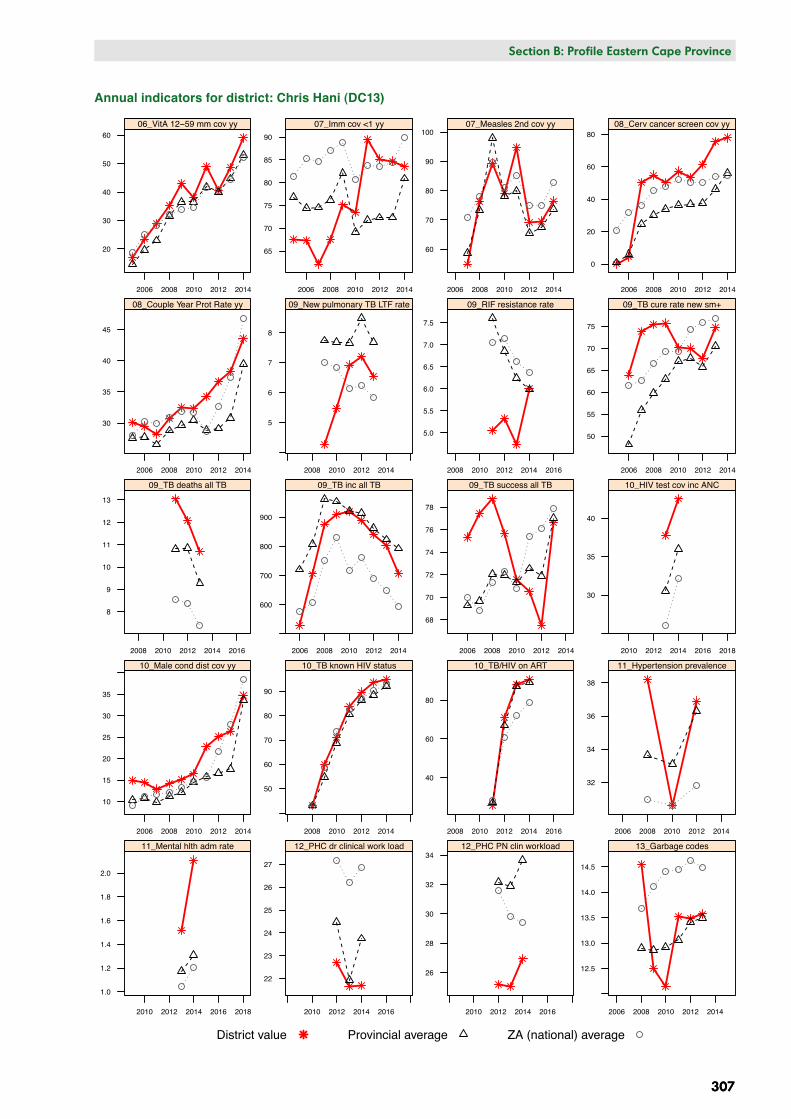
Annual indicators for district: C Hani: DC13Va
lue
20
30
40
50
60
2006 2008 2010 2012 2014
06_VitA 12−59 mm cov yy
65
70
75
80
85
90
2006 2008 2010 2012 2014
07_Imm cov <1 yy
60
70
80
90
100
2006 2008 2010 2012 2014
07_Measles 2nd cov yy
0
20
40
60
80
2006 2008 2010 2012 2014
08_Cerv cancer screen cov yy
30
35
40
45
2006 2008 2010 2012 2014
08_Couple Year Prot Rate yy
5
6
7
8
2008 2010 2012 2014
09_New pulmonary TB LTF rate
5.0
5.5
6.0
6.5
7.0
7.5
2008 2010 2012 2014 2016
09_RIF resistance rate
50
55
60
65
70
75
2006 2008 2010 2012 2014
09_TB cure rate new sm+
8
9
10
11
12
13
2008 2010 2012 2014 2016
09_TB deaths all TB
600
700
800
900
2006 2008 2010 2012 2014
09_TB inc all TB
68
70
72
74
76
78
2006 2008 2010 2012 2014
09_TB success all TB
30
35
40
2010 2012 2014 2016 2018
10_HIV test cov inc ANC
10
15
20
25
30
35
2006 2008 2010 2012 2014
10_Male cond dist cov yy
50
60
70
80
90
2008 2010 2012 2014
10_TB known HIV status
40
60
80
2008 2010 2012 2014 2016
10_TB/HIV on ART
32
34
36
38
2006 2008 2010 2012 2014
11_Hypertension prevalence
1.0
1.2
1.4
1.6
1.8
2.0
2010 2012 2014 2016 2018
11_Mental hlth adm rate
22
23
24
25
26
27
2010 2012 2014 2016
12_PHC dr clinical work load
26
28
30
32
34
2010 2012 2014 2016
12_PHC PN clin workload
12.5
13.0
13.5
14.0
14.5
2006 2008 2010 2012 2014
13_Garbage codes
District value Provincial average ZA (national) average
Section B: National and District Profiles
307
Section B: Profile Eastern Cape Province
307
Annual indicators for district: Chris Hani (DC13)
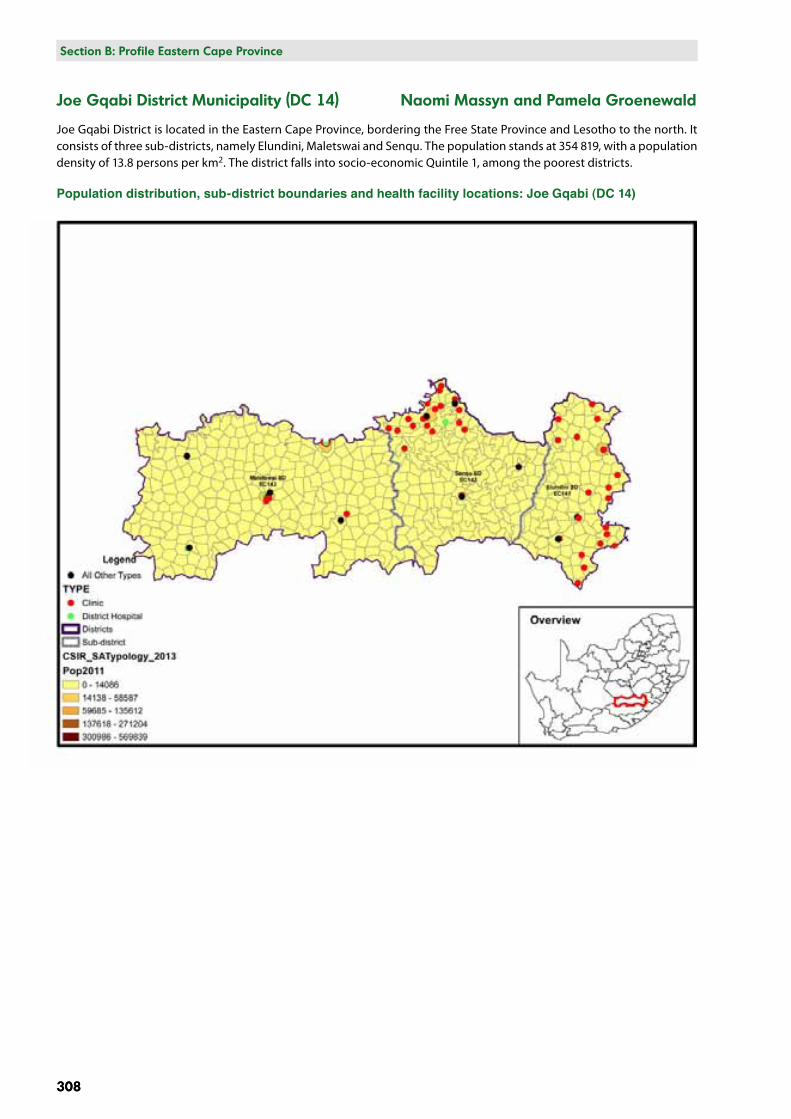
308
Section B: National and District Profiles
308
Section B: Profile Eastern Cape Province
Joe Gqabi District Municipality (DC 14) Naomi Massyn and Pamela Groenewald
Joe Gqabi District is located in the Eastern Cape Province, bordering the Free State Province and Lesotho to the north. It consists of three sub-districts, namely Elundini, Maletswai and Senqu. The population stands at 354 819, with a population density of 13.8 persons per km2. The district falls into socio-economic Quintile 1, among the poorest districts.
Population distribution, sub-district boundaries and health facility locations: Joe Gqabi (DC 14)
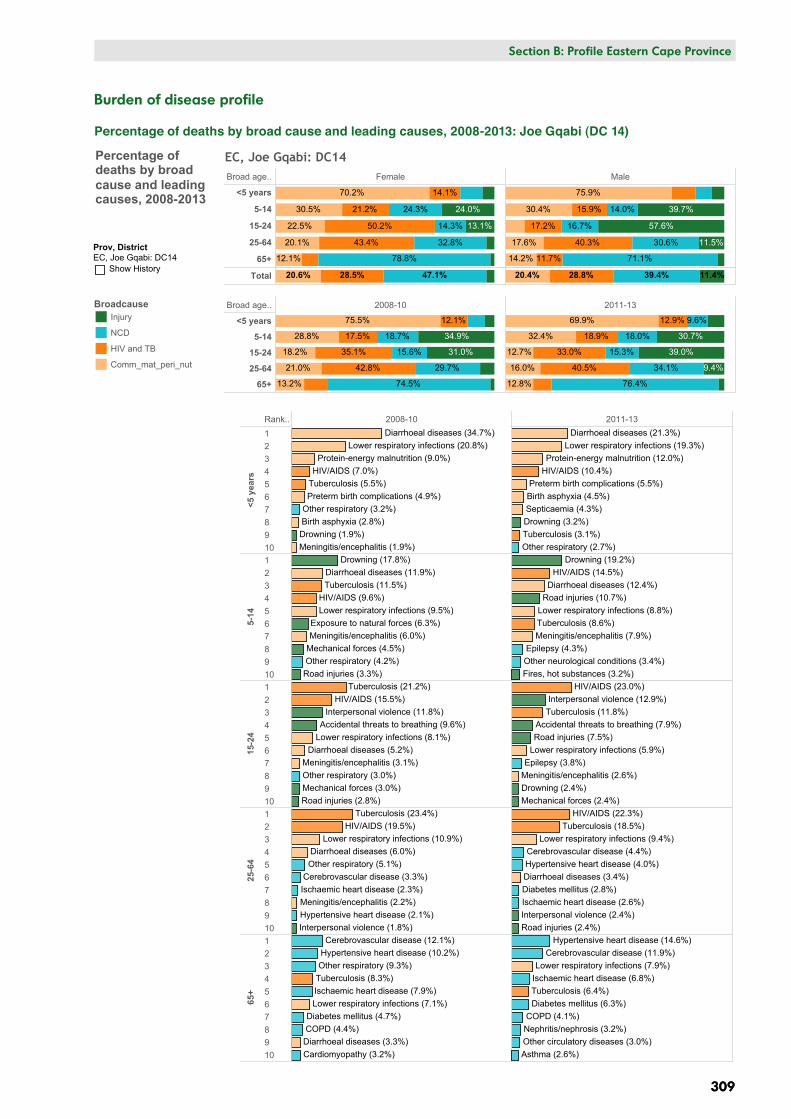
Broad age.. Female Male
<5 years
5-14
15-24
25-64
65+
Total 47.1%28.5%20.6%
24.0%
13.1%
24.3%
14.3%
32.8%
78.8%
14.1%
21.2%
50.2%
43.4%
70.2%
30.5%
22.5%
20.1%
12.1%
11.4%39.4%28.8%20.4%
39.7%
57.6%
11.5%
14.0%
16.7%
30.6%
71.1%
15.9%
17.2%
40.3%
11.7%
75.9%
30.4%
17.6%
14.2%
EC, Joe Gqabi: DC14
Broad age.. 2008-10 2011-13
<5 years
5-14
15-24
25-64
65+
34.9%
31.0%
18.7%
15.6%
29.7%
74.5%
12.1%
17.5%
35.1%
42.8%
75.5%
28.8%
18.2%
21.0%
13.2%
30.7%
39.0%
18.0%
15.3%
34.1%
76.4%
12.9%
18.9%
33.0%
40.5%
69.9%
32.4%
12.7%
16.0%
12.8%
9.4%
9.6%
Rank.. 2008-10 2011-13
<5 y
ears
12345678910
5-14
12345678910
15-2
4
12345678910
25-6
4
12345678910
65+
12345678910
Drowning (1.9%)
Protein-energy malnutrition (9.0%)
Birth asphyxia (2.8%)Other respiratory (3.2%)Preterm birth complications (4.9%)
Meningitis/encephalitis (1.9%)
Diarrhoeal diseases (34.7%)Lower respiratory infections (20.8%)
HIV/AIDS (7.0%)Tuberculosis (5.5%)
Drowning (3.2%)
Protein-energy malnutrition (12.0%)
Birth asphyxia (4.5%)
Other respiratory (2.7%)
Preterm birth complications (5.5%)
Septicaemia (4.3%)
Diarrhoeal diseases (21.3%)Lower respiratory infections (19.3%)
HIV/AIDS (10.4%)
Tuberculosis (3.1%)
Exposure to natural forces (6.3%)
Drowning (17.8%)
Other respiratory (4.2%)Mechanical forces (4.5%)Meningitis/encephalitis (6.0%)
Road injuries (3.3%)
Diarrhoeal diseases (11.9%)
Lower respiratory infections (9.5%)HIV/AIDS (9.6%)
Tuberculosis (11.5%)
Other neurological conditions (3.4%)
Drowning (19.2%)
Epilepsy (4.3%)
Fires, hot substances (3.2%)
Meningitis/encephalitis (7.9%)
Road injuries (10.7%)Diarrhoeal diseases (12.4%)
Lower respiratory infections (8.8%)
HIV/AIDS (14.5%)
Tuberculosis (8.6%)
Other respiratory (3.0%)
Interpersonal violence (11.8%)
Mechanical forces (3.0%)
Accidental threats to breathing (9.6%)
Meningitis/encephalitis (3.1%)
Road injuries (2.8%)
Diarrhoeal diseases (5.2%)Lower respiratory infections (8.1%)
HIV/AIDS (15.5%)Tuberculosis (21.2%)
Drowning (2.4%)
Epilepsy (3.8%)
Interpersonal violence (12.9%)
Mechanical forces (2.4%)
Accidental threats to breathing (7.9%)
Meningitis/encephalitis (2.6%)
Road injuries (7.5%)Lower respiratory infections (5.9%)
HIV/AIDS (23.0%)
Tuberculosis (11.8%)
Other respiratory (5.1%)
Interpersonal violence (1.8%)
Meningitis/encephalitis (2.2%)Hypertensive heart disease (2.1%)
Ischaemic heart disease (2.3%)
Diarrhoeal diseases (6.0%)
Cerebrovascular disease (3.3%)
Lower respiratory infections (10.9%)HIV/AIDS (19.5%)
Tuberculosis (23.4%)
Interpersonal violence (2.4%)Road injuries (2.4%)
Diabetes mellitus (2.8%)
Hypertensive heart disease (4.0%)
Ischaemic heart disease (2.6%)
Diarrhoeal diseases (3.4%)
Cerebrovascular disease (4.4%)Lower respiratory infections (9.4%)
HIV/AIDS (22.3%)Tuberculosis (18.5%)
Other respiratory (9.3%)
Cardiomyopathy (3.2%)
COPD (4.4%)Diabetes mellitus (4.7%)
Hypertensive heart disease (10.2%)
Ischaemic heart disease (7.9%)
Diarrhoeal diseases (3.3%)
Cerebrovascular disease (12.1%)
Lower respiratory infections (7.1%)
Tuberculosis (8.3%)
Other circulatory diseases (3.0%)Asthma (2.6%)
COPD (4.1%)Nephritis/nephrosis (3.2%)
Diabetes mellitus (6.3%)
Hypertensive heart disease (14.6%)
Ischaemic heart disease (6.8%)
Cerebrovascular disease (11.9%)Lower respiratory infections (7.9%)
Tuberculosis (6.4%)
Prov, DistrictEC, Joe Gqabi: DC14
Show History
BroadcauseInjury
NCD
HIV and TB
Comm_mat_peri_nut
Percentage ofdeaths by broadcause and leadingcauses, 2008-2013
Section B: National and District Profiles
309
Section B: Profile Eastern Cape Province
309
Burden of disease profile
Percentage of deaths by broad cause and leading causes, 2008-2013: Joe Gqabi (DC 14)
310
Section B: National and District Profiles
310
Section B: Profile Eastern Cape Province
Broad cause groups by age and gender
In the under-5-year age group, communicable diseases together with maternal, perinatal and nutritional conditions accounted for more than 70% of deaths. HIV and TB accounted for about 14% of deaths, and injuries for around 8%.
In the 5–14-year age group there were bigger differences in the proportions of broad causes between females and males. Injuries accounted for 24.0% of deaths among females and 39.7% of deaths among males, while non-communicable diseases accounted for 24.3% of deaths among females and 14.0% of deaths among males.
In the 15–24-year age group, injury accounted for 57.6% of deaths among males compared with only 13.1% among females, while HIV and TB accounted for 50.2% of deaths among females and only 17.2% among males.
In the 25–64-year age group, HIV and TB accounted for the largest proportion of deaths (43.4% among females and 40.3% among males). Deaths due to non-communicable diseases increased to 32.8% among females and 30.6% among males. Injuries accounted for a small proportion of deaths in this age group, with the percentage being much higher among males (11.5%) than females (3.7%).
In the 65-years-and-older age group, non-communicable diseases accounted for the highest proportion of deaths (78.8% among females and 71.1% among males). Communicable diseases together with maternal, perinatal and nutritional conditions accounted for 12.1% of deaths among females and 14.2% among males.
Trends in broad cause groups by age
In children under 5 years, there was a marked decline in deaths due to communicable diseases together with maternal, perinatal and nutritional conditions, and an increase in injury-related deaths. In the 5–14-year age group, there was a slight increase in deaths due to HIV and TB and communicable diseases together with maternal, perinatal and nutritional conditions, and a decline in injury-related deaths. In the 15–24-year age group, mortality due to HIV and TB and communicable diseases together with maternal, perinatal and nutritional conditions decreased slightly, while injury-related deaths increased. In the 25–64-year age group, a decrease was observed in deaths due to communicable diseases together with maternal, perinatal and nutritional conditions and TB and HIV, while an increase was observed in non-communicable disease mortality. There was not much change in the broad cause groups over the period in the 65-years-and-older age group.
Trends in leading causes of death by age
Under 5 years
Diarrhoeal diseases, lower respiratory infections, protein-energy malnutrition, HIV and AIDS, and prematurity, remained the leading causes of death between 2008–2010 and 2011–2013. Tuberculosis and other respiratory conditions moved down in the ranking, while birth asphyxia and drowning moved up. Mortality in this age group was still largely HIV-related.
5–14 years
Drowning, HIV and AIDS and diarrhoeal disease remained the leading causes of death in this age group. Tuberculosis moved down in the ranking, while road injuries moved up. Lower respiratory infections, meningitis and epilepsy were among the leading causes of death.
15–24 years
HIV and AIDS, interpersonal violence, and accidental threats to breathing remained the leading causes of death in this age group, followed by road injuries, lower respiratory infection, epilepsy, meningitis and drowning.
25–64 years
HIV and AIDS, TB and lower respiratory infection remained the leading causes of death over this period, accounting for almost 50% of deaths in this age group. Cerebrovascular disease, hypertensive heart disease, diarrhoea, diabetes mellitus, ischaemic heart disease, interpersonal violence and road injuries also appeared in the top 10 causes of death.
65 years and older
Cerebrovascular disease and hypertensive heart disease remained the top two leading causes. Lower respiratory infections, ischaemic heart disease, TB, diabetes mellitus, chronic obstructive pulmonary disease, nephritis/nephrosis, other circulatory diseases and asthma were the remaining leading causes.
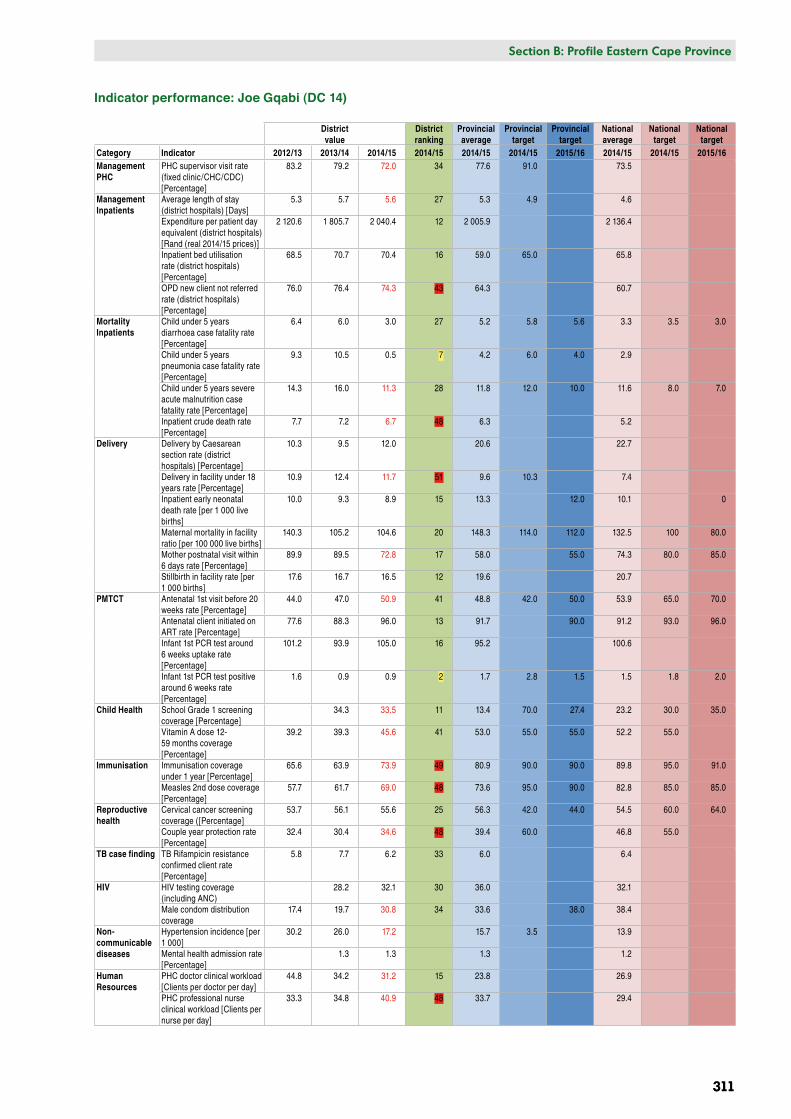
Section B: National and District Profiles
311
Section B: Profile Eastern Cape Province
311
Indicator performance: Joe Gqabi (DC 14)
District value
District ranking
Provincial average
Provincial target
Provincial target
National average
National target
National target
Category Indicator 2012/13 2013/14 2014/15 2014/15 2014/15 2014/15 2015/16 2014/15 2014/15 2015/16Management PHC
PHC supervisor visit rate (fixed clinic/CHC/CDC) [Percentage]
83.2 79.2 72.0 34 77.6 91.0 73.5
Management Inpatients
Average length of stay (district hospitals) [Days]
5.3 5.7 5.6 27 5.3 4.9 4.6
Expenditure per patient day equivalent (district hospitals) [Rand (real 2014/15 prices)]
2 120.6 1 805.7 2 040.4 12 2 005.9 2 136.4
Inpatient bed utilisation rate (district hospitals) [Percentage]
68.5 70.7 70.4 16 59.0 65.0 65.8
OPD new client not referred rate (district hospitals) [Percentage]
76.0 76.4 74.3 43 64.3 60.7
Mortality Inpatients
Child under 5 years diarrhoea case fatality rate [Percentage]
6.4 6.0 3.0 27 5.2 5.8 5.6 3.3 3.5 3.0
Child under 5 years pneumonia case fatality rate [Percentage]
9.3 10.5 0.5 7 4.2 6.0 4.0 2.9
Child under 5 years severe acute malnutrition case fatality rate [Percentage]
14.3 16.0 11.3 28 11.8 12.0 10.0 11.6 8.0 7.0
Inpatient crude death rate [Percentage]
7.7 7.2 6.7 48 6.3 5.2
Delivery Delivery by Caesarean section rate (district hospitals) [Percentage]
10.3 9.5 12.0 20.6 22.7
Delivery in facility under 18 years rate [Percentage]
10.9 12.4 11.7 51 9.6 10.3 7.4
Inpatient early neonatal death rate [per 1 000 live births]
10.0 9.3 8.9 15 13.3 12.0 10.1 0
Maternal mortality in facility ratio [per 100 000 live births]
140.3 105.2 104.6 20 148.3 114.0 112.0 132.5 100 80.0
Mother postnatal visit within 6 days rate [Percentage]
89.9 89.5 72.8 17 58.0 55.0 74.3 80.0 85.0
Stillbirth in facility rate [per 1 000 births]
17.6 16.7 16.5 12 19.6 20.7
PMTCT Antenatal 1st visit before 20 weeks rate [Percentage]
44.0 47.0 50.9 41 48.8 42.0 50.0 53.9 65.0 70.0
Antenatal client initiated on ART rate [Percentage]
77.6 88.3 96.0 13 91.7 90.0 91.2 93.0 96.0
Infant 1st PCR test around 6 weeks uptake rate [Percentage]
101.2 93.9 105.0 16 95.2 100.6
Infant 1st PCR test positive around 6 weeks rate [Percentage]
1.6 0.9 0.9 2 1.7 2.8 1.5 1.5 1.8 2.0
Child Health School Grade 1 screening coverage [Percentage]
34.3 33.5 11 13.4 70.0 27.4 23.2 30.0 35.0
Vitamin A dose 12-59 months coverage [Percentage]
39.2 39.3 45.6 41 53.0 55.0 55.0 52.2 55.0
Immunisation Immunisation coverage under 1 year [Percentage]
65.6 63.9 73.9 49 80.9 90.0 90.0 89.8 95.0 91.0
Measles 2nd dose coverage [Percentage]
57.7 61.7 69.0 48 73.6 95.0 90.0 82.8 85.0 85.0
Reproductive health
Cervical cancer screening coverage ([Percentage]
53.7 56.1 55.6 25 56.3 42.0 44.0 54.5 60.0 64.0
Couple year protection rate [Percentage]
32.4 30.4 34.6 48 39.4 60.0 46.8 55.0
TB case finding TB Rifampicin resistance confirmed client rate [Percentage]
5.8 7.7 6.2 33 6.0 6.4
HIV HIV testing coverage (including ANC)
28.2 32.1 30 36.0 32.1
Male condom distribution coverage
17.4 19.7 30.8 34 33.6 38.0 38.4
Non-communicable diseases
Hypertension incidence [per 1 000]
30.2 26.0 17.2 15.7 3.5 13.9
Mental health admission rate [Percentage]
1.3 1.3 1.3 1.2
Human Resources
PHC doctor clinical workload [Clients per doctor per day]
44.8 34.2 31.2 15 23.8 26.9
PHC professional nurse clinical workload [Clients per nurse per day]
33.3 34.8 40.9 48 33.7 29.4
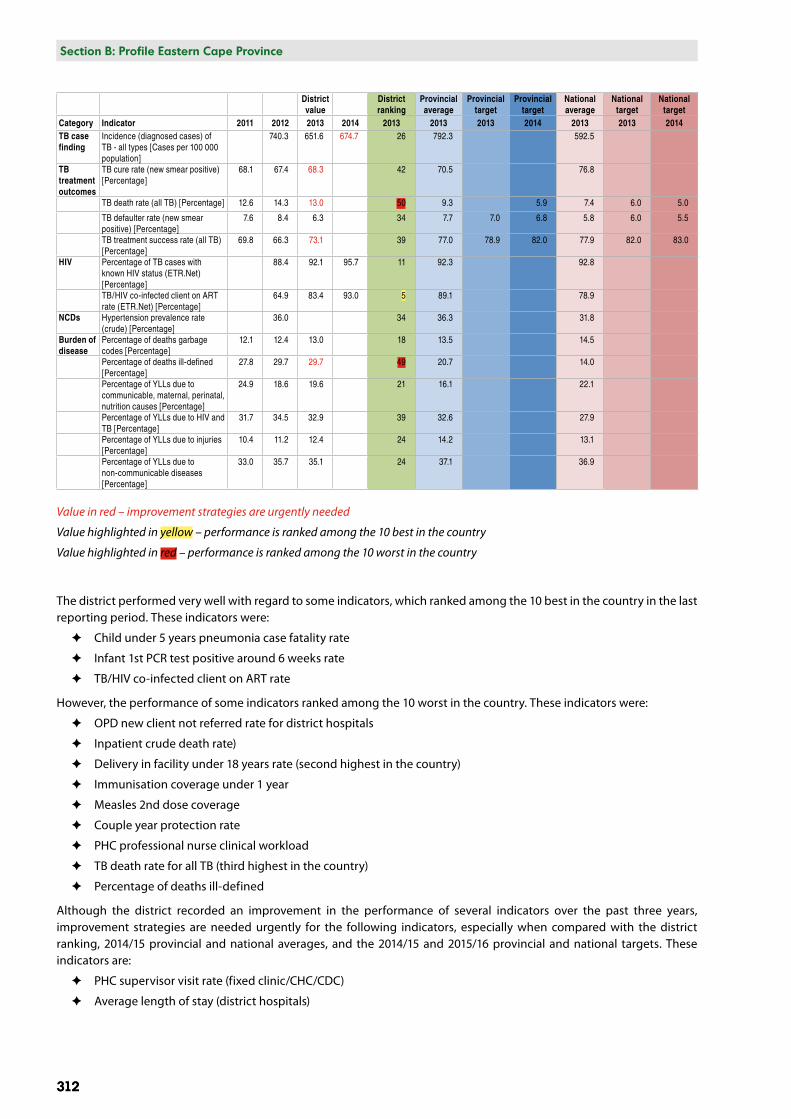
312
Section B: National and District Profiles
312
Section B: Profile Eastern Cape Province
District value
District ranking
Provincial average
Provincial target
Provincial target
National average
National target
National target
Category Indicator 2011 2012 2013 2014 2013 2013 2013 2014 2013 2013 2014TB case finding
Incidence (diagnosed cases) of TB - all types [Cases per 100 000 population]
740.3 651.6 674.7 26 792.3 592.5
TB treatment outcomes
TB cure rate (new smear positive) [Percentage]
68.1 67.4 68.3 42 70.5 76.8
TB death rate (all TB) [Percentage] 12.6 14.3 13.0 50 9.3 5.9 7.4 6.0 5.0
TB defaulter rate (new smear positive) [Percentage]
7.6 8.4 6.3 34 7.7 7.0 6.8 5.8 6.0 5.5
TB treatment success rate (all TB) [Percentage]
69.8 66.3 73.1 39 77.0 78.9 82.0 77.9 82.0 83.0
HIV Percentage of TB cases with known HIV status (ETR.Net) [Percentage]
88.4 92.1 95.7 11 92.3 92.8
TB/HIV co-infected client on ART rate (ETR.Net) [Percentage]
64.9 83.4 93.0 5 89.1 78.9
NCDs Hypertension prevalence rate (crude) [Percentage]
36.0 34 36.3 31.8
Burden of disease
Percentage of deaths garbage codes [Percentage]
12.1 12.4 13.0 18 13.5 14.5
Percentage of deaths ill-defined [Percentage]
27.8 29.7 29.7 49 20.7 14.0
Percentage of YLLs due to communicable, maternal, perinatal, nutrition causes [Percentage]
24.9 18.6 19.6 21 16.1 22.1
Percentage of YLLs due to HIV and TB [Percentage]
31.7 34.5 32.9 39 32.6 27.9
Percentage of YLLs due to injuries [Percentage]
10.4 11.2 12.4 24 14.2 13.1
Percentage of YLLs due to non-communicable diseases [Percentage]
33.0 35.7 35.1 24 37.1 36.9
Value in red – improvement strategies are urgently needed
Value highlighted in yellow – performance is ranked among the 10 best in the country
Value highlighted in red – performance is ranked among the 10 worst in the country
The district performed very well with regard to some indicators, which ranked among the 10 best in the country in the last reporting period. These indicators were:
✦ Child under 5 years pneumonia case fatality rate
✦ Infant 1st PCR test positive around 6 weeks rate
✦ TB/HIV co-infected client on ART rate
However, the performance of some indicators ranked among the 10 worst in the country. These indicators were:
✦ OPD new client not referred rate for district hospitals
✦ Inpatient crude death rate)
✦ Delivery in facility under 18 years rate (second highest in the country)
✦ Immunisation coverage under 1 year
✦ Measles 2nd dose coverage
✦ Couple year protection rate
✦ PHC professional nurse clinical workload
✦ TB death rate for all TB (third highest in the country)
✦ Percentage of deaths ill-defined
Although the district recorded an improvement in the performance of several indicators over the past three years, improvement strategies are needed urgently for the following indicators, especially when compared with the district ranking, 2014/15 provincial and national averages, and the 2014/15 and 2015/16 provincial and national targets. These indicators are:
✦ PHC supervisor visit rate (fixed clinic/CHC/CDC)
✦ Average length of stay (district hospitals)
Section B: National and District Profiles
313
Section B: Profile Eastern Cape Province
313
✦ OPD new client not referred rate (district hospitals)
✦ Child under 5 years severe acute malnutrition case fatality rate
✦ Inpatient crude death rate
✦ Delivery in facility under 18 years rate
✦ Mother postnatal visit within 6 days rate
✦ Antenatal 1st visit before 20 weeks rate
✦ School Grade 1 screening coverage
✦ Vitamin A dose 12–59 months coverage (annualised)
✦ Immunisation coverage under 1 year
✦ Measles 2nd dose coverage
✦ Couple year protection rate
✦ Male condom distribution coverage
✦ Hypertension incidence
✦ PHC doctor clinical workload
✦ PHC professional nurse clinical workload
✦ Incidence (diagnosed cases) of TB (all types)
✦ TB cure rate (new smear positive)
✦ TB death rate (all TB)
✦ TB treatment success rate (all TB)
✦ Percentage of deaths ill-defined
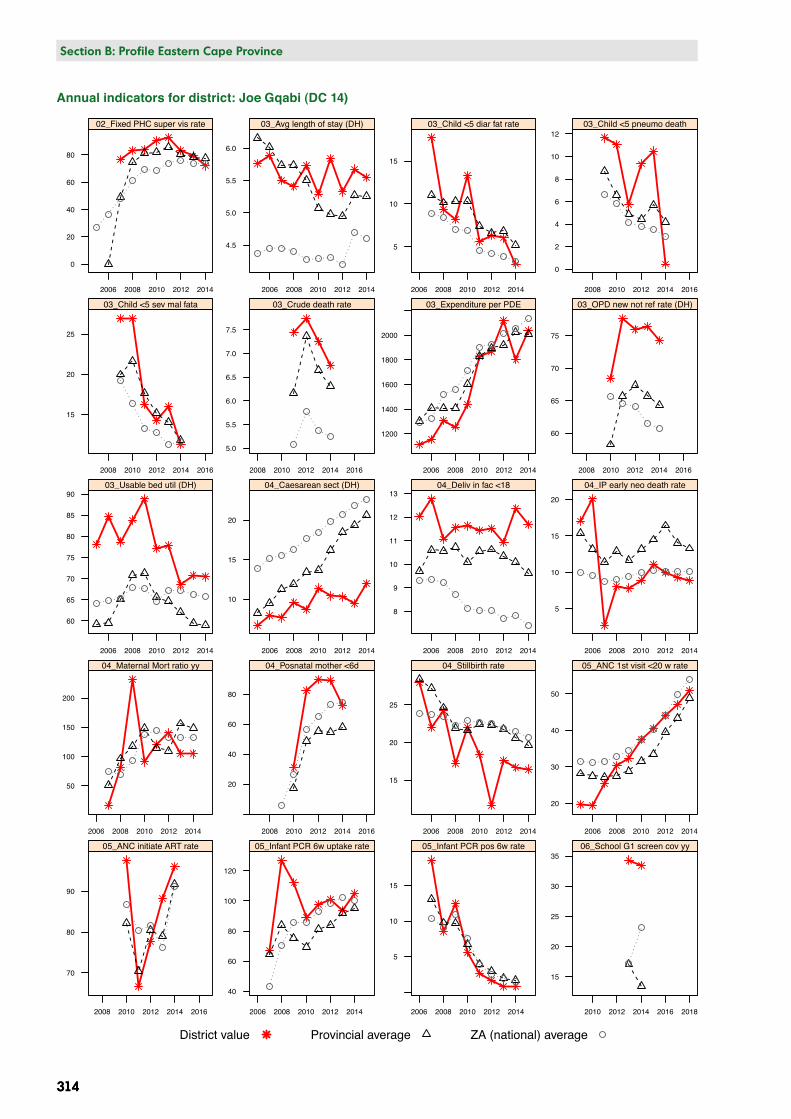
Annual indicators for district: Joe Gqabi: DC14
Valu
e
0
20
40
60
80
2006 2008 2010 2012 2014
02_Fixed PHC super vis rate
4.5
5.0
5.5
6.0
2006 2008 2010 2012 2014
03_Avg length of stay (DH)
5
10
15
2006 2008 2010 2012 2014
03_Child <5 diar fat rate
0
2
4
6
8
10
12
2008 2010 2012 2014 2016
03_Child <5 pneumo death
15
20
25
2008 2010 2012 2014 2016
03_Child <5 sev mal fata
5.0
5.5
6.0
6.5
7.0
7.5
2008 2010 2012 2014 2016
03_Crude death rate
1200
1400
1600
1800
2000
2006 2008 2010 2012 2014
03_Expenditure per PDE
60
65
70
75
2008 2010 2012 2014 2016
03_OPD new not ref rate (DH)
60
65
70
75
80
85
90
2006 2008 2010 2012 2014
03_Usable bed util (DH)
10
15
20
2006 2008 2010 2012 2014
04_Caesarean sect (DH)
8
9
10
11
12
13
2006 2008 2010 2012 2014
04_Deliv in fac <18
5
10
15
20
2006 2008 2010 2012 2014
04_IP early neo death rate
50
100
150
200
2006 2008 2010 2012 2014
04_Maternal Mort ratio yy
20
40
60
80
2008 2010 2012 2014 2016
04_Posnatal mother <6d
15
20
25
2006 2008 2010 2012 2014
04_Stillbirth rate
20
30
40
50
2006 2008 2010 2012 2014
05_ANC 1st visit <20 w rate
70
80
90
2008 2010 2012 2014 2016
05_ANC initiate ART rate
40
60
80
100
120
2006 2008 2010 2012 2014
05_Infant PCR 6w uptake rate
5
10
15
2006 2008 2010 2012 2014
05_Infant PCR pos 6w rate
15
20
25
30
35
2010 2012 2014 2016 2018
06_School G1 screen cov yy
District value Provincial average ZA (national) average
314
Section B: National and District Profiles
314
Section B: Profile Eastern Cape Province
Annual indicators for district: Joe Gqabi (DC 14)
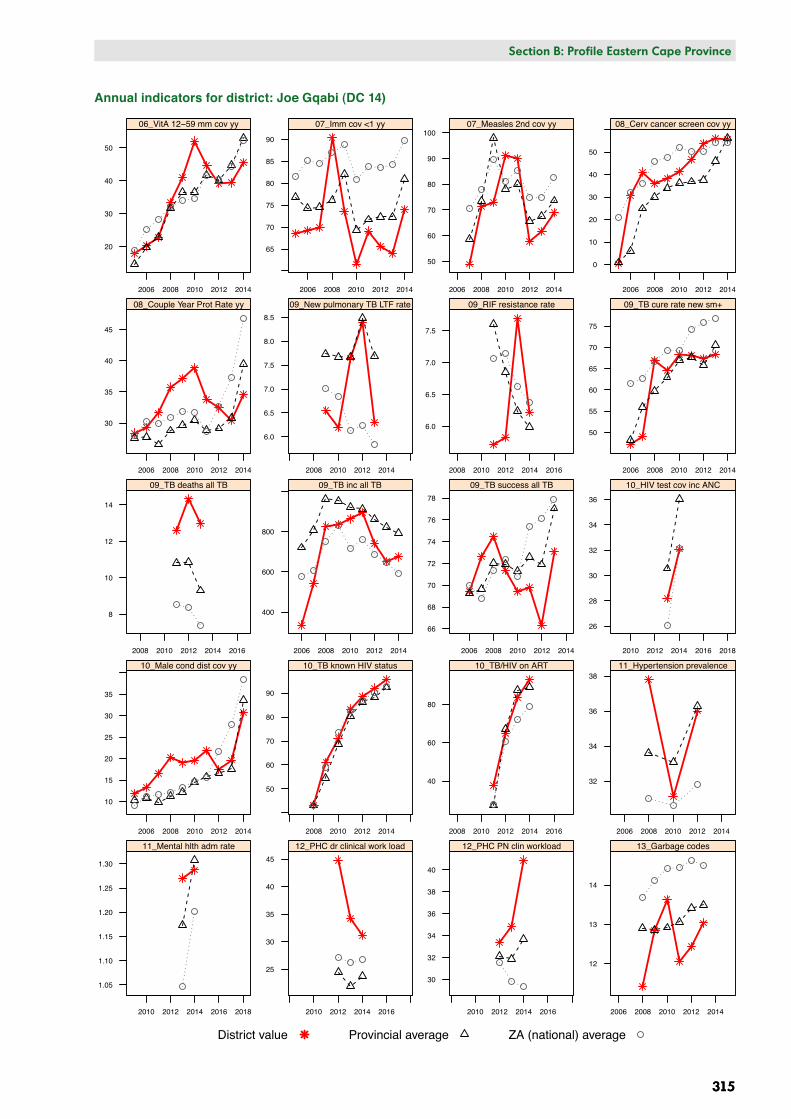
Annual indicators for district: Joe Gqabi: DC14Va
lue
20
30
40
50
2006 2008 2010 2012 2014
06_VitA 12−59 mm cov yy
65
70
75
80
85
90
2006 2008 2010 2012 2014
07_Imm cov <1 yy
50
60
70
80
90
100
2006 2008 2010 2012 2014
07_Measles 2nd cov yy
0
10
20
30
40
50
2006 2008 2010 2012 2014
08_Cerv cancer screen cov yy
30
35
40
45
2006 2008 2010 2012 2014
08_Couple Year Prot Rate yy
6.0
6.5
7.0
7.5
8.0
8.5
2008 2010 2012 2014
09_New pulmonary TB LTF rate
6.0
6.5
7.0
7.5
2008 2010 2012 2014 2016
09_RIF resistance rate
50
55
60
65
70
75
2006 2008 2010 2012 2014
09_TB cure rate new sm+
8
10
12
14
2008 2010 2012 2014 2016
09_TB deaths all TB
400
600
800
2006 2008 2010 2012 2014
09_TB inc all TB
66
68
70
72
74
76
78
2006 2008 2010 2012 2014
09_TB success all TB
26
28
30
32
34
36
2010 2012 2014 2016 2018
10_HIV test cov inc ANC
10
15
20
25
30
35
2006 2008 2010 2012 2014
10_Male cond dist cov yy
50
60
70
80
90
2008 2010 2012 2014
10_TB known HIV status
40
60
80
2008 2010 2012 2014 2016
10_TB/HIV on ART
32
34
36
38
2006 2008 2010 2012 2014
11_Hypertension prevalence
1.05
1.10
1.15
1.20
1.25
1.30
2010 2012 2014 2016 2018
11_Mental hlth adm rate
25
30
35
40
45
2010 2012 2014 2016
12_PHC dr clinical work load
30
32
34
36
38
40
2010 2012 2014 2016
12_PHC PN clin workload
12
13
14
2006 2008 2010 2012 2014
13_Garbage codes
District value Provincial average ZA (national) average
Section B: National and District Profiles
315
Section B: Profile Eastern Cape Province
315
Annual indicators for district: Joe Gqabi (DC 14)
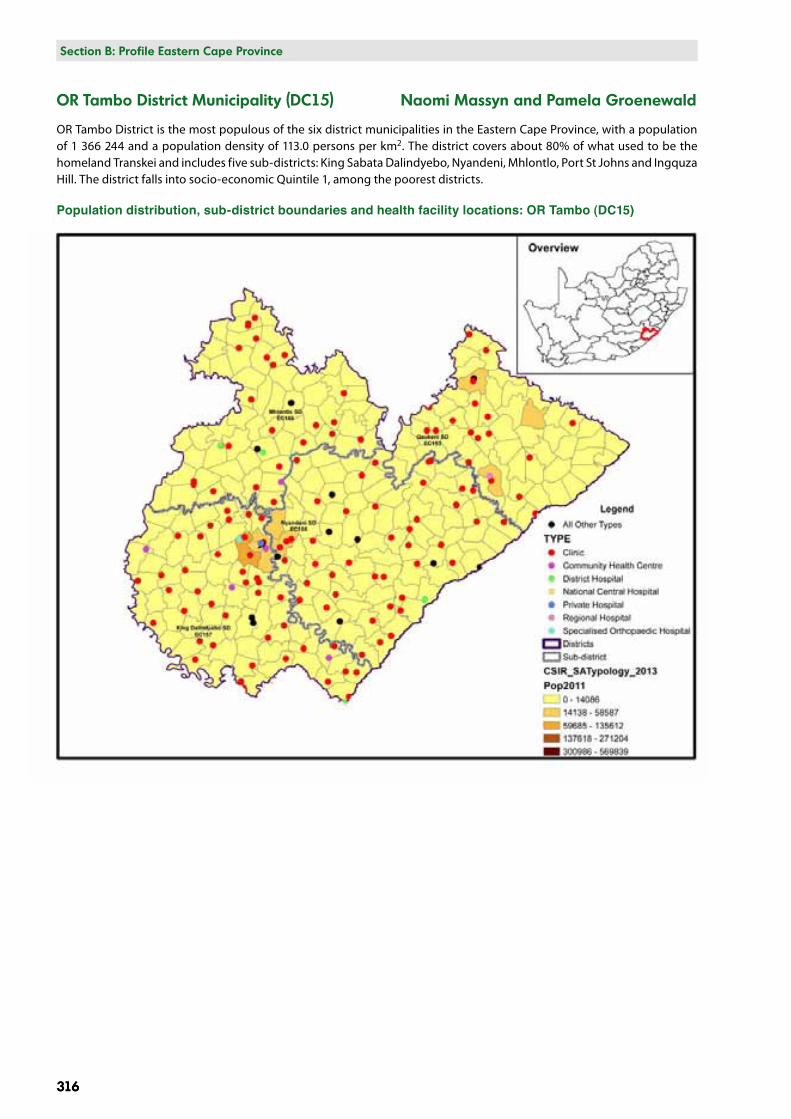
316
Section B: National and District Profiles
316
Section B: Profile Eastern Cape Province
OR Tambo District Municipality (DC15) Naomi Massyn and Pamela Groenewald
OR Tambo District is the most populous of the six district municipalities in the Eastern Cape Province, with a population of 1 366 244 and a population density of 113.0 persons per km2. The district covers about 80% of what used to be the homeland Transkei and includes five sub-districts: King Sabata Dalindyebo, Nyandeni, Mhlontlo, Port St Johns and Ingquza Hill. The district falls into socio-economic Quintile 1, among the poorest districts.
Population distribution, sub-district boundaries and health facility locations: OR Tambo (DC15)
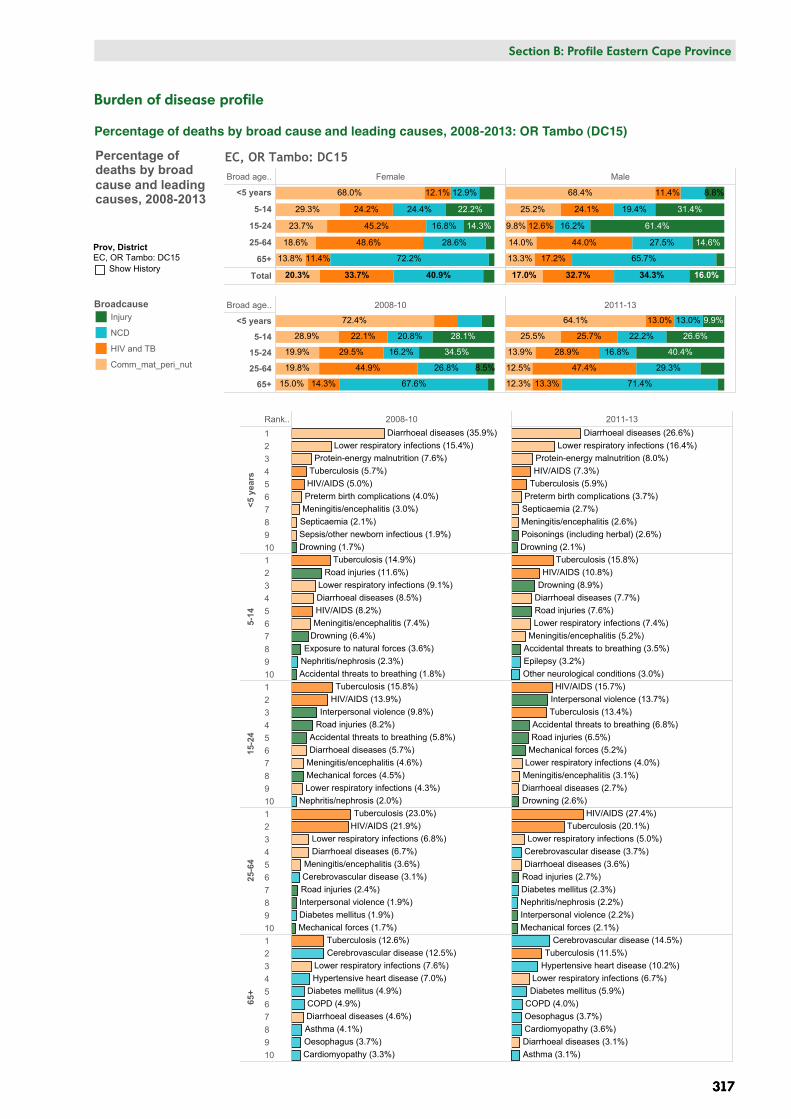
Broad age.. Female Male
<5 years
5-14
15-24
25-64
65+
Total 40.9%33.7%20.3%
22.2%
14.3%
12.9%
24.4%
16.8%
28.6%
72.2%
12.1%
24.2%
45.2%
48.6%
11.4%
68.0%
29.3%
23.7%
18.6%
13.8%
16.0%34.3%32.7%17.0%
31.4%
61.4%
14.6%
19.4%
16.2%
27.5%
65.7%
11.4%
24.1%
12.6%
44.0%
17.2%
68.4%
25.2%
14.0%
13.3%
8.8%
9.8%
EC, OR Tambo: DC15
Broad age.. 2008-10 2011-13
<5 years
5-14
15-24
25-64
65+
28.1%
34.5%
20.8%
16.2%
26.8%
67.6%
22.1%
29.5%
44.9%
14.3%
72.4%
28.9%
19.9%
19.8%
15.0%
8.5%
26.6%
40.4%
13.0%
22.2%
16.8%
29.3%
71.4%
13.0%
25.7%
28.9%
47.4%
13.3%
64.1%
25.5%
13.9%
12.5%
12.3%
9.9%
Rank.. 2008-10 2011-13
<5 y
ears
12345678910
5-14
12345678910
15-2
4
12345678910
25-6
4
12345678910
65+
12345678910
Sepsis/other newborn infectious (1.9%)Drowning (1.7%)
Protein-energy malnutrition (7.6%)
Preterm birth complications (4.0%)
Septicaemia (2.1%)Meningitis/encephalitis (3.0%)
Diarrhoeal diseases (35.9%)Lower respiratory infections (15.4%)
HIV/AIDS (5.0%)Tuberculosis (5.7%)
Poisonings (including herbal) (2.6%)Drowning (2.1%)
Protein-energy malnutrition (8.0%)
Preterm birth complications (3.7%)Septicaemia (2.7%)Meningitis/encephalitis (2.6%)
Diarrhoeal diseases (26.6%)Lower respiratory infections (16.4%)
HIV/AIDS (7.3%)Tuberculosis (5.9%)
Exposure to natural forces (3.6%)Drowning (6.4%)
Accidental threats to breathing (1.8%)
Meningitis/encephalitis (7.4%)
Road injuries (11.6%)
Nephritis/nephrosis (2.3%)
Diarrhoeal diseases (8.5%)Lower respiratory infections (9.1%)
HIV/AIDS (8.2%)
Tuberculosis (14.9%)
Other neurological conditions (3.0%)
Drowning (8.9%)
Epilepsy (3.2%)Accidental threats to breathing (3.5%)Meningitis/encephalitis (5.2%)
Road injuries (7.6%)Diarrhoeal diseases (7.7%)
Lower respiratory infections (7.4%)
HIV/AIDS (10.8%)Tuberculosis (15.8%)
Interpersonal violence (9.8%)
Mechanical forces (4.5%)
Accidental threats to breathing (5.8%)
Meningitis/encephalitis (4.6%)
Road injuries (8.2%)
Nephritis/nephrosis (2.0%)
Diarrhoeal diseases (5.7%)
Lower respiratory infections (4.3%)
HIV/AIDS (13.9%)Tuberculosis (15.8%)
Drowning (2.6%)
Interpersonal violence (13.7%)
Mechanical forces (5.2%)
Accidental threats to breathing (6.8%)
Meningitis/encephalitis (3.1%)
Road injuries (6.5%)
Diarrhoeal diseases (2.7%)
Lower respiratory infections (4.0%)
HIV/AIDS (15.7%)
Tuberculosis (13.4%)
Interpersonal violence (1.9%)
Mechanical forces (1.7%)
Meningitis/encephalitis (3.6%)
Road injuries (2.4%)
Diabetes mellitus (1.9%)
Diarrhoeal diseases (6.7%)
Cerebrovascular disease (3.1%)
Lower respiratory infections (6.8%)HIV/AIDS (21.9%)Tuberculosis (23.0%)
Interpersonal violence (2.2%)Mechanical forces (2.1%)
Road injuries (2.7%)
Nephritis/nephrosis (2.2%)Diabetes mellitus (2.3%)
Diarrhoeal diseases (3.6%)Cerebrovascular disease (3.7%)Lower respiratory infections (5.0%)
HIV/AIDS (27.4%)Tuberculosis (20.1%)
Oesophagus (3.7%)Cardiomyopathy (3.3%)
Asthma (4.1%)
COPD (4.9%)Diabetes mellitus (4.9%)
Hypertensive heart disease (7.0%)
Diarrhoeal diseases (4.6%)
Cerebrovascular disease (12.5%)Lower respiratory infections (7.6%)
Tuberculosis (12.6%)
Oesophagus (3.7%)Cardiomyopathy (3.6%)
Asthma (3.1%)
COPD (4.0%)Diabetes mellitus (5.9%)
Hypertensive heart disease (10.2%)
Diarrhoeal diseases (3.1%)
Cerebrovascular disease (14.5%)
Lower respiratory infections (6.7%)
Tuberculosis (11.5%)
Prov, DistrictEC, OR Tambo: DC15
Show History
BroadcauseInjury
NCD
HIV and TB
Comm_mat_peri_nut
Percentage ofdeaths by broadcause and leadingcauses, 2008-2013
Section B: National and District Profiles
317
Section B: Profile Eastern Cape Province
317
Burden of disease profile
Percentage of deaths by broad cause and leading causes, 2008-2013: OR Tambo (DC15)
318
Section B: National and District Profiles
318
Section B: Profile Eastern Cape Province
Broad cause groups by age and gender
In the under-5-year age group, communicable diseases together with maternal, perinatal and nutritional conditions accounted for about 68% of deaths. HIV and TB accounted for about 12% of deaths, and injuries for around 9%.
In the 5–14-year age group, there were bigger differences in the proportions of broad causes between males and females, with injuries accounting for 22.2% of deaths among females and 31.4% of deaths among males. HIV and TB accounted for 24% of deaths in this age group.
In the 15–24-year age group, injury accounted for 61.4% of deaths among males compared with only 14.3% of deaths among females, while HIV and TB accounted for 45.2% of deaths among females compared with 12.6% among males. Non-communicable diseases accounted for around16% of deaths in this age group.
In the 25–64-year age group, HIV and TB accounted for the largest proportion of deaths (44.0% among males and 48.6% among females). Deaths due to non-communicable diseases increased to 28.6% among females and 27.5% among males. Injuries accounted for a small proportion of deaths in this age group, with the percentage being much higher among males (14.6%) than females (4.2%).
In the 65-years-and-older age group, non-communicable diseases accounted for the highest proportion of deaths (72.2% among females and 65.7% among males). Communicable diseases together with maternal, perinatal and nutritional conditions accounted for around 13% of deaths. HIV and TB deaths were higher among males than females.
Trends in broad cause groups by age
In children under 5 years, there was a marked decline in deaths due to communicable diseases together with maternal, perinatal and nutritional conditions (from 72.4% to 64.1%), and an increase in injury-related deaths. In the 5–14-year age group, there was a slight increase in deaths due to HIV and TB and non-communicable diseases, and a slight decline in deaths due to communicable diseases together with maternal, perinatal and nutritional conditions and injuries. In the 15–24-year age group, deaths due to HIV and TB and communicable diseases together with maternal, perinatal and nutritional conditions decreased slightly, while injury-related deaths increased (from 34.5% to 40.4%). In the 25–64-year age group, a decrease was observed in deaths due to communicable diseases together with maternal, perinatal and nutritional conditions, and an increase was observed in HIV and TB mortality (from 44.9% to 47.4%). In the 65-years-and-older age group there was not much change in the broad cause groups over the period.
Trends in leading causes of death by age
Under 5 years
Diarrhoeal diseases, lower respiratory infections, protein-energy malnutrition, HIV and AIDS, TB, prematurity, septicaemia and meningitis remained the leading causes of death between 2008–2010 and 2011–2013. Birth asphyxia did not appear among the leading causes. Mortality in this age group was still largely HIV-related.
5–14 years
Tuberculosis, HIV and AIDS, drowning, diarrhoeal disease and road injuries remained the leading causes of death in this age group. Meningitis moved down in the ranking, while drowning moved up. Meningitis, accidental threats to breathing and epilepsy were among the leading causes.
15–24 years
HIV and AIDS, interpersonal violence, TB, accidental threats to breathing and road injuries remained the leading causes of death in this age group, followed by mechanical forces, lower respiratory infection, meningitis, diarrhoea and drowning.
25–64 years
HIV and AIDS, TB, and lower respiratory infection remained the leading causes of death over this period, accounting for almost 50% of deaths in this age group. Cerebrovascular disease, diarrhoea, road injuries, diabetes mellitus, nephritis /nephrosis and interpersonal violence also appeared in the top 10 causes of death.
65 years and older
Cerebrovascular disease, TB, hypertensive heart disease, lower respiratory infections, diabetes mellitus and chronic obstructive pulmonary disease remained the top leading causes. Oesophageal cancer, cardiomyopathy, diarrhoea and asthma were the remaining leading causes.
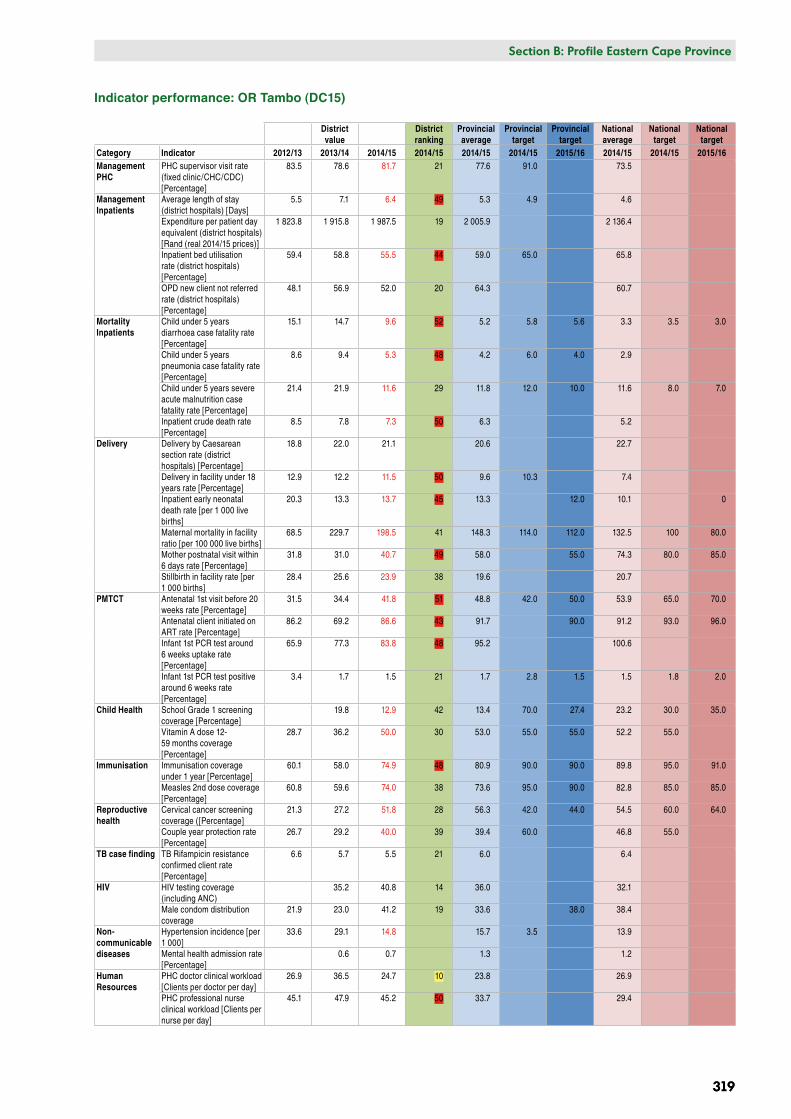
Section B: National and District Profiles
319
Section B: Profile Eastern Cape Province
319
Indicator performance: OR Tambo (DC15)
District value
District ranking
Provincial average
Provincial target
Provincial target
National average
National target
National target
Category Indicator 2012/13 2013/14 2014/15 2014/15 2014/15 2014/15 2015/16 2014/15 2014/15 2015/16Management PHC
PHC supervisor visit rate (fixed clinic/CHC/CDC) [Percentage]
83.5 78.6 81.7 21 77.6 91.0 73.5
Management Inpatients
Average length of stay (district hospitals) [Days]
5.5 7.1 6.4 49 5.3 4.9 4.6
Expenditure per patient day equivalent (district hospitals) [Rand (real 2014/15 prices)]
1 823.8 1 915.8 1 987.5 19 2 005.9 2 136.4
Inpatient bed utilisation rate (district hospitals) [Percentage]
59.4 58.8 55.5 44 59.0 65.0 65.8
OPD new client not referred rate (district hospitals) [Percentage]
48.1 56.9 52.0 20 64.3 60.7
Mortality Inpatients
Child under 5 years diarrhoea case fatality rate [Percentage]
15.1 14.7 9.6 52 5.2 5.8 5.6 3.3 3.5 3.0
Child under 5 years pneumonia case fatality rate [Percentage]
8.6 9.4 5.3 48 4.2 6.0 4.0 2.9
Child under 5 years severe acute malnutrition case fatality rate [Percentage]
21.4 21.9 11.6 29 11.8 12.0 10.0 11.6 8.0 7.0
Inpatient crude death rate [Percentage]
8.5 7.8 7.3 50 6.3 5.2
Delivery Delivery by Caesarean section rate (district hospitals) [Percentage]
18.8 22.0 21.1 20.6 22.7
Delivery in facility under 18 years rate [Percentage]
12.9 12.2 11.5 50 9.6 10.3 7.4
Inpatient early neonatal death rate [per 1 000 live births]
20.3 13.3 13.7 45 13.3 12.0 10.1 0
Maternal mortality in facility ratio [per 100 000 live births]
68.5 229.7 198.5 41 148.3 114.0 112.0 132.5 100 80.0
Mother postnatal visit within 6 days rate [Percentage]
31.8 31.0 40.7 49 58.0 55.0 74.3 80.0 85.0
Stillbirth in facility rate [per 1 000 births]
28.4 25.6 23.9 38 19.6 20.7
PMTCT Antenatal 1st visit before 20 weeks rate [Percentage]
31.5 34.4 41.8 51 48.8 42.0 50.0 53.9 65.0 70.0
Antenatal client initiated on ART rate [Percentage]
86.2 69.2 86.6 43 91.7 90.0 91.2 93.0 96.0
Infant 1st PCR test around 6 weeks uptake rate [Percentage]
65.9 77.3 83.8 48 95.2 100.6
Infant 1st PCR test positive around 6 weeks rate [Percentage]
3.4 1.7 1.5 21 1.7 2.8 1.5 1.5 1.8 2.0
Child Health School Grade 1 screening coverage [Percentage]
19.8 12.9 42 13.4 70.0 27.4 23.2 30.0 35.0
Vitamin A dose 12-59 months coverage [Percentage]
28.7 36.2 50.0 30 53.0 55.0 55.0 52.2 55.0
Immunisation Immunisation coverage under 1 year [Percentage]
60.1 58.0 74.9 48 80.9 90.0 90.0 89.8 95.0 91.0
Measles 2nd dose coverage [Percentage]
60.8 59.6 74.0 38 73.6 95.0 90.0 82.8 85.0 85.0
Reproductive health
Cervical cancer screening coverage ([Percentage]
21.3 27.2 51.8 28 56.3 42.0 44.0 54.5 60.0 64.0
Couple year protection rate [Percentage]
26.7 29.2 40.0 39 39.4 60.0 46.8 55.0
TB case finding TB Rifampicin resistance confirmed client rate [Percentage]
6.6 5.7 5.5 21 6.0 6.4
HIV HIV testing coverage (including ANC)
35.2 40.8 14 36.0 32.1
Male condom distribution coverage
21.9 23.0 41.2 19 33.6 38.0 38.4
Non-communicable diseases
Hypertension incidence [per 1 000]
33.6 29.1 14.8 15.7 3.5 13.9
Mental health admission rate [Percentage]
0.6 0.7 1.3 1.2
Human Resources
PHC doctor clinical workload [Clients per doctor per day]
26.9 36.5 24.7 10 23.8 26.9
PHC professional nurse clinical workload [Clients per nurse per day]
45.1 47.9 45.2 50 33.7 29.4
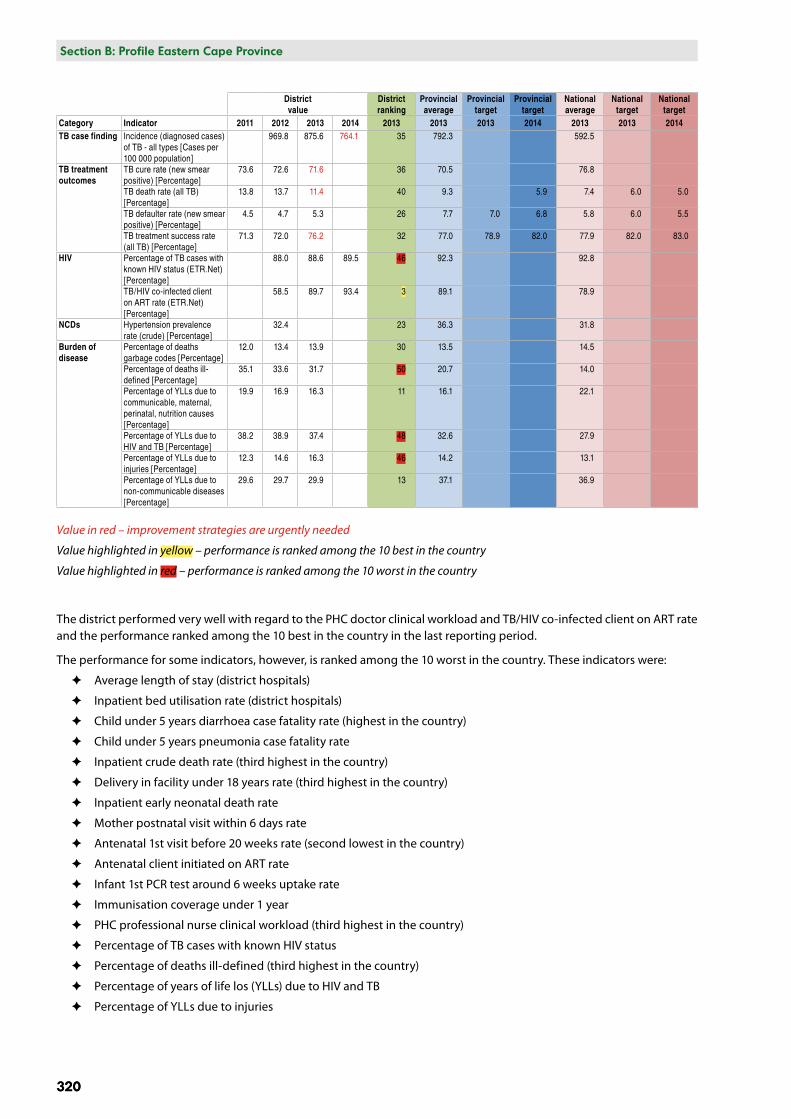
320
Section B: National and District Profiles
320
Section B: Profile Eastern Cape Province
District value
District ranking
Provincial average
Provincial target
Provincial target
National average
National target
National target
Category Indicator 2011 2012 2013 2014 2013 2013 2013 2014 2013 2013 2014TB case finding Incidence (diagnosed cases)
of TB - all types [Cases per 100 000 population]
969.8 875.6 764.1 35 792.3 592.5
TB treatment outcomes
TB cure rate (new smear positive) [Percentage]
73.6 72.6 71.6 36 70.5 76.8
TB death rate (all TB) [Percentage]
13.8 13.7 11.4 40 9.3 5.9 7.4 6.0 5.0
TB defaulter rate (new smear positive) [Percentage]
4.5 4.7 5.3 26 7.7 7.0 6.8 5.8 6.0 5.5
TB treatment success rate (all TB) [Percentage]
71.3 72.0 76.2 32 77.0 78.9 82.0 77.9 82.0 83.0
HIV Percentage of TB cases with known HIV status (ETR.Net) [Percentage]
88.0 88.6 89.5 46 92.3 92.8
TB/HIV co-infected client on ART rate (ETR.Net) [Percentage]
58.5 89.7 93.4 3 89.1 78.9
NCDs Hypertension prevalence rate (crude) [Percentage]
32.4 23 36.3 31.8
Burden of disease
Percentage of deaths garbage codes [Percentage]
12.0 13.4 13.9 30 13.5 14.5
Percentage of deaths ill-defined [Percentage]
35.1 33.6 31.7 50 20.7 14.0
Percentage of YLLs due to communicable, maternal, perinatal, nutrition causes [Percentage]
19.9 16.9 16.3 11 16.1 22.1
Percentage of YLLs due to HIV and TB [Percentage]
38.2 38.9 37.4 48 32.6 27.9
Percentage of YLLs due to injuries [Percentage]
12.3 14.6 16.3 46 14.2 13.1
Percentage of YLLs due to non-communicable diseases [Percentage]
29.6 29.7 29.9 13 37.1 36.9
Value in red – improvement strategies are urgently needed
Value highlighted in yellow – performance is ranked among the 10 best in the country
Value highlighted in red – performance is ranked among the 10 worst in the country
The district performed very well with regard to the PHC doctor clinical workload and TB/HIV co-infected client on ART rate and the performance ranked among the 10 best in the country in the last reporting period.
The performance for some indicators, however, is ranked among the 10 worst in the country. These indicators were:
✦ Average length of stay (district hospitals)
✦ Inpatient bed utilisation rate (district hospitals)
✦ Child under 5 years diarrhoea case fatality rate (highest in the country)
✦ Child under 5 years pneumonia case fatality rate
✦ Inpatient crude death rate (third highest in the country)
✦ Delivery in facility under 18 years rate (third highest in the country)
✦ Inpatient early neonatal death rate
✦ Mother postnatal visit within 6 days rate
✦ Antenatal 1st visit before 20 weeks rate (second lowest in the country)
✦ Antenatal client initiated on ART rate
✦ Infant 1st PCR test around 6 weeks uptake rate
✦ Immunisation coverage under 1 year
✦ PHC professional nurse clinical workload (third highest in the country)
✦ Percentage of TB cases with known HIV status
✦ Percentage of deaths ill-defined (third highest in the country)
✦ Percentage of years of life los (YLLs) due to HIV and TB
✦ Percentage of YLLs due to injuries
Section B: National and District Profiles
321
Section B: Profile Eastern Cape Province
321
Although the district recorded an improvement in the performance of several indicators over the past three years, improvement strategies are needed urgently for the following indicators, especially when compared with the district ranking, 2014/15 provincial and national averages, and the 2014/15 and 2015/16 provincial and national targets. These indicators are:
✦ PHC supervisor visit rate (fixed clinic/CHC/CDC)
✦ Average length of stay (district hospitals)
✦ Inpatient bed utilisation rate (district hospitals)
✦ Child under 5 years diarrhoea, pneumonia and severe acute malnutrition case fatality rate
✦ Inpatient crude death rate
✦ Delivery in facility under 18 years rate
✦ Inpatient early neonatal death rate
✦ Maternal mortality in facility ratio
✦ Mother postnatal visit within 6 days rate
✦ Stillbirth in facility rate
✦ Antenatal 1st visit before 20 weeks rate
✦ Antenatal client initiated on ART rate
✦ Infant 1st PCR test around 6 weeks uptake rate
✦ School Grade 1 screening coverage
✦ Vitamin A dose 12–59 months coverage
✦ Immunisation coverage under 1 year
✦ Measles 2nd dose coverage
✦ Cervical cancer screening coverage
✦ Couple year protection rate
✦ Hypertension incidence
✦ PHC professional nurse clinical workload
✦ Incidence (diagnosed cases) of TB (all types)
✦ TB cure rate (new smear positive)
✦ TB death rate (all TB)
✦ TB treatment success rate (all TB)
✦ Percentage of TB cases with known HIV status
✦ Percentage of deaths ill-defined
✦ Percentage of YLLs due to HIV and TB
✦ Percentage of YLLs due to injuries
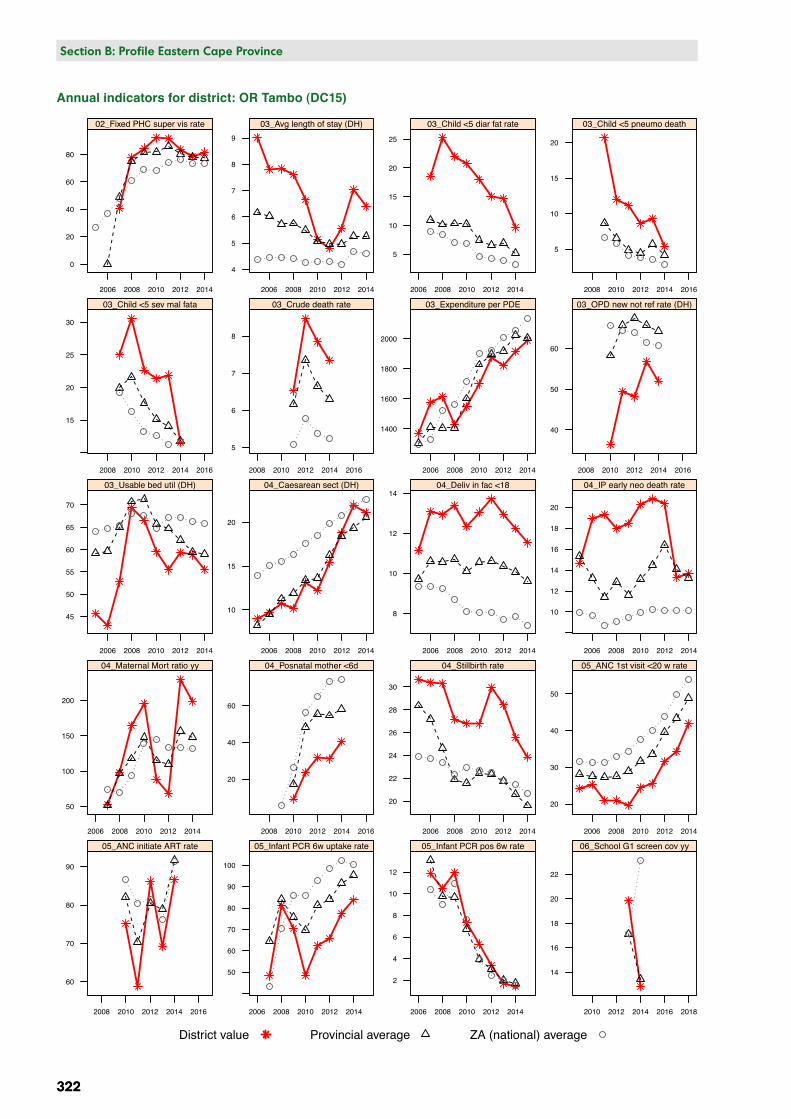
Annual indicators for district: OR Tambo: DC15
Valu
e
0
20
40
60
80
2006 2008 2010 2012 2014
02_Fixed PHC super vis rate
4
5
6
7
8
9
2006 2008 2010 2012 2014
03_Avg length of stay (DH)
5
10
15
20
25
2006 2008 2010 2012 2014
03_Child <5 diar fat rate
5
10
15
20
2008 2010 2012 2014 2016
03_Child <5 pneumo death
15
20
25
30
2008 2010 2012 2014 2016
03_Child <5 sev mal fata
5
6
7
8
2008 2010 2012 2014 2016
03_Crude death rate
1400
1600
1800
2000
2006 2008 2010 2012 2014
03_Expenditure per PDE
40
50
60
2008 2010 2012 2014 2016
03_OPD new not ref rate (DH)
45
50
55
60
65
70
2006 2008 2010 2012 2014
03_Usable bed util (DH)
10
15
20
2006 2008 2010 2012 2014
04_Caesarean sect (DH)
8
10
12
14
2006 2008 2010 2012 2014
04_Deliv in fac <18
10
12
14
16
18
20
2006 2008 2010 2012 2014
04_IP early neo death rate
50
100
150
200
2006 2008 2010 2012 2014
04_Maternal Mort ratio yy
20
40
60
2008 2010 2012 2014 2016
04_Posnatal mother <6d
20
22
24
26
28
30
2006 2008 2010 2012 2014
04_Stillbirth rate
20
30
40
50
2006 2008 2010 2012 2014
05_ANC 1st visit <20 w rate
60
70
80
90
2008 2010 2012 2014 2016
05_ANC initiate ART rate
50
60
70
80
90
100
2006 2008 2010 2012 2014
05_Infant PCR 6w uptake rate
2
4
6
8
10
12
2006 2008 2010 2012 2014
05_Infant PCR pos 6w rate
14
16
18
20
22
2010 2012 2014 2016 2018
06_School G1 screen cov yy
District value Provincial average ZA (national) average
322
Section B: National and District Profiles
322
Section B: Profile Eastern Cape Province
Annual indicators for district: OR Tambo (DC15)
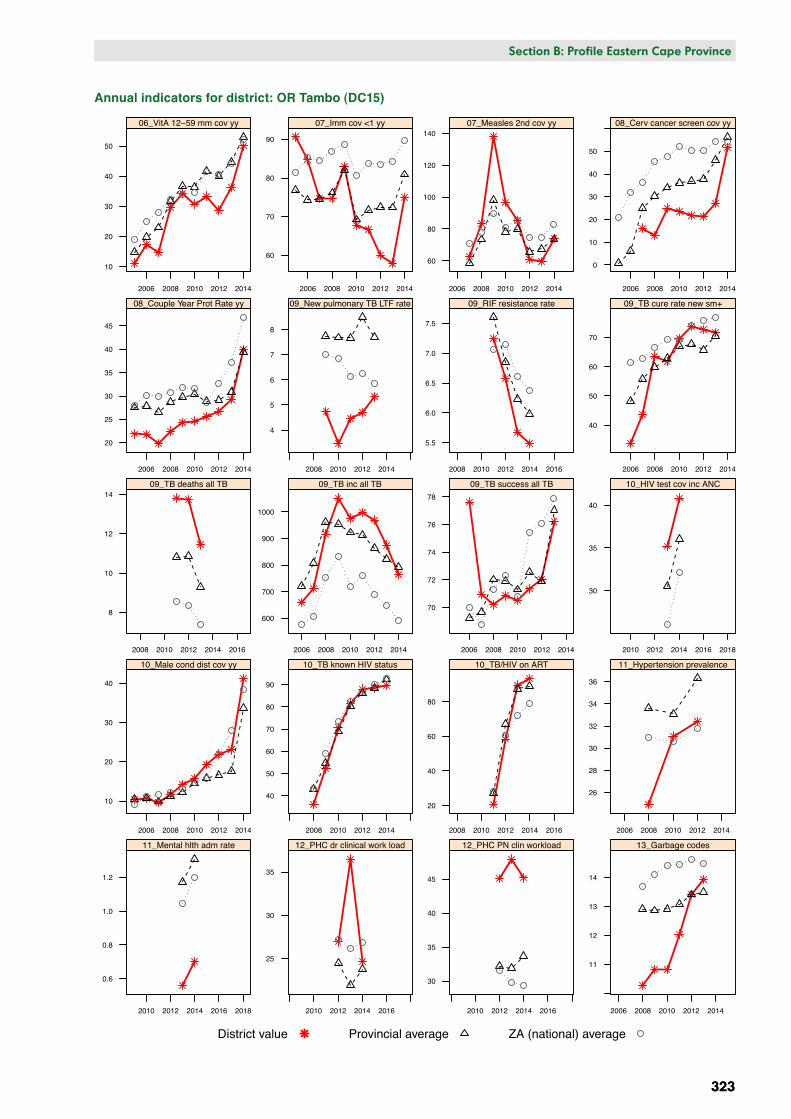
Annual indicators for district: OR Tambo: DC15Va
lue
10
20
30
40
50
2006 2008 2010 2012 2014
06_VitA 12−59 mm cov yy
60
70
80
90
2006 2008 2010 2012 2014
07_Imm cov <1 yy
60
80
100
120
140
2006 2008 2010 2012 2014
07_Measles 2nd cov yy
0
10
20
30
40
50
2006 2008 2010 2012 2014
08_Cerv cancer screen cov yy
20
25
30
35
40
45
2006 2008 2010 2012 2014
08_Couple Year Prot Rate yy
4
5
6
7
8
2008 2010 2012 2014
09_New pulmonary TB LTF rate
5.5
6.0
6.5
7.0
7.5
2008 2010 2012 2014 2016
09_RIF resistance rate
40
50
60
70
2006 2008 2010 2012 2014
09_TB cure rate new sm+
8
10
12
14
2008 2010 2012 2014 2016
09_TB deaths all TB
600
700
800
900
1000
2006 2008 2010 2012 2014
09_TB inc all TB
70
72
74
76
78
2006 2008 2010 2012 2014
09_TB success all TB
30
35
40
2010 2012 2014 2016 2018
10_HIV test cov inc ANC
10
20
30
40
2006 2008 2010 2012 2014
10_Male cond dist cov yy
40
50
60
70
80
90
2008 2010 2012 2014
10_TB known HIV status
20
40
60
80
2008 2010 2012 2014 2016
10_TB/HIV on ART
26
28
30
32
34
36
2006 2008 2010 2012 2014
11_Hypertension prevalence
0.6
0.8
1.0
1.2
2010 2012 2014 2016 2018
11_Mental hlth adm rate
25
30
35
2010 2012 2014 2016
12_PHC dr clinical work load
30
35
40
45
2010 2012 2014 2016
12_PHC PN clin workload
11
12
13
14
2006 2008 2010 2012 2014
13_Garbage codes
District value Provincial average ZA (national) average
Section B: National and District Profiles
323
Section B: Profile Eastern Cape Province
323
Annual indicators for district: OR Tambo (DC15)
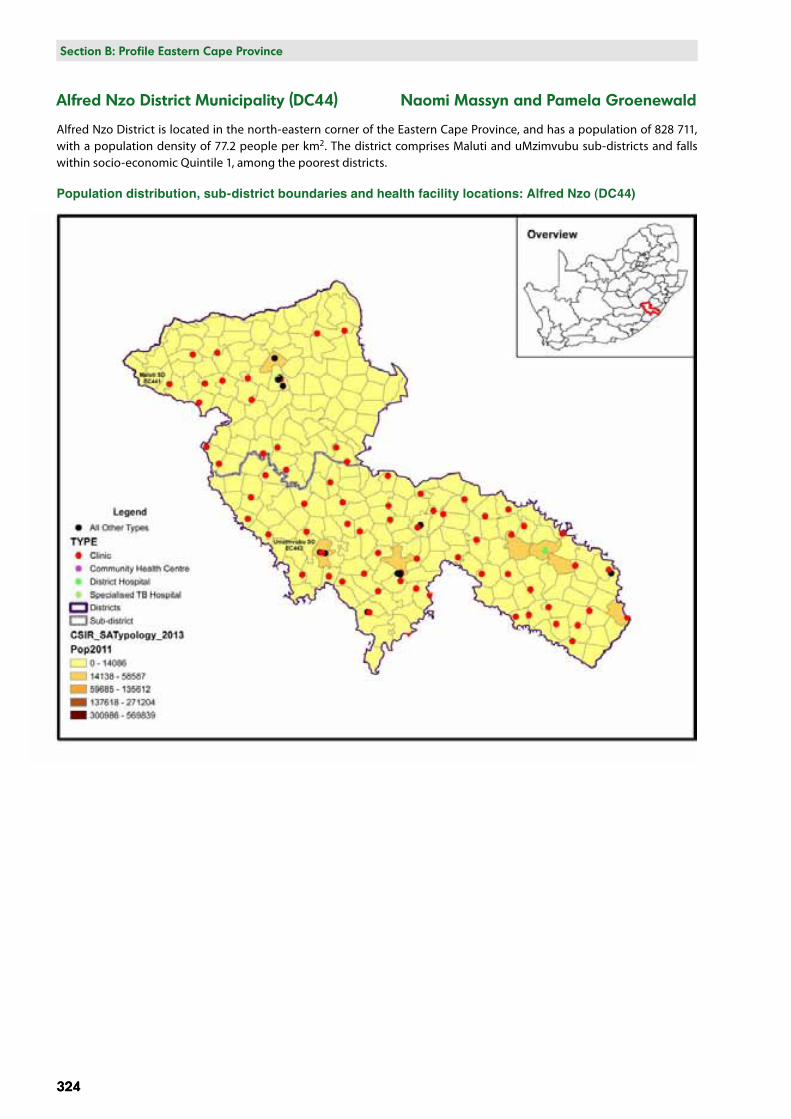
324
Section B: National and District Profiles
324
Section B: Profile Eastern Cape Province
Alfred Nzo District Municipality (DC44) Naomi Massyn and Pamela Groenewald
Alfred Nzo District is located in the north-eastern corner of the Eastern Cape Province, and has a population of 828 711, with a population density of 77.2 people per km2. The district comprises Maluti and uMzimvubu sub-districts and falls within socio-economic Quintile 1, among the poorest districts.
Population distribution, sub-district boundaries and health facility locations: Alfred Nzo (DC44)
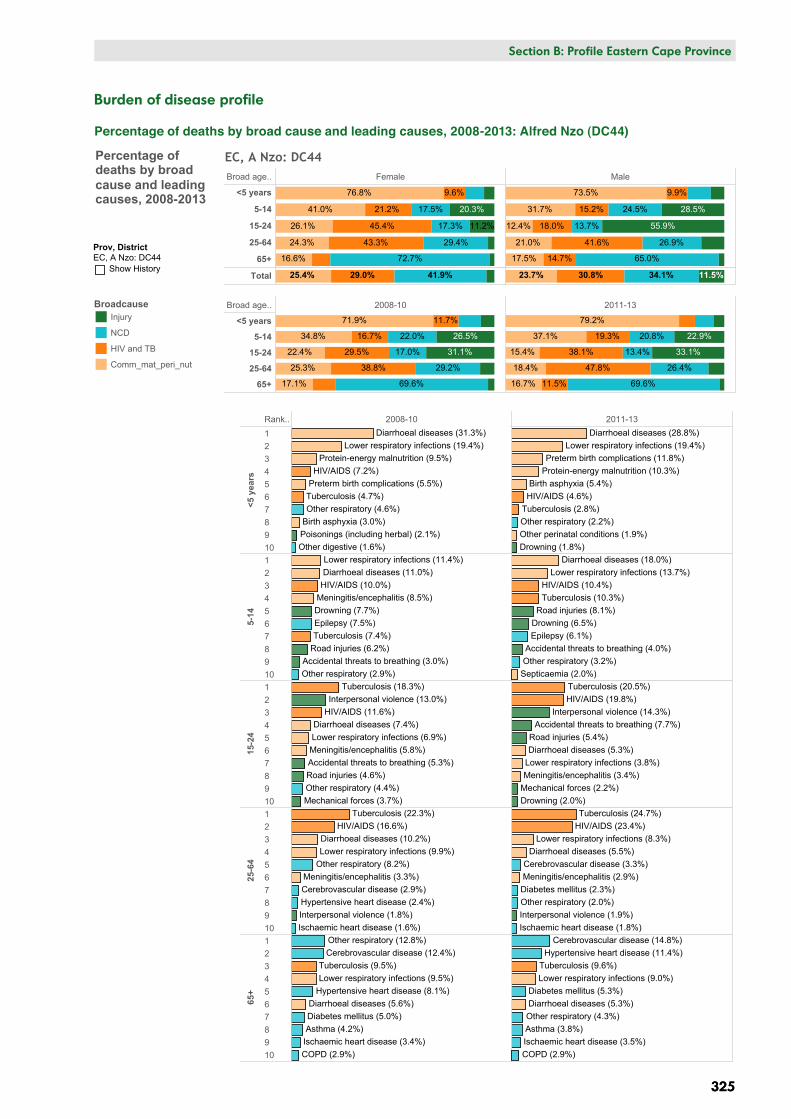
Broad age.. Female Male
<5 years
5-14
15-24
25-64
65+
Total 41.9%29.0%25.4%
20.3%
11.2%
17.5%
17.3%
29.4%
72.7%
21.2%
45.4%
43.3%
76.8%
41.0%
26.1%
24.3%
16.6%
9.6%
11.5%34.1%30.8%23.7%
28.5%
55.9%
24.5%
13.7%
26.9%
65.0%
15.2%
18.0%
41.6%
14.7%
73.5%
31.7%
12.4%
21.0%
17.5%
9.9%
EC, A Nzo: DC44
Broad age.. 2008-10 2011-13
<5 years
5-14
15-24
25-64
65+
26.5%
31.1%
22.0%
17.0%
29.2%
69.6%
11.7%
16.7%
29.5%
38.8%
71.9%
34.8%
22.4%
25.3%
17.1%
22.9%
33.1%
20.8%
13.4%
26.4%
69.6%
19.3%
38.1%
47.8%
11.5%
79.2%
37.1%
15.4%
18.4%
16.7%
Rank.. 2008-10 2011-13
<5 y
ears
12345678910
5-14
12345678910
15-2
4
12345678910
25-6
4
12345678910
65+
12345678910
Poisonings (including herbal) (2.1%)
Protein-energy malnutrition (9.5%)
Birth asphyxia (3.0%)
Other digestive (1.6%)
Other respiratory (4.6%)
Preterm birth complications (5.5%)
Diarrhoeal diseases (31.3%)Lower respiratory infections (19.4%)
HIV/AIDS (7.2%)
Tuberculosis (4.7%)
Other perinatal conditions (1.9%)Drowning (1.8%)
Protein-energy malnutrition (10.3%)Birth asphyxia (5.4%)
Other respiratory (2.2%)
Preterm birth complications (11.8%)
Diarrhoeal diseases (28.8%)Lower respiratory infections (19.4%)
HIV/AIDS (4.6%)Tuberculosis (2.8%)
Drowning (7.7%)Epilepsy (7.5%)
Other respiratory (2.9%)Accidental threats to breathing (3.0%)
Meningitis/encephalitis (8.5%)
Road injuries (6.2%)
Diarrhoeal diseases (11.0%)Lower respiratory infections (11.4%)
HIV/AIDS (10.0%)
Tuberculosis (7.4%)Drowning (6.5%)Epilepsy (6.1%)
Other respiratory (3.2%)Septicaemia (2.0%)
Accidental threats to breathing (4.0%)
Road injuries (8.1%)
Diarrhoeal diseases (18.0%)Lower respiratory infections (13.7%)
HIV/AIDS (10.4%)Tuberculosis (10.3%)
Other respiratory (4.4%)
Interpersonal violence (13.0%)
Mechanical forces (3.7%)
Accidental threats to breathing (5.3%)Meningitis/encephalitis (5.8%)
Road injuries (4.6%)
Diarrhoeal diseases (7.4%)Lower respiratory infections (6.9%)
HIV/AIDS (11.6%)
Tuberculosis (18.3%)
Drowning (2.0%)
Interpersonal violence (14.3%)
Mechanical forces (2.2%)
Accidental threats to breathing (7.7%)
Meningitis/encephalitis (3.4%)
Road injuries (5.4%)Diarrhoeal diseases (5.3%)
Lower respiratory infections (3.8%)
HIV/AIDS (19.8%)Tuberculosis (20.5%)
Other respiratory (8.2%)
Interpersonal violence (1.8%)
Meningitis/encephalitis (3.3%)
Hypertensive heart disease (2.4%)
Ischaemic heart disease (1.6%)
Diarrhoeal diseases (10.2%)
Cerebrovascular disease (2.9%)
Lower respiratory infections (9.9%)
HIV/AIDS (16.6%)Tuberculosis (22.3%)
Other respiratory (2.0%)Interpersonal violence (1.9%)
Meningitis/encephalitis (2.9%)Diabetes mellitus (2.3%)
Ischaemic heart disease (1.8%)
Diarrhoeal diseases (5.5%)Cerebrovascular disease (3.3%)
Lower respiratory infections (8.3%)HIV/AIDS (23.4%)Tuberculosis (24.7%)
Other respiratory (12.8%)
Asthma (4.2%)
COPD (2.9%)
Diabetes mellitus (5.0%)
Hypertensive heart disease (8.1%)
Ischaemic heart disease (3.4%)
Diarrhoeal diseases (5.6%)
Cerebrovascular disease (12.4%)
Lower respiratory infections (9.5%)Tuberculosis (9.5%)
Other respiratory (4.3%)Asthma (3.8%)
COPD (2.9%)
Diabetes mellitus (5.3%)
Hypertensive heart disease (11.4%)
Ischaemic heart disease (3.5%)
Diarrhoeal diseases (5.3%)
Cerebrovascular disease (14.8%)
Lower respiratory infections (9.0%)Tuberculosis (9.6%)
Prov, DistrictEC, A Nzo: DC44
Show History
BroadcauseInjury
NCD
HIV and TB
Comm_mat_peri_nut
Percentage ofdeaths by broadcause and leadingcauses, 2008-2013
Section B: National and District Profiles
325
Section B: Profile Eastern Cape Province
325
Burden of disease profile
Percentage of deaths by broad cause and leading causes, 2008-2013: Alfred Nzo (DC44)
326
Section B: National and District Profiles
326
Section B: Profile Eastern Cape Province
Broad cause groups by age and gender
In the under-5-year age group, communicable diseases together with maternal, perinatal and nutritional conditions accounted for 76.8% of deaths among females and 73.5% among males. HIV and TB and non-communicable diseases accounted for about 10% each, and injuries for around 5%.
In the 5–14-year age group there were bigger differences in the proportions of broad causes between females and males. Communicable diseases together with maternal, perinatal and nutritional conditions accounted for 41.0% of deaths among females versus 31.7% among males; HIV and TB accounted for 21.2% of deaths among females versus 15.2% among males; non-communicable diseases accounted for 17.5% (female) versus 24.5% (male); and injuries accounted for 20.3% (female) versus 28.5% (male).
In the 15–24-year age group, injury accounted for 55.9% of deaths among males compared with only 11.2% among females, while HIV and TB accounted for 45.4% of deaths among females compared with only 18.0% among males.
In the 25–64-year age group, HIV and TB accounted for the largest proportion of deaths (43.4% among females and 41.6% among males). Deaths due to non-communicable diseases increased to 29.4% among females and 26.9% among males. Injuries accounted for a small proportion of deaths in this age group, with the percentage being much higher among males (10.5%) than females (3.0%).
In the 65-years-and-older age group, non-communicable diseases accounted for the highest proportion of deaths (72.7% among females and 65.0% among males). Communicable diseases together with maternal, perinatal and nutritional conditions accounted for around 17% of deaths. This was the only age group where deaths due to HIV and TB were higher among males (14.7%) than females.
Trends in broad cause groups by age
In children under 5 years, deaths due to communicable diseases and maternal, perinatal and nutritional conditions increased from 71.9% to 79.2% between 2008–2010 and 2011–2013 (in contrast to the rest of the province), while the proportion of deaths due to the other broad causes all decreased. In the 5–14-year age group, deaths due to HIV and TB and communicable diseases together with maternal, perinatal and nutritional conditions increased, while injury-related deaths and non-communicable disease mortality declined over this period. In the 15–24-year age group, injury-related deaths and HIV and TB mortality increased. In the 25–64-year age group, the percentage of deaths due to HIV and TB increased from 38.8% to 47.8%, while deaths due to communicable diseases and maternal, perinatal and nutritional conditions declined from 25.3% to 18.4%. This could have been due to more accurate reporting of HIV on death certificates. Non-communicable disease mortality remained more or less at the same level, while injury-related deaths increased slightly over the period. In the 65-years-and-older age group there was not much change in the broad cause groups over the period.
Trends in leading causes of death by age
Under 5 years
Diarrhoeal diseases and lower respiratory infections remained the leading causes of death between 2008–2010 and 2011–2013. Despite prematurity and birth asphyxia moving up in the rankings, and protein-energy malnutrition, HIV and AIDS and TB moving down slightly, mortality in this age group was still largely HIV-related.
5–14 years
Diarrhoea, lower respiratory infections and HIV remained the leading causes of death, with TB replacing meningitis as the fourth leading cause. Road injuries, drowning, epilepsy and accidental threats to breathing (probably cases of interpersonal violence) also ranked among the top 10 causes of death.
15–24 years
Tuberculosis, HIV and interpersonal violence remained the three leading causes of death in this age group, followed by road injuries, diarrhoea, lower respiratory infections, meningitis, and drowning.
25–64 years
Tuberculosis, HIV, lower respiratory infection and diarrhoea remained the leading causes of death, accounting for more than 50% of deaths in this age group. Cerebrovascular disease, diabetes mellitus, interpersonal violence and ischaemic heart disease appeared in the top 10 causes of death.
65 years and older
Cerebrovascular disease, TB and lower respiratory infections remained among the leading causes of death, with hypertensive heart disease and diabetes mellitus moving up in the ranking over this period. Diarrhoea, asthma, ischaemic heart disease and chronic obstructive pulmonary disease remained in the top 10 causes of death in this age group.
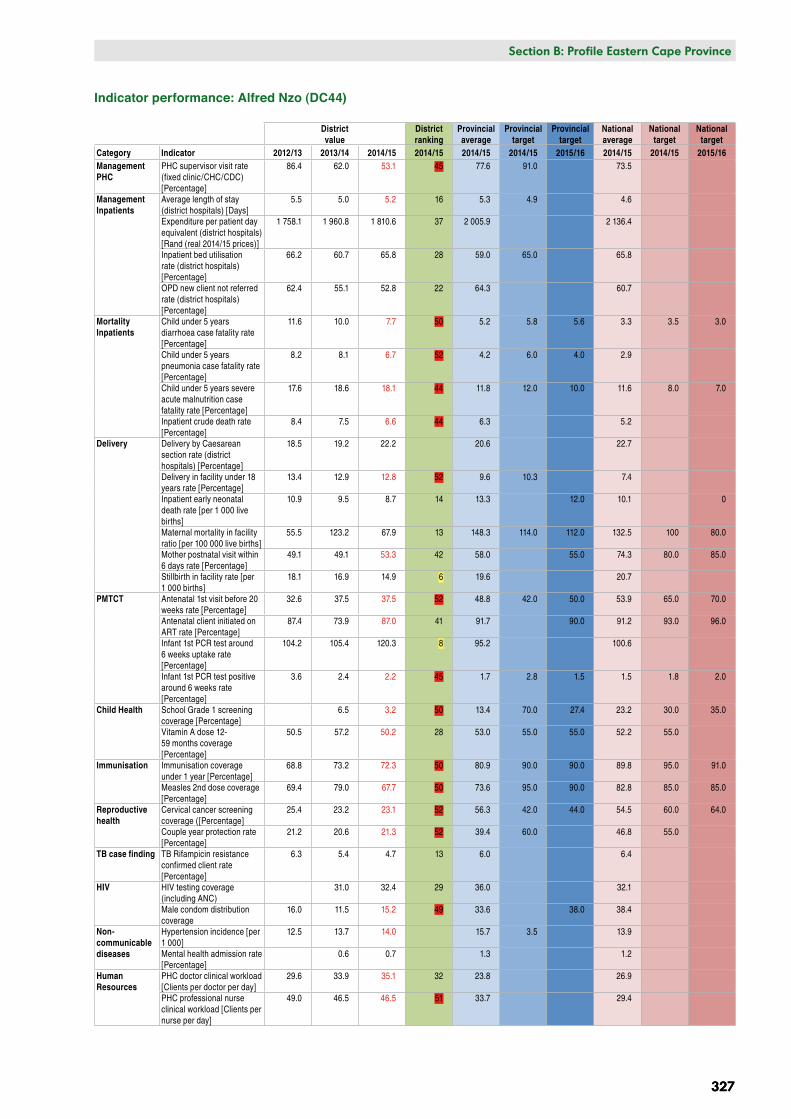
Section B: National and District Profiles
327
Section B: Profile Eastern Cape Province
327
Indicator performance: Alfred Nzo (DC44)
District value
District ranking
Provincial average
Provincial target
Provincial target
National average
National target
National target
Category Indicator 2012/13 2013/14 2014/15 2014/15 2014/15 2014/15 2015/16 2014/15 2014/15 2015/16Management PHC
PHC supervisor visit rate (fixed clinic/CHC/CDC) [Percentage]
86.4 62.0 53.1 45 77.6 91.0 73.5
Management Inpatients
Average length of stay (district hospitals) [Days]
5.5 5.0 5.2 16 5.3 4.9 4.6
Expenditure per patient day equivalent (district hospitals) [Rand (real 2014/15 prices)]
1 758.1 1 960.8 1 810.6 37 2 005.9 2 136.4
Inpatient bed utilisation rate (district hospitals) [Percentage]
66.2 60.7 65.8 28 59.0 65.0 65.8
OPD new client not referred rate (district hospitals) [Percentage]
62.4 55.1 52.8 22 64.3 60.7
Mortality Inpatients
Child under 5 years diarrhoea case fatality rate [Percentage]
11.6 10.0 7.7 50 5.2 5.8 5.6 3.3 3.5 3.0
Child under 5 years pneumonia case fatality rate [Percentage]
8.2 8.1 6.7 52 4.2 6.0 4.0 2.9
Child under 5 years severe acute malnutrition case fatality rate [Percentage]
17.6 18.6 18.1 44 11.8 12.0 10.0 11.6 8.0 7.0
Inpatient crude death rate [Percentage]
8.4 7.5 6.6 44 6.3 5.2
Delivery Delivery by Caesarean section rate (district hospitals) [Percentage]
18.5 19.2 22.2 20.6 22.7
Delivery in facility under 18 years rate [Percentage]
13.4 12.9 12.8 52 9.6 10.3 7.4
Inpatient early neonatal death rate [per 1 000 live births]
10.9 9.5 8.7 14 13.3 12.0 10.1 0
Maternal mortality in facility ratio [per 100 000 live births]
55.5 123.2 67.9 13 148.3 114.0 112.0 132.5 100 80.0
Mother postnatal visit within 6 days rate [Percentage]
49.1 49.1 53.3 42 58.0 55.0 74.3 80.0 85.0
Stillbirth in facility rate [per 1 000 births]
18.1 16.9 14.9 6 19.6 20.7
PMTCT Antenatal 1st visit before 20 weeks rate [Percentage]
32.6 37.5 37.5 52 48.8 42.0 50.0 53.9 65.0 70.0
Antenatal client initiated on ART rate [Percentage]
87.4 73.9 87.0 41 91.7 90.0 91.2 93.0 96.0
Infant 1st PCR test around 6 weeks uptake rate [Percentage]
104.2 105.4 120.3 8 95.2 100.6
Infant 1st PCR test positive around 6 weeks rate [Percentage]
3.6 2.4 2.2 45 1.7 2.8 1.5 1.5 1.8 2.0
Child Health School Grade 1 screening coverage [Percentage]
6.5 3.2 50 13.4 70.0 27.4 23.2 30.0 35.0
Vitamin A dose 12-59 months coverage [Percentage]
50.5 57.2 50.2 28 53.0 55.0 55.0 52.2 55.0
Immunisation Immunisation coverage under 1 year [Percentage]
68.8 73.2 72.3 50 80.9 90.0 90.0 89.8 95.0 91.0
Measles 2nd dose coverage [Percentage]
69.4 79.0 67.7 50 73.6 95.0 90.0 82.8 85.0 85.0
Reproductive health
Cervical cancer screening coverage ([Percentage]
25.4 23.2 23.1 52 56.3 42.0 44.0 54.5 60.0 64.0
Couple year protection rate [Percentage]
21.2 20.6 21.3 52 39.4 60.0 46.8 55.0
TB case finding TB Rifampicin resistance confirmed client rate [Percentage]
6.3 5.4 4.7 13 6.0 6.4
HIV HIV testing coverage (including ANC)
31.0 32.4 29 36.0 32.1
Male condom distribution coverage
16.0 11.5 15.2 49 33.6 38.0 38.4
Non-communicable diseases
Hypertension incidence [per 1 000]
12.5 13.7 14.0 15.7 3.5 13.9
Mental health admission rate [Percentage]
0.6 0.7 1.3 1.2
Human Resources
PHC doctor clinical workload [Clients per doctor per day]
29.6 33.9 35.1 32 23.8 26.9
PHC professional nurse clinical workload [Clients per nurse per day]
49.0 46.5 46.5 51 33.7 29.4
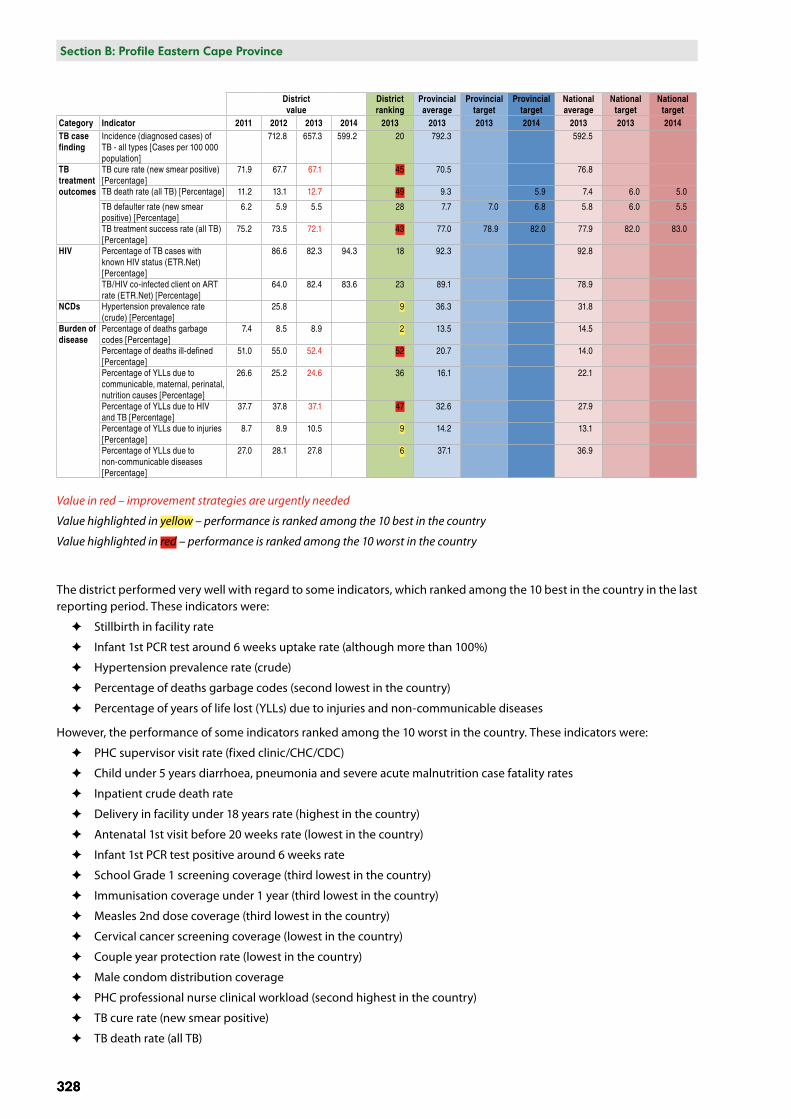
328
Section B: National and District Profiles
328
Section B: Profile Eastern Cape Province
District value
District ranking
Provincial average
Provincial target
Provincial target
National average
National target
National target
Category Indicator 2011 2012 2013 2014 2013 2013 2013 2014 2013 2013 2014TB case finding
Incidence (diagnosed cases) of TB - all types [Cases per 100 000 population]
712.8 657.3 599.2 20 792.3 592.5
TB treatment outcomes
TB cure rate (new smear positive) [Percentage]
71.9 67.7 67.1 45 70.5 76.8
TB death rate (all TB) [Percentage] 11.2 13.1 12.7 49 9.3 5.9 7.4 6.0 5.0
TB defaulter rate (new smear positive) [Percentage]
6.2 5.9 5.5 28 7.7 7.0 6.8 5.8 6.0 5.5
TB treatment success rate (all TB) [Percentage]
75.2 73.5 72.1 43 77.0 78.9 82.0 77.9 82.0 83.0
HIV Percentage of TB cases with known HIV status (ETR.Net) [Percentage]
86.6 82.3 94.3 18 92.3 92.8
TB/HIV co-infected client on ART rate (ETR.Net) [Percentage]
64.0 82.4 83.6 23 89.1 78.9
NCDs Hypertension prevalence rate (crude) [Percentage]
25.8 9 36.3 31.8
Burden of disease
Percentage of deaths garbage codes [Percentage]
7.4 8.5 8.9 2 13.5 14.5
Percentage of deaths ill-defined [Percentage]
51.0 55.0 52.4 52 20.7 14.0
Percentage of YLLs due to communicable, maternal, perinatal, nutrition causes [Percentage]
26.6 25.2 24.6 36 16.1 22.1
Percentage of YLLs due to HIV and TB [Percentage]
37.7 37.8 37.1 47 32.6 27.9
Percentage of YLLs due to injuries [Percentage]
8.7 8.9 10.5 9 14.2 13.1
Percentage of YLLs due to non-communicable diseases [Percentage]
27.0 28.1 27.8 6 37.1 36.9
Value in red – improvement strategies are urgently needed
Value highlighted in yellow – performance is ranked among the 10 best in the country
Value highlighted in red – performance is ranked among the 10 worst in the country
The district performed very well with regard to some indicators, which ranked among the 10 best in the country in the last reporting period. These indicators were:
✦ Stillbirth in facility rate
✦ Infant 1st PCR test around 6 weeks uptake rate (although more than 100%)
✦ Hypertension prevalence rate (crude)
✦ Percentage of deaths garbage codes (second lowest in the country)
✦ Percentage of years of life lost (YLLs) due to injuries and non-communicable diseases
However, the performance of some indicators ranked among the 10 worst in the country. These indicators were:
✦ PHC supervisor visit rate (fixed clinic/CHC/CDC)
✦ Child under 5 years diarrhoea, pneumonia and severe acute malnutrition case fatality rates
✦ Inpatient crude death rate
✦ Delivery in facility under 18 years rate (highest in the country)
✦ Antenatal 1st visit before 20 weeks rate (lowest in the country)
✦ Infant 1st PCR test positive around 6 weeks rate
✦ School Grade 1 screening coverage (third lowest in the country)
✦ Immunisation coverage under 1 year (third lowest in the country)
✦ Measles 2nd dose coverage (third lowest in the country)
✦ Cervical cancer screening coverage (lowest in the country)
✦ Couple year protection rate (lowest in the country)
✦ Male condom distribution coverage
✦ PHC professional nurse clinical workload (second highest in the country)
✦ TB cure rate (new smear positive)
✦ TB death rate (all TB)
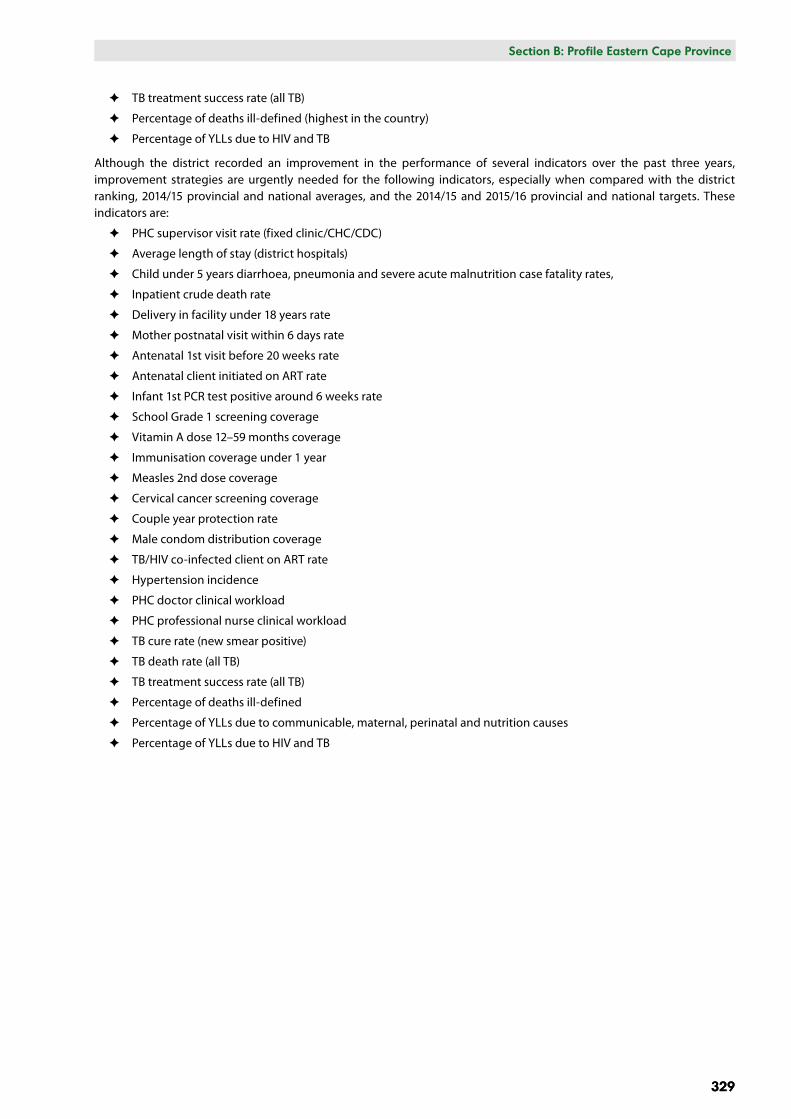
Section B: National and District Profiles
329
Section B: Profile Eastern Cape Province
329
✦ TB treatment success rate (all TB)
✦ Percentage of deaths ill-defined (highest in the country)
✦ Percentage of YLLs due to HIV and TB
Although the district recorded an improvement in the performance of several indicators over the past three years, improvement strategies are urgently needed for the following indicators, especially when compared with the district ranking, 2014/15 provincial and national averages, and the 2014/15 and 2015/16 provincial and national targets. These indicators are:
✦ PHC supervisor visit rate (fixed clinic/CHC/CDC)
✦ Average length of stay (district hospitals)
✦ Child under 5 years diarrhoea, pneumonia and severe acute malnutrition case fatality rates,
✦ Inpatient crude death rate
✦ Delivery in facility under 18 years rate
✦ Mother postnatal visit within 6 days rate
✦ Antenatal 1st visit before 20 weeks rate
✦ Antenatal client initiated on ART rate
✦ Infant 1st PCR test positive around 6 weeks rate
✦ School Grade 1 screening coverage
✦ Vitamin A dose 12–59 months coverage
✦ Immunisation coverage under 1 year
✦ Measles 2nd dose coverage
✦ Cervical cancer screening coverage
✦ Couple year protection rate
✦ Male condom distribution coverage
✦ TB/HIV co-infected client on ART rate
✦ Hypertension incidence
✦ PHC doctor clinical workload
✦ PHC professional nurse clinical workload
✦ TB cure rate (new smear positive)
✦ TB death rate (all TB)
✦ TB treatment success rate (all TB)
✦ Percentage of deaths ill-defined
✦ Percentage of YLLs due to communicable, maternal, perinatal and nutrition causes
✦ Percentage of YLLs due to HIV and TB
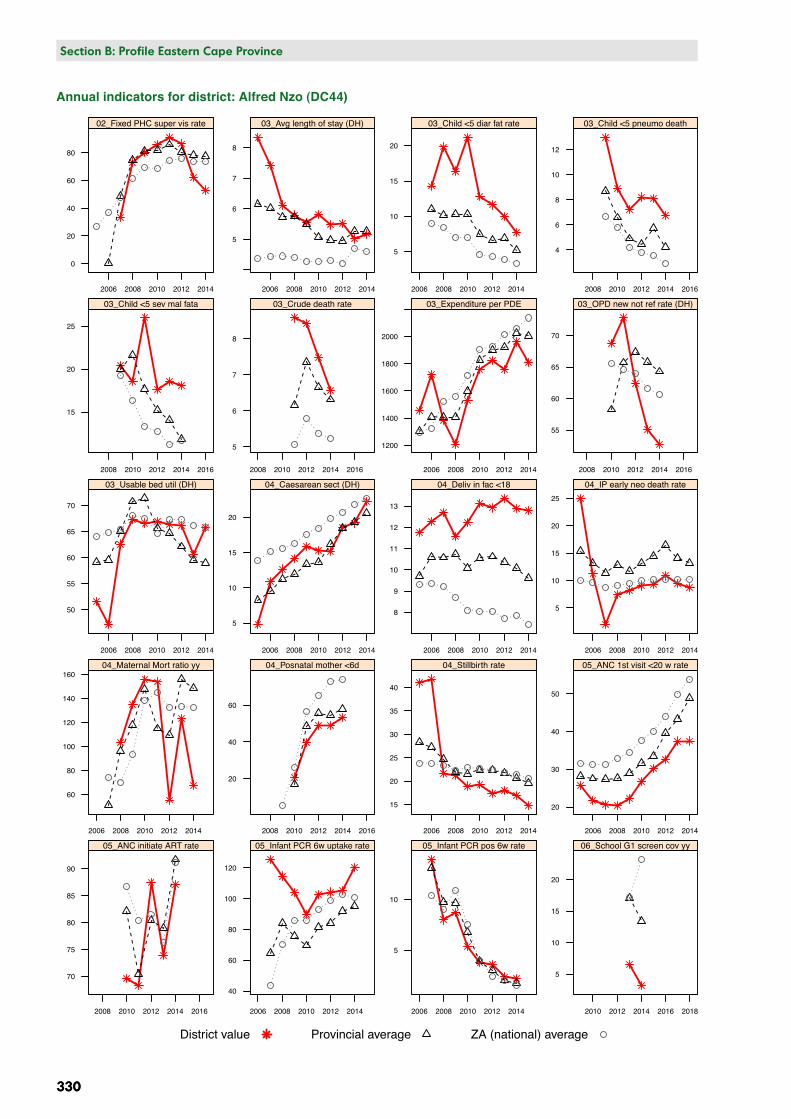
Annual indicators for district: A Nzo: DC44
Valu
e
0
20
40
60
80
2006 2008 2010 2012 2014
02_Fixed PHC super vis rate
5
6
7
8
2006 2008 2010 2012 2014
03_Avg length of stay (DH)
5
10
15
20
2006 2008 2010 2012 2014
03_Child <5 diar fat rate
4
6
8
10
12
2008 2010 2012 2014 2016
03_Child <5 pneumo death
15
20
25
2008 2010 2012 2014 2016
03_Child <5 sev mal fata
5
6
7
8
2008 2010 2012 2014 2016
03_Crude death rate
1200
1400
1600
1800
2000
2006 2008 2010 2012 2014
03_Expenditure per PDE
55
60
65
70
2008 2010 2012 2014 2016
03_OPD new not ref rate (DH)
50
55
60
65
70
2006 2008 2010 2012 2014
03_Usable bed util (DH)
5
10
15
20
2006 2008 2010 2012 2014
04_Caesarean sect (DH)
8
9
10
11
12
13
2006 2008 2010 2012 2014
04_Deliv in fac <18
5
10
15
20
25
2006 2008 2010 2012 2014
04_IP early neo death rate
60
80
100
120
140
160
2006 2008 2010 2012 2014
04_Maternal Mort ratio yy
20
40
60
2008 2010 2012 2014 2016
04_Posnatal mother <6d
15
20
25
30
35
40
2006 2008 2010 2012 2014
04_Stillbirth rate
20
30
40
50
2006 2008 2010 2012 2014
05_ANC 1st visit <20 w rate
70
75
80
85
90
2008 2010 2012 2014 2016
05_ANC initiate ART rate
40
60
80
100
120
2006 2008 2010 2012 2014
05_Infant PCR 6w uptake rate
5
10
2006 2008 2010 2012 2014
05_Infant PCR pos 6w rate
5
10
15
20
2010 2012 2014 2016 2018
06_School G1 screen cov yy
District value Provincial average ZA (national) average
330
Section B: National and District Profiles
330
Section B: Profile Eastern Cape Province
Annual indicators for district: Alfred Nzo (DC44)
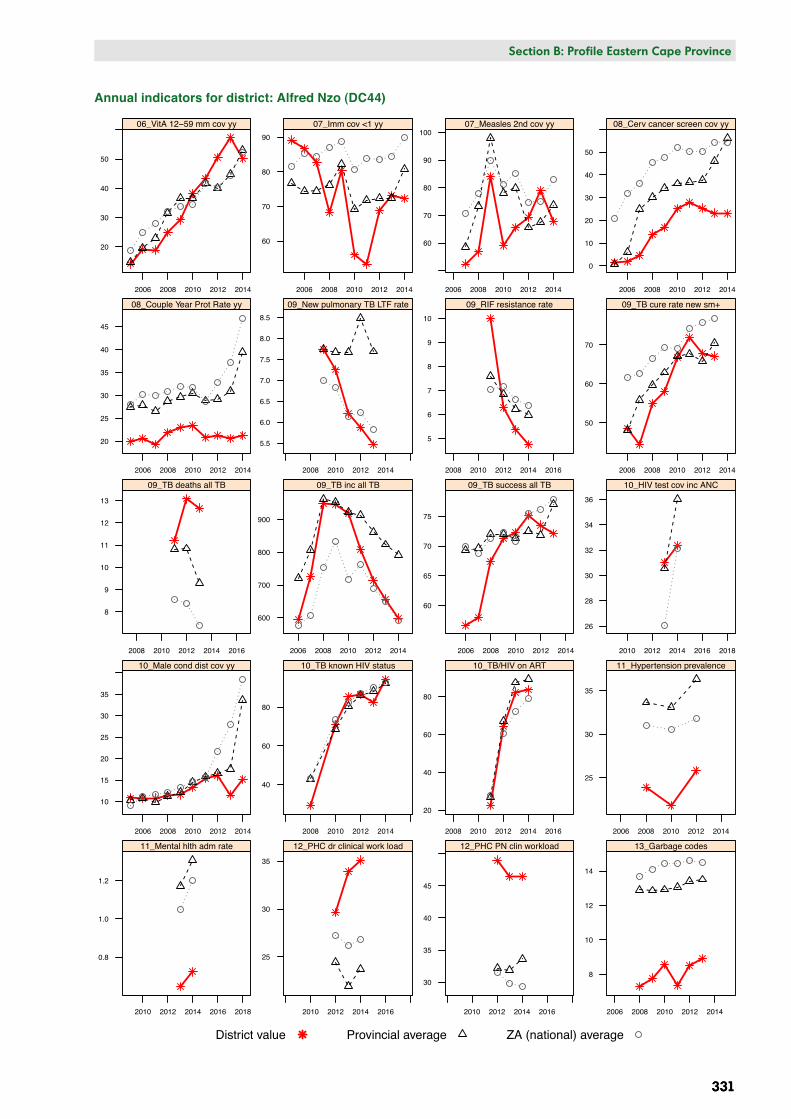
Annual indicators for district: A Nzo: DC44Va
lue
20
30
40
50
2006 2008 2010 2012 2014
06_VitA 12−59 mm cov yy
60
70
80
90
2006 2008 2010 2012 2014
07_Imm cov <1 yy
60
70
80
90
100
2006 2008 2010 2012 2014
07_Measles 2nd cov yy
0
10
20
30
40
50
2006 2008 2010 2012 2014
08_Cerv cancer screen cov yy
20
25
30
35
40
45
2006 2008 2010 2012 2014
08_Couple Year Prot Rate yy
5.5
6.0
6.5
7.0
7.5
8.0
8.5
2008 2010 2012 2014
09_New pulmonary TB LTF rate
5
6
7
8
9
10
2008 2010 2012 2014 2016
09_RIF resistance rate
50
60
70
2006 2008 2010 2012 2014
09_TB cure rate new sm+
8
9
10
11
12
13
2008 2010 2012 2014 2016
09_TB deaths all TB
600
700
800
900
2006 2008 2010 2012 2014
09_TB inc all TB
60
65
70
75
2006 2008 2010 2012 2014
09_TB success all TB
26
28
30
32
34
36
2010 2012 2014 2016 2018
10_HIV test cov inc ANC
10
15
20
25
30
35
2006 2008 2010 2012 2014
10_Male cond dist cov yy
40
60
80
2008 2010 2012 2014
10_TB known HIV status
20
40
60
80
2008 2010 2012 2014 2016
10_TB/HIV on ART
25
30
35
2006 2008 2010 2012 2014
11_Hypertension prevalence
0.8
1.0
1.2
2010 2012 2014 2016 2018
11_Mental hlth adm rate
25
30
35
2010 2012 2014 2016
12_PHC dr clinical work load
30
35
40
45
2010 2012 2014 2016
12_PHC PN clin workload
8
10
12
14
2006 2008 2010 2012 2014
13_Garbage codes
District value Provincial average ZA (national) average
Section B: National and District Profiles
331
Section B: Profile Eastern Cape Province
331
Annual indicators for district: Alfred Nzo (DC44)
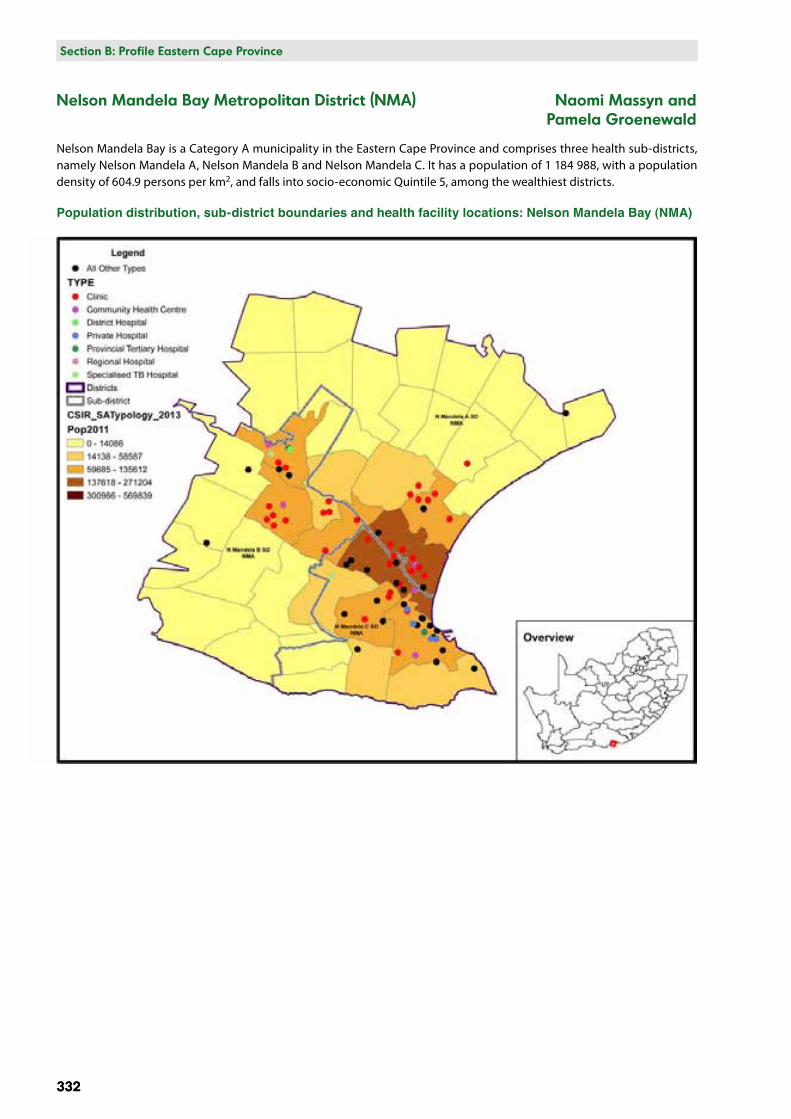
332
Section B: National and District Profiles
332
Section B: Profile Eastern Cape Province
Nelson Mandela Bay Metropolitan District (NMA) Naomi Massyn and Pamela Groenewald
Nelson Mandela Bay is a Category A municipality in the Eastern Cape Province and comprises three health sub-districts, namely Nelson Mandela A, Nelson Mandela B and Nelson Mandela C. It has a population of 1 184 988, with a population density of 604.9 persons per km2, and falls into socio-economic Quintile 5, among the wealthiest districts.
Population distribution, sub-district boundaries and health facility locations: Nelson Mandela Bay (NMA)
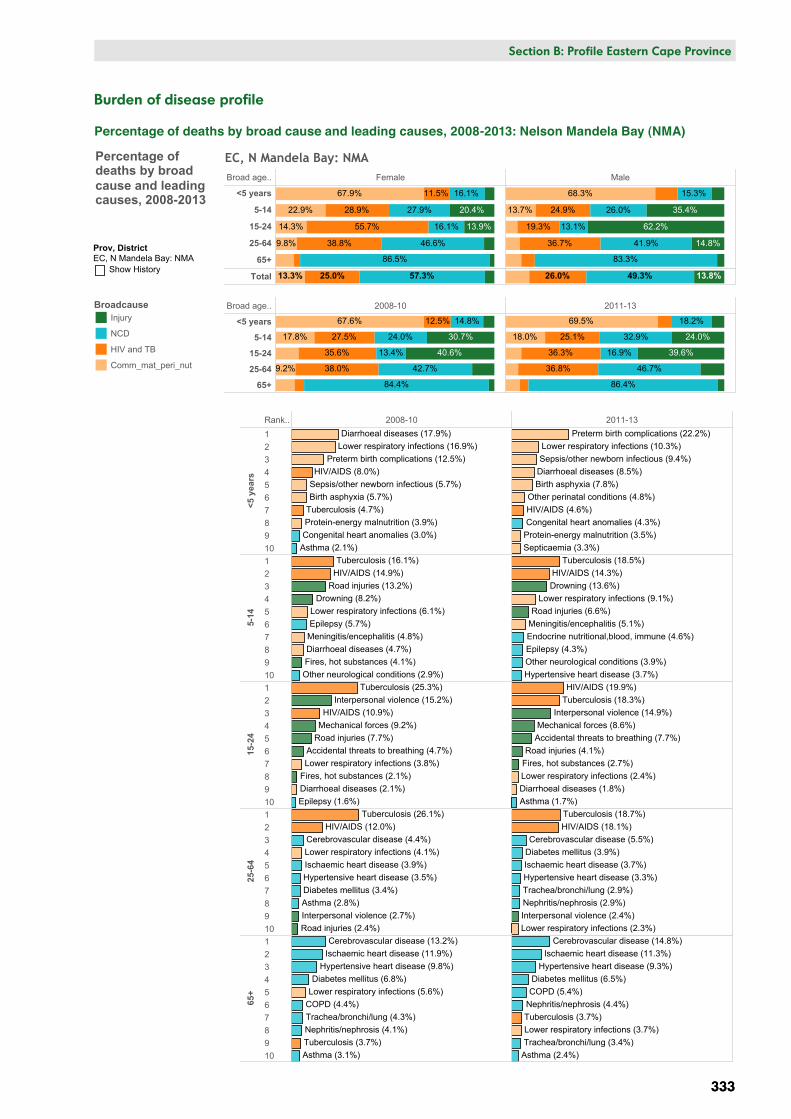
Broad age.. Female Male
<5 years
5-14
15-24
25-64
65+
Total 57.3%25.0%13.3%
20.4%
13.9%
16.1%
27.9%
16.1%
46.6%
86.5%
11.5%
28.9%
55.7%
38.8%
67.9%
22.9%
14.3%
9.8%
13.8%49.3%26.0%
35.4%
62.2%
14.8%
15.3%
26.0%
13.1%
41.9%
83.3%
24.9%
19.3%
36.7%
68.3%
13.7%
EC, N Mandela Bay: NMA
Broad age.. 2008-10 2011-13
<5 years
5-14
15-24
25-64
65+
30.7%
40.6%
14.8%
24.0%
13.4%
42.7%
84.4%
12.5%
27.5%
35.6%
38.0%
67.6%
17.8%
9.2%
24.0%
39.6%
18.2%
32.9%
16.9%
46.7%
86.4%
25.1%
36.3%
36.8%
69.5%
18.0%
Rank.. 2008-10 2011-13
<5 y
ears
12345678910
5-14
12345678910
15-2
4
12345678910
25-6
4
12345678910
65+
12345678910
Congenital heart anomalies (3.0%)
Sepsis/other newborn infectious (5.7%)
Protein-energy malnutrition (3.9%)
Birth asphyxia (5.7%)
Preterm birth complications (12.5%)
Asthma (2.1%)
Diarrhoeal diseases (17.9%)Lower respiratory infections (16.9%)
HIV/AIDS (8.0%)
Tuberculosis (4.7%)Congenital heart anomalies (4.3%)
Other perinatal conditions (4.8%)
Sepsis/other newborn infectious (9.4%)
Protein-energy malnutrition (3.5%)
Birth asphyxia (7.8%)
Preterm birth complications (22.2%)
Septicaemia (3.3%)
Diarrhoeal diseases (8.5%)
Lower respiratory infections (10.3%)
HIV/AIDS (4.6%)
Other neurological conditions (2.9%)
Drowning (8.2%)
Epilepsy (5.7%)
Fires, hot substances (4.1%)
Meningitis/encephalitis (4.8%)
Road injuries (13.2%)
Diarrhoeal diseases (4.7%)
Lower respiratory infections (6.1%)
HIV/AIDS (14.9%)Tuberculosis (16.1%)
Other neurological conditions (3.9%)
Drowning (13.6%)
Epilepsy (4.3%)Endocrine nutritional,blood, immune (4.6%)Meningitis/encephalitis (5.1%)Road injuries (6.6%)
Hypertensive heart disease (3.7%)
Lower respiratory infections (9.1%)
HIV/AIDS (14.3%)Tuberculosis (18.5%)
Epilepsy (1.6%)
Fires, hot substances (2.1%)
Interpersonal violence (15.2%)
Mechanical forces (9.2%)
Accidental threats to breathing (4.7%)Road injuries (7.7%)
Diarrhoeal diseases (2.1%)
Lower respiratory infections (3.8%)
HIV/AIDS (10.9%)
Tuberculosis (25.3%)
Fires, hot substances (2.7%)
Asthma (1.7%)
Interpersonal violence (14.9%)Mechanical forces (8.6%)Accidental threats to breathing (7.7%)
Road injuries (4.1%)
Diarrhoeal diseases (1.8%)Lower respiratory infections (2.4%)
HIV/AIDS (19.9%)Tuberculosis (18.3%)
Asthma (2.8%)Interpersonal violence (2.7%)Road injuries (2.4%)
Diabetes mellitus (3.4%)Hypertensive heart disease (3.5%)Ischaemic heart disease (3.9%)
Cerebrovascular disease (4.4%)Lower respiratory infections (4.1%)
HIV/AIDS (12.0%)Tuberculosis (26.1%)
Trachea/bronchi/lung (2.9%)
Interpersonal violence (2.4%)Nephritis/nephrosis (2.9%)
Diabetes mellitus (3.9%)
Hypertensive heart disease (3.3%)Ischaemic heart disease (3.7%)
Cerebrovascular disease (5.5%)
Lower respiratory infections (2.3%)
HIV/AIDS (18.1%)Tuberculosis (18.7%)
Trachea/bronchi/lung (4.3%)
Asthma (3.1%)
COPD (4.4%)
Nephritis/nephrosis (4.1%)
Diabetes mellitus (6.8%)Hypertensive heart disease (9.8%)
Ischaemic heart disease (11.9%)Cerebrovascular disease (13.2%)
Lower respiratory infections (5.6%)
Tuberculosis (3.7%) Trachea/bronchi/lung (3.4%)Asthma (2.4%)
COPD (5.4%)Nephritis/nephrosis (4.4%)
Diabetes mellitus (6.5%)Hypertensive heart disease (9.3%)
Ischaemic heart disease (11.3%)Cerebrovascular disease (14.8%)
Lower respiratory infections (3.7%)Tuberculosis (3.7%)
Prov, DistrictEC, N Mandela Bay: NMA
Show History
BroadcauseInjury
NCD
HIV and TB
Comm_mat_peri_nut
Percentage ofdeaths by broadcause and leadingcauses, 2008-2013
Section B: National and District Profiles
333
Section B: Profile Eastern Cape Province
333
Burden of disease profile
Percentage of deaths by broad cause and leading causes, 2008-2013: Nelson Mandela Bay (NMA)
334
Section B: National and District Profiles
334
Section B: Profile Eastern Cape Province
Broad cause groups by age and gender
In the under-5-year age group, communicable diseases together with maternal, perinatal and nutritional conditions accounted for around 68% of deaths. Non-communicable diseases accounted for about 16% of deaths, HIV and TB for about 12%, and injuries for around 4%.
In the 5–14-year age group there were bigger differences in the proportions of broad causes between females and males. Injuries accounted for 20.4% of deaths among females and 35.4% of deaths among males, and communicable diseases together with maternal, perinatal and nutritional conditions accounted for 22.9% among females versus 13.7% among males.
In the 15–24-year age group, injury accounted for 62.2% of deaths among males compared with only 13.9% among females, while HIV and TB accounted for 55.7% of deaths among females versus 19.3% among males.
In the 25–64-year age group, non-communicable diseases accounted for the largest proportion of deaths (41.9% among males and 46.6% among females). Injuries accounted for a small proportion of deaths, with the percentage being much higher among males (14.8%) than females (4.8%).
In the 65-years-and-older age group, non-communicable diseases accounted for the highest proportion of deaths (86.5% among females and 83.3% among males). HIV and TB deaths were higher among males than females.
Trends in broad cause groups by age
There was not much change in broad cause groups among children under 5 years over this period. In the 5–14-year age group there was a slight decrease in HIV and TB mortality, a bigger decrease in injury-related deaths, and a marked increase in non-communicable disease mortality. There was not much change in broad cause groups for the 15–24-year, 25–64 year, and the 65-years-and-older age groups over the period.
Trends in leading causes of death by age
Under 5 years
Deaths due to diarrhoea, lower respiratory infection, HIV and AIDS and TB declined markedly over this period. Deaths due to prematurity increased markedly, along with deaths due to sepsis/other neonatal infections, birth asphyxia and other perinatal conditions. HIV-related mortality declined to less than 30% in this district.
5–14 years
Tuberculosis, HIV and AIDS, drowning, lower respiratory infections and road injuries remained the top five causes of death in this age group over this period, although the proportion of road injuries declined and drowning increased. Meningitis and epilepsy were also among the top 10 causes.
15–24 years
HIV and AIDS, TB, interpersonal violence, mechanical forces and road injuries remained in the top six causes of death over this period, with HIV increasing markedly. Fires, lower respiratory infections and diarrhoea also appeared among the top 10 causes.
25–64 years
Tuberculosis, HIV and AIDS and cerebrovascular disease remained the top three causes of death over the whole period. Lower respiratory infections declined, with diabetes mellitus, ischaemic heart disease, hypertensive heart disease and lung cancer moving up in the ranking. Interpersonal violence also appeared in the top 10 causes in both periods.
65 years and older
Cerebrovascular disease, ischaemic heart disease, hypertensive heart disease and diabetes mellitus remained the leading causes of death in this age group over the whole period. Lower respiratory infections dropped in the ranking in the latter period.
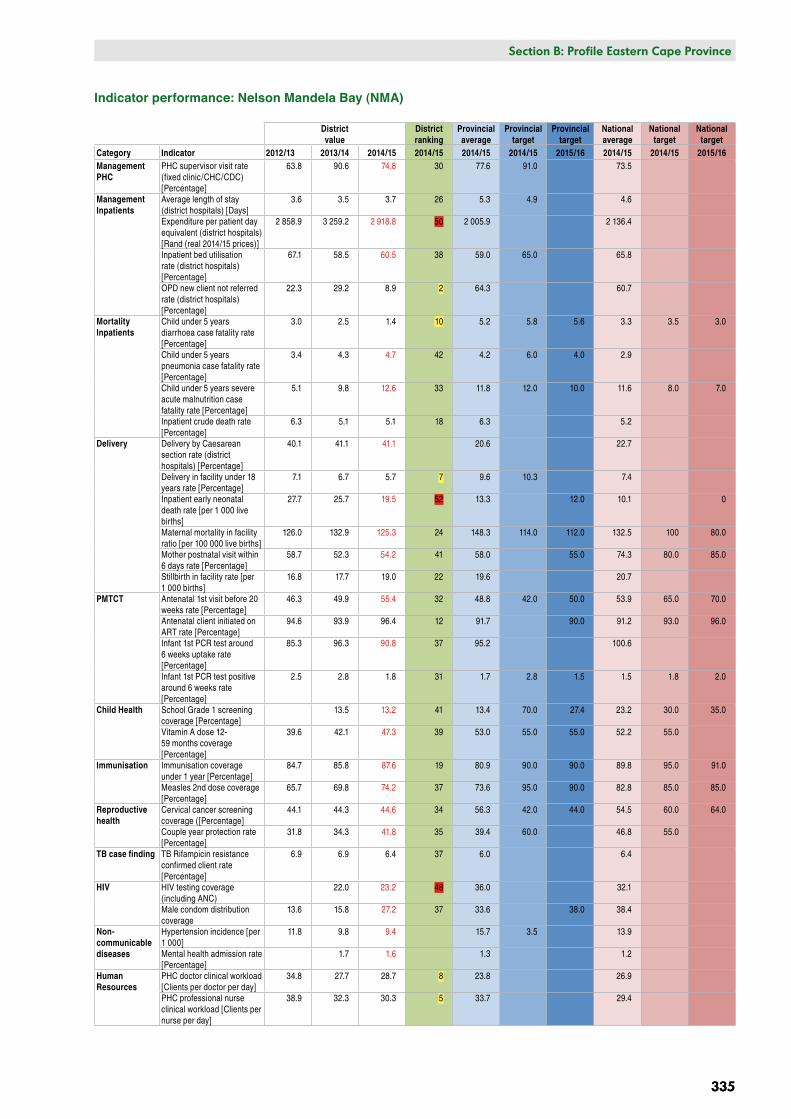
Section B: National and District Profiles
335
Section B: Profile Eastern Cape Province
335
Indicator performance: Nelson Mandela Bay (NMA)
District value
District ranking
Provincial average
Provincial target
Provincial target
National average
National target
National target
Category Indicator 2012/13 2013/14 2014/15 2014/15 2014/15 2014/15 2015/16 2014/15 2014/15 2015/16Management PHC
PHC supervisor visit rate (fixed clinic/CHC/CDC) [Percentage]
63.8 90.6 74.8 30 77.6 91.0 73.5
Management Inpatients
Average length of stay (district hospitals) [Days]
3.6 3.5 3.7 26 5.3 4.9 4.6
Expenditure per patient day equivalent (district hospitals) [Rand (real 2014/15 prices)]
2 858.9 3 259.2 2 918.8 50 2 005.9 2 136.4
Inpatient bed utilisation rate (district hospitals) [Percentage]
67.1 58.5 60.5 38 59.0 65.0 65.8
OPD new client not referred rate (district hospitals) [Percentage]
22.3 29.2 8.9 2 64.3 60.7
Mortality Inpatients
Child under 5 years diarrhoea case fatality rate [Percentage]
3.0 2.5 1.4 10 5.2 5.8 5.6 3.3 3.5 3.0
Child under 5 years pneumonia case fatality rate [Percentage]
3.4 4.3 4.7 42 4.2 6.0 4.0 2.9
Child under 5 years severe acute malnutrition case fatality rate [Percentage]
5.1 9.8 12.6 33 11.8 12.0 10.0 11.6 8.0 7.0
Inpatient crude death rate [Percentage]
6.3 5.1 5.1 18 6.3 5.2
Delivery Delivery by Caesarean section rate (district hospitals) [Percentage]
40.1 41.1 41.1 20.6 22.7
Delivery in facility under 18 years rate [Percentage]
7.1 6.7 5.7 7 9.6 10.3 7.4
Inpatient early neonatal death rate [per 1 000 live births]
27.7 25.7 19.5 52 13.3 12.0 10.1 0
Maternal mortality in facility ratio [per 100 000 live births]
126.0 132.9 125.3 24 148.3 114.0 112.0 132.5 100 80.0
Mother postnatal visit within 6 days rate [Percentage]
58.7 52.3 54.2 41 58.0 55.0 74.3 80.0 85.0
Stillbirth in facility rate [per 1 000 births]
16.8 17.7 19.0 22 19.6 20.7
PMTCT Antenatal 1st visit before 20 weeks rate [Percentage]
46.3 49.9 55.4 32 48.8 42.0 50.0 53.9 65.0 70.0
Antenatal client initiated on ART rate [Percentage]
94.6 93.9 96.4 12 91.7 90.0 91.2 93.0 96.0
Infant 1st PCR test around 6 weeks uptake rate [Percentage]
85.3 96.3 90.8 37 95.2 100.6
Infant 1st PCR test positive around 6 weeks rate [Percentage]
2.5 2.8 1.8 31 1.7 2.8 1.5 1.5 1.8 2.0
Child Health School Grade 1 screening coverage [Percentage]
13.5 13.2 41 13.4 70.0 27.4 23.2 30.0 35.0
Vitamin A dose 12-59 months coverage [Percentage]
39.6 42.1 47.3 39 53.0 55.0 55.0 52.2 55.0
Immunisation Immunisation coverage under 1 year [Percentage]
84.7 85.8 87.6 19 80.9 90.0 90.0 89.8 95.0 91.0
Measles 2nd dose coverage [Percentage]
65.7 69.8 74.2 37 73.6 95.0 90.0 82.8 85.0 85.0
Reproductive health
Cervical cancer screening coverage ([Percentage]
44.1 44.3 44.6 34 56.3 42.0 44.0 54.5 60.0 64.0
Couple year protection rate [Percentage]
31.8 34.3 41.8 35 39.4 60.0 46.8 55.0
TB case finding TB Rifampicin resistance confirmed client rate [Percentage]
6.9 6.9 6.4 37 6.0 6.4
HIV HIV testing coverage (including ANC)
22.0 23.2 48 36.0 32.1
Male condom distribution coverage
13.6 15.8 27.2 37 33.6 38.0 38.4
Non-communicable diseases
Hypertension incidence [per 1 000]
11.8 9.8 9.4 15.7 3.5 13.9
Mental health admission rate [Percentage]
1.7 1.6 1.3 1.2
Human Resources
PHC doctor clinical workload [Clients per doctor per day]
34.8 27.7 28.7 8 23.8 26.9
PHC professional nurse clinical workload [Clients per nurse per day]
38.9 32.3 30.3 5 33.7 29.4
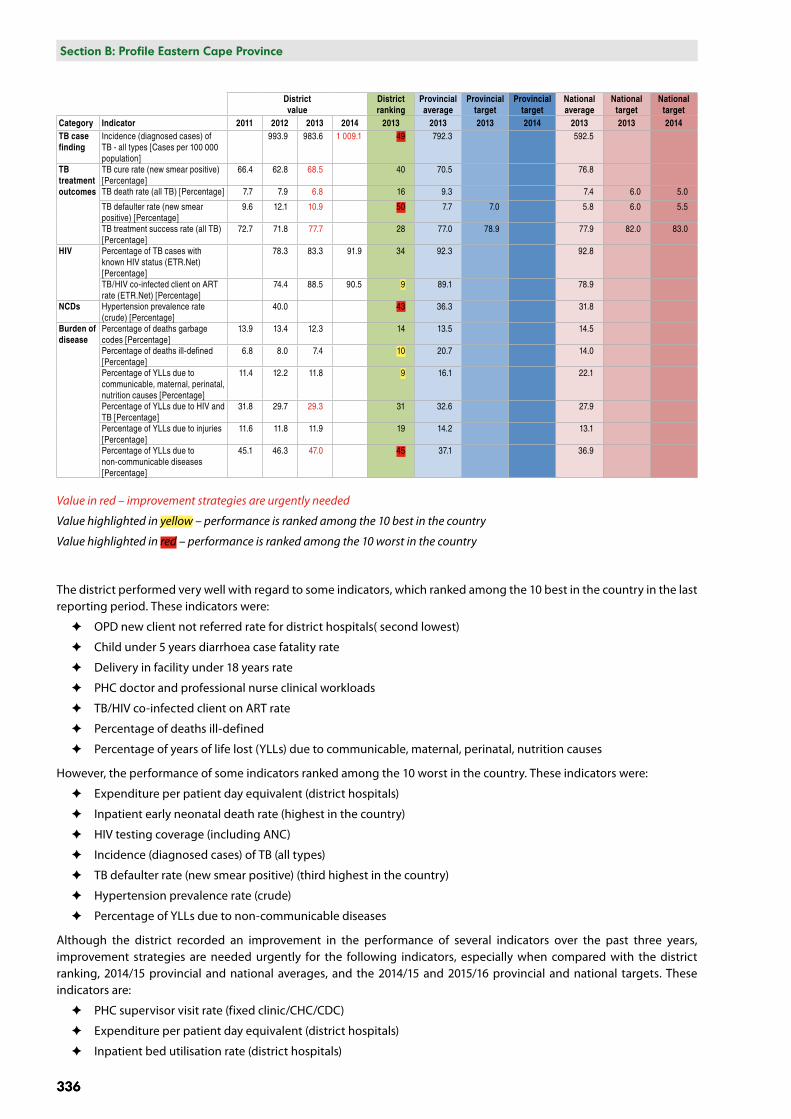
336
Section B: National and District Profiles
336
Section B: Profile Eastern Cape Province
District value
District ranking
Provincial average
Provincial target
Provincial target
National average
National target
National target
Category Indicator 2011 2012 2013 2014 2013 2013 2013 2014 2013 2013 2014TB case finding
Incidence (diagnosed cases) of TB - all types [Cases per 100 000 population]
993.9 983.6 1 009.1 49 792.3 592.5
TB treatment outcomes
TB cure rate (new smear positive) [Percentage]
66.4 62.8 68.5 40 70.5 76.8
TB death rate (all TB) [Percentage] 7.7 7.9 6.8 16 9.3 7.4 6.0 5.0
TB defaulter rate (new smear positive) [Percentage]
9.6 12.1 10.9 50 7.7 7.0 5.8 6.0 5.5
TB treatment success rate (all TB) [Percentage]
72.7 71.8 77.7 28 77.0 78.9 77.9 82.0 83.0
HIV Percentage of TB cases with known HIV status (ETR.Net) [Percentage]
78.3 83.3 91.9 34 92.3 92.8
TB/HIV co-infected client on ART rate (ETR.Net) [Percentage]
74.4 88.5 90.5 9 89.1 78.9
NCDs Hypertension prevalence rate (crude) [Percentage]
40.0 43 36.3 31.8
Burden of disease
Percentage of deaths garbage codes [Percentage]
13.9 13.4 12.3 14 13.5 14.5
Percentage of deaths ill-defined [Percentage]
6.8 8.0 7.4 10 20.7 14.0
Percentage of YLLs due to communicable, maternal, perinatal, nutrition causes [Percentage]
11.4 12.2 11.8 9 16.1 22.1
Percentage of YLLs due to HIV and TB [Percentage]
31.8 29.7 29.3 31 32.6 27.9
Percentage of YLLs due to injuries [Percentage]
11.6 11.8 11.9 19 14.2 13.1
Percentage of YLLs due to non-communicable diseases [Percentage]
45.1 46.3 47.0 45 37.1 36.9
Value in red – improvement strategies are urgently needed
Value highlighted in yellow – performance is ranked among the 10 best in the country
Value highlighted in red – performance is ranked among the 10 worst in the country
The district performed very well with regard to some indicators, which ranked among the 10 best in the country in the last reporting period. These indicators were:
✦ OPD new client not referred rate for district hospitals( second lowest)
✦ Child under 5 years diarrhoea case fatality rate
✦ Delivery in facility under 18 years rate
✦ PHC doctor and professional nurse clinical workloads
✦ TB/HIV co-infected client on ART rate
✦ Percentage of deaths ill-defined
✦ Percentage of years of life lost (YLLs) due to communicable, maternal, perinatal, nutrition causes
However, the performance of some indicators ranked among the 10 worst in the country. These indicators were:
✦ Expenditure per patient day equivalent (district hospitals)
✦ Inpatient early neonatal death rate (highest in the country)
✦ HIV testing coverage (including ANC)
✦ Incidence (diagnosed cases) of TB (all types)
✦ TB defaulter rate (new smear positive) (third highest in the country)
✦ Hypertension prevalence rate (crude)
✦ Percentage of YLLs due to non-communicable diseases
Although the district recorded an improvement in the performance of several indicators over the past three years, improvement strategies are needed urgently for the following indicators, especially when compared with the district ranking, 2014/15 provincial and national averages, and the 2014/15 and 2015/16 provincial and national targets. These indicators are:
✦ PHC supervisor visit rate (fixed clinic/CHC/CDC)
✦ Expenditure per patient day equivalent (district hospitals)
✦ Inpatient bed utilisation rate (district hospitals)
Section B: National and District Profiles
337
Section B: Profile Eastern Cape Province
337
✦ Child under 5 years pneumonia case fatality rate
✦ Child under 5 years severe acute malnutrition case fatality rate
✦ Delivery by Caesarean section rate (district hospitals)
✦ Inpatient early neonatal death rate
✦ Maternal mortality in facility ratio
✦ Mother postnatal visit within 6 days rate
✦ Antenatal 1st visit before 20 weeks rate
✦ Infant 1st PCR test around 6 weeks uptake rate
✦ School Grade 1 screening coverage
✦ Vitamin A dose 12–59 months coverage
✦ Immunisation coverage under 1 year
✦ Measles 2nd dose coverage
✦ Cervical cancer screening coverage
✦ Couple year protection rate
✦ HIV testing coverage (including ANC)
✦ Male condom distribution coverage
✦ Mental health admission rate
✦ Incidence (diagnosed cases) of TB (all types)
✦ TB cure rate (new smear positive)
✦ TB death rate (all TB)
✦ TB defaulter rate (new smear positive)
✦ TB treatment success rate (all TB)
✦ Hypertension prevalence rate (crude)
✦ Hypertension incidence
✦ Percentage of YLLs due to non-communicable diseases
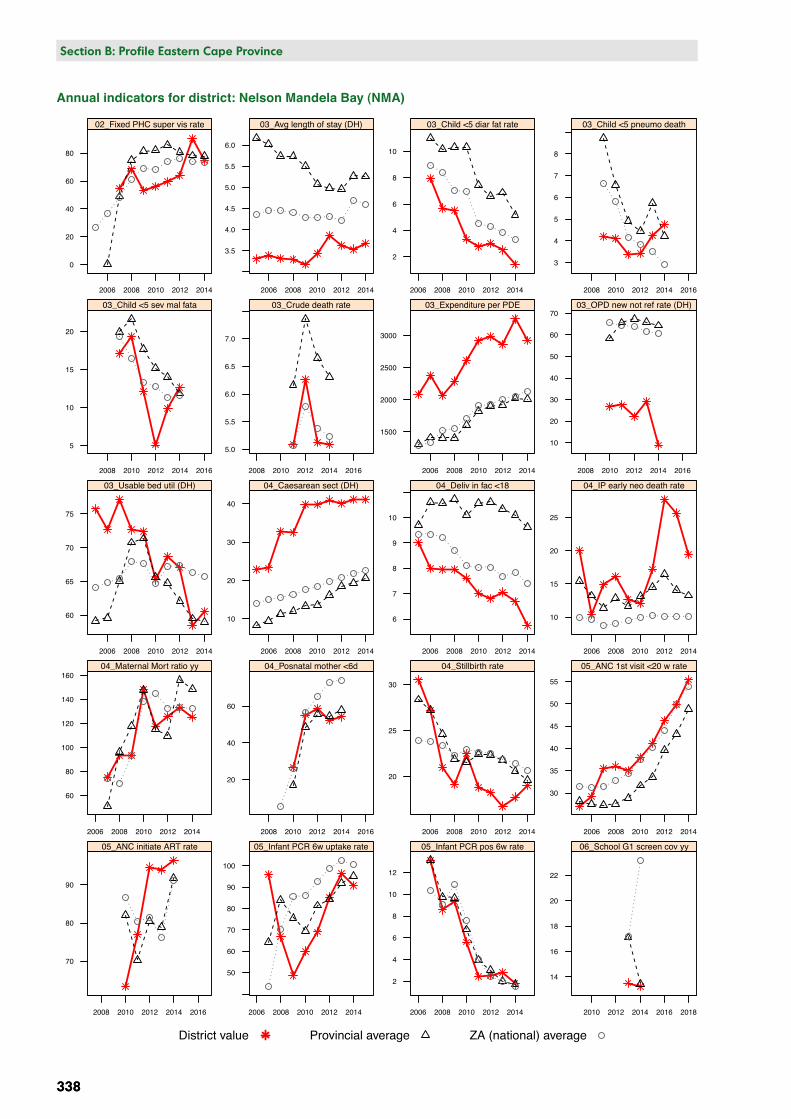
Annual indicators for district: N Mandela Bay: NMA
Valu
e
0
20
40
60
80
2006 2008 2010 2012 2014
02_Fixed PHC super vis rate
3.5
4.0
4.5
5.0
5.5
6.0
2006 2008 2010 2012 2014
03_Avg length of stay (DH)
2
4
6
8
10
2006 2008 2010 2012 2014
03_Child <5 diar fat rate
3
4
5
6
7
8
2008 2010 2012 2014 2016
03_Child <5 pneumo death
5
10
15
20
2008 2010 2012 2014 2016
03_Child <5 sev mal fata
5.0
5.5
6.0
6.5
7.0
2008 2010 2012 2014 2016
03_Crude death rate
1500
2000
2500
3000
2006 2008 2010 2012 2014
03_Expenditure per PDE
10
20
30
40
50
60
70
2008 2010 2012 2014 2016
03_OPD new not ref rate (DH)
60
65
70
75
2006 2008 2010 2012 2014
03_Usable bed util (DH)
10
20
30
40
2006 2008 2010 2012 2014
04_Caesarean sect (DH)
6
7
8
9
10
2006 2008 2010 2012 2014
04_Deliv in fac <18
10
15
20
25
2006 2008 2010 2012 2014
04_IP early neo death rate
60
80
100
120
140
160
2006 2008 2010 2012 2014
04_Maternal Mort ratio yy
20
40
60
2008 2010 2012 2014 2016
04_Posnatal mother <6d
20
25
30
2006 2008 2010 2012 2014
04_Stillbirth rate
30
35
40
45
50
55
2006 2008 2010 2012 2014
05_ANC 1st visit <20 w rate
70
80
90
2008 2010 2012 2014 2016
05_ANC initiate ART rate
50
60
70
80
90
100
2006 2008 2010 2012 2014
05_Infant PCR 6w uptake rate
2
4
6
8
10
12
2006 2008 2010 2012 2014
05_Infant PCR pos 6w rate
14
16
18
20
22
2010 2012 2014 2016 2018
06_School G1 screen cov yy
District value Provincial average ZA (national) average
338
Section B: National and District Profiles
338
Section B: Profile Eastern Cape Province
Annual indicators for district: Nelson Mandela Bay (NMA)
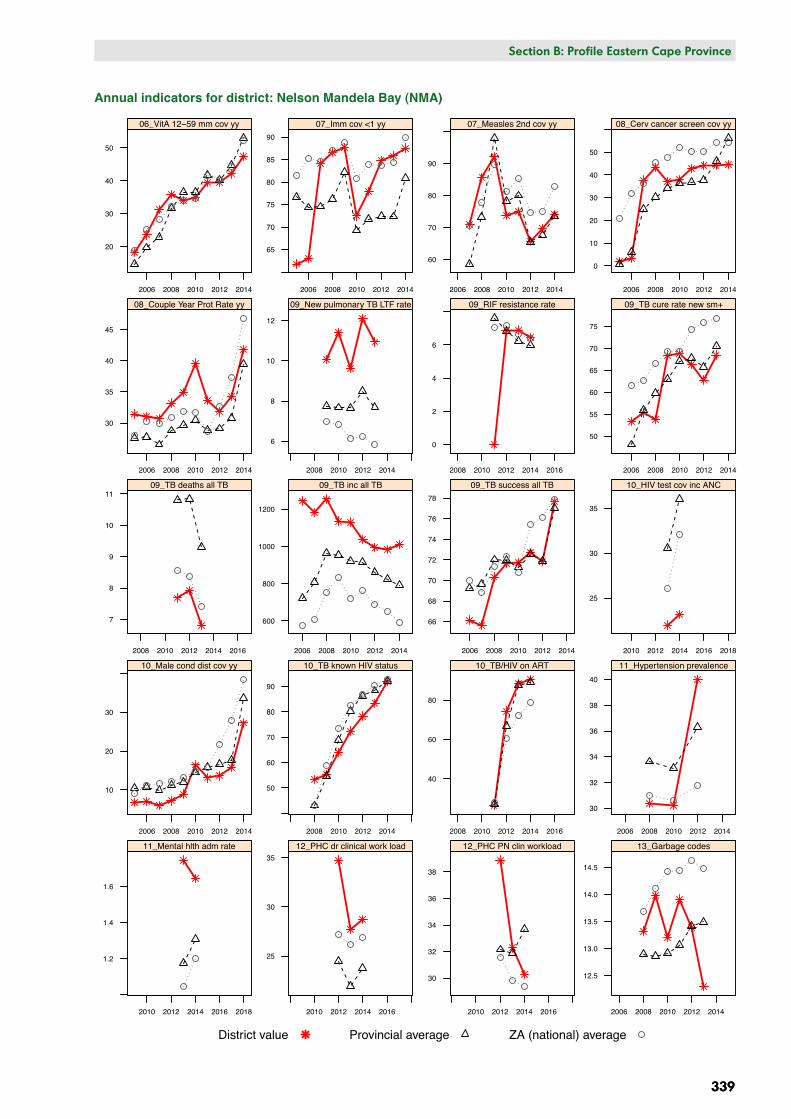
Annual indicators for district: N Mandela Bay: NMAVa
lue
20
30
40
50
2006 2008 2010 2012 2014
06_VitA 12−59 mm cov yy
65
70
75
80
85
90
2006 2008 2010 2012 2014
07_Imm cov <1 yy
60
70
80
90
2006 2008 2010 2012 2014
07_Measles 2nd cov yy
0
10
20
30
40
50
2006 2008 2010 2012 2014
08_Cerv cancer screen cov yy
30
35
40
45
2006 2008 2010 2012 2014
08_Couple Year Prot Rate yy
6
8
10
12
2008 2010 2012 2014
09_New pulmonary TB LTF rate
0
2
4
6
2008 2010 2012 2014 2016
09_RIF resistance rate
50
55
60
65
70
75
2006 2008 2010 2012 2014
09_TB cure rate new sm+
7
8
9
10
11
2008 2010 2012 2014 2016
09_TB deaths all TB
600
800
1000
1200
2006 2008 2010 2012 2014
09_TB inc all TB
66
68
70
72
74
76
78
2006 2008 2010 2012 2014
09_TB success all TB
25
30
35
2010 2012 2014 2016 2018
10_HIV test cov inc ANC
10
20
30
2006 2008 2010 2012 2014
10_Male cond dist cov yy
50
60
70
80
90
2008 2010 2012 2014
10_TB known HIV status
40
60
80
2008 2010 2012 2014 2016
10_TB/HIV on ART
30
32
34
36
38
40
2006 2008 2010 2012 2014
11_Hypertension prevalence
1.2
1.4
1.6
2010 2012 2014 2016 2018
11_Mental hlth adm rate
25
30
35
2010 2012 2014 2016
12_PHC dr clinical work load
30
32
34
36
38
2010 2012 2014 2016
12_PHC PN clin workload
12.5
13.0
13.5
14.0
14.5
2006 2008 2010 2012 2014
13_Garbage codes
District value Provincial average ZA (national) average
Section B: National and District Profiles
339
Section B: Profile Eastern Cape Province
339
Annual indicators for district: Nelson Mandela Bay (NMA)