Embed Size (px)
Citation preview
1
East Coast Winter Storm of 7-8 January 2017 Richard H. Grumm
and Charles Ross
National Weather Service State College, PA 16803 1. Introduction
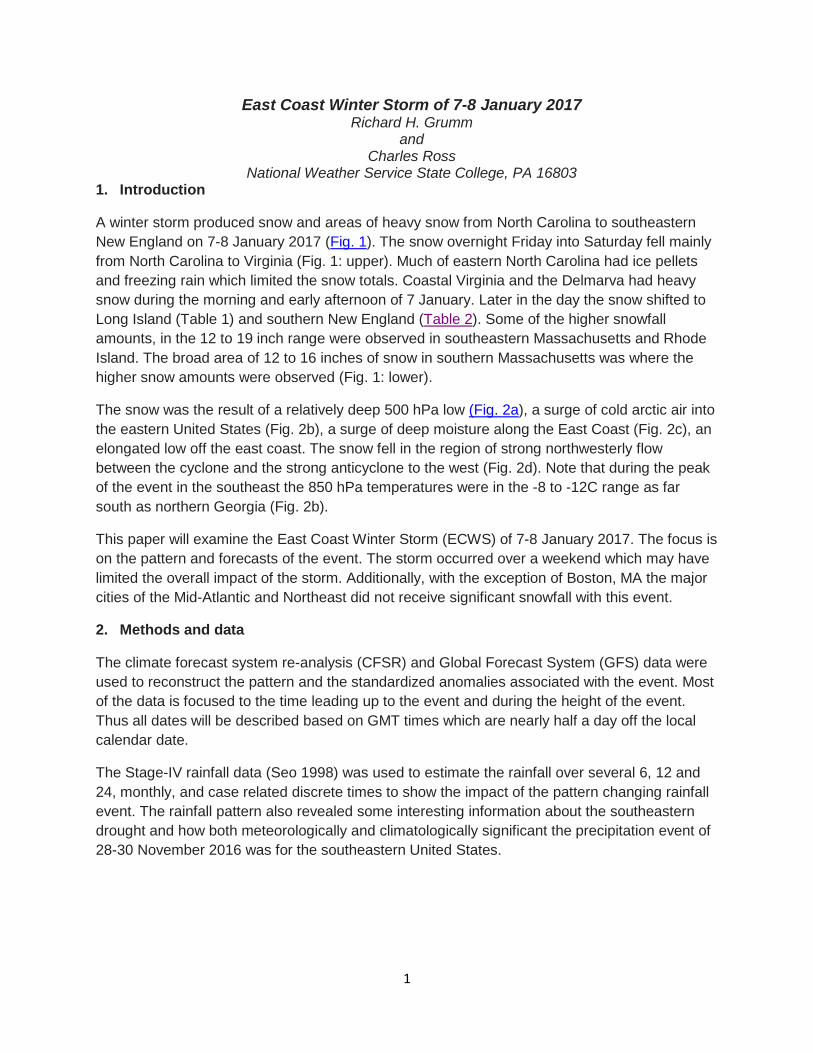
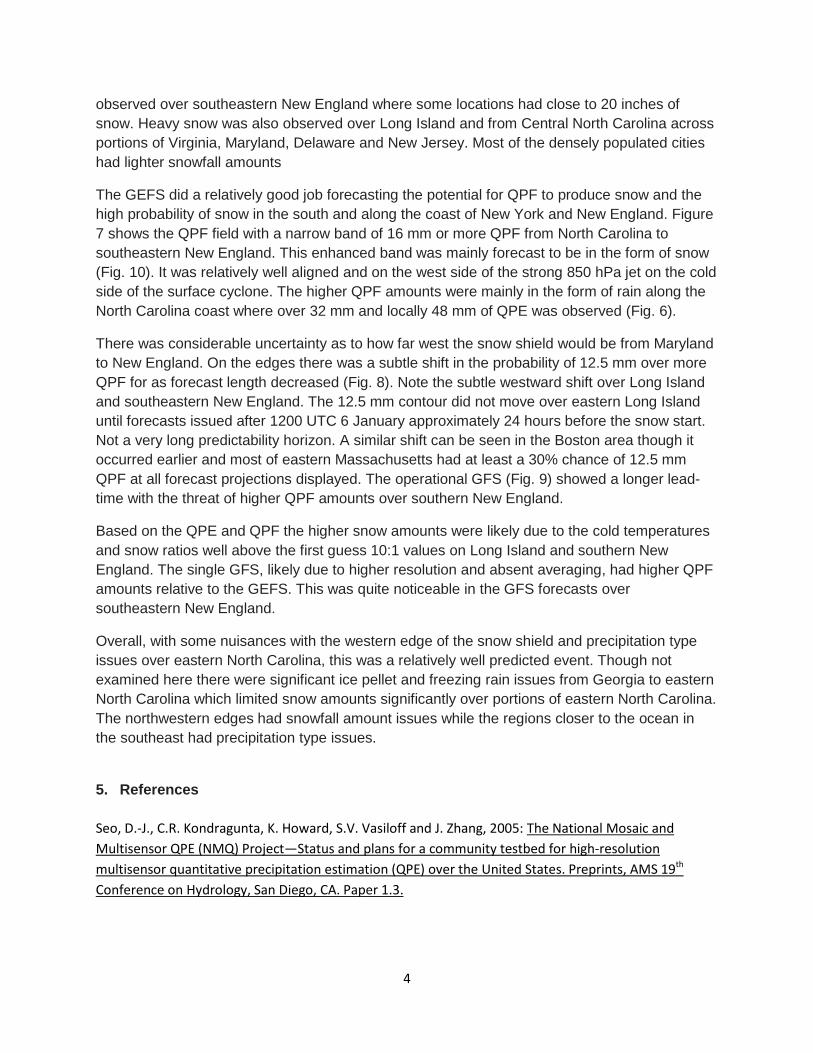
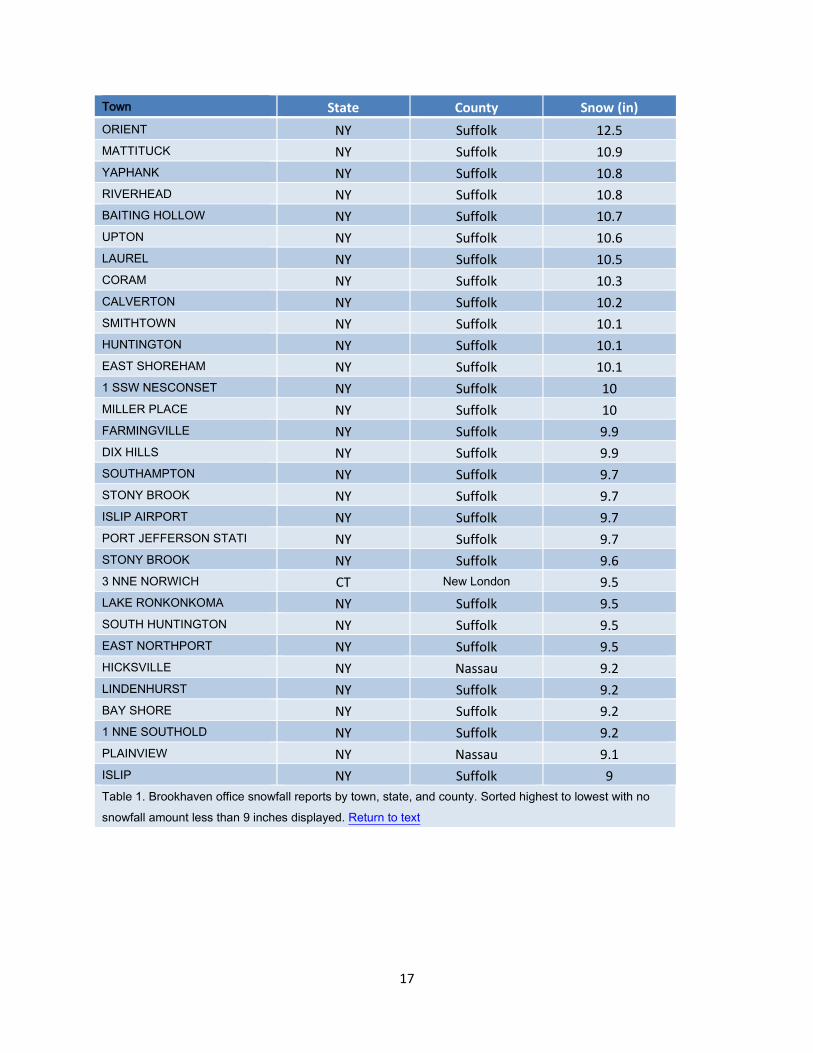
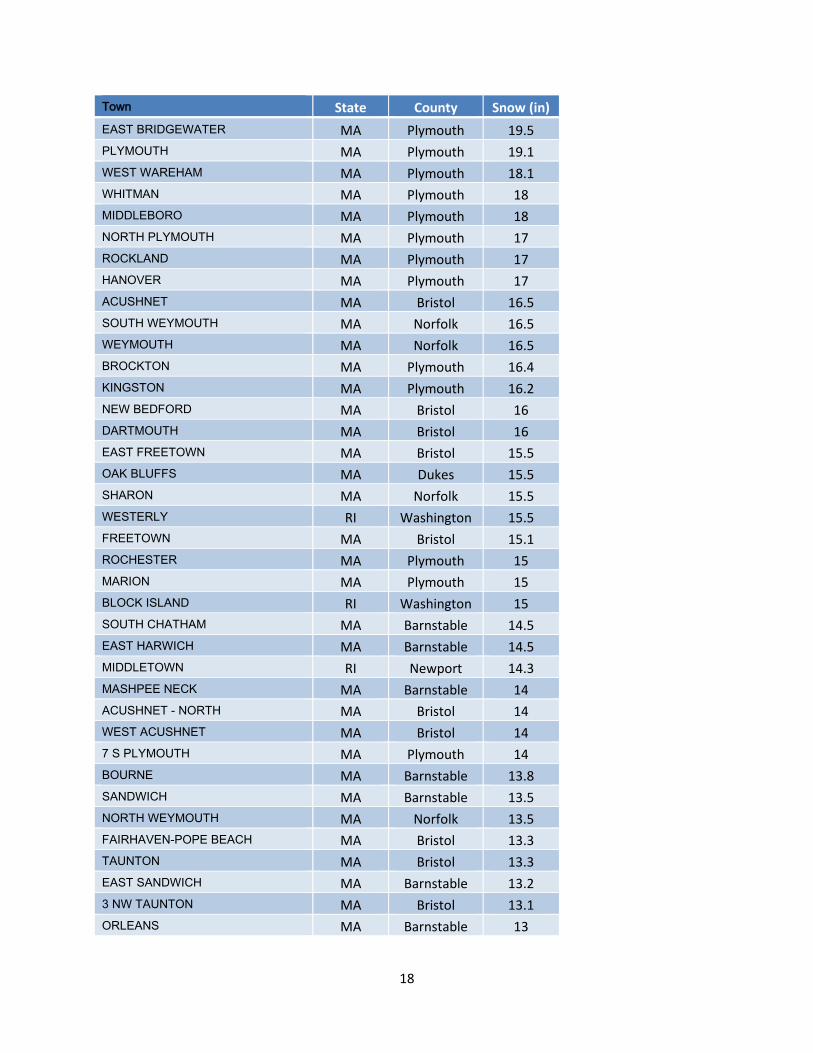
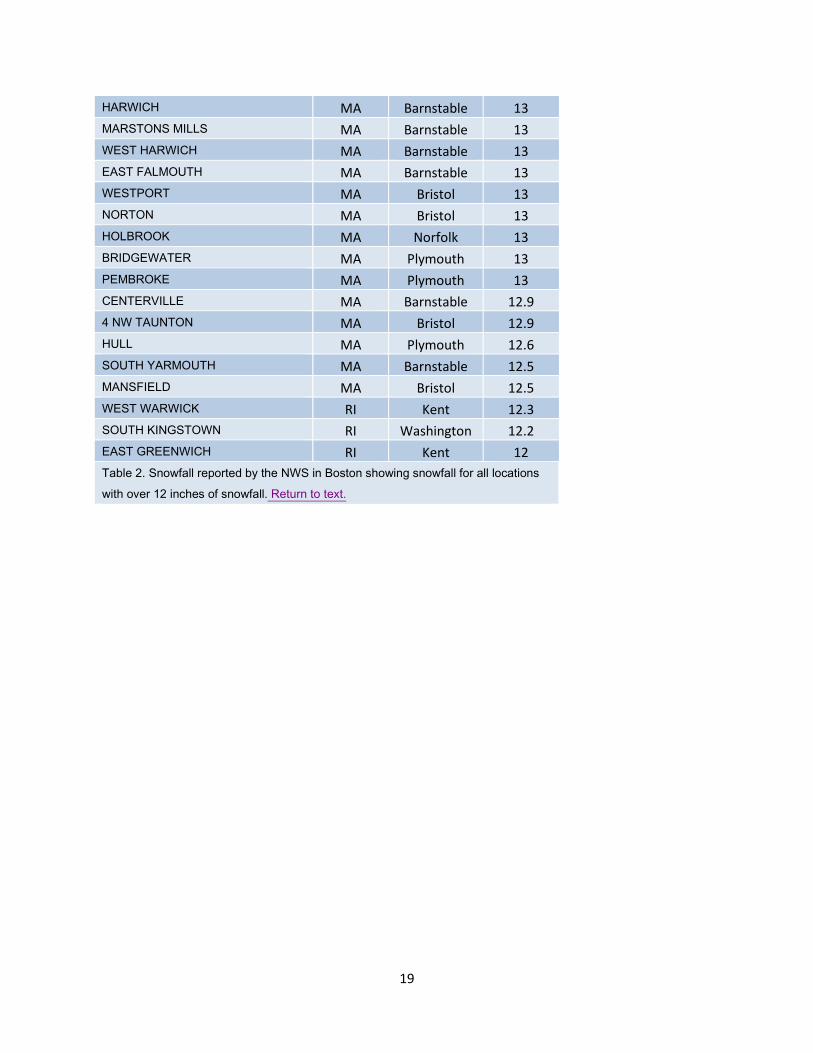
A winter storm produced snow and areas of heavy snow from North Carolina to southeastern New England on 7-8 January 2017 (Fig. 1). The snow overnight Friday into Saturday fell mainly from North Carolina to Virginia (Fig. 1: upper). Much of eastern North Carolina had ice pellets and freezing rain which limited the snow totals. Coastal Virginia and the Delmarva had heavy snow during the morning and early afternoon of 7 January. Later in the day the snow shifted to Long Island (Table 1) and southern New England (Table 2). Some of the higher snowfall amounts, in the 12 to 19 inch range were observed in southeastern Massachusetts and Rhode Island. The broad area of 12 to 16 inches of snow in southern Massachusetts was where the higher snow amounts were observed (Fig. 1: lower).
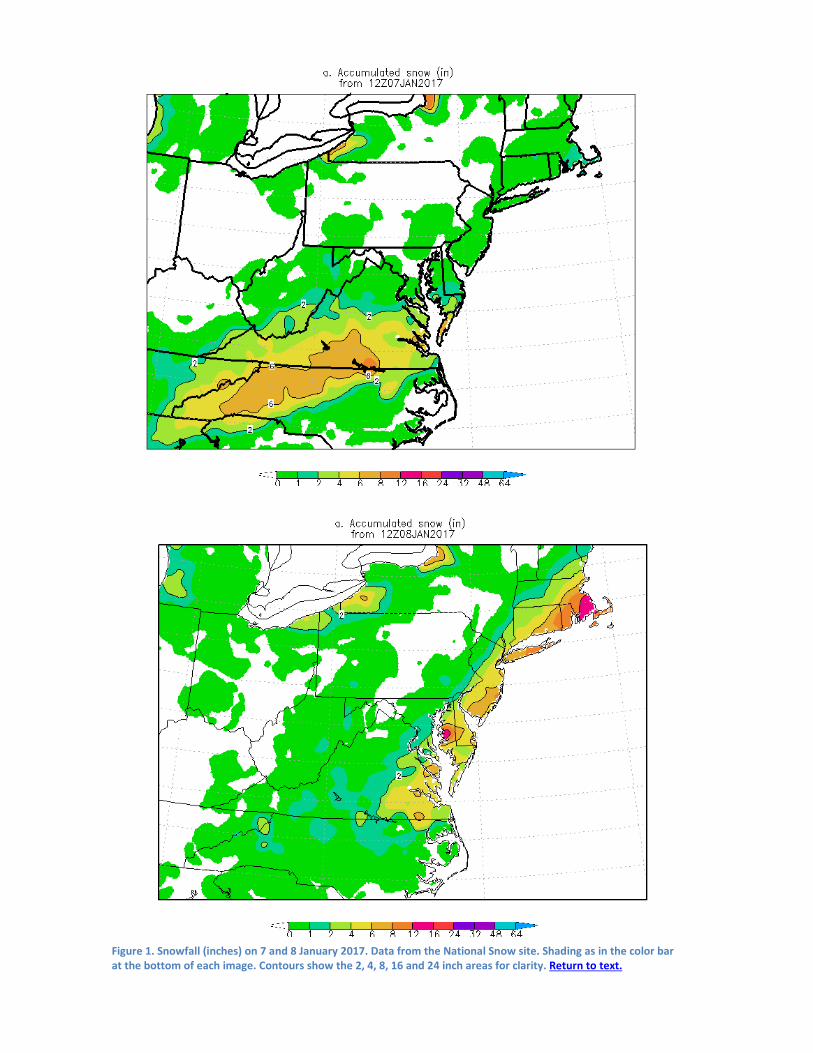
The snow was the result of a relatively deep 500 hPa low (Fig. 2a), a surge of cold arctic air into the eastern United States (Fig. 2b), a surge of deep moisture along the East Coast (Fig. 2c), an elongated low off the east coast. The snow fell in the region of strong northwesterly flow between the cyclone and the strong anticyclone to the west (Fig. 2d). Note that during the peak of the event in the southeast the 850 hPa temperatures were in the -8 to -12C range as far south as northern Georgia (Fig. 2b).
This paper will examine the East Coast Winter Storm (ECWS) of 7-8 January 2017. The focus is on the pattern and forecasts of the event. The storm occurred over a weekend which may have limited the overall impact of the storm. Additionally, with the exception of Boston, MA the major cities of the Mid-Atlantic and Northeast did not receive significant snowfall with this event.
2. Methods and data
The climate forecast system re-analysis (CFSR) and Global Forecast System (GFS) data were used to reconstruct the pattern and the standardized anomalies associated with the event. Most of the data is focused to the time leading up to the event and during the height of the event. Thus all dates will be described based on GMT times which are nearly half a day off the local calendar date.
The Stage-IV rainfall data (Seo 1998) was used to estimate the rainfall over several 6, 12 and 24, monthly, and case related discrete times to show the impact of the pattern changing rainfall event. The rainfall pattern also revealed some interesting information about the southeastern drought and how both meteorologically and climatologically significant the precipitation event of 28-30 November 2016 was for the southeastern United States.
2
Snowfall data was retrieved in GRIB2 format from the National Operational Hydrologic Remote Sensing Center. Both 24 and 48 hour GRIB2 files were retrieved. Figure 1 shows the snowfall form the 24 hour files for 7 and 8 January 2017. These data were plotted using GrADS.
Forecasts from the NCEP GEFS are the primary source here. The GEFS data was stored in GRIB2 format and processed using GrADS. Many of the images produced were produced in real-time in single panel images. They were reproduced here using a 6-panel format to facilitate the comparison of 6 GEFS forecast cycles spanning 6 days. This left the possibility of using 24 different GEFS forecast cycles. Nearly all the images shown here are either from the 0000 and 1200 UTC cycles. To get to longer ranges these data too were thinned from a potential of 12 to 6 times. Images of various other cycle times were made and showed a similar signal.
3. Results a. The Large scale pattern
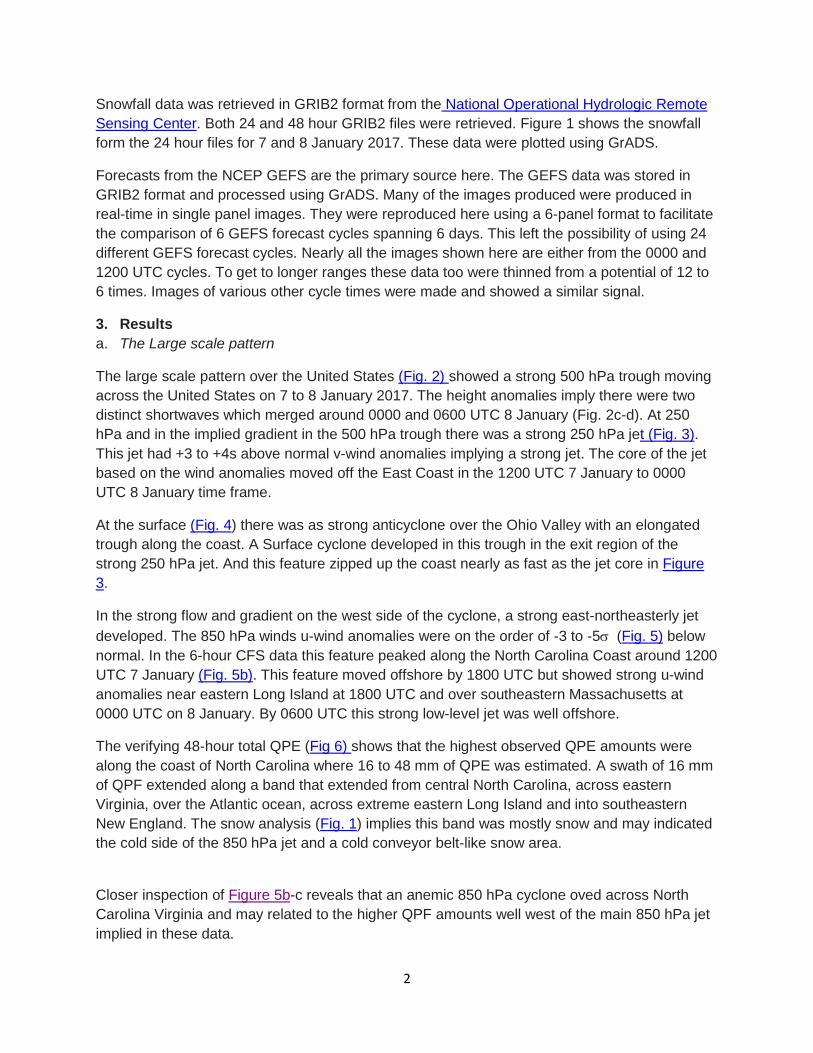
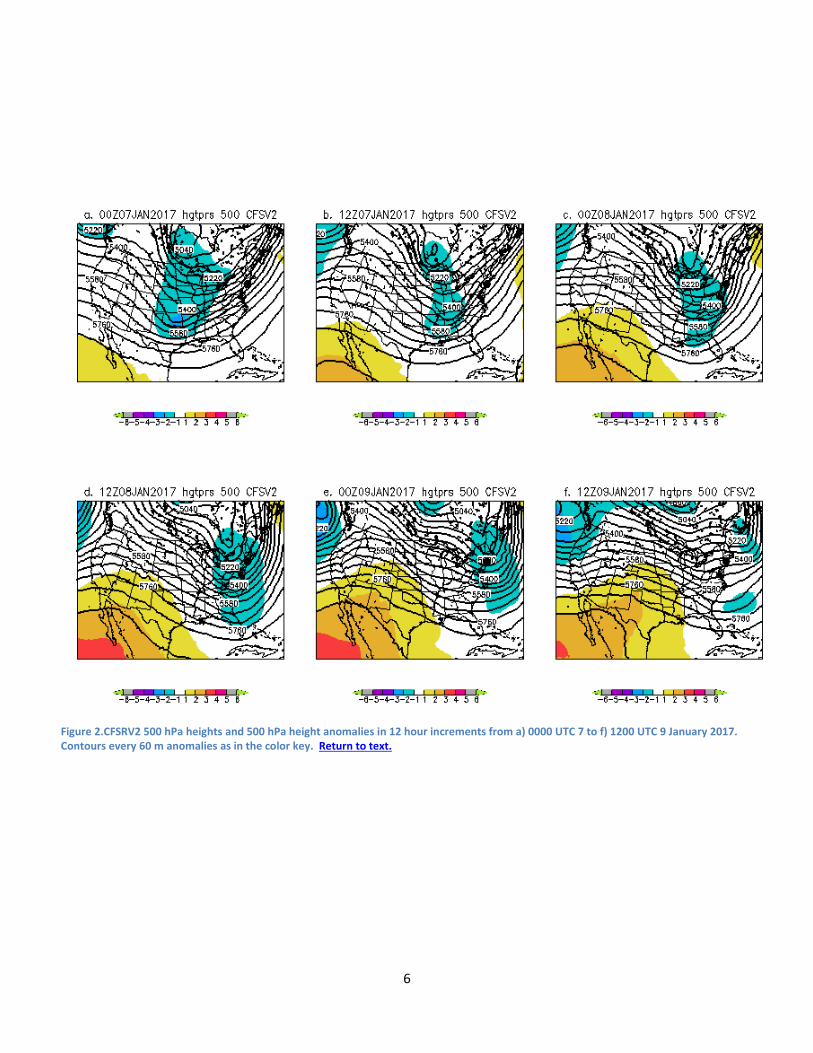
The large scale pattern over the United States (Fig. 2) showed a strong 500 hPa trough moving across the United States on 7 to 8 January 2017. The height anomalies imply there were two distinct shortwaves which merged around 0000 and 0600 UTC 8 January (Fig. 2c-d). At 250 hPa and in the implied gradient in the 500 hPa trough there was a strong 250 hPa jet (Fig. 3). This jet had +3 to +4s above normal v-wind anomalies implying a strong jet. The core of the jet based on the wind anomalies moved off the East Coast in the 1200 UTC 7 January to 0000 UTC 8 January time frame.
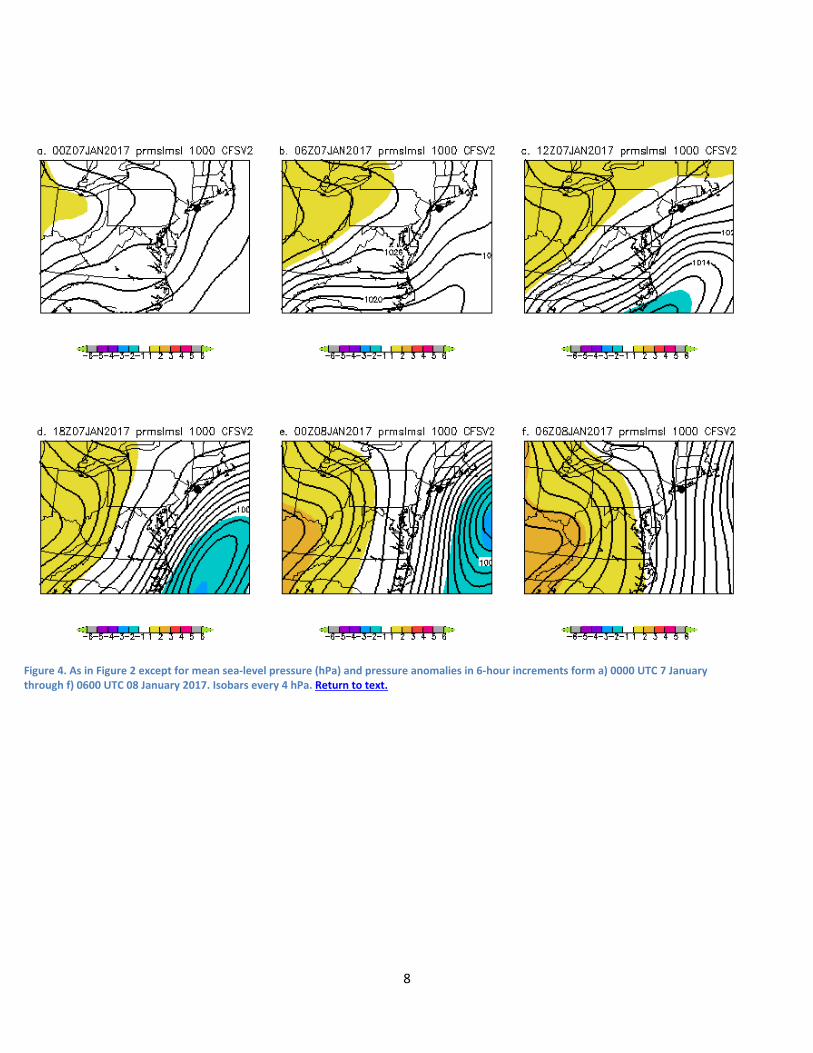
At the surface (Fig. 4) there was as strong anticyclone over the Ohio Valley with an elongated trough along the coast. A Surface cyclone developed in this trough in the exit region of the strong 250 hPa jet. And this feature zipped up the coast nearly as fast as the jet core in Figure 3.
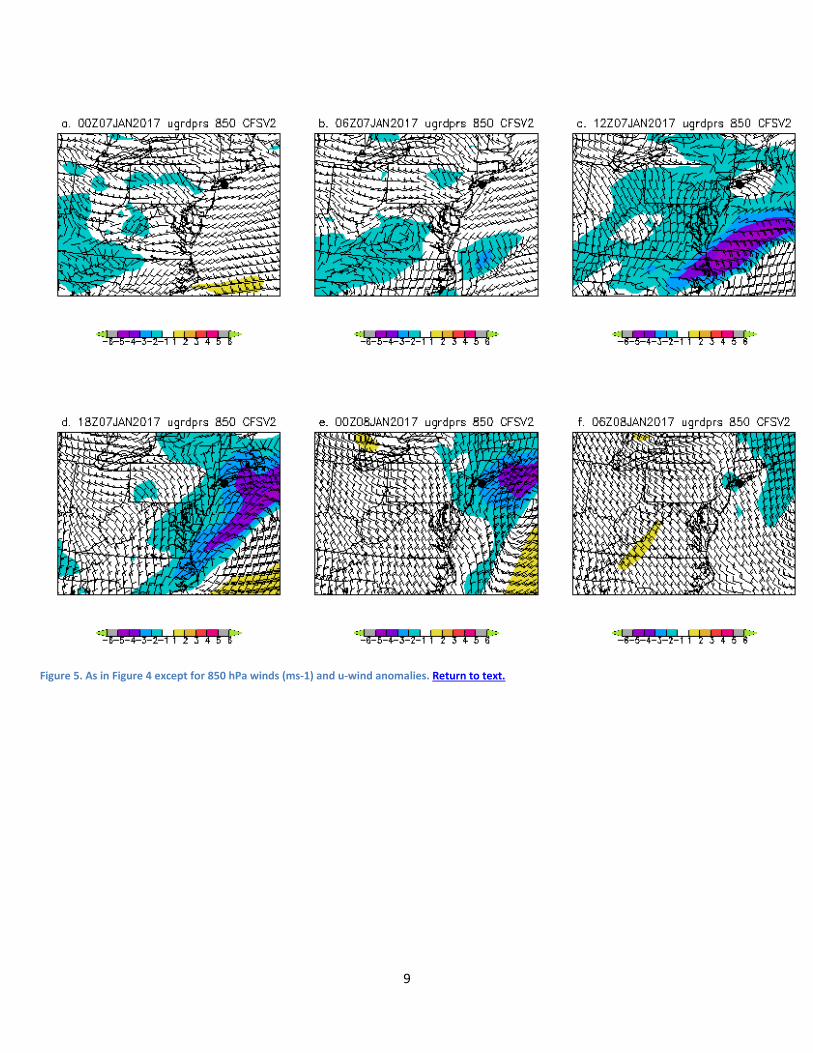
In the strong flow and gradient on the west side of the cyclone, a strong east-northeasterly jet developed. The 850 hPa winds u-wind anomalies were on the order of -3 to -5σ (Fig. 5) below normal. In the 6-hour CFS data this feature peaked along the North Carolina Coast around 1200 UTC 7 January (Fig. 5b). This feature moved offshore by 1800 UTC but showed strong u-wind anomalies near eastern Long Island at 1800 UTC and over southeastern Massachusetts at 0000 UTC on 8 January. By 0600 UTC this strong low-level jet was well offshore.
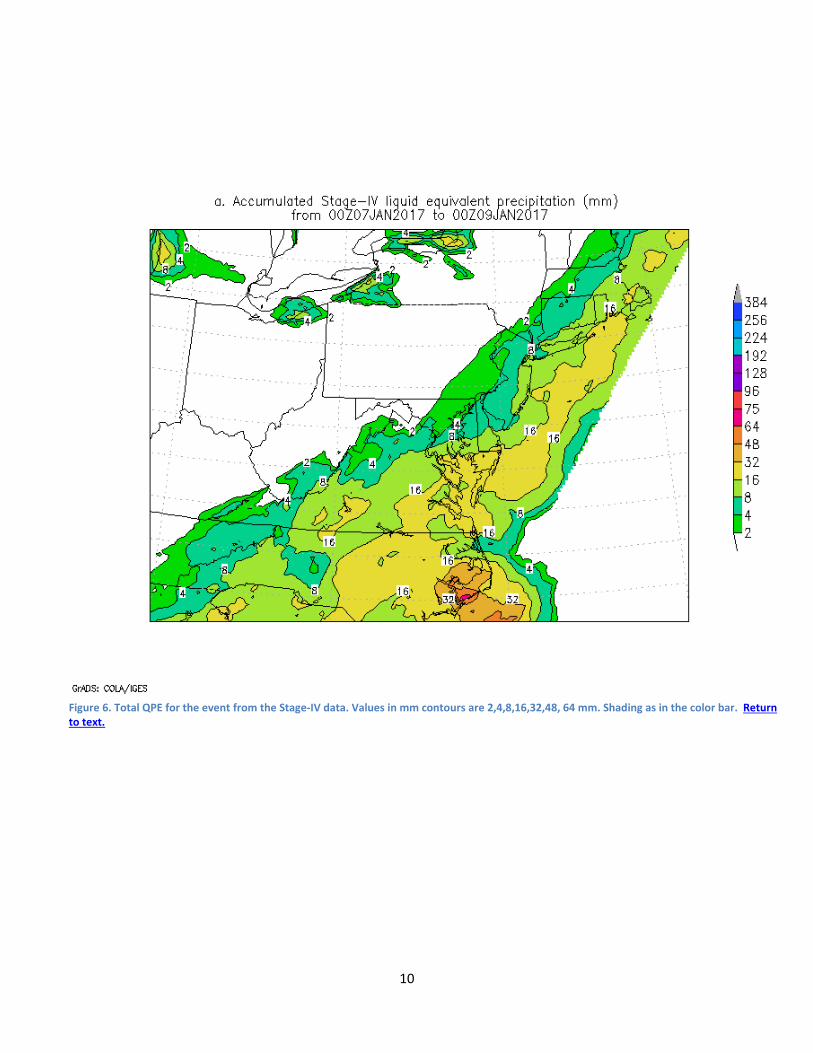
The verifying 48-hour total QPE (Fig 6) shows that the highest observed QPE amounts were along the coast of North Carolina where 16 to 48 mm of QPE was estimated. A swath of 16 mm of QPF extended along a band that extended from central North Carolina, across eastern Virginia, over the Atlantic ocean, across extreme eastern Long Island and into southeastern New England. The snow analysis (Fig. 1) implies this band was mostly snow and may indicated the cold side of the 850 hPa jet and a cold conveyor belt-like snow area.
Closer inspection of Figure 5b-c reveals that an anemic 850 hPa cyclone oved across North Carolina Virginia and may related to the higher QPF amounts well west of the main 850 hPa jet implied in these data.
3
b. Forecasts
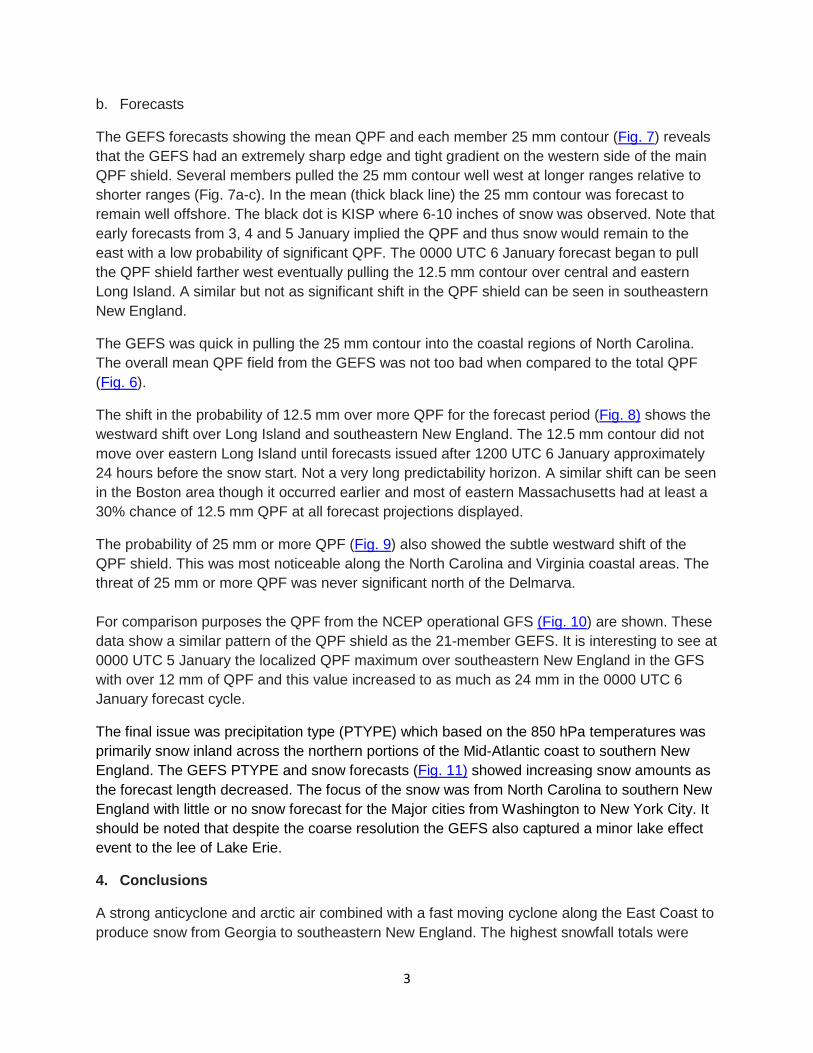
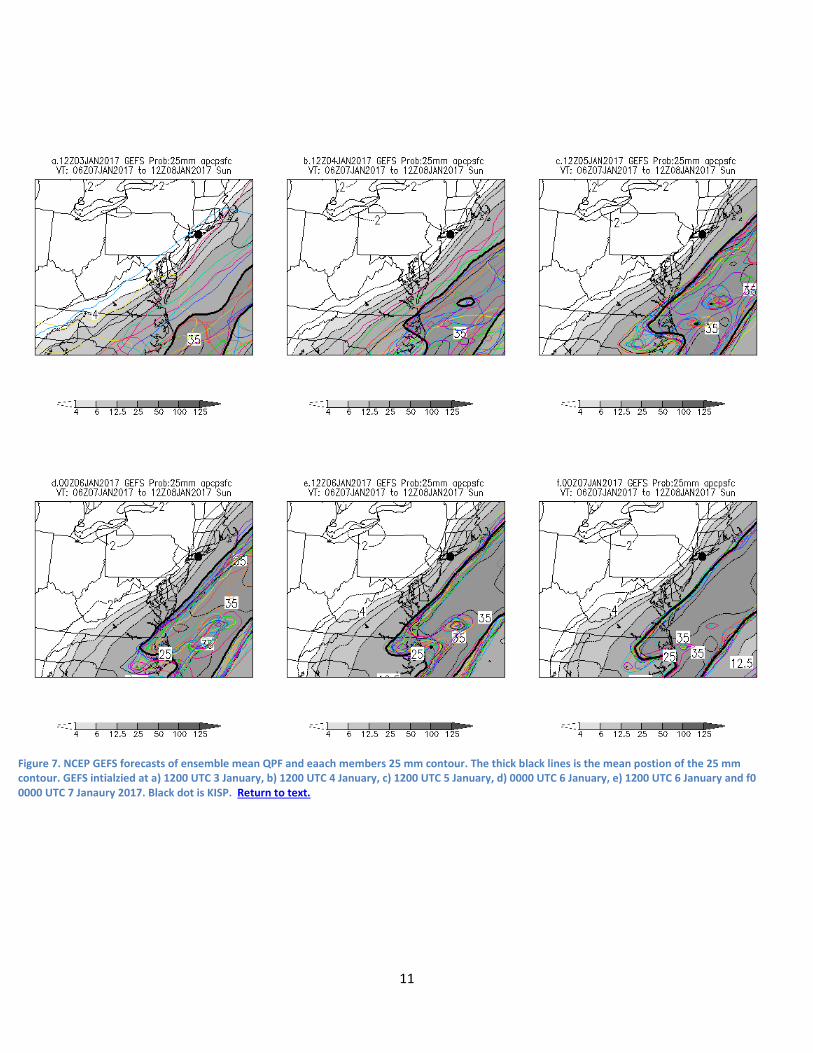
The GEFS forecasts showing the mean QPF and each member 25 mm contour (Fig. 7) reveals that the GEFS had an extremely sharp edge and tight gradient on the western side of the main QPF shield. Several members pulled the 25 mm contour well west at longer ranges relative to shorter ranges (Fig. 7a-c). In the mean (thick black line) the 25 mm contour was forecast to remain well offshore. The black dot is KISP where 6-10 inches of snow was observed. Note that early forecasts from 3, 4 and 5 January implied the QPF and thus snow would remain to the east with a low probability of significant QPF. The 0000 UTC 6 January forecast began to pull the QPF shield farther west eventually pulling the 12.5 mm contour over central and eastern Long Island. A similar but not as significant shift in the QPF shield can be seen in southeastern New England.
The GEFS was quick in pulling the 25 mm contour into the coastal regions of North Carolina. The overall mean QPF field from the GEFS was not too bad when compared to the total QPF (Fig. 6).
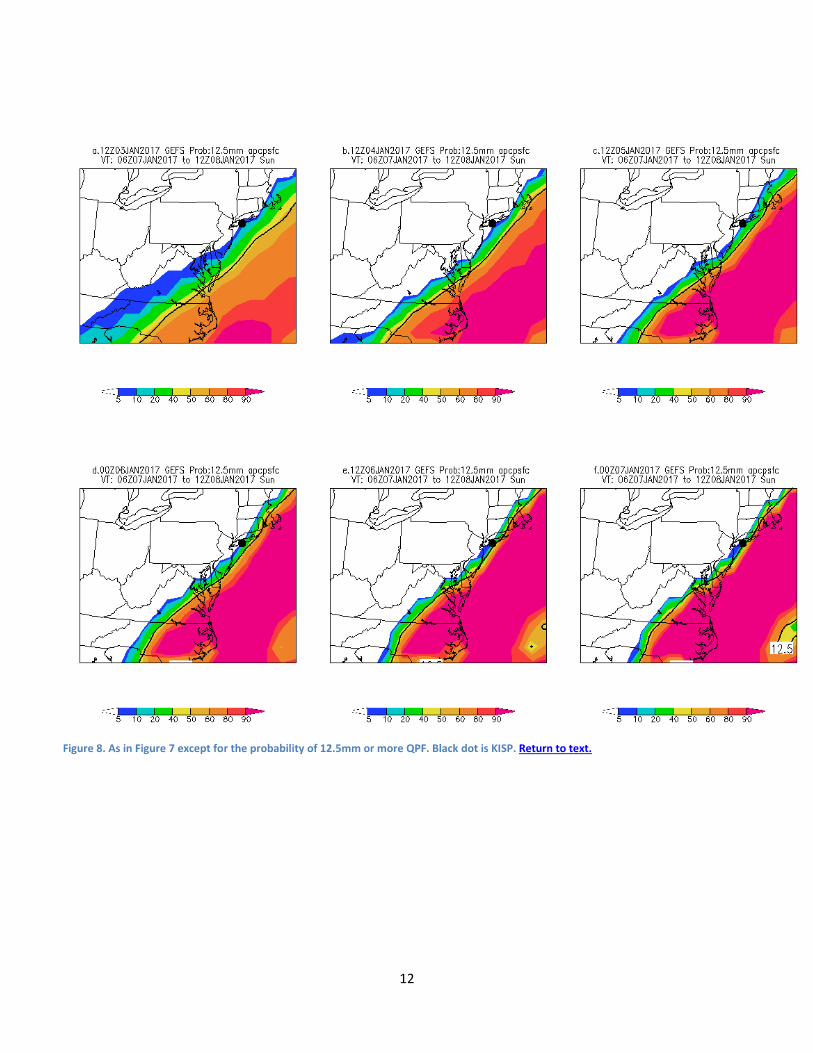
The shift in the probability of 12.5 mm over more QPF for the forecast period (Fig. 8) shows the westward shift over Long Island and southeastern New England. The 12.5 mm contour did not move over eastern Long Island until forecasts issued after 1200 UTC 6 January approximately 24 hours before the snow start. Not a very long predictability horizon. A similar shift can be seen in the Boston area though it occurred earlier and most of eastern Massachusetts had at least a 30% chance of 12.5 mm QPF at all forecast projections displayed.
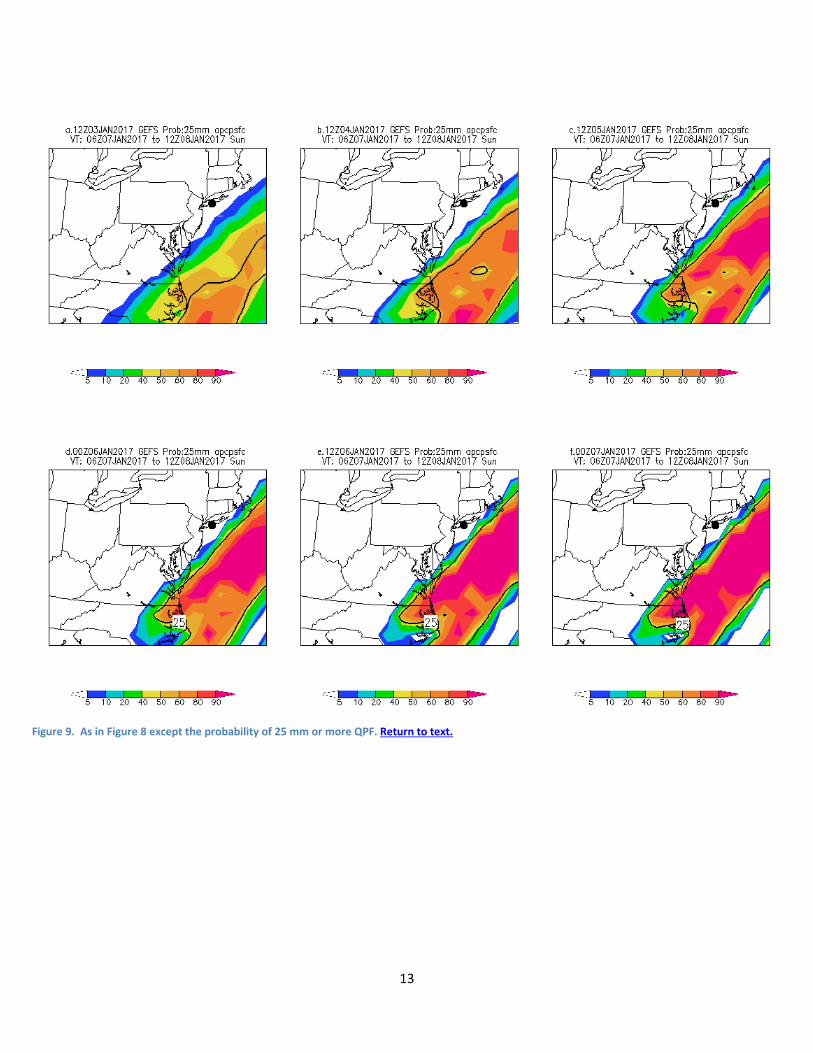
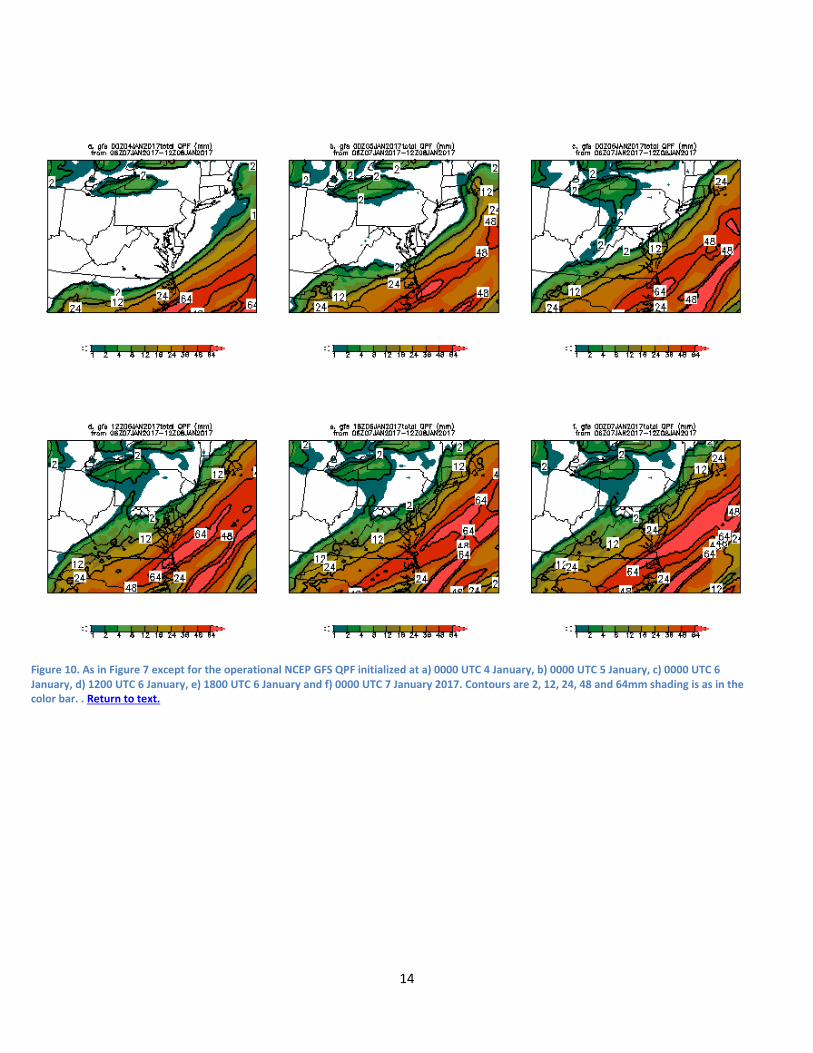
The probability of 25 mm or more QPF (Fig. 9) also showed the subtle westward shift of the QPF shield. This was most noticeable along the North Carolina and Virginia coastal areas. The threat of 25 mm or more QPF was never significant north of the Delmarva. For comparison purposes the QPF from the NCEP operational GFS (Fig. 10) are shown. These data show a similar pattern of the QPF shield as the 21-member GEFS. It is interesting to see at 0000 UTC 5 January the localized QPF maximum over southeastern New England in the GFS with over 12 mm of QPF and this value increased to as much as 24 mm in the 0000 UTC 6 January forecast cycle.
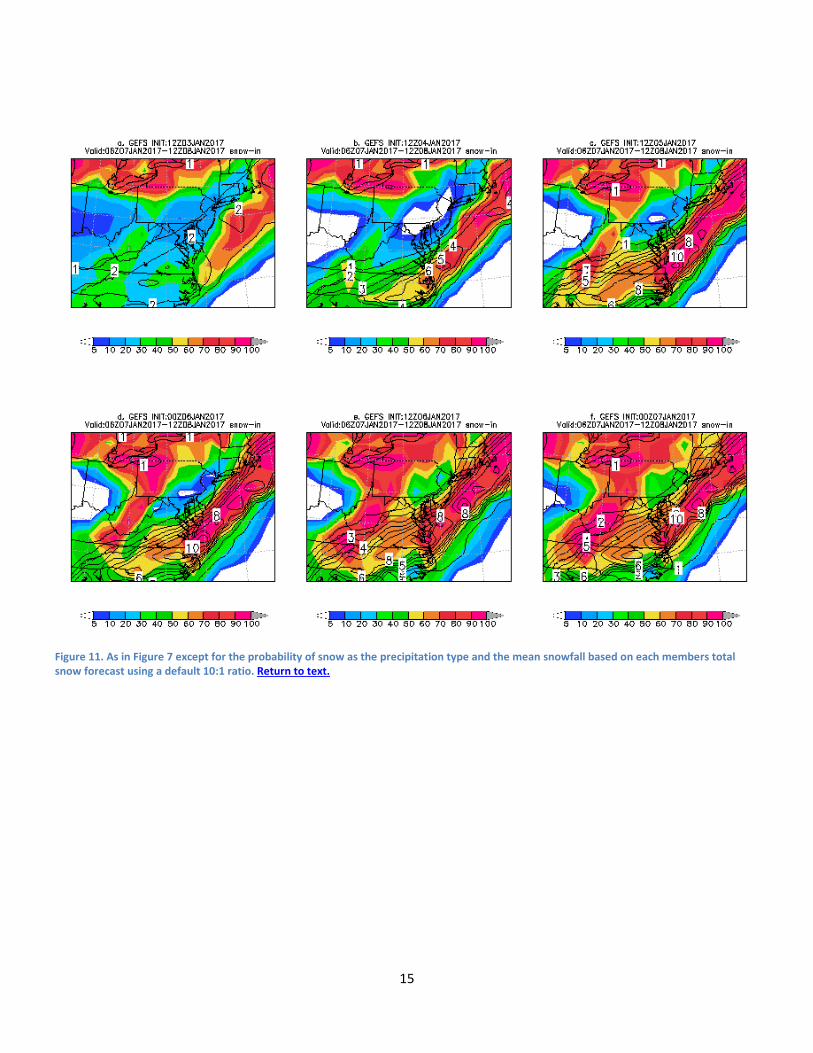
The final issue was precipitation type (PTYPE) which based on the 850 hPa temperatures was primarily snow inland across the northern portions of the Mid-Atlantic coast to southern New England. The GEFS PTYPE and snow forecasts (Fig. 11) showed increasing snow amounts as the forecast length decreased. The focus of the snow was from North Carolina to southern New England with little or no snow forecast for the Major cities from Washington to New York City. It should be noted that despite the coarse resolution the GEFS also captured a minor lake effect event to the lee of Lake Erie.
4. Conclusions
A strong anticyclone and arctic air combined with a fast moving cyclone along the East Coast to produce snow from Georgia to southeastern New England. The highest snowfall totals were
4
observed over southeastern New England where some locations had close to 20 inches of snow. Heavy snow was also observed over Long Island and from Central North Carolina across portions of Virginia, Maryland, Delaware and New Jersey. Most of the densely populated cities had lighter snowfall amounts
The GEFS did a relatively good job forecasting the potential for QPF to produce snow and the high probability of snow in the south and along the coast of New York and New England. Figure 7 shows the QPF field with a narrow band of 16 mm or more QPF from North Carolina to southeastern New England. This enhanced band was mainly forecast to be in the form of snow (Fig. 10). It was relatively well aligned and on the west side of the strong 850 hPa jet on the cold side of the surface cyclone. The higher QPF amounts were mainly in the form of rain along the North Carolina coast where over 32 mm and locally 48 mm of QPE was observed (Fig. 6).
There was considerable uncertainty as to how far west the snow shield would be from Maryland to New England. On the edges there was a subtle shift in the probability of 12.5 mm over more QPF for as forecast length decreased (Fig. 8). Note the subtle westward shift over Long Island and southeastern New England. The 12.5 mm contour did not move over eastern Long Island until forecasts issued after 1200 UTC 6 January approximately 24 hours before the snow start. Not a very long predictability horizon. A similar shift can be seen in the Boston area though it occurred earlier and most of eastern Massachusetts had at least a 30% chance of 12.5 mm QPF at all forecast projections displayed. The operational GFS (Fig. 9) showed a longer lead-time with the threat of higher QPF amounts over southern New England.
Based on the QPE and QPF the higher snow amounts were likely due to the cold temperatures and snow ratios well above the first guess 10:1 values on Long Island and southern New England. The single GFS, likely due to higher resolution and absent averaging, had higher QPF amounts relative to the GEFS. This was quite noticeable in the GFS forecasts over southeastern New England.
Overall, with some nuisances with the western edge of the snow shield and precipitation type issues over eastern North Carolina, this was a relatively well predicted event. Though not examined here there were significant ice pellet and freezing rain issues from Georgia to eastern North Carolina which limited snow amounts significantly over portions of eastern North Carolina. The northwestern edges had snowfall amount issues while the regions closer to the ocean in the southeast had precipitation type issues.
5. References
Seo, D.-J., C.R. Kondragunta, K. Howard, S.V. Vasiloff and J. Zhang, 2005: The National Mosaic and Multisensor QPE (NMQ) Project—Status and plans for a community testbed for high-resolution multisensor quantitative precipitation estimation (QPE) over the United States. Preprints, AMS 19th Conference on Hydrology, San Diego, CA. Paper 1.3.
5
Figure 1. Snowfall (inches) on 7 and 8 January 2017. Data from the National Snow site. Shading as in the color bar at the bottom of each image. Contours show the 2, 4, 8, 16 and 24 inch areas for clarity. Return to text.
6
Figure 2.CFSRV2 500 hPa heights and 500 hPa height anomalies in 12 hour increments from a) 0000 UTC 7 to f) 1200 UTC 9 January 2017. Contours every 60 m anomalies as in the color key. Return to text.
7
Figure 3 As in Figure 2 except for 250 hpa winds (ms-1) and v-wind anomalies. Return to text.
8
Figure 4. As in Figure 2 except for mean sea-level pressure (hPa) and pressure anomalies in 6-hour increments form a) 0000 UTC 7 January through f) 0600 UTC 08 January 2017. Isobars every 4 hPa. Return to text.
9
Figure 5. As in Figure 4 except for 850 hPa winds (ms-1) and u-wind anomalies. Return to text.
10
Figure 6. Total QPE for the event from the Stage-IV data. Values in mm contours are 2,4,8,16,32,48, 64 mm. Shading as in the color bar. Return to text.
11
Figure 7. NCEP GEFS forecasts of ensemble mean QPF and eaach members 25 mm contour. The thick black lines is the mean postion of the 25 mm contour. GEFS intialzied at a) 1200 UTC 3 January, b) 1200 UTC 4 January, c) 1200 UTC 5 January, d) 0000 UTC 6 January, e) 1200 UTC 6 January and f0 0000 UTC 7 Janaury 2017. Black dot is KISP. Return to text.
12
Figure 8. As in Figure 7 except for the probability of 12.5mm or more QPF. Black dot is KISP. Return to text.
13
Figure 9. As in Figure 8 except the probability of 25 mm or more QPF. Return to text.
14
Figure 10. As in Figure 7 except for the operational NCEP GFS QPF initialized at a) 0000 UTC 4 January, b) 0000 UTC 5 January, c) 0000 UTC 6 January, d) 1200 UTC 6 January, e) 1800 UTC 6 January and f) 0000 UTC 7 January 2017. Contours are 2, 12, 24, 48 and 64mm shading is as in the color bar. . Return to text.
15
Figure 11. As in Figure 7 except for the probability of snow as the precipitation type and the mean snowfall based on each members total snow forecast using a default 10:1 ratio. Return to text.

16
17
Town State County Snow (in) ORIENT NY Suffolk 12.5 MATTITUCK NY Suffolk 10.9 YAPHANK NY Suffolk 10.8 RIVERHEAD NY Suffolk 10.8 BAITING HOLLOW NY Suffolk 10.7 UPTON NY Suffolk 10.6 LAUREL NY Suffolk 10.5 CORAM NY Suffolk 10.3 CALVERTON NY Suffolk 10.2 SMITHTOWN NY Suffolk 10.1 HUNTINGTON NY Suffolk 10.1 EAST SHOREHAM NY Suffolk 10.1 1 SSW NESCONSET NY Suffolk 10 MILLER PLACE NY Suffolk 10 FARMINGVILLE NY Suffolk 9.9 DIX HILLS NY Suffolk 9.9 SOUTHAMPTON NY Suffolk 9.7 STONY BROOK NY Suffolk 9.7 ISLIP AIRPORT NY Suffolk 9.7 PORT JEFFERSON STATI NY Suffolk 9.7 STONY BROOK NY Suffolk 9.6 3 NNE NORWICH CT New London 9.5 LAKE RONKONKOMA NY Suffolk 9.5 SOUTH HUNTINGTON NY Suffolk 9.5 EAST NORTHPORT NY Suffolk 9.5 HICKSVILLE NY Nassau 9.2 LINDENHURST NY Suffolk 9.2 BAY SHORE NY Suffolk 9.2 1 NNE SOUTHOLD NY Suffolk 9.2 PLAINVIEW NY Nassau 9.1 ISLIP NY Suffolk 9 Table 1. Brookhaven office snowfall reports by town, state, and county. Sorted highest to lowest with no snowfall amount less than 9 inches displayed. Return to text
18
Town State County Snow (in) EAST BRIDGEWATER MA Plymouth 19.5 PLYMOUTH MA Plymouth 19.1 WEST WAREHAM MA Plymouth 18.1 WHITMAN MA Plymouth 18 MIDDLEBORO MA Plymouth 18 NORTH PLYMOUTH MA Plymouth 17 ROCKLAND MA Plymouth 17 HANOVER MA Plymouth 17 ACUSHNET MA Bristol 16.5 SOUTH WEYMOUTH MA Norfolk 16.5 WEYMOUTH MA Norfolk 16.5 BROCKTON MA Plymouth 16.4 KINGSTON MA Plymouth 16.2 NEW BEDFORD MA Bristol 16 DARTMOUTH MA Bristol 16 EAST FREETOWN MA Bristol 15.5 OAK BLUFFS MA Dukes 15.5 SHARON MA Norfolk 15.5 WESTERLY RI Washington 15.5 FREETOWN MA Bristol 15.1 ROCHESTER MA Plymouth 15 MARION MA Plymouth 15 BLOCK ISLAND RI Washington 15 SOUTH CHATHAM MA Barnstable 14.5 EAST HARWICH MA Barnstable 14.5 MIDDLETOWN RI Newport 14.3 MASHPEE NECK MA Barnstable 14 ACUSHNET - NORTH MA Bristol 14 WEST ACUSHNET MA Bristol 14 7 S PLYMOUTH MA Plymouth 14 BOURNE MA Barnstable 13.8 SANDWICH MA Barnstable 13.5 NORTH WEYMOUTH MA Norfolk 13.5 FAIRHAVEN-POPE BEACH MA Bristol 13.3 TAUNTON MA Bristol 13.3 EAST SANDWICH MA Barnstable 13.2 3 NW TAUNTON MA Bristol 13.1 ORLEANS MA Barnstable 13
19
HARWICH MA Barnstable 13 MARSTONS MILLS MA Barnstable 13 WEST HARWICH MA Barnstable 13 EAST FALMOUTH MA Barnstable 13 WESTPORT MA Bristol 13 NORTON MA Bristol 13 HOLBROOK MA Norfolk 13 BRIDGEWATER MA Plymouth 13 PEMBROKE MA Plymouth 13 CENTERVILLE MA Barnstable 12.9 4 NW TAUNTON MA Bristol 12.9 HULL MA Plymouth 12.6 SOUTH YARMOUTH MA Barnstable 12.5 MANSFIELD MA Bristol 12.5 WEST WARWICK RI Kent 12.3 SOUTH KINGSTOWN RI Washington 12.2 EAST GREENWICH RI Kent 12 Table 2. Snowfall reported by the NWS in Boston showing snowfall for all locations with over 12 inches of snowfall. Return to text.

20

21