Embed Size (px)
Citation preview

May, 2004
East Asian Trade Relations in the Wake of China’s WTO Accession
David Roland-HolstUC Berkeley and Mills College
Evolution of Trade and Foreign Direct Investment in the Asia-PacificA Dissemination Workshop for the Center for Global Partnership (CGP) Project,
“China, Japan, and the United States: Emergent Trilateralism in the Pacific Economy”CGP Headquarters, Tokyo

May, 2004 D. Roland-Holst
Contents
I. China’s Emergence and the Asian Trade Triangle: Projections to 2020
II. East and Southeast Asian Regionalism III. Global Supply NetworksIV. A New Perspective on Regional Comparative
AdvantageV. Labor Market Determinants of China’s
Comparative Advantage
May, 2004 D. Roland-Holst
Introduction
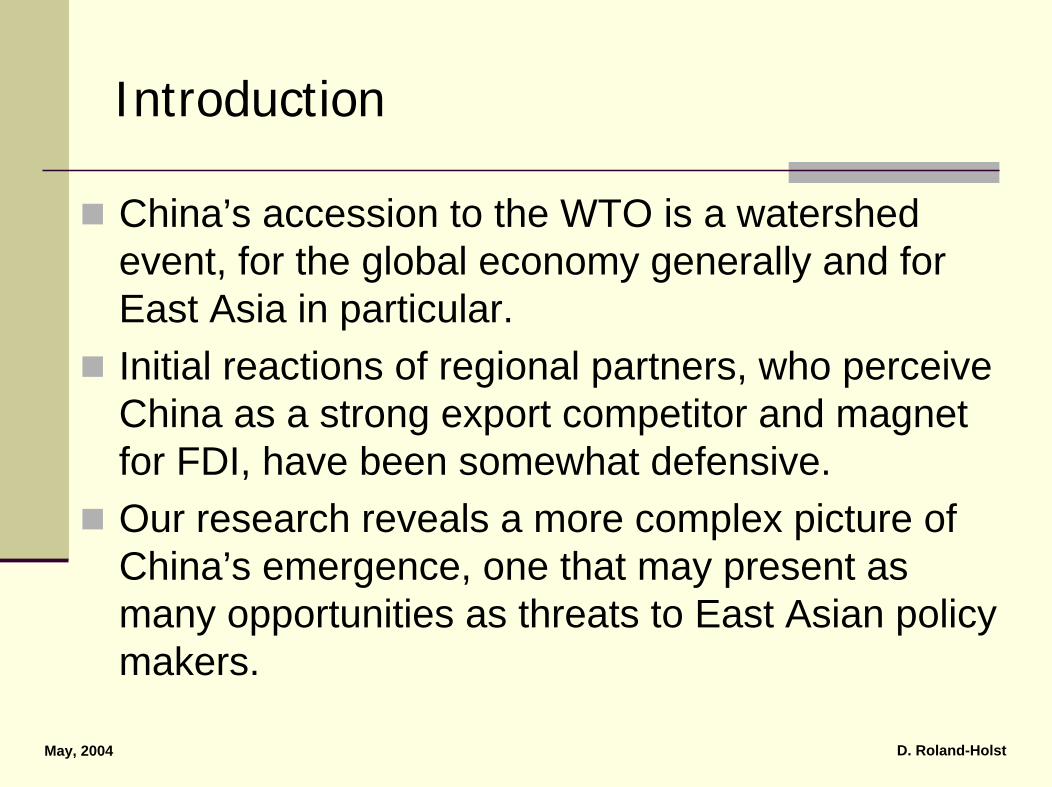
China’s accession to the WTO is a watershed event, for the global economy generally and for East Asia in particular. Initial reactions of regional partners, who perceive China as a strong export competitor and magnet for FDI, have been somewhat defensive. Our research reveals a more complex picture of China’s emergence, one that may present as many opportunities as threats to East Asian policy makers.

May, 2004 D. Roland-Holst
Introduction
Because of its size and stage of development, China will play two roles in the region with unusual prominence. 1. It will stiffen export competition in a broad
spectrum of products, particularly in extra-regional markets.
2. The growth of China’s economy will make it the region’s largest importer, and this absorption will create unprecedented opportunities for regional exporters.

May, 2004 D. Roland-Holst
I. China’s Emergence and the Asian Trade Triangle
Projections to 2020Using a global forecasting model.

May, 2004 D. Roland-Holst
Real GDP Growth(Normalized to 100 in 2000)
0
50
100
150
200
250
300
350
400
450
2005 2010 2015 2020
China
Japan
NIE
ASEAN

May, 2004 D. Roland-Holst
Real GDP(billions of 1997 USD)
0
1000
2000
3000
4000
5000
6000
7000
2005 2010 2015 2020
China
Japan
NIE
ASEAN

May, 2004 D. Roland-Holst
Real Exports(billions of 1997 USD)
300
400
500
600
700
800
900
1000
1100
1200
2005 2010 2015 2020
China
Japan
NIE
ASEAN

May, 2004 D. Roland-Holst
Real Imports(billions of 1997 USD)
300
400
500
600
700
800
900
1000
1100
1200
2005 2010 2015 2020
China
Japan
NIE
ASEAN

May, 2004 D. Roland-Holst
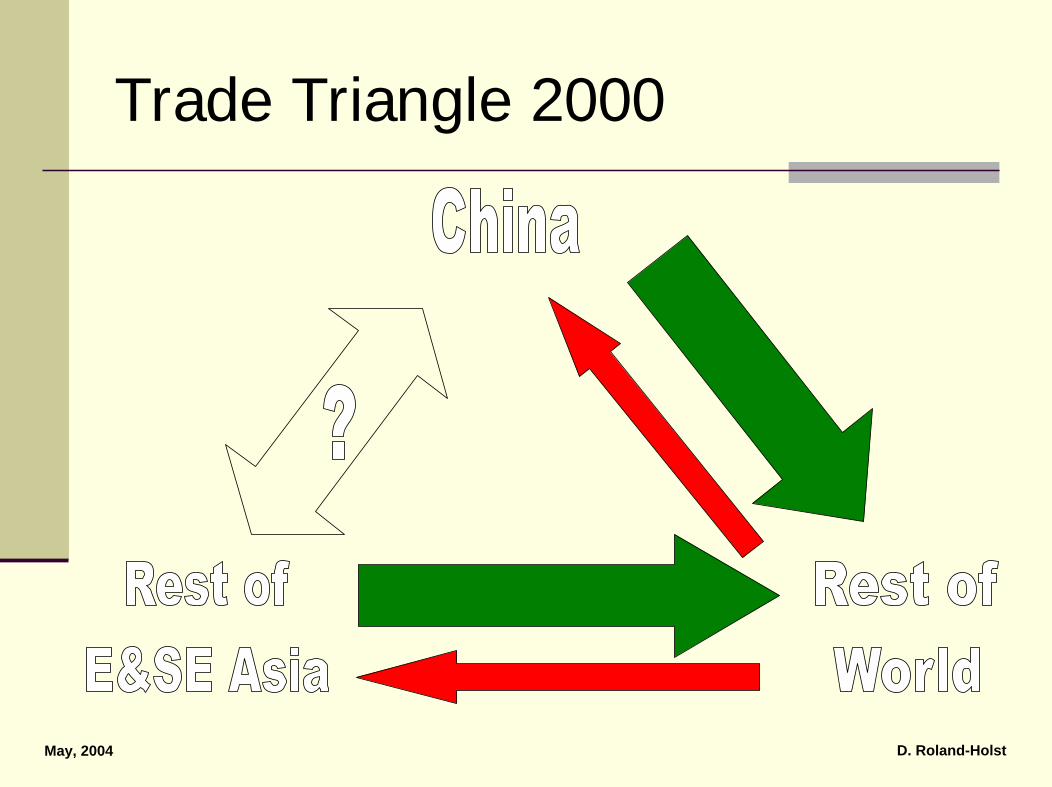
The Asian Trade Triangle
These forecasts indicate the emergence of a systematic pattern of triangular trade between China, the Rest of East and Southeast Asia, and the Rest of the WorldThis Trade Triangle reveals that China’s export expansion offers significant growth leverage to its neighbors. Chinese absorption will emerge to dominate regional demand. Provided Asian economies do not isolate themselves from this process, the net effect of China’s growth can be hugely positive.
May, 2004 D. Roland-Holst
Trade Triangle 2000

May, 2004 D. Roland-Holst
Trade Triangle 2020
May, 2004 D. Roland-Holst
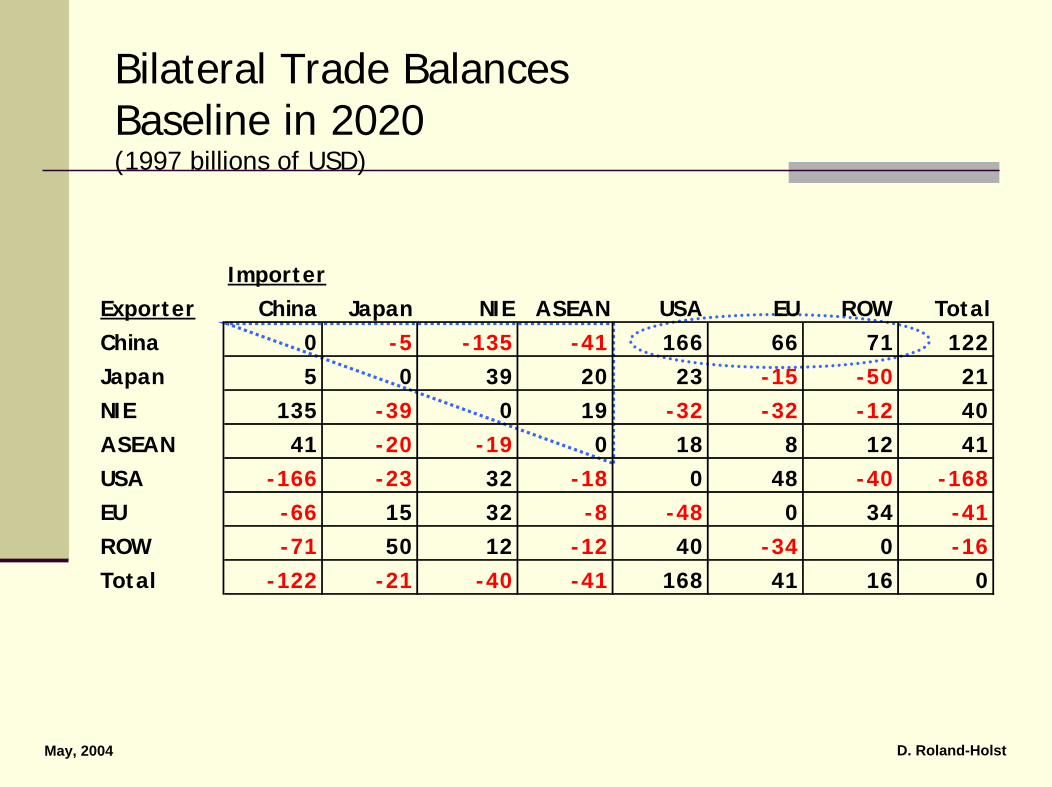
Bilateral Trade BalancesBaseline in 2020(1997 billions of USD)
ImporterExporter China Japan NIE ASEAN USA EU ROW TotalChina 0 -5 -135 -41 166 66 71 122Japan 5 0 39 20 23 -15 -50 21NIE 135 -39 0 19 -32 -32 -12 40ASEAN 41 -20 -19 0 18 8 12 41USA -166 -23 32 -18 0 48 -40 -168EU -66 15 32 -8 -48 0 34 -41ROW -71 50 12 -12 40 -34 0 -16Total -122 -21 -40 -41 168 41 16 0

May, 2004 D. Roland-Holst
II. Regional Strategic Scenarios
How can regional economies best respond to China’s global initiative?
A variety of alternative regional arrangements were examined empirically. All include the first scenario.
1. CNWTO: China joins WTO, status quo elsewhere2. AFTA: ASEAN Free Trade Area 3. AFTAPC: AFTA plus China4. NEAFTA: Northeast Asian Free Trade Area
- China, Japan, and Korea5. ASEAN+3: ASEAN, China, Japan, and Korea6. PAC3: Pacific Trilateralism - China, Japan, USA7. GTL: Global Trade Liberalization

May, 2004 D. Roland-Holst
Exports(percentage change from Baseline in 2020)
-5
0
5
10
15
20
25
30
35
40
45
CNWTO AFTA AFTAPC NEAFTA ASEAN+3 PAC3 GTL
ChinaJapanNIEASEANUSAEUROW

May, 2004 D. Roland-Holst
The “China Threat”Bilateral Trade Growth: CNWTO(percentage changes in 2020, relative to Baseline)
ImporterExporter China Japan NIE ASEAN USA EU ROW TotalChina 0 37 43 36 31 35 32 34Japan 38 -5 -4 -6 -7 -5 -5 3NIE 32 -10 -7 -11 -13 -10 -10 3ASEAN 28 -4 -1 -2 -5 -3 -4 1usa 24 -1 1 -1 0 -1 -1 1EU 22 -0 1 -1 -2 -1 -2 -0ROW 13 -0 2 2 -2 -1 -1 -0Grand Tot 26 5 6 2 2 0 1 3
May, 2004 D. Roland-Holst
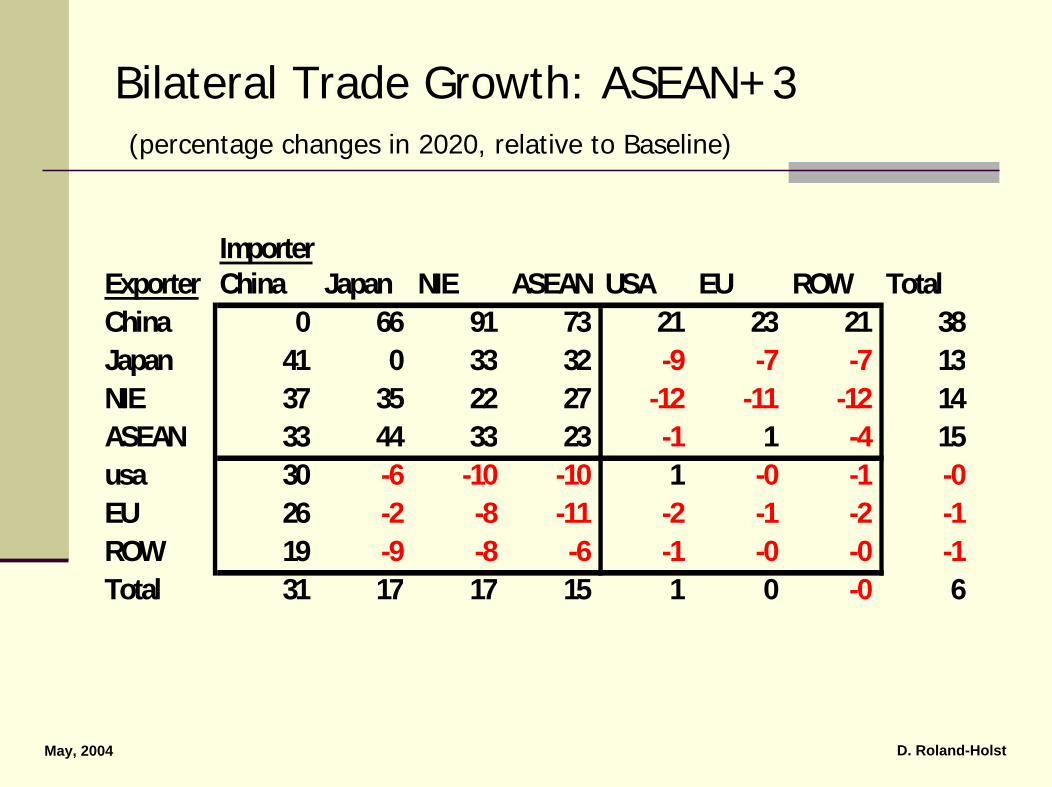
Bilateral Trade Growth: ASEAN+3(percentage changes in 2020, relative to Baseline)
ImporterExporter China Japan NIE ASEAN USA EU ROW TotalChina 0 66 91 73 21 23 21 38Japan 41 0 33 32 -9 -7 -7 13NIE 37 35 22 27 -12 -11 -12 14ASEAN 33 44 33 23 -1 1 -4 15usa 30 -6 -10 -10 1 -0 -1 -0EU 26 -2 -8 -11 -2 -1 -2 -1ROW 19 -9 -8 -6 -1 -0 -0 -1Total 31 17 17 15 1 0 -0 6

May, 2004 D. Roland-Holst
Regionalism and China
China is in a relatively unique position. This country can apparently “go it alone” to globalization. It also possesses two carrots and one stick in regional negotiations:
Carrots: Access to domestic market and the “bandwagon” effect, selling into China’s export growth.Stick: Denial of access.
However, this strategic leverage appears to be limited for two reasons:
Chinese imports are essential to its export capacityWTO standards will not sustain exclusion

May, 2004 D. Roland-Holst
Regionalism and Globalism
East and Southeast Asia can capture most of the absolute export growth expected from full globalization by just forming ASEAN+3.Thus, head-to-head export global competition is less important than leveraging opportunities presented by East Asia’s fastest growing internal market.The best strategy for East and Southeast Asia is to pursue globalism through more comprehensive regionalism.
May, 2004 D. Roland-Holst
III. Global Supply Networks
Supply chain decomposition is one of the most dramatic features of globalization, particularly in E&SE Asia. This propagation of multinational supply networks is changing the Asian economic landscape in four ways:
1. Capital allocation2. Production patterns3. Trade4. The development process itself

May, 2004 D. Roland-Holst
1. Capital Allocation
FDI across the supply chain is driven by:Resource costs (the traditional explanation)Rent seeking and other institutional imperfectionsMarket access: double targetingProximate marketsPortfolio decisions
risk managementasset allocation

May, 2004 D. Roland-Holst
2. Production Patterns: Regional Hierarchy and FDI Competition
Regional hierarchies are being expanded according to the characteristics of FDI.Countries are increasingly FDI “quality”conscious.They are competing for FDI with financial incentives and real policies toward human capital and infrastructure.

May, 2004 D. Roland-Holst
3. Trade: Multilateralism in Bilateralism
Bilateral linkages often reflect components of more extended, multilateral supply chains.Our results indicate that over one third of total value creation in bilateral ties actually arises from multilateral network linkages.This is due mainly to trade in intermediates.Intermediate trade is growing faster than final goods trade, and will ultimately dominate as it does in the EU.

May, 2004 D. Roland-Holst
4. Development Process: Bamboo Capitalism
From the nodes in an ever-expanding root system of intermediate supply, independent producers and even complete local markets emerge to join the dynamic of regional competition and innovation.Microeconomic replication of this kind is accelerating and diversifying growth, overcoming exactly the specialization tendencies dictated by traditional comparative advantage.Regional economies are thereby becoming more diversified, balanced in their growth properties, and convergent in economic structure.

May, 2004 D. Roland-Holst
IV. A New Perspective on Regional Comparative Advantage
Exhaustive analysis of trade flow data can reveal emergent patterns of commodity trade, but not the underlying sources of comparative advantage.In the long run, capital is mobile and wage differentials can only be sustained by productivity differences.Therefore, the skill content of trade is an essential determinant of real comparative advantage.

May, 2004 D. Roland-Holst
Relative Skill Content of Output
To elucidate this issue, trade flow data were adjusted to capture differences in embodied labor services.In particular, for country k and sector i, we define
where LVA denotes labor value added for each sector and country. This measure indicates the relative skill content, per unit of output, and is independent of exchange rates.
ki
kik
i UnskilledLVASkilledLVA
)()(
=λ

May, 2004 D. Roland-Holst
Skill-adjusted Trade FlowsWe now adjust a traditional Intra-industry trade flow measure
for skill content, i.e.
an index (between -1 and 1) of the relative export or import orientation of embodied labor service trade. Here the variable Ei
km denotes exports from k to m of sector i goods.
mki
mi
kmi
ki
mki
mi
kmi
kikm
i EEEEELT
λλλλ
+−
=
mki
kmi
mki
kmikm
i EEEEIIC
+−
=

May, 2004 D. Roland-Holst
Export and Import Orientation of Trade in Goods and Labor Services
JAPANTrade Weighted Percentages
IIT: Intra-industry Commodity TradeChina Japan NIE ASEAN USA EU Total
Strong Import 54 0 25 46 27 34 359 0 6 4 10 15 7
Neutral 3 0 57 5 16 6 928 0 11 44 42 35 43
Strong Export 6 0 0 2 4 10 5Total 100 0 100 100 100 100 100
ELT: Embodied Labor TradeChina Japan NIE ASEAN USA EU Total
Strong Import 23 0 14 21 8 12 134 0 2 0 5 9 2
Neutral 4 0 27 4 10 3 43 0 50 56 51 34 14
Strong Export 66 0 7 18 25 41 66Total 100 0 100 100 100 100 100

May, 2004 D. Roland-Holst
Export and Import Orientation of Trade in Goods and Labor Services
ASEANTrade Weighted Percentages
IIT: Intra-industry Commodity TradeChina Japan NIE ASEAN USA EU Total
Strong Import 13 20 28 0 13 17 512 73 53 0 13 11 10
Neutral 11 4 16 0 48 15 7455 1 1 0 21 54 8
Strong Export 9 1 3 0 5 3 2Total 100 100 100 0 100 100 100
ELT: Embodied Labor TradeChina Japan NIE ASEAN USA EU Total
Strong Import 6 48 57 0 10 10 15 27 24 0 42 14 8
Neutral 6 4 1 0 29 57 4856 0 2 0 7 6 35
Strong Export 26 21 17 0 12 14 8Total 100 100 100 0 100 100 100

May, 2004 D. Roland-Holst
Export and Import Orientation of Trade in Goods and Labor Services
CHINATrade Weighted Percentages
IIT: Intra-industry Commodity TradeChina Japan NIE ASEAN USA EU Total
Strong Import 0 18 83 26 5 5 30 48 11 55 1 8 18
Neutral 0 3 2 8 7 52 490 5 2 6 43 7 26
Strong Export 0 26 2 5 44 28 5Total 0 100 100 100 100 100 100
ELT: Embodied Labor TradeChina Japan NIE ASEAN USA EU Total
Strong Import 0 66 86 26 6 14 50 3 8 56 42 54 41
Neutral 0 4 2 7 8 3 240 4 1 5 7 7 23
Strong Export 0 23 2 6 38 22 7Total 0 100 100 100 100 100 100

May, 2004 D. Roland-Holst
V. Labor Market Determinants of China’s Comparative Advantage
In this age of capital mobility, employment patterns are more important determinants of comparative advantage.Labor markets are dynamic in nature, however, and changing demand and supply conditions can shift comparative advantage decisively.

May, 2004 D. Roland-Holst
China’s Labor Markets
In China, labor is the ultimate source of comparative advantage. Domestic labor allocation patterns appear to be changing in important ways, however:
Rural to Urban migration is continuing. Transactions costs to this activity are rising, but the opportunity cost of labor in the rural sector continues to decline.Skilled labor demand is rising faster than supply. This trend is being accelerated by FDI, for which skilled labor appears to be a complement.

May, 2004 D. Roland-Holst
Conclusions
1. China will be the largest trading economy in East Asia by about 2010.China will be the region’s largest exporter by about 2010, but it’s largest importer by 2005. The latter situation presents an unprecedented opportunity for neighboring economies.

May, 2004 D. Roland-Holst
Conclusions
2. The growth of China’s internal market will accelerate other East Asian export growth significantly and create historic opportunities for regional investors.
Provided East Asian economies do not isolate themselves from the process of Chinese trade liberalization, the net effect of China’s growth will be hugely positive, as Chinese absorption emerges to dominate regional demand.

May, 2004 D. Roland-Holst
Conclusions
3.China will be Japan’s largest trading partner by 2020.
In terms of both exports and imports, China will become Japan’s largest bilateral partner. Japan will also be China’s largest individual source of imports.

May, 2004 D. Roland-Holst
Conclusions
4. An East Asian Trade Triangle will emerge, where China develops a sustained trade deficit with East Asia and a surplus with Western OECD economies of nearly equal magnitude. In other words, most of China’s trade surplus will ultimately accrue to its regional neighbors. This has profound implications for patterns of both North-South and regional capital accumulation.

May, 2004 D. Roland-Holst
Conclusions
5. The Trade Triangle enables China to “deliver globalization” to the region by joining the WTO.
In this sense, East Asia can capture most of the benefits of full globalization by just forming ASEAN+3. The other EA countries should negotiate collectively with China, with an eye toward broader objectives.
Our results indicate that, in the wake of China’s WTO accession, the best strategy for East Asia is to pursue globalism through more comprehensive regionalism.

May, 2004 D. Roland-Holst
Conclusions
6. China can “go it alone” on the path to globalization.
By conforming to its existing WTO commitments, China will realize most of the gains it would enjoy in a world of free trade. Thus its unilateral initiative makes it less reliant on regional and bilateral commitments.

May, 2004 D. Roland-Holst
Conclusions
7. China has a special position in the regional trade matrix, but its strategic leverage appears to be limited.
Preferential access to individual EA exporters is not sustainable under its WTO commitments. The carrots are real, but their strategic value is limited.Furthermore, EA imports are essential to China’s export capacity. The stick is not credible against most EA partners.

May, 2004 D. Roland-Holst
Conclusions
8. Bilateral trade flows only reveal the direct part of regional comparative advantage.
Indirect linkages, spanning complex regional and global supply chains, often determine the majority of net gains from trade.Detailed multiplier decomposition analysis reveals that the East Asian trade mosaic is decomposing global supply chains and distributing the gains from China’s domestic growth through rapid trade expansion.

May, 2004 D. Roland-Holst
Conclusions
9. Shifting commodity trade patterns in East Asia do not fully reflect underlying comparative advantages. In particular, detailed analysis of the factor content of regional trade reveals the following (1996-2000):
Japan is strongly export oriented in high wage sectors. ASEAN is “holding its own” in bilateral trade with China by concentrating on higher wage exports.Korea and Taipei,China have both maintained strong regional export orientation in high wage activities.China has maintained most of its export orientation in low wage activities, although a new component of high wage net exports is emerging.

May, 2004 D. Roland-Holst
Conclusions
10. China’s conditions of comparative advantage are likely to experience rapid evolution for two reasons:
Significant and relatively sustained inbound FDI is rapidly expanding production capacity and altering patterns of factor productivity and returns.Labor markets are entering an important transition period:
Migratory patterns for unskilled labor are likely to intensify.Supply conditions for skilled labor may not keep pace with demand.Economic reform may adversely affect short term aggregate labor demand.

May, 2004 D. Roland-Holst
Looking Ahead
After a relatively upbeat analysis, three emergent areas deserve a closer look:
1. Regional Trade: From export competition to import competition
2. China’s export terms-of-trade3. Labor markets in China

May, 2004 D. Roland-Holst
Looking Ahead 1: Regional Trade
From export competition to import competition. China’s export position is now well established, but
the pace of absorption is forcing it onto more intense competition for resources and other intermediate goods.
Resource seeking integration/partnershipsUpstream FDIValue added shifting/transfer pricing

May, 2004 D. Roland-Holst
Looking Ahead 2: Terms of Trade
China’s export terms-of-trade may weakenThis will narrow export margins and increase inflationary pressureDomestic resources (and FDI) may begin shifting from exports to import substitutes and nontradables (reverse Dutch disease)Employment intensity of this sectoral rotation will be a very important issue (services vs. property)

May, 2004 D. Roland-Holst
Looking Ahead 3: Labor Markets
Labor markets in China:How high?
Skilled labor demand may be rising faster than supply. This trend is being accelerated by FDI, for which skilled labor appears to be a complement. What exactly is the capacity of formal and informal education/innovation to deliver higher productivity?
How long?Demographic transition and rising dependencyThe only way out is ever-increasing labor productivity
How wide? Migratory pressure will continue as the opportunity cost of labor in the rural sector declines monotonicallyActual migration must continue to be demand-drivenRegional growth rates will increasingly determine aggregate growth (median vs. average growth)