Embed Size (px)
Citation preview

Easing the Pain: Strategies for Maximizing Dental Clinic Efficiency
Mark J. Doherty, DMD, MPH, CCHP
Dental Management Coalition
June 1, 2009

What Exactly is the Pain?1• Reduced reimbursements 2• An expectation to be financially viable
3• Treating a population that bears the heaviest burden of disease
4• Pressure to see more patients
5• Quality indicators which drive completed treatments within an environment of care that is often compromised
6• Limited scopes of service due to regulations
7• Accomplishing our mission in a

compromised economy
“The financial viability of core safety net providers is even more at risk today than in the past.
…Failure to support these essential providers could have a devastating impact not only on the populations who depend on them for care but also on the safety net to care for patients whom they are unable or unwilling to serve.”
Institute of Medicine: America’s Health Care Safety Net, Intact but Endangered, 2000
The IOM Report continues:
“…to preserve our network of safety net providers, we must enhance and coordinate technical assistance programs targeted to improving the operations and competitive position of safety net providers…including
improvements in management information systems, appointment scheduling systems…
efforts to streamline operations, and
reengineering of services so that they are more responsive to patients.”

There is an Imbalance!


Safety NetBusiness
Safety NetMission

SNS Assessments and the DataShow That Safety Net Clinics :
1• Are extremely focused on the provision of service but are inefficient in relation to effective operations and systems
2• Often present with an inaccurate or partial understanding of their practice and opportunities within
3• Compile or receive inadequate data to properly evaluate the practice
4• Lack business accountability, strategic planning and/or guidance
5• Are challenged by inadequate resources for Safety Net practice management consulting and reference
SNS Mission
Partnering with Safety Net oral health programs
to provide technical assistance and support that
enhances community-based oral health care
and creates programs that are mission-driven
and financially-sustainable, assuring the long-

term viability of the safety net.

Balance
Safety NetSafety
Net
MissionBusines
s


The Safety Net Solutions Process
1
Prac
tice
Analysis
Practice
Management
Data Survey
Key Practice Data
Site Visit

2 3
Findings and Enhancement Discussions Plan
Presentation Action steps
Education Roadmap

Strategy
Foundation

4
Supported Implementatio n
Coaching
Guidance
Motivation

SNS Improvement ModelPhase 1: Practice Analysis –Practice Management Data Survey
Profiles
Demographics Staffing
Front end [registration] and back end [billing]

Scheduling
No-show policy Emergency policy
Services provided

SNS Improvement ModelPhase 1: Practice Analysis – Key Practice Data
Profit and Loss
Fee schedule
Aging report
Encounter form

SNS Improvement ModelPhase 1: Practice Analysis – Site Visit to Assess
Morale
Physical environment and layout Patients and staff
Operations, systems and workflow
Administrative leadership
Clinical services in action

SNS Improvement ModelPhase 2: Findings and Discussion
1• All data analyzed with attention to local environment of care
2• Findings presented in a collaborative, non-threatening way to senior and dental leadership using an open format discussion
3• Priorities identified for strategic planning

4• Final deliverable is a customized practice enhancement plan

SNS Improvement ModelPhase 3: Practice Enhancement Plan
1• Specific action steps 2• Road map for practice success 3• Short- and long-term strategies
4• Short-term items chosen and designed for early success
5• Early positive results fosters staff commitment and buy-in

6• Success breeds success

SNS Improvement ModelPhase 4: Supported Implementation
1• Assistance during implementation 2• Coaching 3• Guidance 4• Motivation 5• Education

6• Solutions to specific problems

SNS Improvement ModelFinal Phase Evalua
tion

SNS Improvement Model

SNSEnhancemen
tAnalysis
PlanDo
Plan
=IHI SNS
Act Study
Evaluation
Implementation

From Start to Finish:The SNS Practice Assessment Process

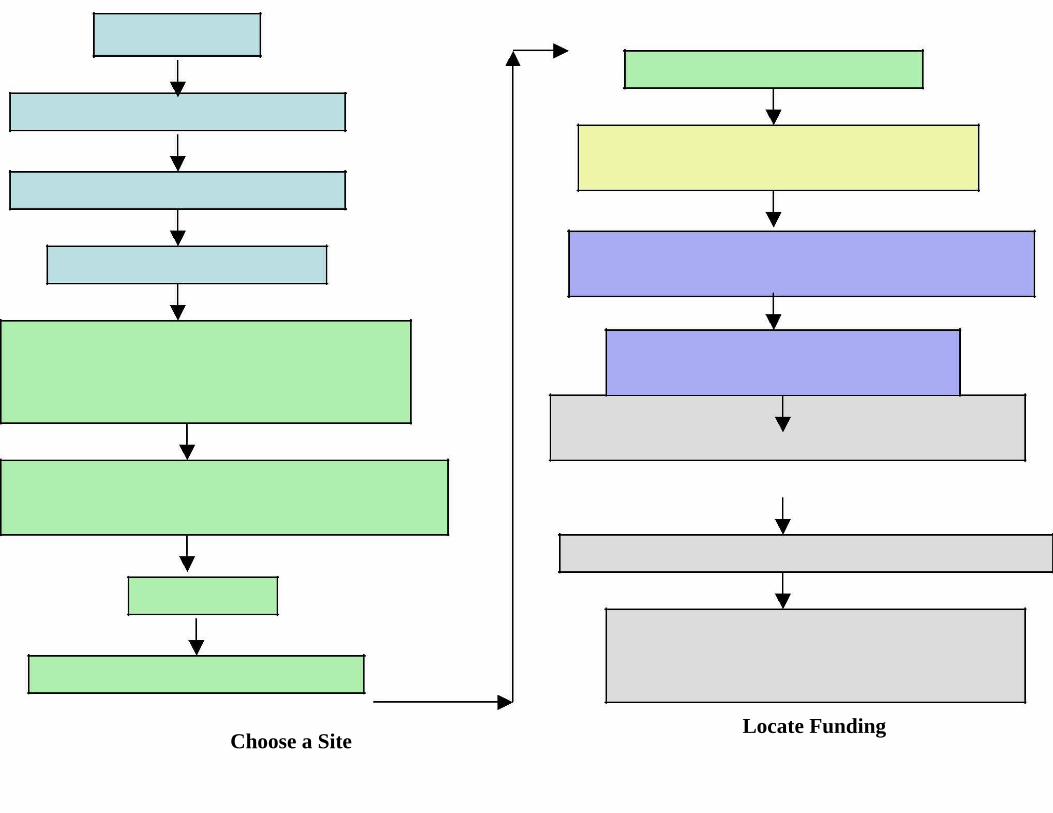
Choose a SiteLocate Funding

(if necessary)
Execute a Contract/MOU
Initiate a Launch Call
Assess practice environment of care: reimbursement
environment, Primary Insurers, etc.
Send out PMDS and Key Practice Data To safety net dental program
Gather data
Perform site visit and meeting
Conduct practice analysis
Develop Findings and DiscussionsPresentation and conduct meeting
Develop Practice Enhancement Plan to SN practice w/ timelines and accountability
Provide oversight and guidance during implementation
Encourage participation in SNS Learning Collaboratives & online resources
Collect evaluation data at 6, 12, & 24 months
Send evaluation data to Safety Net Solutions
Central Office for
analysis and reporting

Enhancement Plan is Often:Strategic Planning
1• Strategic Planning identifies where we are, where we want to go and how we are going to get there
2• It is a road map 3• Comprised of short- and long-term
strategies
4• Operational, business and clinical strategies

5• Series of action steps

Initiate Strategic Planning to Maximize Clinical Efficiency by:
Gathering Data1• In order to plan strategically, you first have to
define your practice. Where is the practice? 2• Pertinent practice data does not lie, and it
defines the practice well….on paper 3• Data provides the information needed to
create a strategic plan

4• Information is knowledge and knowledge is power

Practice Management Data Survey
1• The Practice Management Data Survey is a compilation of facts and figures related to the dental practice

EA Toolkit Pg 5

Practice ManagementData Survey
PMDS is used to create a representation of the practice, mostly through numbers, including:
– Treatment rooms
– Funding – Patient demographics – Staffing issues
– Documentation of eligibility – Billing operations
– Reconciling charges
against revenue
collected
– Schedulin
g – Gross charges – Emergencies
– No-show policy – Quality
– Sliding fee – Payer and patient mix
– Transactions

Practice Management DataSurvey (Profile of Center)
Profile of CenterNumber of Operatories: _________________________________________
Hours of Operation (dental services only)Monday: ____________________ Thursday: ____________________Tuesday:____________________ Friday: ____________________Wednesday: ___________________ Saturday: ____________________Are the hours of operation for overall CHC different than dental? Yes
NoIf so, how do they differ? ______________________________________
1. Are you a federally qualified CHC? Yes No
2. If you are an FQHC, are you paid of a Fee For Service basis or an encounterrate for Medicaid?
Fee For Service Encounter Rate
3. If you are paid on an Encounter Rate, what is your current rate? _________
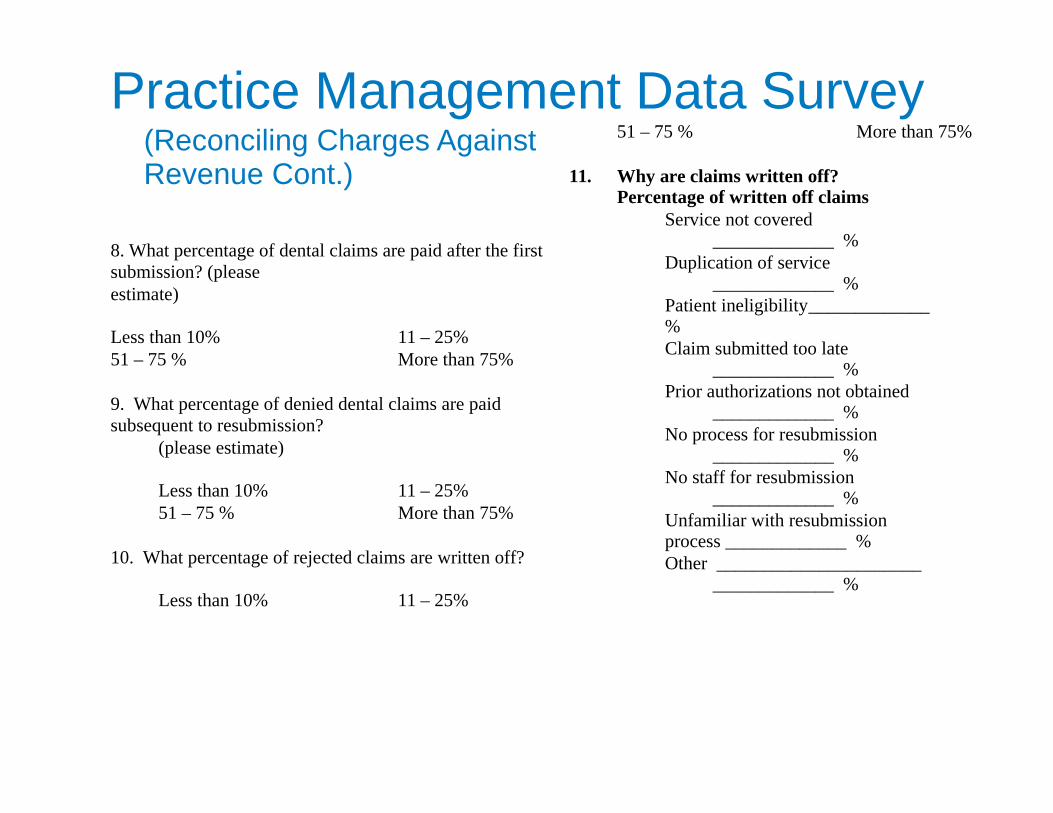
Practice Management Data Survey(Reconciling Charges Against Revenue Cont.)
8. What percentage of dental claims are paid after the first submission? (pleaseestimate)
Less than 10% 11 – 25%51 – 75 % More than 75%
9. What percentage of denied dental claims are paid subsequent to resubmission?
(please estimate)
Less than 10% 11 – 25%51 – 75 % More than 75%
10. What percentage of rejected claims are written off?
Less than 10% 11 – 25%
51 – 75 % More than 75%
11. Why are claims written off?Percentage of written off claims
Service not covered_____________ %
Duplication of service_____________ %
Patient ineligibility_____________ %Claim submitted too late
_____________ %Prior authorizations not obtained
_____________ %No process for resubmission
_____________ %No staff for resubmission
_____________ %Unfamiliar with resubmission process _____________ %Other ______________________
_____________ %

Key Practice DataIncludes:
1• Number of total dental visits
2• Number of total scheduled visits
3• Number of total unduplicated patients
4• Number of new dental patients
5• Number of emergency
patients 6• P
rofit and Loss (expense and rev
enue) statement
7• Copy of current dental fee schedule
8• Copy of sliding fee

schedule 9• List of
dental quality health indicators used to monitor dental health outcomes (i.e. number of Phase 1 completed treatments, number of preventive services provided per patient, number of new patients introduced to the practice, etc.)
10• Number of Phase 1 Completed Treatment
s
1• Copy of current dental encounter form
2• Sample schedule for dental that shows actual patient appointments for each of your operatories (for a typical week).
3• A productivity report

by ADA code.
4• Number of unique dental patients by payer and age (under 21 and over 21)
5• Dental policies for no-shows, emergencies and sliding fee scale
6• An aging report that shows the number and dollar amount of unpaid claims extending out 30, 60, and 90 days (broken out by
payer mix).
7• No-show rate for Dental and Health Center
8• Current state Medicaid regulations and fee schedule
What Can That Data Tell Us?1• If expenses are greater then revenue 2• The cost per visit (expenses/visits) 3• The revenue per visit (revenue/visits)
4• If we are accomplishing our mission (completed treatments)
5• If we are controlling chaos (% no-Shows, # emergencies)
6• What our opportunities are (payer mix) and how well we are using the mix to expand our access
What Are the Best Practices Which all Community Practices Should Include?
1. Staffing patterns to meet need and capacity
2. Efficient scheduling policies 3. Proper handling of emergencies 4. An effective no-show policy 5. Expected treatment protocols
6. A proper and well thought out fee schedule

7. A well-planned sliding fee scale
8. Consistent documentation of eligibility policies

Best Practices (cont.)
9. An efficient and effective billing system 10. Practice and user-friendly encounter form 11. Smooth transfer of billing information 12. Flow chart of billing procedure for all users
13. Defined system for reconciliation of remittances
14. Policy and system to handle denials
15. Policy for managing the prior approval process

Creation of a Business-EducatedDepartment
1• Staff should know and understand the environment of care
2• Understand and practice to the limits of the state practice act
3• Use Dental Informatics equal to those utilized in private practice in the service

area

Think and Plan at the Level ofthe Visit


The Visit is What We Understand1• Clinically 2• Financially 3• Strategically 4• Practically
The Visit
1• Build and create strategic plans around the visit
2• Eliminate chaos involved with the visit
3• Create business plans using the visit as the basic building block

Major Factors That MaximizeClinic Efficiency
Managing Emergencies
Managing No-Shows

Scheduling
Clinical Protocols
Managing Emergencies1• Define what constitutes a true emergency
2• Create an emergency management system that meets the level of need, but preserves regularly scheduled appointments
3• Develop and implement an emergency policy, and stick to it
4• Provide training for registration and reception

staff

Managing No-Shows
1• Create and distribute no-show policy
2• Enforce the no-show policy consistently
3• Track: – No-shows – Cancellations

– Fill-ins – Scheduled visits vs. actual appointments
Managing No-Shows (cont.)
1• Other potential strategies for managing no-shows: – Have patients sign the no-show policy – Provide reminder messages for upcoming appointments
– Schedule appointments no further out than 30-45 days – Schedule one follow-up appointment at a time

– 48 hour check-in rule

SchedulingSome factors that affect scheduling policies:1• Demographics of the patient population 2• How far in advance appointments are scheduled 3• Appointment lengths 4• Number of appointments available
Scheduling Best Practices1• Schedule appointments no further out than 30-
45 days 2• Schedule appointments one at a time
– Exception: patients undergoing complex procedures that require multiple visits to complete
3• Determine basic appointment length by service provided: 30-45-60 minutes

– Additional 10-15 minute increments for procedures requiring additional time

Scheduling with EFDAs
1• Can be used strategically to expand the capacity of the dental program
2• The functions that EFDAs can perform varies from state to state
3• There are many ways in which EFDAs can be scheduled to maximize productivity

Scheduling with EFDAs1• Example: “Restorative Days”
2• Schedule an afternoon with patients who need routine quadrant fillings – Work as a team with as many chairs as possible – Dentist gives anesthesia and preps teeth
– EFDA places restorations while Dentist gives anesthesia or preps another patient

– Dentist returns to first patient to check the work and adjust occlusion

Preparing to Utilize EFDAs1• Research the State Practice Act 2• Strategic Plan 3• Train Dentists and EFDAs 4• Set Goals and Revisit in 3 Months
5• Engage a Consultant if the Concept Feels Foreign
Common Scheduling PracticesThat Create Chaos
1• Double-booking 2• Triple-booking 3• Over-booking
– Can create patient and staff dissatisfaction – Can disrupt clinic flow – Are an Admission of Inefficiency or Lack of Control

Developing Clinical Protocols1• Define what should be done at each visit type
2• Protocols directed toward the completion of Phase One treatment
– 12-month timeline (or earlier, depending on practice goals)
3• Develop a tracking system for practices to use to document the completion of Phase 1 Treatments [dummy codes]

Additional Dental Practice Issues that Affect Sustainability
1• Staffing 2• Sliding Fee Scale 3• Documentation of Encounters 4• Documentation of Eligibility
Staffing1• Cross-train all support staff (receptionists,
registration clerks, schedules, billers, dental assistants) to fill in as needed
2• Consider incentive programs to reward the dental team and increase access
3• Use dental assistants and hygienists efficiently

Fee Schedule and Sliding Fee Scale
1• Determine Usual and Customary Fees for the region before setting the fee schedule
2• Compare the current fee schedule with reimbursement provided by each insurer
3• Sliding fee
discounts based on Federal Poverty Guidelines
4• High enough fees to capture all potential revenue from insurers, but low enough to be affordable for uninsured patients
5• Establish a nominal fee for

patients at or below 100% FPL

Encounters Forms
1• Create a user-friendly encounter form that covers the procedures within the scope of service of the practice
2• Goal: Easily interpreted by non-dental staff to result in the filing of a clean claim
3• Should include ADA code, tooth numbers, surfaces, or quadrants, where applicable.

Documentation of EligibilityKeys to Effective Documentation
1• Verify patient’s eligibility for specific services to be provided at every visit
2• Obtain prior authorizations for all services that require them before providing the service
3• Develop formal policy for dealing with non-emergent patients without proper documentation of eligibility
Handling of Self-Pays and Co-Pays
1• Established policy for self-pay patients
2• Co-pays collected at the time of the visit
3• Give the right
message and the same message to all
4• Policies drive expectations
5• Lack of policies leads to failure

Effective Billing Practices1• A well-designed encounter form
2• A process for the transfer of information from dental to billing and built-in accountability
3• Flow charts to give a visual of accountability for the process
4• A system for the reconciliation of remittances
5• A policy and accountability for handling of denials and resubmissions
6• A policy for prior approvals

7• Orientation, flow chart and guidebook for billing staff

Documentation of Eligibility FlowChart
Patient calls for appointment
Registration
EligibilityConfirmed
Appointment made; patient told to bring insurance card to visit
Patient shows up for appointment and presents card
Registration clerk verifies
Eligibility coverage againEligibility Denied
Confirmed
Patient has option to receive care
as self-Patient is seen
pay or, if eligible, apply for Medicaid and
get appointme
nt when enrolled

EligibilityDenied
Patient has option to come as self-pay or, if eligible, apply for Medicaid and get
appointment when enrolled
If covered by Medicaid or agree to be self-pay, appointment is made
If patient elects to receive care on a self-pay basis, they are given an
estimate of what the costs will be for their visit when the appointment is
made and informed that they will be
required to pay at the time of
the visit
If patient elects to receive care on a self-
pay basis, they are given an estimate of what the costs
will be for their visit when the appointment is made and
informed that they will be
required to pay at the time of
the visit

BillingProcess Flow
Chart
Patient calls for appointment; registration documents eligibility and schedules appointment


Patient comes in for appointment; eligibility is checked again; patient is asked to pay any co-pays
due at the time of the visit
Encounter form is generated; patient sits in chair; provider sees patient and documents services form
For Medicaid patients, DA takes encounter f
orm and puts it in holding cart
Encounter for
ental specialist
Reconciled againstpatient account
Patients with co-payments (self-pay or commercial insurance) take encounter form to registration and check out
Patient meets with patient accounts specialist to revie
w follow-up care needed and estimated costs
If patient agrees to care plan, next appointment is made
Patient accounts specialist takes encounter form
Self-Pay
Encounter form go
es to
billing,
where it is
reviewe
d and patient
invoice is generated for
balance due,
if any
Patient gets bill and pays or continues to get billed
Account is either paid in full or written off as bad debt
Reconciled againstWritten off
Submitted for paymentpatient account again
Create a Business-EducatedDepartment
1• Know and discuss the environment of care and what it allows
2• Define the scope of service with a system of checks, balances and accountability
3• Know the state practice act and wherever possible expand staff duties to take advantage of possibilities
4• Orient all new staff formally
Dental Informatics
1• Plan well and completely for the integration of the EDR and E-practice management
2• If in doubt: Hire a Consultant
3• Whenever and wherever possible, entertain the possibilities of digital radiography for the practice

Strategic Planning1• After establishing where you are, now the practice needs to
figure out where they are going and how they will get there – Define the practice’s mission and explore scope of service
– Develop an action plan to get the practice to achieve the goals of: 1• The dental practice’s mission 2• The overall health center mission 3• Quality dental health indicators 4• Completion of Phase 1 Treatments
2• Develop policies, procedures, and operations that foster

the attainment of the dental practice’s goals 3• Develop long- and short-term goals and action steps

Evaluation Data GatheredGross Charges
Net Revenue
Expenses (Direct and Indirect)
Total Number of Visits
Revenue per visit
Cost per visit
Number of Completed Phase 1 Treatments
Number of Unduplicated Patients
Number of Transactions
No-Show Rate
Emergency Rate
Number of FTE Dentists
Number of FTE Hygienists
Number of FTE Dental Support Staff
Any Change in Scope of Service?
Any Change in hours of operation?
Number of New Patients

Monthly Progress Reports
Opportunity Enhancement Due On Track for Clinic Any Barriers AssistancePlan Date Timely Progress to Requested?
Recommendation Completion? Update completion(If no, please of
providerecommenda
revised due tion?date)
Emergencies Implement a new 8/15/2 Yes E.P. has No Noemergency 009 beenpolicy created and
is beingreviewed by

our board

Case Study 1:2-Chair Southern MA FQHC
FY20 FY2006 07
ClinicalProductivity
Total Visits 3,391 5,642
FinancialProductivity
Net Revenue $249,761 $598,052
Revenue per Visit $71 $106 This clinic added twopart-time dentists forExpenses $315,363 $490,85 evening, Saturday &
4Sunday hours. The totalclinic hours servingCost per Visit $93 $87 patients went from 35 to
Operating $74,602 $107,19 52 per week

loss/surplus loss 8 gain
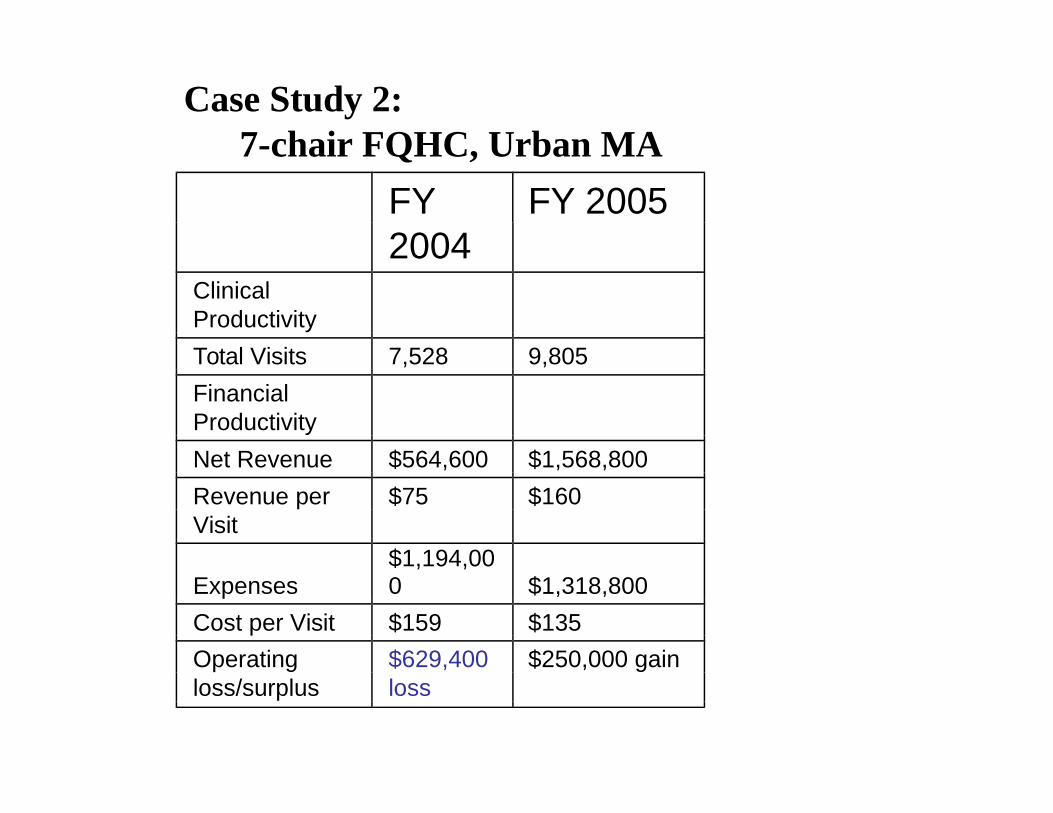
Case Study 2:7-chair FQHC, Urban MA
FY FY 20052004
ClinicalProductivity
Total Visits 7,528 9,805
FinancialProductivity
Net Revenue $564,600 $1,568,800
Revenue per $75 $160Visit
Expenses$1,194,000 $1,318,800
Cost per Visit $159 $135
Operating $629,400 $250,000 gainloss/surplus loss

This clinic had not revised its fee schedule in over 5 years. It was immediately updated to the current MassHealth dental schedule.
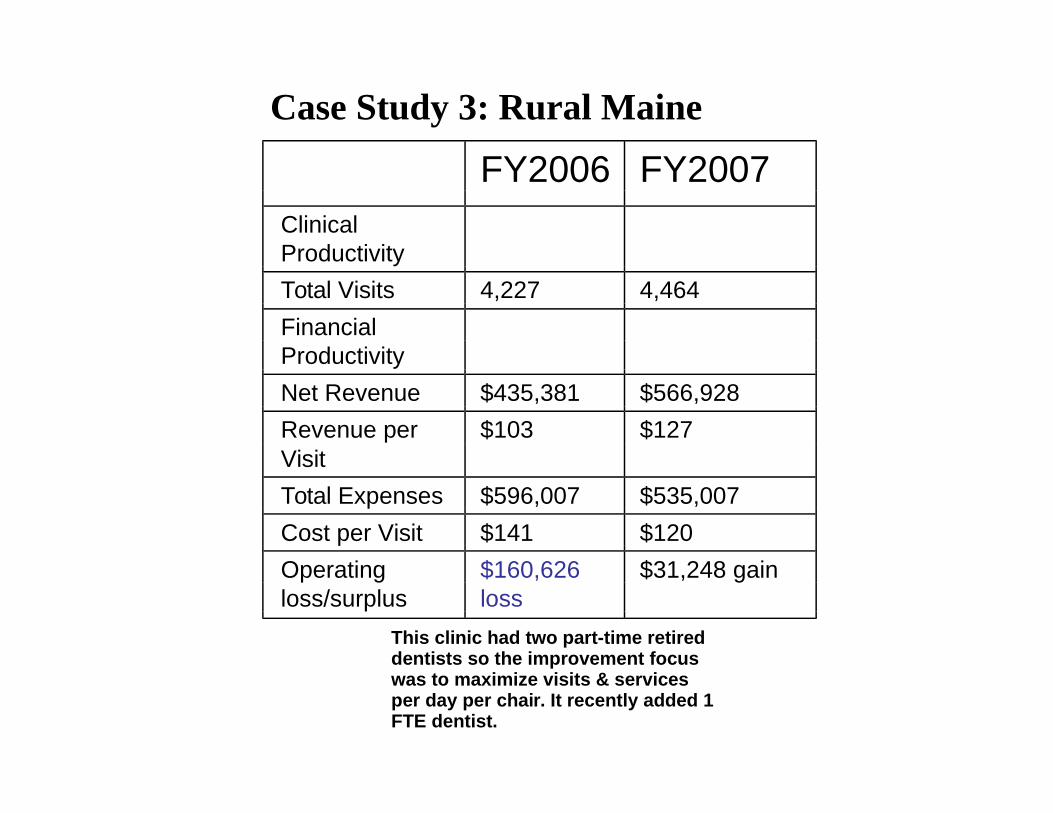
Case Study 3: Rural Maine
FY2006 FY2007ClinicalProductivity
Total Visits 4,227 4,464
FinancialProductivity
Net Revenue $435,381 $566,928
Revenue per $103 $127Visit
Total Expenses $596,007 $535,007
Cost per Visit $141 $120
Operating $160,626 $31,248 gainloss/surplus loss
This clinic had two part-time retired dentists so the improvement focus was to maximize visits & services per day per chair. It recently added 1 FTE dentist.

Case Study 4: 7-Chair FQHC
FY FY 20072006
ClinicalProductivity
Total Visits 8,860 8,406
FinancialProductivity
Net Revenue $1,233,904 $1,572,009
Revenue per Visit $139 $187
Expenses $1,642,091 $1,467,093
Cost per Visit $185 $175
Operating $408,187 $104,916
loss/surplus loss gain


Safety Net Solutions
Partnering to Strengthen and Preserve the Oral Health Safety Net

http://www.dentaquestinstitute.org/safetynetsolutions