Embed Size (px)
Citation preview
Eapen, John (2011) An Analysis of the Entry Barriers for Firms entering the Indian Market. A case for the Crude Oil and Fertilizer Industry. [Dissertation (University of Nottingham only)] (Unpublished)
Access from the University of Nottingham repository: http://eprints.nottingham.ac.uk/24932/1/MBA_dissertation_John_Eapen.pdf
Copyright and reuse:
The Nottingham ePrints service makes this work by students of the University of Nottingham available to university members under the following conditions.
This article is made available under the University of Nottingham End User licence and may be reused according to the conditions of the licence. For more details see: http://eprints.nottingham.ac.uk/end_user_agreement.pdf
For more information, please contact [email protected]
1 | P a g e
UNIVERSITY OF NOTTINGHAM BUSINESS SCHOOL
MANAGEMENT PROJECT
PROJECT SUPERVISOR
PROFESSOR PAWAR KULWANT
By:
JOHN EAPEN STUDENT ID:4146036
2010-2011
An Analysis of the Entry Barriers for Firms entering the Indian
Market. A case for the Crude Oil and Fertilizer Industry.
A Management project presented in part consideration for the degree of MBA
2 | P a g e
ABSTRACT
International businesses are seeking opportunity to expand their business in emerging markets.
Globalization has provided opportunities to enter new markets and access untapped resource. This has
resulted is flourishing of trade between countries. In the process on internationalization firm are
undergoing difficulties is using the same methods used in the home countries to enter new markets.
This results in losses for the firm and even business failure.
This report is based on the analysis of the crude oil and the fertilizer industry. The market study is done
to understand the attractiveness of the industry and the fundamental characteristics of the market.
With the help of PESTEL and The Five Forces models the report analyses the external and internal
barriers of the industry and the interventions like corruption that would also impact the industry. With
the help of Internationalization models the report suggests possible internationalization processes that a
new entrant could use to enter the Indian market.
The main focus of the report is to analyses the barriers that new entrants face in the new market entry.
By exploring the different barriers in the market firms will be able align their strategies depending on
the possible barriers. It also focuses on the governmental interventions and corruption which underlie in
the system. To gain competitive advantage firms need to factor in these barriers and formulate a
strategy to internationalize.

3 | P a g e
ACKNOWLEDGEMENTS
I would like to express my deepest gratitude to the people who have given me support, assistance and
guidance to complete this dissertation. The undertaking of this project wouldn’t has been possible
without you.
Firstly I would like to thank my supervisor for this Dissertation, Professor Pawar Kulwant for overseeing
my project, spending his time in providing support, clarity and inspiring experience to complete my
project. He has given me an experience that I can learn so much from and one simply couldn’t wish for a
better or friendlier supervisor.
I would also like to thank Mr Catalin Propescu for giving me the opportunity to work on the internship.
He has given me a lot of support by spending his time on clearing all my queries, providing me support
and advice in spite of his busy schedule.
Finally, I would like to take this opportunity to thank my Parents and friends who have stood by me both
inspiring and motivating me throughout this project.
4 | P a g e
TABLE OF CONTENT CHAPTER 1: INTRODUCTION ......................................................................................................................... 7
CHAPTER 2: INDUSTRY ANALYSIS .................................................................................................................. 9
INTRODUCTION ............................................................................................................................................. 9
2.1. FERTILIZER INDUSTRY IN INDIA .......................................................................................................... 9
2.1.1. FERTILIZER MARKET ..................................................................................................................... 9
2.1.2. PRESENT TRENDS IN THE INDUSTRY ......................................................................................... 10
2.1.3. UREA .......................................................................................................................................... 11
2.1.4. DAP ............................................................................................................................................ 11
2.1.5. COMPLEX FERTILIZERS ............................................................................................................... 12
2.1.6. PROFITABITITY ........................................................................................................................... 13
2.1.7. REQUIREMENTS OF THE MARKET ............................................................................................. 15
2.1.8. IMPORT PROCEDURES ............................................................................................................... 16
2.1.9. CONCESSION SCHEME ............................................................................................................... 16
2.1.10. GOVERNMENT RULES & LAWS ................................................................................................ 16
2.2. CRUDE OIL INDUSTRY IN INDIA ........................................................................................................ 19
2.2.1. CONSUMPTION OF CRUDE OIL .................................................................................................. 19
2.2.2. REFINERIES AND PRODUCTION ................................................................................................. 20
2.2.3. LOGISTIC DATA ON TRANSPORT OF CRUDE OIL ........................................................................ 21
2.2.4. BY-PRODUCTS OF CRUDE OIL .................................................................................................... 23
2.2.5. GOVERNMENT INITIATIVES ....................................................................................................... 23
CONCLUSION ............................................................................................................................................... 24
CHAPTER 3 - LITERATURE REVIEW .............................................................................................................. 25
3.1. ENTRY BARRIERS - EXTERNAL ........................................................................................................... 25
3.1.1. POLITICAL FACTORS:- ................................................................................................................ 25
3.1.2. SOCIOCULTURAL ENVIRONMENT .............................................................................................. 27
3.1.3. ECONOMIC FACTORS:- .............................................................................................................. 29
3.1.4. INFRASTRUCTURE ...................................................................................................................... 31
3.2. ENTER BARRIERS - INTERNAL ........................................................................................................... 32
3.2.1. COMPETITIVENESS OF EXISTING FIRMS .................................................................................... 32
5 | P a g e
3.2.2. ABSOLUTE CAPITAL REQUIREMENT .......................................................................................... 33
3.2.3. COST OF CAPITAL ....................................................................................................................... 33
3.2.4. ECONOMIES OF SCALE:- ............................................................................................................ 33
3.2.5. PRODUCT DIFFERENTIATION ..................................................................................................... 34
3.2.6 DISTRIBUTION CHANNELS .......................................................................................................... 34
3.2.7. EXIT BARRIERS ........................................................................................................................... 35
3.3. CORRUPTION ........................................................................................................................................ 36
3.4. INTERNATIONALIZATION ...................................................................................................................... 38
3.4.1. UPPSALA INTERNATIONALIZATION MODEL:- ................................................................................ 38
3.4.1.1. THE UPPSALA MODEL NEGATIVES:- ....................................................................................... 39
3.4.2. TRANSACTION COST MODEL:- ....................................................................................................... 40
3.4.2.1. CRITIQUES OF TRANSACTION COST ....................................................................................... 41
3.4.3. THE NETWORK MODEL .................................................................................................................. 41
3.4.3.1. CRITIQUES OF THE NETWORK MODEL ................................................................................... 42
CONCLUSION: .............................................................................................................................................. 43
CHAPTER 4: RESEARCH METHODOLOGY ..................................................................................................... 44
INTRODUCTION ....................................................................................................................................... 44
4.1. RESEARCH METHODOLOGY .............................................................................................................. 44
4.1.1. PRIMARY RESEARCH METHODOLOGY ....................................................................................... 45
4.1.1. DRAW BACKS OF PRIMARY RESEARCH METHODOLOGY:- ........................................................ 46
4.2. SECONDARY RESEARCH METHODOLOGY ..................................................................................... 47
4.2.1. DRAW BACKS OF SECONDARY RESEARCH INFORMATION ........................................................ 47
CHAPTER 5: ANALYSIS & DISCUSSION ......................................................................................................... 48
INTRODUCTION ........................................................................................................................................... 48
5.1. PESTEL .................................................................................................................................................. 48
5.1.1. POLITICAL FACTORS ....................................................................................................................... 48
5.1.2. ECONOMICAL FACTORS ................................................................................................................. 50
5.1.3. SOCIAL FACTORS ........................................................................................................................... 51
5.1.4. TECHNOLOGICAL FACTORS ........................................................................................................... 52
5.1.5. CONCLUSIONS BASED ON THE PEST ANALYSIS ............................................................................. 53
5.2. ANALYSIS OF COMPETITION IN THE INTERNAL MARKET - FIVE FORCES .............................................. 53
6 | P a g e
5.2.1. ANAYSIS OF THE CRUDE OIL INDUSTRY ......................................................................................... 54
5.2.2. ANALYSIS OF THE FERTILIZER INDUSTRY ....................................................................................... 55
5.3. CORRUPTION IN INDIA ......................................................................................................................... 57
5.4. INTERNATIONALIZATION ...................................................................................................................... 60
5.4.1. CRUDE OIL INDUSTRY .................................................................................................................... 60
5.4.2. FERTILIZER INDUSTRY .................................................................................................................... 60
CHAPTER 6: CONCLUSION ........................................................................................................................... 62
REFERENCES ................................................................................................................................................ 63
7 | P a g e
CHAPTER 1: INTRODUCTION
India is a country located towards the central northern cost of the Indian Ocean where it shares its
boundaries in the west with Pakistan, in the north with Tibet, Bhutan and Nepal and in the east by
Myanmar and Bangladesh. Its population is 1.2 billion which makes it the world’s largest democratic
country with 28 states and seven union territories (Euromonitor, 2010). The median age in India is
relatively low at 25 which make it an attractive consumer market. It is for seen that India will overtake
China as the most populated country in less than 20 years. The large domestic market makes the
country less dependent on trade. India has emerged as one of the leading economies of the world over
the last decade and according to Budhwar (2010) foreign investors have been making a beeline to enter
the lucrative Indian market.
The country has seen tremendous growth over the last decade and has emerged as the fourth largest
economy in purchasing power parity terms. The real GDP grew at a rate of 8% per year in 2000 to 2008
and in the year 2010 it had increased to 10.4%.The reasons for this was the strong performance of the
agriculture and industry sector. The agriculture sector contributed by 16.1% to India’s GDP but employs
52% of the total available work force (Harjeet, 2011). Due to India’s current position in the world the
country has been attracting a lot of interests for investment. There is a lot of evidence regarding the
availability of opportunities for foreign investors given the dynamic nature of the business environment
in India which is changing at a rapid pace ( Budhwar, 2010). The well diversified industry base, a large
and sophisticated finance base, healthy GDP and strength in the knowledge driven industries are factors
that help in the attractiveness of the country for investment.
Also The Indian geographic location offers investors with advantages with its large cost line and diverse
topography. Needless to say there are also disadvantages that investors would face in this market.
Foreign investors looking at entering the Indian market would have to deal with issues such as
corruption, bureaucratic red tapeism, infrastructure limitations, union policies and practices which are a
counter to progressive business.
This report analysis the entry barriers to entering the Indian market in respect to the crude oil and the
fertilizer industry. The structure of the report is as follows:-
8 | P a g e
Chapter 2 gives a complete market study of the Crude oil and Fertilizer industry in India. In this section I
have tried to look also at the policies that the governments have in these sectors providing subsidies and
tax reductions. This report is based in the requirements made by the Client during my internship.
Chapter 3 is a literature review based on the entry barriers effecting firms during internationalization. It
discusses based on literature published by authors on the initial external and internal barriers in
entering a new market. The section further discusses about corruption in countries and debates about
the pros and cons of corruption. The final section describes the different types of internationalization
models and their critiques.
Chapter 4 describes the methodology used in the research and data collection process. The process
used is a quantitative approach with a primary and secondary analysis. This section talks about the view
point of different authors on the research process and the limitations in using these methods.
Chapter 5 is the discussion section where we analyses the Indian market using the information in the
literature review and the data acquired in the market. This section starts with a PEST analysis which
helps us understand the main external factors affecting the market entry. The internal barriers are
analyzed for both the industries using the Porters 5 forces model. Following the market analyses the
corruption in India is discussed based on the barriers that it would form for new market entrants. Finally
suggestions are made on the internationalization models that the two respective industries can use
during the market entry process into India.
Chapter 6 is the conclusion to the dissertation where in i consolidate the results of the study and make
analyses of the entry barriers for the Indian market with respect to the two industries. This section
would also consist of a do’s and dont’s section which would have the factors that firms entering the
Indian market should pay attention to.
9 | P a g e
CHAPTER 2: INDUSTRY ANALYSIS
INTRODUCTION
The industry analysis is based on the internship done for the client on the Fertilizer industry and the
crude oil industry in India. This section analyses both the industry to understand the potential market in
India and the benefits of entering the market. This report also talks about the present competitors in the
market and the industry requirements.
2.1. FERTILIZER INDUSTRY IN INDIA
Agriculture sector accounts as the primary occupation for majority of the population in India. The
agriculture sector alone contributes to around 25% of India’s GDP (financemasala, 2011). The production
of food grains in India rose by an excess of 156 million MT since 1951-52.This saw the need for higher
yield to feed the growing population. The fertilizer industry started with its first factory in the 1906
which produces Single Super Phosphate in Ranipet, Chennai. After independence a few more large scale
factories were established such as the Fertilizer and Chemicals Travancore of India ltd in Cochin and The
Fertilizer Corporation of India in Sindri, Bihar.
By the year 2007 the Indian government records indicated that the Indian fertilizer industry had made a
production of 120.61 LMT of Nitrogen (N) 56.59 LMT of Nitrogen (N) and 56.59LMT of Phosphateic (P)
Nutrient (Euro monitor, 2007). These success in production by the fertilizer industry got India to the
position of 3rd largest fertilizer producer in the world.
2.1.1. FERTILIZER MARKET
Fertilizers can be described as a substance which is inorganic, organic, natural or artificial which supplies
elements required for plant growth.16 elements are required for plant growth where in 9 elements are
needed in large and seven in small quantities (Tradechakra, 2010). The four important division in the
fertilizer industry are Finance and accounting, Fertilizer Import, Fertilizer project planning, Vigilance &
Administration and Movement – Distribution of the products (financemasala, 2011).
Based on the nutrient composition the Indian fertilizer industry can be broadly divided into three
categories – Nitrogenous (N), Phosphate (P) and Potassium (K).
10 | P a g e
The industry has been heavily regulated for decades by the Government of India due to the political
sensitivity of fertilizer prices. The regulations covered under the FGP – Farm Gate Price 1regulate the
types of fertilizers eligible for subsidy, distribution pattern and returns that can be earned from
manufacturing. Urea is the key fertilizer consumed within the nitrogenous fertilizer segment and
account for 50% of all fertilizer consumption in India (ICRA, 2011). Phosphate fertilizers are consumed as
complex fertilizers with different levels of NP and NPK. Potassium fertilizers mainly comprise of MOP
(Muriate of Potash) which is directly exported and not manufactured in India (ICRA, 2011).
Through heavy subsidizing the government absorbs much of the input costs as seen below the trends in
Farm Gate Prices and international prices of Urea and DAP.
2.1.2. PRESENT TRENDS IN THE INDUSTRY
The Indian fertilizer industry is undergoing considerable change with existing manufacturer’s seeking to
expand their capacity and new developers moving to take advantage of the government policy
initiatives and the mismatch between demand and supply. The investment into the industry is to the
tune of $ 10 billion (Satish et al, 2010).Global technology providers for fertilizers such as KBR, Haldor
Topsoe and Saipem and reinforcing their presence in the Indian market by building up their capacity in
the country. Investments have increased to the tune of 44.73% in private sectors, 29% in the public
sectors and 26.27% in the co-operative sectors (financemasala, 2011). This is viewed as a sudden surge
of improvement considering the fact that the last big plant was built by Chambal Fertilizers and
chemicals in 1999.
Indian companies are trying up with international companies to improve and increase production for
example Saipem supplies the engineering experience and technology for Matrix fertilizers and chemicals
ltd located in West Bengal and KBR is providing Matrix technology to produce Ammonia (Satish et al,
2010).The key concerns of the industry are the rising input prices and delays in the allocation of natural
gases which are holding up the capacity expansion which is needed by the industry ( Reuters, 2011).
The rising food grain consumption due to the requirement from the rising population in India has fuelled
the demand for fertilizers in India which is being met by Imports. According to Indian Fertilizer outlook
(2010) based on a report by Fitch Ratings India Pvt ltd Imports are in the tune of 21% of urea, 67% of
1 Farm Gate Price is given as the net value of the product when it leaves the producers after marketing costs have
been subtracted.
11 | P a g e
phosphorous based fertilizers and 100% of potash rich fertilizers in the country. According to Fitch the
domestic demand will always be higher than domestic production which will increase imports (Reuters,
2011).Through this it’s evident that the increase of production of Urea would be dependent on the
decision of the government to allocate requested natural gas supplies. The Indian fertilizer industry
consists of 57 large scale units of which 29 are into manufacturing of Urea, 13 are into calcium
ammonium Sulphate / Nitrate and the remaining 20 are into production of Complex fertilizers and DAP
(financemasala, 2011).
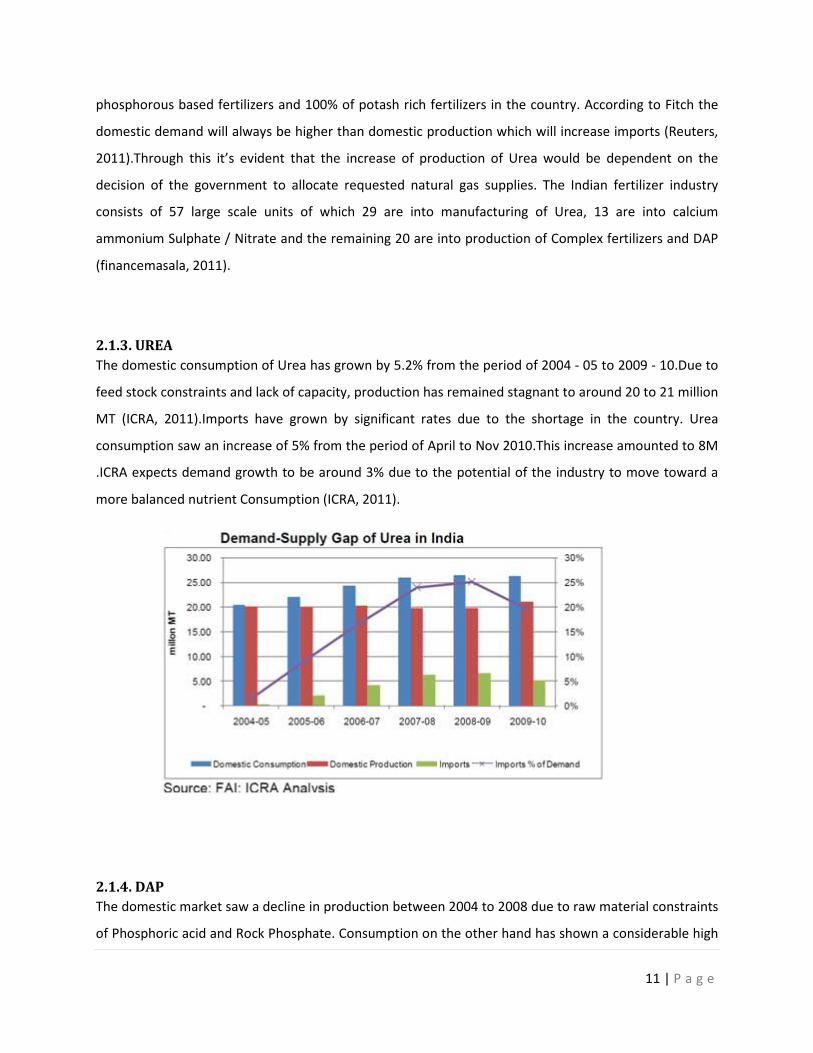
2.1.3. UREA
The domestic consumption of Urea has grown by 5.2% from the period of 2004 - 05 to 2009 - 10.Due to
feed stock constraints and lack of capacity, production has remained stagnant to around 20 to 21 million
MT (ICRA, 2011).Imports have grown by significant rates due to the shortage in the country. Urea
consumption saw an increase of 5% from the period of April to Nov 2010.This increase amounted to 8M
.ICRA expects demand growth to be around 3% due to the potential of the industry to move toward a
more balanced nutrient Consumption (ICRA, 2011).
2.1.4. DAP
The domestic market saw a decline in production between 2004 to 2008 due to raw material constraints
of Phosphoric acid and Rock Phosphate. Consumption on the other hand has shown a considerable high
12 | P a g e
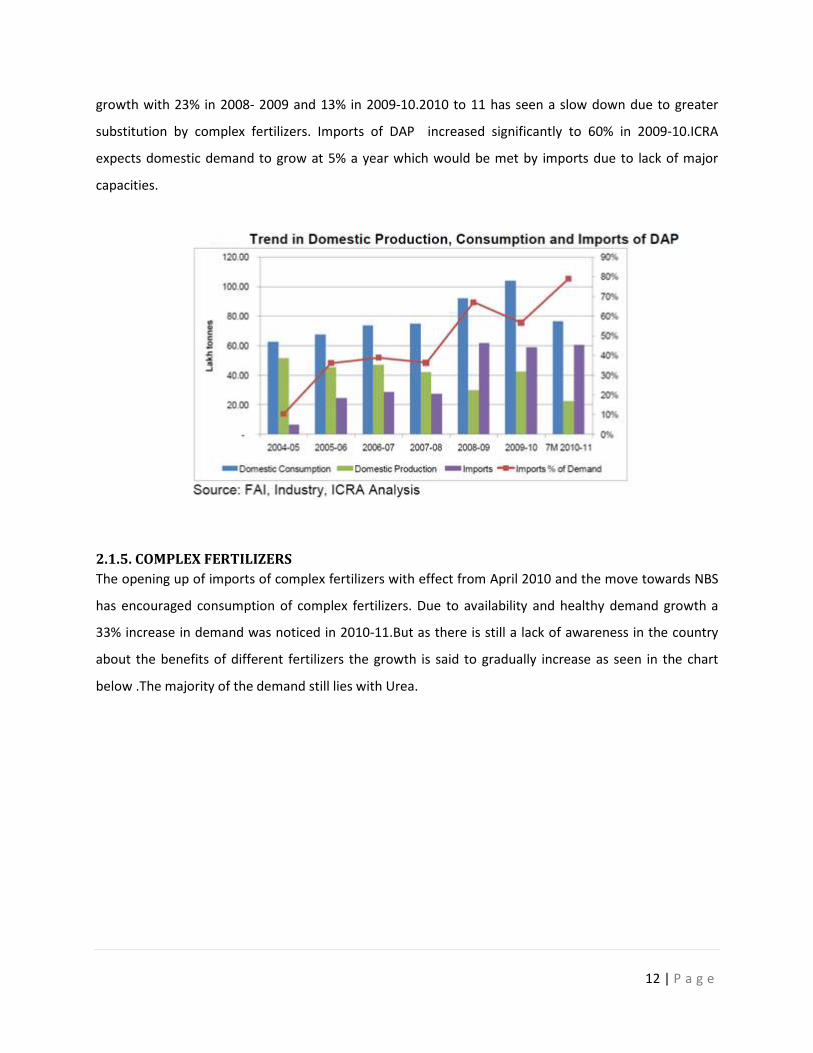
growth with 23% in 2008- 2009 and 13% in 2009-10.2010 to 11 has seen a slow down due to greater
substitution by complex fertilizers. Imports of DAP increased significantly to 60% in 2009-10.ICRA
expects domestic demand to grow at 5% a year which would be met by imports due to lack of major
capacities.
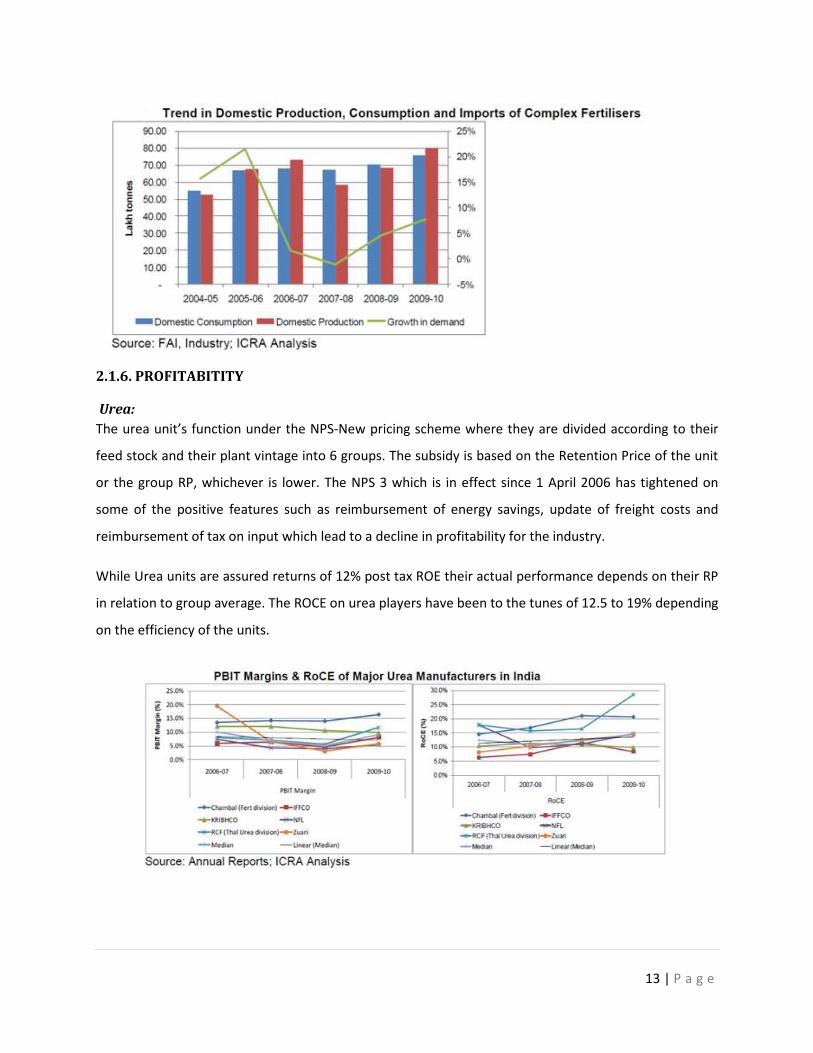
2.1.5. COMPLEX FERTILIZERS
The opening up of imports of complex fertilizers with effect from April 2010 and the move towards NBS
has encouraged consumption of complex fertilizers. Due to availability and healthy demand growth a
33% increase in demand was noticed in 2010-11.But as there is still a lack of awareness in the country
about the benefits of different fertilizers the growth is said to gradually increase as seen in the chart
below .The majority of the demand still lies with Urea.
13 | P a g e
2.1.6. PROFITABITITY
Urea:
The urea unit’s function under the NPS-New pricing scheme where they are divided according to their
feed stock and their plant vintage into 6 groups. The subsidy is based on the Retention Price of the unit
or the group RP, whichever is lower. The NPS 3 which is in effect since 1 April 2006 has tightened on
some of the positive features such as reimbursement of energy savings, update of freight costs and
reimbursement of tax on input which lead to a decline in profitability for the industry.
While Urea units are assured returns of 12% post tax ROE their actual performance depends on their RP
in relation to group average. The ROCE on urea players have been to the tunes of 12.5 to 19% depending
on the efficiency of the units.
14 | P a g e
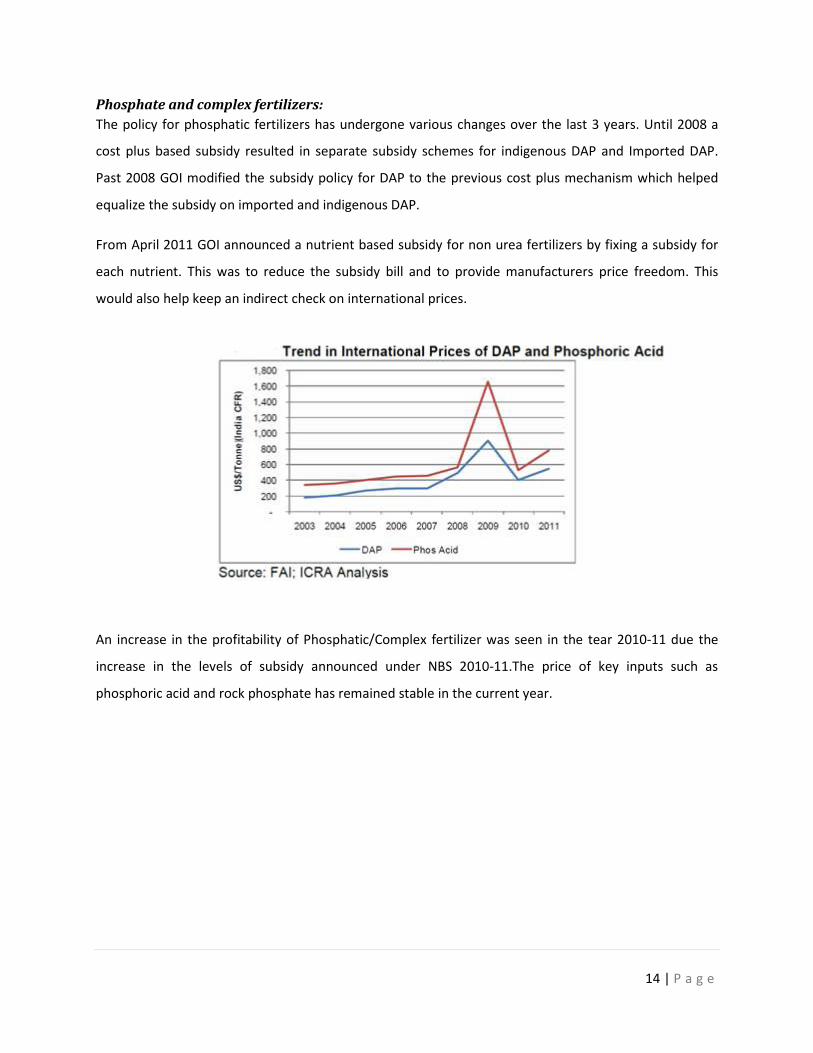
Phosphate and complex fertilizers:
The policy for phosphatic fertilizers has undergone various changes over the last 3 years. Until 2008 a
cost plus based subsidy resulted in separate subsidy schemes for indigenous DAP and Imported DAP.
Past 2008 GOI modified the subsidy policy for DAP to the previous cost plus mechanism which helped
equalize the subsidy on imported and indigenous DAP.
From April 2011 GOI announced a nutrient based subsidy for non urea fertilizers by fixing a subsidy for
each nutrient. This was to reduce the subsidy bill and to provide manufacturers price freedom. This
would also help keep an indirect check on international prices.
An increase in the profitability of Phosphatic/Complex fertilizer was seen in the tear 2010-11 due the
increase in the levels of subsidy announced under NBS 2010-11.The price of key inputs such as
phosphoric acid and rock phosphate has remained stable in the current year.
15 | P a g e
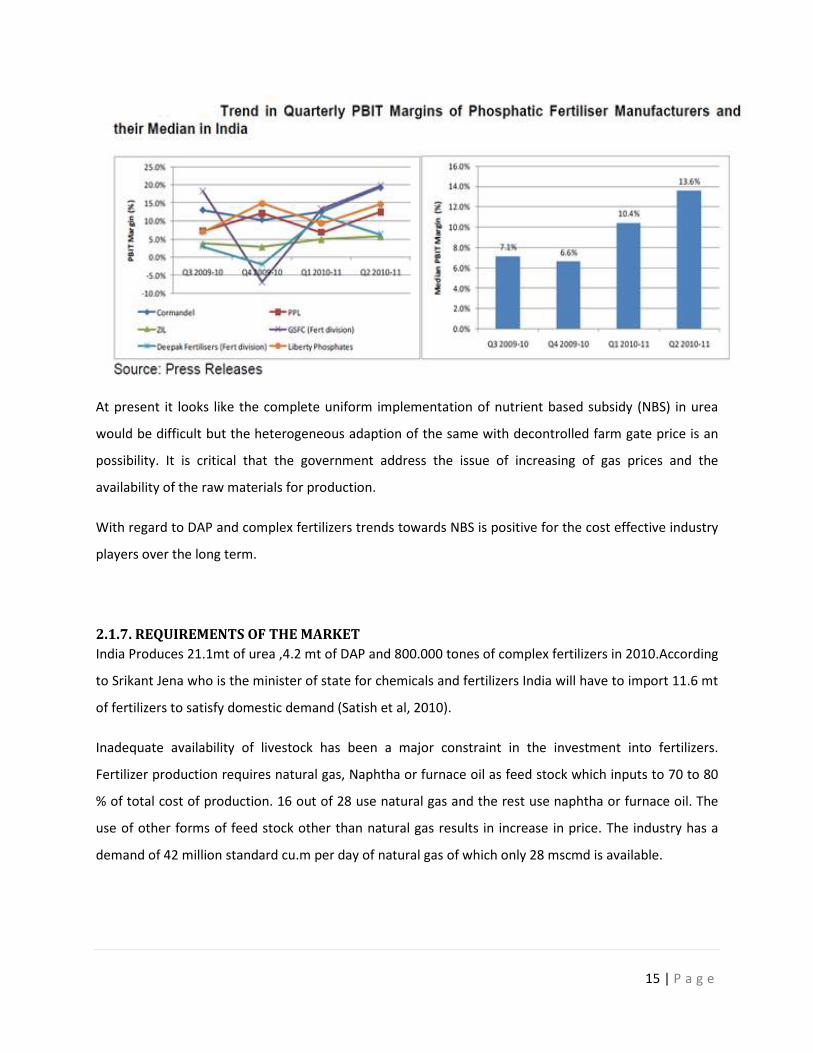
At present it looks like the complete uniform implementation of nutrient based subsidy (NBS) in urea
would be difficult but the heterogeneous adaption of the same with decontrolled farm gate price is an
possibility. It is critical that the government address the issue of increasing of gas prices and the
availability of the raw materials for production.
With regard to DAP and complex fertilizers trends towards NBS is positive for the cost effective industry
players over the long term.
2.1.7. REQUIREMENTS OF THE MARKET
India Produces 21.1mt of urea ,4.2 mt of DAP and 800.000 tones of complex fertilizers in 2010.According
to Srikant Jena who is the minister of state for chemicals and fertilizers India will have to import 11.6 mt
of fertilizers to satisfy domestic demand (Satish et al, 2010).
Inadequate availability of livestock has been a major constraint in the investment into fertilizers.
Fertilizer production requires natural gas, Naphtha or furnace oil as feed stock which inputs to 70 to 80
% of total cost of production. 16 out of 28 use natural gas and the rest use naphtha or furnace oil. The
use of other forms of feed stock other than natural gas results in increase in price. The industry has a
demand of 42 million standard cu.m per day of natural gas of which only 28 mscmd is available.
16 | P a g e
2.1.8. IMPORT PROCEDURES
Urea comes under statutory price distribution and movement control and allocations are made under
ECA- Essential commodities Act and come under the Retention Price cum Subsidy Scheme. Other
fertilizers such as DAP, MOP, Complex fertilizers and SSP are decontrolled under which the government
provides concession scheme.
Import of urea is made through 3 state trading agencies which are India potash limited (IPL) State
trading Corporation (STC) and mineral and material trading corporation (MMTC).These agencies are
used to move Urea in particular states as per movement order to sell it to farmers at MRP issued by the
Department of Fertilizers. Other than the STA no individual or company is allowed to import urea
without obtaining permission from the government of India.
Import of DAP and MOP is free and any company or individual can import and sell these products in any
part of the country. The government takes care of the distribution margin and transportation costs of
decontrolled fertilizers on normative bases under the concession scheme.
2.1.9. CONCESSION SCHEME
This scheme provides producers and consumers reimbursement on pre fixed rates which are subject to
periodical updating for sale of per tone pottasic/phosphatic fertilizers at MRP (Maximum retailed price)
issued by the Department of Fertilizers. For import of DAP/MOP it moves along the line of landing cost
dependent on the international price which is updated quarterly. Complex fertilizers are subsidized
based on nutrient contents of NPK. For MOP (K) consumption requirements are met fully through
imports therefore the rate of subsidy is decided based on the international prices and the MRP fixed by
the government.
2.1.10. GOVERNMENT RULES & LAWS
The Governments new fertilizer policy raised the price of Urea by 10% and placed a nutrition based
subsidy program which replaced the earlier product pricing regime and partially freed price (fertilizer
policy, 2008).it is evident that the policy has been designed to attract more investors into the Urea
manufacturing. The flip side is that the industry is already skewed towards urea as Potassium and
phosphorous based products are more expensive than nitrogen rich chemicals.
17 | P a g e
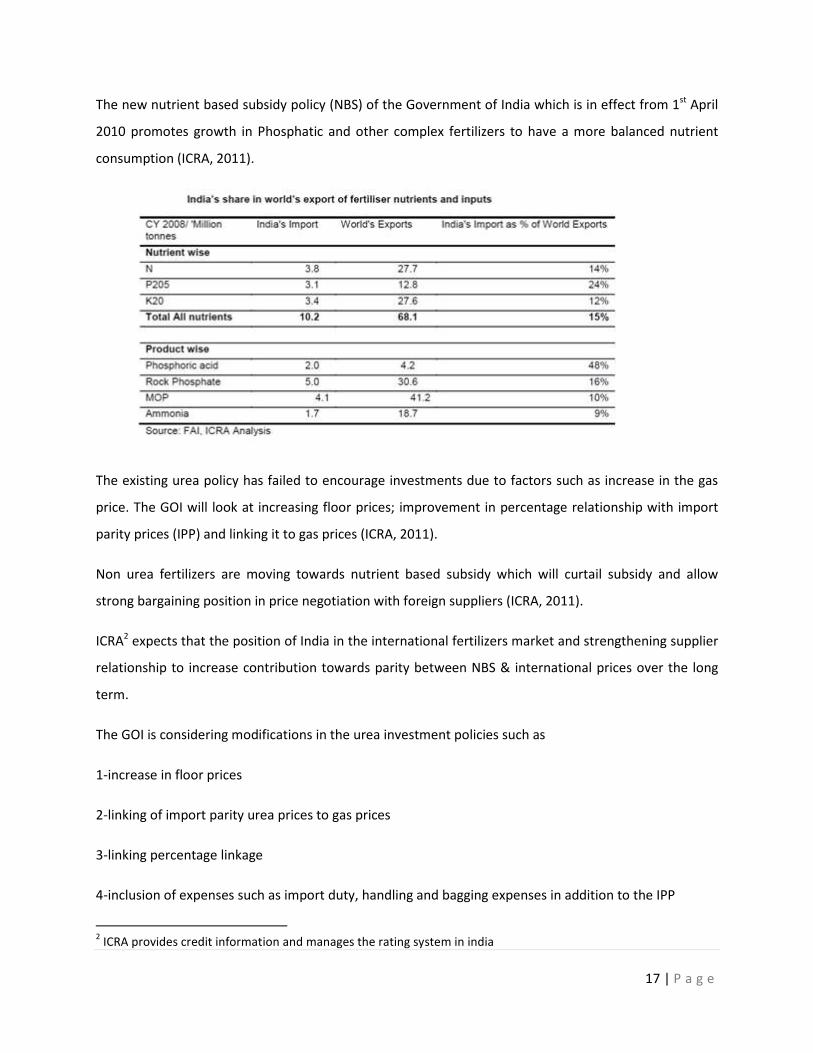
The new nutrient based subsidy policy (NBS) of the Government of India which is in effect from 1st April
2010 promotes growth in Phosphatic and other complex fertilizers to have a more balanced nutrient
consumption (ICRA, 2011).
The existing urea policy has failed to encourage investments due to factors such as increase in the gas
price. The GOI will look at increasing floor prices; improvement in percentage relationship with import
parity prices (IPP) and linking it to gas prices (ICRA, 2011).
Non urea fertilizers are moving towards nutrient based subsidy which will curtail subsidy and allow
strong bargaining position in price negotiation with foreign suppliers (ICRA, 2011).
ICRA2 expects that the position of India in the international fertilizers market and strengthening supplier
relationship to increase contribution towards parity between NBS & international prices over the long
term.
The GOI is considering modifications in the urea investment policies such as
1-increase in floor prices
2-linking of import parity urea prices to gas prices
3-linking percentage linkage
4-inclusion of expenses such as import duty, handling and bagging expenses in addition to the IPP
2 ICRA provides credit information and manages the rating system in india
18 | P a g e
GOI is also contemplating the introduction of Urea into the NBS for which all liquid fuel based units have
to be converted into gas which is a prerequisite for uniform implementation. The urea industry in India
is heterogeneous on account of variations in feedstock, plant vintage and energy consumption which
results in large variation in the cost of production. Due to this a uniform adoption for NBS for Urea may
lead to disparity.
The government of India tried to flex its bargaining powers by reducing subsidy benchmarks which
turned unsuccessful due to sharp rise in international prices which lead to a role back which turned out
to be a positive for industry participants and farmers. The initial subsidy which was at a steep discount
of 25 to 30% in comparison to the international prices lead to an inability to negotiate lower prices with
suppliers and to raise the farm gate price. Therefore GOI rolled back the subsidy cuts and brought the
benchmark to 5 to 10%.
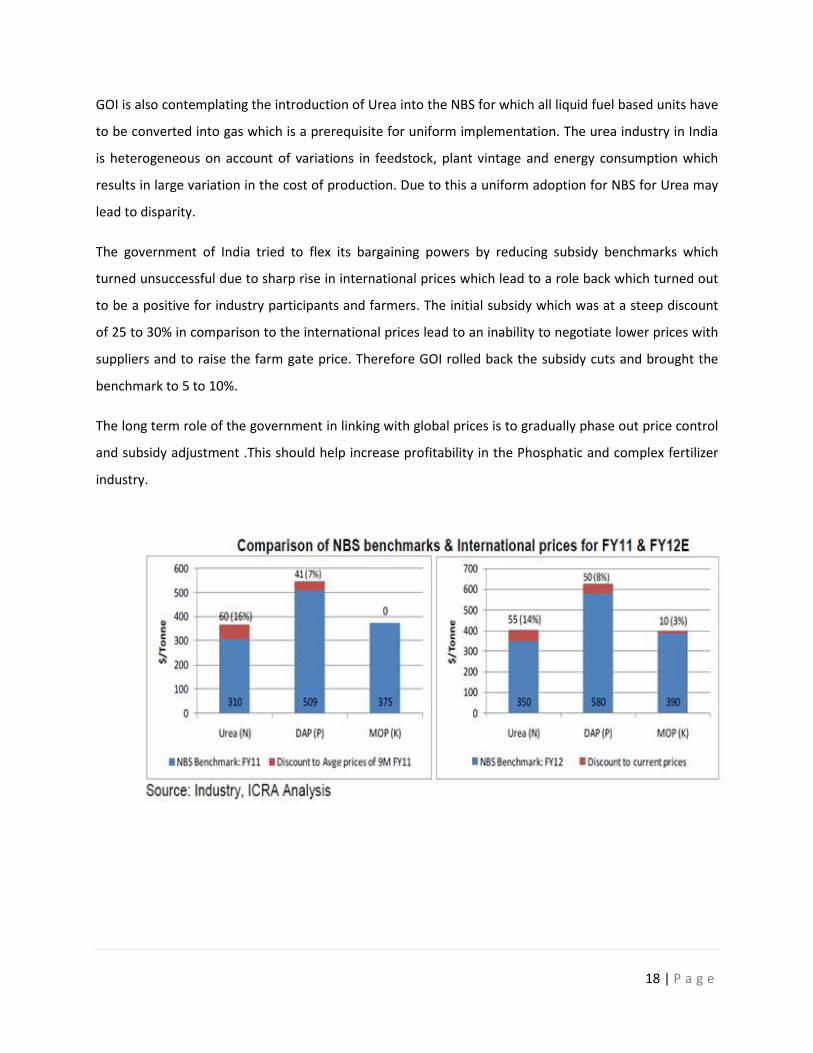
The long term role of the government in linking with global prices is to gradually phase out price control
and subsidy adjustment .This should help increase profitability in the Phosphatic and complex fertilizer
industry.
19 | P a g e
2.2. CRUDE OIL INDUSTRY IN INDIA
India was initially not known to the world for crude oil and it’s by products. In 1886 oil was discovered in
Digboi, Assam where the first refinery was set up in 1901(crnindia, 2010).Two other locations that were
identified were Chambay and Bombay. International companies were involved with exploration and
production but now the industry has been nationalised.
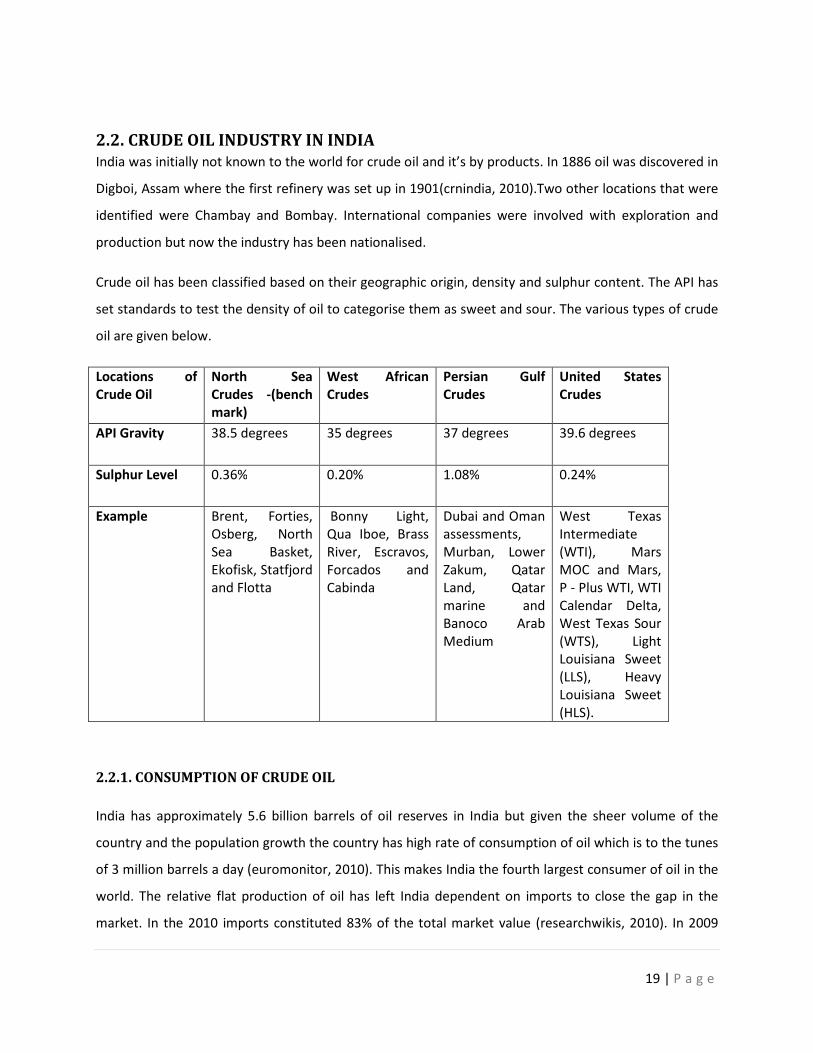
Crude oil has been classified based on their geographic origin, density and sulphur content. The API has
set standards to test the density of oil to categorise them as sweet and sour. The various types of crude
oil are given below.
Locations of
Crude Oil
North Sea
Crudes -(bench
mark)
West African
Crudes
Persian Gulf
Crudes
United States
Crudes
API Gravity 38.5 degrees 35 degrees 37 degrees 39.6 degrees
Sulphur Level 0.36% 0.20% 1.08% 0.24%
Example Brent, Forties,
Osberg, North
Sea Basket,
Ekofisk, Statfjord
and Flotta
Bonny Light,
Qua Iboe, Brass
River, Escravos,
Forcados and
Cabinda
Dubai and Oman
assessments,
Murban, Lower
Zakum, Qatar
Land, Qatar
marine and
Banoco Arab
Medium
West Texas
Intermediate
(WTI), Mars
MOC and Mars,
P - Plus WTI, WTI
Calendar Delta,
West Texas Sour
(WTS), Light
Louisiana Sweet
(LLS), Heavy
Louisiana Sweet
(HLS).
2.2.1. CONSUMPTION OF CRUDE OIL
India has approximately 5.6 billion barrels of oil reserves in India but given the sheer volume of the
country and the population growth the country has high rate of consumption of oil which is to the tunes
of 3 million barrels a day (euromonitor, 2010). This makes India the fourth largest consumer of oil in the
world. The relative flat production of oil has left India dependent on imports to close the gap in the
market. In the 2010 imports constituted 83% of the total market value (researchwikis, 2010). In 2009
20 | P a g e
India was the 6th largest importer with nearly imports of 2.1 million bbl/d (Satish et al, 2010). The crude
oil Industry is dominated by state owned enterprises. ONGC Oil and natural gas Corporation is the
largest oil company in India followed by other state owned companies such as Indian Oil Corporation
and Gas Authority of India Limited. The Indian oil and gas industry is forecasted to grow by 13% annually
over the period of 2011-2016 (economic times, 2011). The major oil reserves of the country are situated
at-
• Mumbai high (Mumbai)
• Upper Assam (Assam)
• Cambay (Gujarat)
• Krishna-Godavari basin (Andhara Pradesh)
• Cauvery basin (Tamil Nadu)
• Nagaland
• Arunachal Pradesh
2.2.2. REFINERIES AND PRODUCTION
It is the second most important source of energy in India after coal. Crude oil and its products account
for about 35 % of energy supply as against nearly 50 % by coal (crnindia, 2010). The production of India’s
industrial sectors compared to that of multi-national companies is very small. The country has less than
1% share in the global production of crude oil, 1.1 % in natural gas, 2.8 % in crude oil consumption and
1% in natural gas (IBEF, 2011).
Oil and Natural Gas Corporation Limited (ONGC), ONGC-Videsh Limited which is a subsidiary company
of ONGC Limited, Oil India Limited (OIL) are the main public sector companies engaged in exploration,
production and transportation of crude oil and natural gas.
The largest crude oil producing oilfield is the Mumbai high field that produces around 260.000 barrels
per day (financemasala, 2011). Among these production centres, major share is by the offshore reserves
as compared to onshore reserves. The refining capacity of crude oil in India is over 2.1 million barrels per
day. The refining sector in India is held by both public and private sector, public sector being the
dominating one. The major units pertaining to the oil sector in India are
21 | P a g e
• Indian Oil Corporation (Public sector)
• Oil and Natural Gas Corporation (Public sector)
• Reliance India Ltd (Private sector)
• Essar Oil Refinery (Private sector)
• Bharat Petroleum Corporation Ltd (Public sector)
• Hindustan Petroleum Corporation Ltd (Public sector)
• Mangalore Refineries and Petrochemicals Ltd (Public sector)
Both the upstream - exploration and production and downstream - refining, marketing and distribution
sectors were till late dominated by public sector companies. Lately however the private sector has also
been allowed to enter this field for exploration and production of crude oil. The prominent private
players include Reliance Petroleum Limited, Essar Oil Limited, Cairn Engineering India Pty. Limited and
British Gas. PSUs like ONGC & Oil India Limited account for 90 % of domestic production of crude oil &
natural gas.
However India depends on imports for nearly 70 %of its crude requirements. India has thirty-five major
fields onshore (primarily in Assam and Gujarat) and four major offshore oil fields (Bombay High, south of
Pondicherry, and in the Palk Strait).Cambay, Upper Assam, Bombay Offshore, Krishna-Godavari, Cauvery
and Assam-Aranka are few active basins with commercial production.
2.2.3. LOGISTIC DATA ON TRANSPORT OF CRUDE OIL
External
Crude from onshore oil fields is mainly transported through pipelines and in case of offshore oil fields,
sea-route is also used. Imported crude which comes via sea route is directly supplied to refineries taking
advantage of their coastal locations. Road and rail don’t playing any role in transportation of crude oil.
Key Port Location
• Mumbai Kandla
• Chennai
• Cochin
22 | P a g e
• Mangalore
• RawaVizag
• Chennai
• Nagapattinam
Out of the total annual production of crude oil around 32 million tonnes, coastal shipping moves about
16 million tonnes. As the domestic production of crude is likely to remain around 32 million tonnes in
the coming years (based on the Ministry of Petroleum and Natural Gas estimates) the Consultants do
not foresee any significant change in the pattern of coastal movement offshore. The only competing
mode of transport with coastal shipping for crude movement is pipelines, which directly transport crude
from oil fields to refineries.
Internal
Out of the 15 refineries belonging to Public Sector those at Digboi, Guwahati, Numaligarh and
Bonaingaon process indigenous Assam crude oil only. Cauvery Basin Refinery also processes indigenous
crude produced from Cauvery basin and PY-3 fields.
The refineries such as BPCL-Mumbai, HPC-Mumbai, CRL-Cochin, HPC-Vizag, IOCGujarat, IOC-Mathura,
MRL-Chennai process indigenous as well as imported crude. IOC-Haldia, IOC-Panipat and IOC-Barauni
refineries process only imported crude.
At present, there are three offshore oil fields operating in India producing crude oil namely Bombay High
(Maharashtra), Rawa (Andhra Pradesh) and PY-03.Domestic crude extracted from offshore oil fields is
transported by sea from Mumbai, Rawa and Cuddalore to coast based refineries at Mangalore, Cochin,
Chennai, Vizag as per variations in supply, demand and imports.
23 | P a g e
2.2.4. BY-PRODUCTS OF CRUDE OIL
Crude oil is a complex mixture of hydrocarbon molecules, which are molecules, made of long chains or
rings of carbon and hydrogen. Its primary use is as a raw material to be processed by refineries into
gasoline, diesel fuel, and airplane fuel. Quite a few products are made from crude oil.
• Bitumen - for roads and roofing
• Fuel - for ships and factories
• Lubricating oils, waxes, polishes
• Diesel fuel
• Jet fuel
• Petrol
• Chemicals
• Liquefied petroleum gas
• Others - plastics (Ethylene and propylene), rubbing alcohol, medicines (e. g. Aspirin), rubber.
2.2.5. GOVERNMENT INITIATIVES
The Indian government has introduced policies which are aimed at increasing production and
exploration activities in India. The NELP –New exploration license policy permited foreign countries to
hold 100 % equity ownership in oil and gas projects(economic times,2011).The government is promoting
FDI so as to improve the technologies in the market and increase productivity.
Most of the oil state owned oil companies are said to be running on a loss as the government subsidises
the price of oil in the market after the crude oil is imported. Only recently did the government de
regulate the prices of petrol but diesel and other products are still regulated. The oil refineries importing
crude oil are given tax benefits and incentives to cover costs of crude oil refining. Many of the policies
and data linked to this is unclear as different sanctions are available depending on the state where the
refinery is present.
The country is also looking at developing strategic petroleum reserve. This will make India a point where
crude oil reserves can be stores. The government is looking at the construction of storage tanks with the
capacity of 36.7 million barrels. The locations being considered are places along the east coast and
Mangalore.
24 | P a g e
Quiet recently, the ONGC Videsh Limited has shown keen interest in acquisition of equity oil in countries
like Russia, Vietnam, Iran, Iraq, Venezuela, Algeria and some of the African countries. India has made its
single largest investment abroad through ONGC Videsh limited with an investment of 2.77 billion. Of the
23000 barrels of oil and 58 million cubic feet of gas produced a day in Sakhalin India will get 20% in
proportion to its equity. The company has invested in the buyout of a Russian firm Imperial Energy for
about USD 2 billion and is seeking access to more Russian oilfields. India also wants to use Russian
influence over some Central Asia countries to secure energy supplies.
The transport of oil from is becoming a significant issue. Russia proposed for a 7 billion project to lay a
pipeline from Iran across Pakistan to India for which United States opposed the project as it would
involve building up of Iran’s energy infrastructure.
CONCLUSION
From the above reports it is understood that there is a good potential in the market for both the
industries. The fertilizer industry consists of both deregulated and regulated sectors. There is a gap in
the market for urea and potassium based fertilizers. Both these requirements can be met only through
imports. The channels for the trade are different as the controlled sector would be handled by the
government ant the decontrolled would be through trade channels.
In the crude oil industry there is a requirement for crude oil as India cannot meet its demands with its
existing capacity. The trade process is carried on directly with state owned refineries and a few private
companies. As orders are based on tenders and the companies are directly involved in the tender
process the approvals are also done by the same firm. Since these companies are owned by the
government it is highly possible that the industry will have political influences during the tender release.
25 | P a g e
CHAPTER 3 - LITERATURE REVIEW
In this section we review the entry barriers present while entering a new market. We initially look at the
external environment as a whole to understand the Political, Sociocultural, Economic and infrastructural
factors that act as an entry barrier to new market entrants. On analyzing the external environment we
review factors that cause barriers internally to the firm’s market entry. These factors consist of
competitiveness in the market, distribution channels, capital requirement, infrastructure, economies of
scale, distribution and exit barriers. Corruption is a major factor that firms need to tackle in new
markets. The second part of this section discusses various view points of corruption and the implications
of it. Finally we discuss about the different models developed around the internationalization process
and the benefits and critiques of these models.
3.1. ENTRY BARRIERS - EXTERNAL
3.1.1. POLITICAL FACTORS:-
Political factors is given as the amount of government intervention in the given countries economy.
Tariffs, Quotas, Restrictions on investment and subsidies are the factors that are government enforced
with the intention to protect domestic industries. This can be seen in industries which represent a large
voting blocks, Industries that serve as a symbol of a countries modernity and competitiveness, industries
which linked to natural security and industries connected to essential goods, Producers of entitlement
goods or services such as health care, Exploiting of natural resources and industries that require high
sunk cost (Ghemawat ,2001). Historic and politic factors between countries greatly affect the process of
business between the countries. According to Ghemawat (2001) Colony colonizer links between
countries boost trade by 900% which is seen where Britain has continued its ties with its former colonies
in commonwealth.
Political factors and risks are important for international activities and since it takes many forms
different facets of the risk need to analyze depending on the type of internationalization of the firm
(Agarwal, 2007).Failure to understand political risks and the important factors of it can lead to poor
decisions which would affect the business venture.
Political factors are highly relevant in the pre and post entry of the process model of
internationalizations (Bascarri et al, 2000). Stapenhurst (1992) stated that political risks is of less
importance to exporters as less capital is at stake but loss of revenue exceeds the value of expropriated
26 | P a g e
assets (Gillespie 1989).This can be seen where goods exported undergo conflicts which lead to the loss
of payment for the goods and the loss of future sales. Henisz & Wiliamson (1999) addresses the issue of
tackling the political risks by transaction cost analysis where the firms weigh in the costs and benefits of
political governance structure and policies and the likely political hazards that could occur in the host
country.
Torre and Neckar framework explains the various political risk factors as it includes economic, political,
internal and external dimensions. The analysis is based on Internal – economic, External-Economical,
Internal Political and External political.
Internal Economic Factors
It is the analysis of the host country and the rate of development based on the per capital income, Price
Index, Income distribution and economic growth. Countries look forward to development through joint
ventures to bring in new technology development. Countries may be looking forward to foreign
investment and would mold their policies to promote trade. At the same time more conservative
countries would have strict policies to ensure that trade is controlled. By analyzing these economical
factors one can understand the nature of the host country.
External Economic Factors
These factors consist of factors such as foreign trade, external debt, and overall balance of payment,
capital flights and indicators such as foreign exchange rates of the country. Protectionism is give as the
amount of import restrictions by tariffs and quotas. By analyzing the level of protectionism in the host
country it will help in determining the policies in the future. Countries with high debt outstanding will
have fluctuating policy changes and would have destabilizing, political, social and economical
consequences (Miller 1992).Capital Outflow are also given as restrictions on foreign exchange reserves
imposed by the host country government. It indicates the level to which governments will intervene in
conditions of economic difficulties and lobbying by pressure groups. The level of intervention by the
host country will give a better understanding on the restrictions in the future. Exchange rates in another
factor that will give us an insight into the likely hood of the government introducing new policies.
Unstable foreign exchange rates lead to economic problems which will in turn lead to political risks (Eun
et al, 2005).
27 | P a g e
Internal Political Factors:-
The internal political factors are given as the situation in the host country, the social structure and the
balance between the people’s requirements and the quality of leadership. By analyzing factors such as
Political stability, level of democracy, corruption and level of red tape we can understand the extent to
which the government intervention exists in the economy.
Rules, taxes and restrictions are set in countries based on political situations and the instability can
cause instability. Changes and different ideologies can bring in changes in government policies. This is
also linked to the level of democracy where in elected officials in the executive and legislative branches
of the government reflect the will of the people (Agarwal, 2007).Democracy is less prone to radical
policy change as satisfied people are less likely to start a revolution. The degree of red tape in the
country is given as the layers of operational and administrative rules and procedures which may be
politically initiated (Agarwal, 2007).This can also involve the level of corruption and bribery. It is found
that less corrupt countries which are transparent are able to attract more FDI (zhao, 2003).
External Political Factors:-
International issues, conflicts, regional issues, political conflicts and general attitudes to foreign business
can externally effect and induce the political situation in the host country. To further understand
External political factors we analyze with two concepts which are - regional / international political
conflicts and the analysis of the general attitude of the host country government towards foreign
business (Agarwal, 2007). International conflicts include the relationship between the home country and
the host country. The attitude of the host country to international trade would give an insight on the
level of political risk and the level to which the present government would intervene in the market.
3.1.2. SOCIOCULTURAL ENVIRONMENT
In international markets it is it is important to understand the various norms in behavior and understand
personal values to be able to market to the target audience. Cultural factors determine the values that
influence the business/industry culture which further influences the culture of the individual company
(Hollensen, 2008). It is usually simpler to do business with customers who share more common factors
which can be seen across country borders. Differences in religion, beliefs, race, language and social
norms are capable of creating distance between two countries (Ghemawat, 2001). Countries having
28 | P a g e
similar factors will tend to be more amicable to each other where in factors such as language and
religion can be easily understood but subtle factors such as social norms are more difficult to
understand. Products and consumer behavior can touch a deep nerve which can trigger association
related to consumer identity as part of a community (Ghemawat, 2001).An example of this would be
that Star TV had seen Asia as a market with great potential and over looked the cultural distance. The
company suffered huge losses as they had predicted that the Asian viewers would be happy with English
language where as if they had taken cultural distance into account they would have understood the
need to localize.
According to Taylor (1881)” culture includes knowledge, belief, art, morals, law, customs and any
capabilities and habits acquired by man as part of society”. Culture incapacitates many factors and
Hollensen (2008) explains it by dividing it into 3 sectors which are - The visible daily behavior (body
language, clothes) Value and social morals (family morals, friendship patterns), basic cultural
assumptions (national identity, ethnic culture, religion). Halls (1960) used language communication to
make a generalized division between low context and high context culture. Classifying of culture is
essential in developing marketing and advertising strategies as it would be easier to understand the
fundamentals of the host country.
Language is given as the key to culture and while learning a language one tends to learn also the culture
from which it derives. Murdoch (1945) divides language into two major elements which are verbal and
non verbal language. Verbal communication is an important means of communication where in the
words that are pronounced and the type of words used give a lot of meaning on the type of person. In
non verbal communication according to Hall (1960) is a powerful means of communication where in
90% of the message is communicated. In many countries a lot is understood by the means of non verbal
communication. This can be seen in the way MNC advertise their products differently in different
countries.
Manners and custom is another factor which should be carefully monitored. This is important
understanding in negotiation process as interpretations which are based on framework of reference
may lead to a totally incorrect conclusion (Hollensen, 2008).By observing basic customs of different
regions the typical nature can be studied.
Material culture is one factor which is developed from technology and is related to how the society
functions. Convergence happens based on technological advancements. Technology is accepted based
29 | P a g e
on the advancement and which is most suitable pertaining to a select sector. Some technology is easily
accepted where as others take time to be accept.
Social institutions tend to influence the way people relate to one another and how they behave within
each other. According to Hollensen (2008) primary reference groups consist of family, co workers and
intimate groups. Secondary groups are given as organizations where less continuous interaction takes
place like trade organization. This influences the role and discipline under which the manager operates
with their subordinates.
Education is a function of transferring skills ,culture and tradition to new cultures (Lee, 1966).The
process of education vary in different countries based on their value system therefore one cannot
recruit based on a standard form on requirement. The education system is usually tied to the values and
attitudes. The central belief is developed from religious beliefs. Conservative societies are more risk
averse where as new systems and concepts take time to be accepted. Education can be used to educate
and change beliefs for the better. These values can be seen on aesthetical factors such as how a product
is packaged and marketed. This can give a lot of in-depth information on how organization cans convey
positive messages in different markets.
Hofstede (1983) identified the fundamental differences between cultures along four dimensions which
are power distance, uncertainty avoidance, individualism and masculinity. He developed a model of 4+1
dimension which helps explain values and motivations used in marketing and advertising across
cultures. By understanding cultural differences company’s can have a better understanding on which
markets to enter and which markets are not attractive. They will also be able to negotiate with a clear
understanding of the fundamentals of the host country. “The right mix between local knowledge of
different cultures and globalization of national marketing strategies is given as the key to success in
global marketing” (Hall, 1960).
3.1.3. ECONOMIC FACTORS:-
The wealth and economic condition of consumers affect the level of trade and the level of partnering.
“Countries that are economically rich engage with more cross border economic activity with countries
on the same lines rather than poorer countries” (Ghemawat, 2001).
Hollensen(2008) explains that Economic development are developed from one of the 3 types of
economic activities. The primary economic process is concerning agriculture and extractive process.
30 | P a g e
Secondary is given as the manufacturing activities where in the output of the primary is processed.
Tertiary is given as the activities based on services.” When the average income of the family rises the
percentage of income spent on food declines, the percentage of spending on house hold activities stay
constant and percentage spent on service activities will increase”(Hollensen, 2006).
The exchange rate is a key economical factor that effect both domestic and international companies.
When the country’s currency is week the price of exports in the world market will decline where as the
price of imports will increase (Hampton, 1977).These factors lead to a battle for market share as prices
would fluctuate. This fluctuation would lead to firms competing on the differences occurring in the price
difference due to exchange rate fluctuations. This is the reason why more international businesses are
carried out with countries which have a stable exchange rate.
The national government is also involved with controlling the fluctuation of currency. Devaluation and
revaluation are seen in different countries where in governments devalues currency to give local
companies an edge over competitors or boost exports (Schweickert , 1993). The repercussions of this
would be the inefficiency caused due to less pressure in production cost which can lead to inflation.
Revaluation increases the imports and reduces exports. By understanding the nature of the economic
situation in the host country we can understand the opportunities that the market process.
The measure for economic development is given as GNP (Gross national product) which is the value of
all goods and services produced by the country in a year. This includes domestic production and
international activities. Gross domestic product (GDP) is given as the value of goods and services in the
domestic market over a period of one year. By analyzing the GNP and GDP of a country one can
understand the economic conditions prevalent in the country.
Economic integration is when countries engage in economic cooperation to use their resources
effectively to provide large markets for member countries (Kruger, 1977).Free trade area is a type of
integration where barriers for trade among the member countries are removed. EFTA is one such type
of free trade involving eight European countries. Customs union is another type of integration which
goes one step further where a single common trade policy is established with non members where as
the members have freedom of trade in goods and services. Common markets in similar to customs
union but allow production factors such as labor, capital and technology freely among members.
Economic union is the most integrated where in the economic policies are also integrated. Within the
member’s policies, currencies, taxations, spending are all harmonized.
31 | P a g e
By understanding the different type of economic factors that are prevalent in countries it is easy to
frame the basic characteristics of a target market so as to understand the possibility of success in the
entry of new markets.
3.1.4. INFRASTRUCTURE
Large corporate and MNCs have always faced critical challenges in entering new markets and using
standardization approach at the same time experimenting with local approaches. Companies that are
looking at new markets use tools such as portfolio analysis, political risk assessment which focuses at
profits but leave out information on the soft infrastructure present in these countries (Khanna, 2005).
Companies tend to take for granted infrastructure that exists in their home country and fails to
understand the difficulties that they would face in the host countries with underdeveloped or inferior
infrastructure.
Today developing countries have been the focal point for fast growing markets in product and services
where skilled labor and trained managers are inexpensive(Chowdhury, 2009).Developed countries are
investing in developing countries to take advantage and stay competitive in the market but it shouldn’t
be assumed that business can be done the same way in both the countries. This is due to the quality of
infrastructure that varies from country to country. Advanced economies have large number of market
intermediaries and efficient contract enforcing mechanism whereas less developed system have
unskilled intermediaries with less efficient legal systems (Khanna, 2005).Due to this corporate are
finding it difficult to transfer their strategies to their host countries in emerging markets. Successful
organizations use new strategies and techniques focused at making most out of operating in emerging
markets.
It is essential that when companies develop strategies that they initially understand the differences in
between the two countries by understanding how the product, labor and capital markets work in the
target countries. The term infrastructure covers services from public utilities like power,
telecommunications, piped water supply, sanitation, sewage, disposal, and piped gas to public works
such as roads and transport sectors such as railways, ports, waterways and airports (Cavusgil et al,
2002). Many countries lack these basic services due to poor planning. This is one factor for which most
develop countries do not invest in countries which lack these basic factors. Developed countries like
china and India have infrastructure but it is not in tune with the technologies and standards available in
the developed economies.
32 | P a g e
The infrastructure of a country is divided into 3 groups which are energy, telecommunication and
transport. Energy consists of electricity, oil and gas. The telecommunication consists of services
comprising of telephone services, mobile phones, internet and broadband connectivity. These are
essential factors in ensuring connectivity. Transportation factors are essential to reduces transaction
costs and increase efficiency. This includes land, air and sea. Infrastructural factors that affect logistics
are the quality of roads, railways, airports and ports.
It is essential that any organization entering developed economies should scope the host country for
infrastructural deficits that will affect their investments. Western firms can use this deficit in
infrastructure in the host country as an opportunity in business or develop infrastructure to meet their
needs(Cavusgil et al, 2002).For example china suffers from its intercity transport system which supplies
raw materials, cola and electricity. This result in power shortages coal accounts for 70% of china’s power
generation (World Bank country brief, 2000).India also faces shortage in power and to support its
growing requirements it needs to double its electrical generation capacity. (Financial times survey, 2000)
3.2. ENTER BARRIERS - INTERNAL
3.2.1. COMPETITIVENESS OF EXISTING FIRMS
Based on the attractiveness of the industry and the number of players in the market the profitability of
the industry can be analyzed. In the case of intense rivalry between firms in the industry it can lead to
low profitability due to intense price wars. The pressure to use capacity under these situations to
increase efficiency will act as additional pressure to cut costs.
If there are no barriers to entry in the market then competition in the market will correct by situation by
the entry of new players into the market which will drive up production and drive down costs(Pepperell,
1981).The factors that make entry difficult into a market impair efficiency. Antitrust laws are prevalent
to bring in a fair amount of equality in the market among competitors. To ensure that this form of
equality is maintained in the market the government is given the rights to oversee and tackle issues.
Barriers to entry are given as barriers that misallocate resources and reduce the vigor of competition at
the expense of the customer (Pepperell, 1981).
33 | P a g e
3.2.2. ABSOLUTE CAPITAL REQUIREMENT
Firms over investing to inflate artificially to make new entrants believe that they need to do likewise if
they have to compete (Comanor, 1967).This comes in as a barrier since new firms would be pessimistic
noticing the high costs involved in the market entry. It is argued that this would happens only if the firm
is sure of the profits that it will make will cover the costs incurred as this would otherwise lead to losses
which would alternatively help their rivals.(Kendrick, 1976)
The existing firms also tend to operate on a higher run average cost as they would have access to
superior production process, hold patents or be party to trade secrets. Due to this existing firms would
be trying to achieve economies of scale. The new entrant would take time to catch up to the existing
firm technology. It would take existing firms more time to learn the trade secrets of the industry to
compete against existing firms. Also new entrants may control the best raw material or will have the
most experienced labor or management experience (Lananginier, 2004). Therefore new entrants are
exposed to more expensive, less efficient, low quality alternatives.
High amount of capital is required to constitute a barrier of entry (Bain, 1967).Over investment would
raise costs above competitive levels and would give a built in cost advantage (Pepperell, 1981).Capital is
a cost that is required to achieve efficiency. If an industry is very attractive then the no of players
entering the market will be regardless on the level of investment that will be necessary.
3.2.3. COST OF CAPITAL
It is said that new entrants into a market is placed at a disadvantage due to high interest levels that the
company has to incur due to the money borrowed (Pepperell, 1981).This is because the firm lacks
history in the new market and would have to pay high interests to secure loans. Existing firms have
access to cheaper sources of finance if they are viewed by capital markets as less risky than new
entrants. This happens due to the variation in the amounts borrowed and the accumulation of interests.
However if the new entrant is a well established firm it will be able to borrow capital at the same
interest as the existing firms in the market (Hollensen, 2008).
3.2.4. ECONOMIES OF SCALE:-
According to Lipczynski (2005) economies of scale can act as a barrier to entry in two ways. One of the
ways is institutions where fixed costs are highly relative to variable costs is that the minimum efficiency
scale is large in relation to the size of the markets. Companies need to increase their output levels to
34 | P a g e
decrease over all costs. Secondly when average costs associated with product costs below the minimum
efficiency scale are greater than average cost at minimum efficiency scale. The dilemma that it leads to
is entrants need to accept the risk with large scale entry to avoid average cost penalty or they enter
small scale and absorb the average cost penalty.
For new entrants it is essential to take over a large area of the market to take advantage of the
economies of scale (Pepperell, 1981).This can lead to issues where in the increased levels of output
would force price below cost which would affect profitability. (Scherer, 1976) The need for the
government intervention is necessary as this would build a balance in the market.
3.2.5. PRODUCT DIFFERENTIATION
This is when a firm tries to differentiate its product and services from rivals such that it can raise price
which will be more than the cost of differentiation which will result in superior profitability
(Richards,2008).The fundamental factor behind this is that buyers are aware of the differentiation and
rivals cannot match the quality of the product provided. Though this has many benefits there are risks
involved in differentiation such as high cost of product can drive buyers to switch to basic products
under economic crunch. .Another risk is when there are to many differentiated products in the market it
can lead to confusion from the buyers side.
Yuter Wang (2007) explains about how differentiation between the domestic and foreign firms affects
the level of tariff on import. The balance of well differentiated products In a market will help drive down
costs of tariff on the product.
3.2.6 DISTRIBUTION CHANNELS
The choice of distribution is one of the crucial factors in export issues. Distribution process can be on
two sections which are direct and indirect export modes (Ford, 2002). Indirect export modes consist of
export houses, confirming houses, buying houses, piggybacking. Direct export modes consist of agents,
distributors, direct selling and local sales office. These are fundamental character differences in the
export distribution channels and it is essential that firms choose these channels viewing these factors.
An example of this is that agents does not own the goods and is paid commission on sales and
distributors take ownership of the goods and make a revenue on the markup.
A constant issue faces in distribution is the power and conflicts in channels that occur where companies
form alliances to increase their power over channel members (Palamountain, 1955).This is done to
increase entry barriers for new entrants in the market. Companies can excise an indirect control on
35 | P a g e
market share. The new entrant company also faces difficulties during the process of change in a channel
process against the opposition of surrounding companies (Pepperell, 1981).
3.2.7. EXIT BARRIERS
If a firm undergoes difficulties to leave the industry the exit capacity would become an issue and would
affect the industry with low profitability (Richards, 2008). This is due to the firm having specialized
assets, government intervention or emotional barriers established with established family firms.
The time of new venture entry there should be an equally well planned exit strategy so that firms can
exercise its options of terminating their operation (Pepperell, 1981).Matthews (1977) suggests the use
of Trend impact analysis which gives an advanced performance signal which can be used to alert
management to the possible failure of the venture which will give a need to consider an exit strategy .It
also projects the results of alternative strategies and subjective judgments can be made.
Various Economic, Strategic and managerial forces may influence the height of exit barriers( Porter,
1976).Exit barriers present in markets trap firms which results in destructive competition and reduced
profits (Porter 1976). Caves &Porter (1976) stated that these barriers prevent firms from changing their
strategy. This can be fundamentally backed by the government to ensure that firms do not switch
markets easily.
36 | P a g e
3.3. CORRUPTION
According to Webster’s international dictionary (1961) corruption is defined as inducement by means of
improper consideration like bribery which leads to commitment to a violation of duty. A bribe is given as
a gift, favour, price or reward given to influence the judgement or corrupt a person in position of trust
(Dwivedi, 1967). Both bribery and corruption is usually linked in some way but can stand independent of
each other. A person who takes bribes is corrupt but a person who does not take bribe can also be
corrupt.
Corruption is seen in different ways in different parts of the world. There is always a conflict between
the ideologies of the western countries and the non-western countries. What might be corrupt in the
western countries would be normal and accepted in the non-western countries. Developing countries
like India find corruption a part of their daily lives. David H Bayley (1966) explains in his journal about
the point of view of a Delhi business man who feels that corruption and bribery are foreign words and
giving presents and gratuities to government officers was an indispensable courtesy and a respectable
civilian way of carrying out business (Bayley, 1966).The concept of what is a permissible and
impermissible behavior becomes hazy in countries where corruption prevails. According to J.S Nye
(1967) few characteristics of countries that face corruption are:-
a) Countries with Inequality in the distribution of wealth.
b) Countries where business and markets are tightly held by the government and access of gaining
wealth is only through the political office.
c) There are conflicts in the changing moral codes. This can be seen in India where the cast system
brings in a lot of disparity and conflicts between people.
d) The government and the society I not strong to enforce regulation.
e) Countries which lack a sense of national community.
Andrei Shleifer (1993) differentiates corruption into two types of corruption where one is without theft
and the other which is theft. Without theft is when the officer charges a price over the official cost and
keeps the additional charges and returns the charges to the government. Theft is when the officer takes
the total amount for himself the does not give to the government. In the first case the initial cost of the
service would go up. In theft the cost would be equal or lesser than the original cost but the total
amount would go towards personal gains .Bayley (1966) points out the effects of corruption as:-
37 | P a g e
a) Corrupt acts can lead to failure of the government to achieve the target goals set by them.
b) It leads to a rise in the price of administration where the tax payer if forced to pay additionally
to the same service amount due.
c) In the form of kickbacks it takes the form of total amount expended for public purpose. It is the
diversion of resources from public to private.
d) Corruption erodes morality and influences members of the administration to adhere.
e) Corruption in the government lowers the respect for constituted authority.
f) Corruption will hinder the growth of developing countries as these individuals would be self-
centered and would put his prospects before that of the country.
g) The effort that would be spent in enhancing credentials, strengthening ones cases goes into the
task of lobbying to develop enough influence to offset the claims of others.
h) The attention and energies of officers and nonofficial are divested into unproductive wrangling
as black mailing and treats would follow where corruption exists.
i) Corruption causes decisions to be weighed by money rather than human needs.
According to David H Bayley (1966) corruption exists in many developing nations and it forms a
prominent or non-avoidable feature of bureaucratic life in these nations. It is suggested that in the case
of countries facing pervasive and cumbersome regulations corruption may improve efficiency and help
growth (Bardhan, 1997).Non economists suggest that corruption is the much needed grease for the
squeaking wheel of a rigid administration (Bayley , 1966).J.S Nye(1967) points out few benefits :-
• A Capital formation is when private capital is scarce and the government lacks the capacity to
tax surplus because the economic conditions are that there is high difference between the rich
and the poor with the majority being poor. Here corruption would an important form of capital
formation. The point of question would be if the capital is put to constructive use.
• In countries where there is to many restrictions where in the process of checking several times
would not work well for the country. Inadequate administrative resources could be mitigated by
corruption to avoid Red Tape ideologies. An import reason why regulations and permits exists is
probably to deny them to collect bribes in return for the permits (De Soto, 1989).According to
Schumpeter entrepreneurship is a vital factor for economic growth and in countries where there
is an ideological bias against private incentives corruption would be a tool to gain access to
political decisions which are beneficial.
38 | P a g e
• it is assumed that a if the members of politics share a sense of community then there is more
ease to cope with change and preserve legitimacy. Elite integration is when corruption brings
about ability to overcome divisions between ruling parties and allows the process of assimilation
of each other. This brings in a form of National Integration within the country. If corruption does
not exist then the constant fight for power would lead to destruction.
• Governmental capacity corruption is given as situations where the laws are underdeveloped and
the powers to control new institutions are not present. In these situations leaders in these
countries would have to rely on ideal, coercive or material incentives to aggregate powers to
govern. This form of corruption would help in the transition face of the country.
One factor that can be concluded is that under conditions where corruption helps in the contribution
towards the betterment of the country corruption is acceptable but when corruption leads to waste of
resources, capital outflow, Investment distortion it leads to instability and would affect the economical
growth of the country. It is observed that corruption can be seen in different lights where in several
authors have stated that certain kinds of corruption are desirable (leff, 1964) but the process of having
no control to what levels would be right and wrong brings us to the conclusion that corruption is not
beneficial to development of the country. Studies by Klitgaard (1991) conclude that corruption slows
down development.
3.4. INTERNATIONALIZATION
3.4.1. UPPSALA INTERNATIONALIZATION MODEL:-
This model came into being in the 1970s when research was conducted on internationalization process
on Swedish manufacturing firms. The model deals with how the organization learns and the impact of
learning on organizational behavior and investment (Johanson et al, 1977). It emphasizes on learning
through ongoing activity. International activities require general knowledge and market specific
knowledge where in the general knowledge is transmitted from one country to another but market
specific knowledge is gained through experience. The concept of market commitment consists of two
factors which are the amount of resources committed and the degree of commitment. Resource
commitment is the amount of resources that could be operationalized to the size of investment in the
market. Degree of commitment is the difficulty of finding alternative resource and transferring them to
alternate uses.
39 | P a g e
Through incremental behavior firms can control foreign ventures and slowly build knowledge on how to
conduct business in new markets (Carlos, 1966).The model is based on 4 core concepts which are
market knowledge, market commitment, commitment decision and current activities (Forsgren,
2002).Johnson (1975) distinguished 4 types of entry into an international market where the successive
strategies represent higher levels of involvement. The model is based on the fact that
internationalization of a firm undergoes this step wise process.
Turnbull (1987) found that firms with international experience use various approaches for market entry
and need not go through middle men and that their ultimate goal is not limited to production .Buckley
(1987) stated that firms would use a mixed approach to individual foreign markets. Johanson (1990) in
response to these factors suggested three exceptions .First the firms with more resources should make a
larger internationalisation step; secondly when there are stable markets firms can increase their market
knowledge and thirdly firms with substantial experience can generalize their experience to specific
markets.
3.4.1.1. THE UPPSALA MODEL NEGATIVES:-
The model was introduced in the 1977 and since then there have been research on internationalization
which can build on the existing model. It is argued that the model uses a narrow interpretation of
learning which leads to a narrow prediction of the internationalization literature(Hollensen,2008).The
assumption that of a loosely coupled perspective on the organisation is problematic with regards to the
discussion on how market commitment and market knowledge effect further internationalization
behavior (Forsgren, 2002).
The model emphasizes on experiential learning through ongoing activities. This is a long drawn studies
conducted by Hanson (1999), Kraatz (1998) and others show that through business relationship
organizations can gain access to the knowledge of other firms. The process can be shortened through
hiring of individuals with the required expertise from which the organization can learn (Barkema,
1998).Researchers such as Bjorkman (1990) has suggested the process of imitative learning by learning
from other successful firms.
It is also criticized that the model uses a more reactive rather than a proactive perspective of learning
(Forsgren, 2002).This can lead to a loss in stimulating need for new process and techniques which can
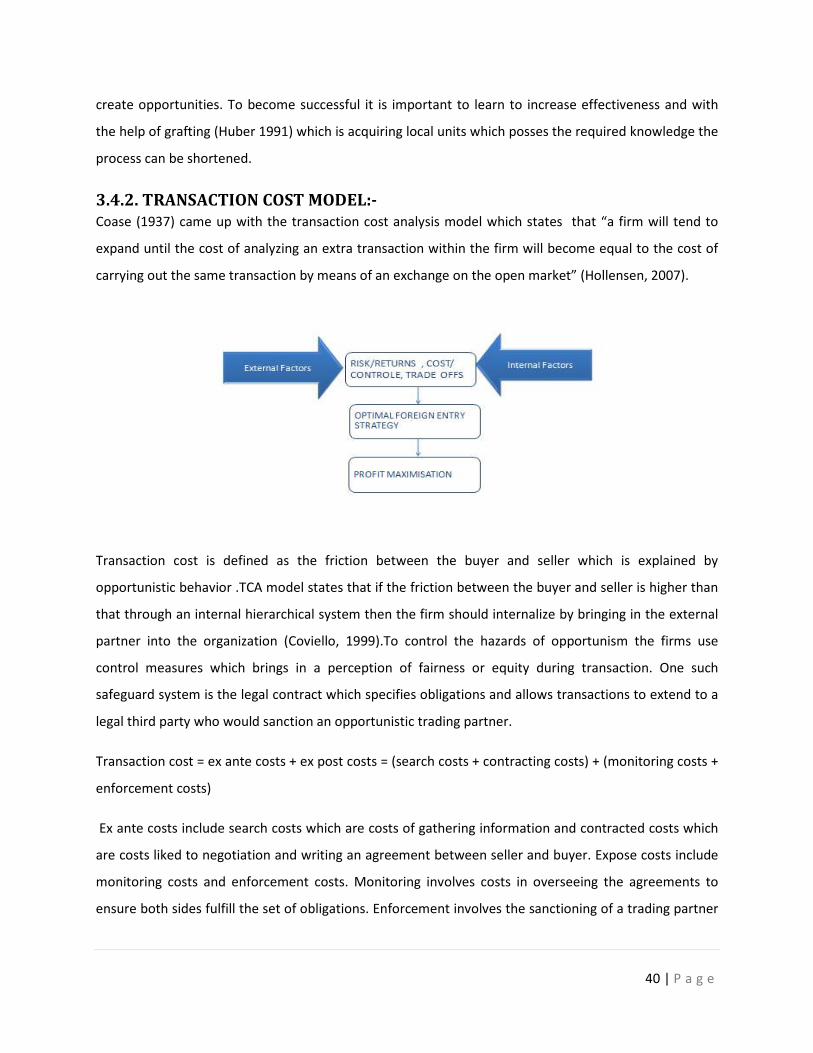
40 | P a g e
create opportunities. To become successful it is important to learn to increase effectiveness and with
the help of grafting (Huber 1991) which is acquiring local units which posses the required knowledge the
process can be shortened.
3.4.2. TRANSACTION COST MODEL:-
Coase (1937) came up with the transaction cost analysis model which states that “a firm will tend to
expand until the cost of analyzing an extra transaction within the firm will become equal to the cost of
carrying out the same transaction by means of an exchange on the open market” (Hollensen, 2007).
Transaction cost is defined as the friction between the buyer and seller which is explained by
opportunistic behavior .TCA model states that if the friction between the buyer and seller is higher than
that through an internal hierarchical system then the firm should internalize by bringing in the external
partner into the organization (Coviello, 1999).To control the hazards of opportunism the firms use
control measures which brings in a perception of fairness or equity during transaction. One such
safeguard system is the legal contract which specifies obligations and allows transactions to extend to a
legal third party who would sanction an opportunistic trading partner.
Transaction cost = ex ante costs + ex post costs = (search costs + contracting costs) + (monitoring costs +
enforcement costs)
Ex ante costs include search costs which are costs of gathering information and contracted costs which
are costs liked to negotiation and writing an agreement between seller and buyer. Expose costs include
monitoring costs and enforcement costs. Monitoring involves costs in overseeing the agreements to
ensure both sides fulfill the set of obligations. Enforcement involves the sanctioning of a trading partner
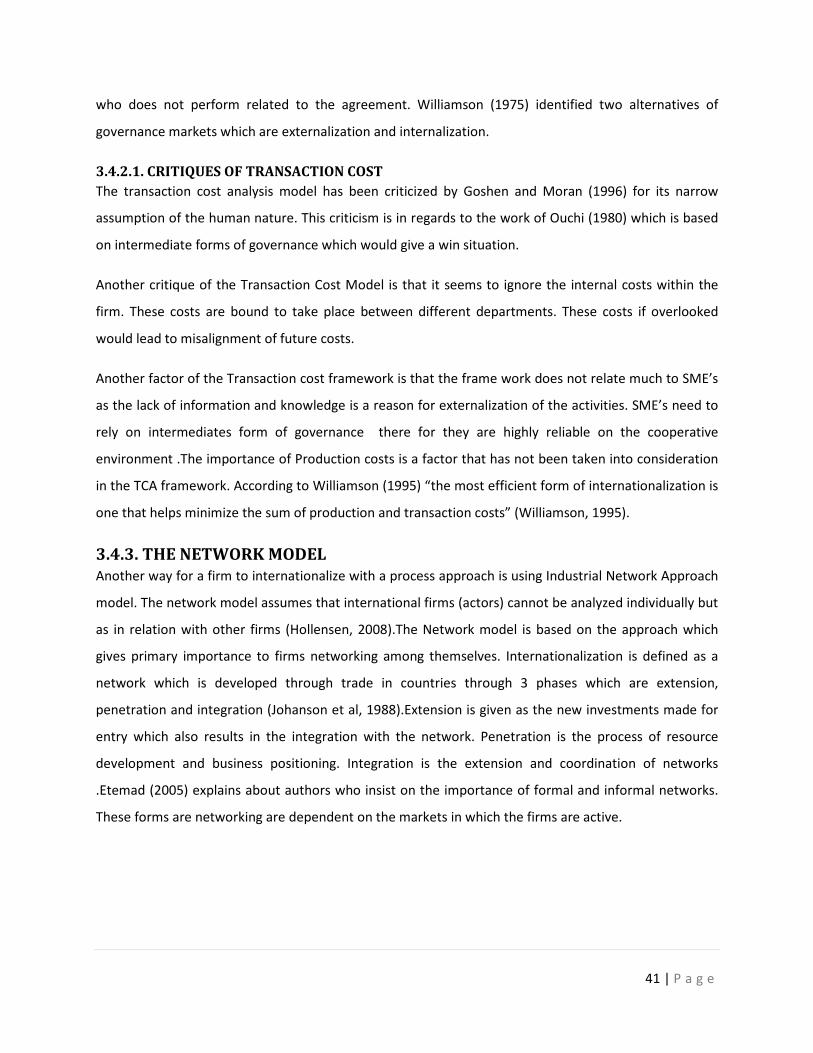
41 | P a g e
who does not perform related to the agreement. Williamson (1975) identified two alternatives of
governance markets which are externalization and internalization.
3.4.2.1. CRITIQUES OF TRANSACTION COST
The transaction cost analysis model has been criticized by Goshen and Moran (1996) for its narrow
assumption of the human nature. This criticism is in regards to the work of Ouchi (1980) which is based
on intermediate forms of governance which would give a win situation.
Another critique of the Transaction Cost Model is that it seems to ignore the internal costs within the
firm. These costs are bound to take place between different departments. These costs if overlooked
would lead to misalignment of future costs.
Another factor of the Transaction cost framework is that the frame work does not relate much to SME’s
as the lack of information and knowledge is a reason for externalization of the activities. SME’s need to
rely on intermediates form of governance there for they are highly reliable on the cooperative
environment .The importance of Production costs is a factor that has not been taken into consideration
in the TCA framework. According to Williamson (1995) “the most efficient form of internationalization is
one that helps minimize the sum of production and transaction costs” (Williamson, 1995).
3.4.3. THE NETWORK MODEL
Another way for a firm to internationalize with a process approach is using Industrial Network Approach
model. The network model assumes that international firms (actors) cannot be analyzed individually but
as in relation with other firms (Hollensen, 2008).The Network model is based on the approach which
gives primary importance to firms networking among themselves. Internationalization is defined as a
network which is developed through trade in countries through 3 phases which are extension,
penetration and integration (Johanson et al, 1988).Extension is given as the new investments made for
entry which also results in the integration with the network. Penetration is the process of resource
development and business positioning. Integration is the extension and coordination of networks
.Etemad (2005) explains about authors who insist on the importance of formal and informal networks.
These forms are networking are dependent on the markets in which the firms are active.
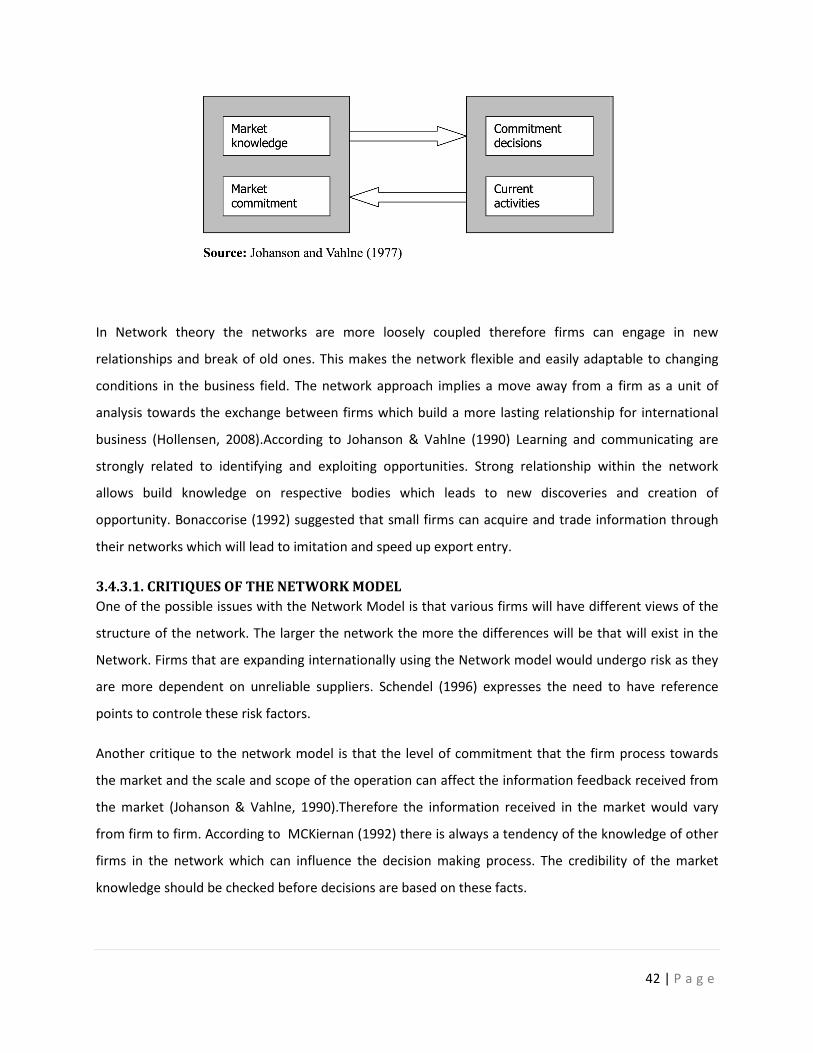
In Network theory the networks are more loosely coupled therefore firms can engage in new
relationships and break of old ones. This
conditions in the business field. The network approach implies a move away from a firm as a unit of
analysis towards the exchange between firms which build a more lasting relationship for internat
business (Hollensen, 2008).According to Johanson & Vahlne (1990) Learning and communicating are
strongly related to identifying and exploiting opportunities. Strong relationship within the network
allows build knowledge on respective bodies which lea
opportunity. Bonaccorise (1992) suggested that small firms can acquire and trade information through
their networks which will lead to imitation and speed up export entry.
3.4.3.1. CRITIQUES OF THE NETWORK MODEL
One of the possible issues with the Network Model is that various firms will have different views of the
structure of the network. The larger the network the more the differences will be that will exist in the
Network. Firms that are expanding internationally us
are more dependent on unreliable suppliers.
points to controle these risk factors.
Another critique to the network model is that the level of commitment t
the market and the scale and scope of the operation can affect the information feedback received from
the market (Johanson & Vahlne, 1990).Therefore the information received in the market would vary
from firm to firm. According to MCKiernan (1992) there is always a tendency of the knowledge of other
firms in the network which can influence the decision making process. The credibility of the market
knowledge should be checked before decisions are based on these facts.
In Network theory the networks are more loosely coupled therefore firms can engage in new
relationships and break of old ones. This makes the network flexible and easily adaptable to changing
conditions in the business field. The network approach implies a move away from a firm as a unit of
analysis towards the exchange between firms which build a more lasting relationship for internat
business (Hollensen, 2008).According to Johanson & Vahlne (1990) Learning and communicating are
strongly related to identifying and exploiting opportunities. Strong relationship within the network
allows build knowledge on respective bodies which leads to new discoveries and creation of
opportunity. Bonaccorise (1992) suggested that small firms can acquire and trade information through
their networks which will lead to imitation and speed up export entry.
3.4.3.1. CRITIQUES OF THE NETWORK MODEL
the possible issues with the Network Model is that various firms will have different views of the
structure of the network. The larger the network the more the differences will be that will exist in the
Network. Firms that are expanding internationally using the Network model would undergo risk as they
are more dependent on unreliable suppliers. Schendel (1996) expresses the need to have reference
points to controle these risk factors.
Another critique to the network model is that the level of commitment that the firm process towards
the market and the scale and scope of the operation can affect the information feedback received from
the market (Johanson & Vahlne, 1990).Therefore the information received in the market would vary
to MCKiernan (1992) there is always a tendency of the knowledge of other
firms in the network which can influence the decision making process. The credibility of the market
knowledge should be checked before decisions are based on these facts.
42 | P a g e
In Network theory the networks are more loosely coupled therefore firms can engage in new
makes the network flexible and easily adaptable to changing
conditions in the business field. The network approach implies a move away from a firm as a unit of
analysis towards the exchange between firms which build a more lasting relationship for international
business (Hollensen, 2008).According to Johanson & Vahlne (1990) Learning and communicating are
strongly related to identifying and exploiting opportunities. Strong relationship within the network
ds to new discoveries and creation of
opportunity. Bonaccorise (1992) suggested that small firms can acquire and trade information through
the possible issues with the Network Model is that various firms will have different views of the
structure of the network. The larger the network the more the differences will be that will exist in the
ing the Network model would undergo risk as they
Schendel (1996) expresses the need to have reference
hat the firm process towards
the market and the scale and scope of the operation can affect the information feedback received from
the market (Johanson & Vahlne, 1990).Therefore the information received in the market would vary
to MCKiernan (1992) there is always a tendency of the knowledge of other
firms in the network which can influence the decision making process. The credibility of the market
43 | P a g e
CONCLUSION:
From the above reviews we understand that the entry strategy for firms into new markets face several
challenges. The international model guide firms in taking multilateral decisions which is essential in new
market entry. The challenges faced in the new markets are both external and internal factors which
would affect the nature of business. It is highly essential that companies value these factors before the
market entry process. Corruption is a factor that many western countries take for granted when
entering new markets. The level of corruption and the degree to which it can affect the growth of the
company should be analyzed. If the barriers that these factors cause are not factored in during
internationalization, this can lead to failure for the firm in new markets entry.
44 | P a g e
CHAPTER 4: RESEARCH METHODOLOGY
INTRODUCTION
This Chapter aims to justify the research methodology which has been used in the research for the
completion of this dissertation. The method used is a Qualitative approach with Primary and Secondary
research methodology. By using these techniques the entry barriers for international companies to
enter the Indian market has been researched.
4.1. RESEARCH METHODOLOGY
In this report qualitative methodology of research has been followed. Yin (1994) stated that the
qualitative research method helps in finalizing a framework in which the data can be analyzed in a better
manner. According to Patton (2002) qualitative research is a method that seeks to understand
phenomena’s in context specific settings such as real world where the researcher does not attempt to
manipulate the phenomena of interest. Another factor is that the process is flexible and allows
spontaneity and adaptation between the researcher and the respondent. The research was based the
internship which looked at the entry process of an international trade organization into the Indian
market. The internship was conducted on two sectors which are the Crude oil industry and the Fertilizer
industry. The fundamental requirements of the client were based on the following questions.
• Which are the main commodities that are imported?
• Who are the end consumers (Government, Private companies) and what is their share in
the total demand? Which of them are importing directly from foreign countries?
• Who are the importers (Government or specific companies, traders, broker’s i.e. middle
men) and what is their share in the total end consumers demand?
• Where do the importers go to satisfy their demand? Who are the main players from
foreign countries that satisfy the importers/ end consumers demand?
• Which is the law that is governing the internal market and the imports for these
commodities?
• Identify & analyze the type of barriers to entry by foreign companies in terms of
legislative, import duty, quality, price, and competition, authorizations, etc.
• Identify & analyze the operational challenges likely to be faced when entering Indian
markets and their implications on logistics and supply chains
45 | P a g e
The research was done based on the requirements given above. The research process took place in two
stages where in the Primary stage consisted on the interviews and email communication which took
place with people from the industry to acquire up to date information on the industry and acquire a
better insight. The secondary analysis was the second process where data was collected from journals,
articles and the internet in reference to the industry. With the help of the data acquired this paper looks
at answering the fundamental requirement of the dissertation.
4.1.1. PRIMARY RESEARCH METHODOLOGY
The primary research method is the process of acquiring data directly from the industry and about the
market. This form of research work is used to get information specific to the research conducted as the
information acquired would not have been published. The advantage of primary data according to
Kervin (1999) is that the data has been collect with a specific purpose. Another important advantage of
this method is that the interviewer is present at the time of the interview and the respondent can ask
for any king of clarification that is required (Cooper and Schindler, 2001).The data collection process is
done by
• Face to Face Interviews
• Telephone Interviews
• Online Surveys
• Questionnaires
INTERVIEWS
The Interview process is a predominant means data collection in the qualitative research methodology.
A good interview is the art and science of exploring the subjective knowledge, opinions and beliefs of an
individual. The interview process provides in-depth information about a particular research issue.
FACE TO FACE INTERVIEW:
An interview was conducted with Mr.Catalin Propescu who is the Managing partner of A&P Investments
Limited. The company is into International trade and development and investment management. The
company’s focus is in the Oil & Gas Industry and is looking at opportunities to enter the Indian market.
The Internship is based on the requirements of Mr Catalin Propescu and an interview was conducted to
understand the further requirements of the client and to get a better understanding of the trade.
46 | P a g e
TELEPHONE INTERVIEW:
An Interview was conducted with K.A Mehamood who is a supplier and stockiest of fertilizers in the
southern region of India. He operates in the state of Kerala. This interview was conducted to understand
the supply chain process in the fertilizer industry and the regulations and the government laws which
are prevalent in the industry. This interview was conducted also to understand the market potential of
different fertilizers in the market.
EMAIL CORRESPONDENCES:
I had tried to communicate directly with the Indian Fertilizer Board. On sending a request for
information I was sent a membership form to register as a vendor. On stating that I was a student and
required information for dissertation purpose I was given access to their weekly news letters. This
weekly news gave me updates on the latest happenings in the industry.
PERSONAL EXPERIENCE:
As I am an Indian national and have been associated with the trade business I was able to contribute
with the knowledge I had acquired working with the rubber trading market in india.I have also trained
with the government of India in the Small Scale Industry (SSI) for Import and export management
training. This help in the understanding of the process of imports and export and the trade barriers
associated with it.
4.1.1. DRAW BACKS OF PRIMARY RESEARCH METHODOLOGY:-
The primary research methods give us information from the industry which has not been published.
They are based on experiences and a practical point of view. However there are draw backs in this
process. The problems with a face to face interview is if the right questions have been asked and how
the interviewer is basing these questions .Limited information acquired only in of section could give a
very different result of analysis. The second issue is the number of interviews taken. Only if there are
different viewpoints taken then a conclusion be framed from it but in the case of this report due to lack
of time only two interviews were take. Another drawback is the information acquired should be
analyzed and checked with the secondary information to validate it otherwise the information wouldn’t
have a successful analysis.
47 | P a g e
4.2. SECONDARY RESEARCH METHODOLOGY
The secondary research methodology is a methods that adopt data collected from books, literature,
journals, news paper and annual reports which are used to gather the research resource. This mainly
consists of data that have been published. According to Bordens and Abbott (2010) the conceptual steps
that outline a secondary research are
• Set general research questions
• Select relevant sites and subjects
• Collect relevant data
• Data interpretation and Illustration
• Conceptual and Theoretical Work
• Draw in findings and conclusions
The data collection process was done mainly through web sites as journals do not have up to date
information on the two industries in the Indian market. As the fertilizer market is centrally controlled by
the government of India it was relatively easier to get information where as the Crude oil industry is
controlled by individual state owned companies and the information is not available. The crude oil
industry in India is a more controlled industry which is monopolized by these state owned companies.
4.2.1. DRAW BACKS OF SECONDARY RESEARCH INFORMATION
The validity of the secondary research is an import factor in data interpretation. According to McBurney
and White (2010) the validity of the secondary data is an important factor in the research process. The
mismatch of the views and data collected of different authors may misguide the information of the
research. Secondly the transfer of difference is another disadvantage that could occur. Data is collected
over different circumstances and within a time frame and when applying this data into research the
location and time might have changed for which the validity of the previous data has to be reconsidered
(Devine and Heath, 2009). Another disadvantage by Rugg and Petre (2007) is that some of the data
collected may not have been updated for a long time which can lead to inconsistency with the facts in
reality. If this data is collected then there is the possibility of mistakes and misjudgments caused in the
research process.
48 | P a g e
CHAPTER 5: ANALYSIS & DISCUSSION
INTRODUCTION
With the help of frame works and models this paper analyses the crude oil and fertilizer industry to
understand the Indian market. We initially start with the PEST analyses of understand the Indian market.
Followed by this we use the Five forces model for the industry analyses of both the industries. With the
help of this we would understand the barriers in the industry around which a business strategy can be
developed. With the help of the above analysis this paper recommends an internationalization process
for both respective industries.
5.1. PESTEL
The PEST analysis framework consists of macro-environmental factors used in the environmental
scanning for strategic management. It helps identify environmental factors that may affect the business.
It consists of 4 types of environmental factors which are Political, Economical, Social and Technological
factors. With the help of this framework we will analyze the external factors that act as an entry barrier
into India.
5.1.1. POLITICAL FACTORS
Taxation Policy
The Indian governments pose high interest rates but to promote trade has launched many tax incentives
and promotions. It has tied with 65 countries for a double taxation relief where the company will apply
tax on only one of the two countries in trade. An example of this would be that the government
provides a 100% deduction on taxes for seven years for companies undertaking mineral oil refining or
production. Deductions are also available if companies undertake locations in certain industrially
backward states and districts. Excise duty is between 0 to 16% and the customs duty is between 0 to
30%.Free trade zones also is a form of promotion where companies in this sector enjoy zero import
duty.
49 | P a g e
Privatization
India initially had a very socialist state point of view but the government is now allowing privatization of
state owned corporations. This could result in the government raising billions of dollars from the sale of
shares of potentially world class manufacturing companies. This will bring in more clarity and better
management skills into the existing firms.
Deregulation
International retailers have been reluctant to enter the Indian market as they weren’t allowed to have
majority ownership. India is in the process of lifting its restrictions .Deregulation is seen in many sectors
and recently in the gasoline and diesel sector which underwent a price de regulation phase where it is
now linked to the international price. Some sectors such as fertilizer industry are still regulated by the
government.
International Trade Regulations
The import and export are regulated by the foreign trade act of 1992 which replaced the import and
export act of 1947.The present act gives the government immense power of control in this sector. India
is steadily opening up its economy but its tariffs are high in comparison to other countries and its
investment norms are restrictive.
General Initiatives
The Indian government is initiated to the economic development of the country. They are poised at
making the required efforts to develop the Indian economy. Investments are being made in developing
the infrastructure in the country which is a huge lack in the country. Trade is being promoted with tax
exemptions. New technologies are being introduced to increase the productivity of the agriculture
industry.
Country Stability
Political instability in India poses no risk because no policy framed by past government has been
reversed by successive governments so far. Economic development has been accepted as a necessity by
all parties including the communist party (Marxist) of India. International stability is given as the absence
of conflict among major powers and is also related to a balance of power between major continents.
India has a long history of collaboration with countries and is a part of several international
50 | P a g e
organizations. The only issue it faces is with Pakistan on terrorism based on the issues with Kashmir and
terrorism.
5.1.2. ECONOMICAL FACTORS
Interest rates
The interest rates in India are set by the Reserve Bank of India. Investment into the country sees high
interest rates but this will be balanced out by the attractiveness of the market which is seeing high
investment into the country. The government through tax exemptions and subsidies bring in promotions
to the company.
Strength of currency/ exchange rates
The Indian currency is gaining strength as the GDP crossed the 1 trillion mark making India the 12th
country to achieve this milestone. Exchange rates are relatively stable. This makes exporting more
difficult as rise in price could cause issues.
Inflation
Inflation rate is at 8.43% in July 2011.The high levels of inflation has lead to affecting Wage with salaries
estimated to have risen by 15% in2010 and expected to rise by 13% in 2011.Price of product and
commodities have also risen. The government is taking initiatives to keep the growing inflation in check.
Government spending
The government announced a new industrial policy in july 1991 which would help reduce the number of
industries under compulsory licensing , disinvestment to public sectors, liberalization of policy to foreign
capital , foreign investment promotion and automatic permitting for technological agreement with
foreign countries. This has been done with the intent to attract new technology into the Indian market.
Import/export ratio
India has 61.5% more on exports than imports which is quite unfavorable. Exports of manufacturing and
mineral fuel made up 37.9% of the exports. The EU and USA are India’s most important trading partners
with 18.6 % and 13.3% in the countries total export. The rise of the rupee can cause problems in the
51 | P a g e
export sector. Infrastructure reduces growth of GDP by 1% .The government is trying to promote
spending in infrastructure by providing tax cuts and benefits.
5.1.3. SOCIAL FACTORS
Current population is at 1.2 billion where the median age in 25 in 2010.it is forecasted that India will
take over china as the most populated country in the world in less than 20 years. Indian saving ratio is
comparatively high amounting to 29% of disposable income .A general trend seen is people moving from
rural areas to metro’s and cities. There is section of the country where the wealth of the country has not
reached.
Income Distribution
The wealth distribution in India is uneven with 10 % of the income group earning 33% of the income. A
quarter of the population in India earns less than the government specified poverty threshold.
The farming industry is an important sector in India and the new technological advancements are highly
appreciated by the government. Products that will bring in better development in this area is well
rewarded by the government by benefits and tax cuts.
India is ranked as the 7th most environmentally hazardous country in the world. The environment
problems are growing rapidly in the country. Over exploitation of the country resources has resulted in
environmental degradation of resources.
Education trends
The literacy rate is expanding to two thirds of the population and much of the economic development is
acclaimed to be due to the educational system. The issue that the system is facing is that due to the IT
boom the education is focused mainly towards this sector and scientific research. The system is not
balanced giving opportunity to develop in other fields. This also brings in a lack of overall development
and awareness to the system.
Diversity
India is a culturally rich country with languages, religions, dance, music, food, architecture varying in
every state. The country is one of the most religiously diverse countries where religion and culture play a
central role in the lives of its people. The language spoken in various states also vary from state to state
52 | P a g e
with over 20 languages with Hindi being the national language. Among all the diversity there is great
amount of unity seen in the Indian people.
Health
The current population in India is at 1.2 billion in which the median age is at 25 in the year 2010
(euromonitor, 2010).The health care system features an universal system run by the government. The
health care system is seen to be growing at a rapid pace and with the rising income levels more new
developments are being introduced. According to the World Bank (2009) the life expectancy in India is
at 64.
5.1.4. TECHNOLOGICAL FACTORS
Government technology funding
The government is looking at bringing in transparency in policies and procedures to give investors a
platform to invest into India. The government is looking forward to investments through foreign direct
investments to improve existing technology. The government is providing economic zones where
technology imports are given exemptions and tax benefits.
Inventions
India is promoting the introduction of foreign technology into its different markets. The fertilizer
industry has recently been implementing new technology to improve its produce. Russian mineral and
oil excavation techniques are been used by the mining industry .India is looking at implanting the best
techniques in the market for its different sectors.
Communications
The telecommunication industry is seeing a lot of change with a lot of new international companies
entering the market. This has brought in a lot of development in the telecom sector but band width is
still a problem that a lot of firms in India are effected by. The internet capability in the country has still a
long way to go to reach international standards.
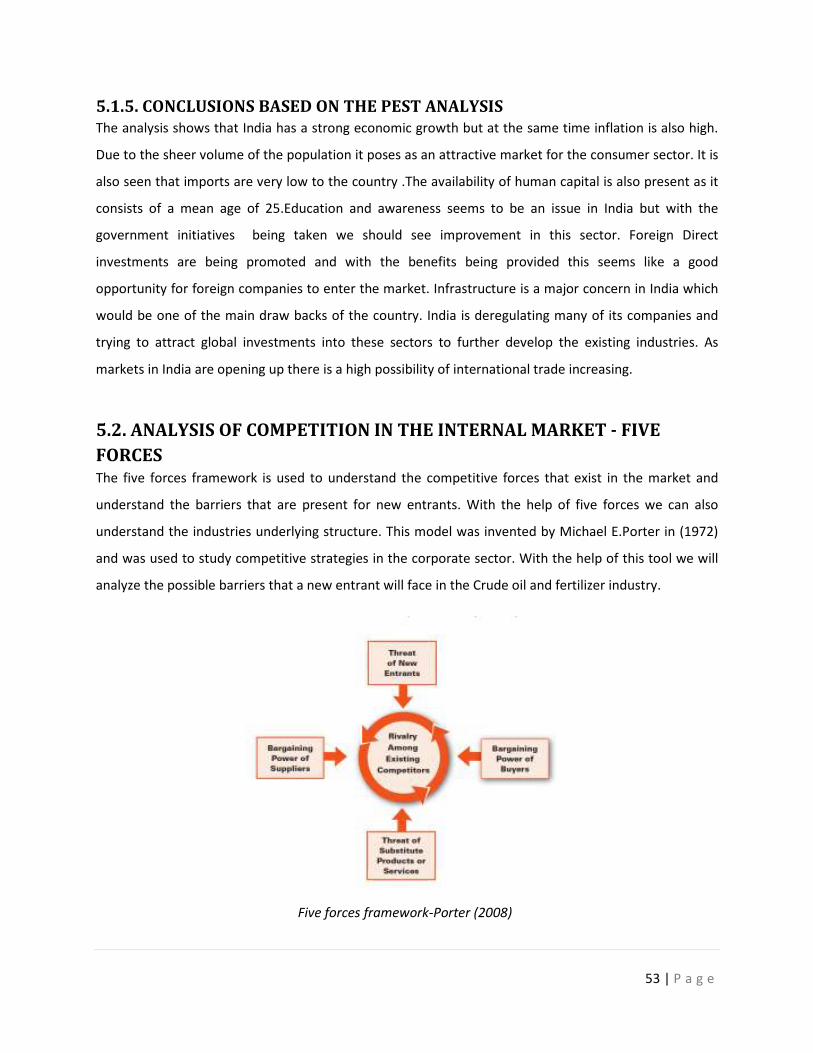
53 | P a g e
5.1.5. CONCLUSIONS BASED ON THE PEST ANALYSIS
The analysis shows that India has a strong economic growth but at the same time inflation is also high.
Due to the sheer volume of the population it poses as an attractive market for the consumer sector. It is
also seen that imports are very low to the country .The availability of human capital is also present as it
consists of a mean age of 25.Education and awareness seems to be an issue in India but with the
government initiatives being taken we should see improvement in this sector. Foreign Direct
investments are being promoted and with the benefits being provided this seems like a good
opportunity for foreign companies to enter the market. Infrastructure is a major concern in India which
would be one of the main draw backs of the country. India is deregulating many of its companies and
trying to attract global investments into these sectors to further develop the existing industries. As
markets in India are opening up there is a high possibility of international trade increasing.
5.2. ANALYSIS OF COMPETITION IN THE INTERNAL MARKET - FIVE
FORCES
The five forces framework is used to understand the competitive forces that exist in the market and
understand the barriers that are present for new entrants. With the help of five forces we can also
understand the industries underlying structure. This model was invented by Michael E.Porter in (1972)
and was used to study competitive strategies in the corporate sector. With the help of this tool we will
analyze the possible barriers that a new entrant will face in the Crude oil and fertilizer industry.
Five forces framework-Porter (2008)
54 | P a g e
5.2.1. ANAYSIS OF THE CRUDE OIL INDUSTRY
Entry barriers for trade of crude oil - High
Existing crude oil producing companies produce in large volume and the country consists of few
refineries of which most are public limited companies owned by the state government. The huge market
requirement and the large volume supplied by the companies give them supply side scale economies
which forces entrants into this sector to come into the industry on large scale investments or to accept a
cost disadvantage. The demand side benefits of scale are also high as India imports most of its crude oil
and oil is of high demand.
The capital requirement for the industry to invest is also high to manage the requirement of the country
.The requirement is based on the government tenders which are sanctioned. The crude oil is shipped to
location during which the payment process would initiate. The responsibility is on the traders end. This
requires high capital requirement during the transport and delivery stage but at the same time the
industry is highly lucrative.
The power of Suppliers - High
The suppliers of crude oil have high bargaining power as they hold the reserves of Crude oil. Most
countries import crude oil from oil rich countries like Russia, UAE and Kazakhstan. The supplier groups
who supply the traders are powerful due to the large reserves that they hold. The suppliers have
interests in different parts of the world to trade and India is only one of the markets that they would
trade. Therefore the possibility to extract maximum profits from one market alone is slim. The contracts
are levied for a certain period so the industry participants do undergo switching costs when they are
switching suppliers but this is possible once the contract terminates. Contracts are also tied with foreign
policies with certain countries and governments so this can pose as a problem. Suppliers cannot forward
integrate into the industry as the manufactures of crude oil always use traders to trade between them
and the buyers.
The power of buyers - low
55 | P a g e
The power of the buyers is low as crude oil is a commodity in great demand. The factors that are
important for the buyers are the policy and relation between the 2 countries, modes of payment,
guaranty and transportation. In the crude oil industry the buyer looks at the percentage of discount
offered as this would be the main differentiating factor between traders. Transportation costs is a
another factor that is discussed based on who would take the responsibility.
The threat of substitutes - low
The threat of substitutes in the industry is low as there are no substitutes to crude oil. There are many
products that substitute to the byproducts of crude oil but these products are either expensive or not
easily available. Today crude oil plays a major role in any countries economy.
Rivalry among existing firms - High
The existing trading firms would have built the required network of contacts required in the crude oil
industry. These factors are highly important for the industry as the political system is closely linked to
the industry .Based on the relationship of firms the government is known to give favors to companies
depending on the relationship that the participant poses with the government as the requirements are
given based on tenders that are sometimes pre fixed. Existing traders would also know the distributing
channels better.
Since the products of rival traders are the same and the switching costs for buyers are few the need to
give discounts is essential to win buyers. This can lead to price wars. Crude oil is transported from
different parts of the world and it is essential for the companies selling crude oil but relations to ensure
long term trade.
5.2.2. ANALYSIS OF THE FERTILIZER INDUSTRY
Entry Barriers for trade of fertilizers – low
The fertilizer industry in India consists of Nitrogenous, Phosphatic and Potassic based fertilizers. Out of
the various fertilizers Urea is the most highly used fertilizer in India. Due to the shortage in supply the
government is forced to import Urea. Trade of urea into India is mainly through tenders set by the
56 | P a g e
government. Phosphatic and Potasic fertilizers are de-regularized and are gaining popularity with better
farming education. Entry barriers into trade of fertilizers are low as the market is differentiated with
various products. It enjoys demand side benefits of scale as a large network of buyers influence the
product that is brought. An example of this would be Urea.
High capital is required during trading but the risks in the industry are less as the government
undertakes the process of imports and transportation to required buyers. This happens in the case of
Urea. For other fertilizers the market is open and people can directly import the product with proper
licensing. The advantage of quality is big in the industry as this can drastically vary in the industry.
Different grades of fertilizers can be acquired in the market today.
In the case of UREA the government of India takes care of the process of distribution channels but in the
case of other fertilizers the distribution procee is done by the buyers. New entrants will find it difficult in
this regards as there are different distributers for each sector who are dominated by existing players and
loyal to existing firms. To break into this would be a barrier for new firms.
The power of suppliers- Medium
The power of suppliers is low as there are many producers in the international market. The main
problem in the Indian market is the shortage of feed stock which is essential for the production of Urea.
The switching costs are also low as there are various different types of suppliers varying on quality,
grade and price.
In products supply groups can easily forward integrate into the industry. This is possible as this sector
consists of de-regulated fertilizers where the process of market entry is not administered by the
government. This type of forward integration is seen in the existing industries in India who are supplying
to the end users.
The power of Buyers - Low
Buyers in the market for Urea face a regulated system where the government undertakes the import
process based on tenders to supply the fertilizer. The market price is the farm gate price set by the
government. Companies importing urea are paid the subsidy costs. The government commands the
purchases therefore the power of buyers are low.
57 | P a g e
Buyers face low switching costs and the various fertilizers available in the market leads to the buyers
bargaining on price and quality depending on the demand of the product. Buyers also earn profits due
to the subsidies in that the government provides in the fertilizer industry.
The treat of substitutes-High
The threats for substitutes are high as various kinds of fertilizer are available in the market. The
government of India is making the farmers aware of good farming techniques and educating them that
urea is not the only source of nutrition for the soil. New techniques are being introduced with foreign
investors entering the market. Other fertilizers are gaining popularity which are DAP and Mixed
fertilizers. These fertilizers are better substitutes which would bring in better yield with a combination
with urea. The profitability also suffers in the industry as various substitutes are available in the market.
The introduction of more economical mix of new fertilizers can easily affect the market.
Rivalry among existing competitors – High
In the de-regulated sectors the competition among existing trade firms are high as the price discounting,
product introduction, advertisement campaigns are used to market their product. In the regulated
sectors the market is controlled by the government. Competition is prevalent during the tender process
to ensure that the tender is acquired. Stiff competition and influencing takes place with existing firms
and the government. On securing the tender the supply process is locked in.
5.3. CORRUPTION IN INDIA
Indian economic growth has been affected by corruption and cronyism which effects the larger
population (Budhwar, 2011). Corruption and red tapism are partly consequences of oligarchic control
which act as a major barrier to the growth of entrepreneurs in India. The country is famous for its
influence peddling politicians, money seeking bureaucrats and bribe dispensing entrepreneurs
(Gopalan,1997).As the implementing body for all government policies ,laws and regulations the civil
servant is seen as the heart of the governance problem in India (Das, 2001).
To understand how corruption works and for companies to come up with required strategies it is
essential to understand the deeper long term forces shaping and sustaining corruption and their link to
local characteristic (Johnston, 2008). From the 1960s to the 80s India was one of the most controlled
58 | P a g e
economies in the world where every sector in the economy was administered and controlled by the
government. Most of the primary industries were regulated by the government. Over the years India has
opened out its market and is moving towards a lot more privatization. The key factor to India’s success is
the combination of liberal economy and democracy.
The people of India have a collectivist mentality and people seem to be linked by networks of highly
diversified ties (Budhwar, 1997). In India boundaries are built between in-group and out-groups based
on caste, language and region. Indians show favoritism to in group members and are suspicious and
hostile towards out group members. The form of corruption is embedded in the system where due
gratitude is given to the officials for the help rendered. The corruption is categorized according to the
rich and the poor. The rich and educated that have wealth but do not have values pay bribe to dupe the
system .The companies also do so if they want to avoid the system. They also use bribe to score over the
competition. The poor are also forces to pay bribe as they are powerless. In India the poor end up
paying bribe for things they need to get free and the rich get what is not rightfully theirs (Budhwar,
1997).
The Indian government plays a interventionist role in allocating resources , relying on markets,
organizing production , stresses import substitution and self reliance rather than export growth and
discourages investments (Das, 2001).Companies benefit from legal corruption where by using influence
they gain advantage over regulation and policy makers. Lakshmi Mittal who is one of the leading
industrialists in steel said that if he had tried to buy an existing steel plant in India he would have spent
half his life chasing bureaucrats and politicians where he could completely take over abroad in few
months.
5.3.1. CORRUPTION THROUGH SUBSIDIES
Subsidies provided by the government of India for the poor are one of the main loop holes for
corruption in India. In the oil and gas industry there is huge discrepancy in price between Petrol, diesel
and kerosene prices. Even though the prices of petrol have been freed up diesel and petrol prices are
still controlled. The people below the poverty line are given benefits to purchase kerosene at a lower
price and this advantage gives oil mafias an opportunity to make large profits by selling it at higher
prices or contaminating it with petrol. An estimate of 38.6% of kerosene is divested to the black market.
59 | P a g e
The corruption through subsidy is also seen in the fertilizer industry where Euria is a subsidized product
which is controlled by the government. The farmers are under the pretext that urea alone will improve
the fertility of the soil and due to these misconceptions have driven the consumption of urea very high
.The corrupt politicians and bureaucrats make a huge profit by the loop holes in the subsidy policies.
5.3.2. FORCES WORKING AGAINST CORRUPTION
Amongst the corruption that happens in India there are strong force’s propelling India forward. These
forces are first the liberal economy of the country which is promoting entrepreneurs. Secondly Indian
demography has shown high resilience. Thirdly India’s free and vigorous press is a big force in bringing
transparency and curbing corruption. Indian strength lies with the Indian professionals and people and
the compatibility with western economy and English educated people. The outgoing President and CEO
of GE in India, Scott Bryman said that the endemic culture of bribery, corruption, Kick backs and
cronyism that he had saw when he first arrived has significantly disappeared (Haniffa, 2007).
It is important for the international company to understand the process of function in the country.
Understanding the ruling party in the state and their term of rule as this is an important factor. It is also
critical to understand if the party is of the same or different party in the central government as all
important decisions can be influenced by the center.
The infrastructure in India is one major problem in for international companies. This is one factor that
the government of India is working at developing to cater to the industry requirements. At present the
power and the energy sector is very under developed in India.
International companies get into trouble in India showing arrogance and lacking cultural sensitivity but
not because they are strangers or outsiders. The best way to overcome corruption is through
transparency. The free press can be used as a tool to bring in transparency to the required sector and
corruption can be eliminated.
Anna Hazaree who is an activist is pressurizing the government to enact a strict anti corruption bill. This
would bring in strict consequences to people found involved in corruption including the ministers of the
state and even the prime minister. This movement has seen a lot of support from the people of India
and if the Lokpal bill is passed then India could see a lot of changes in its administration which would
drastically reduce to the corruption that prevails in India.
60 | P a g e
5.4. INTERNATIONALIZATION
5.4.1. CRUDE OIL INDUSTRY
The crude oil industry consists of a very close nit circle of both state owned refineries and private
companies. To trade crude oil to these companies it is important to be able to make the required
connections to enter contracts. Since majority of the companies are state owned there is a high
possibility of the political influences of the state playing in the decision process of the firm. Information
within this circle would be closely held. This would require a great deal of general knowledge to
understand the process of trade and to be able to market to specific companies and at the same time
market specific knowledge which can be gained through experience in the market.
My suggestion would be to use the Uppsala Internationalization model where in the trading firm can use
the four of internationalization involvement and commitment. By Initially bidding for tenders the firm
will be able to understand the process of sanctioning and trade in India. They will also be able to make a
study of how the market works. On securing tenders the firm can move into export via independent
representatives as they would have built required contacts for trade in the industry. Following this
depending on the sales of trade and profitability of the firm can establish a foreign sales subsidiary to
manage and control the trade process at the same time gain valuable Intel of the market and build on
contacts to secure more orders. If the industry feels that the market is highly profitable the firm can look
at FDI into firms to make use of the subsidies provided by the government at the same time increase
profitability.
This step wise process of gradually penetrating the Indian market will help the firm implement
knowledge acquired from other markets and at the same time absorb market based knowledge and
improve their techniques as they move from one stage to another. In the case of failure of the market or
trade the firm will be prepared with precautionary measures well in advance.
5.4.2. FERTILIZER INDUSTRY
The fertilizer industry consists of a market which is highly differentiated. On the broad outset the
industry consists of regulated and de-regulated sectors. Urea which is the most highly traded form of
fertilizer comes under the regulated category and the other fertilizers like DAP, Mixed fertilizers come
61 | P a g e
under the deregulated category. Regulated section of the industry as discussed earlier is controlled by
the government and would have many political influences in the industry. The de-regulated sector
would have an open market system where the need to know the market conditions and the distribution
process is highly critical.
Since the market condition is such that it is differentiated I would recommend a more mixed
internationalization approach where we could use a mix of both TCA framework and network model
approach. The network model uses a mode of handling activities interdependent between several
business actors. By development of relationship with existing firms and building it in such a way that
there is willingness of firms to engage and exchange in relationship. By this process businesses can
perform more efficiently and acquire the right information to convert into sales. The transaction model
will benefit by the firm understanding of when to internalize resources to reduce costs. In the fertilizer
industry it would be crucial to appoint a consultant who is well versed in the characteristics of the
market. Over time this externality can be internalized to reduce transaction costs. By doing this the firm
will be able to take advantage of the market knowledge to make the right decisions. This combination of
the two models will help in giving the firm an advantage of acquiring orders and distribution channels
quickly and effectively.
62 | P a g e
CHAPTER 6: CONCLUSION
In the past decade India’s economy has seen tremendous growth. The country has seen large amount of
foreign investments and new ventures in its market. Many companies have found it difficult to sustain in
the Indian market as they have over looked the entry barriers that the company would face. Also the
facts of the lack of data available about the market pose as a major concern for new entrants. The
process of political influences and corruption has also posed as a major barrier for international firms.
With the write kind of analysis of the external, internal barriers and market study, new entrants can
build a competitive strategy to enter the market and establish themselves. India has high potential and a
competitive strategy built to tackle this market will be highly lucrative.
With India being the fourth largest consumer of crude oil in the world and with the growing requirement
in the country the industry is seen to have high potential. Also the countries location and long coast line
makes the country easily accessible. It is seen that market knowledge is key to being successful in this
industry. The industry is dominated by state owned refineries and a few private companies that handle
trade directly. Government involvement is seen in the industry. Due to the involvement of the
government power there is high possibility of power play and corruption .This report suggests new
entrants to use an Uppsala model of internationalization so that firms can acquire the required market
knowledge and understand the barriers that it would face and device competitive strategy to sustain in
the industry.
The agriculture industry is the largest economic sector employing 52% of the work force in the country.
It plays a significant role in the overall development of the country. There is a steady decline in the share
of the industry in the country’s GDP due to the lacks of awareness and new farming knowledge in the
sector. The government has invested highly in this industry to further improve and introduce new
farming techniques. The fertilizer market consists of a mix of controlled and decontrolled sectors where
in the government controls the market price of these fertilizers. The most highly consumed fertilizer is
Urea whose imports are controlled by the government. This is seen as a highly attractive market where
in a lot of logistic issues are taken care by the government during trade .Other upcoming fertilizers like
DAP and mixed fertilizers are sectors with good potential as they have recently been deregulated. The
barriers to entry are varied from internal to external factors discussed in the report and to strategic
planning the new entrants can enter the Indian fertilizer market.
63 | P a g e
REFERENCES
REFERENCES
Bain J.S., (1969). Firm size and profitability.Review of Economics and Statistics.Vol. 1, pp. 319-331.
Bardhan, Parnab. (1997). Corruption and Development: A Review of Issues. Economic literature.Vol.
XXXV (1), pp. 1320-1346.
Barkema, H., andVermeulen, F. (1998). International expansion through start-up or acquisition: a
Learning perspective. Academy of Management Journal, vol. 41(1), pp. 7–26.
Bayley, David H. (1966). The effect of Corruption in a Developing nation.Political science association. Vol.
19 (4), pp. 719-132.
Bjorkman, I., (1990). Foreign direct investment: an organizational learning perspective. The Finnish
Journal of Business Economics, vol. 4, pp. 271–294.
Bonaccorsi,A., (1992). On the relationship between firm size and export intensity.Journal of International
Business studies, Vol. 23 (4), pp. 605-36.
Bordens, K and Abbott, B. B. (2010).Research Design and Methodology: A Process Approach. London,
McGraw-Hill.
Buckley, P. J. M., H. and Sparkes, JR. (1987).Direct foreign investment in japan as a means of market
entry: the case of European firms. Journal of Marketing Management, Vol. 2(No.3), pp. 241-58.
Business Review, vol. 1(3), pp. 9–27.
Carlson, S. (1966). Uppsala: Acta UniversitatisUpsaliensis.International business research.
Cavusgil, S.T., Ghauri, P.N., Agarwal, M. R., (2002). Doing business in emerging markets: entry and
negotiation strategies. USA: Sage Publications. Vol. 4, pp. 31-39.
Chowdhury, Abu. (2009). Multilaterals and Infrastructure Funds: A New Era. Journal of Structured
Finance.Vol. 14 (7), pp. 68-74.
Coase,R.H (1937). The nature of the firm.Economica. Vol. 3, pp. 386-405.
Comanor.W.,(1967).Vertical mergers, Market Power and Anti trust Laws. American Economic
Review.Vol. 57, pp. 259-262.
CRN. (2010). Crude Oil .Downloaded from http://www.crnindia.com/commodity/crudeoil.html. Last
accessed 7th of September 2011.
64 | P a g e
Das, S.K., (2001). Public office, Private interests: Bureaucracy and Corruption in India. Oxford University
Press.
Devine, F and Heath, S.(2009). Doing Social Science: Evidence and Methods in Empirical Research.
Basingstoke, Palgrave Macmillan.
Energy Bulletin (2007).Energy - Oil - India Marketing Research.Downloaded from
http://researchwikis.com/Energy_-_Oil_-_India_Marketing_Research. Last accessed 1st of September
2011.
Eun, C. Resnick, B..&Brean.D., (2005).International Financial Management: Canadian Perspectives,
Toronto. Canada:McGrawHill.
Financemasala (2011).The Fertilizer Industry In India.Downloaded from
http://www.financemasala.com/indian-industry/fertilizer-industry-in-india.html. Last accessed 3rd of
August 2011.
Forsgren, M., Holm, U., andJohanson, J., (1995).Divisional headquarters go abroad—a step in the
Internationalizationof the Multinational Corporation. Journal of Management Studies, vol. 32(4), pp.
475–491.
Ghemawat, P., (2001).Distance still Matters. The Hard Reality of Global Expansion.Harvard Business
Review.September, pp. 137- 147.
Goshal,S and Moran,P (1996). Bad for practice: a critique of transaction cost theory.Academy of
management review, vol. 21(1), pp. 13-47.
Hall, E.T. (1960).The silent language in overseas business.Harvard Business Review. Vol. 12, pp, 87-89.
Hampton.P ,Rayner A.C. (1977). The sense of multivariate methods in economics.Regional Science and
Urban Economics, vol. 7 (1), pp. 267-287.
Haniffa, A., (2007). Bribery, Corruption down in India: outgoing GE Indian chief. Rediff.com, 22 May.
Hansen, M. T. (1999). The search-transfer problem: the role of weak ties in sharing knowledge
acrossorganizational subunits. Administrative Science Quarterly, vol. 44, pp. 82–111.
Harjeet.(2011). Investment opportunity in India. Downloaded from
http://investmentopportunitiesinindia.wordpress.com/2011/07/21/indian-economy-a-brief-overview/.
Last accessed 20th of August 2011.
Henisz, W.J., & Williamson.O. (1999).Comparative economic organization - within and between
countries.Business and Politics, vol. 1(3), pp. 261-277.
65 | P a g e
Himangshu Watts (2011). Over a barrel: Crude oil & policy.Downloaded from:
http://articles.economictimes.indiatimes.com. Last accessed 21st of August 2011.
Hofstede, G (1983). The cultural relative of organization practices and theories. Journal of International
Business Studies, Vol. 3, pp. 75-89.
Hollensen, Svend (2008). Essentials of global marketing. 5th ed. England: Pearson Education Limited.
IBEF (2011).Oil and Gas.Downloaded from http://www.ibef.org/industry/oilandgas.aspx. Last accessed
7th of September 2011.
ICRA (2011).Subsidy policy changes to determine the industry growth trajectory. Indian Fertiliser
Industry.Vol. 1 (1), pp. 1-14.
J.S Nye. (1967). Corruption and Political Development: A Cost Benefit Analysis. The American Political
Science Review.Vol. 61 (2), pp. 417-427.
James Agarwal, DorotheeFeils. (2007). Political Risk and the Internationalization.Canadian Joumal of
Administrative Sciences. Vol. 24 (26), pp. 65-181.
Johanson, J., &Vahlne, J. -E. (1977). The internationalization process of the firm—a model of
knowledgedevelopment and increasing foreign market commitments.Journal of International Business
Studies,
Johanson, J., &Vahlne, J.-E.(1992). Management of foreign market entry. Scandinavian
InternationalJournal, vol. 17, pp. 219–235.
Johanson,J., and Mattson,L.G (1988). Internationalization in Industrial Systems.Strategies in Global
Competition, vol. 2, pp. 54- 78.
Johanson,J., and Vahlne J.E., (1990).The mechanism of internationalization. International Marketing
Review, vol. 4, pp. 11-24.
Johanson, J., andWiedersheim-Paul, F. (1975).The internationalization of the firm-four cases. Journal
ofManagement Studies, vol. 12, pp. 305–322.
Johnston, M., (2008).Japan, Korea, Philippines, China : four syndromes of corruption. Crime, Law and
Social Change, vol. 49, pp. 205 – 23.
Kathryn RudieHarrigan. (1985). Exit Barriers and Vertical Integration.Academy of Management
Journal.Vol. 28 (3), pp. 686-697.
Kendrick.J., (1976).Productive trends and Statistics.Joint economic committee studies.Vol 1, pp. 52- 34.
66 | P a g e
Kraatz, M. S. (1998). Learning by association? Interorganisational networks and adaptation to
environmental change. Academy of Management Journal, vol. 41(6), pp. 621–643.
Kruger, Anne (1997).Free trade agreement versus customs unions. Journal of Development Economics,
vol. 54, pp. 169-187.
Lee, J (1966). Cultural analysis in the overseas operation. Harvard business review. Vol. March – April,
pp. 106-114.
Leff, N (1964). Economic Development through Bureaucratic Corruption.American Behaviour Scientist,
pp. 8-14.
Lipczynski, J. (2005). Industrial organization. 2nd ed. England: Prentice Hall.
Mc Burney, D H and White, T L. (2010).Research methods.California Thomson Wadsworth.
McKiernan, P. (1992). Strategies of growth: Maturity, recovery, and internationalisation. London:
Routledge.
Miller, K. (1992). A framework for integrated risk management in international business.Joumal of
International BusinessStudies, vol. 23(2), pp. 311-331.
Ministry of external affairs (2009).OIL AND NATURAL GAS.Downloaded from:
http://www.indiainbusiness.nic.in/industry-infrastructure/industrial-sectors/oil-gas.htm. Last accessed
7th of September 2011.
Murdoch,G.P. (1945). The common denomination of cultures in Linton, R, The science of man in the
world crises.Columbia University press, New York.
Ouchi, W.G (1980). Markets, bureaucracies and clan. Administrative Science Quarterly, vol. 25, pp. 129-
142.
Patton, M.Q (2002).Qualitative evaluation and research methods.Thousand Oaks,CA:Sage Publications,
Inc. 3rd Edition.
Pepperell H.C, Turner R.W. (1981). Barriers to Entry.California Management Review.Vol. XXIII (3), pp. 29-
39.
Porter, M. (1976).The Competitive Advantage of Nations. Harvard Business Review, vol. March- April, pp.
238- 276.
67 | P a g e
Reuters (2011).TEXT-Fitch: Stable outlook for India's fertiliser sector in 2011.Downloaded from
http://in.reuters.com/article/2011/01/24/idINWLA348320110124. Last accessed 3rd of August 2011.
Richards, J., Dobson, P., Starkey, K. (2004).Strategic Management: Issues and Cases. Blackwell.
Rugg, G., and Peter, M., (2007).A Gentle Guide to Research Methods. Berkshire, Open University Press.
Satish John &VarunSood. (2010). Fertilizer industry set for wave of investments of up to $10
bn.Downloaded from: http://www.livemint.com/2010/08/31221202/Fertilizer-industry-set-for-wa.html.
Last accessed 3rd Aug 2011.
Schendel, Hart, S., &, D. Fiegenbaum, A., (1996). Strategic reference point theory. Strategic Management
Schweickert Rainer. (1993). Alternative Strategies for Real Devaluation and the Sequencing of Economic
Reforms in Developing Countries.Kyklos.Vol. 46 (1), pp. 65-85.
Shleifer, A. (1993). Corruption.National Bureau of Economic Research.Vol. 1 (4372), pp. 1-24.
Stapenhurst, F., (1992).Political Risk Assessment around the North Atlantic.New York; St. Martin's Press.
TarunKhanna, Krishna G. Palepu, and JayantSinha.(2005). Strategies that fit emerging markets.Harvard
Business Review.Vol. 12 (3), pp. 63-76.
Taylor,E.B (1881).Anthropology: An Introduction to the study of man and Civilization. New York.
Tradechakra (2010).Fertilizer.Downloaded from http://www.tradechakra.com/indian-
economy/industries/fertilizers.html. Last accessed 5th of August 2011.
William E. Matthews. (1977). Planned Entry—Planned Exit. California Management Review.Vol. XX (2),
pp. 36-44.
Williamson, O.E (1975).Markets and Hierarchies: Analysis and antitrust implications. The Free PressNew
York.
Worldbank (2000).India Country brief.Downloaded from: http://web.worldbank.org. Last accessed 7th of
September 2011.
Yin, R.K (1994).Case Study Research : Design and Methods. London:Sage Publications.
Yip, G. S., Biscarri, J. G..&Monti, J. A. (20).The role of internationalization process in the performance of
newly internationalizing firms.Journal of International Marketing, vol. 8(3), pp. 10-35.
Zhao, J.H. Kim. S.H..& Du, J. (2003).The impact of corruption and transparency on foreign direct
investment: an empirical analysis. Management International Review, vol. (1), pp. 41-62.


![വാ൪ഷികപതിപ്പ്...Lintu Sara Eapen \£{X^ew ഇട ക ക ള പ . ഉമ മ Recipe Ruby Saji Treasure trove in Turkey Dr. Suja Varghese s]mXpam¸v ര ബ](https://img.pdfslide.us/doc/110x75/5f23967bfd9b42208060f985/aaaaaaaaaaaaa-lintu-sara-eapen-xew-aa-a.jpg)