Embed Size (px)
Citation preview
ENDANGERED FISH MONITORING AND
NONNATIVE SPECIES MONITORING AND
CONTROL IN THE UPPER/MIDDLE SAN JUAN
RIVER: 2013
FINAL REPORT
PREPARED FOR:
SAN JUAN RIVER BASIN RECOVERY IMPLEMENTATION PROGRAM
PREPARED BY:
BOBBY R. DURAN
U.S. FISH AND WILDLIFE SERVICE
NEW MEXICO FISH AND WILDLIFE CONSERVATION OFFICE
3800 COMMONS N.E.
ALBUQUERQUE, NM 87109
Endangered Fish Monitoring and Nonnative Species Monitoring and Control in the Upper/Middle San Juan River: 2013 Final
ENDANGERED FISH MONITORING AND NONNATIVE SPECIES
MONITORING AND CONTROL IN THE UPPER/MIDDLE SAN JUAN RIVER:
2013
PREPARED BY:
BOBBY R. DURAN
UNITED STATES FISH AND WILDLIFE SERVICE
NEW MEXICO FISH AND WILDLIFE CONSERVATION OFFICE
3800 COMMONS N.E.
ALBUQUERQUE, NM 87109
SUBMITTED TO:
SAN JUAN RIVER BASIN RECOVERY IMPLEMENTATION PROGRAM
BIOLOGY COMMITTEE
1 JULY 2014
Endangered Fish Monitoring and Nonnative Species Monitoring and Control in the Upper/Middle San Juan River: 2013 Final
i
EXECUTIVE SUMMARY
1. A total of 13,912 channel catfish and 202 common carp were removed from river miles
(RM) 166.6 – 52.9 in 693.7 hours of electrofishing.
2. No juvenile channel catfish were collected during the two nonnative removal trips and
fall monitoring from PNM Weir to Hogback Diversion. Adult catch rates were similar to
values observed in 2012.
3. Juvenile channel catfish CPUE, from Hogback Diversion to Shiprock Bridge, declined
during all three nonnative removal trips and fall monitoring. Adult channel catfish CPUE
remained similar to 2012.
4. Juvenile and adult channel catfish CPUE, from Shiprock Bridge to Mexican Hat, Utah,
declined during fall monitoring to the lowest observed catch rates throughout the study
period 1996-2013.
5. Mean common carp CPUE was <1.0 fish/hour in all three removal sections.
6. Common carp CPUE, during annual fall monitoring in all three removal sections,
significantly declined after the initiation of nonnative removal.
7. A total of 573 Colorado pikminnow and 2,041 razorback sucker were collected during
our efforts in 2013.
8. Nineteen adult Colorado pikeminnow (>450 mm total length (TL)) were collected in
2013 including 15 individual fish >500 mm TL.
9. Similar to 2012, a possible spawning aggregation of adult Colorado pikeminnow was
observed in June near RM 118.
10. Razorback sucker continue to show long-term persistence in the river. Fourteen
individual fish captured in 2013 had been in the San Juan River 10 or more years.
Endangered Fish Monitoring and Nonnative Species Monitoring and Control in the Upper/Middle San Juan River: 2013 Final
ii
TABLE OF CONTENTS
EXECUTIVE SUMMARY ........................................................................................................................i
INTRODUCTION ...................................................................................................................................1
STUDY AREA ......................................................................................................................................1
METHODS ...........................................................................................................................................2
RESULTS .............................................................................................................................................4
PNM WEIR TO HOGBACK DIVERSION ............................................................................................4
Channel catfish.........................................................................................................................4
Common carp ...........................................................................................................................6
HOGBACK DIVERSION TO SHIPROCK BRIDGE .................................................................................7
Channel catfish.........................................................................................................................7
Common carp ...........................................................................................................................10
SHIPROCK BRIDGE TO MEXICAN HAT ............................................................................................11
Mark and Recapture .................................................................................................................12
Channel catfish.........................................................................................................................15
Common carp ...........................................................................................................................17
RARE FISH COLLECTIONS ...............................................................................................................18
Colorado pikeminnow ..............................................................................................................19
Razorback sucker .....................................................................................................................21
DISCUSSION ........................................................................................................................................22
ACKNOWLEDGEMENTS ........................................................................................................................28
LITERATURE CITED .............................................................................................................................29
APPENDICES ........................................................................................................................................31

Endangered Fish Monitoring and Nonnative Species Monitoring and Control in the Upper/Middle San Juan River: 2013 Final
iii
LIST OF TABLES
Table 1. Channel catfish exploitation rates from Shiprock Bridge to Mexican Hat, UT. 2013. Numbers in parentheses
in the Mark Pass row represent total number of channel catfish tagged in that size class. Numbers in
parentheses in the Trip 1 row represent total number of channel catfish recaptured for that size class and
trip and percentage is the exploitation rate for that size class during that trip….. ……………………...…...12
Table 2. Number of adult channel catfish removed during each trip. The % of population estimate removed
each trip is based off of the population estimate for adult channel catfish from Shiprock Bridge to
Mexican Hat. The estimated number of fish remaining is also based off of the population estimate. ............. 13
Table 3. Number of juvenile channel catfish removed during each trip. The % of population estimate removed
each trip is based off of the population estimate for juvenile channel catfish from Shiprock Bridge to
Mexican Hat. The estimated number of fish remaining is also based off of the population estimate .............. 14
Table 4. Summary of Colorado pikeminnow, by known year class, collected during nonnative fish removal; 2013 ... 19
Table 5. Summary of razorback sucker by year class collected during nonnative fish removal; 2013.......................... 21
LIST OF FIGURES
Figure 1. Map of study area ........................................................................................................................................... 2
Figure 2. Channel catfish CPUE (fish/hour) during annual fall monitoring by year, PNM Weir to Hogback
Diversion; 1996-2013. Adult CPUE is represented by triangles. Juvenile CPUE is represented by circles.
A line was fitted if the trend was significant (y= 4.937 – 0.638x; r2 = 0.39; p = 0.04). The vertical hash
line represents the initiation of intensive nonnative removal in this section. Error bars represent ± 1 SE.. .. 5
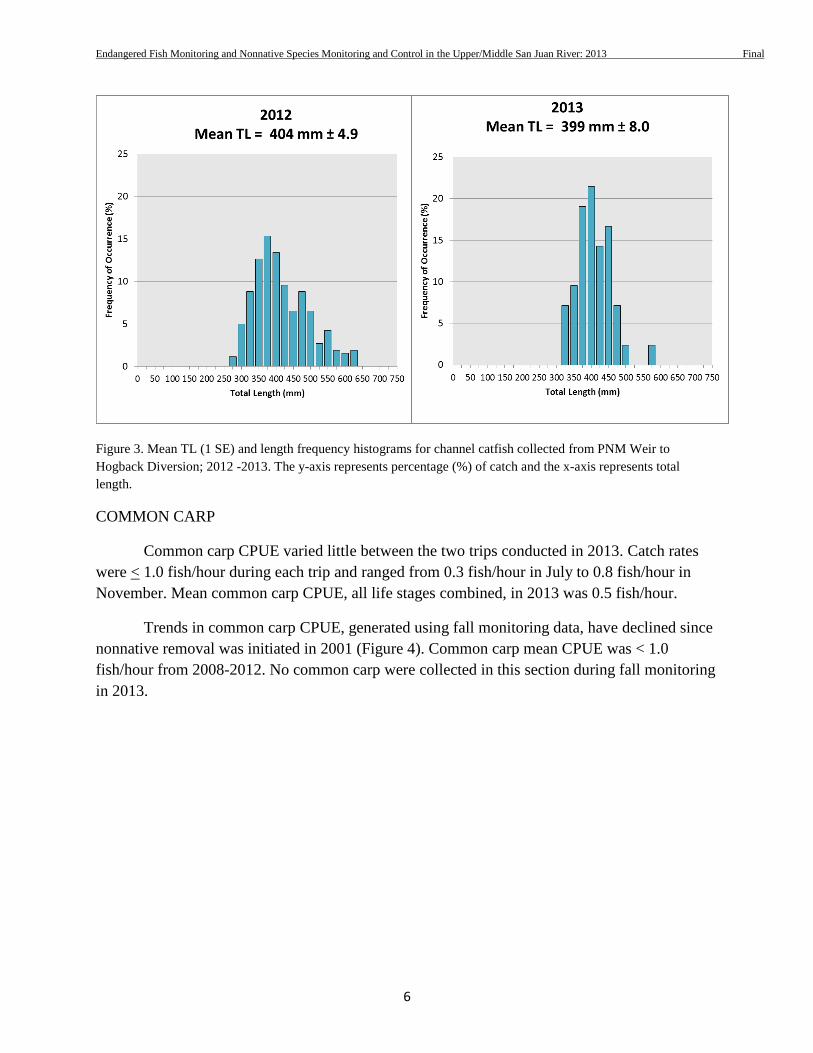
Figure 3. Mean TL (1 SE) and length frequency histograms for channel catfish collected from PNM Weir to
Hogback Diversion; 2011 -2013. The y-axis represents percentage (%) of catch and the x-axis represents
total length. .................................................................................................................................................... 6
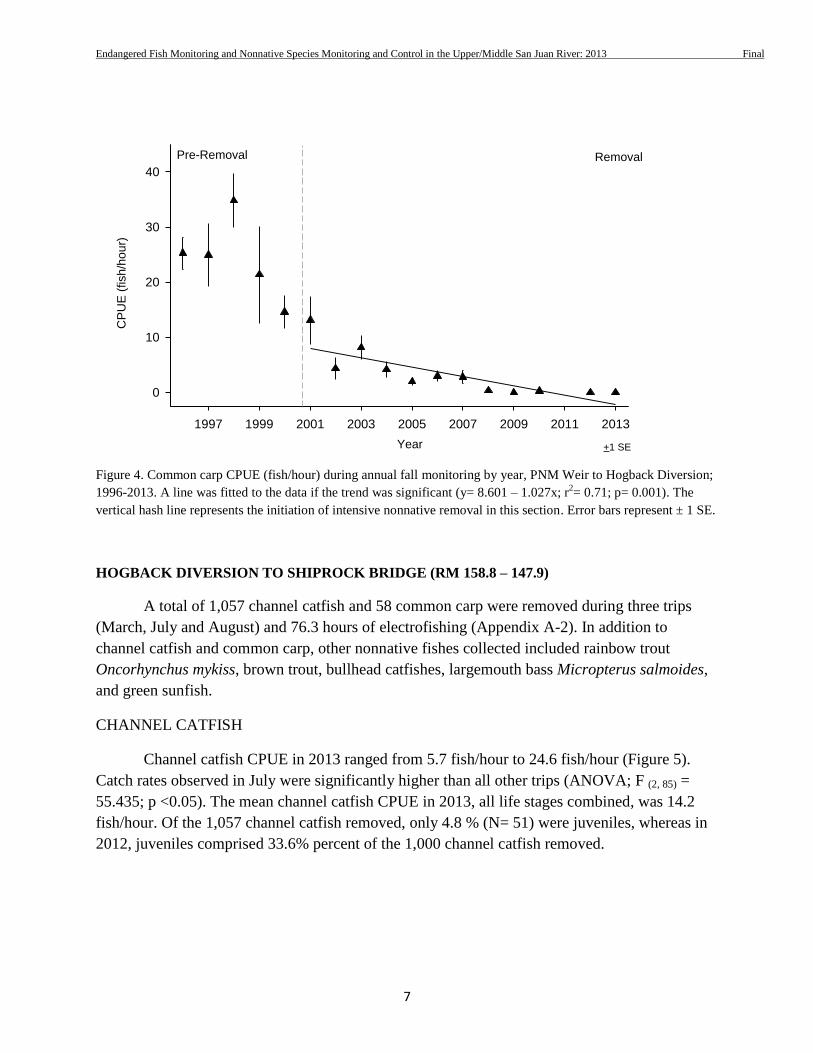
Figure 4. . Common carp CPUE (fish/hour) during annual fall monitoring by year, PNM Weir to Hogback
Diversion; 1996-2013. A line was fitted to the data if the trend was significant (y= 8.601 – 1.027x; r2=
0.71; p= 0.001). The vertical hash line represents the initiation of intensive nonnative removal in this
section. Error bars represent ± 1 SE... .......................................................................................................... 7
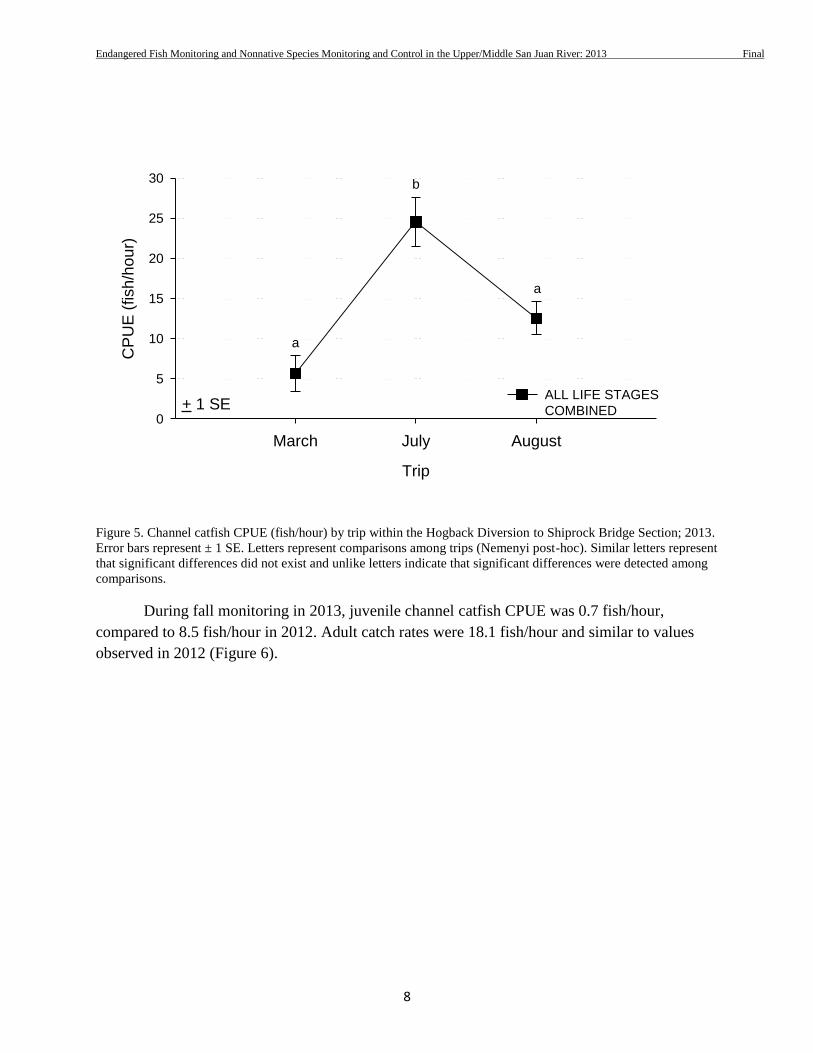
Figure 5. Channel catfish CPUE (fish/hour) by trip within the Hogback Diversion to Shiprock Bridge Section
2013. Error bars represent ± 1 SE. Letters represent comparisons among trips (Nemenyi post-hoc).
Similar letters represent that significant differences did not exist and unlike letters indicate that
significant differences were detected among comparisons. .......................................................................... 8
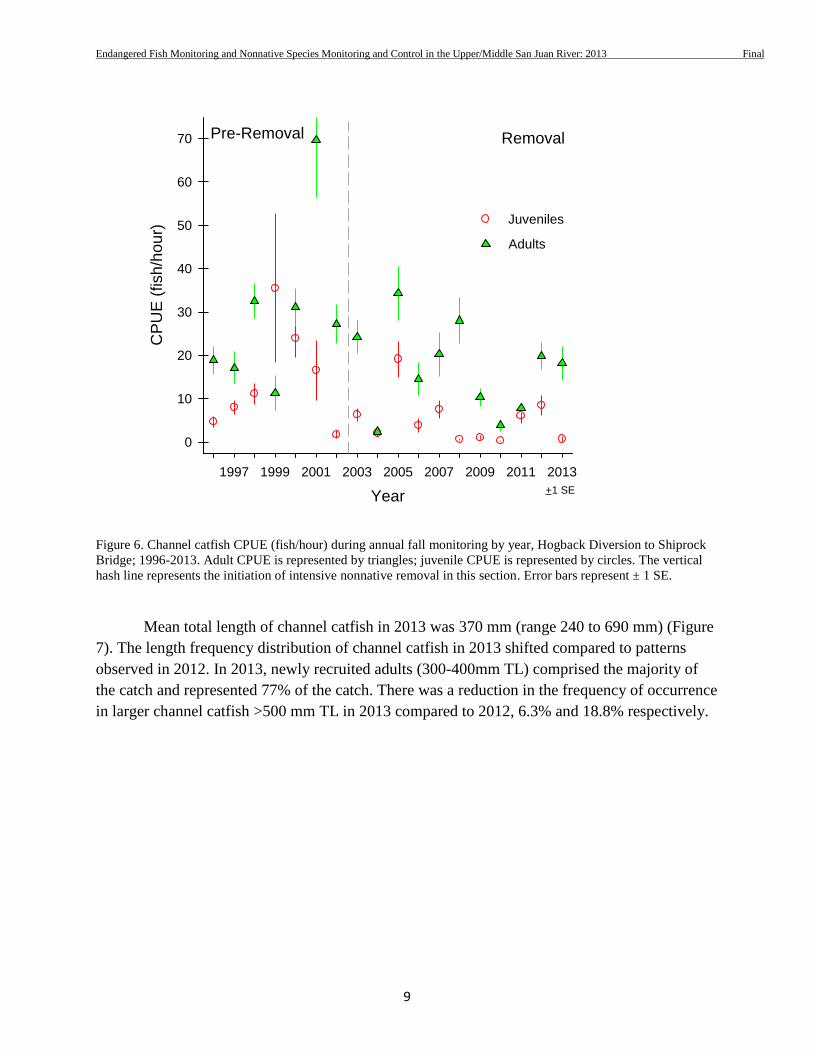
Figure 6. Channel catfish CPUE (fish/hour) during annual fall monitoring by year, Hogback Diversion
to Shiprock Bridge; 1996-2013. Adult CPUE is represented by triangles. Juvenile CPUE is represented
by circles. The vertical hash line represents the initiation of intensive nonnative removal in this section.
Error bars represent ± 1 SE. .......................................................................................................................... 9
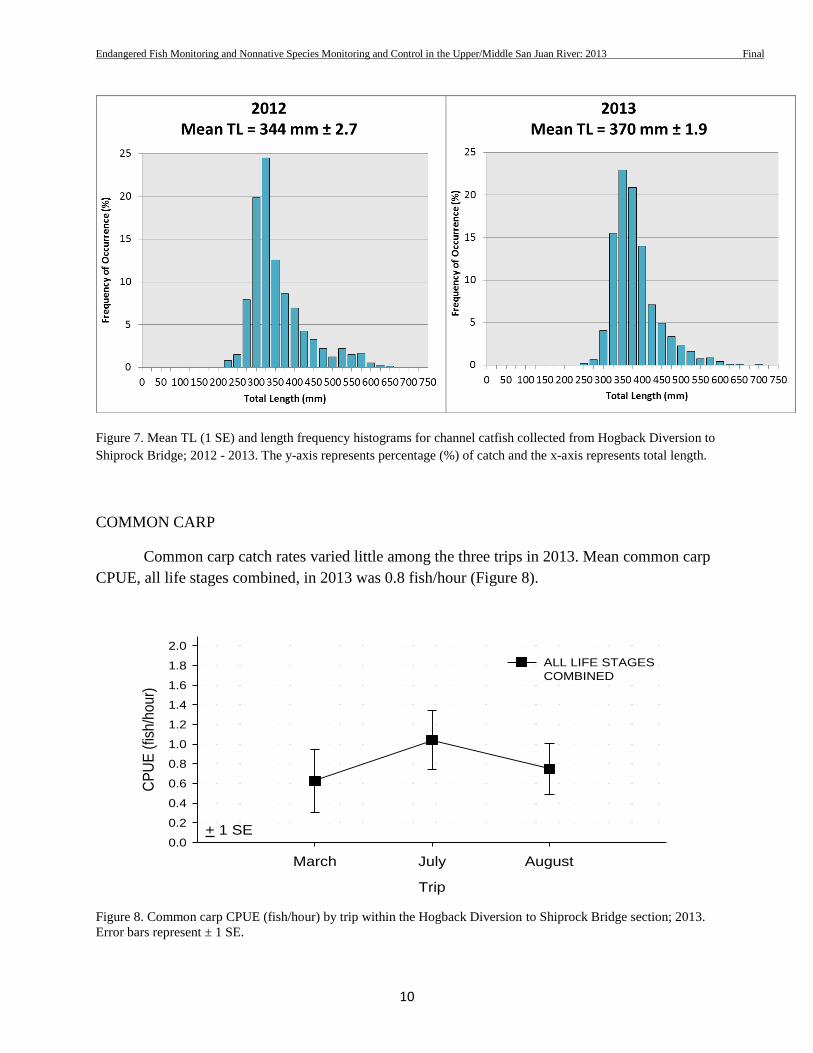
Figure 7. Mean TL (1 SE) and length frequency histograms for channel catfish collected from Hogback Diversion
to Shiprock Bridge; 2012 - 2013. The y-axis represents percentage (%) of catch and the x-axis represents
total length .................................................................................................................................................... 10
Endangered Fish Monitoring and Nonnative Species Monitoring and Control in the Upper/Middle San Juan River: 2013 Final
iv
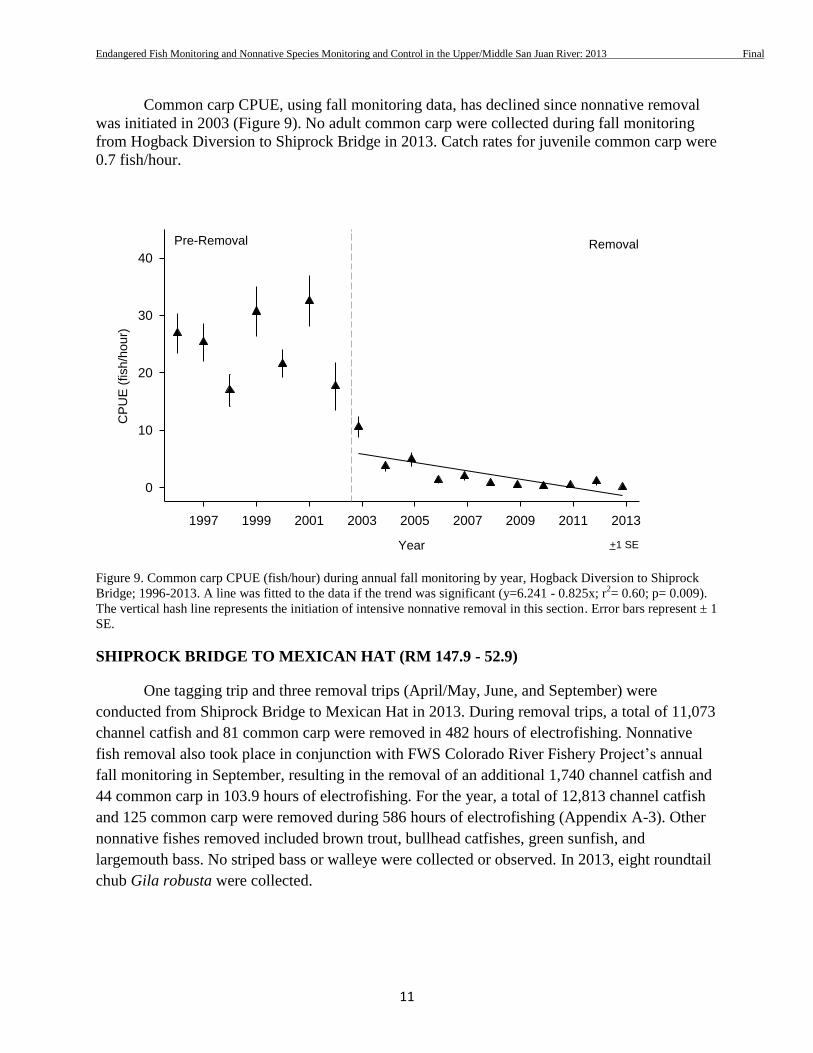
Figure 8. Common carp CPUE (fish/hour) by trip within the Hogback Diversion to Shiprock Bridge section; 2013.
Error bars represent ± 1 SE ........................................................................................................................... 10
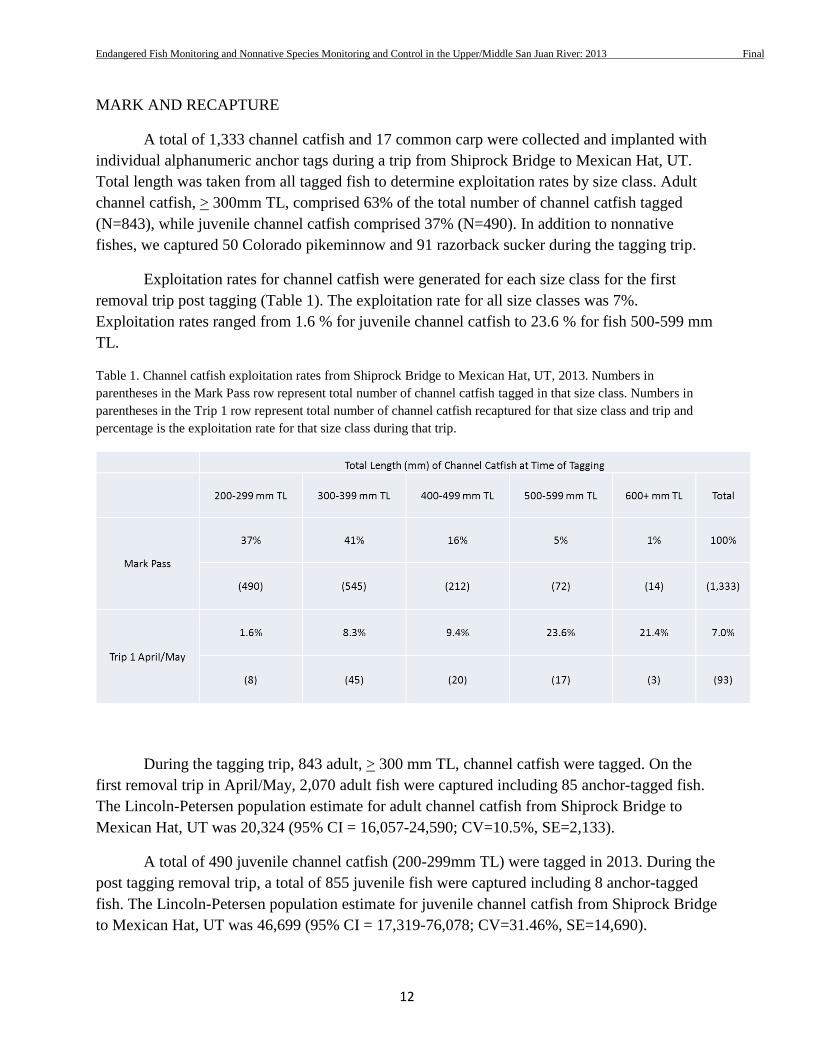
Figure 9. Common carp CPUE (fish/hour) during annual fall monitoring by year, Hogback Diversion to Shiprock
Bridge; 1996-2013. A line was fitted to the data if the trend was significant (y=6.241 - 0.825x; r2= 0.60;
p= 0.009). The vertical hash line represents the initiation of intensive nonnative removal in this section.
Error bars represent ± 1 SE. .......................................................................................................................... 11
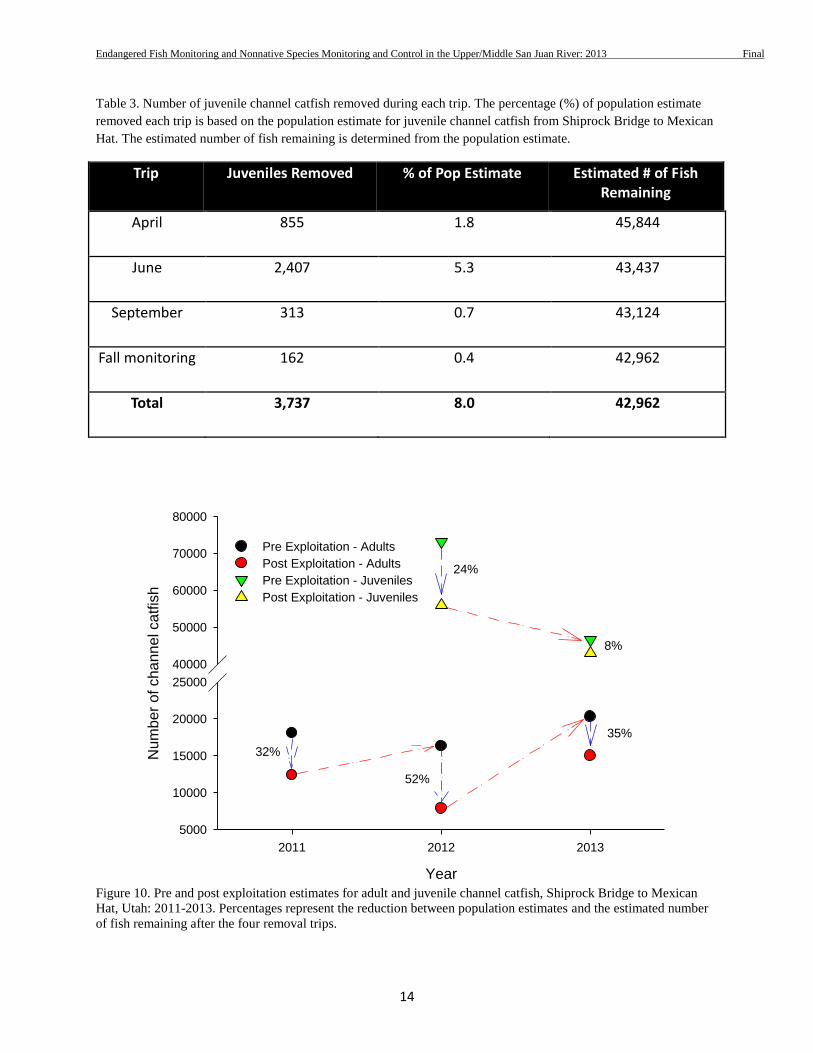
Figure 10. Pre and post exploitation estimates for adult and juvenile channel catfish, Shiprock Bridge to Mexican
Hat, Utah: 2011-2013. Percentages represent the reduction between population estimates at the
beginning of the year before sampling versus the population estimate remaining after the four removal
trips ............................................................................................................................................................... 14
Figure 11. Channel catfish CPUE (fish/hour) by trip from Shiprock Bridge to Mexican Hat; 2013. Error bars
represent ± 1 SE. Letters represent comparisons among trips (Nemenyi post-hoc). Similar letters
represent that significant differences did not exist and unlike letters indicate that significant differences
were detected among comparisons. .............................................................................................................. 15
Figure 12. Channel catfish CPUE (fish/hour) during annual fall monitoring by year, Shiprock Bridge to
Mexican Hat; 1996-2013. Adult CPUE is represented by triangles. Juvenile CPUE is represented by
circles. The vertical hash line represents the initiation of intensive nonnative removal in
this section .................................................................................................................................................... 16
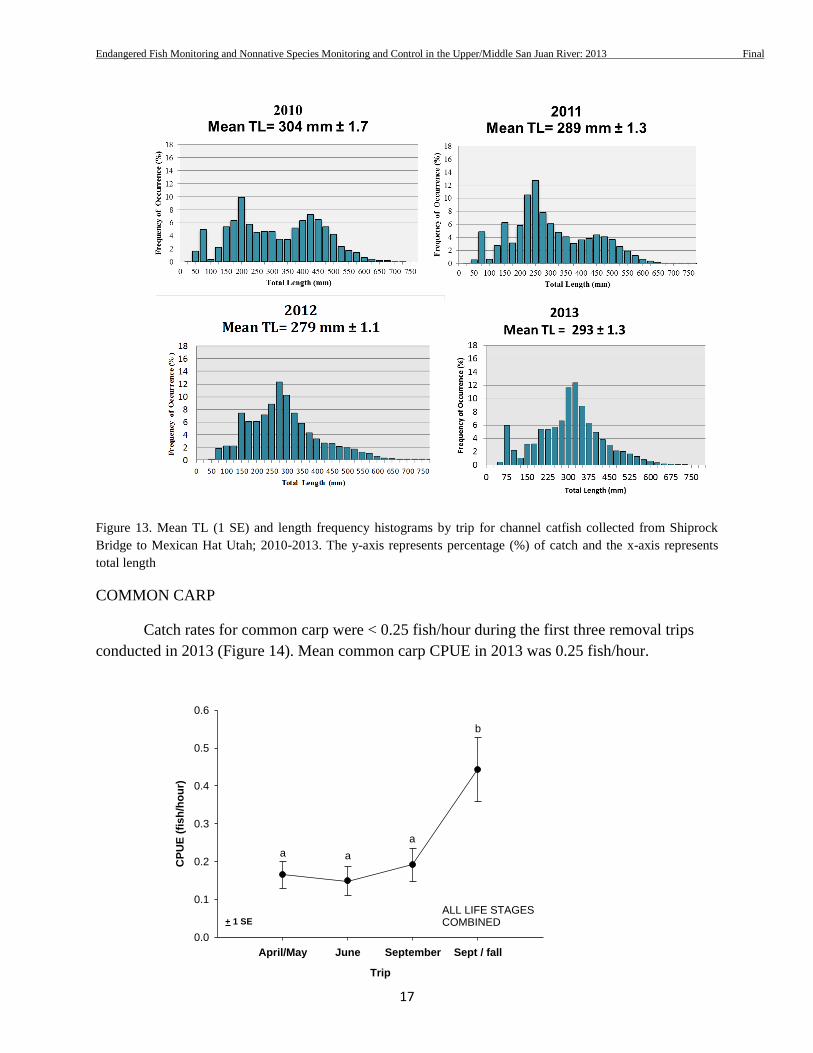
Figure 13. Mean TL (1 SE) and length frequency histograms by trip for channel catfish collected from Shiprock
Bridge to Mexican Hat Utah; 2010 - 2013. The y-axis represents percentage (%) of catch and the x-axis
represents total length. .................................................................................................................................. 17
Figure 14. Common carp CPUE (fish/hour of electrofishing) during 2013 nonnative removal trips from Shiprock
Bridge to Mexican Hat. Error bars represent + 1 SE. Letters represent comparisons among trips
(Nemenyi post-hoc). Similar letters represent that significant differences did not exist and unlike letters
indicate that significant differences were detected among comparisons...................................................... 17
Figure 15. Common carp CPUE (fish/hour) during annual fall monitoring by year, Shiprock Bridge to Mexican
Hat; 1996-2013. A line was fitted to the data if the trend was significant (96-05: y= 16.289 – 1.332x; r2
= 0.77; p<0.001; 06-12: y= 2.484 – 0.467; r2= 0.81; p=0.01). The vertical hash line represents the
initiation of intensive nonnative removal in this section. Error bars represent ± 1 SE ................................ 18
Figure 16. Mean TL (1 SE) and length frequency histogram for Colorado pikeminnow collected during intensive
nonnative fish removal trips; 2013. The y-axis represents percentage (%) of catch and the x-axis
represents total length.. ................................................................................................................................. 20
Figure 17. Mean TL (1 SE) and length frequency histogram for razorback sucker collected during intensive
nonnative fish removal trips; 2013. The y-axis represents percentage (%) of catch and the x-axis
represents total length ................................................................................................................................... 22
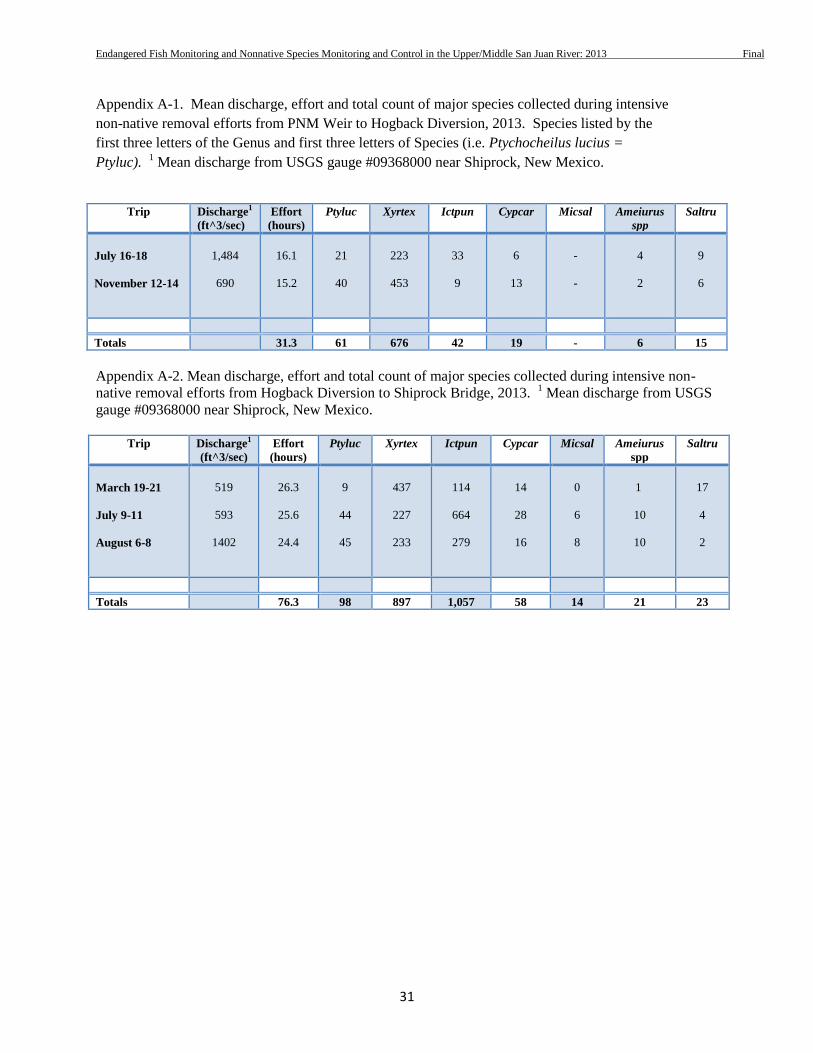
Appendix A-1. Mean discharge, effort and total count of major species collected during intensive
nonnative fish removal efforts from PNM Weir to Hogback Diversion, 2013. Species listed by the
first three letters of the Genera and first three letters of the Species (i.e. Ptychocheilus lucius =
Ptyluc). 1 Mean discharge from USGS gauge #09368000 near Shiprock, New Mexico ...................... 32
Appendix A-2. Mean discharge, effort and total count of major species collected during intensive
nonnative fish removal efforts from Hogback Diversion to Shiprock Bridge, 2013. 1 Mean
discharge from USGS gauge #09368000 near Shiprock, New Mexico ................................................. 32
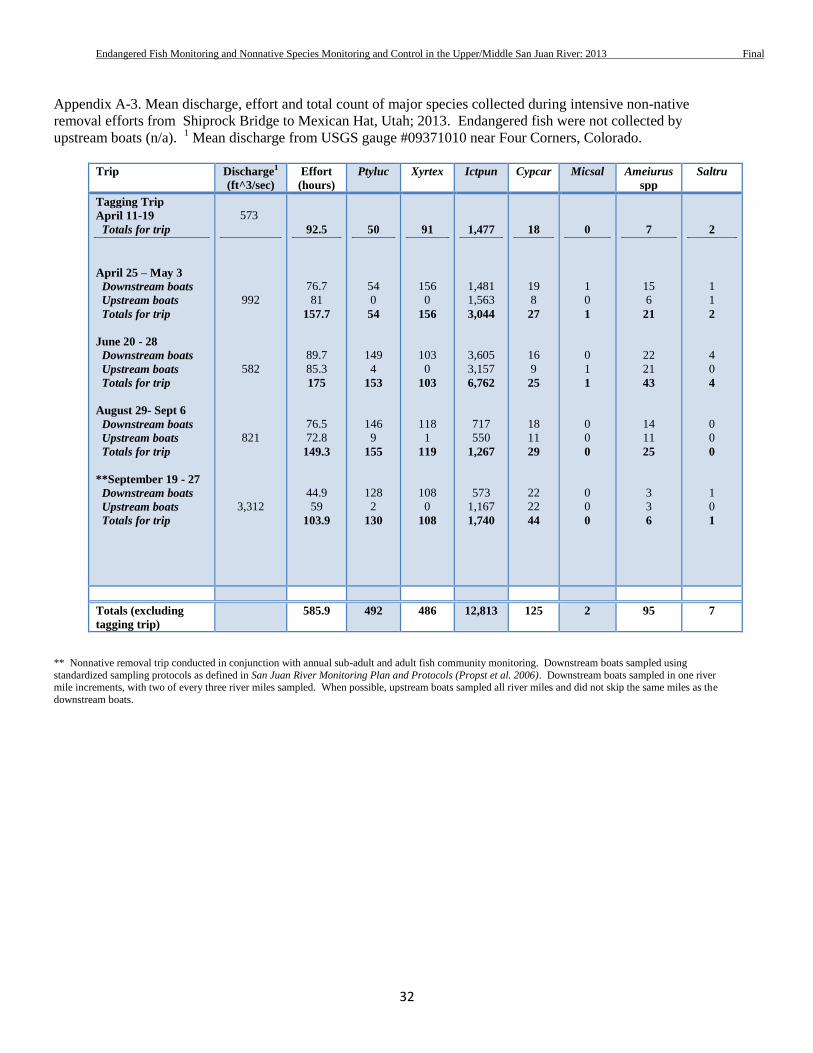
Appendix A-3. Mean discharge, effort and total count of major species collected during intensive
nonnative fish removal efforts from Shiprock Bridge to Mexican Hat, Utah; 2013. 1 Mean
discharge from USGS gauge #09371010 near Four Corners, Colorado ................................................ 33
1
INTRODUCTION_____________________________________________________________
The San Juan River is home to two federally endangered fishes, Colorado pikeminnow
Ptychocheilus lucius and razorback sucker Xyrauchen texanus. The establishment of channel
catfish Ictalurus punctatus and common carp Cyprinus carpio has been identified as a detriment
to the recovery of Colorado pikeminnow and razorback sucker (USFW 2002a, b). Reducing the
impacts of nonnative fishes has specifically been identified as a management element in the San
Juan River Basin Recovery Implementation Program’s Long Range Plan (U.S. Fish and Wildlife
Service 2013):
Element 3 - Specific goals, actions, and tasks
Goal 3.1 Control Problematic Nonnative Fishes.
Action 3.1.1 Develop, implement, and evaluate the most effective
strategies for reducing problematic nonnative fish.
Task 3.1.1.1 Mechanically remove nonnative fish to achieve
objectives
Removal efforts by U.S. Fish and Wildlife Service, New Mexico Fish and Wildlife
Conservation Office (NMFWCO) began on a limited basis in 1998 with intensified efforts
beginning in 2001. These initial efforts focused on a section of river from PNM Weir to Hogback
Diversion (RM 166.6 - 159.0). In addition to this section, intensive nonnative removal from
Hogback Diversion to Shiprock Bridge (RM 158.8 – 147.9) has been conducted since 2003.
Based on observed increases in channel catfish abundance (Ryden 2007, 2008), efforts were
expanded in 2008 to include intensive removal from Shiprock Bridge to Mexican Hat, UT (RM
147.9 – 52.9). In 2013, intensive nonnative removal conducted by NMFWCO encompassed
113.7 river miles.
Study objectives were as follows:
1. Continue to remove nonnative fishes, primarily channel catfish and common carp, from 113.7 river miles of
the San Juan River
2. Implement riverwide mark/recapture to determine exploitation rates for channel catfish
3. Evaluate distribution and abundance patterns of nonnative species to determine effects of mechanical
removal
4. Characterize distribution and abundance of endangered fishes in the upper and middle reaches of the San
Juan River
STUDY AREA ________________________________________________________________
Intensive nonnative removal efforts in 2013 focused on three individual sections of the
San Juan River, New Mexico, Colorado, and Utah, encompassing 113.7 river miles (RM).
Sections sampled included PNM Weir to Hogback Diversion (RM 166.6 – 159.0), Hogback
Diversion to Shiprock Bridge (RM 158.8 – 147.9), and Shiprock Bridge to Mexican Hat, Utah
Endangered Fish Monitoring and Nonnative Species Monitoring and Control in the Upper/Middle San Juan River: 2013 Final
2
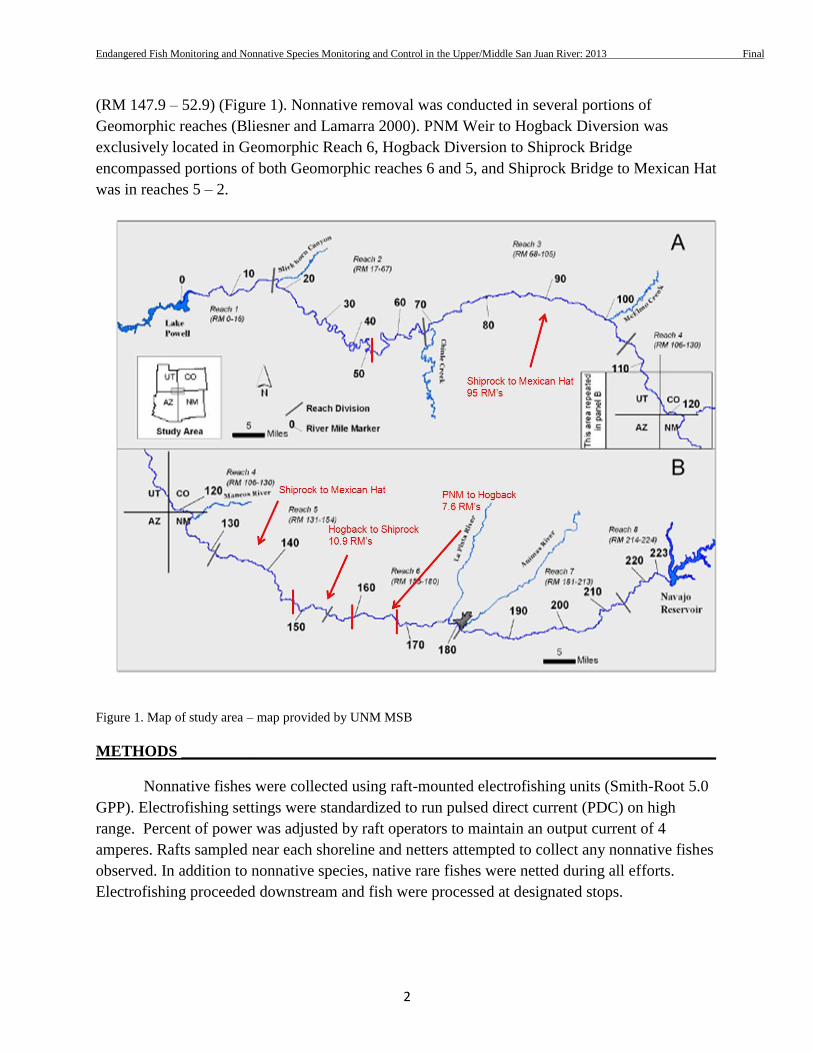
(RM 147.9 – 52.9) (Figure 1). Nonnative removal was conducted in several portions of
Geomorphic reaches (Bliesner and Lamarra 2000). PNM Weir to Hogback Diversion was
exclusively located in Geomorphic Reach 6, Hogback Diversion to Shiprock Bridge
encompassed portions of both Geomorphic reaches 6 and 5, and Shiprock Bridge to Mexican Hat
was in reaches 5 – 2.
Figure 1. Map of study area – map provided by UNM MSB
METHODS ___________________________________________________________________
Nonnative fishes were collected using raft-mounted electrofishing units (Smith-Root 5.0
GPP). Electrofishing settings were standardized to run pulsed direct current (PDC) on high
range. Percent of power was adjusted by raft operators to maintain an output current of 4
amperes. Rafts sampled near each shoreline and netters attempted to collect any nonnative fishes
observed. In addition to nonnative species, native rare fishes were netted during all efforts.
Electrofishing proceeded downstream and fish were processed at designated stops.
Endangered Fish Monitoring and Nonnative Species Monitoring and Control in the Upper/Middle San Juan River: 2013 Final
3
All nonnative fishes or a representative sub-sample (blind grab) were measured (nearest 1
mm) for total (TL) and standard length (SL) and weighed (nearest 5 g). Seconds of electrofishing
were recorded to determine effort at the end of each sampling unit. Sampling units ranged from
two to three miles depending on the section. All nonnative fishes collected were removed from
the river. Two electrofishing rafts sampled for three consecutive days/trip from PNM Weir to
Hogback Diversion and Hogback Diversion to Shiprock Bridge. During sampling from Shiprock
Bridge to Mexican Hat, a total of four electrofishing rafts were used. Two rafts began sampling
one hour prior to the remaining rafts resulting in the completion of two electrofishing passes per
trip.
Native rare fishes collected were immediately placed in a live well or five-gallon bucket
separate from nonnative fishes. Rare native fishes were measured (nearest 1 mm), weighed
(nearest 5 g) and checked for the presence of a Passive Implant Transponder (PIT) tag. If a PIT
tag was detected, the number was recorded and it was noted that the fish was a recaptured fish. If
the presence of a PIT tag was not detected and the fish was ≥ 150 mm TL, a 134.2 kHz PIT tag
was implanted and the capture status was recorded as a new capture (Davis 2010).
A mark and recapture study from Shiprock Bridge to Mexican Hat for channel catfish
was initiated in 2011. The purpose of this effort was to determine exploitation rates and generate
population estimates. All channel catfish and common carp ≥ 200 mm TL were tagged with
individually numbered anchor tags and released back to the river. A population estimate was
calculated for adult and juvenile channel catfish, and adult common carp using a Lincoln-
Petersen estimate with Chapman’s Correction. The estimate was based on fish recaptured during
the first trip conducted after tagging. Fish that moved upstream of Shiprock Bridge were not
included in the calculation of exploitation rates or the population estimate. Exploitation rates, u,
were estimated as the proportion of recaptured marked fish to marked fish (Deroba et al. 2005),
u = R/M
where, R represents number of recaptured fish and M represents number of marked fish.
To assess long-term trends in distribution and abundance, mean catch rates (fish per hour
of electrofishing CPUE) and standard error (± 1 SE) were calculated using the software package
SPSS version 13.0 (2004). Species CPUE were calculated as the total number of fish collected
divided by the total sampling effort (hours of electrofishing). If CPUE data met the assumptions
of normality and equality of variance, a one-way analysis of variance (ANOVA) was conducted
to determine if significant differences existed. Multiple pairwise comparisons using Bonferroni
post-hoc tests were used to determine where significant differences existed. If data were
heteroscedastic, and transformations were unsuccessful in attaining equal variance, an ANOVA
on ranked data (Kruskal-Wallis) was conducted with Nemenyi post-hoc tests to determine where
significant differences existed (Zar 1996). Significance levels were set at P<0.05.
Data for each removal section were summarized by trip. Catch rates among individual
trips were analyzed to assess temporal changes within the year. Due to difference in the number
Endangered Fish Monitoring and Nonnative Species Monitoring and Control in the Upper/Middle San Juan River: 2013 Final
4
and timing of removal trips conducted in each section among years, we used data collected
during the annual sub-adult and adult fall monitoring to assess long term trends in catch rates.
These data were collected under standardized monitoring protocols with the primary assumptions
that sampling methods employed were appropriate to the species, size, and habitats being
sampled, and that sampling efficiency remained relatively constant (SJRIP 2012). Catch data pre
and post intensive removal were analyzed to assess the effects of removal on nonnative fishes.
RESULTS____________________________________________________________________
PNM WEIR TO HOGBACK DIVERSION (RM 166.6 – 159.0)
A total of 42 channel catfish and 19 common carp were removed from this section during
two trips (July and November) and 31.3 hours of electrofishing (Appendix A-1). Additional
nonnative fishes removed from the section included brown trout Salmo trutta, bullhead catfishes
Ameiurus spp., and green sunfish Lepomis cyanellus.
CHANNEL CATFISH
In 2013, mean channel catfish CPUE for all life stages combined was 1.2 fish/hour. Catch
rates were similar between trips and were 1.9 fish/hour in July and 0.5 fish/hour in November.
No juvenile channel catfish were collected during the two trips in 2013. Fewer total fish (N = 42)
were removed in this section in 2013, compared to 2012 (N = 301). Out of the 42 fish removed
in 2013, 33(78.6%) came from the July trip.
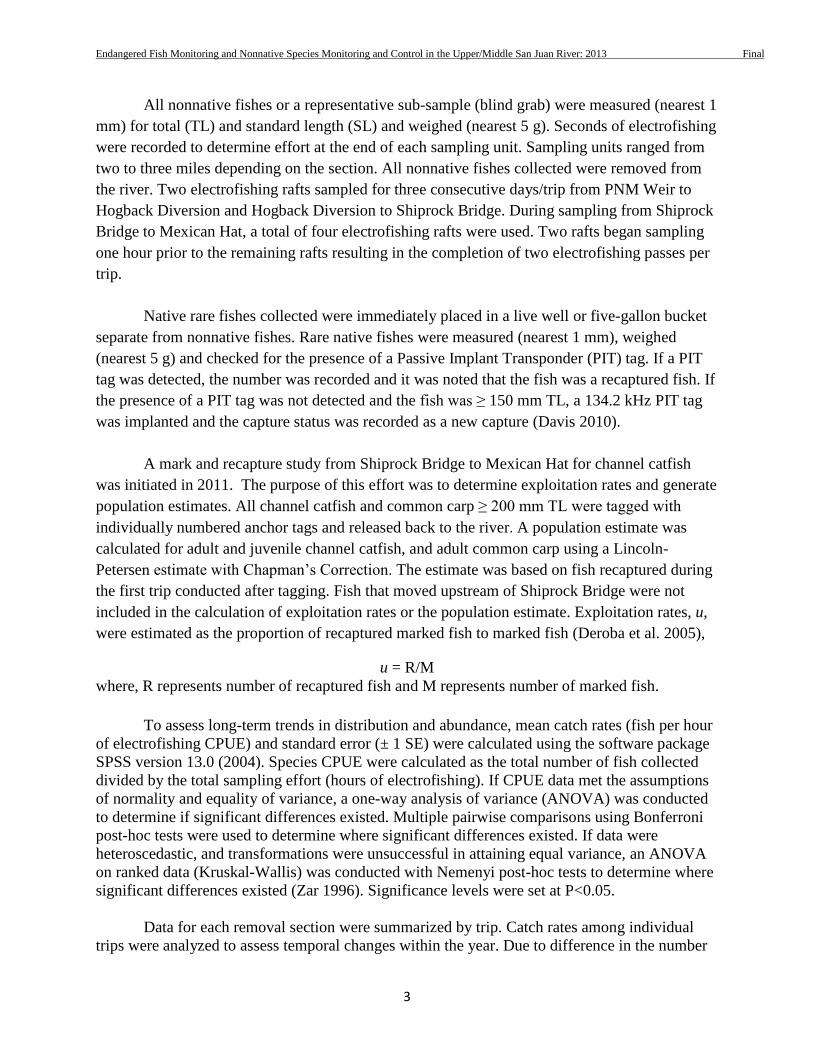
Trends in juvenile channel catfish CPUE , generated using fall monitoring data, have
declined since nonnative removal was initiated in this section in 2001 (Figure 2). Juvenile
channel catfish were collected during all years prior to the initiation of intensive removal and
2013 marked the fifth consecutive year, post–removal, that no juvenile channel catfish were
collected. In 2013, adult channel catfish catch rates were significantly lower than in all years
prior to the start of intensive removal.
Endangered Fish Monitoring and Nonnative Species Monitoring and Control in the Upper/Middle San Juan River: 2013 Final
5
Figure 2. Channel catfish CPUE (fish/hour) during annual fall monitoring by year, PNM Weir to Hogback
Diversion; 1996-2013. Adult CPUE is represented by triangles and juvenile CPUE is represented by circles. A line
was fitted if the trend was significant (y= 4.937 – 0.638x; r2 = 0.39; p = 0.04). The vertical hash line represents the
initiation of intensive nonnative removal in this section. Error bars represent ± 1 SE.
Mean total length of channel catfish in 2013 was 399 mm TL (range 305 to 560 mm TL)
(Figure 3). The majority of channel catfish collected in 2013 was composed of newly recruited
adults (300-400 mm TL).The percentage (4.8%) of large adult channel catfish, >500 mm TL,
was reduced from 18.8% in 2012.
1997 1999 2001 2003 2005 2007 2009 2011 2013
CP
UE
(fish
/ho
ur)
0
10
20
30
40
50
60
Juveniles
Year
Removal
Adults
Pre-Removal
+1 SE
Endangered Fish Monitoring and Nonnative Species Monitoring and Control in the Upper/Middle San Juan River: 2013 Final
6
Figure 3. Mean TL (1 SE) and length frequency histograms for channel catfish collected from PNM Weir to
Hogback Diversion; 2012 -2013. The y-axis represents percentage (%) of catch and the x-axis represents total
length.
COMMON CARP
Common carp CPUE varied little between the two trips conducted in 2013. Catch rates
were < 1.0 fish/hour during each trip and ranged from 0.3 fish/hour in July to 0.8 fish/hour in
November. Mean common carp CPUE, all life stages combined, in 2013 was 0.5 fish/hour.
Trends in common carp CPUE, generated using fall monitoring data, have declined since
nonnative removal was initiated in 2001 (Figure 4). Common carp mean CPUE was < 1.0
fish/hour from 2008-2012. No common carp were collected in this section during fall monitoring
in 2013.
Endangered Fish Monitoring and Nonnative Species Monitoring and Control in the Upper/Middle San Juan River: 2013 Final
7
Figure 4. Common carp CPUE (fish/hour) during annual fall monitoring by year, PNM Weir to Hogback Diversion;
1996-2013. A line was fitted to the data if the trend was significant (y= 8.601 – 1.027x; r2= 0.71; p= 0.001). The
vertical hash line represents the initiation of intensive nonnative removal in this section. Error bars represent ± 1 SE.
HOGBACK DIVERSION TO SHIPROCK BRIDGE (RM 158.8 – 147.9)
A total of 1,057 channel catfish and 58 common carp were removed during three trips
(March, July and August) and 76.3 hours of electrofishing (Appendix A-2). In addition to
channel catfish and common carp, other nonnative fishes collected included rainbow trout
Oncorhynchus mykiss, brown trout, bullhead catfishes, largemouth bass Micropterus salmoides,
and green sunfish.
CHANNEL CATFISH
Channel catfish CPUE in 2013 ranged from 5.7 fish/hour to 24.6 fish/hour (Figure 5).
Catch rates observed in July were significantly higher than all other trips (ANOVA; F (2, 85) =
55.435; p <0.05). The mean channel catfish CPUE in 2013, all life stages combined, was 14.2
fish/hour. Of the 1,057 channel catfish removed, only 4.8 % (N= 51) were juveniles, whereas in
2012, juveniles comprised 33.6% percent of the 1,000 channel catfish removed.
1997 1999 2001 2003 2005 2007 2009 2011 2013
0
10
20
30
40
+1 SEYear
CP
UE
(fish/h
our)
Pre-Removal Removal
Endangered Fish Monitoring and Nonnative Species Monitoring and Control in the Upper/Middle San Juan River: 2013 Final
8
Figure 5. Channel catfish CPUE (fish/hour) by trip within the Hogback Diversion to Shiprock Bridge Section; 2013.
Error bars represent ± 1 SE. Letters represent comparisons among trips (Nemenyi post-hoc). Similar letters represent
that significant differences did not exist and unlike letters indicate that significant differences were detected among
comparisons.
During fall monitoring in 2013, juvenile channel catfish CPUE was 0.7 fish/hour,
compared to 8.5 fish/hour in 2012. Adult catch rates were 18.1 fish/hour and similar to values
observed in 2012 (Figure 6).
Trip
March July August
CP
UE
(fish
/ho
ur)
0
5
10
15
20
25
30
ALL LIFE STAGES
COMBINED
a
b
a
+ 1 SE
Endangered Fish Monitoring and Nonnative Species Monitoring and Control in the Upper/Middle San Juan River: 2013 Final
9
Figure 6. Channel catfish CPUE (fish/hour) during annual fall monitoring by year, Hogback Diversion to Shiprock
Bridge; 1996-2013. Adult CPUE is represented by triangles; juvenile CPUE is represented by circles. The vertical
hash line represents the initiation of intensive nonnative removal in this section. Error bars represent ± 1 SE.
Mean total length of channel catfish in 2013 was 370 mm (range 240 to 690 mm) (Figure
7). The length frequency distribution of channel catfish in 2013 shifted compared to patterns
observed in 2012. In 2013, newly recruited adults (300-400mm TL) comprised the majority of
the catch and represented 77% of the catch. There was a reduction in the frequency of occurrence
in larger channel catfish >500 mm TL in 2013 compared to 2012, 6.3% and 18.8% respectively.
1997 1999 2001 2003 2005 2007 2009 2011 2013
CP
UE
(fish
/ho
ur)
0
10
20
30
40
50
60
70
Juveniles
Year
Removal
Adults
Pre-Removal
+1 SE
Endangered Fish Monitoring and Nonnative Species Monitoring and Control in the Upper/Middle San Juan River: 2013 Final
10
Figure 7. Mean TL (1 SE) and length frequency histograms for channel catfish collected from Hogback Diversion to
Shiprock Bridge; 2012 - 2013. The y-axis represents percentage (%) of catch and the x-axis represents total length.
COMMON CARP
Common carp catch rates varied little among the three trips in 2013. Mean common carp
CPUE, all life stages combined, in 2013 was 0.8 fish/hour (Figure 8).
Figure 8. Common carp CPUE (fish/hour) by trip within the Hogback Diversion to Shiprock Bridge section; 2013.
Error bars represent ± 1 SE.
Trip
March July August
CP
UE
(fis
h/h
our)
0.0
0.2
0.4
0.6
0.8
1.0
1.2
1.4
1.6
1.8
2.0
ALL LIFE STAGES
COMBINED
+ 1 SE
Endangered Fish Monitoring and Nonnative Species Monitoring and Control in the Upper/Middle San Juan River: 2013 Final
11
Common carp CPUE, using fall monitoring data, has declined since nonnative removal
was initiated in 2003 (Figure 9). No adult common carp were collected during fall monitoring
from Hogback Diversion to Shiprock Bridge in 2013. Catch rates for juvenile common carp were
0.7 fish/hour.
Figure 9. Common carp CPUE (fish/hour) during annual fall monitoring by year, Hogback Diversion to Shiprock
Bridge; 1996-2013. A line was fitted to the data if the trend was significant (y=6.241 - 0.825x; r2= 0.60; p= 0.009).
The vertical hash line represents the initiation of intensive nonnative removal in this section. Error bars represent ± 1
SE.
SHIPROCK BRIDGE TO MEXICAN HAT (RM 147.9 - 52.9)
One tagging trip and three removal trips (April/May, June, and September) were
conducted from Shiprock Bridge to Mexican Hat in 2013. During removal trips, a total of 11,073
channel catfish and 81 common carp were removed in 482 hours of electrofishing. Nonnative
fish removal also took place in conjunction with FWS Colorado River Fishery Project’s annual
fall monitoring in September, resulting in the removal of an additional 1,740 channel catfish and
44 common carp in 103.9 hours of electrofishing. For the year, a total of 12,813 channel catfish
and 125 common carp were removed during 586 hours of electrofishing (Appendix A-3). Other
nonnative fishes removed included brown trout, bullhead catfishes, green sunfish, and
largemouth bass. No striped bass or walleye were collected or observed. In 2013, eight roundtail
chub Gila robusta were collected.
1997 1999 2001 2003 2005 2007 2009 2011 2013
CP
UE
(fish
/ho
ur)
0
10
20
30
40
Year +1 SE
Pre-Removal Removal
Endangered Fish Monitoring and Nonnative Species Monitoring and Control in the Upper/Middle San Juan River: 2013 Final
12
MARK AND RECAPTURE
A total of 1,333 channel catfish and 17 common carp were collected and implanted with
individual alphanumeric anchor tags during a trip from Shiprock Bridge to Mexican Hat, UT.
Total length was taken from all tagged fish to determine exploitation rates by size class. Adult
channel catfish, > 300mm TL, comprised 63% of the total number of channel catfish tagged
(N=843), while juvenile channel catfish comprised 37% (N=490). In addition to nonnative
fishes, we captured 50 Colorado pikeminnow and 91 razorback sucker during the tagging trip.
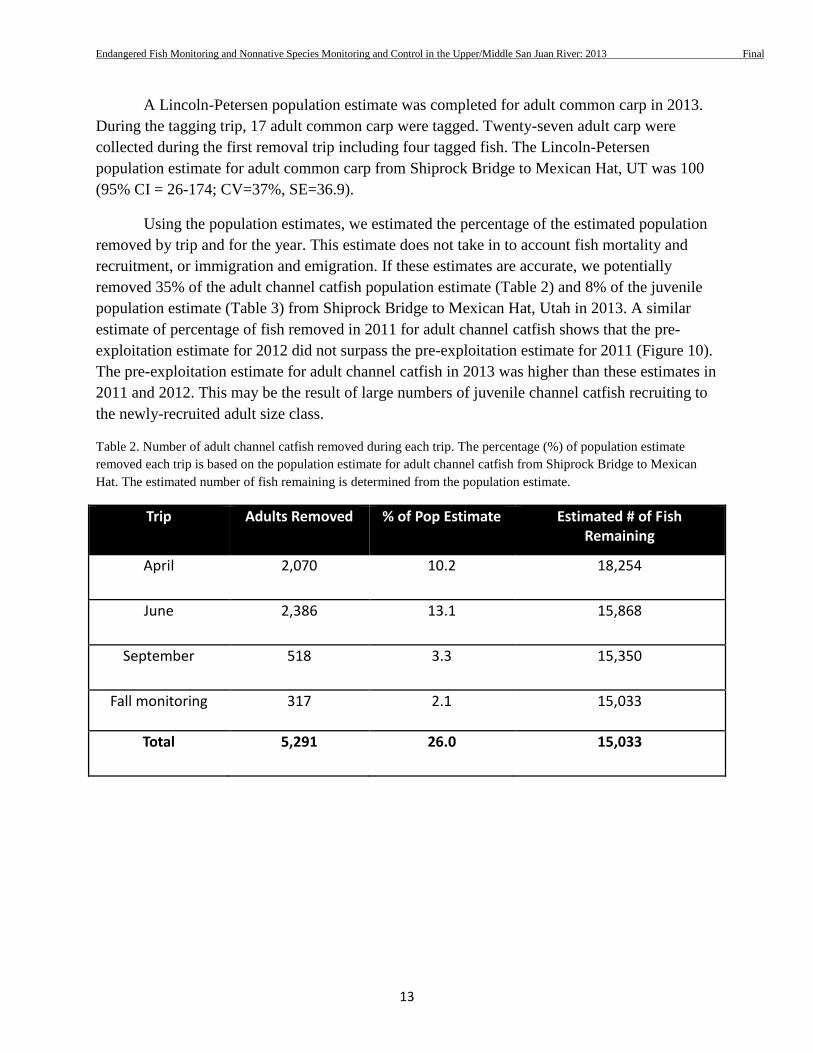
Exploitation rates for channel catfish were generated for each size class for the first
removal trip post tagging (Table 1). The exploitation rate for all size classes was 7%.
Exploitation rates ranged from 1.6 % for juvenile channel catfish to 23.6 % for fish 500-599 mm
TL.
Table 1. Channel catfish exploitation rates from Shiprock Bridge to Mexican Hat, UT, 2013. Numbers in
parentheses in the Mark Pass row represent total number of channel catfish tagged in that size class. Numbers in
parentheses in the Trip 1 row represent total number of channel catfish recaptured for that size class and trip and
percentage is the exploitation rate for that size class during that trip.
During the tagging trip, 843 adult, > 300 mm TL, channel catfish were tagged. On the
first removal trip in April/May, 2,070 adult fish were captured including 85 anchor-tagged fish.
The Lincoln-Petersen population estimate for adult channel catfish from Shiprock Bridge to
Mexican Hat, UT was 20,324 (95% CI = 16,057-24,590; CV=10.5%, SE=2,133).
A total of 490 juvenile channel catfish (200-299mm TL) were tagged in 2013. During the
post tagging removal trip, a total of 855 juvenile fish were captured including 8 anchor-tagged
fish. The Lincoln-Petersen population estimate for juvenile channel catfish from Shiprock Bridge
to Mexican Hat, UT was 46,699 (95% CI = 17,319-76,078; CV=31.46%, SE=14,690).
Endangered Fish Monitoring and Nonnative Species Monitoring and Control in the Upper/Middle San Juan River: 2013 Final
13
A Lincoln-Petersen population estimate was completed for adult common carp in 2013.
During the tagging trip, 17 adult common carp were tagged. Twenty-seven adult carp were
collected during the first removal trip including four tagged fish. The Lincoln-Petersen
population estimate for adult common carp from Shiprock Bridge to Mexican Hat, UT was 100
(95% CI = 26-174; CV=37%, SE=36.9).
Using the population estimates, we estimated the percentage of the estimated population
removed by trip and for the year. This estimate does not take in to account fish mortality and
recruitment, or immigration and emigration. If these estimates are accurate, we potentially
removed 35% of the adult channel catfish population estimate (Table 2) and 8% of the juvenile
population estimate (Table 3) from Shiprock Bridge to Mexican Hat, Utah in 2013. A similar
estimate of percentage of fish removed in 2011 for adult channel catfish shows that the pre-
exploitation estimate for 2012 did not surpass the pre-exploitation estimate for 2011 (Figure 10).
The pre-exploitation estimate for adult channel catfish in 2013 was higher than these estimates in
2011 and 2012. This may be the result of large numbers of juvenile channel catfish recruiting to
the newly-recruited adult size class.
Table 2. Number of adult channel catfish removed during each trip. The percentage (%) of population estimate
removed each trip is based on the population estimate for adult channel catfish from Shiprock Bridge to Mexican
Hat. The estimated number of fish remaining is determined from the population estimate.
Trip Adults Removed % of Pop Estimate Estimated # of Fish Remaining
April 2,070 10.2 18,254
June 2,386 13.1 15,868
September 518 3.3 15,350
Fall monitoring 317 2.1 15,033
Total 5,291 26.0 15,033
Endangered Fish Monitoring and Nonnative Species Monitoring and Control in the Upper/Middle San Juan River: 2013 Final
14
Table 3. Number of juvenile channel catfish removed during each trip. The percentage (%) of population estimate
removed each trip is based on the population estimate for juvenile channel catfish from Shiprock Bridge to Mexican
Hat. The estimated number of fish remaining is determined from the population estimate.
Trip Juveniles Removed % of Pop Estimate Estimated # of Fish Remaining
April 855 1.8 45,844
June 2,407 5.3 43,437
September 313 0.7 43,124
Fall monitoring 162 0.4 42,962
Total 3,737 8.0 42,962
Figure 10. Pre and post exploitation estimates for adult and juvenile channel catfish, Shiprock Bridge to Mexican
Hat, Utah: 2011-2013. Percentages represent the reduction between population estimates and the estimated number
of fish remaining after the four removal trips.
Year
2011 2012 2013
Num
ber
of cha
nn
el ca
tfis
h
5000
10000
15000
20000
25000
40000
50000
60000
70000
80000
Pre Exploitation - Adults
Post Exploitation - Adults
Pre Exploitation - Juveniles
Post Exploitation - Juveniles
32%
52%
35%
8%
24%
Endangered Fish Monitoring and Nonnative Species Monitoring and Control in the Upper/Middle San Juan River: 2013 Final
15
REMOVAL TRIPS
CHANNEL CATFISH
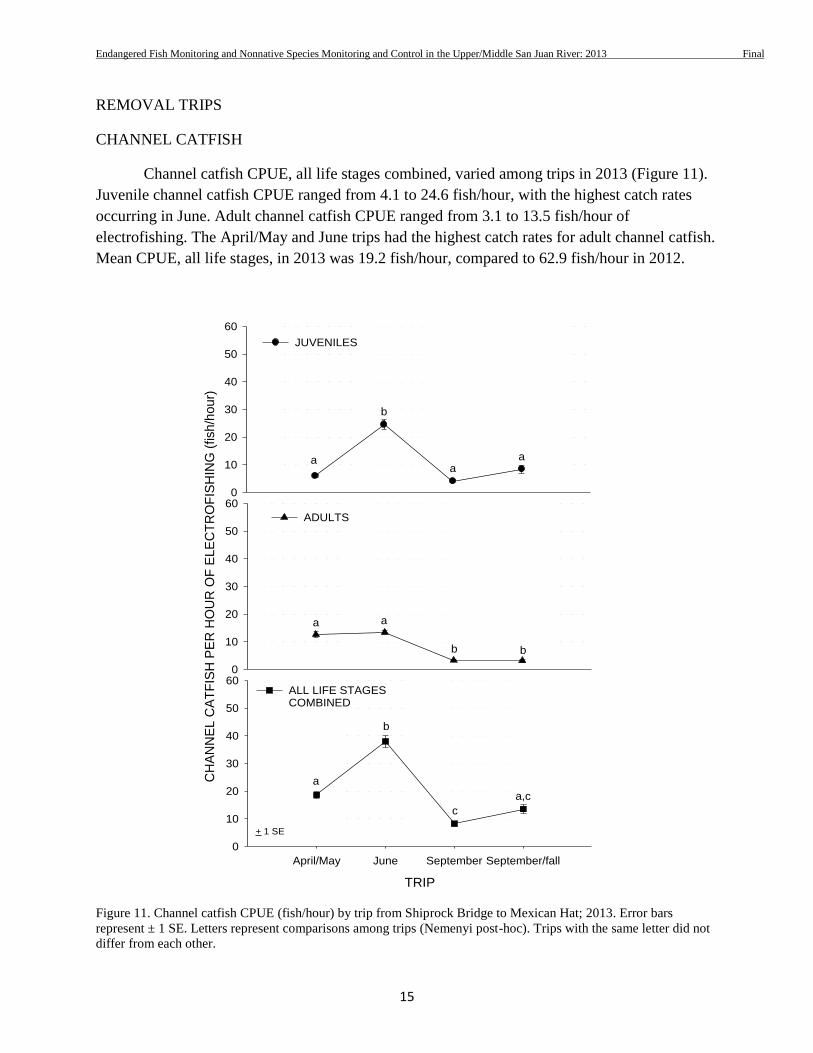
Channel catfish CPUE, all life stages combined, varied among trips in 2013 (Figure 11).
Juvenile channel catfish CPUE ranged from 4.1 to 24.6 fish/hour, with the highest catch rates
occurring in June. Adult channel catfish CPUE ranged from 3.1 to 13.5 fish/hour of
electrofishing. The April/May and June trips had the highest catch rates for adult channel catfish.
Mean CPUE, all life stages, in 2013 was 19.2 fish/hour, compared to 62.9 fish/hour in 2012.
Figure 11. Channel catfish CPUE (fish/hour) by trip from Shiprock Bridge to Mexican Hat; 2013. Error bars
represent ± 1 SE. Letters represent comparisons among trips (Nemenyi post-hoc). Trips with the same letter did not
differ from each other.
0
10
20
30
40
50
60
JUVENILES
CH
AN
NE
L C
AT
FIS
H P
ER
HO
UR
OF
EL
EC
TR
OF
ISH
ING
(fish
/ho
ur)
0
10
20
30
40
50
60
ADULTS
a,c,d
b
c
d
a a
bb
a
b
aa
TRIP
April/May June September September/fall
0
10
20
30
40
50
60ALL LIFE STAGESCOMBINED
c
a,c
b
a
+ 1 SE
Endangered Fish Monitoring and Nonnative Species Monitoring and Control in the Upper/Middle San Juan River: 2013 Final
16
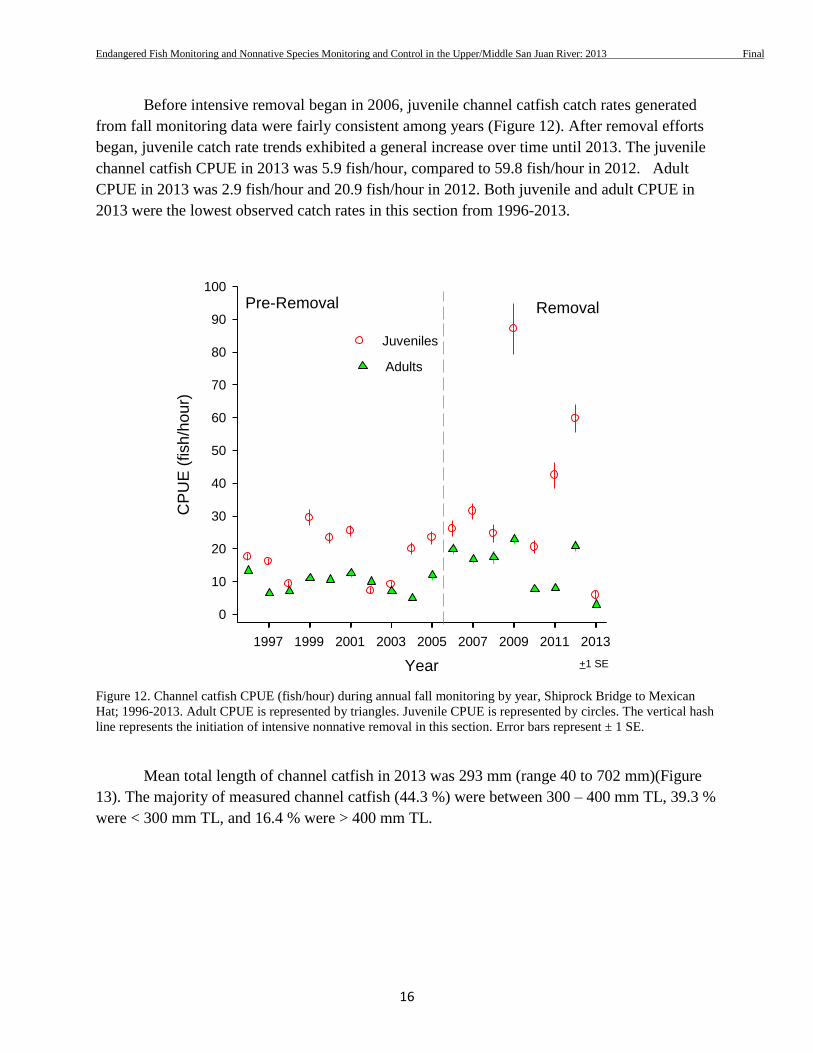
Before intensive removal began in 2006, juvenile channel catfish catch rates generated
from fall monitoring data were fairly consistent among years (Figure 12). After removal efforts
began, juvenile catch rate trends exhibited a general increase over time until 2013. The juvenile
channel catfish CPUE in 2013 was 5.9 fish/hour, compared to 59.8 fish/hour in 2012. Adult
CPUE in 2013 was 2.9 fish/hour and 20.9 fish/hour in 2012. Both juvenile and adult CPUE in
2013 were the lowest observed catch rates in this section from 1996-2013.
Figure 12. Channel catfish CPUE (fish/hour) during annual fall monitoring by year, Shiprock Bridge to Mexican
Hat; 1996-2013. Adult CPUE is represented by triangles. Juvenile CPUE is represented by circles. The vertical hash
line represents the initiation of intensive nonnative removal in this section. Error bars represent ± 1 SE.
Mean total length of channel catfish in 2013 was 293 mm (range 40 to 702 mm)(Figure
13). The majority of measured channel catfish (44.3 %) were between 300 – 400 mm TL, 39.3 %
were < 300 mm TL, and 16.4 % were > 400 mm TL.
1997 1999 2001 2003 2005 2007 2009 2011 2013
CP
UE
(fish
/hour)
0
10
20
30
40
50
60
70
80
90
100
Juveniles
Year
Removal
Adults
Pre-Removal
+1 SE
Endangered Fish Monitoring and Nonnative Species Monitoring and Control in the Upper/Middle San Juan River: 2013 Final
17
Figure 13. Mean TL (1 SE) and length frequency histograms by trip for channel catfish collected from Shiprock
Bridge to Mexican Hat Utah; 2010-2013. The y-axis represents percentage (%) of catch and the x-axis represents
total length
COMMON CARP
Catch rates for common carp were < 0.25 fish/hour during the first three removal trips
conducted in 2013 (Figure 14). Mean common carp CPUE in 2013 was 0.25 fish/hour.
a a
a
b
Trip
April/May June September Sept / fall
CP
UE
(fi
sh
/ho
ur)
0.0
0.1
0.2
0.3
0.4
0.5
0.6
+ 1 SE
ALL LIFE STAGESCOMBINED
a a
a
b
Endangered Fish Monitoring and Nonnative Species Monitoring and Control in the Upper/Middle San Juan River: 2013 Final
18
Figure 14. Common carp CPUE (fish/hour of electrofishing) during 2013 nonnative removal trips from Shiprock
Bridge to Mexican Hat. Error bars represent ± 1 SE. Letters represent comparisons among trips (Nemenyi post-hoc).
Trips with the same letter did not differ from each other
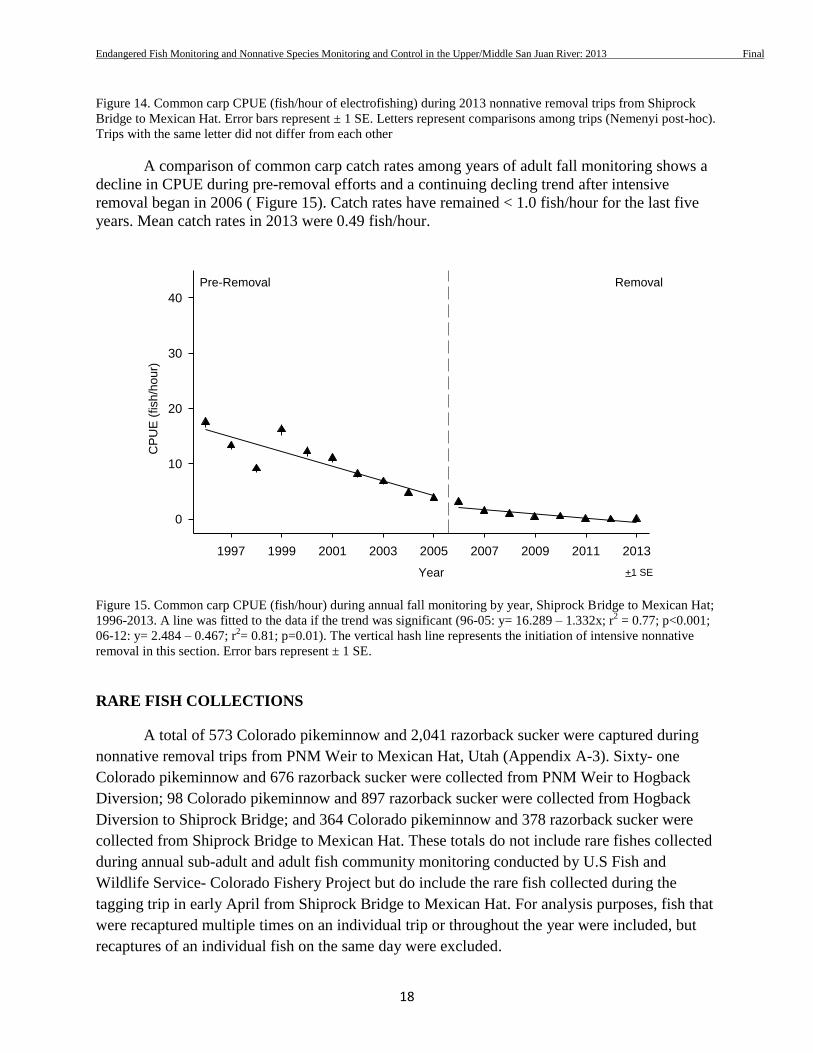
A comparison of common carp catch rates among years of adult fall monitoring shows a
decline in CPUE during pre-removal efforts and a continuing decling trend after intensive
removal began in 2006 ( Figure 15). Catch rates have remained < 1.0 fish/hour for the last five
years. Mean catch rates in 2013 were 0.49 fish/hour.
Figure 15. Common carp CPUE (fish/hour) during annual fall monitoring by year, Shiprock Bridge to Mexican Hat;
1996-2013. A line was fitted to the data if the trend was significant (96-05: y= 16.289 – 1.332x; r2 = 0.77; p<0.001;
06-12: y= 2.484 – 0.467; r2= 0.81; p=0.01). The vertical hash line represents the initiation of intensive nonnative
removal in this section. Error bars represent ± 1 SE.
RARE FISH COLLECTIONS
A total of 573 Colorado pikeminnow and 2,041 razorback sucker were captured during
nonnative removal trips from PNM Weir to Mexican Hat, Utah (Appendix A-3). Sixty- one
Colorado pikeminnow and 676 razorback sucker were collected from PNM Weir to Hogback
Diversion; 98 Colorado pikeminnow and 897 razorback sucker were collected from Hogback
Diversion to Shiprock Bridge; and 364 Colorado pikeminnow and 378 razorback sucker were
collected from Shiprock Bridge to Mexican Hat. These totals do not include rare fishes collected
during annual sub-adult and adult fish community monitoring conducted by U.S Fish and
Wildlife Service- Colorado Fishery Project but do include the rare fish collected during the
tagging trip in early April from Shiprock Bridge to Mexican Hat. For analysis purposes, fish that
were recaptured multiple times on an individual trip or throughout the year were included, but
recaptures of an individual fish on the same day were excluded.
1997 1999 2001 2003 2005 2007 2009 2011 2013
0
10
20
30
40
+1 SEYear
CP
UE
(fish
/ho
ur)
Pre-Removal Removal
Endangered Fish Monitoring and Nonnative Species Monitoring and Control in the Upper/Middle San Juan River: 2013 Final
19
COLORADO PIKEMINNOW
All Colorado pikeminnow collected in 2013 were considered to be stocked fish. A total
of 80 individual fish had PIT tags at time of capture. Recaptures of PIT tagged fish ranged from
1- 3,355 days since first encounter. Fish were classified as first encounters when the fish was
stocked in the river or collected and tagged in the river. Days since first encounter could not be
calculated for all PIT tagged Colorado pikeminnow due to errors when recording PIT tag
numbers. The majority of PIT tagged fish (76.5%, n= 65) were captured < 730 days since first
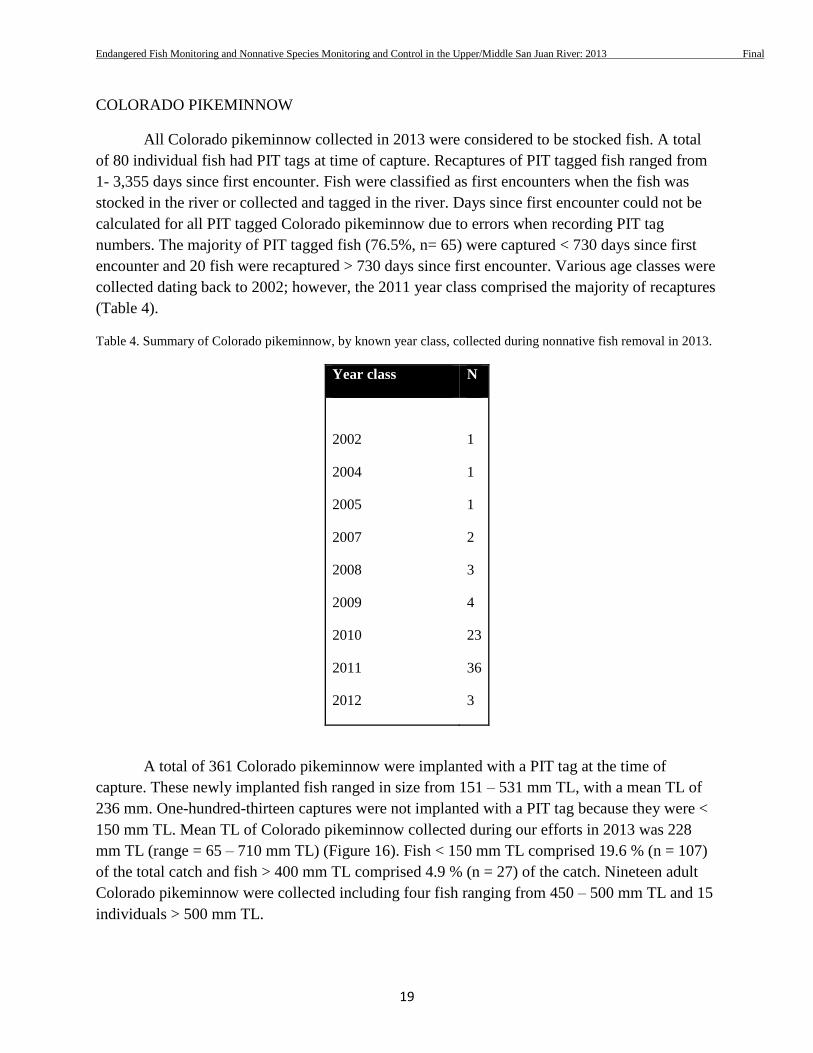
encounter and 20 fish were recaptured > 730 days since first encounter. Various age classes were
collected dating back to 2002; however, the 2011 year class comprised the majority of recaptures
(Table 4).
Table 4. Summary of Colorado pikeminnow, by known year class, collected during nonnative fish removal in 2013.
Year class N
2002
2004
2005
2007
2008
2009
2010
2011
2012
1
1
1
2
3
4
23
36
3
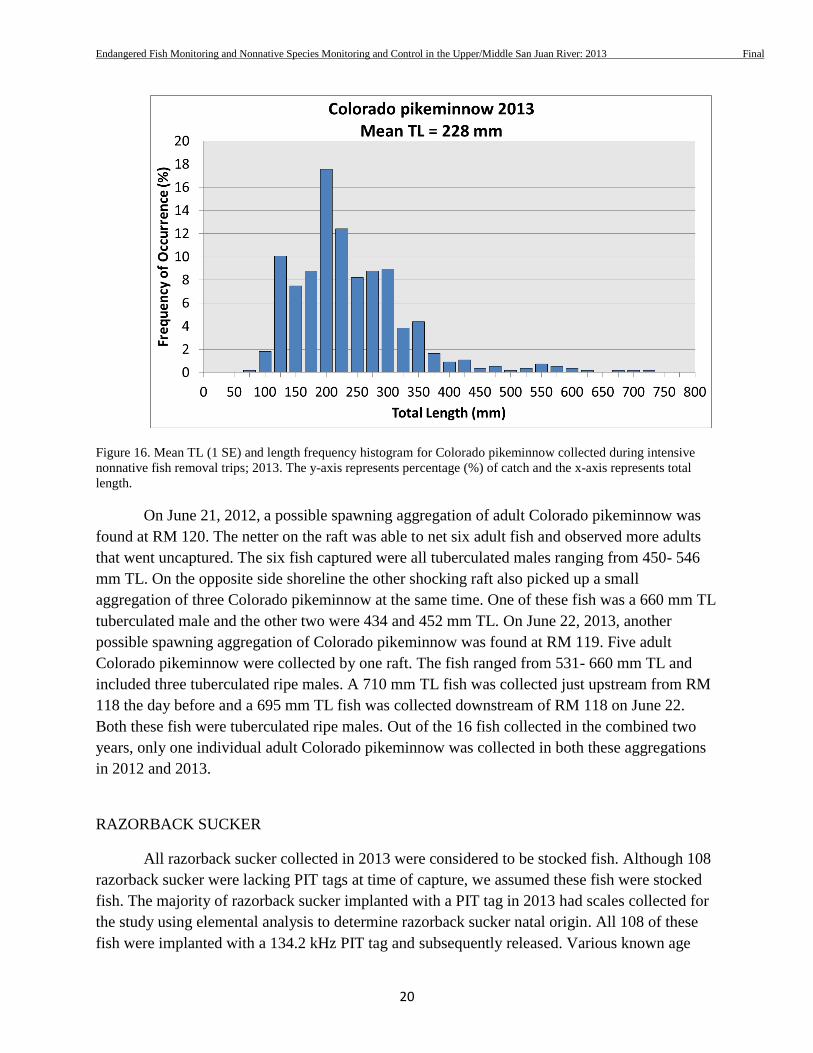
A total of 361 Colorado pikeminnow were implanted with a PIT tag at the time of
capture. These newly implanted fish ranged in size from 151 – 531 mm TL, with a mean TL of
236 mm. One-hundred-thirteen captures were not implanted with a PIT tag because they were <
150 mm TL. Mean TL of Colorado pikeminnow collected during our efforts in 2013 was 228
mm TL (range = 65 – 710 mm TL) (Figure 16). Fish < 150 mm TL comprised 19.6 % (n = 107)
of the total catch and fish > 400 mm TL comprised 4.9 % (n = 27) of the catch. Nineteen adult
Colorado pikeminnow were collected including four fish ranging from 450 – 500 mm TL and 15
individuals > 500 mm TL.
Endangered Fish Monitoring and Nonnative Species Monitoring and Control in the Upper/Middle San Juan River: 2013 Final
20
Figure 16. Mean TL (1 SE) and length frequency histogram for Colorado pikeminnow collected during intensive
nonnative fish removal trips; 2013. The y-axis represents percentage (%) of catch and the x-axis represents total
length.
On June 21, 2012, a possible spawning aggregation of adult Colorado pikeminnow was
found at RM 120. The netter on the raft was able to net six adult fish and observed more adults
that went uncaptured. The six fish captured were all tuberculated males ranging from 450- 546
mm TL. On the opposite side shoreline the other shocking raft also picked up a small
aggregation of three Colorado pikeminnow at the same time. One of these fish was a 660 mm TL
tuberculated male and the other two were 434 and 452 mm TL. On June 22, 2013, another
possible spawning aggregation of Colorado pikeminnow was found at RM 119. Five adult
Colorado pikeminnow were collected by one raft. The fish ranged from 531- 660 mm TL and
included three tuberculated ripe males. A 710 mm TL fish was collected just upstream from RM
118 the day before and a 695 mm TL fish was collected downstream of RM 118 on June 22.
Both these fish were tuberculated ripe males. Out of the 16 fish collected in the combined two
years, only one individual adult Colorado pikeminnow was collected in both these aggregations
in 2012 and 2013.
RAZORBACK SUCKER
All razorback sucker collected in 2013 were considered to be stocked fish. Although 108
razorback sucker were lacking PIT tags at time of capture, we assumed these fish were stocked
fish. The majority of razorback sucker implanted with a PIT tag in 2013 had scales collected for
the study using elemental analysis to determine razorback sucker natal origin. All 108 of these
fish were implanted with a 134.2 kHz PIT tag and subsequently released. Various known age
Endangered Fish Monitoring and Nonnative Species Monitoring and Control in the Upper/Middle San Juan River: 2013 Final
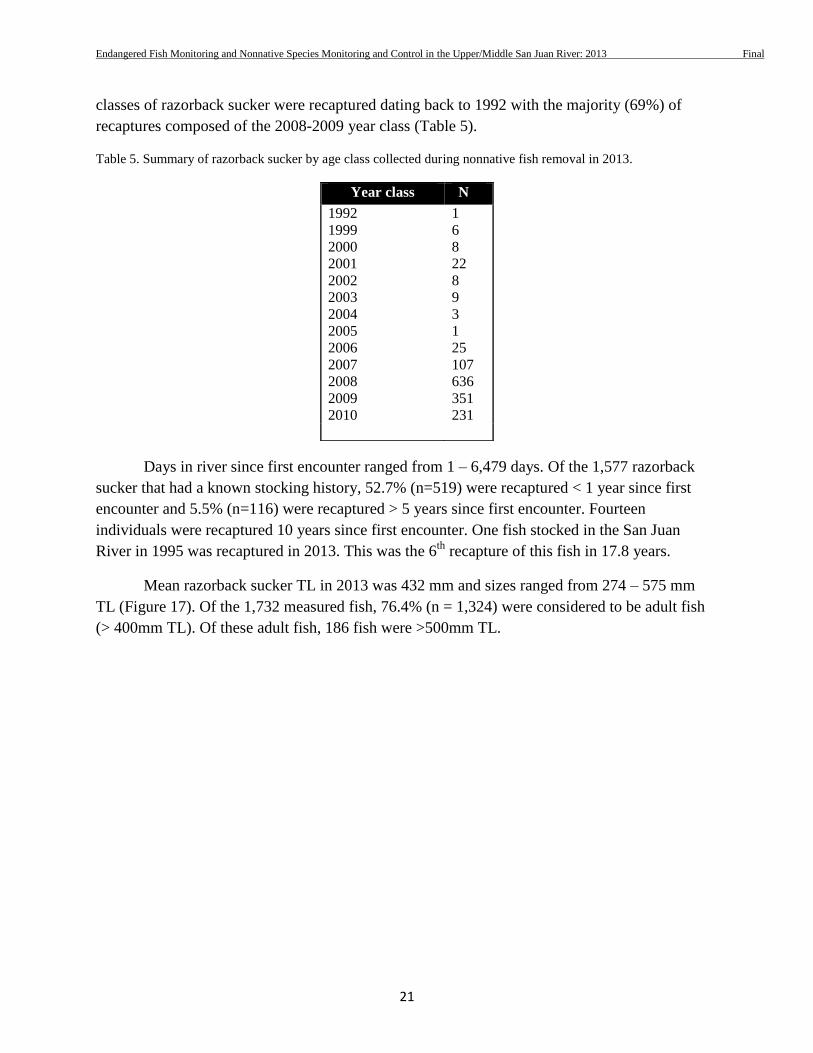
21
classes of razorback sucker were recaptured dating back to 1992 with the majority (69%) of
recaptures composed of the 2008-2009 year class (Table 5).
Table 5. Summary of razorback sucker by age class collected during nonnative fish removal in 2013.
Days in river since first encounter ranged from 1 – 6,479 days. Of the 1,577 razorback
sucker that had a known stocking history, 52.7% (n=519) were recaptured < 1 year since first
encounter and 5.5% (n=116) were recaptured > 5 years since first encounter. Fourteen
individuals were recaptured 10 years since first encounter. One fish stocked in the San Juan
River in 1995 was recaptured in 2013. This was the 6th
recapture of this fish in 17.8 years.
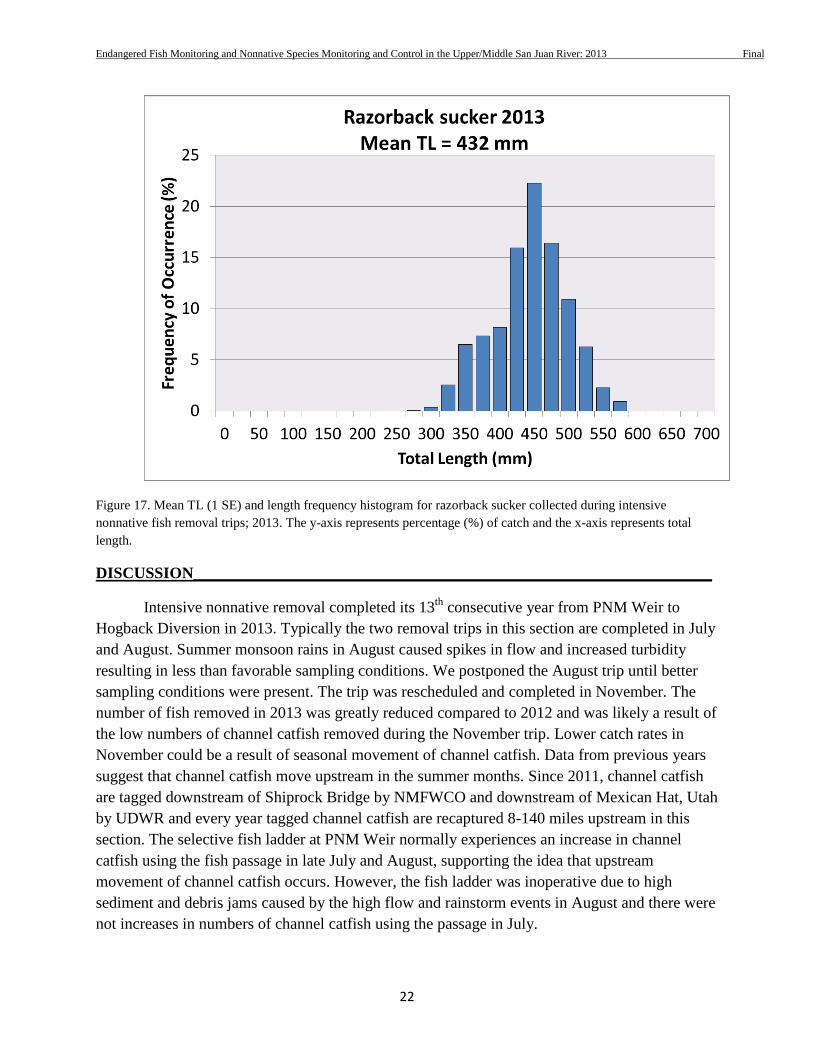
Mean razorback sucker TL in 2013 was 432 mm and sizes ranged from 274 – 575 mm
TL (Figure 17). Of the 1,732 measured fish, 76.4% (n = 1,324) were considered to be adult fish
(> 400mm TL). Of these adult fish, 186 fish were >500mm TL.
Year class NN
1992
1999
2000
2001
2002
2003
2004
2005
2006
2007
2008
2009
2010
1
6
8
22
8
9
3
1
25
107
636
351
231
Endangered Fish Monitoring and Nonnative Species Monitoring and Control in the Upper/Middle San Juan River: 2013 Final
22
Figure 17. Mean TL (1 SE) and length frequency histogram for razorback sucker collected during intensive
nonnative fish removal trips; 2013. The y-axis represents percentage (%) of catch and the x-axis represents total
length.
DISCUSSION_________________________________________________________________
Intensive nonnative removal completed its 13th
consecutive year from PNM Weir to
Hogback Diversion in 2013. Typically the two removal trips in this section are completed in July
and August. Summer monsoon rains in August caused spikes in flow and increased turbidity
resulting in less than favorable sampling conditions. We postponed the August trip until better
sampling conditions were present. The trip was rescheduled and completed in November. The
number of fish removed in 2013 was greatly reduced compared to 2012 and was likely a result of
the low numbers of channel catfish removed during the November trip. Lower catch rates in
November could be a result of seasonal movement of channel catfish. Data from previous years
suggest that channel catfish move upstream in the summer months. Since 2011, channel catfish
are tagged downstream of Shiprock Bridge by NMFWCO and downstream of Mexican Hat, Utah
by UDWR and every year tagged channel catfish are recaptured 8-140 miles upstream in this
section. The selective fish ladder at PNM Weir normally experiences an increase in channel
catfish using the fish passage in late July and August, supporting the idea that upstream
movement of channel catfish occurs. However, the fish ladder was inoperative due to high
sediment and debris jams caused by the high flow and rainstorm events in August and there were
not increases in numbers of channel catfish using the passage in July.
Endangered Fish Monitoring and Nonnative Species Monitoring and Control in the Upper/Middle San Juan River: 2013 Final
23
Prior to the initiation of removal in 2001, channel catfish catch rates in this section from
PNM Weir to Hogback Diversion, during fall monitoring, varied among years but suggested
relatively high adult channel catfish abundance. Post initiation of intensive removal, catch rates
for both juvenile and adult channel catfish still varied among years but both size classes have
exhibited general declining trends. Juvenile channel catfish have not been collected in this
section during fall monitoring for the last five years. The observed decline in juveniles is likely
the cumulative result of intensive removal efforts in this section and adjacent downstream
sections. Variation in CPUE data among years may be partially responsible for the failure to
detect significant declining trends in adult channel catfish catch rates in this section during our
study period. Although adult CPUE trends have not changed over time, catch rates in 2013 were
significantly lower than values observed prior to removal.
In 2003, nonnative removal efforts were expanded to include the Hogback Diversion to
Shiprock Bridge section. Catch rates for channel catfish have varied among years, but still
remain relatively high. Juvenile catch rates during fall monitoring increased in 2011 and 2012,
but declined to previous levels in 2013. The observed increases in 2011 and 2012 coincided with
increases in juvenile abundance downstream of Shiprock Bridge. The high adult channel catfish
catch rates in 2013 may be result of the 2011 and 2012 juvenile cohorts recruiting to the adult
size class. The majority of channel catfish collected in this section in 2013 were composed of
newly recruited adults. It is unknown if these fish recruited to the adult size class in this section
or immigrated from downstream reaches. Recaptures of channel catfish that were tagged
downstream of Shiprock Bridge and Mexican Hat, Utah illustrate widespread upstream
movement and the potential to repopulate upstream removal reaches throughout the year.
Although each removal section is analyzed and presented independently, it is important to
recognize the effect that high juvenile channel catfish abundance in downstream areas may have
on other removal sections because of immigration/emigration years later.
Beginning in 2008, the expansion of removal efforts to include two passes per trip from
Shiprock Bridge to Mexican Hat, UT, was expected to result in significant declines in channel
catfish abundance riverwide. Fall monitoring CPUE data showed that juvenile channel catfish
catch rates continued to increase after the initiation of intensive removal in this section. Similar
increases in juvenile channel catfish catch rates were observed after the initial years of intensive
removal in the two uppermost sections of our study only to decline with continued exploitation
(Davis and Duran 2009). Adult catch rates were stable the first four years of intensive removal
and were reduced in 2010-2011 only to increase in 2012. Juvenile catch rates drastically declined
during 2013 fall monitoring. Adult CPUE during fall monitoring also declined in 2013. Juvenile
and adult CPUE in 2013 were the lowest observed catch rates for channel catfish from 1996-
2013. These declines were also observed during the other three nonnative removal trips held
throughout the year in this section. The overall total numbers of channel catfish removed in this
section throughout the year were drastically reduced compared to previous years although there
Endangered Fish Monitoring and Nonnative Species Monitoring and Control in the Upper/Middle San Juan River: 2013 Final
24
was a similar amount of effort. Total numbers of fish removed in 2013 were only 31% of the
total amount removed in 2012. In 2012, the summer nonnative removal trip that typically took
place in July was moved to June to try to target channel catfish during spawning. By collecting
catfish as they aggregate to spawn or by collecting males that were guarding egg nests, we hope
to disrupt spawning and lower reproductive success. While the success of this would be very
difficult to quantify, it may be a reason we observed declines in juvenile channel catfish in 2013.
Equally important in the management of this species is a better understanding of our
capture techniques and the associated efficiency of capturing various life stages of our target
species. Previous analyses of our nonnative fish removal data by others suggest that our success
in capturing channel catfish < 300mm TL may be limited (J. Morel unpublished data). A similar
analysis of catch curves by 1-inch size groups suggests that channel catfish are fully recruited to
our gear size once they attain a minimum length of 304-356mm TL (J. Davis unpublished data).
Gerhardt and Hubert (1991) reported that in the Powder River drainage, the Ricker and
Thompson-Bell model indicated that population structure and abundance of channel catfish
would change considerably as exploitation rates (harvest) increased. They reported that an
annual exploitation rate of 22% would result in a 75% reduction in overall abundance of fish >
300 mm TL, and cause a substantial shift towards smaller individuals. Using the population
estimate for juvenile channel catfish and the actual numbers we removed throughout the year
from Shiprock Bridge to Mexican Hat, we estimated an 8% reduction between the population
estimate and the estimated number of juvenile fish remaining after all the nonnative removal
trips. It is also estimated that we removed 35% of the adult fish population estimate. Similar to
2012, our exploitation rates for adults were much higher than for juveniles. As juvenile fish in
the river grow to sizes more susceptible to our gear type, we anticipate larger percentage
reductions between pre-exploitation population estimates and the estimated number of fish
remaining at the end of the year.
New methods and gear types for effectively capturing juvenile channel catfish are being
considered for future efforts and include the use of electric seines, hoop nets and baiting areas
prior to removal trips. By employing these new techniques it may be possible to focus our effort
at removing size classes of channel catfish that we are currently ineffective in capturing and
would likely result in an increase in our overall exploitation rates. Removing smaller sized fish,
before reaching sexual maturity, may reduce overall reproductive potential and recruitment.
Helms (1975) found that 1 of 10 channel catfish were sexually mature at 330 mm TL, compared
to 5 of 10 at 380 mm TL. In addition, he found that channel catfish at 330 mm TL produced
around 4,500 eggs/fish compared to the production of 41,500 eggs/fish at 380 mm TL.
Based on the length frequency histograms in all three removal sections, the majority of
channel catfish captured in 2013 were newly recruited adult fish. A reduction in abundance of
large channel catfish, 425-600 mm TL, may be important in not only limiting the reproductive
Endangered Fish Monitoring and Nonnative Species Monitoring and Control in the Upper/Middle San Juan River: 2013 Final
25
potential of channel catfish in the San Juan River but may also limit overall predatory impacts on
native fishes by channel catfish. Brooks et al. (2000) found that San Juan River channel catfish <
300 mm TL consumed almost exclusively macroinvertebrates and Russian olive fruits. Piscivory
occurred most frequently in fish > 450 mm TL. Documentation of predation on endangered
fishes during their study was not observed and was likely due to the relatively low number of
endangered fishes in the San Juan River at the time of their study. An increase in smaller size
classes of fish and a reliance on single year classes has been documented as a response to
exploitation of channel catfish in the Mississippi River (Pitlo 1997). Maintaining or even
increasing intensive removal efforts from Shiprock Bridge to Mexican Hat in order to remove
these fish as they recruit into adulthood will be important in reducing riverwide abundance of
channel catfish.
Many unknown factors can make it difficult to detect significant declines in channel
catfish abundance or effects of mechanical nonnative removal. While the declines from Shiprock
Bridge to Mexican Hat observed in 2013 are encouraging, it is difficult to determine if there was
an actual decline in the channel catfish population or if environmental conditions during
sampling limited catch rates. Turbidity is the biggest factor that can affect electrofishing catch
ability through limiting netting efficiency. While we do not have a consistent data set of secchi
disc readings for every trip, we can look at the flow of the river for a particular trip in each year
for comparison among years. High flows do not always result in higher turbidity in the river;
however, rain storms and other monsoonal events cause spikes in flow which is usually a result
of washes flashing into the river. The flash flooding of these shale washes usually results in a
high sediment load being dispersed throughout the river, resulting in increased turbidity and very
poor visibility. Spikes in flow were evident in all four removal trips, including fall monitoring, in
2013. Flows during fall monitoring in 2013 ranged from 1,500 to 9,000 CFS during the nine day
trip, whereas in 2012, flows were never higher than 1,100 CFS. It is unknown if the low catch
rates observed in 2013 were direct results of the environmental factors such as spikes in flow and
increased turbidity or if they were actual population declines in response to mechanical removal.
Continued monitoring will enable us to determine if an actual population decline occurred in
2013 or if the lower catch rates were a result of poor sampling conditions throughout the year.
Common carp were once ubiquitous in the San Juan River and during 1991-1997 SJRIP
studies were the fourth most abundant fish in electrofishing collections (Ryden 2000).
Corresponding with the initiation of intensive removal in each of the three sections, common
carp abundance has been greatly reduced to a level of infrequent collection across all studies
(Elverud 2010; Ryden 2010). Common carp catch rates in 2013 were < 1.0 fish/hour in all three
removal section. Prior to the initiation of nonnative removal in each of the three sections,
common carp catch rates during annual fall monitoring were relatively high and showed little
variance among years. After intensive nonnative removal began in each section, common carp
CPUE immediately declined. Common carp CPUE during fall monitoring has been less than one
Endangered Fish Monitoring and Nonnative Species Monitoring and Control in the Upper/Middle San Juan River: 2013 Final
26
fish per hour of electrofishing for the last five consecutive years in each of the three sections.
These declines may be a result of a combination of factors including intensive nonnative removal
efforts, a regulated flow regime resulting in a lack of overbank flow and the waterfall at Clay
Hills prohibiting upstream movement of fish out of Lake Powell.
Common carp are one of the world’s most damaging and invasive fish. Their
establishment in a system can lead to declines in vegetation, water quality and native fauna.
Nonnative removal combined with other variables has drastically reduced the common carp
population in the San Juan River from one of the most abundant fish in the 1990’s to one that is
now infrequently collected river wide. This successful management of a very invasive nonnative
species is often overshadowed by the trends of channel catfish abundance in the river. While
common carp are not predatory, they can still negatively impact native fish communities and
affect recovery efforts of endangered. Decreased common carp abundance may limit competitive
interactions with native fishes and negative habitat modifications often associated with common
carp (i.e. uprooting of aquatic plants causing increased turbidity, possible cause of noxious algae
blooms by recycling of nutrients from silt substrates) (Cooper 1987). These decreases in
abundance and the subsequent declines in carp biomass may allow for higher utilization of
resources by native fishes with limited levels of interspecific competition.
In addition to our goal of removing large-bodied nonnative fishes, intensive nonnative
removal trips have contributed to the gathering of information on rare fish distribution and
abundance and may be used as a barometer to measure the success of current augmentation
programs. The frequency and range of our trips, initially near stocking locations and now
riverwide, provide the opportunity to collect large amounts of data on stocked fish and may be
used to evaluate the success, or failure, of individual stocking events.
While all rare fish captured in 2013 were considered to be stocked fish, it is encouraging
to see hatchery reared fish survive and persist in the river. We continue to capture consistent
numbers of adult Colorado pikeminnow throughout the year. Additionally, the documented
spawning aggregation of adult Colorado pikeminnow found in the same area two years in a row
suggests that the number of sub-adult and adult fish in the San Juan River is reaching numbers
that enable them to ‘find’ each other for spawning. Numbers of Colorado pikeminnow that had a
PIT tag at time of capture were reduced in 2013 compared to previous years. It has unknown if
these fish are still in the river and go undetected throughout the year or if they have moved out of
the system or have perished. However, with the recent work sampling tributaries of the San Juan
River and the installation of remote PIT tag arrays in tributaries and the main stem San Juan, we
should gain a better understanding on how many PIT tagged fish occupy the San Juan River.
Razorback sucker have shown long term persistence in the San Juan River. Fourteen individual
fish captured in 2013 had been in the river ten years or more, with one fish persisting in the river
17.8 years. We continued to collect razorback sucker without PIT tags in 2013; however, the
Endangered Fish Monitoring and Nonnative Species Monitoring and Control in the Upper/Middle San Juan River: 2013 Final
27
majority of fish without PIT tags had scales taken for the study using elemental analysis of scales
to determine if they are wild fish or stocked fish.
Mechanical removal of nonnative fishes, primarily channel catfish and common carp,
continues to be supported by the SJRIP as one management tool for the recovery of Colorado
pikeminnow and razorback sucker. Under the framework of adaptive management, the SJRIP
will continue to seek ways to improve the efficacy of nonnative fish removal. Complete
eradication of these species is not expected; however, using multiple pass sampling has and is
expected to continue to reduce abundance to manageable levels. By reducing abundance and
biomass of these species, spatial and trophic interactions with common and rare native fishes
should be reduced and may result in improved post-stocking survival of stocked rare fishes.
Collecting data on growth, distribution and abundance of rare fishes in conjunction with
intensive nonnative fish removal continues to supplement monitoring data of these two species
and will assist researchers with future management decisions and assessing progress towards
recovery.
Endangered Fish Monitoring and Nonnative Species Monitoring and Control in the Upper/Middle San Juan River: 2013 Final
28
ACKNOWLEDGEMENTS
We would like to thank the staffs of New Mexico Department of Game and Fish,
Conservation Services Division; Utah Department of Wildlife Resources, Moab Field Station;
U.S. Fish and Wildlife Service, Colorado River Project (Grand Junction); Navajo Nation
Department of Fish and Wildlife; American Southwest Ichthyological Researchers, L.L.C. and
U.S. Bureau of Indian Affairs, Farmington, NM for participating on our intensive nonnative fish
removal trips in 2013. Collection permits were issued by New Mexico Department of Game and
Fish, Colorado Division of Wildlife, Utah Department of Natural Resources and Navajo Nation
Department of Fish and Wildlife. Funding for this work was provided through authorizing
legislation for the SJRIP and administered by U.S. Bureau of Reclamation, Salt Lake City, Utah.
Endangered Fish Monitoring and Nonnative Species Monitoring and Control in the Upper/Middle San Juan River: 2013 Final
29
LITERATURE CITED
Bliesner, R. and V. Lamarra. 2000. Hydrology, Geomorphology and Habitat Studies. San Juan
River Recovery Implementation Program, U.S. Fish and Wildlife Service, Albuquerque,
New Mexico.
Brooks, J.E., M.J. Buntjer, and J.R. Smith. 2000. Non-native species interactions: Management
implications to aid in recovery of the Colorado pikeminnow Ptychocheilus lucius and
razorback sucker Xyrauchen texanus in the San Juan River, CO-NM-UT. San Juan River
Recovery Implementation Program, U.S. Fish and Wildlife Service, Albuquerque, NM.
Cooper, E.L. ed. 1987. Carp in North America. American Fisheries Society. Bethesda,
Maryland.
Davis, J.E. 2010. Passive Integrated Transponder (PIT) tagging methodologies for the San Juan
Basin Recovery Implementation Program. Final Report for the San Juan River Basin
Recovery Implementation Program, U.S. Fish and Wildlife Service, Albuquerque, NM.
Davis, J.E. and B.R Duran. 2009. Non-native species monitoring and control in the upper San
Juan River, New Mexico: 2009. Final Report for the San Juan River Recovery
Implementation Program, U.S. Fish and Wildlife Service, Albuquerque, NM.
Deroba, J.J., M.J. Hansen, N.A. Nate and J.M. Hennessy. 2005. Evaluating assumptions of
mark-recapture studies for estimating angling exploitation of walleyes in northern
Wisconsin lakes. North American Journal of Fisheries Management, (25): 890-896
Duran, B.R., J.E. Davis, and E. Teller Sr. 2010. Nonnative species monitoring and control in the
upper/middle San Juan River:2010. Progress Report for the San Juan River Recovery
Implementation Program. Final Report. U.S. Fish and Wildlife Service, Albuquerque, NM
Elverud, D.S. 2010. Nonnative control in the lower San Juan River 2010. Interim Progress
Report for the San Juan River Recovery Implementation Program, U.S. Fish and Wildlife
Service, Albuquerque, NM.
Gerhardt, D.R. and W.A. Hubert. 1991. Population dynamics of a lightly exploited channel catfish stock
in the Powder River system, Wyoming-Montana. North American Journal of Fisheries
Management 11: 200-205.
Helms, D.R. 1975. Variations in the abundance of channel catfish year classes in the upper
Mississippi River and causative factors. Iowa Conservation Commission, Iowa Fisheries
Technical Series 75-1, Des Moines.
Pitlo, J. Jr. 1997. Response of upper Mississippi River channel catfish populations to changes in
commercial harvest regulations. North American Journal of Fisheries Management. 17:
848-859.
Endangered Fish Monitoring and Nonnative Species Monitoring and Control in the Upper/Middle San Juan River: 2013 Final
30
Ryden, D.W. 2000. Adult fish community monitoring on the San Juan River, 1991-1997. San
Juan River Recovery Implementation Program, U.S. Fish and Wildlife Service,
Albuquerque, NM.
Ryden, D.W. 2005. Long term monitoring of sub-adult and adult large-bodied fishes in the San
Juan River: 2004. Interim Progress Report for the San Juan River Recovery
Implementation Program. U.S. Fish and Wildlife Service, Albuquerque, NM.
Ryden, D.W. 2008. Augmentation of the San Juan River razorback sucker population: 2007.
Interim Progress Report for the San Juan River Recovery Implementation Program.
U.S. Fish and Wildlife Service, Albuquerque, NM.
Ryden, D.W. 2009. Long term monitoring of sub-adult and adult large-bodied fishes in the San
Juan River: 2008. Interim Progress Report (Draft) for the San Juan River Recovery
Implementation Program. U.S. Fish and Wildlife Service, Albuquerque, NM.
Ryden, D.W. 2010. Long term monitoring of sub-adult and adult large-bodied fishes in the San
Juan River: 2010. Interim Progress Report for the San Juan River Recovery
Implementation Program. U.S. Fish and Wildlife Service, Albuquerque, NM.
San Juan River Recovery Implementation Program. 2013. Long Range Plan. U.S. Fish and
Wildlife Service, Albuquerque, NM.
San Juan River Basin Recovery Implementation Program. 2012. San Juan River Basin Recovery
Implementation Program Monitoring Plans and Protocols. San Juan River Basin
Recovery Implementation Program, U.S Fish and Wildlife Service, Albuquerque, NM.
SPSS. 2004. SPSS 13.0 Brief Guide. SPSS Inc., Chicago, Illinois, U.S.A. 231 pp.
U.S. Fish and Wildlife Service. 2002a. Colorado pikeminnow (Ptychocheilus lucius) Recovery Goals:
amendment and supplement to the Colorado Squawfish Recovery Plan. U.S. Fish and Wildlife
Service, Mountain-Prairie Region (6), Denver, Colorado.
U.S. Fish and Wildlife Service. 2002b. Razorback sucker Xyrauchen texanus Recovery Goals:
amendment and supplement to the Razorback Sucker Recovery Plan. U.S. Fish and Wildlife
Service, Mountain-Prairie Region (6), Denver, Colorado.
Zar, J.H. 1996. Biostatistical Analysis. 4th edition. Prentice-Hall, Upper Saddle River, New
Jersey.
Endangered Fish Monitoring and Nonnative Species Monitoring and Control in the Upper/Middle San Juan River: 2013 Final
31
Appendix A-1. Mean discharge, effort and total count of major species collected during intensive
non-native removal efforts from PNM Weir to Hogback Diversion, 2013. Species listed by the
first three letters of the Genus and first three letters of Species (i.e. Ptychocheilus lucius =
Ptyluc). 1 Mean discharge from USGS gauge #09368000 near Shiprock, New Mexico.
Trip Discharge1
(ft^3/sec)
Effort
(hours)
Ptyluc Xyrtex Ictpun Cypcar Micsal Ameiurus
spp
Saltru
July 16-18
November 12-14
1,484
690
16.1
15.2
21
40
223
453
33
9
6
13
-
-
4
2
9
6
Totals 31.3 61 676 42 19 - 6 15
Appendix A-2. Mean discharge, effort and total count of major species collected during intensive non-
native removal efforts from Hogback Diversion to Shiprock Bridge, 2013. 1 Mean discharge from USGS
gauge #09368000 near Shiprock, New Mexico.
Trip Discharge1
(ft^3/sec)
Effort
(hours)
Ptyluc Xyrtex Ictpun Cypcar Micsal Ameiurus
spp
Saltru
March 19-21
July 9-11
August 6-8
519
593
1402
26.3
25.6
24.4
9
44
45
437
227
233
114
664
279
14
28
16
0
6
8
1
10
10
17
4
2
Totals 76.3 98 897 1,057 58 14 21 23
Endangered Fish Monitoring and Nonnative Species Monitoring and Control in the Upper/Middle San Juan River: 2013 Final
32
Appendix A-3. Mean discharge, effort and total count of major species collected during intensive non-native
removal efforts from Shiprock Bridge to Mexican Hat, Utah; 2013. Endangered fish were not collected by
upstream boats (n/a). 1
Mean discharge from USGS gauge #09371010 near Four Corners, Colorado.
Trip Discharge1
(ft^3/sec)
Effort
(hours)
Ptyluc Xyrtex Ictpun Cypcar Micsal Ameiurus
spp
Saltru
Tagging Trip
April 11-19
Totals for trip
April 25 – May 3
Downstream boats
Upstream boats
Totals for trip
June 20 - 28
Downstream boats
Upstream boats
Totals for trip
August 29- Sept 6
Downstream boats
Upstream boats
Totals for trip
**September 19 - 27
Downstream boats
Upstream boats
Totals for trip
573
992
582
821
3,312
92.5
76.7
81
157.7
89.7
85.3
175
76.5
72.8
149.3
44.9
59
103.9
50
54
0
54
149
4
153
146
9
155
128
2
130
91
156
0
156
103
0
103
118
1
119
108
0
108
1,477
1,481
1,563
3,044
3,605
3,157
6,762
717
550
1,267
573
1,167
1,740
18
19
8
27
16
9
25
18
11
29
22
22
44
0
1
0
1
0
1
1
0
0
0
0
0
0
7
15
6
21
22
21
43
14
11
25
3
3
6
2
1
1
2
4
0
4
0
0
0
1
0
1
Totals (excluding
tagging trip)
585.9 492 486 12,813 125 2 95 7
** Nonnative removal trip conducted in conjunction with annual sub-adult and adult fish community monitoring. Downstream boats sampled using
standardized sampling protocols as defined in San Juan River Monitoring Plan and Protocols (Propst et al. 2006). Downstream boats sampled in one river mile increments, with two of every three river miles sampled. When possible, upstream boats sampled all river miles and did not skip the same miles as the
downstream boats.

Endangered Fish Monitoring and Nonnative Species Monitoring and Control in the Upper/Middle San Juan River: 2013 Final
33