Embed Size (px)
Citation preview
E - BOOK FOR COLLEGE ALGEBRA King Fahd University of Petroleum & Minerals
KFUPM - Prep Year Math Program (c) 20013 All Right Reserved
2.4
E - BOOK FOR COLLEGE ALGEBRA King Fahd University of Petroleum & Minerals
The Graph of a Functions
Domain of a Function Vertical Line Test Piecewise Function
E - BOOK FOR COLLEGE ALGEBRA King Fahd University of Petroleum & Minerals
KFUPM - Prep Year Math Program (c) 2009 All Right Reserved
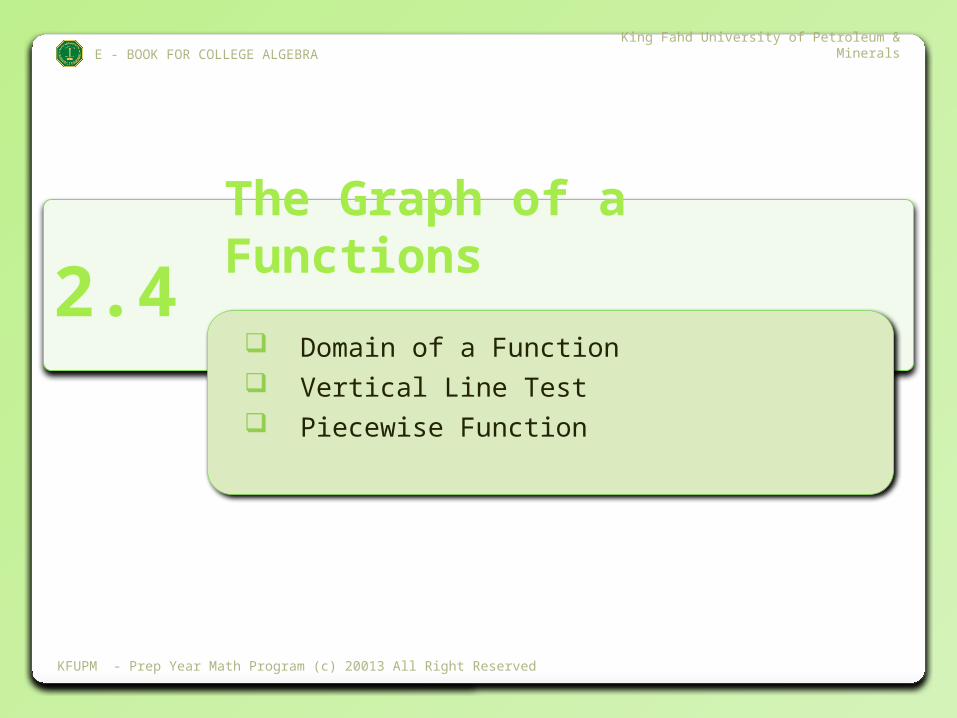
Graphing a function
The graph of a function f is the set of all point (x, y) in the xy-plane with x in the domain of the function and .
E - BOOK FOR COLLEGE ALGEBRA King Fahd University of Petroleum & Minerals
KFUPM - Prep Year Math Program (c) 2009 All Right Reserved
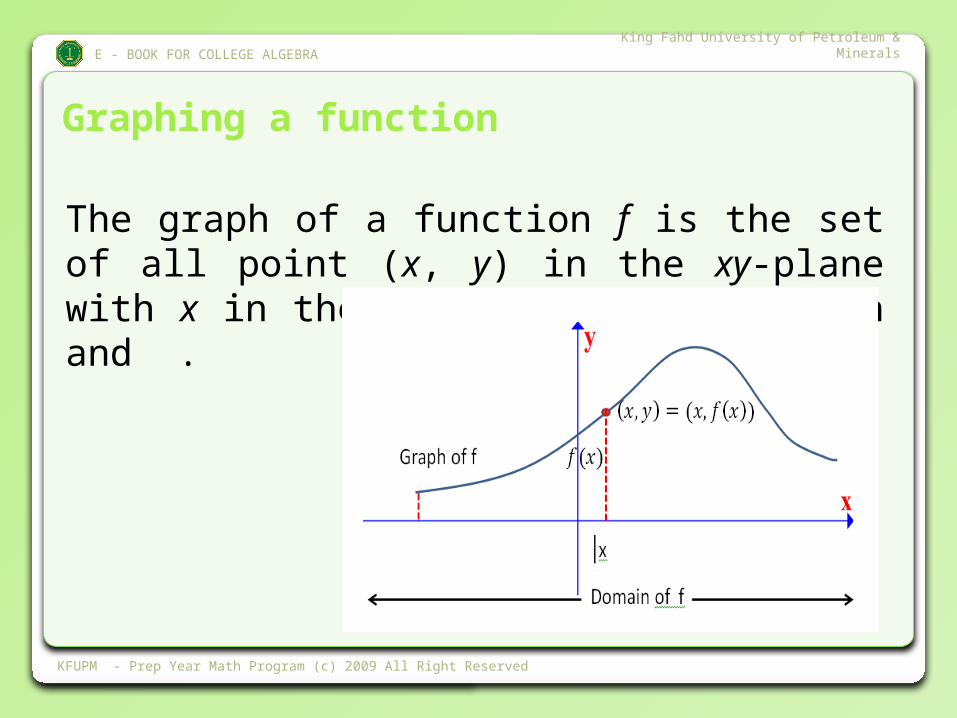
Example 1Specify the domains and ranges of the functions whose graph appears in the following figures:
E - BOOK FOR COLLEGE ALGEBRA King Fahd University of Petroleum & Minerals
KFUPM - Prep Year Math Program (c) 2009 All Right Reserved
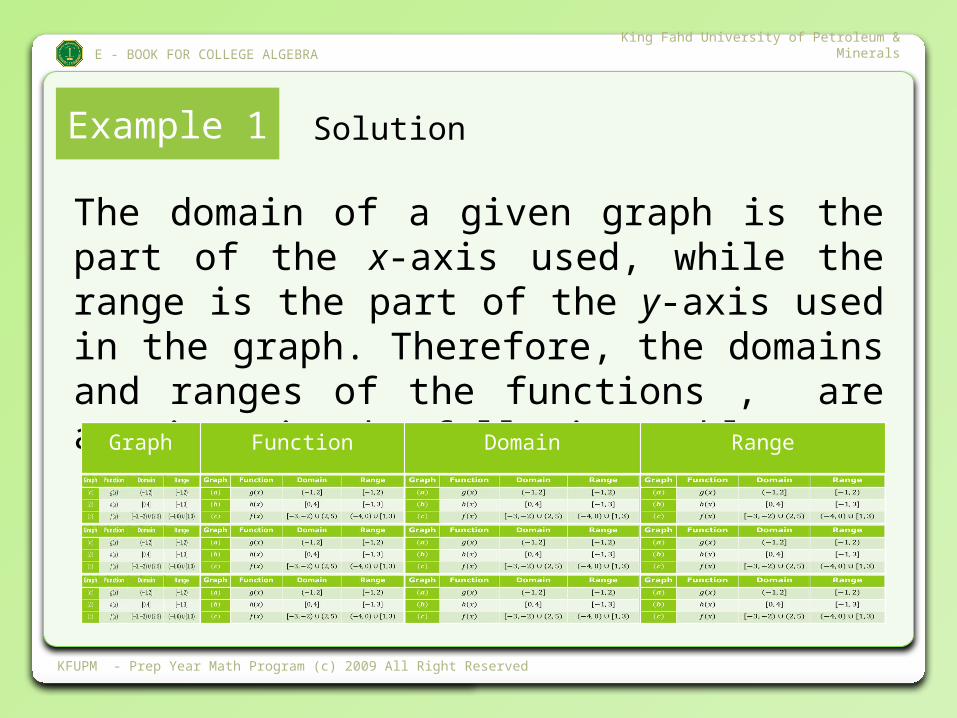
Example 1 Solution
The domain of a given graph is the part of the x-axis used, while the range is the part of the y-axis used in the graph. Therefore, the domains and ranges of the functions , are as given in the following table.
Graph Function Domain Range
E - BOOK FOR COLLEGE ALGEBRA King Fahd University of Petroleum & Minerals
KFUPM - Prep Year Math Program (c) 2009 All Right Reserved
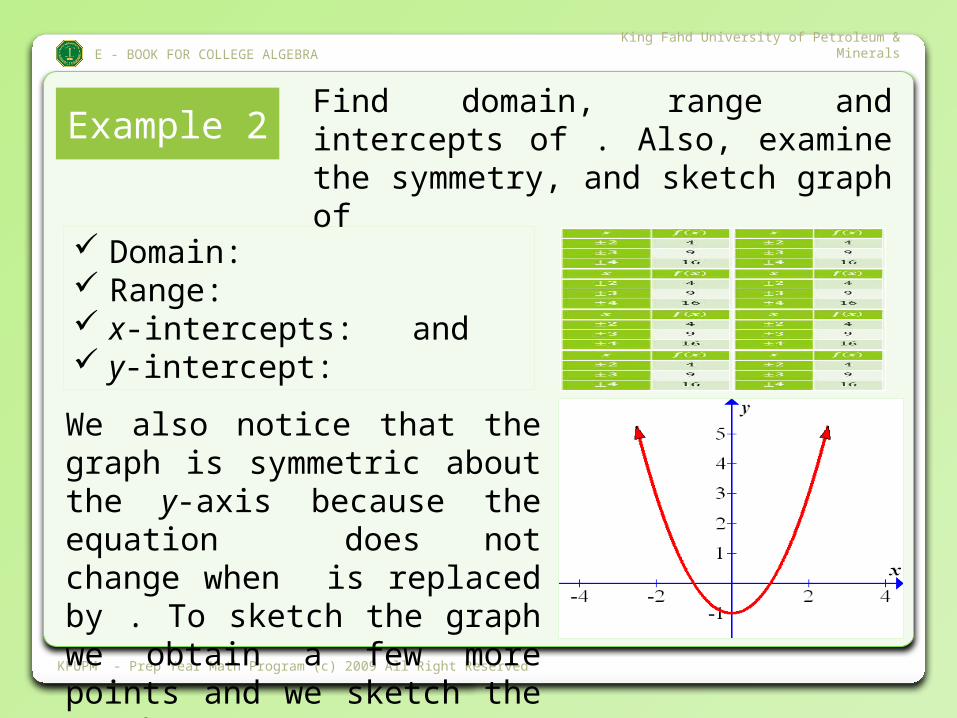
Example 2Find domain, range and intercepts of . Also, examine the symmetry, and sketch graph of
Domain: Range: x-intercepts: and y-intercept:
We also notice that the graph is symmetric about the y-axis because the equation does not change when is replaced by . To sketch the graph we obtain a few more points and we sketch the graph
E - BOOK FOR COLLEGE ALGEBRA King Fahd University of Petroleum & Minerals
KFUPM - Prep Year Math Program (c) 2009 All Right Reserved
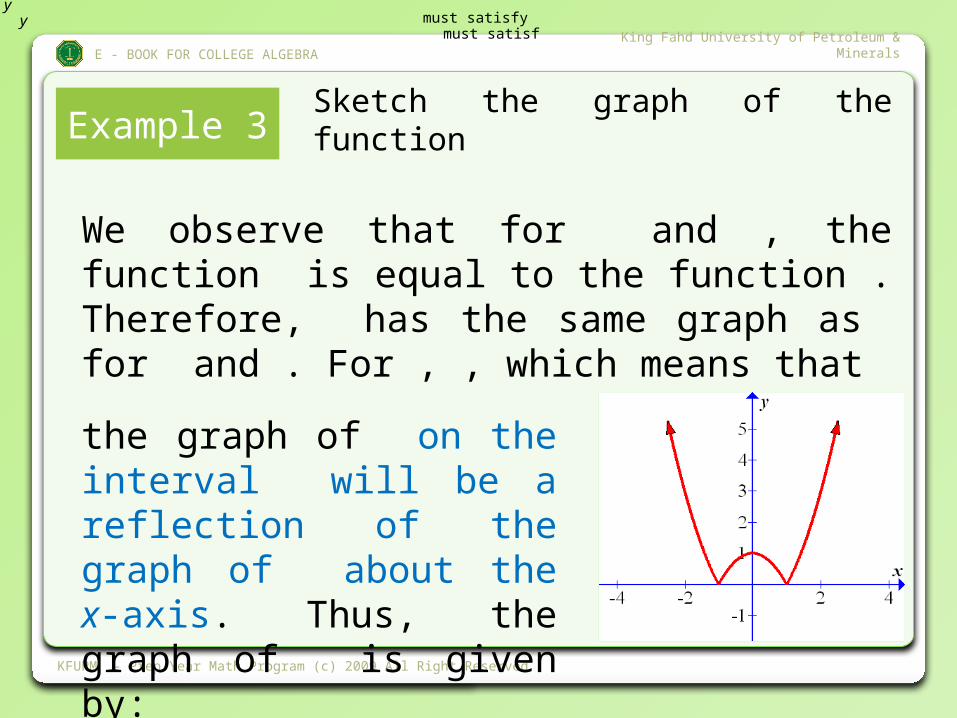
Example 3Sketch the graph of the function
ymust satisfy y
must satisf
We observe that for and , the function is equal to the function . Therefore, has the same graph as for and . For , , which means that
the graph of on the interval will be a reflection of the graph of about the x-axis. Thus, the graph of is given by:
E - BOOK FOR COLLEGE ALGEBRA King Fahd University of Petroleum & Minerals
KFUPM - Prep Year Math Program (c) 2009 All Right Reserved
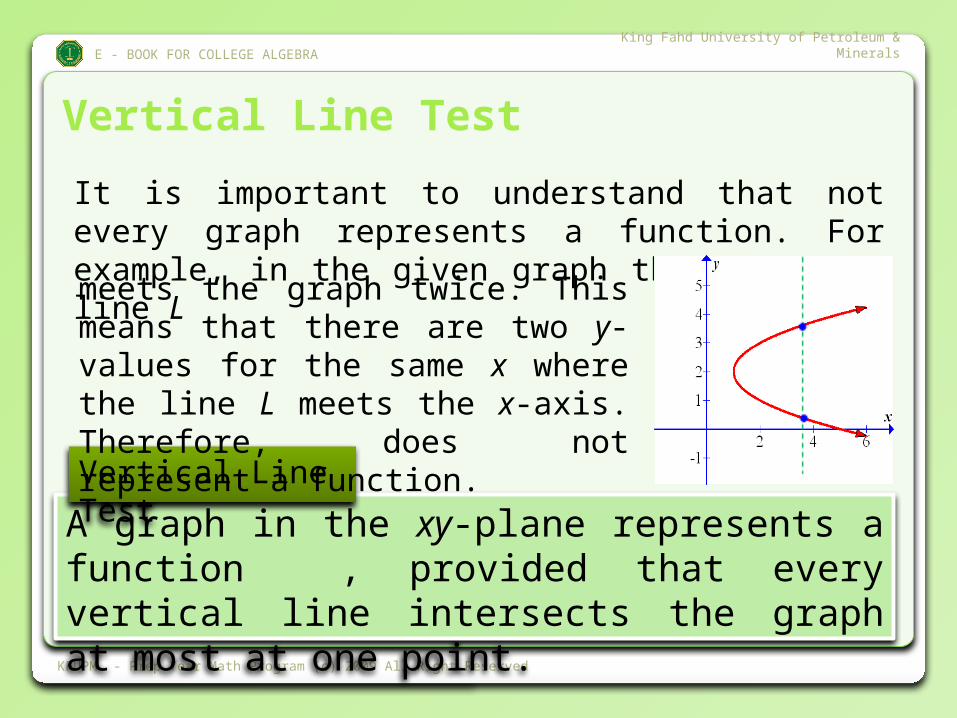
Vertical Line Test
It is important to understand that not every graph represents a function. For example, in the given graph the vertical, line L
A graph in the xy-plane represents a function , provided that every vertical line intersects the graph at most at one point.
Vertical Line Test
meets the graph twice. This means that there are two y-values for the same x where the line L meets the x-axis. Therefore, does not represent a function.
E - BOOK FOR COLLEGE ALGEBRA King Fahd University of Petroleum & Minerals
KFUPM - Prep Year Math Program (c) 2009 All Right Reserved
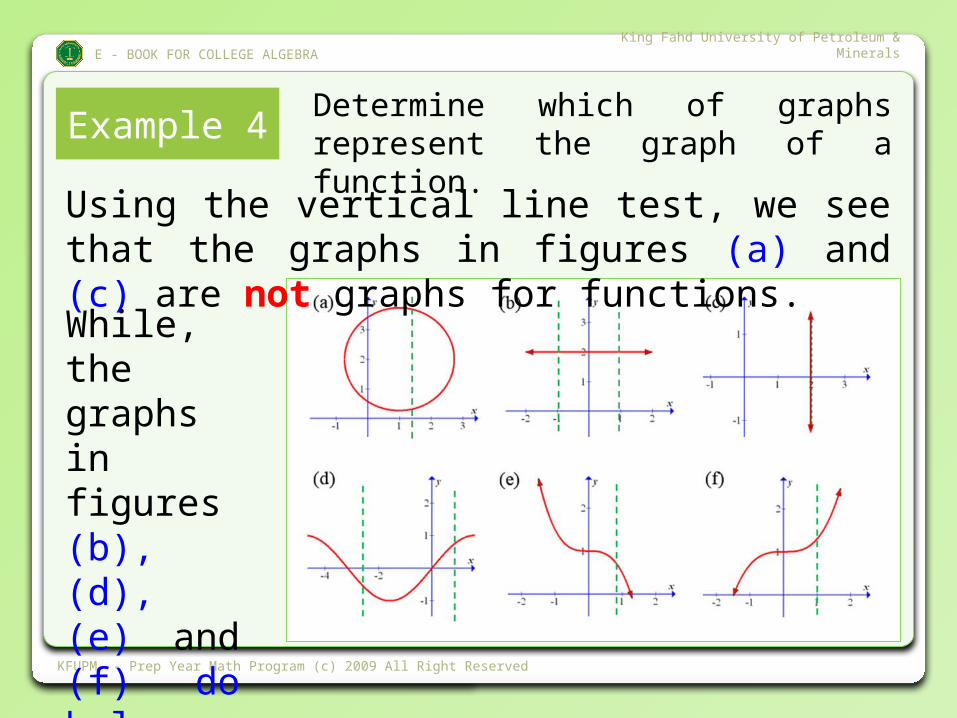
Example 4Determine which of graphs represent the graph of a function.
While, the graphs in figures (b), (d), (e) and (f) do belong to functions.
Using the vertical line test, we see that the graphs in figures (a) and (c) are not graphs for functions.
E - BOOK FOR COLLEGE ALGEBRA King Fahd University of Petroleum & Minerals
KFUPM - Prep Year Math Program (c) 2009 All Right Reserved
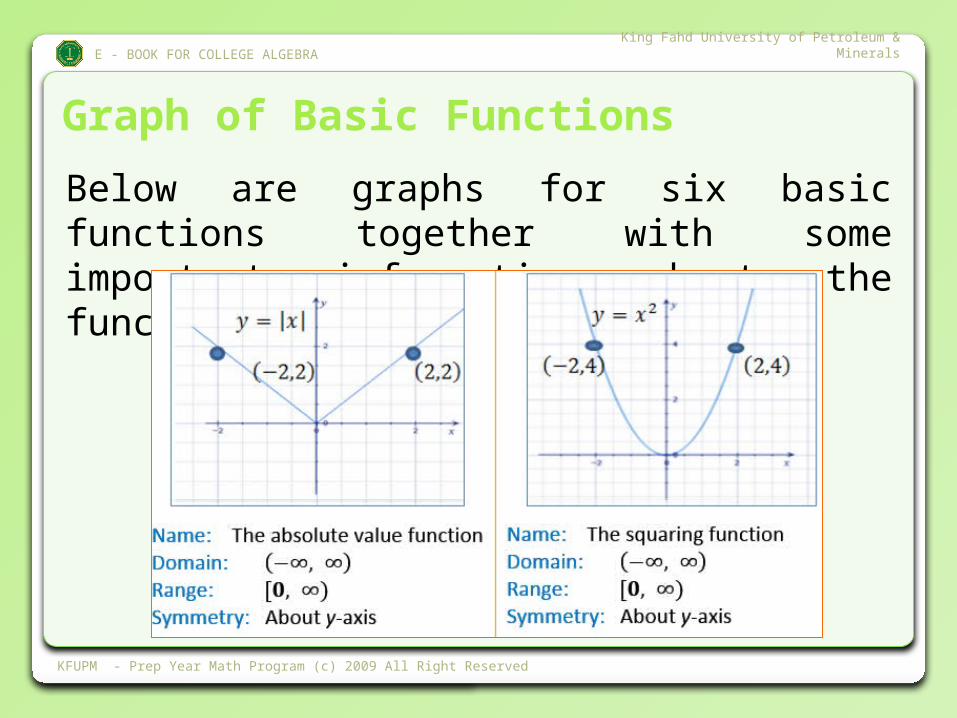
Graph of Basic Functions
Below are graphs for six basic functions together with some important information about the functions.
E - BOOK FOR COLLEGE ALGEBRA King Fahd University of Petroleum & Minerals
KFUPM - Prep Year Math Program (c) 2009 All Right Reserved
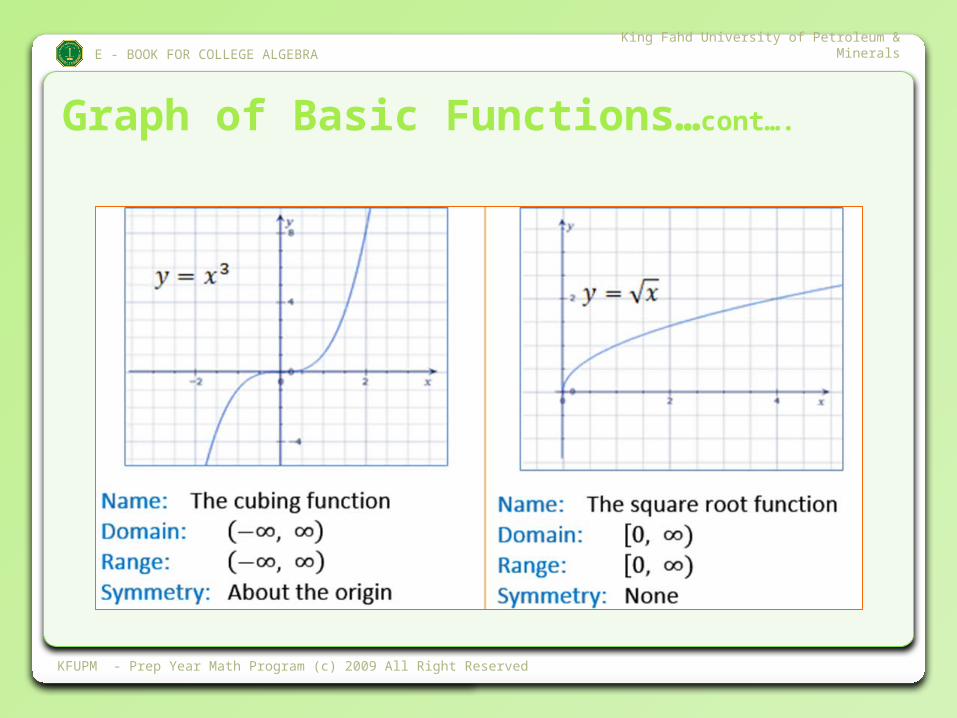
Graph of Basic Functions…cont….
E - BOOK FOR COLLEGE ALGEBRA King Fahd University of Petroleum & Minerals
KFUPM - Prep Year Math Program (c) 2009 All Right Reserved
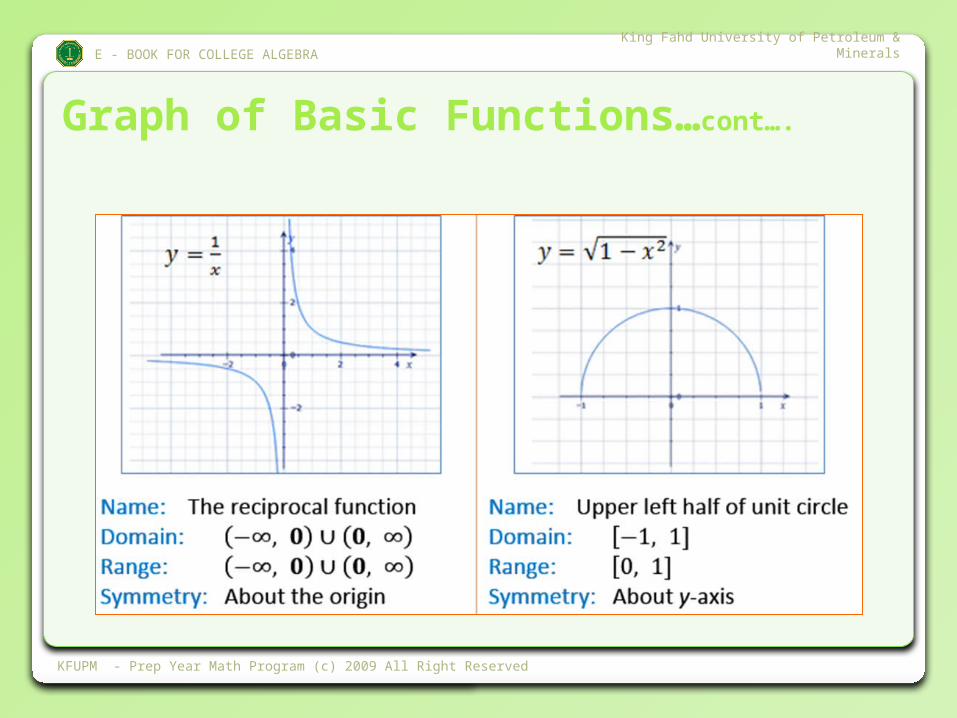
Graph of Basic Functions…cont….
E - BOOK FOR COLLEGE ALGEBRA King Fahd University of Petroleum & Minerals
KFUPM - Prep Year Math Program (c) 2009 All Right Reserved
Piecewise Functions
All functions considered earlier are defined by one single equation. In some cases, however, functions may be defined by combining several equations. For example,
represent cases like this and is called a piecewise defined function.
E - BOOK FOR COLLEGE ALGEBRA King Fahd University of Petroleum & Minerals
KFUPM - Prep Year Math Program (c) 2009 All Right Reserved
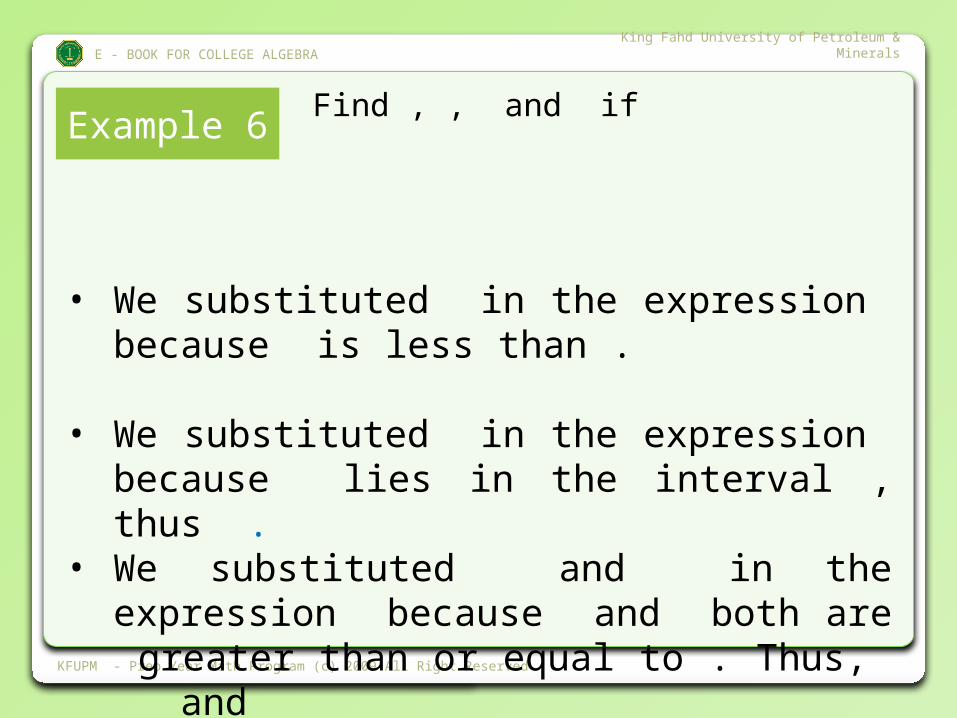
Example 6Find , , and if
• We substituted in the expression because is less than .
• We substituted in the expression because lies in the interval , thus .
• We substituted and in the expression because and both are greater than or equal to . Thus, and
E - BOOK FOR COLLEGE ALGEBRA King Fahd University of Petroleum & Minerals
KFUPM - Prep Year Math Program (c) 2009 All Right Reserved
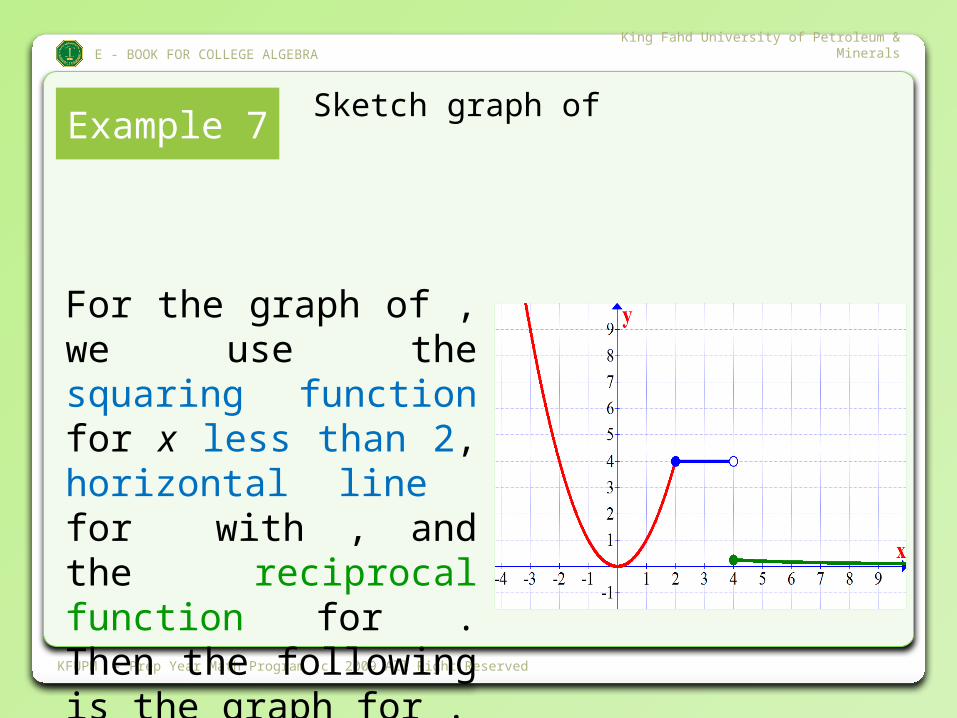
Example 7Sketch graph of
For the graph of , we use the squaring function for x less than 2, horizontal line for with , and the reciprocal function for . Then the following is the graph for .
E - BOOK FOR COLLEGE ALGEBRA King Fahd University of Petroleum & Minerals
KFUPM - Prep Year Math Program (c) 2009 All Right Reserved
Increasing, Decreasing and Constant Functions
A function is said to be increasing (decreasing) on an interval within the domain of if whenever are two numbers inside this interval we have
A function is said to be constant on an interval if
for every in this interval, we have .
Observe that the graph of a constant is a horizontal line.
E - BOOK FOR COLLEGE ALGEBRA King Fahd University of Petroleum & Minerals
KFUPM - Prep Year Math Program (c) 2009 All Right Reserved
Turning Points of a Graph
A point in the domain of is called a turning point if the graph of changes from increasing to decreasing at or vise versa.
A turning point is called a maximum point (minimum point) if the graph of at changes from increasing to decreasing (decreasing to increasing).
E - BOOK FOR COLLEGE ALGEBRA King Fahd University of Petroleum & Minerals
KFUPM - Prep Year Math Program (c) 2009 All Right Reserved
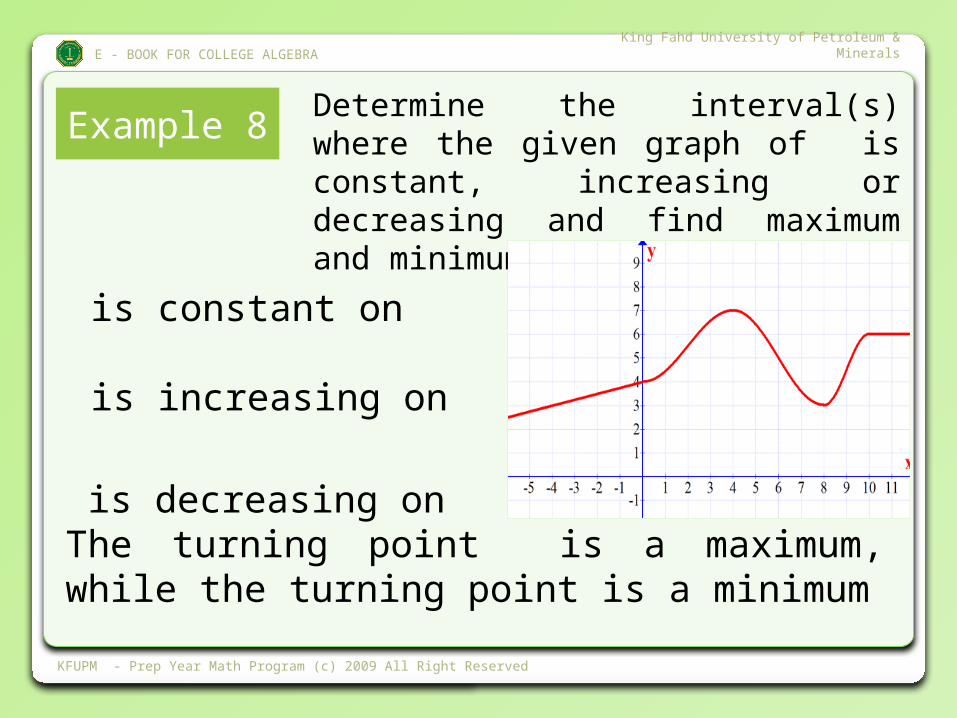
Example 8Determine the interval(s) where the given graph of is constant, increasing or decreasing and find maximum and minimum points.
is decreasing on The turning point is a maximum, while the turning point is a minimum
is constant on
is increasing on