Embed Size (px)
Citation preview
Dis cus si on Paper No. 14-005
Dynamic Market Power in an Exhaustible Resource Industry. The Case of Rare Earth Elements
Frank Pothen
Dis cus si on Paper No. 14-005
Dynamic Market Power in an Exhaustible Resource Industry. The Case of Rare Earth Elements
Frank Pothen
Download this ZEW Discussion Paper from our ftp server:
http://ftp.zew.de/pub/zew-docs/dp/dp14005.pdf
Die Dis cus si on Pape rs die nen einer mög lichst schnel len Ver brei tung von neue ren For schungs arbei ten des ZEW. Die Bei trä ge lie gen in allei ni ger Ver ant wor tung
der Auto ren und stel len nicht not wen di ger wei se die Mei nung des ZEW dar.
Dis cus si on Papers are inten ded to make results of ZEW research prompt ly avai la ble to other eco no mists in order to encou ra ge dis cus si on and sug gesti ons for revi si ons. The aut hors are sole ly
respon si ble for the con tents which do not neces sa ri ly repre sent the opi ni on of the ZEW.
Dynamic Market Power in an Exhaustible
Resource Industry. The Case of Rare Earth
Elements
Frank Pothen∗†
December 19, 2013
Abstract
This paper investigates China’s capability to exert power on Rare Earth markets until
2020. A dynamic partial equilibrium model allowing for a disaggregated representa-
tion of the mining sector and endogenous investment in capacities is developed. The
model is calibrated on a novel dataset on Rare Earth mines. Simulations show that
Chinese market power is a transitory phenomenon. In 2014 and 2015, Light Rare
Earth prices increase by 21 per cent and Heavy Rare Earth prices more than double
compared to free trade, if assuming export restrictions to remain unchanged. Market
power on Light Rare Earths vanishes almost completely by 2017 due to the entry of
new suppliers, while it persists until 2019 for Heavy Rare Earths. Export restrictions
imply a loss of Marshallian welfare of US$ 1.96 billion outside China. In the short run,
even moderate cuts in export quotas can increase exerted market power substantially.
Altering tariffs induces smaller but more persistent effects. Sensitivity checks indicate
that the results are robust, but delayed opening of new mines and demand shocks can
be important for China’s capability to exert market power.
JEL Classifications: F17, Q31, Q37
Keywords: Partial Equilibrium Model, Metals, Rare Earths, Export Restrictions, Ex-
haustible Resources
∗email: [email protected], tel: +49-621-1235-368, fax: +49-621-1235-226, ZEW, Centre for EuropeanEconomic Research, Postfach 103443, L 7/1, 68034 Mannheim, Germany.†I am deeply indebted to Florian Landis, Heinz Welsch, Andreas Loschel, Simon Koesler, as well as to
the participants of the EAERE conference 2013, the EcoMod 2014, and the participants of seminars atthe ZEW and the University of Oldenburg for valuable feedback for previous versions of the paper. Theresearch underlying this study was conducted within the project ”Linking Impact Assessment Instrumentsto Sustainability Expertise (LIAISE)” funded by the European Commission, DG Research as part ofthe 7th Framework Programme, Grant Agreement 243 826. For more information on financial support,please visit the website of the author (www.zew.de/staff fpo) and see the annual report of the Centre forEuropean Economic Research.
1
1 Introduction
Despite serving as an indispensable input for numerous ubiquitous products, from powerful
permanent magnets in hard discs to phosphors in TV screens, Rare Earths were virtually
absent from public debate until a few years ago. China, which is accounting for more than
90 per cent of worldwide Rare Earth production, changed that recently. The People’s
Republic tightened its export restrictions on the metals repeatedly from 2005 onwards.
Hence, prices have increased continuously and skyrocketed in 2011. Under the impression
of these events, more general discussions about the dependency on raw material imports
emerged in the US and the EU alike (U.S. Department of Energy, 2011; EU Commission,
2010).
Chinese market power is neither exogenous nor static. If prices are sufficiently high,
new suppliers can enter the market, in particular in case of Rare Earths, whose deposits
are found in many parts of the worlds. China’s export restrictions increase prices in the
rest of the world and encourage the expansion of supply. Thus, tight export barriers today
can reduce market power in the future. When interpreting China’s power on Rare Earth
markets, these dynamics have to be taken into account.
In this paper, I investigate to which extend China is able to exert power on Rare
Earth markets until 2020 using its trade barriers and which welfare effects they imply.
Exerted market power is measured as the price increase relative to a free trade situation.
A dynamic partial equilibrium model allowing for endogenous investment in capacities
and a disaggregated representation of the mining sector is developed. It represents the
physical life cycle of the metals, from the extraction of ores to recycling or disposal. The
model is calibrated using a novel dataset on Rare Earth mines. Scenarios are simulated
to assess the influence that China’s most important policy parameters have on exerted
market power: export quotas, export tariffs, and domestic production.
Partial equilibrium models of metal markets can be distinguished into two groups.
The first is econometric models including Fisher et al. (1972); Fisher and Owen (1981);
Slade (1980) and, more recently, Agostini (2006). This branch of literature proposes
aggregate behavioral equations for supply, demand, price formation and recycling. The
parameters are estimated econometrically and tested statistically. A second group of
studies calibrates partial equilibrium models on metal markets (Winters, 1995; Demailly
and Quirion, 2008). A recent example of this approach is Lanz et al. (2013). They develop
a model for the global copper market taking into account transportation costs, recycling,
and a disaggregated processing sector. It is used to assess carbon leakage induced by
2
sub-global sectoral climate policy. These models do not consider endogenous capacity
investments.
This paper makes three main contributions. Firstly, it applies a novel dynamic partial
equilibrium model to metal markets. Secondly, it provides the first quantitative assessment
on China’s market power on Rare Earth Elements. Thirdly, it explicitly analyses the
dynamic aspects of market power in a raw material sector.
Model simulations indicate that China’s power on Rare Earths market is a temporary
phenomenon. Its persistence differs by the type of Rare Earths, however. Assuming for
status-quo export barriers to remain in place, Chinese market power on Light Rare Earths
vanishes around 2016. Market power on Heavy Rare Earths is expected to endure until
the end of the decade. Welfare losses outside China due to the export restrictions are US$
1.96 billion1 until 2020.
Altering China’s export quotas has strong effects on prices in the short run, but the
People’s Republic is unable to exert market power in the long run using quotas. Changing
export tariffs has weaker but more continuing effects. Expanding production in China
crowds out supply from the rest of the world and makes existing export restrictions more
effective. The results are robust to many key assumptions regarding demand and supply
of Rare Earths. They are affected strongest by demand shocks and unplanned delays
while opening new mines in the rest of the world.
The paper proceeds as follows. Section 2 introduces the Rare Earth Elements. Section
3 presents China’s restrictions on Rare Earth exports. The model is outlined in section 4,
its results in section 5. The outcomes of the sensitivity analyses are presented in section
6. Section 7 concludes.
2 Rare Earths in a Nutshell
2.1 Basic Properties
This subsection provides an introduction to Rare Earth Elements. It draws heavily from
Gupta and Krishnamurthy (2005) who give a comprehensive overview of the chemical and
physical properties of Rare Earths.
Rare Earths or Rare Earth Elements are a group of 17 metals. They include the
Lanthanides, the elements from Lanthanum (Number 57 in the periodic table of elements)
to Lutetium (71), plus Scandium (21) and Yttrium (39). Rare Earths are subdivided
1Billion denotes 109 throughout the paper.
3
into Light Rare Earth Elements and Heavy Rare Earth Elements. The former include
Lanthanum (57) to Samarium (62), while the latter consist of Europium (63) to Lutetium
(71). Yttrium is included in the Heavy Rare Earths due to its greater similarity to those.
Rare Earths are not rare from a geological point of view. Cerium, the most abundant
Rare Earth Element, is roughly as abundant in the Earth’s crust as copper. Even the
rarest stable Rare Earth, Lutetium, is more plentiful than Gold or Platinum. Heavy Rare
Earths are less abundant than Light ones.
Notable deposits of Rare Earths are known in a number of nations. U.S. Geological
Survey (2013) estimates total reserves of 110 million metric tons. 48 per cent are located
in China. The Chinese government estimates its share of reserves to be much smaller,
at approximately 23 per cent (SCIO, 2012). Other important deposits are located in the
Commonwealth of Independent States, the US, India, or Australia.
All Rare Earths except Scandium exhibit almost identical chemical properties. This
is due to the lanthanide contraction. A characteristic configuration of electrons within
the Rare Earths leads to very similar ionic radii. That is responsible for their chemical
similarity which makes separating Rare Earths from each other technically challenging
and economically costly. The lanthanide contraction also explains why the metals always
occur together in their deposits, to a varying degree, however. Occurrences of Rare Earths
are either rich in Heavy or in Light Rare Earths.
2.2 Supply, Demand, and Prices
Chinese producers dominate the supply of Rare Earth elements. The country accounted
for 95 per cent of world production in 2011 and 86 per cent in 2012 (U.S. Geological Survey,
2013). This was not always the case. From the mid-1960s to the mid-1980s, the Mountain
Pass mine in California was the most important source of Rare Earths worldwide. China
entered the market in the late 1970s. Most of its extraction stems from the Bayan Obo
mine in the Inner Mongolia Autonomous Region. China has further increased its output
of Rare Earths over the following decades, eventually forcing foreign competitors to exit
the market (Hurst, 2010). Until very recently, only a few fringe producers have been
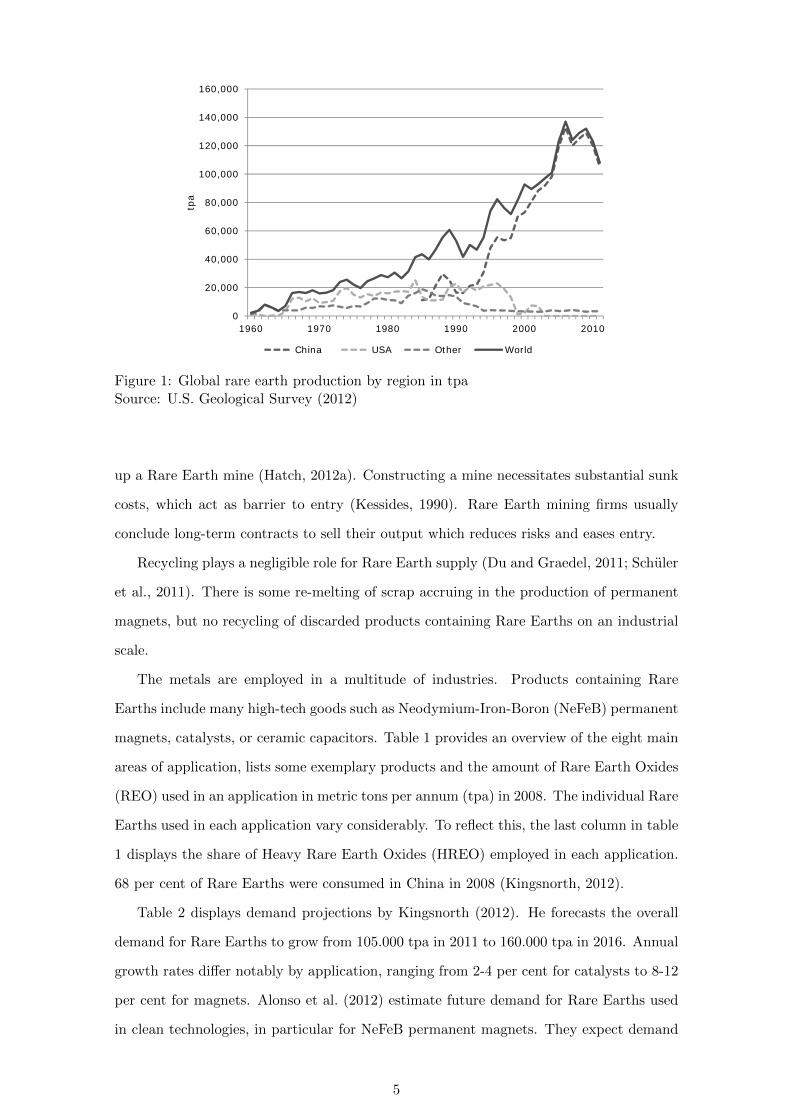
supplying Rare Earths outside China. Figure 1 shows the production of Rare Earths by
region in (metric) tons per year (tpa) from 1960 to 2011.
A large number of firms is currently trying to enter the Rare Earth market. Hatch
(2013b) lists 47 mining projects in 15 countries which published resource estimates based
on international standards in July 2013. More than 400 mining projects aim at setting
4
0
20,000
40,000
60,000
80,000
100,000
120,000
140,000
160,000
1960 1970 1980 1990 2000 2010
tpa
China USA Other World
Figure 1: Global rare earth production by region in tpaSource: U.S. Geological Survey (2012)
up a Rare Earth mine (Hatch, 2012a). Constructing a mine necessitates substantial sunk
costs, which act as barrier to entry (Kessides, 1990). Rare Earth mining firms usually
conclude long-term contracts to sell their output which reduces risks and eases entry.
Recycling plays a negligible role for Rare Earth supply (Du and Graedel, 2011; Schuler
et al., 2011). There is some re-melting of scrap accruing in the production of permanent
magnets, but no recycling of discarded products containing Rare Earths on an industrial
scale.
The metals are employed in a multitude of industries. Products containing Rare
Earths include many high-tech goods such as Neodymium-Iron-Boron (NeFeB) permanent
magnets, catalysts, or ceramic capacitors. Table 1 provides an overview of the eight main
areas of application, lists some exemplary products and the amount of Rare Earth Oxides
(REO) used in an application in metric tons per annum (tpa) in 2008. The individual Rare
Earths used in each application vary considerably. To reflect this, the last column in table
1 displays the share of Heavy Rare Earth Oxides (HREO) employed in each application.
68 per cent of Rare Earths were consumed in China in 2008 (Kingsnorth, 2012).
Table 2 displays demand projections by Kingsnorth (2012). He forecasts the overall
demand for Rare Earths to grow from 105.000 tpa in 2011 to 160.000 tpa in 2016. Annual
growth rates differ notably by application, ranging from 2-4 per cent for catalysts to 8-12
per cent for magnets. Alonso et al. (2012) estimate future demand for Rare Earths used
in clean technologies, in particular for NeFeB permanent magnets. They expect demand
5
Application Exemplary Products tpa REO % HREO
Catalysts Catalysts for fluid cracking, automotive catalysts 27,380 0%Glass industry Polishing powders, colorized or decolorized glass 28,444 3 %Metallurgy Steel and aluminum alloys 11,503 0 %Phosphors TV sets, monitors, fluorescent lamps 9,002 81 %Magnets Permanent magnets in hard discs, wind turbines 26,228 7 %Battery alloys Nickel-metal-hydride (NiMH) batteries 12,098 0 %Ceramics Superconductors, Ceramic capacitors 7,000 53 %Other Paints and pigments, waste water treatment 7,520 21 %
Table 1: Applications of Rare EarthsSource: Schuler et al. (2011); U.S. Geological Survey (2011)
for Rare Earths from these applications to grow between 700 and 2.600 per cent over the
next 25 years.
Application Demand 2011 Projection 2016tpa tpa
Catalysts 20,000 25,000Glass 8,000 10,000Polishing 14,000 18,000Metal alloys 21,000 30,000Magnets 21,000 36,000Phosphors 8,000 12,000Ceramics 7,000 10,000Other 6,000 19,000Total 105,000 160,000
Table 2: Demand projectionsSource: Kingsnorth (2012)
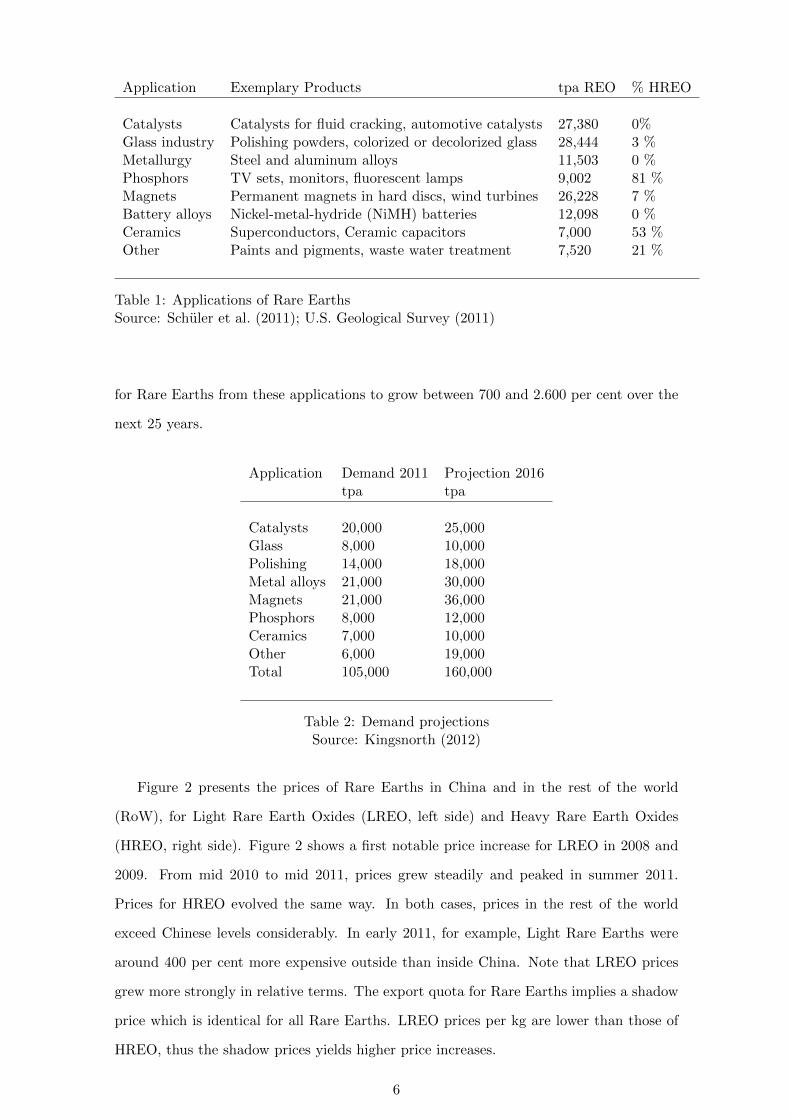
Figure 2 presents the prices of Rare Earths in China and in the rest of the world
(RoW), for Light Rare Earth Oxides (LREO, left side) and Heavy Rare Earth Oxides
(HREO, right side). Figure 2 shows a first notable price increase for LREO in 2008 and
2009. From mid 2010 to mid 2011, prices grew steadily and peaked in summer 2011.
Prices for HREO evolved the same way. In both cases, prices in the rest of the world
exceed Chinese levels considerably. In early 2011, for example, Light Rare Earths were
around 400 per cent more expensive outside than inside China. Note that LREO prices
grew more strongly in relative terms. The export quota for Rare Earths implies a shadow
price which is identical for all Rare Earths. LREO prices per kg are lower than those of
HREO, thus the shadow prices yields higher price increases.
6
0
20
40
60
80
100
120
140
160
180
200
01.2
006
05.2
006
09.2
006
01.2
007
05.2
007
09.2
007
01.2
008
05.2
008
09.2
008
01.2
009
05.2
009
09.2
009
01.2
010
05.2
010
09.2
010
01.2
011
05.2
011
09.2
011
01.2
012
05.2
012
09.2
012
US$
per
kg
RoW
China
(a)
0
100
200
300
400
500
600
700
01.2
010
03.2
010
05.2
010
07.2
010
09.2
010
11.2
010
01.2
011
03.2
011
05.2
011
07.2
011
09.2
011
11.2
011
01.2
012
03.2
012
05.2
012
07.2
012
09.2
012
11.2
012
US$
per
kg
RoW
China
(b)
Figure 2: Real prices of LREO and HREO in US$ per kgSource: asianmetal.com
3 Chinese Export Restrictions on Rare Earths
Already in 1990, the Chinese government declared Rare Earths a strategic mineral. For-
eign firms are banned from all mining, smelting, and separating activities, unless they
form a joint venture with a Chinese company (Tse, 2011). A number of barriers to Rare
Earth exports were erected thereafter.
China levies ad-valorem taxes on Rare Earth exports. They range from 15 to 25 per
cent and are imposed on ores, intermediate products, pure metals, and alloys containing
Rare Earth Elements (Tse, 2011). A 16 per cent value added tax refund on exports of
unprocessed Rare Earths was abolished in 2007 (Korinek and Kim, 2010). Effective export
taxes are between 34.5 and 46 per cent.
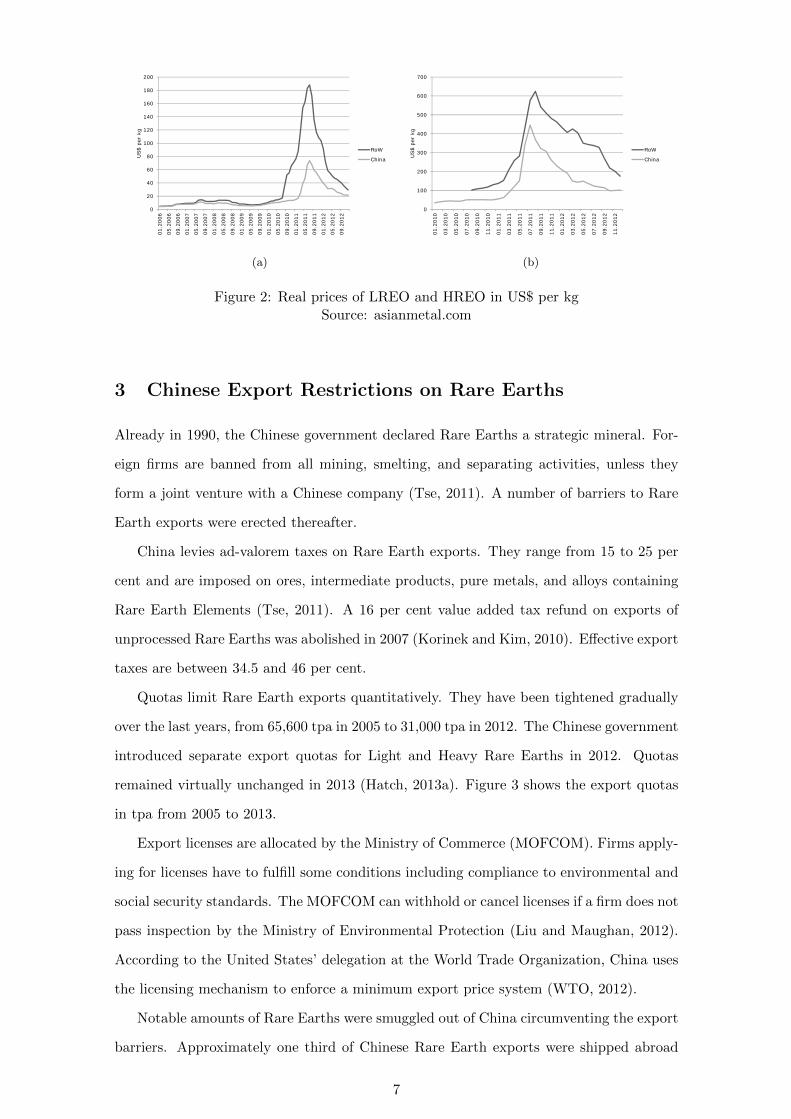
Quotas limit Rare Earth exports quantitatively. They have been tightened gradually
over the last years, from 65,600 tpa in 2005 to 31,000 tpa in 2012. The Chinese government
introduced separate export quotas for Light and Heavy Rare Earths in 2012. Quotas
remained virtually unchanged in 2013 (Hatch, 2013a). Figure 3 shows the export quotas
in tpa from 2005 to 2013.
Export licenses are allocated by the Ministry of Commerce (MOFCOM). Firms apply-
ing for licenses have to fulfill some conditions including compliance to environmental and
social security standards. The MOFCOM can withhold or cancel licenses if a firm does not
pass inspection by the Ministry of Environmental Protection (Liu and Maughan, 2012).
According to the United States’ delegation at the World Trade Organization, China uses
the licensing mechanism to enforce a minimum export price system (WTO, 2012).
Notable amounts of Rare Earths were smuggled out of China circumventing the export
barriers. Approximately one third of Chinese Rare Earth exports were shipped abroad
7
0
10,000
20,000
30,000
40,000
50,000
60,000
70,000
2005 2006 2007 2008 2009 2010 2011 2012 2013*
tpa
HREO
LREO
REO
Figure 3: Chinese export quotas 2005 to 2013.Source: Tse (2011); Hatch (2012b,c, 2013a)
illegally in 2008 (Hurst, 2010). The difference between Chinese and foreign trade statistics
fell to 8,000 t in 2011 (Wubbeke, 2013), indicating a decline in smuggling activities.
4 Model and Data
4.1 Model Structure
4.1.1 Overview
A dynamic partial equilibrium model is used to investigate China’s power on Rare Earth
markets. It replicates the whole physical life cycle of the metals, from the ores in the
ground to recycling or disposal. This section provides an overview of the model. See
Pothen (2013) for an in-depth description.
Five regions are distinguished in the model. China (Cn), the rest of Asia (RoA),
the United States (USA), Europe (EUR) and the other countries (OtC). Scandium as
well as Holmium to Lutetium are excluded due to a lack of data. All quantities in the
model are measured in Rare Earth Oxides (REO). Each Rare Earth element is modeled
individually, but results are usually presented for Light Rare Earths (LREO) and Heavy
Rare Earths (HREO). All prices are expressed in 2013 US$. The model is solved for
each year until 2025. Results are presented up to 2020. The model is formulated as a
mixed complementarity (MCP) problem and solved using the PATH algorithm (Dirkse
and Ferris, 1995).
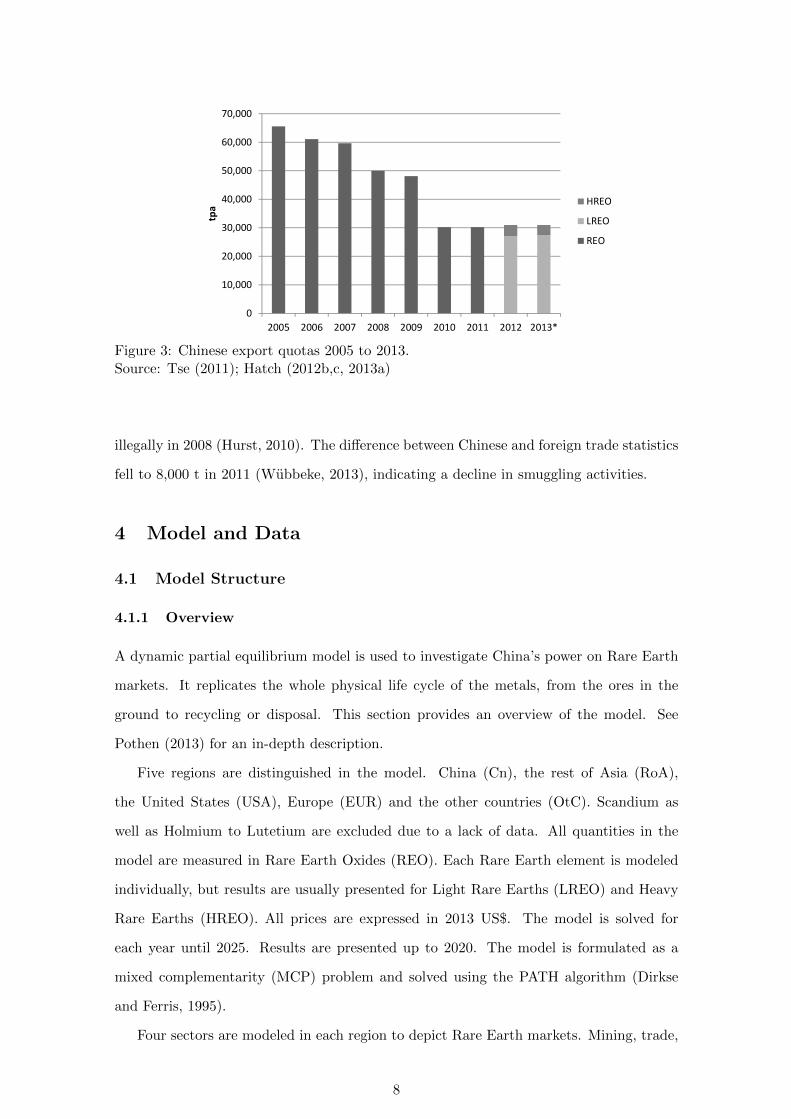
Four sectors are modeled in each region to depict Rare Earth markets. Mining, trade,
8
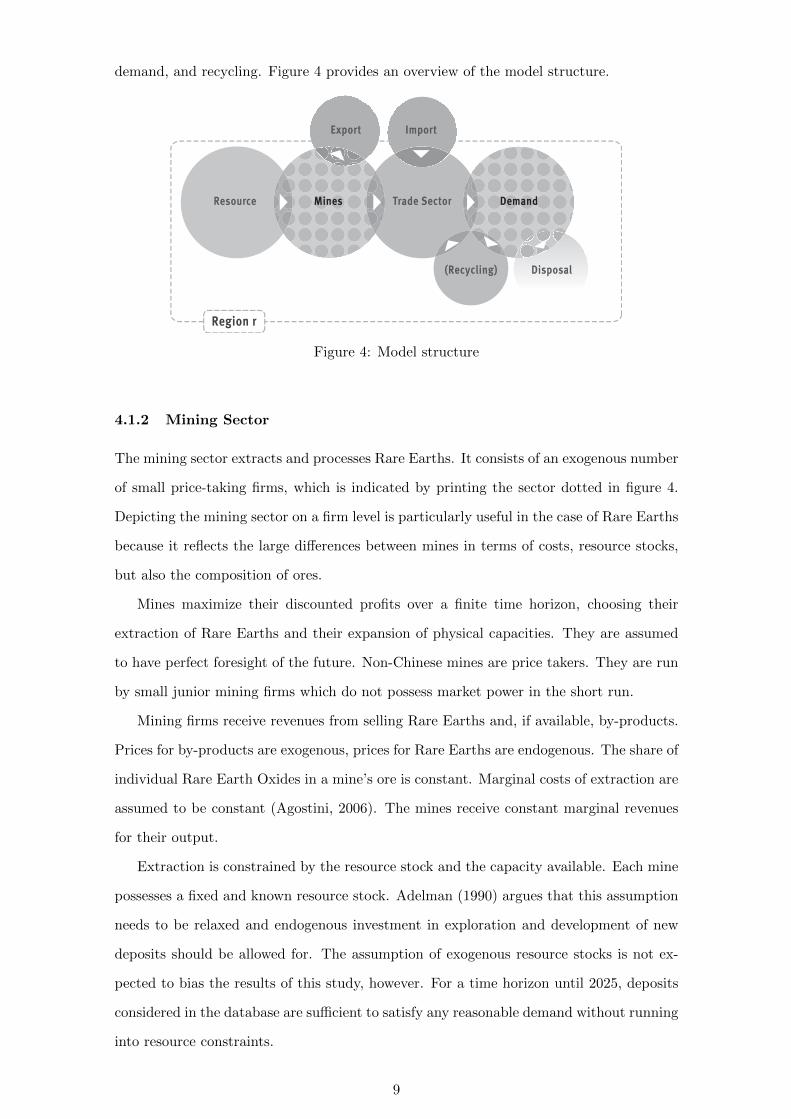
demand, and recycling. Figure 4 provides an overview of the model structure.
Resource Mines
Export Import
(Recycling)
Trade Sector Demand
Disposal
Region r
Figure 4: Model structure
4.1.2 Mining Sector
The mining sector extracts and processes Rare Earths. It consists of an exogenous number
of small price-taking firms, which is indicated by printing the sector dotted in figure 4.
Depicting the mining sector on a firm level is particularly useful in the case of Rare Earths
because it reflects the large differences between mines in terms of costs, resource stocks,
but also the composition of ores.
Mines maximize their discounted profits over a finite time horizon, choosing their
extraction of Rare Earths and their expansion of physical capacities. They are assumed
to have perfect foresight of the future. Non-Chinese mines are price takers. They are run
by small junior mining firms which do not possess market power in the short run.
Mining firms receive revenues from selling Rare Earths and, if available, by-products.
Prices for by-products are exogenous, prices for Rare Earths are endogenous. The share of
individual Rare Earth Oxides in a mine’s ore is constant. Marginal costs of extraction are
assumed to be constant (Agostini, 2006). The mines receive constant marginal revenues
for their output.
Extraction is constrained by the resource stock and the capacity available. Each mine
possesses a fixed and known resource stock. Adelman (1990) argues that this assumption
needs to be relaxed and endogenous investment in exploration and development of new
deposits should be allowed for. The assumption of exogenous resource stocks is not ex-
pected to bias the results of this study, however. For a time horizon until 2025, deposits
considered in the database are sufficient to satisfy any reasonable demand without running
into resource constraints.
9
The theoretical literature emphasizes the importance of investment costs and endoge-
nous capacities for modeling exhaustible resources sectors (Cairns, 2001; Holland, 2003).
Considering endogenous investment is particularly important for the Rare Earth sector,
where substantial capacity increases can be expected in the next years. In the model,
mines can increase their capacities incurring convex investment costs. The investment
cost function is calibrated to replicate proposed mine sizes closely (Pothen, 2013). To
reflect the considerable time needed to open up a Rare Earth mine, a lag between the
decision to invest and the commencement of production is introduced. Capacities are
reduced by 50 per cent in the first year of production to reflect ramp-up times.
Mines extract raw materials if per-unit revenues compensate for the shadow prices of
both the exhaustible resource and the capacity constraint. Investing in physical capacities
reduces the shadow price of the constraint. Mines invest in capacities as long as the
marginal costs of investment are below the gains from relaxing the constraint. For some
mines, the marginal costs of investment always exceed the marginal benefits. They do not
invest in capacities and thus do not enter the market.
China’s Rare Earth production needs to be modeled differently. The mining sector
includes some very large producers, in particular the Bayan Obo mine, and is subject to
tight and increasing government control. Representing the sector by a number of small,
profit-maximizing firms does not appear plausible.
Both the Chinese Rare Earth output and the trade restrictions are assumed to be
exogenous throughout the study. Unless specified otherwise, China’s extraction is assumed
to increase gradually to 150,000 tpa until 2018 and export restrictions correspond to those
in 2013.
Two main reasons justify the assumption that China’s behavior is exogenous. Firstly,
Chinese policy makers have to balance a number of goals when deciding upon Rare
Earth extraction and trade policies. These include environmental protection and resource
conservation, generation of government revenue, and growth of downstream industries
(Wubbeke, 2013; Pothen and Fink, 2013). Postulating a Chinese objective function is
likely to oversimplify the policy problem and would yield biased results on China’s behav-
ior.
Secondly, deriving China’s optimal policy requires solving a differential game between
(at least) the People’s Republic and the non-Chinese producers. The exact structure
of this game is not clear, however. It is, for example, not obvious if China can act as a
Stackelberg leader. Deriving Chinese behavior base from a differential game would further
10
increase modeling uncertainties.
Assuming Chinese behavior to be exogenous avoids such uncertainties. It allows to
investigate the leeway Chinese policy makers have to exert market power without claiming
to derive optimal policies for the People’s Republic.
Fringe producers of Rare Earths active prior to 2012 are aggregated into a representa-
tive mine whose output is held constant. The underlying intuition is that an expansion of
production would necessitate substantial investment. If such investment cannot observed,
no large increases in output should be expected.
4.1.3 Trade Sector
A trade sector in each region depicts trade flows of Rare Earths. It buys primary Rare
Earths both at domestic and foreign mines (the import and export flows in figure 4) as
well as recycled metals from the domestic recycling sector. The trade sector sells the Rare
Earths to the domestic demand sector. It is modeled as a price-taking representative firm.
Chinese export restrictions are implemented at the trade sectors. Tariffs are levied on
Rare Earth exports from China. Quotas on Light and Heavy Rare Earths constrain the
exports quantitatively. I assume that no smuggling takes place. This reflects a lack of
data on costs of smuggling as well as increasing efforts to put a kybosh on illegal exports
by the People’s Republic (SCIO, 2012).
Transport and other trade costs are neglected. Having export restrictions in place in
China but no other trade costs implies the existence of two prices for each Rare Earth,
one in China and one in all other places. The latter (aggregate) region is denoted rest of
the world (RoW).
4.1.4 Demand and Recycling
Rare Earths are used as intermediate inputs in seven applications: catalysts, glass, met-
allurgy (including batteries), phosphors, magnets, ceramics and other applications. Each
application employs different Rare Earths and the respective industries are distributed
unevenly across regions. Thus, I model demand as iso-elastic functions specific to appli-
cation, Rare Earth Oxide, and region. It is calibrated on demand prognoses to account
for exogenous increases in demand for Rare Earths. The price elasticity of demand εt is
assumed to be identical over all applications and regions.
If a good containing Rare Earths reaches the end of its useful lifetime, the metals can
be recycled. Currently, no recycling of Rare Earths takes place on an industrial scale (Du
11
and Graedel, 2011). Costs are prohibitive at current prices and technologies (Meyer and
Bras, 2011). In most simulations, recycling costs are assumed to remain prohibitive until
2025.
The following approach is chosen to investigate how introducing recycling affects
China’s market power. I assume that products of each application have fixed lifetimes.
After the end of the lifetime, they are discarded and become available for recycling. A
recycling sector, modeled as a price-taking representative firm, can retrieve the contained
Rare Earths. They incur constant marginal costs which is assumed as part of a scenario.
4.2 Data
A novel dataset on Rare Earth mines is compiled to calibrate the mining sector. It
encompasses the 17 farthest progressed Rare Earth mining projects outside China. Some
of those firms announce that they plan to commence production only by the end of the
decade. Not considering less progressed projects should not influence the results heavily.
Data is extracted from feasibility studies prepared by mining companies and filed at
stock exchanges in the US, Australia, or Canada. Feasibility studies assess if a project
is both technically feasible and economically profitable. They include comprehensive
geological data, resource estimations, construction plans for the mine, engineering cost
estimates, and some market prospectives (Rudenno, 2009). Feasibility studies tend to be
optimistic in terms of costs and time-schedules (Noort and Adams, 2006; Mackenzie and
Cusworth, 2007) but provide disclosed and verifiable data. All firms having cost estimates
available before August 2012 are included in the dataset.
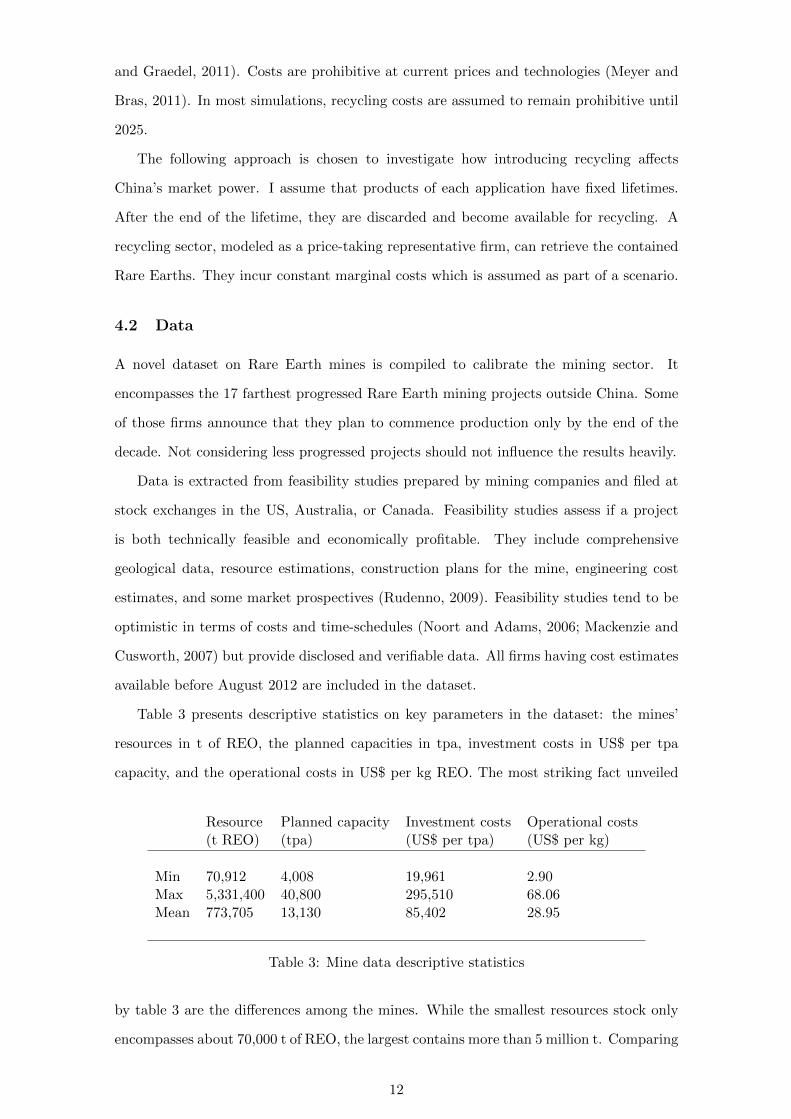
Table 3 presents descriptive statistics on key parameters in the dataset: the mines’
resources in t of REO, the planned capacities in tpa, investment costs in US$ per tpa
capacity, and the operational costs in US$ per kg REO. The most striking fact unveiled
Resource Planned capacity Investment costs Operational costs(t REO) (tpa) (US$ per tpa) (US$ per kg)
Min 70,912 4,008 19,961 2.90Max 5,331,400 40,800 295,510 68.06Mean 773,705 13,130 85,402 28.95
Table 3: Mine data descriptive statistics
by table 3 are the differences among the mines. While the smallest resources stock only
encompasses about 70,000 t of REO, the largest contains more than 5 million t. Comparing
12
the average deposit size of more than 770,000 t with the annual consumption of about
125,000 tons indicates that exhaustion of Rare Earths is not an urgent problem. Planned
capacities range from 4,000 tpa to 40,000 tpa, with an average of about 13,000 tpa.
Investment costs are high, even by the mining sector’s standards. They range from
US$ 20,000 to almost US$ 300,000 per ton of capacity. Processing facilities account for a
large share of investment costs. Extraction costs also vary strongly, between US$ 3 to US$
70 per kg of Rare Earth Oxides. Cost data has to be interpreted with care, however. Costs
of extracting and processing by-products are allocated to the Rare Earths, overestimating
the costs for mines which sell by-products.
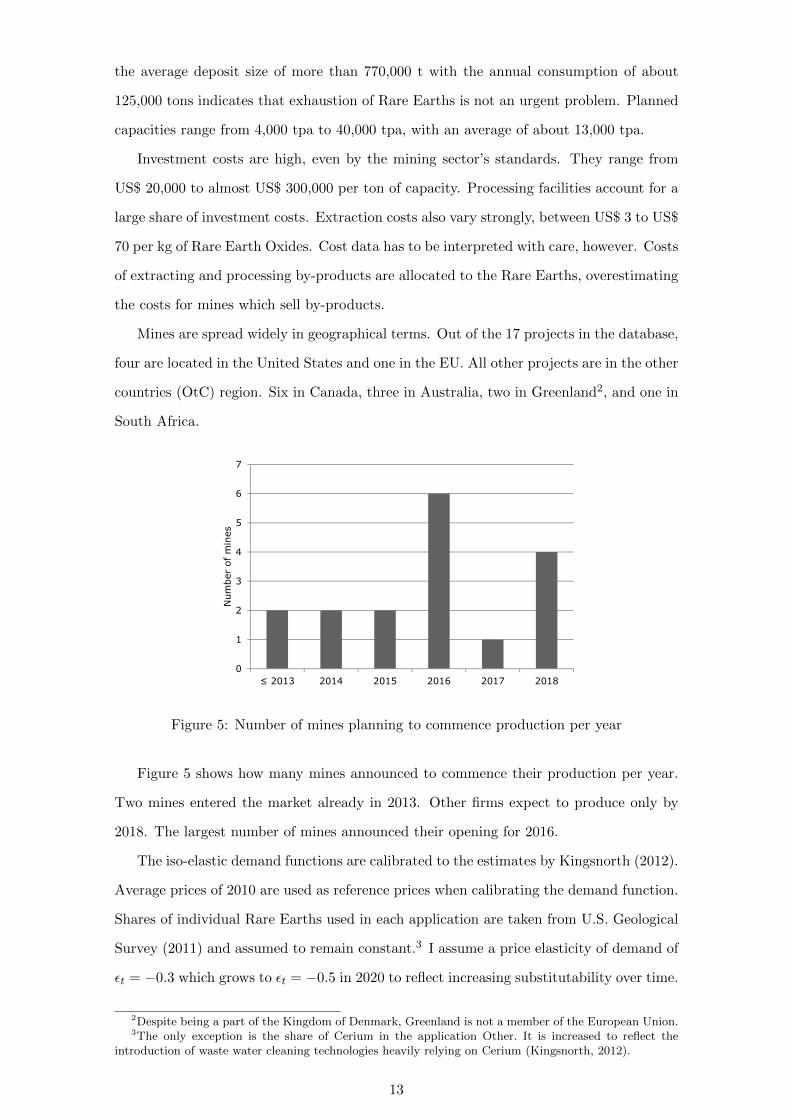
Mines are spread widely in geographical terms. Out of the 17 projects in the database,
four are located in the United States and one in the EU. All other projects are in the other
countries (OtC) region. Six in Canada, three in Australia, two in Greenland2, and one in
South Africa.
0
1
2
3
4
5
6
7
≤ 2013 2014 2015 2016 2017 2018
Num
ber
of m
ines
Figure 5: Number of mines planning to commence production per year
Figure 5 shows how many mines announced to commence their production per year.
Two mines entered the market already in 2013. Other firms expect to produce only by
2018. The largest number of mines announced their opening for 2016.
The iso-elastic demand functions are calibrated to the estimates by Kingsnorth (2012).
Average prices of 2010 are used as reference prices when calibrating the demand function.
Shares of individual Rare Earths used in each application are taken from U.S. Geological
Survey (2011) and assumed to remain constant.3 I assume a price elasticity of demand of
εt = −0.3 which grows to εt = −0.5 in 2020 to reflect increasing substitutability over time.
2Despite being a part of the Kingdom of Denmark, Greenland is not a member of the European Union.3The only exception is the share of Cerium in the application Other. It is increased to reflect the
introduction of waste water cleaning technologies heavily relying on Cerium (Kingsnorth, 2012).
13
These numbers are consistent with estimates for other metals such as copper (Agostini,
2006), Aluminum (Fisher and Owen, 1981), or Zinc (Gupta, 1982). Price data for Rare
Earth Oxides inside and outside China comes from asianmetal.com, a private sector firm
supplying metal prices.
5 Results
5.1 Business as Usual Scenario
The first simulation is the business as usual (BAU) scenario. It is assumed that China
leaves its export barriers as they are in 2013. Export tariffs vary between 15 and 25 per
cent, depending on the individual metal. Value added tax is not deducted for exports.
The export quotas add up to about 31,000 tpa. Roughly 27,000 tpa thereof are allocated
to Light Rare Earths. Rare Earth supply by the People’s Republic grows to 150,000 tpa
in 2018. No recycling takes place.
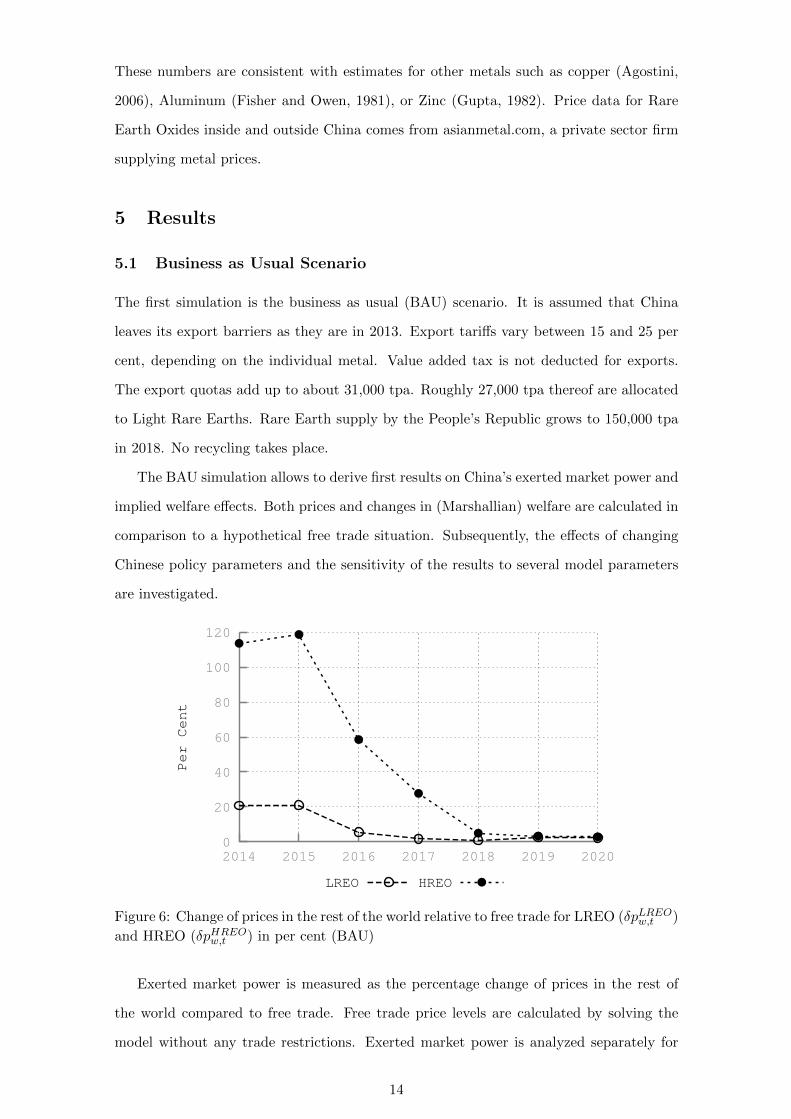
The BAU simulation allows to derive first results on China’s exerted market power and
implied welfare effects. Both prices and changes in (Marshallian) welfare are calculated in
comparison to a hypothetical free trade situation. Subsequently, the effects of changing
Chinese policy parameters and the sensitivity of the results to several model parameters
are investigated.
0
20
40
60
80
100
120
2014 2015 2016 2017 2018 2019 2020
Per Cent
LREO HREO
Figure 6: Change of prices in the rest of the world relative to free trade for LREO (δpLREOw,t )
and HREO (δpHREOw,t ) in per cent (BAU)
Exerted market power is measured as the percentage change of prices in the rest of
the world compared to free trade. Free trade price levels are calculated by solving the
model without any trade restrictions. Exerted market power is analyzed separately for
14
LREO (δpLREOw,t ) and HREO (δpHREO
w,t ). Recall that prices in all regions except China are
identical because no trade costs other than Chinese export barriers are accounted for.
Figure 6 shows how δpLREOw,t and δpHREO
w,t evolve under BAU export restrictions. It in-
dicates the temporary nature of China’s market power. The People’s Republic is expected
to have lost its market power by 2019. It is important, however, to differentiate between
Light and Heavy Rare Earths. China exerts both weaker and less persistent market power
on LREO than on HREO. δpLREOw,t equals 21 per cent in 2014 and 2015, thus prices for
LREO in the rest of the world are expected to be 21 per cent above free trade levels. The
number declines in 2016 and remains at around 2 per cent thereafter. Heavy Rare Earth
Oxides’ prices are more than twice as high as they were under free trade until 2015. The
markup on prices implied by China’s export barriers falls to 58 in 2016 and 27 per cent
in 2017. From 2019 onwards, the price difference remains at around 3 per cent.
20000
40000
60000
80000
100000
120000
140000
2014 2015 2016 2017 2018 2019 2020
tpa
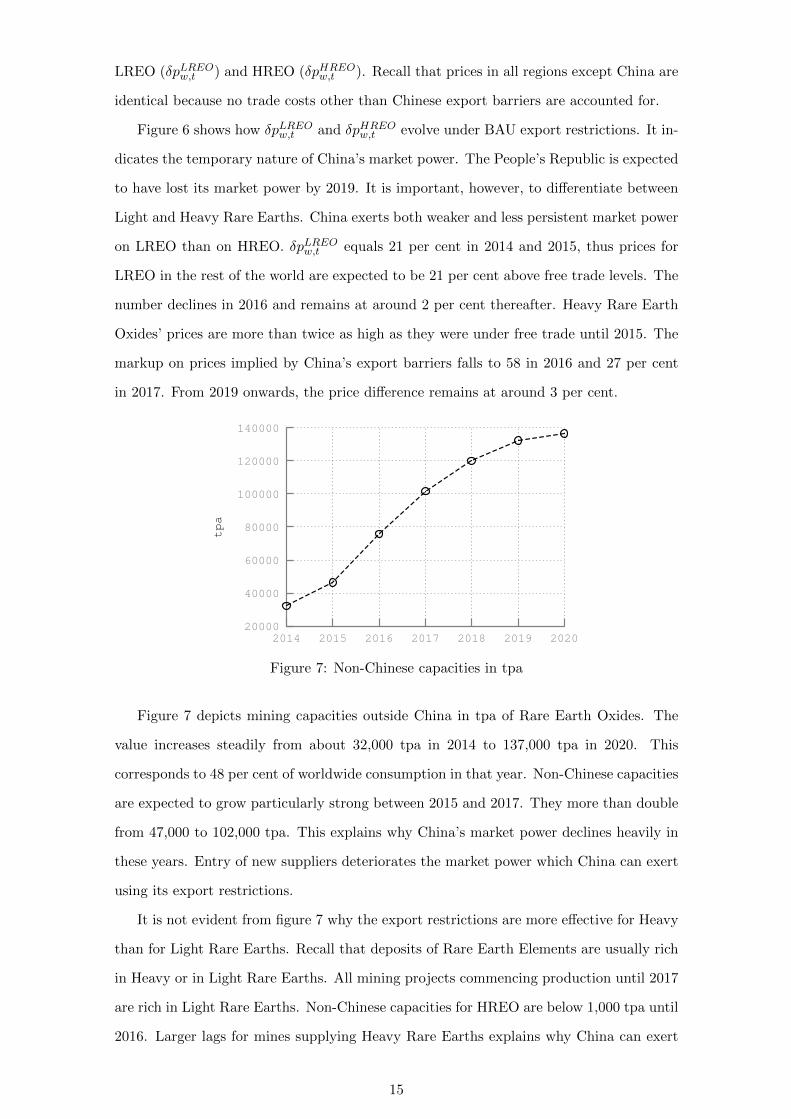
Figure 7: Non-Chinese capacities in tpa
Figure 7 depicts mining capacities outside China in tpa of Rare Earth Oxides. The
value increases steadily from about 32,000 tpa in 2014 to 137,000 tpa in 2020. This
corresponds to 48 per cent of worldwide consumption in that year. Non-Chinese capacities
are expected to grow particularly strong between 2015 and 2017. They more than double
from 47,000 to 102,000 tpa. This explains why China’s market power declines heavily in
these years. Entry of new suppliers deteriorates the market power which China can exert
using its export restrictions.
It is not evident from figure 7 why the export restrictions are more effective for Heavy
than for Light Rare Earths. Recall that deposits of Rare Earth Elements are usually rich
in Heavy or in Light Rare Earths. All mining projects commencing production until 2017
are rich in Light Rare Earths. Non-Chinese capacities for HREO are below 1,000 tpa until
2016. Larger lags for mines supplying Heavy Rare Earths explains why China can exert
15
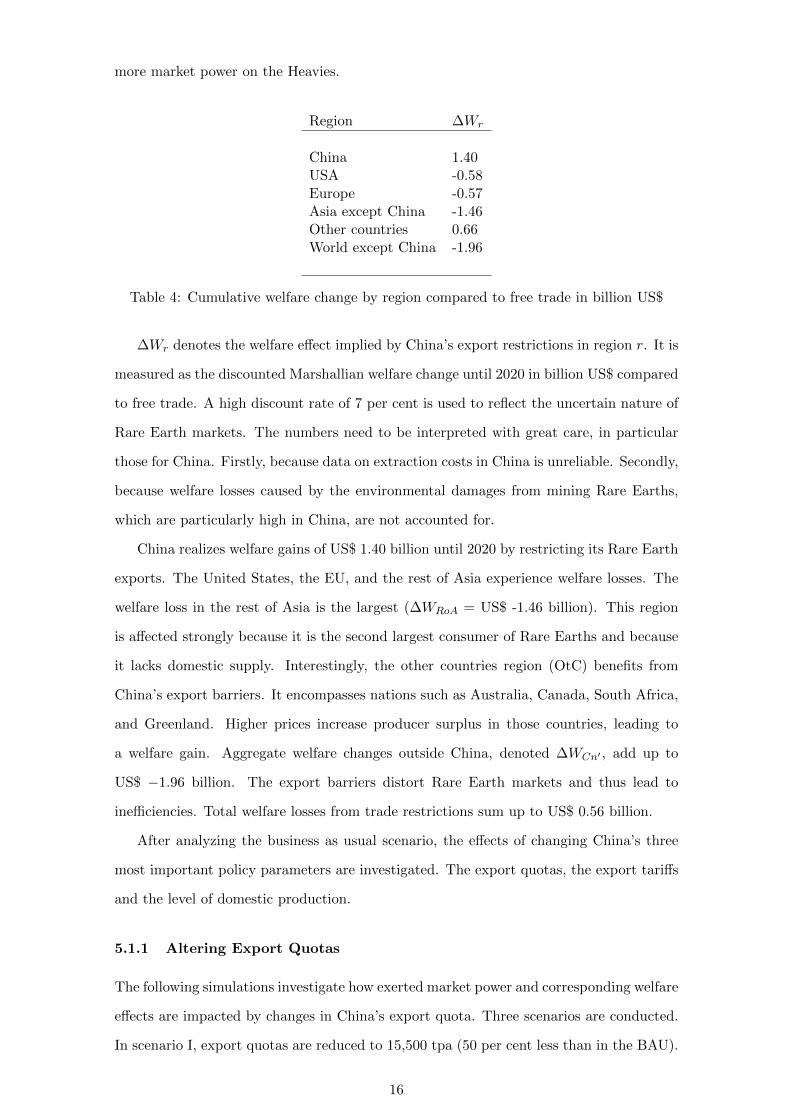
more market power on the Heavies.
Region ∆Wr
China 1.40USA -0.58Europe -0.57Asia except China -1.46Other countries 0.66World except China -1.96
Table 4: Cumulative welfare change by region compared to free trade in billion US$
∆Wr denotes the welfare effect implied by China’s export restrictions in region r. It is
measured as the discounted Marshallian welfare change until 2020 in billion US$ compared
to free trade. A high discount rate of 7 per cent is used to reflect the uncertain nature of
Rare Earth markets. The numbers need to be interpreted with great care, in particular
those for China. Firstly, because data on extraction costs in China is unreliable. Secondly,
because welfare losses caused by the environmental damages from mining Rare Earths,
which are particularly high in China, are not accounted for.
China realizes welfare gains of US$ 1.40 billion until 2020 by restricting its Rare Earth
exports. The United States, the EU, and the rest of Asia experience welfare losses. The
welfare loss in the rest of Asia is the largest (∆WRoA = US$ -1.46 billion). This region
is affected strongly because it is the second largest consumer of Rare Earths and because
it lacks domestic supply. Interestingly, the other countries region (OtC) benefits from
China’s export barriers. It encompasses nations such as Australia, Canada, South Africa,
and Greenland. Higher prices increase producer surplus in those countries, leading to
a welfare gain. Aggregate welfare changes outside China, denoted ∆WCn′ , add up to
US$ −1.96 billion. The export barriers distort Rare Earth markets and thus lead to
inefficiencies. Total welfare losses from trade restrictions sum up to US$ 0.56 billion.
After analyzing the business as usual scenario, the effects of changing China’s three
most important policy parameters are investigated. The export quotas, the export tariffs
and the level of domestic production.
5.1.1 Altering Export Quotas
The following simulations investigate how exerted market power and corresponding welfare
effects are impacted by changes in China’s export quota. Three scenarios are conducted.
In scenario I, export quotas are reduced to 15,500 tpa (50 per cent less than in the BAU).
16
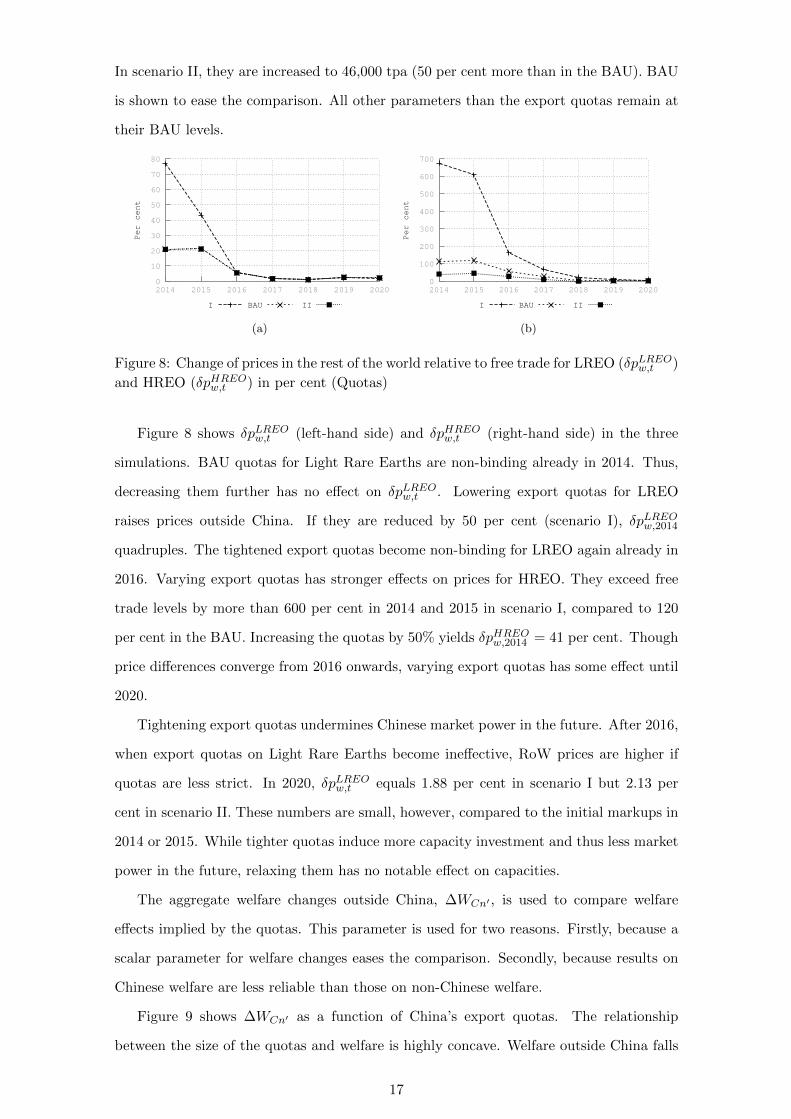
In scenario II, they are increased to 46,000 tpa (50 per cent more than in the BAU). BAU
is shown to ease the comparison. All other parameters than the export quotas remain at
their BAU levels.
0
10
20
30
40
50
60
70
80
2014 2015 2016 2017 2018 2019 2020
Per cent
I BAU II
(a)
0
100
200
300
400
500
600
700
2014 2015 2016 2017 2018 2019 2020
Per cent
I BAU II
(b)
Figure 8: Change of prices in the rest of the world relative to free trade for LREO (δpLREOw,t )
and HREO (δpHREOw,t ) in per cent (Quotas)
Figure 8 shows δpLREOw,t (left-hand side) and δpHREO
w,t (right-hand side) in the three
simulations. BAU quotas for Light Rare Earths are non-binding already in 2014. Thus,
decreasing them further has no effect on δpLREOw,t . Lowering export quotas for LREO
raises prices outside China. If they are reduced by 50 per cent (scenario I), δpLREOw,2014
quadruples. The tightened export quotas become non-binding for LREO again already in
2016. Varying export quotas has stronger effects on prices for HREO. They exceed free
trade levels by more than 600 per cent in 2014 and 2015 in scenario I, compared to 120
per cent in the BAU. Increasing the quotas by 50% yields δpHREOw,2014 = 41 per cent. Though
price differences converge from 2016 onwards, varying export quotas has some effect until
2020.
Tightening export quotas undermines Chinese market power in the future. After 2016,
when export quotas on Light Rare Earths become ineffective, RoW prices are higher if
quotas are less strict. In 2020, δpLREOw,t equals 1.88 per cent in scenario I but 2.13 per
cent in scenario II. These numbers are small, however, compared to the initial markups in
2014 or 2015. While tighter quotas induce more capacity investment and thus less market
power in the future, relaxing them has no notable effect on capacities.
The aggregate welfare changes outside China, ∆WCn′ , is used to compare welfare
effects implied by the quotas. This parameter is used for two reasons. Firstly, because a
scalar parameter for welfare changes eases the comparison. Secondly, because results on
Chinese welfare are less reliable than those on non-Chinese welfare.
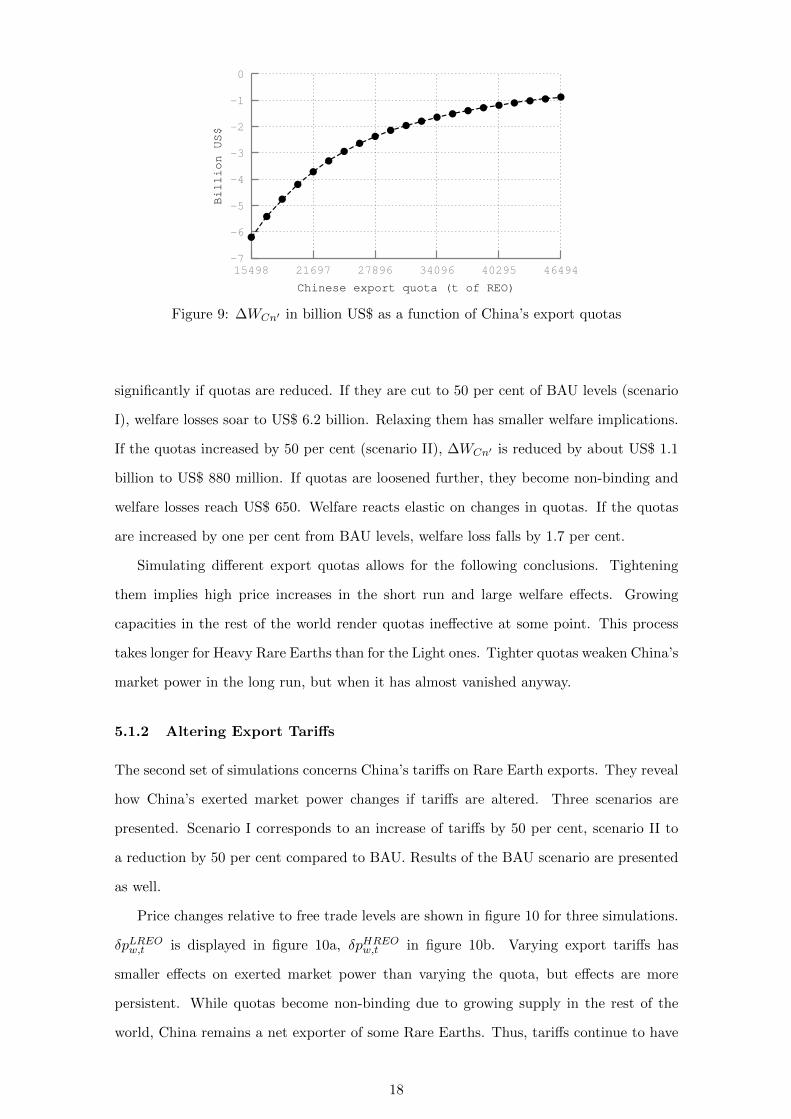
Figure 9 shows ∆WCn′ as a function of China’s export quotas. The relationship
between the size of the quotas and welfare is highly concave. Welfare outside China falls
17
-7
-6
-5
-4
-3
-2
-1
0
15498 21697 27896 34096 40295 46494
Billion US$
Chinese export quota (t of REO)
Figure 9: ∆WCn′ in billion US$ as a function of China’s export quotas
significantly if quotas are reduced. If they are cut to 50 per cent of BAU levels (scenario
I), welfare losses soar to US$ 6.2 billion. Relaxing them has smaller welfare implications.
If the quotas increased by 50 per cent (scenario II), ∆WCn′ is reduced by about US$ 1.1
billion to US$ 880 million. If quotas are loosened further, they become non-binding and
welfare losses reach US$ 650. Welfare reacts elastic on changes in quotas. If the quotas
are increased by one per cent from BAU levels, welfare loss falls by 1.7 per cent.
Simulating different export quotas allows for the following conclusions. Tightening
them implies high price increases in the short run and large welfare effects. Growing
capacities in the rest of the world render quotas ineffective at some point. This process
takes longer for Heavy Rare Earths than for the Light ones. Tighter quotas weaken China’s
market power in the long run, but when it has almost vanished anyway.
5.1.2 Altering Export Tariffs
The second set of simulations concerns China’s tariffs on Rare Earth exports. They reveal
how China’s exerted market power changes if tariffs are altered. Three scenarios are
presented. Scenario I corresponds to an increase of tariffs by 50 per cent, scenario II to
a reduction by 50 per cent compared to BAU. Results of the BAU scenario are presented
as well.
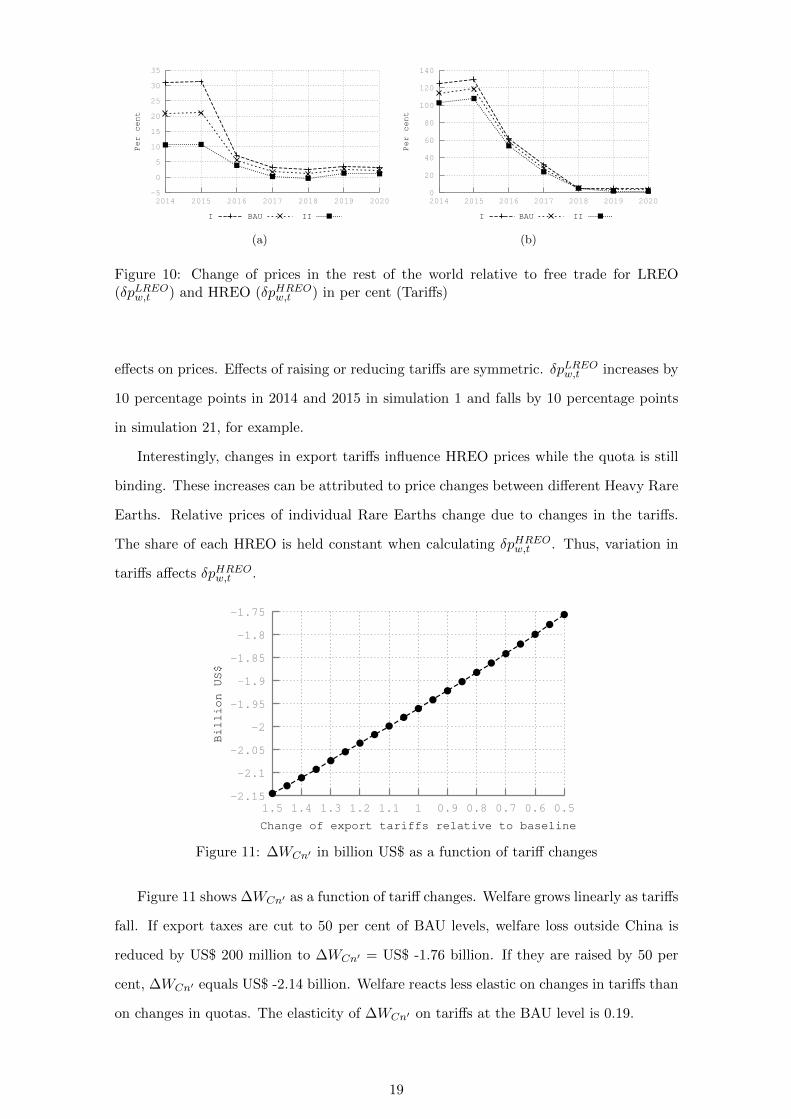
Price changes relative to free trade levels are shown in figure 10 for three simulations.
δpLREOw,t is displayed in figure 10a, δpHREO
w,t in figure 10b. Varying export tariffs has
smaller effects on exerted market power than varying the quota, but effects are more
persistent. While quotas become non-binding due to growing supply in the rest of the
world, China remains a net exporter of some Rare Earths. Thus, tariffs continue to have
18
-5
0
5
10
15
20
25
30
35
2014 2015 2016 2017 2018 2019 2020
Per cent
I BAU II
(a)
0
20
40
60
80
100
120
140
2014 2015 2016 2017 2018 2019 2020
Per cent
I BAU II
(b)
Figure 10: Change of prices in the rest of the world relative to free trade for LREO(δpLREO
w,t ) and HREO (δpHREOw,t ) in per cent (Tariffs)
effects on prices. Effects of raising or reducing tariffs are symmetric. δpLREOw,t increases by
10 percentage points in 2014 and 2015 in simulation 1 and falls by 10 percentage points
in simulation 21, for example.
Interestingly, changes in export tariffs influence HREO prices while the quota is still
binding. These increases can be attributed to price changes between different Heavy Rare
Earths. Relative prices of individual Rare Earths change due to changes in the tariffs.
The share of each HREO is held constant when calculating δpHREOw,t . Thus, variation in
tariffs affects δpHREOw,t .
-2.15
-2.1
-2.05
-2
-1.95
-1.9
-1.85
-1.8
-1.75
1.5 1.4 1.3 1.2 1.1 1 0.9 0.8 0.7 0.6 0.5
Billion US$
Change of export tariffs relative to baseline
Figure 11: ∆WCn′ in billion US$ as a function of tariff changes
Figure 11 shows ∆WCn′ as a function of tariff changes. Welfare grows linearly as tariffs
fall. If export taxes are cut to 50 per cent of BAU levels, welfare loss outside China is
reduced by US$ 200 million to ∆WCn′ = US$ -1.76 billion. If they are raised by 50 per
cent, ∆WCn′ equals US$ -2.14 billion. Welfare reacts less elastic on changes in tariffs than
on changes in quotas. The elasticity of ∆WCn′ on tariffs at the BAU level is 0.19.
19
5.1.3 Rare Earth Supply
Further simulations concern the supply of Rare Earths in China. Production of Rare
Earth elements is highly regulated and the Chinese government aims at further tightening
its control over domestic supply (SCIO, 2012). It is reasonable to perceive Chinese Rare
Earth production as a policy variable.
Again, three scenarios are presented. Scenario I corresponds to a 25 per cent increase
in Chinese Rare Earth output. The production is reduced in scenario II by 25 per cent,
both compared to the BAU. Results of the BAU are shown for comparison as well. Export
restrictions remain unchanged in all scenarios.
Note that changing Chinese Rare Earth supply also implies a different free trade
situation. Therefore, the respective free trade simulations are conducted for all scenarios.
The results do not reveal if expanding or reducing production is beneficial for China,
because neither the environmental externalities associated with mining nor the user rents
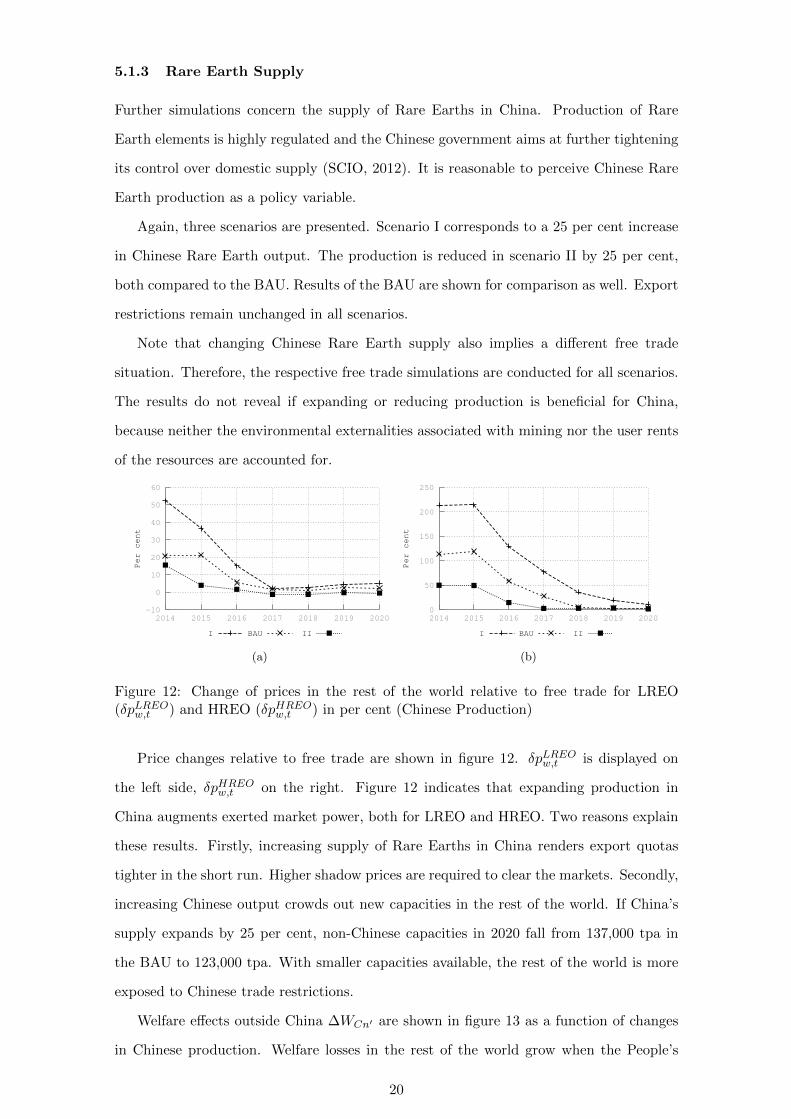
of the resources are accounted for.
-10
0
10
20
30
40
50
60
2014 2015 2016 2017 2018 2019 2020
Per cent
I BAU II
(a)
0
50
100
150
200
250
2014 2015 2016 2017 2018 2019 2020
Per cent
I BAU II
(b)
Figure 12: Change of prices in the rest of the world relative to free trade for LREO(δpLREO
w,t ) and HREO (δpHREOw,t ) in per cent (Chinese Production)
Price changes relative to free trade are shown in figure 12. δpLREOw,t is displayed on
the left side, δpHREOw,t on the right. Figure 12 indicates that expanding production in
China augments exerted market power, both for LREO and HREO. Two reasons explain
these results. Firstly, increasing supply of Rare Earths in China renders export quotas
tighter in the short run. Higher shadow prices are required to clear the markets. Secondly,
increasing Chinese output crowds out new capacities in the rest of the world. If China’s
supply expands by 25 per cent, non-Chinese capacities in 2020 fall from 137,000 tpa in
the BAU to 123,000 tpa. With smaller capacities available, the rest of the world is more
exposed to Chinese trade restrictions.
Welfare effects outside China ∆WCn′ are shown in figure 13 as a function of changes
in Chinese production. Welfare losses in the rest of the world grow when the People’s
20
-3.5
-3
-2.5
-2
-1.5
-1
-0.5
1.251.201.151.101.051.000.950.900.850.800.75
Billion US$
Change of Chinese production relative to baseline
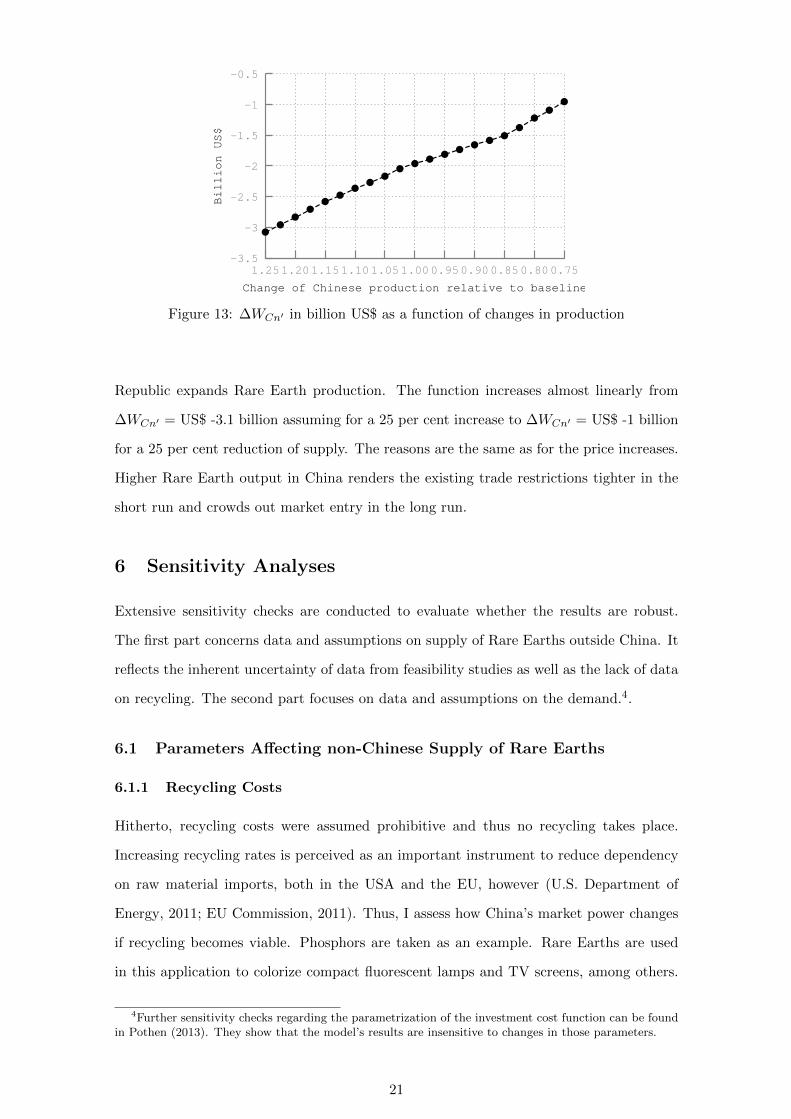
Figure 13: ∆WCn′ in billion US$ as a function of changes in production
Republic expands Rare Earth production. The function increases almost linearly from
∆WCn′ = US$ -3.1 billion assuming for a 25 per cent increase to ∆WCn′ = US$ -1 billion
for a 25 per cent reduction of supply. The reasons are the same as for the price increases.
Higher Rare Earth output in China renders the existing trade restrictions tighter in the
short run and crowds out market entry in the long run.
6 Sensitivity Analyses
Extensive sensitivity checks are conducted to evaluate whether the results are robust.
The first part concerns data and assumptions on supply of Rare Earths outside China. It
reflects the inherent uncertainty of data from feasibility studies as well as the lack of data
on recycling. The second part focuses on data and assumptions on the demand.4.
6.1 Parameters Affecting non-Chinese Supply of Rare Earths
6.1.1 Recycling Costs
Hitherto, recycling costs were assumed prohibitive and thus no recycling takes place.
Increasing recycling rates is perceived as an important instrument to reduce dependency
on raw material imports, both in the USA and the EU, however (U.S. Department of
Energy, 2011; EU Commission, 2011). Thus, I assess how China’s market power changes
if recycling becomes viable. Phosphors are taken as an example. Rare Earths are used
in this application to colorize compact fluorescent lamps and TV screens, among others.
4Further sensitivity checks regarding the parametrization of the investment cost function can be foundin Pothen (2013). They show that the model’s results are insensitive to changes in those parameters.
21
The high prices of Rare Earths used for producing them makes recycling more realistic
than in many other applications.
Three scenarios are conducted to assess the impact of introducing recycling of phos-
phors. They differ from each other in the constant marginal costs of retrieving one kg of
Rare Earths from phosphors. In the first scenario, the costs are assumed to be US$ 230
per kg. This corresponds to the price of a kg of Rare Earths used to produce phosphors
in 2014. Costs of US$ 173 are assumed in the second scenario. They are further reduced
to US$ 115 in the last scenario. The three scenarios are denoted 230, 173, and 115.
0
5
10
15
20
25
2014 2015 2016 2017 2018 2019 2020
Per cent
115 173 230
(a)
0
20
40
60
80
100
120
2014 2015 2016 2017 2018 2019 2020
Per cent
115 173 230
(b)
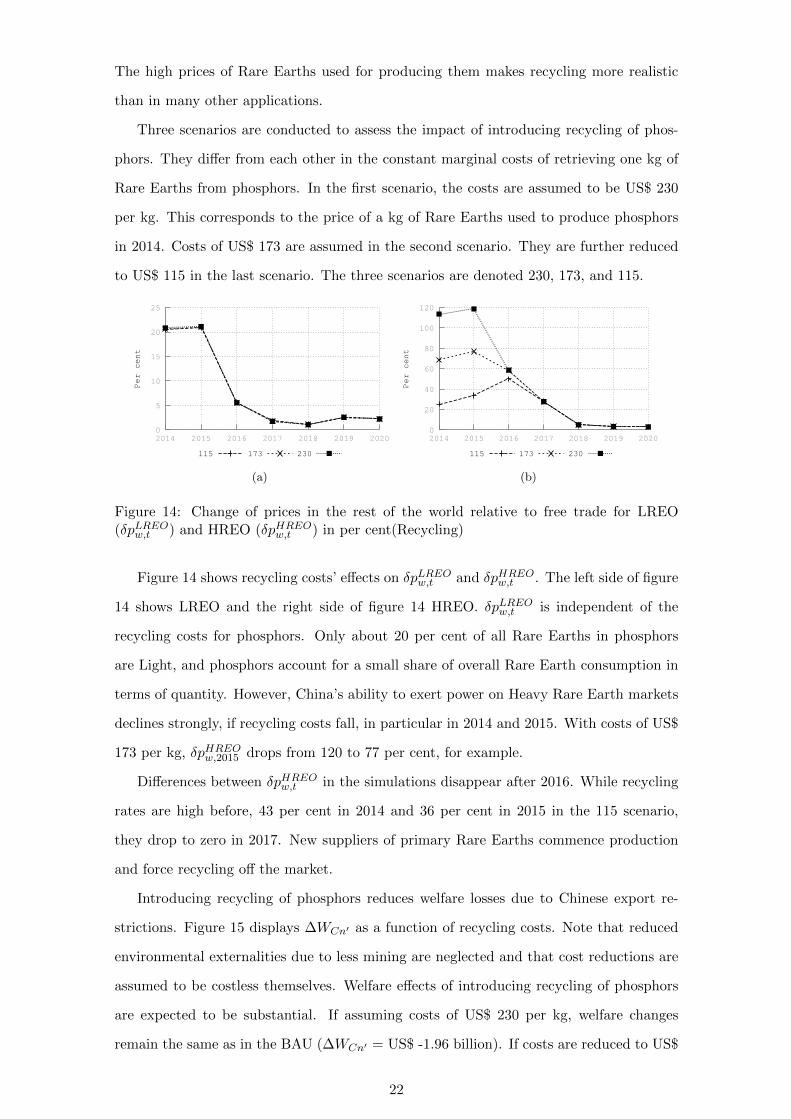
Figure 14: Change of prices in the rest of the world relative to free trade for LREO(δpLREO
w,t ) and HREO (δpHREOw,t ) in per cent(Recycling)
Figure 14 shows recycling costs’ effects on δpLREOw,t and δpHREO
w,t . The left side of figure
14 shows LREO and the right side of figure 14 HREO. δpLREOw,t is independent of the
recycling costs for phosphors. Only about 20 per cent of all Rare Earths in phosphors
are Light, and phosphors account for a small share of overall Rare Earth consumption in
terms of quantity. However, China’s ability to exert power on Heavy Rare Earth markets
declines strongly, if recycling costs fall, in particular in 2014 and 2015. With costs of US$
173 per kg, δpHREOw,2015 drops from 120 to 77 per cent, for example.
Differences between δpHREOw,t in the simulations disappear after 2016. While recycling
rates are high before, 43 per cent in 2014 and 36 per cent in 2015 in the 115 scenario,
they drop to zero in 2017. New suppliers of primary Rare Earths commence production
and force recycling off the market.
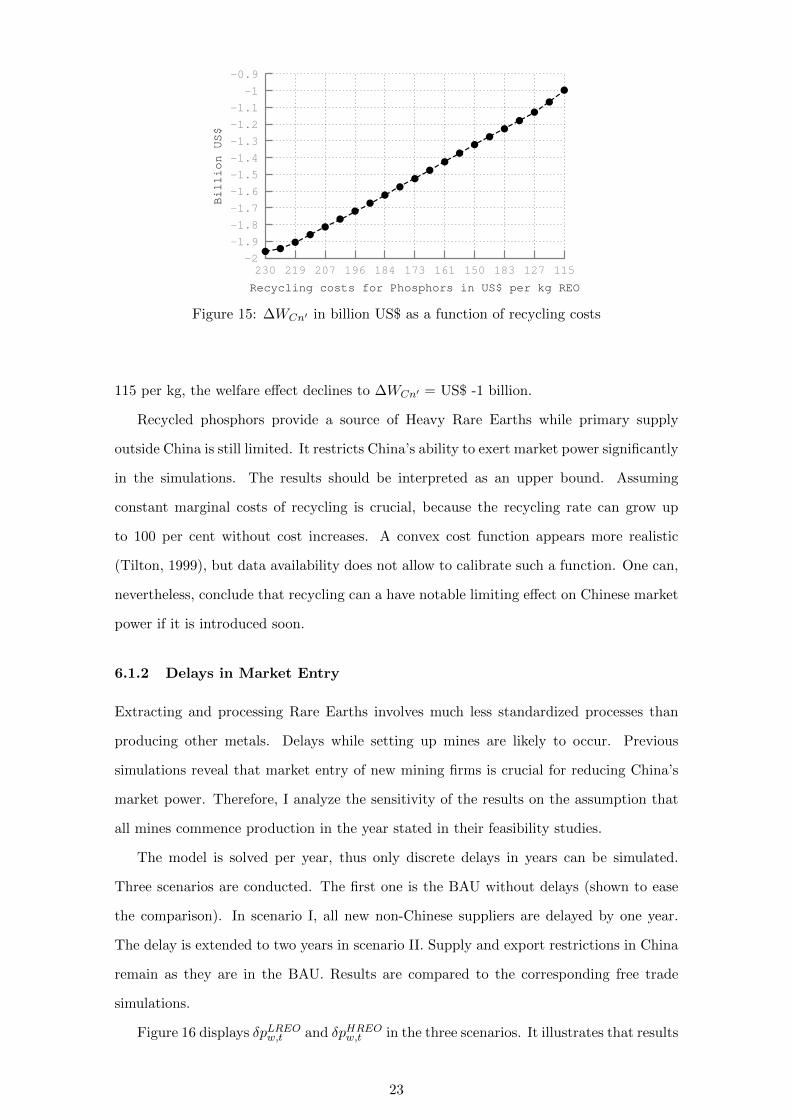
Introducing recycling of phosphors reduces welfare losses due to Chinese export re-
strictions. Figure 15 displays ∆WCn′ as a function of recycling costs. Note that reduced
environmental externalities due to less mining are neglected and that cost reductions are
assumed to be costless themselves. Welfare effects of introducing recycling of phosphors
are expected to be substantial. If assuming costs of US$ 230 per kg, welfare changes
remain the same as in the BAU (∆WCn′ = US$ -1.96 billion). If costs are reduced to US$
22
-2
-1.9
-1.8
-1.7
-1.6
-1.5
-1.4
-1.3
-1.2
-1.1
-1
-0.9
230 219 207 196 184 173 161 150 183 127 115
Billion US$
Recycling costs for Phosphors in US$ per kg REO
Figure 15: ∆WCn′ in billion US$ as a function of recycling costs
115 per kg, the welfare effect declines to ∆WCn′ = US$ -1 billion.
Recycled phosphors provide a source of Heavy Rare Earths while primary supply
outside China is still limited. It restricts China’s ability to exert market power significantly
in the simulations. The results should be interpreted as an upper bound. Assuming
constant marginal costs of recycling is crucial, because the recycling rate can grow up
to 100 per cent without cost increases. A convex cost function appears more realistic
(Tilton, 1999), but data availability does not allow to calibrate such a function. One can,
nevertheless, conclude that recycling can a have notable limiting effect on Chinese market
power if it is introduced soon.
6.1.2 Delays in Market Entry
Extracting and processing Rare Earths involves much less standardized processes than
producing other metals. Delays while setting up mines are likely to occur. Previous
simulations reveal that market entry of new mining firms is crucial for reducing China’s
market power. Therefore, I analyze the sensitivity of the results on the assumption that
all mines commence production in the year stated in their feasibility studies.
The model is solved per year, thus only discrete delays in years can be simulated.
Three scenarios are conducted. The first one is the BAU without delays (shown to ease
the comparison). In scenario I, all new non-Chinese suppliers are delayed by one year.
The delay is extended to two years in scenario II. Supply and export restrictions in China
remain as they are in the BAU. Results are compared to the corresponding free trade
simulations.
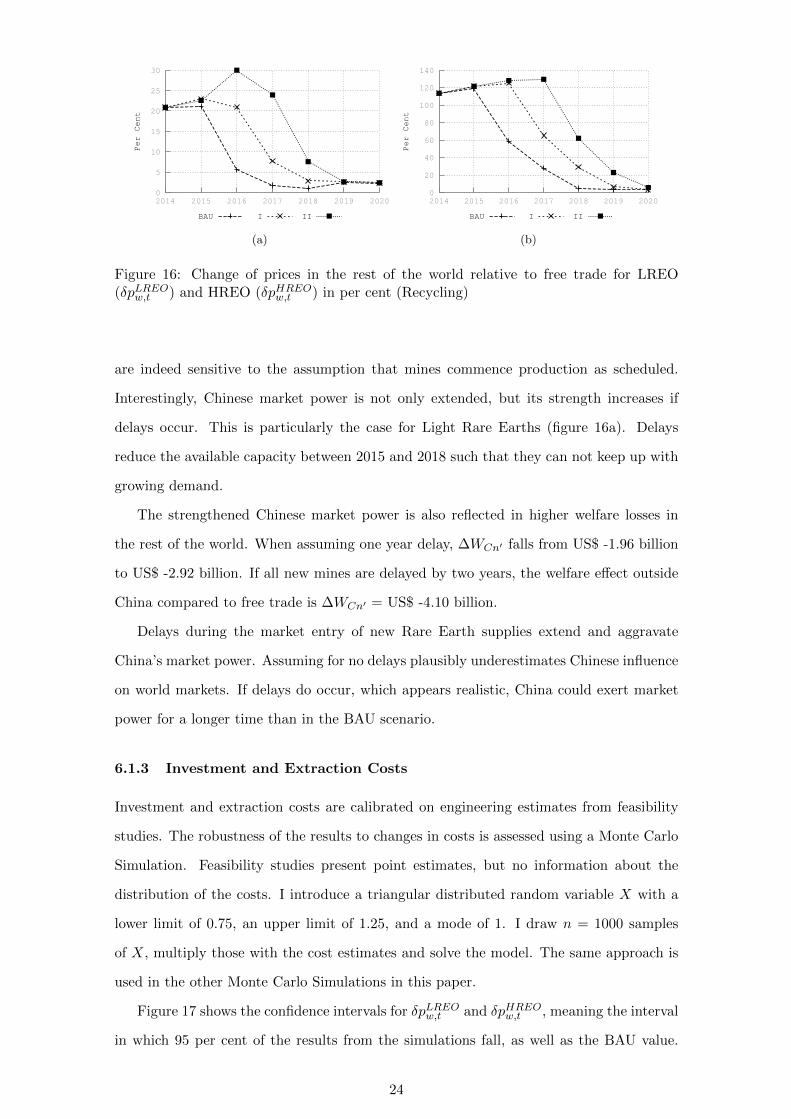
Figure 16 displays δpLREOw,t and δpHREO
w,t in the three scenarios. It illustrates that results
23
0
5
10
15
20
25
30
2014 2015 2016 2017 2018 2019 2020
Per Cent
BAU I II
(a)
0
20
40
60
80
100
120
140
2014 2015 2016 2017 2018 2019 2020
Per Cent
BAU I II
(b)
Figure 16: Change of prices in the rest of the world relative to free trade for LREO(δpLREO
w,t ) and HREO (δpHREOw,t ) in per cent (Recycling)
are indeed sensitive to the assumption that mines commence production as scheduled.
Interestingly, Chinese market power is not only extended, but its strength increases if
delays occur. This is particularly the case for Light Rare Earths (figure 16a). Delays
reduce the available capacity between 2015 and 2018 such that they can not keep up with
growing demand.
The strengthened Chinese market power is also reflected in higher welfare losses in
the rest of the world. When assuming one year delay, ∆WCn′ falls from US$ -1.96 billion
to US$ -2.92 billion. If all new mines are delayed by two years, the welfare effect outside
China compared to free trade is ∆WCn′ = US$ -4.10 billion.
Delays during the market entry of new Rare Earth supplies extend and aggravate
China’s market power. Assuming for no delays plausibly underestimates Chinese influence
on world markets. If delays do occur, which appears realistic, China could exert market
power for a longer time than in the BAU scenario.
6.1.3 Investment and Extraction Costs
Investment and extraction costs are calibrated on engineering estimates from feasibility
studies. The robustness of the results to changes in costs is assessed using a Monte Carlo
Simulation. Feasibility studies present point estimates, but no information about the
distribution of the costs. I introduce a triangular distributed random variable X with a
lower limit of 0.75, an upper limit of 1.25, and a mode of 1. I draw n = 1000 samples
of X, multiply those with the cost estimates and solve the model. The same approach is
used in the other Monte Carlo Simulations in this paper.
Figure 17 shows the confidence intervals for δpLREOw,t and δpHREO
w,t , meaning the interval
in which 95 per cent of the results from the simulations fall, as well as the BAU value.
24
-5
0
5
10
15
20
25
2014 2015 2016 2017 2018 2019 2020
Per
cent
Q2.5 BAU Q97.5
(a)
0
20
40
60
80
100
120
140
2014 2015 2016 2017 2018 2019 2020
Per
cent
Q2.5 BAU Q97.5
(b)
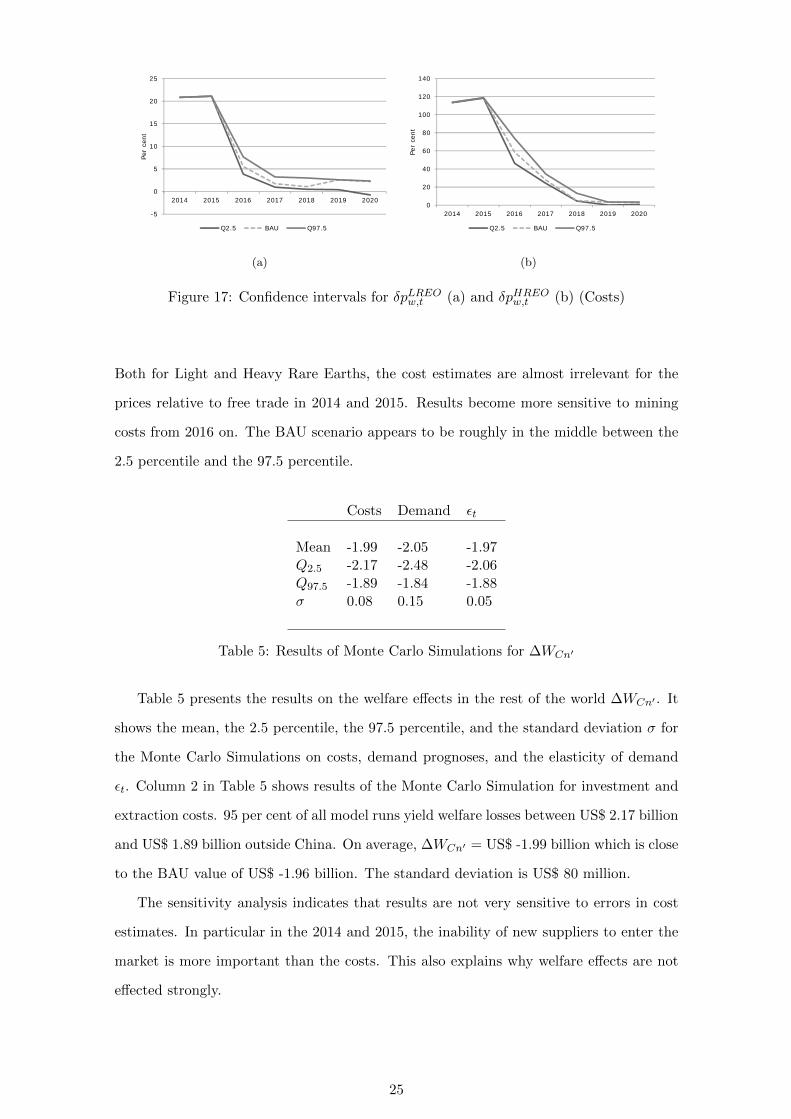
Figure 17: Confidence intervals for δpLREOw,t (a) and δpHREO
w,t (b) (Costs)
Both for Light and Heavy Rare Earths, the cost estimates are almost irrelevant for the
prices relative to free trade in 2014 and 2015. Results become more sensitive to mining
costs from 2016 on. The BAU scenario appears to be roughly in the middle between the
2.5 percentile and the 97.5 percentile.
Costs Demand εt
Mean -1.99 -2.05 -1.97Q2.5 -2.17 -2.48 -2.06Q97.5 -1.89 -1.84 -1.88σ 0.08 0.15 0.05
Table 5: Results of Monte Carlo Simulations for ∆WCn′
Table 5 presents the results on the welfare effects in the rest of the world ∆WCn′ . It
shows the mean, the 2.5 percentile, the 97.5 percentile, and the standard deviation σ for
the Monte Carlo Simulations on costs, demand prognoses, and the elasticity of demand
εt. Column 2 in Table 5 shows results of the Monte Carlo Simulation for investment and
extraction costs. 95 per cent of all model runs yield welfare losses between US$ 2.17 billion
and US$ 1.89 billion outside China. On average, ∆WCn′ = US$ -1.99 billion which is close
to the BAU value of US$ -1.96 billion. The standard deviation is US$ 80 million.
The sensitivity analysis indicates that results are not very sensitive to errors in cost
estimates. In particular in the 2014 and 2015, the inability of new suppliers to enter the
market is more important than the costs. This also explains why welfare effects are not
effected strongly.
25
6.2 Parameters Affecting Demand for Rare Earths
6.2.1 Demand Prognoses
The demand functions are calibrated on the prognoses by Kingsnorth (2012). The ro-
bustness of the results to changes in demand is scrutinized in this sensitivity analyses.
A Monte Carlo Simulation is applied. Again, a triangular distributed random variable
(lower limit 0.75, upper limit 1.25, mode 1) is assumed for, n = 1000 samples are drawn
and multiplied with the demand prognosis.
-10
-5
0
5
10
15
20
25
2014 2015 2016 2017 2018 2019 2020
Per
cent
Q2.5 BAU Q97.5
(a)
0
20
40
60
80
100
120
140
2014 2015 2016 2017 2018 2019 2020
Per
cent
Q2.5 BAU Q97.5
(b)
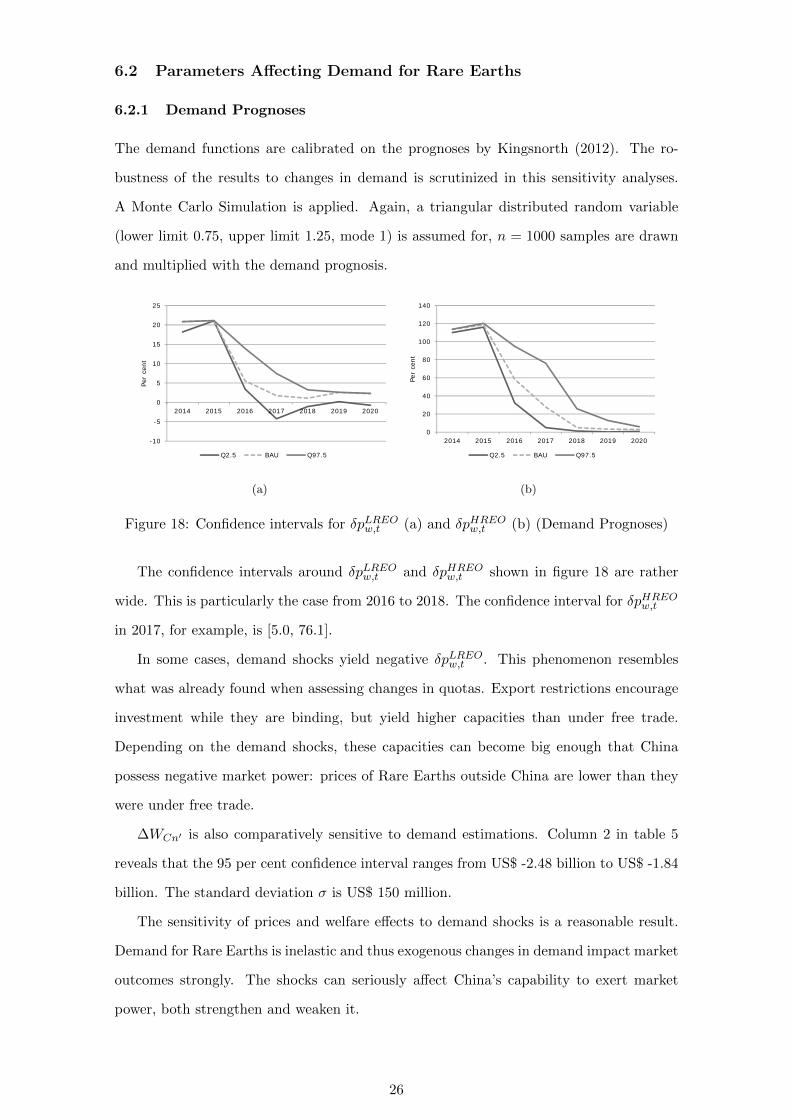
Figure 18: Confidence intervals for δpLREOw,t (a) and δpHREO
w,t (b) (Demand Prognoses)
The confidence intervals around δpLREOw,t and δpHREO
w,t shown in figure 18 are rather
wide. This is particularly the case from 2016 to 2018. The confidence interval for δpHREOw,t
in 2017, for example, is [5.0, 76.1].
In some cases, demand shocks yield negative δpLREOw,t . This phenomenon resembles
what was already found when assessing changes in quotas. Export restrictions encourage
investment while they are binding, but yield higher capacities than under free trade.
Depending on the demand shocks, these capacities can become big enough that China
possess negative market power: prices of Rare Earths outside China are lower than they
were under free trade.
∆WCn′ is also comparatively sensitive to demand estimations. Column 2 in table 5
reveals that the 95 per cent confidence interval ranges from US$ -2.48 billion to US$ -1.84
billion. The standard deviation σ is US$ 150 million.
The sensitivity of prices and welfare effects to demand shocks is a reasonable result.
Demand for Rare Earths is inelastic and thus exogenous changes in demand impact market
outcomes strongly. The shocks can seriously affect China’s capability to exert market
power, both strengthen and weaken it.
26
6.2.2 Price Elasticity of Demand
The last Monte Carlo Simulation investigates the robustness of the results to the assump-
tion that the price elasticity of demand grows εt = −0.3 to εt = −0.5 in 2020. It is
conducted analogously to the previous ones. n = 1000 samples are drawn from a trian-
gular distributed random variable (lower limit 0.75, upper limit 1.25, mode 1), multiplied
with εt and the model is solved.
0
5
10
15
20
25
2014 2015 2016 2017 2018 2019 2020
Per
cent
Q2.5 BAU Q97.5
(a)
0
20
40
60
80
100
120
140
2014 2015 2016 2017 2018 2019 2020Pe
r ce
ntQ2.5 BAU Q97.5
(b)
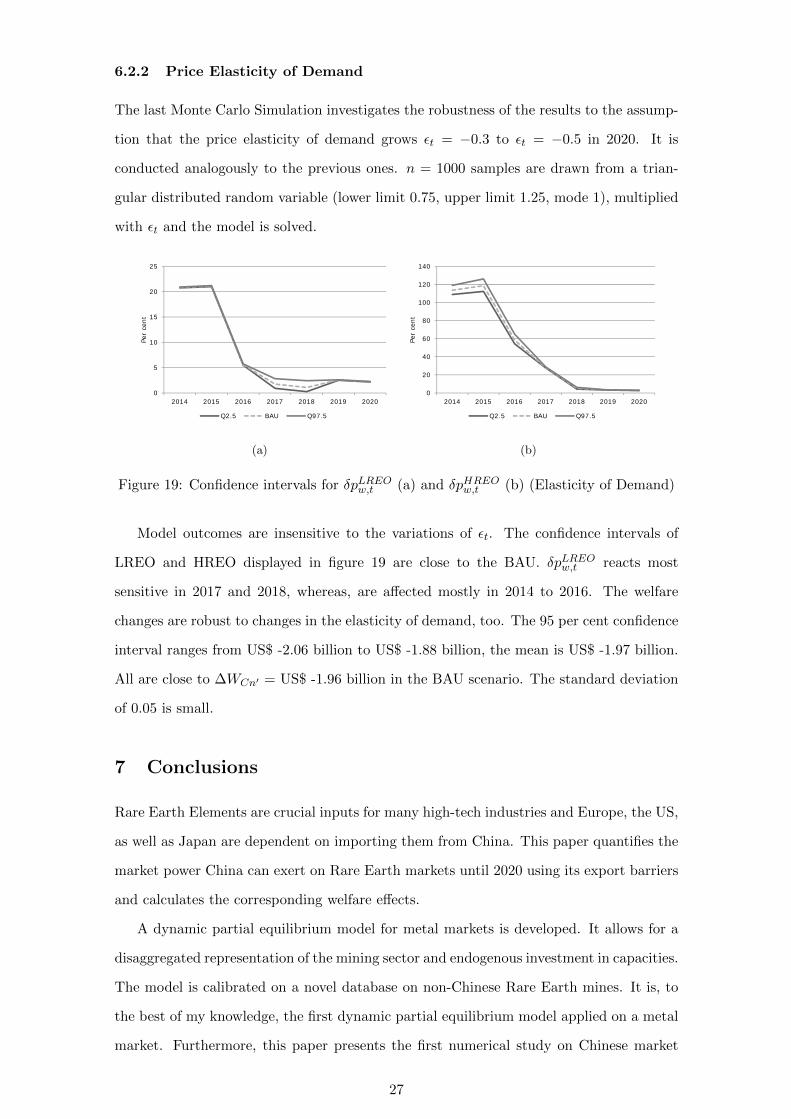
Figure 19: Confidence intervals for δpLREOw,t (a) and δpHREO
w,t (b) (Elasticity of Demand)
Model outcomes are insensitive to the variations of εt. The confidence intervals of
LREO and HREO displayed in figure 19 are close to the BAU. δpLREOw,t reacts most
sensitive in 2017 and 2018, whereas, are affected mostly in 2014 to 2016. The welfare
changes are robust to changes in the elasticity of demand, too. The 95 per cent confidence
interval ranges from US$ -2.06 billion to US$ -1.88 billion, the mean is US$ -1.97 billion.
All are close to ∆WCn′ = US$ -1.96 billion in the BAU scenario. The standard deviation
of 0.05 is small.
7 Conclusions
Rare Earth Elements are crucial inputs for many high-tech industries and Europe, the US,
as well as Japan are dependent on importing them from China. This paper quantifies the
market power China can exert on Rare Earth markets until 2020 using its export barriers
and calculates the corresponding welfare effects.
A dynamic partial equilibrium model for metal markets is developed. It allows for a
disaggregated representation of the mining sector and endogenous investment in capacities.
The model is calibrated on a novel database on non-Chinese Rare Earth mines. It is, to
the best of my knowledge, the first dynamic partial equilibrium model applied on a metal
market. Furthermore, this paper presents the first numerical study on Chinese market
27
power on Rare Earths.
The results show that China’s market power is of temporary nature. The decline of
market power differs by type of Rare Earth. Assuming for export restrictions to remain as
they are in 2013, the People’s Republic increases prices for Light Rare Earths in the rest
of the world by 21 per cent compared to free trade in 2014 and 2015. China’s capability
to exert market power declines quickly thereafter due to market entry of new suppliers.
Market power is more persistent for Heavy Rare Earths. Status-quo export barriers
more than double prices outside China in 2014 and 2015. China’s market power only
vanishes by the end of the decade. Non-Chinese Heavy Rare Earth producers have longer
lags until they are able to commence production, thus China’s monopoly is less contested
by foreign suppliers. Current Chinese export restrictions imply a welfare loss of US$ 1.96
billion outside China until 2020.
Altering export restrictions or varying Chinese production yields different levels of
exerted market power. Tightening export quotas is very effective in the short run and
implies strong welfare effects. But it also induces investment in new capacities, slightly
reducing Chinese market power in the long run. Increasing or decreasing export tariffs has
less strong but more long-lasting effects. Expanding Chinese Rare Earth output increases
market power because it tightens existing export barriers in the short run and crowds out
non-Chinese supply in the long run. Introducing recycling attenuates Chinas power on
Rare Earth markets, but it has to commence quickly to have major effects.
The results are robust to changes in most key parameters. Varying investment and
extraction costs as well as the price elasticity of demand for Rare Earths do not change the
model’s results strongly. Delays while opening up new mines allow China to exert market
power more persistently. Chinese market power depends considerably on the exogenous
growth of demand for Rare Earths, however.
Two policy conclusions can be drawn from the results of this paper. Firstly, market
forces will plausibly erode Chinese power on Rare Earth markets until the end of the
decade. All attempts to introduce recycling, to increase resource efficiency, or to foster
substitution need to take this into account. Shortsighted measures relying on high prices
levels are likely to be fruitless. Secondly, power on raw material markets is not permanent,
but sluggish investment in mining capacities opens up windows of opportunity for nations
to influence prices. This calls for a long-term approach in raw material policies. Affected
firms, for example, should diversify their inputs to avoid being dependent on a small
number of suppliers.
28
In this study, Chinese behavior was assumed to be exogenous. This assumptions
allows to reduce modeling uncertainties and to get a clear picture of China’s leeway to
exert market power. To get a deeper understanding of Chinese behavior, optimal policies
should be be derived from an optimizing calculus in further research. Models analyzing the
optimal behavior of a large resource supplier facing competition from small, price-taking
(fringe) suppliers (Salant, 1976; Pindyck, 1978; Groot et al., 2003) could be applied.
8 References
Adelman, M. A. (1990). Mineral Depletion, with Special Reference to Petroleum. Reviewof Economics and Statistics, 72(1):1–10.
Agostini, C. A. (2006). Estimating Market Power in the US Copper Industry. Review ofIndustrial Organization, 28(1):17–39.
Alonso, E., Sherman, A. M., Wallington, T. J., Everson, M. P., Field, F. R., Roth, R.,and Kirchain, R. E. (2012). Evaluating Rare Earth Element Availability: A Case withRevolutionary Demand from Clean Technologies. Environmental Science & Technology,46(6):3406–3414.
Cairns, R. D. (2001). Capacity Choice and the Theory of the Mine. Environmental andResource Economics, 18(1):129–148.
Demailly, D. and Quirion, P. (2008). European Emission Trading Scheme and competitive-ness: A case study on the iron and steel industry. Energy Economics, 30(4):2009–2027.
Dirkse, S. P. and Ferris, M. C. (1995). The PATH Solver: A Non-Monotone StabilizationScheme for Mixed Complementarity Problems. Optimization Methods and Software,5(2):123–156.
Du, X. and Graedel, T. E. (2011). Uncovering the Global Life Cycles of the Rare EarthElements. Scientific Reports, 1.
EU Commission (2010). Critical raw materials for the EU. Report of the Ad-hoc WorkingGroup on defining critical raw materials. Technical report.
EU Commission (2011). Tackling the Challenges in Commodity Markets and on RawMaterials. COM(2011) 25 final. Technical report.
Fisher, F. M., Cootner, P. H., and Baily, M. N. (1972). An Econometric Model of theWorld Copper Industry. Bell Journal of Economics, 3(2):568–609.
Fisher, L. and Owen, A. (1981). An economic model of the US aluminium market. Re-sources Policy, 7(3):150–160.
Groot, F., Withagen, C., and de Zeeuw, A. (2003). Strong time-consistency in the cartel-versus-fringe model. Journal of Economic Dynamics and Control, 28(2):287–306.
Gupta, C. K. and Krishnamurthy, N. (2005). Extractive Metallurgy Of Rare Earths. CRCPress.
Gupta, S. (1982). An econometric analysis of the world zinc market. Empirical Economics,7(1):213–237.
29
Hatch, G. (2012a). August 2012 Updates To The TMR Advanced Rare-Earth ProjectsIndex.
Hatch, G. (2012b). The Final Chinese Rare-Earth Export-Quota Allocations For 2012.
Hatch, G. (2012c). The First Round Of Chinese Rare-Earth Export-Quota AllocationsFor 2013.
Hatch, G. (2013a). The Second Round of Chinese Rare-Earth Export-Quota Allocationsfor 2013.
Hatch, G. (2013b). TMR Advanced Rare-Earth Projects Index. July 24, 2013 Update.Technical report.
Holland, S. P. (2003). Set-up costs and the existence of competitive equilibrium whenextraction capacity is limited. Journal of Environmental Economics and Management,46(3):539–556.
Hurst, C. (2010). Chinas Rare Earth Elements Industry: What Can the West Learn?Technical report, Institute for the Analysis of Global Security.
Kessides, I. N. (1990). Market Concentration, Contestability, and Sunk Costs. Review ofEconomics and Statistics, 72(4):614–622.
Kingsnorth, D. J. (2012). The Global Rare Earths Industry: A Delicate Balancing Act.Technical report, Deutsche Rohstoffagentur.
Korinek, J. and Kim, J. (2010). Export Restrictions on Strategic Raw Materials and TheirImpact on Trade and Global Supply. Trade Policy Working Papers. OECD Publishing.
Lanz, B., Rutherford, T. F., and Tilton, J. E. (2013). Subglobal Climate Agreements andEnergy-intensive Activities: An Evaluation of Carbon Leakage in the Copper Industry.World Economy, 36(3):254–279.
Liu, H.-W. and Maughan, J. (2012). China’s Rare Earths Export Quotas: Out of theChina-Raw Materials Gate, But Past the WTO’s Finish Line? Journal of InternationalEconomic Law, 15(4):971–1005.
Mackenzie, W. and Cusworth, N. (2007). The Use and Abuse of Feasibility Studies. InAusIMM Project Evaluation Conference, Melbourne, Australia. Australasian Instituteof Mining and Metallurgy.
Meyer, L. and Bras, B. (2011). Rare earth metal recycling. In Sustainable Systems andTechnology (ISSST), 2011 IEEE International Symposium on, pages 1–6.
Noort, D. J. and Adams, C. (2006). Effective Mining Project Management Systems.In International Mine Management Conference. Australasian Institute of Mining andMetallurgy.
Pindyck, R. S. (1978). Gains to Producers from the Cartelization of Exhaustible Re-sources. Review of Economics and Statistics, 60(2):238–251.
Pothen, F. (2013). The Metal Resources (METRO) Model. A Dynamic Partial Equilib-rium Model for Metal Markets Applied to Rare Earth Elements. Technical report, ZEWDiscussion Paper No. 13-112, Mannheim.
Pothen, F. and Fink, K. (2013). The Political Economy of China’s Export Restrictionson Rare Earth Elements. Technical report, Unpublished Work.
Rudenno, V. (2009). The Mining Valuation Handbook. Mining and Energy Valuation forInvestors and Management. Wrightbooks, 3rd edition.
30
Salant, S. W. (1976). Exhaustible Resources and Industrial Structure: A Nash-CournotApproach to the World Oil Market. Journal of Political Economy, 84(5):1079–1094.
Schuler, D., Buchert, M., Liu, R., Dittrich, S., and Merz, C. (2011). Study on Rare Earthsand Their Recycling. Oko-Institut, Darmstadt.
SCIO (2012). Situation and Policies of China’s Rare Earth Industry. Technical report.
Slade, M. E. (1980). The effects of higher energy prices and declining ore quality: Cop-peraluminium substitution and recycling in the USA. Resources Policy, 6(3):223–239.
Tilton, J. E. (1999). The future of recycling. Resources Policy, 25(3):197–204.
Tse, P.-K. (2011). Chinas Rare-Earth Industry. Technical report, U.S. Geological SurveyReport 20111042.
U.S. Department of Energy (2011). Critical Materials Strategy. Technical report.
U.S. Geological Survey (2011). Rare Earth Elements. End Use and Recyclability. Technicalreport, U.S. Geological Survey.
U.S. Geological Survey (2012). Global Rare Earth Oxide (REO) Production Trends.Technical report.
U.S. Geological Survey (2013). Mineral Commodity Summaries 2013 - Rare Earths. Tech-nical report.
Winters, L. (1995). Liberalizing European steel trade. European Economic Review,39(34):611–621.
WTO (2012). China Measures Related to the Exportation of Rare Earths, Tungstenand Molybdenum. Request for Consultations by the United States. Technical report,WT/DS431/6.
Wubbeke, J. (2013). Rare earth elements in China: Policies and narratives of reinventingan industry. Resources Policy, 38(3):384–394.
31