Embed Size (px)
Citation preview
Accepted Manuscript
Title: Dynamic Failure Assessment of an Ammonia StorageUnit: A Case Study
Author: Arnab Roy Prashant Srivastava Shishir Sinha
PII: S0957-5820(14)00148-7DOI: http://dx.doi.org/doi:10.1016/j.psep.2014.09.004Reference: PSEP 481
To appear in: Process Safety and Environment Protection
Received date: 2-6-2014Revised date: 12-9-2014Accepted date: 22-9-2014
Please cite this article as: Roy, A., Srivastava, P., Sinha, S., Roy, A.,DynamicFailure Assessment of an Ammonia Storage Unit: A Case Study, Process Safety andEnvironment Protection (2014), http://dx.doi.org/10.1016/j.psep.2014.09.004
This is a PDF file of an unedited manuscript that has been accepted for publication.As a service to our customers we are providing this early version of the manuscript.The manuscript will undergo copyediting, typesetting, and review of the resulting proofbefore it is published in its final form. Please note that during the production processerrors may be discovered which could affect the content, and all legal disclaimers thatapply to the journal pertain.
Page 1 of 50
Accep
ted
Man
uscr
ipt
Highlights for Review:
The study shows the variation of failure probabilities of the associated safety systems.
The study shows the use of DFA tools in conducting an effective failure assessment study of
a utility in Storage Unit.
The method can be detected the vulnerable areas which help to prevent escalation of an
abnormal event to a major accident.
Abnormal scenarios have been analyzed in term of probability of tank failure in presence of safety barriers.
Page 2 of 50
Accep
ted
Man
uscr
ipt
Dynamic Failure Assessment of an Ammonia Storage Unit: A Case Study
Arnab Roy1, Prashant Srivastava2, Shishir Sinha*
Arnab Roy
Department of Chemical Engineering,
Indian Institute of Technology, Roorkee,
Roorkee-247667 (India)
Corresponding Email: [email protected]
Prashant Srivastava
Department of CoEDMM,
Indian Institute of Technology, Roorkee,
Roorkee-247667 (India)
Shishir Sinha
Department of Chemical Engineering,
Indian Institute of Technology, Roorkee,
Roorkee-247667 (India)
Abstract:
Chemical Process Industries usually contain a diverse inventory of hazardous chemicals and
complex systems required to perform process operations such as storage, separation, reaction,
compression etc. The complex interactions between the equipment make them vulnerable to
catastrophic accidents. Risk and failure assessment provide engineers with an intuitive tool
for decision making in the operation of such plants. Abnormal events and near-miss situations
occur regularly during the operation of a system. Accident Sequence Precursors (ASP) can
be used to demonstrate the real-time operating condition of a plant. Dynamic Failure
Assessment (DFA) methodology is based on Bayesian statistical methods incorporates ASP
data to revise the generic failure probabilities of the systems during its operational lifetime.
In this paper, DFA methodology is applied on an ammonia storage unit in a specialized
chemical industry. Ammonia is stored in cold storage tanks as liquefied gas at atmospheric
pressure. These tanks are susceptible to failures due to various abnormal conditions arising
due process failures.
Page 3 of 50
Accep
ted
Man
uscr
ipt
Tank failures due to three such abnormal conditions are considered. Variation of the failure
probability of the safety systems is demonstrated. The authors use ASP data collected from
plant specific sources and safety expert judgement. The failure probabilities of some safety
systems concerned show considerable deviation from the generic values. The method helps to
locate the components which have undergone more degradation over the period and hence
must be paid attention to. In addition, a Bayesian predictive model has been used to predict
the number of abnormal events in the next time interval. The user-friendly and intuitive
nature of the tool makes it appropriate for application in safety assessment reports in process
industries.
Keywords: Dynamic failure assessment, Bayesian theory, Ammonia tank failure, Abnormal
event, Accident sequence precursor
Introduction:
Over the last few decades chemical products have become ubiquitous in everyday life of
humans. Their scope of usage ranges from quotidian paper clips to highly complex
engineering marvels such as space shuttles. To meet the surging demand for chemical
products prodigious plants are being built. The operating conditions inside these plants are
intense and complex interactions exist between the various systems and sub-systems. A brief
survey of history will reveal that subsystem or single component failure have often led to
catastrophic consequences and huge financial losses such as the Bhopal tragedy (Eckerman,
2005), the vapour cloud explosion at Flixborugh (Crowl & Louvar, 2002) , fertilizer plant
explosion at Toulouse, France, BP Texas City oil refinery accident (Kalantarnia et al., 2010).
Consequently a lot of researches have been conducted to develop a robust risk assessment
methodology for process industries (Knegtering & Pasman, 2013).
A large variety of risk assessment tools exist which have both qualitative and quantitative
properties. As Kirchsteiger (1997) pointed out risk analysis is concerned with the
reconstruction of reality to identify the causes of accidents either in a quantitative or in a
qualitative way.
The complexity of processes in chemical industries calls for a risk assessment tool which can
adapt to the dynamics of the environment and properly portray the temporal aspects (Labeau
et al., 2000). These include modelling of sequential failures, dependencies between
Page 4 of 50
Accep
ted
Man
uscr
ipt
components, effects of degradations and exogenous constraints and variability in the
operating conditions. To account for these variations which occur almost regularly during the
lifetime of the system, the tool should be able to induct new information (Khakzad et al.,
2013c). This makes it applicable not only at the design stage but also during operational
lifetime of the system which forms a platform for real time decision making and risk
management (Pasman & Rogers, 2013).
The lack of formal data in conducting risk analysis in process industries is quite a hindrance
and has proved to be the biggest blight in conducting a proper safety assessment. Safety
analysts have to use a large amount of subjective information in their studies. Thus the
preferred tool must be able to use this subjective information formally to yield objective
results.
A number of modelling techniques have been developed for assessing the dynamic reliability
of complex systems. Dynamic fault trees (Dugan et al., 1992, Bucci et al., 2008, Chiaccio et
al., 2011) and Markov chains are notable mentions. Swaminathan and Smidts (1999)
proposed a technique to model dynamic characteristics of process operations using event
sequence diagrams (ESD). Luo and Hu (2013) used the ESD model to identify the critical
events and the evolution of risk in a system. Markov chains are extensively used for
dependability analysis and as an efficient tool for modelling dynamic behaviour (Bolch et al.,
1998). But their solutions often become intractable and erroneous. Khan and Abbasi, 2001
propose a risk assessment procedure named Operational Risk Assessment (ORA) for
chemical industries conducting both quantitative and qualitative analyses using different
tools. The same authors combine the Maximum Credible Accident Analysis (MCAA) tool
(Khan & Abbasi, 2002) for worst case scenario analysis and the PROFAT II tool coded in
Visual C+ (Khan & Abbasi, 2000) for fault tree quantification to form a safety assessment
procedure called SCAP (Safety Credible Accident Probabilistic fault-tree analysis) (Khan et
al., 2001, 2002).
2. Dynamic Failure Assessment methodology
The conventional quantitative safety assessment techniques are static in nature in the view
that that they employ generic data for calculations. These data are usually insufficient to
highlight plant-specific problems. The operating conditions of a process plant calls for a risk
assessment tool which can adapt to the dynamics of the plant like the effects of process
variables on the systems and failure-on-demand. Thus dynamic reliability has become a
Page 5 of 50
Accep
ted
Man
uscr
ipt
subject of constant research among safety analysts (Aldemir et al. 1994, Devooght and
Smidts, 1992, 1996, Siu, 1994). Computational methods involving Monte Carlo simulations
have been developed (Marseguerra and Zio, 1996, Marseguerra et al., 1998). However, these
methods require a considerable amount of mathematical knowledge and complex
calculations. As in any other commercial activity, time is the most important factor during
operation of a process plant. Thus, the use of conventional quantitative risk assessment
methods, which has gained maturity over the years of research, is very common in safety
assessment report of process plants. But these methods do not take into account the dynamic
operating conditions of the plant and usually yield generic results. Thus plant specific
problems are not highlighted. The authors seek to present a safety assessment tool which is
one hand user friendly and on the other can sufficiently adapt to the plant dynamics to
identify the plant specific vulnerable areas. Dynamic Failure Assessment methodology
proposed by Meel and Seider (2006) can adapt to the dynamic conditions of a process plant
by incorporating plant-specific near-miss and incident data. Dynamic failure probabilities of
accident sequences are calculated which gives a real time scenario of the operating conditions
in a process plant. The safety department of process plants can use the tool to identify the
systems which are more prone to failure during their yearly maintenance assessment reports.
Once the potential systems have been identified, methods involving Monte Carlo simulations
and DFTs can be used to assess the effect of process variables such as temperature, stress
level, component and other design aspects. Plant specific near misses and incidents which are
known as Accident Sequence Precursors (ASPs) data are used to update the generic failure
probabilities of components using Bayes Theorem thus yielding results which are plant
specific in nature. Consequently the end state probabilities are also updated giving a realistic
picture of the safety profile of the plant
Dynamic failure assessment may be implemented in a system unit in the following steps,
Step 1: Scenario identification: This step identifies the most likely scenario, type of failures
and end-states associated with the scenario.
Step 2: Prior function calculation: Using generic data the design stage or prior failure
probabilities are calculated.
Step 3: Formation of the likelihood function: Incident and near misses i.e. accident sequence
precursors are used in this stage to update the prior failure probability functions
Page 6 of 50
Accep
ted
Man
uscr
ipt
Step 4: Posterior function calculation: Bayesian theory is used to calculate the posterior
function using prior and likelihood functions.
Step 5: Consequence analysis is conducted on the scenario to estimate the potential
consequences of all possible end states.
In addition a Bayesian predictive method is used to estimate the number of events in the next
time interval. The details of the method are elucidated further in the subsequent sections.
Kalantarnia et al. (2009) uses the DFA methodology in safety analysis of a storage tank
containing hazardous chemicals. Comparison study with standard Probabilistic Risk
Assessment techniques demonstrates the efficiency of the method to model real time failure
frequency during lifetime of the process unit. The efficiency of the dynamic risk assessment
methodology is further witnessed in Kalantarnia et al. (2010) where it is used to assess the
data from the BP Texas City incident. Meel et al. (2007) investigate and analyse the NRC
database using the abovementioned methodology. The NRC database contains reports about
oil, chemical and biological environmental discharges (NRC) (http://www.nrc.gov/). In
Pariyani et al. (2010) dynamic data collected from Distributed Control Systems (DCS) and
Emergency Shutdown (ESD) systems are used as ASP data for dynamic risk analysis of an
industrial FCCU unit. Pariyani et al. (2012a, b) uses the dynamic failure analysis
methodology by using data recorded in emergency shutdown (ESD) and distributed control
systems (DCS) to increase process safety and product quality.
In this paper, the authors conduct a dynamic failure assessment of a cryogenic ammonia
storage unit in a speciality chemical industry. Ammonia is widely used in process industries
as a feedstock for nitrogen, refrigerant and also as sustainable power source. The low
Immediately Dangerous to Life and Health (IDLH) of 300 ppm and TLA-TWA (25 ppm)
value are indicative of Ammonia’s hazardous nature. Even a little exposure to Ammonia can
cause serious harm to the human body like burns, headaches and damage to eyes and lungs
(Griffiths and Megson, 1984). Ammonia is often involved in accidents, a fact buttressed by
its frequent mention in accidents notified to the Commission of European Communities under
the requirements of the SEVESO-directive (Drogaris, 1991). Ammonia have been subject to
many risk assessment studies (Aneziris et al., 2000, McGowan, 2000 ) but to the authors’ best
knowledge dynamic failure assessment of ammonia storage unit has not been performed as
yet. Dynamic reliability assessment of a storage unit of hazardous material has been
conducted using Petri Nets (Codetta-Raiteri, 2011) and Bayesian networks (Codetta-Raiteri
Page 7 of 50
Accep
ted
Man
uscr
ipt
and Portinale, 2014). This study shows the variation of failure probabilities of the associated
safety systems over the years and also identifies the areas which most vulnerable to accidents.
The rest of the paper is arranged as follow. The paper begins by describing the reference
system and identifying the pertinent abnormal conditions which can lead to tank failure in
Section 3. The effects of each abnormal condition are assessed and dynamic failure
assessment is conducted on them in separate sections (Section 4, 5 and 6). Section 7 presents
the Sensitivity analysis. The paper concludes with a discussion on the results of the study and
present suggestions for future work.
3. System Description:
Cold storage tanks are used widely in chemical process industries to store large amount of
liquefied gas at atmospheric pressure. Demand of the liquefied gas and the viability of the
construction cost are the major factors in designing such storage units. The capacity of the
storage facilities generally vary between 10,000 to 120,000 m3. The failure probability rises
proportionally with the increase in size of the tank. The reference unit is a liquefied ammonia
storage unit in a specialized chemical plant with capacity of 20,000m3.
As mentioned earlier ammonia is very hazardous in nature. It exists as gas in normal
conditions and can be liquefied by reducing temperature or increasing pressure. Three types
of storage facilities are commonly used:
(a) Storage under pressure in spherical vessels
(b) Storage at ambient temperature and equivalent pressure in cylindrical vessels and
(c) Storage at atmospheric pressure under cryogenic conditions.
The storage facilities are quite susceptible to failures which lead to the release of a large
amount of ammonia into the atmosphere. Releases of high magnitude can cause serious
consequences including injuries and fatalities as well as financial losses.
Page 8 of 50
Accep
ted
Man
uscr
ipt
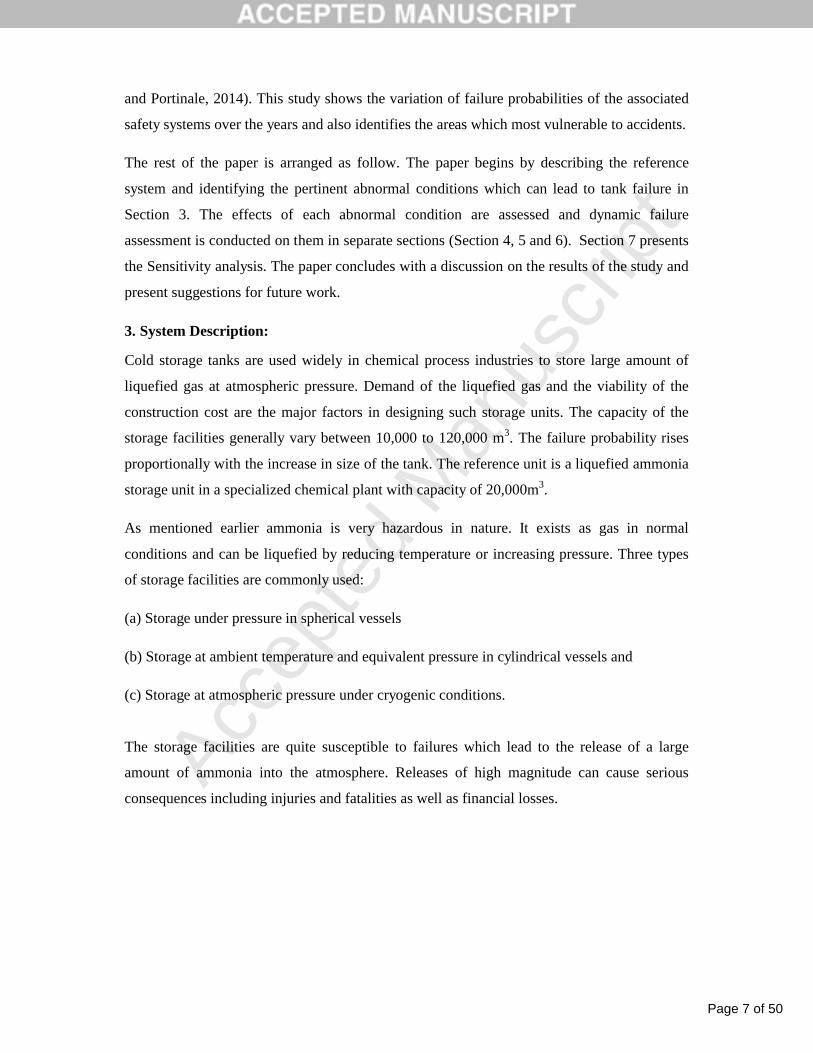
Fig. 1: Ammonia storage unit
The ammonia tank in question is a single containment double-walled facility with capacity of
20,000 m3 of liquefied ammonia stored at -33 degree C. The design temperature limits are -40
degree C to +48 degree C. The minimum and maximum tank design pressure is set equal to -
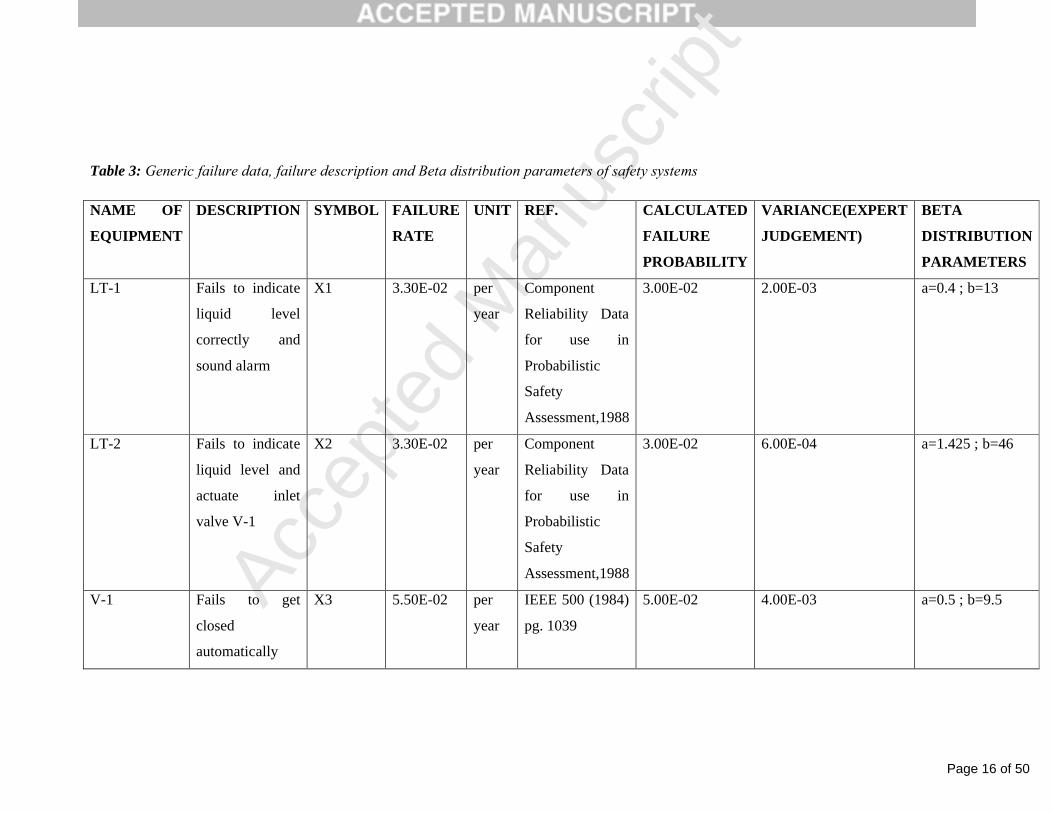
9.8 mbarg and 98 mbarg, respectively. Fig. 1 shows a schematic view of tank safety systems.
The abbreviations of each component have been brought in nomenclatures and are described
in Table 1.
Table 1: Symbol for major equipment
SYMBOL INSTRUMENT NAME
V Flow Control Valve
PSV Pressure Safety Valve
PT Pressure Transmitter
PAH Pressure Alarm High
PSLL Pressure Switch Very Low
Page 9 of 50
Accep
ted
Man
uscr
ipt
LT Level Transmitter
LAH Level Alarm High
PV Pressure Controlled Valve
For the specified tank, five abnormal events which can lead to a accident are specified:
• Ammonia release due to overfilling.
• Ammonia release due to over pressurization.
• Ammonia release due to under pressurization.
• Ammonia release due to rupture of the inlet loading line.
• Ammonia release due to rupture of the outlet loading line.
These five events are identified to be the major reasons of tank failure.
Dynamic failure assessment of the storage unit is carried out pertaining to the abnormal
events of overfilling, over pressurization and under pressurization scenarios due to the
unavailability of data in the case of the last two abnormal events.
4. Overfilling scenario and safety systems concerned:
The first abnormal scenario on which dynamic risk assessment is applied is the overfilling
scenario. This major potential hazardous scenario is chiefly caused due to overflowing of
materials in this case liquid ammonia through the input pipes. Referring to Fig.1 the safety
installations concerned with overfilling are the Level Transmitter 1(LT-1), Level Transmitter
2 (LT-2) and the input valve V-1.
When the liquefied ammonia level inside the tank reaches the high level (H.L), the level
transmitter LT-1 should indicate the high liquid level and sound the high level alarm, LAH.
Subject to the successful performance of these two safety systems, the concerned operator
can take relevant corrective action and normal operation can resume. If however the
instruments fail to perform or the operator fails to observe the warning, the liquid level inside
the tank increases. At this stage the liquid level reaches the very high level (V.H.L) and the
level transmitter LT-2 comes into action. LT-2 indicates the increasing liquid level inside the
tank and actuates inlet valve V-1 to close to check the inflow of liquid ammonia into the
overfilled tank. When LT-2 is successful, automatic shutdown occurs but if it fails to do so,
the operator must shut down the process i.e. close the valve V-1 manually.
Page 10 of 50
Accep
ted
Man
uscr
ipt
It is assumed that the process cannot be rectified back to its normal operational conditions
once the level inside has reached very high level (V.H.L) and LT-2 have been triggered.
The failure of all these safety layers results in the release of a vast amount of ammonia into
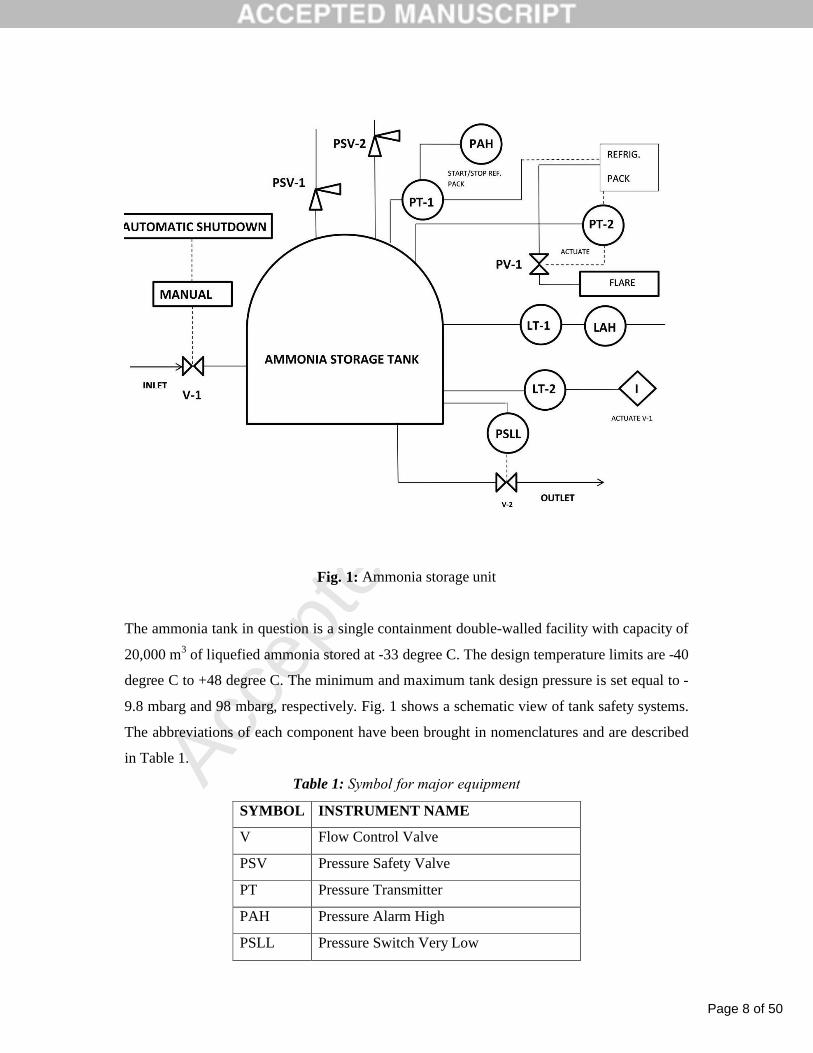
the atmosphere. To demonstrate this sequence of events in response to an overfilling scenario
and to examine their outcomes the event tree model is presented.
Fig 2: Event tree model of overfilling scenario in ammonia storage unit
4.1 Event Tree model for overfilling scenario:
The associated event tree model for the overfilling scenario in an ammonia storage unit is
shown in Fig. 2. The safety systems concerned with the overfilling situation are
chronologically arranged as LT-1, LT-2, automatic shutdown of inlet valve V-1and manual
shutdown of V-1. The end states are categorised according to the conditions of continued
operation (C1), shut down (C2) and tank failure due to overfilling (C3).
The failure probabilities of each safety system are presented in the lower branches of the
event tree model denoted by x1, x2, x3 and x4. It must be mentioned here that the failure
probabilities considered here are assumed to be independent of the consequences and the
performance of the prior safety barriers. It is true that consideration of interdependencies
between the failure of different events increases accuracy of the results. But, this method is
more effective and necessary when human factors are involved in the calculations. As this
Page 11 of 50
Accep
ted
Man
uscr
ipt
study mainly focuses on the failure of the safety systems, the failure probabilities are
considered to be independent. Meel and Seider (2006) provide a Bayesian Model which can
be used effectively to conduct dynamic failure assessment by taking correlation coefficients
and applying copula theory to model the interdependencies. However, that method will
require more exact data.
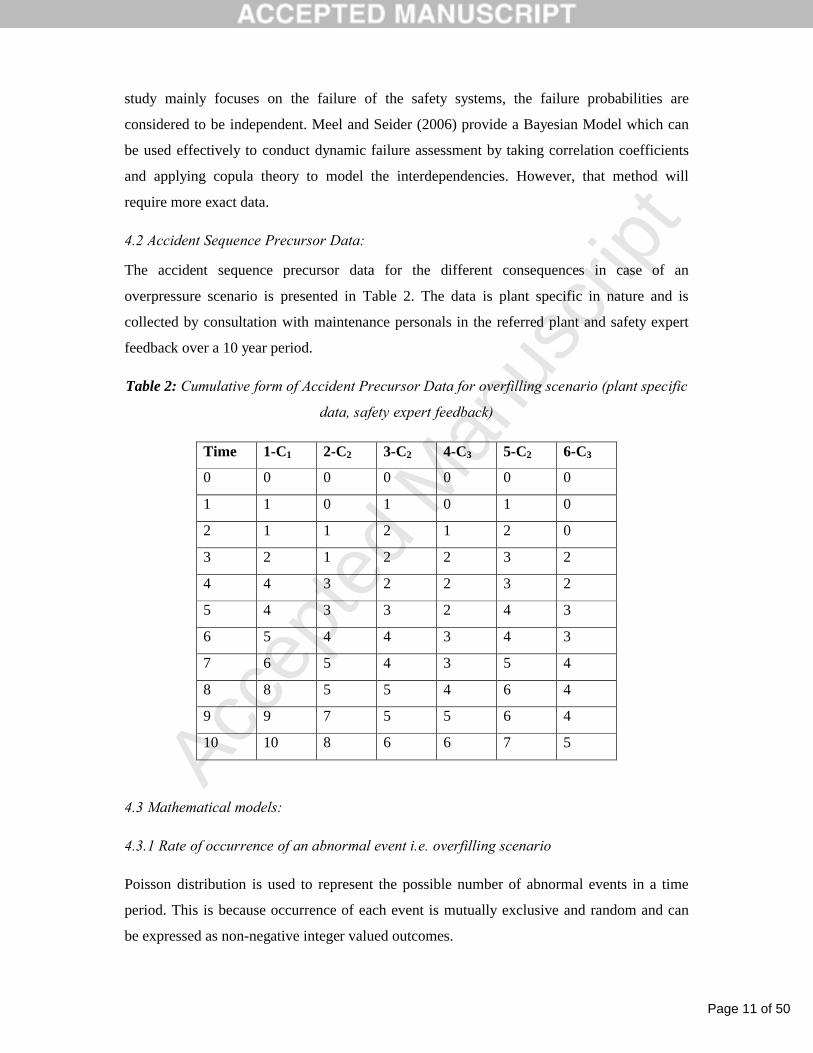
4.2 Accident Sequence Precursor Data:
The accident sequence precursor data for the different consequences in case of an
overpressure scenario is presented in Table 2. The data is plant specific in nature and is
collected by consultation with maintenance personals in the referred plant and safety expert
feedback over a 10 year period.
Table 2: Cumulative form of Accident Precursor Data for overfilling scenario (plant specific
data, safety expert feedback)
Time 1-C1 2-C2 3-C2 4-C3 5-C2 6-C3
0 0 0 0 0 0 0
1 1 0 1 0 1 0
2 1 1 2 1 2 0
3 2 1 2 2 3 2
4 4 3 2 2 3 2
5 4 3 3 2 4 3
6 5 4 4 3 4 3
7 6 5 4 3 5 4
8 8 5 5 4 6 4
9 9 7 5 5 6 4
10 10 8 6 6 7 5
4.3 Mathematical models:
4.3.1 Rate of occurrence of an abnormal event i.e. overfilling scenario
Poisson distribution is used to represent the possible number of abnormal events in a time
period. This is because occurrence of each event is mutually exclusive and random and can
be expressed as non-negative integer valued outcomes.
Page 12 of 50
Accep
ted
Man
uscr
ipt
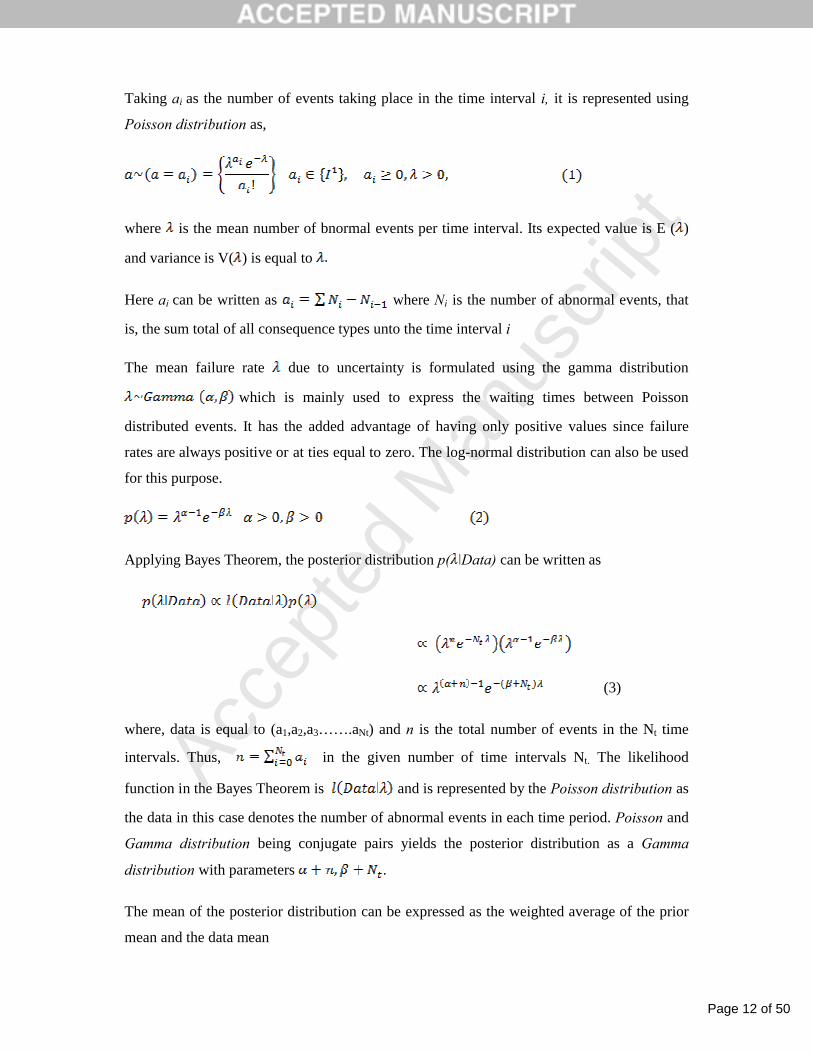
Taking ai as the number of events taking place in the time interval i, it is represented using
Poisson distribution as,
where is the mean number of bnormal events per time interval. Its expected value is E ( )
and variance is V( ) is equal to
Here ai can be written as where Ni is the number of abnormal events, that
is, the sum total of all consequence types unto the time interval i
The mean failure rate due to uncertainty is formulated using the gamma distribution
which is mainly used to express the waiting times between Poisson
distributed events. It has the added advantage of having only positive values since failure
rates are always positive or at ties equal to zero. The log-normal distribution can also be used
for this purpose.
Applying Bayes Theorem, the posterior distribution p( ǀData) can be written as
(3)
where, data is equal to (a1,a2,a3…….aNt) and n is the total number of events in the Nt time
intervals. Thus, in the given number of time intervals Nt. The likelihood
function in the Bayes Theorem is and is represented by the Poisson distribution as
the data in this case denotes the number of abnormal events in each time period. Poisson and
Gamma distribution being conjugate pairs yields the posterior distribution as a Gamma
distribution with parameters .
The mean of the posterior distribution can be expressed as the weighted average of the prior
mean and the data mean
Page 13 of 50
Accep
ted
Man
uscr
ipt
where the posterior mean is and the prior and data mean are respectively and
Meel and Seider (2006) calculated the predictive marginal probability distribution,
p( ), to estimate the number of abnormal events aNt+1 in the next time interval
Nt+1 conditional on the ASP data observed, to be negative binomially distributed.
The predictive negative binomial distribution for the number of events in the next time
interval conditional on the observed data can be written as,
The mean of the predictive number of events in the next time intervala and the
predictive variance is .
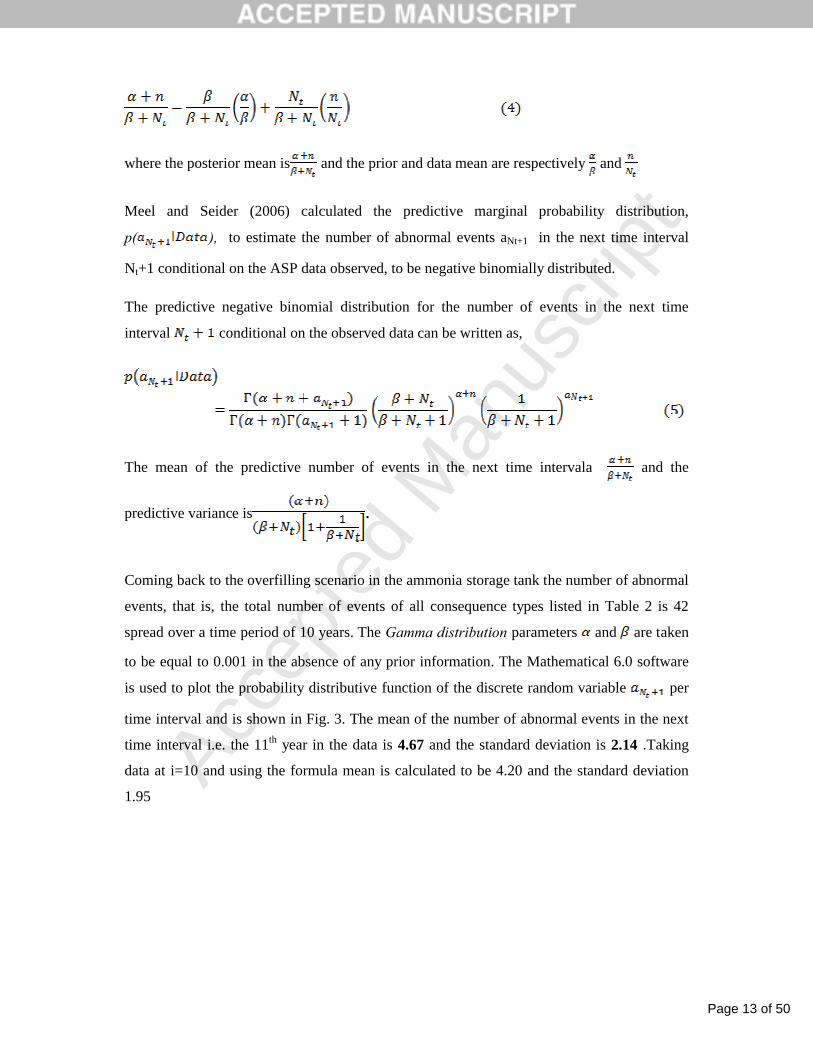
Coming back to the overfilling scenario in the ammonia storage tank the number of abnormal
events, that is, the total number of events of all consequence types listed in Table 2 is 42
spread over a time period of 10 years. The Gamma distribution parameters and are taken
to be equal to 0.001 in the absence of any prior information. The Mathematical 6.0 software
is used to plot the probability distributive function of the discrete random variable per
time interval and is shown in Fig. 3. The mean of the number of abnormal events in the next
time interval i.e. the 11th year in the data is 4.67 and the standard deviation is 2.14 .Taking
data at i=10 and using the formula mean is calculated to be 4.20 and the standard deviation
1.95
Page 14 of 50
Accep
ted
Man
uscr
ipt
Fig. 3: Probability mass function of discrete random variable in case of overfilling
scenario
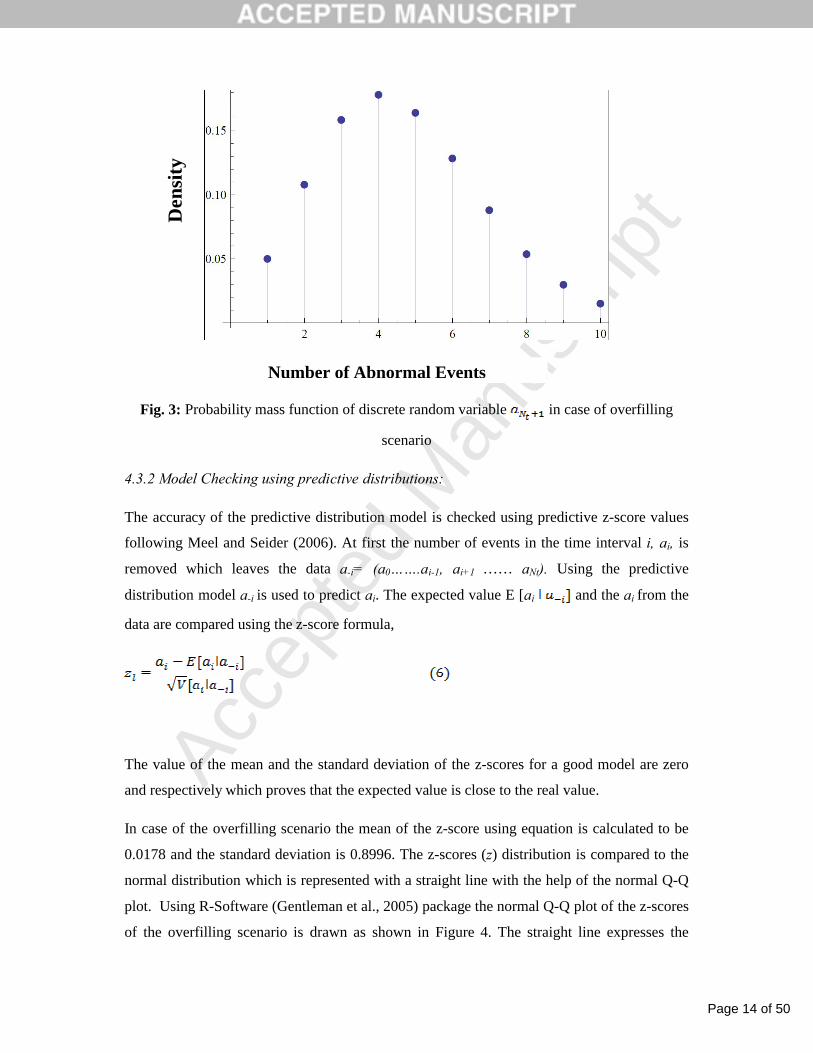
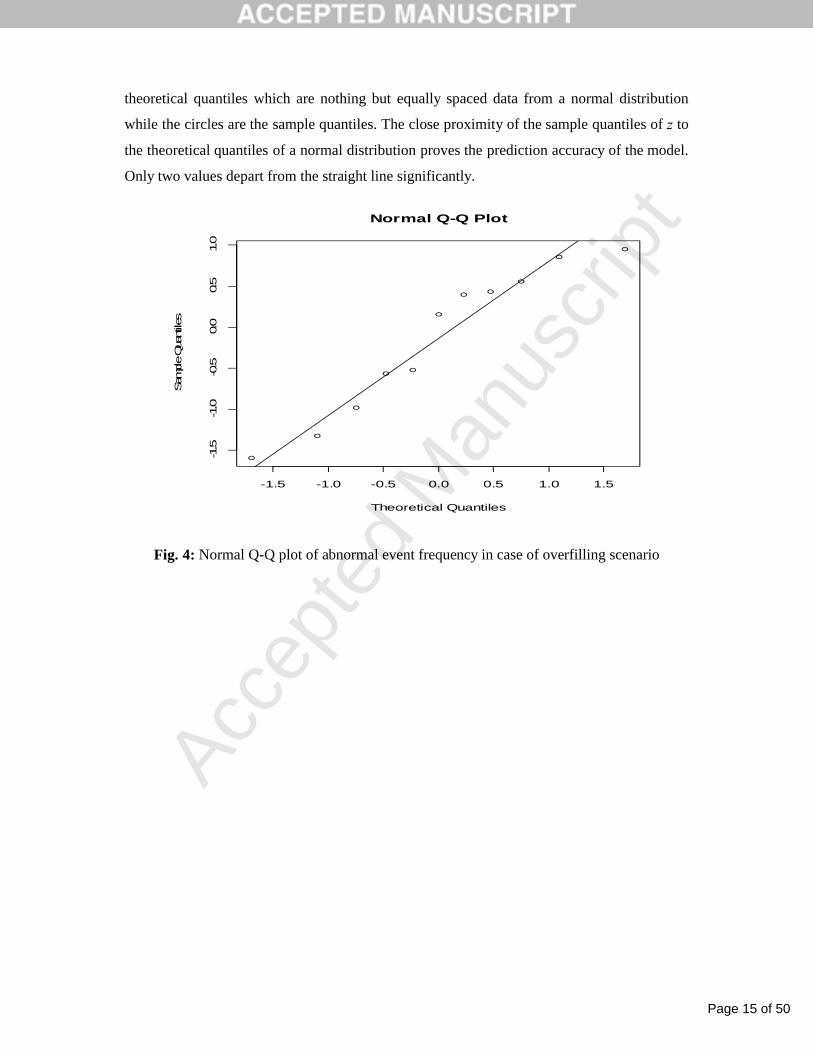
4.3.2 Model Checking using predictive distributions:
The accuracy of the predictive distribution model is checked using predictive z-score values
following Meel and Seider (2006). At first the number of events in the time interval i, ai, is
removed which leaves the data a-i= (a0…….ai-1, ai+1 …… aNt). Using the predictive
distribution model a-i is used to predict ai. The expected value E [ai and the ai from the
data are compared using the z-score formula,
The value of the mean and the standard deviation of the z-scores for a good model are zero
and respectively which proves that the expected value is close to the real value.
In case of the overfilling scenario the mean of the z-score using equation is calculated to be
0.0178 and the standard deviation is 0.8996. The z-scores (z) distribution is compared to the
normal distribution which is represented with a straight line with the help of the normal Q-Q
plot. Using R-Software (Gentleman et al., 2005) package the normal Q-Q plot of the z-scores
of the overfilling scenario is drawn as shown in Figure 4. The straight line expresses the
D
ensi
ty
Number of Abnormal Events
Page 15 of 50
Accep
ted
Man
uscr
ipt
theoretical quantiles which are nothing but equally spaced data from a normal distribution
while the circles are the sample quantiles. The close proximity of the sample quantiles of z to
the theoretical quantiles of a normal distribution proves the prediction accuracy of the model.
Only two values depart from the straight line significantly.
-1.5 -1.0 -0.5 0.0 0.5 1.0 1.5
-1.5
-1.0
-0.5
0.0
0.5
1.0
Normal Q-Q Plot
Theoretical Quantiles
Sample Q
uan
tiles
Fig. 4: Normal Q-Q plot of abnormal event frequency in case of overfilling scenario
Page 16 of 50
Accep
ted
Man
uscr
ipt
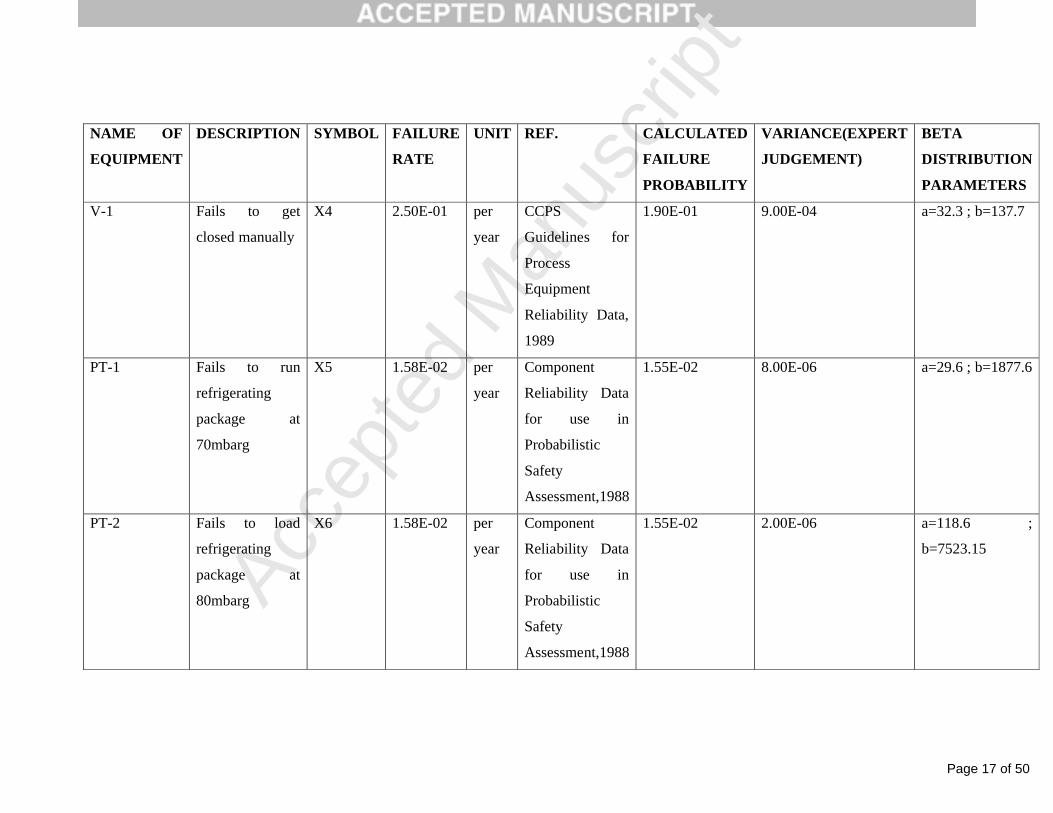
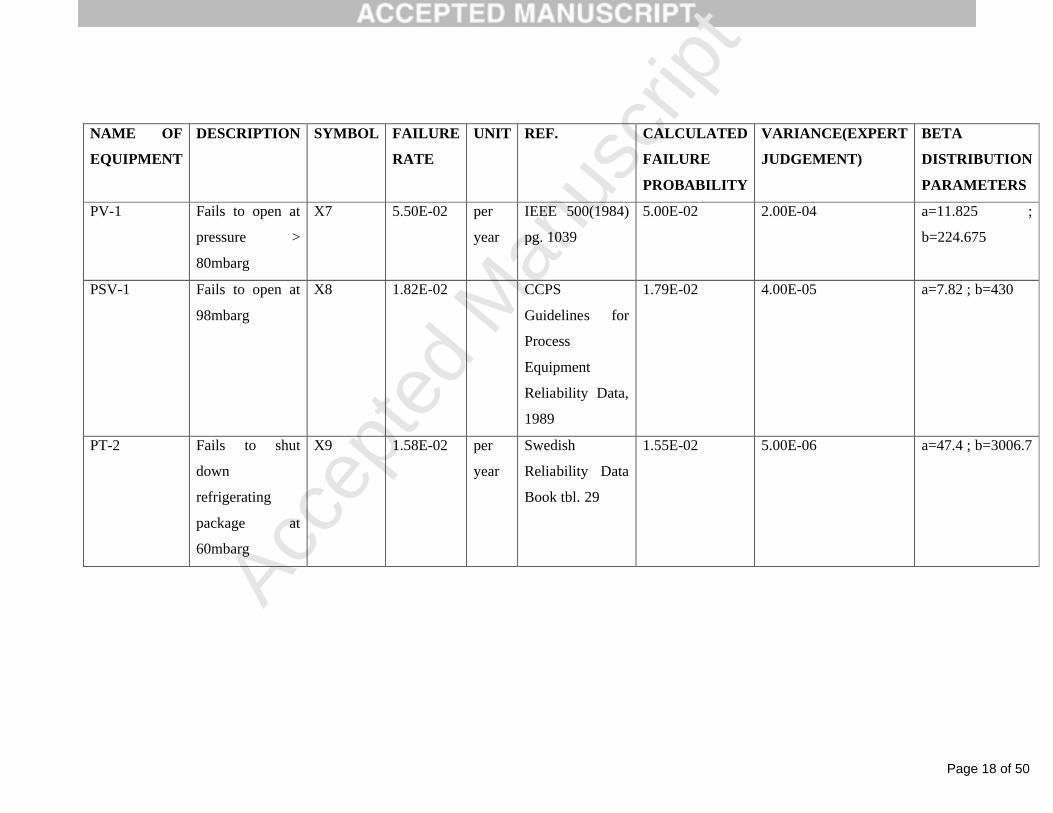
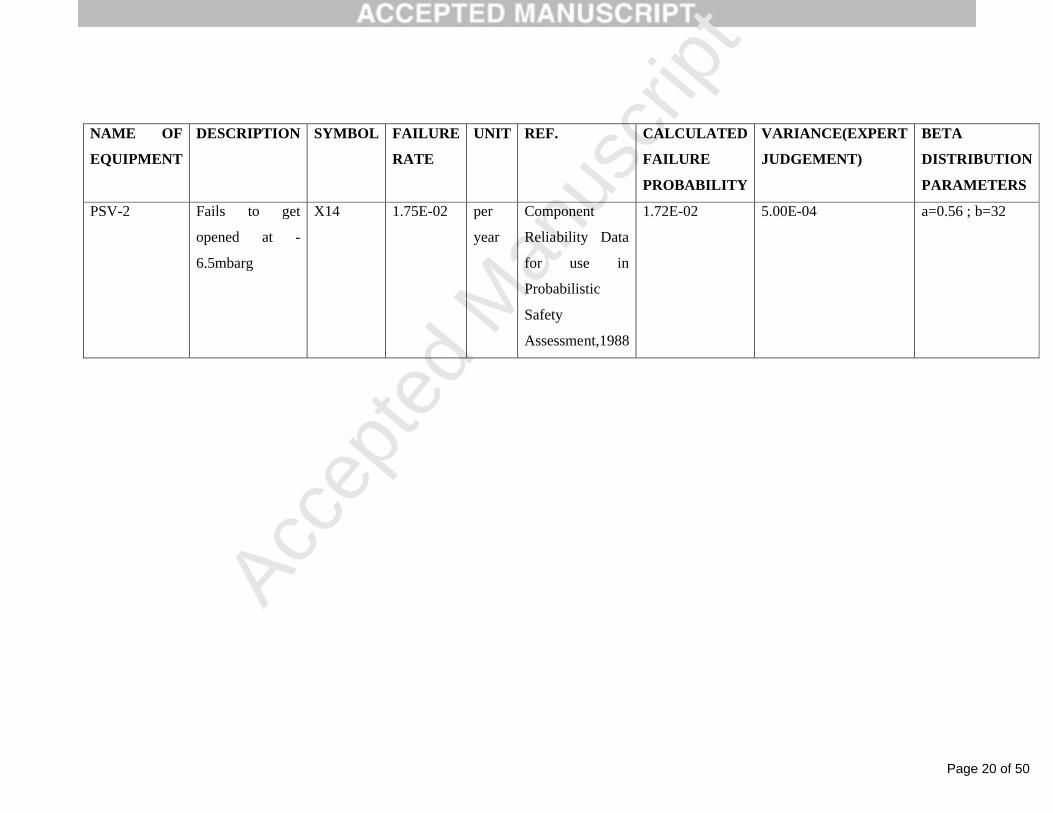
Table 3: Generic failure data, failure description and Beta distribution parameters of safety systems
NAME OF
EQUIPMENT
DESCRIPTION SYMBOL FAILURE
RATE
UNIT REF. CALCULATED
FAILURE
PROBABILITY
VARIANCE(EXPERT
JUDGEMENT)
BETA
DISTRIBUTION
PARAMETERS
LT-1 Fails to indicate
liquid level
correctly and
sound alarm
X1 3.30E-02 per
year
Component
Reliability Data
for use in
Probabilistic
Safety
Assessment,1988
3.00E-02 2.00E-03 a=0.4 ; b=13
LT-2 Fails to indicate
liquid level and
actuate inlet
valve V-1
X2 3.30E-02 per
year
Component
Reliability Data
for use in
Probabilistic
Safety
Assessment,1988
3.00E-02 6.00E-04 a=1.425 ; b=46
V-1 Fails to get
closed
automatically
X3 5.50E-02 per
year
IEEE 500 (1984)
pg. 1039
5.00E-02 4.00E-03 a=0.5 ; b=9.5
Page 17 of 50
Accep
ted
Man
uscr
ipt
NAME OF
EQUIPMENT
DESCRIPTION SYMBOL FAILURE
RATE
UNIT REF. CALCULATED
FAILURE
PROBABILITY
VARIANCE(EXPERT
JUDGEMENT)
BETA
DISTRIBUTION
PARAMETERS
V-1 Fails to get
closed manually
X4 2.50E-01 per
year
CCPS
Guidelines for
Process
Equipment
Reliability Data,
1989
1.90E-01 9.00E-04 a=32.3 ; b=137.7
PT-1 Fails to run
refrigerating
package at
70mbarg
X5 1.58E-02 per
year
Component
Reliability Data
for use in
Probabilistic
Safety
Assessment,1988
1.55E-02 8.00E-06 a=29.6 ; b=1877.6
PT-2 Fails to load
refrigerating
package at
80mbarg
X6 1.58E-02 per
year
Component
Reliability Data
for use in
Probabilistic
Safety
Assessment,1988
1.55E-02 2.00E-06 a=118.6 ;
b=7523.15
Page 18 of 50
Accep
ted
Man
uscr
ipt
NAME OF
EQUIPMENT
DESCRIPTION SYMBOL FAILURE
RATE
UNIT REF. CALCULATED
FAILURE
PROBABILITY
VARIANCE(EXPERT
JUDGEMENT)
BETA
DISTRIBUTION
PARAMETERS
PV-1 Fails to open at
pressure >
80mbarg
X7 5.50E-02 per
year
IEEE 500(1984)
pg. 1039
5.00E-02 2.00E-04 a=11.825 ;
b=224.675
PSV-1 Fails to open at
98mbarg
X8 1.82E-02 CCPS
Guidelines for
Process
Equipment
Reliability Data,
1989
1.79E-02 4.00E-05 a=7.82 ; b=430
PT-2 Fails to shut
down
refrigerating
package at
60mbarg
X9 1.58E-02 per
year
Swedish
Reliability Data
Book tbl. 29
1.55E-02 5.00E-06 a=47.4 ; b=3006.7
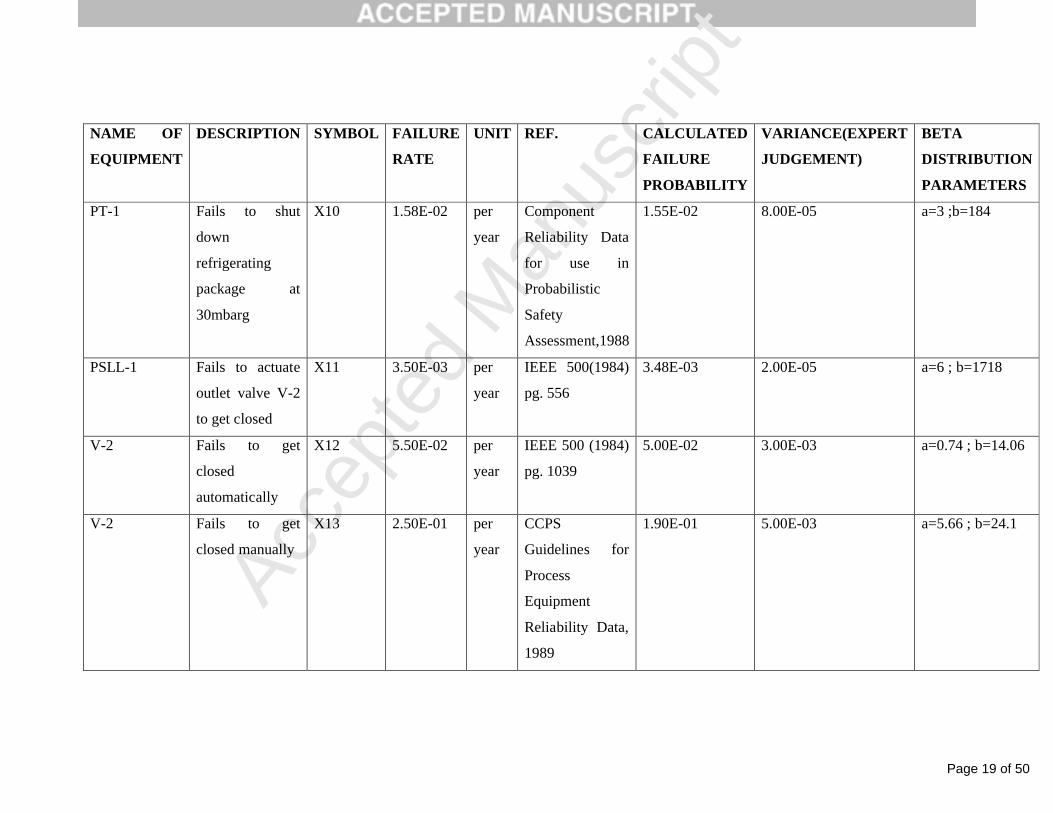
Page 19 of 50
Accep
ted
Man
uscr
ipt
NAME OF
EQUIPMENT
DESCRIPTION SYMBOL FAILURE
RATE
UNIT REF. CALCULATED
FAILURE
PROBABILITY
VARIANCE(EXPERT
JUDGEMENT)
BETA
DISTRIBUTION
PARAMETERS
PT-1 Fails to shut
down
refrigerating
package at
30mbarg
X10 1.58E-02 per
year
Component
Reliability Data
for use in
Probabilistic
Safety
Assessment,1988
1.55E-02 8.00E-05 a=3 ;b=184
PSLL-1 Fails to actuate
outlet valve V-2
to get closed
X11 3.50E-03 per
year
IEEE 500(1984)
pg. 556
3.48E-03 2.00E-05 a=6 ; b=1718
V-2 Fails to get
closed
automatically
X12 5.50E-02 per
year
IEEE 500 (1984)
pg. 1039
5.00E-02 3.00E-03 a=0.74 ; b=14.06
V-2 Fails to get
closed manually
X13 2.50E-01 per
year
CCPS
Guidelines for
Process
Equipment
Reliability Data,
1989
1.90E-01 5.00E-03 a=5.66 ; b=24.1
Page 20 of 50
Accep
ted
Man
uscr
ipt
NAME OF
EQUIPMENT
DESCRIPTION SYMBOL FAILURE
RATE
UNIT REF. CALCULATED
FAILURE
PROBABILITY
VARIANCE(EXPERT
JUDGEMENT)
BETA
DISTRIBUTION
PARAMETERS
PSV-2 Fails to get
opened at -
6.5mbarg
X14 1.75E-02 per
year
Component
Reliability Data
for use in
Probabilistic
Safety
Assessment,1988
1.72E-02 5.00E-04 a=0.56 ; b=32
Page 21 of 50
Accep
ted
Man
uscr
ipt
4.3.3 Estimation of failure probabilities of safety systems:
In the event tree in Figure 2 failure probabilities of the safety systems are assigned to each
branch. The failure probabilities are denoted as x1, x2…….x4, each assigned to a safety
system. In respect to Bayesian Theory these probabilities are called “priors”, named because
they represent our knowledge about the system before observing data. These prior
distributions do not have an absolute value but is represented by a probability distribution
function called the prior distribution.
The prior failure probabilities of the safety systems are taken to be Beta distributed with the
parameters as and bs, (where s represents each safety system). The distribution represents all
the possible values of the failure probabilities between 0 and 1 and hence can be said to be a
probability distribution of probabilities.
The mean of this distribution is /( + ) and the variance .
The mean values of the prior probabilities are collected from generic data available in the
CCPS Guidelines for Process Equipment Reliability Data (2006), the IAEA Component
Reliability Data for use in Probabilistic Safety Assessment, (1988) and the IEEE 500 (1984).
The variance is calculated from consultations with safety experts and engineers. The beta
distribution parameters are calculated by solving the generic mean values and the variances.
The value of failure probability of each safety system, along with their reference and failure
description is given in Table 3.
The prior failure probabilities are updated using the ASP data through the Bernoulli’s
likelihood distribution to express two mutually exclusive events: the occurrence and the non-
occurrence of failure. The likelihood distribution of safety system s is
where Ks and Ls are the number of failures and the number of success of the concerned safety
system s in each time period over the 10 year period. Beta and Bernoulli’s distributions are
conjugate pairs and thus the posterior distribution also becomes beta distributed. The
posterior distribution is thus given by
Page 22 of 50
Accep
ted
Man
uscr
ipt
The parameters of the posterior Beta distribution are (as+Ks, bs+Ls). The mean of the posterior
distribution becomes, which can be expressed as the weighted average of the
prior mean and the data mean as:
= ( +
where, is the prior mean and is the data mean.
As Ks and Ls change after each time period, the mean of the failure probability of each safety
system also change accordingly after each time period. Ks and Ls can be calculated from the
ASP data collected in Table 2.Ks accounts for the total number of consequences occurred due
to the failure of the safety system s in a single time interval while Ls gives the corresponding
number of successes.
For example the number of failure Ks for the the safety system LT-1 for the first year is
and, number of successes Ls,
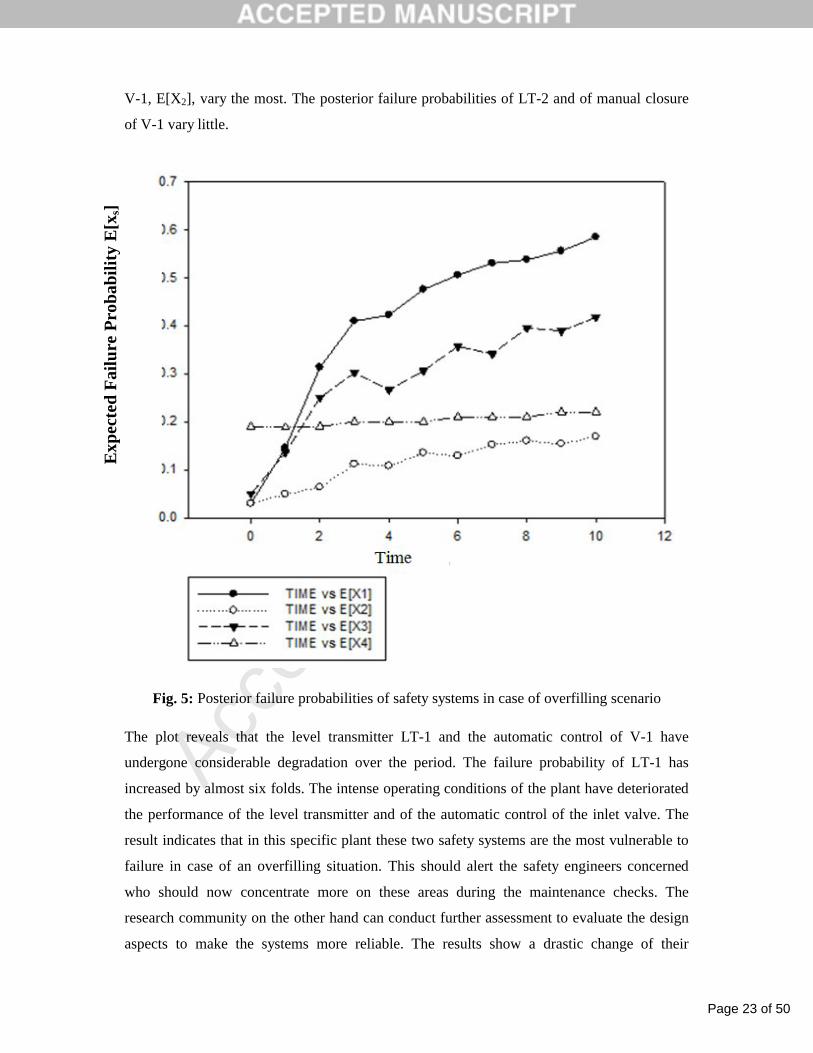
The means of the failure probabilities of the safety systems during overfilling scenario over
the 10 year period are calculated and plotted in Figure 5.
As it can be seen from Figure 5 the failure probabilities of all the safety systems change when
the ASP data is used to calculate the posterior probabilities. The expected value of the failure
probabilities of safety system LT-1, E[X1], and of failure of automatic closure of inlet valve
Page 23 of 50
Accep
ted
Man
uscr
ipt
V-1, E[X2], vary the most. The posterior failure probabilities of LT-2 and of manual closure
of V-1 vary little.
Fig. 5: Posterior failure probabilities of safety systems in case of overfilling scenario
The plot reveals that the level transmitter LT-1 and the automatic control of V-1 have
undergone considerable degradation over the period. The failure probability of LT-1 has
increased by almost six folds. The intense operating conditions of the plant have deteriorated
the performance of the level transmitter and of the automatic control of the inlet valve. The
result indicates that in this specific plant these two safety systems are the most vulnerable to
failure in case of an overfilling situation. This should alert the safety engineers concerned
who should now concentrate more on these areas during the maintenance checks. The
research community on the other hand can conduct further assessment to evaluate the design
aspects to make the systems more reliable. The results show a drastic change of their
E
xpec
ted
Fai
lure
Pro
bab
ilit
y E
[xs]
Page 24 of 50
Accep
ted
Man
uscr
ipt
probabilities as new data are integrated into the analysis over the 10 years. Using plant
specific data the generic failure probabilities are tailored and updated to properly portray the
degradation of the safety systems over the operational time period.
The proposed tool employs easy probabilistic calculations which serve as a first step towards
identifying the failure prone areas of a system in case of an abnormal event. It can be easily
used by safety engineers in the plant to conduct a proper real-time safety assessment
4.3.4 Estimation of consequence probabilities.
The end-state probabilities of the event tree model in Figure 2 are calculated next. The
probabilities are calculated from the failure probabilities assigned to each branch of the event
tree. The end-state probabilities are calculated from the following equation,
where SBk represents the safety barrier associated with the consequence of severity level k.
The value of if the kth level failure propagates along the down-branch of the event
tree of safety system s and when the failure passes along the success or the up-
branch of the associated safety barrier s.
The end-state probabilities of the event tree model are calculated. The consequences of the
same severity level are added together to give the total occurrence probability of each end
state of a particular severity per year eg. 2-C2, 3-C2 and 5-C2 are added to give the total
probability of occurrence of C2. The total occurrence probabilities of end state per year are
tabulated in Table 4.
Table 4: Posterior consequence probabilities in case of overfilling scenario
TIME P(C1) P(C2) P(C3)
0 0.97 0.029665 0.000447
1 0.854 0.014227 0.00489
2 0.687 0.029875 0.017715
3 0.591 0.038625 0.031098
4 0.578 0.401131 0.029141
5 0.525 0.448556 0.03797
Page 25 of 50
Accep
ted
Man
uscr
ipt
6 0.495 0.47062 0.046836
7 0.47 0.496089 0.049098
8 0.463 0.49759 0.05546
9 0.445 0.51267 0.058985
10 0.416 0.53696 0.0662
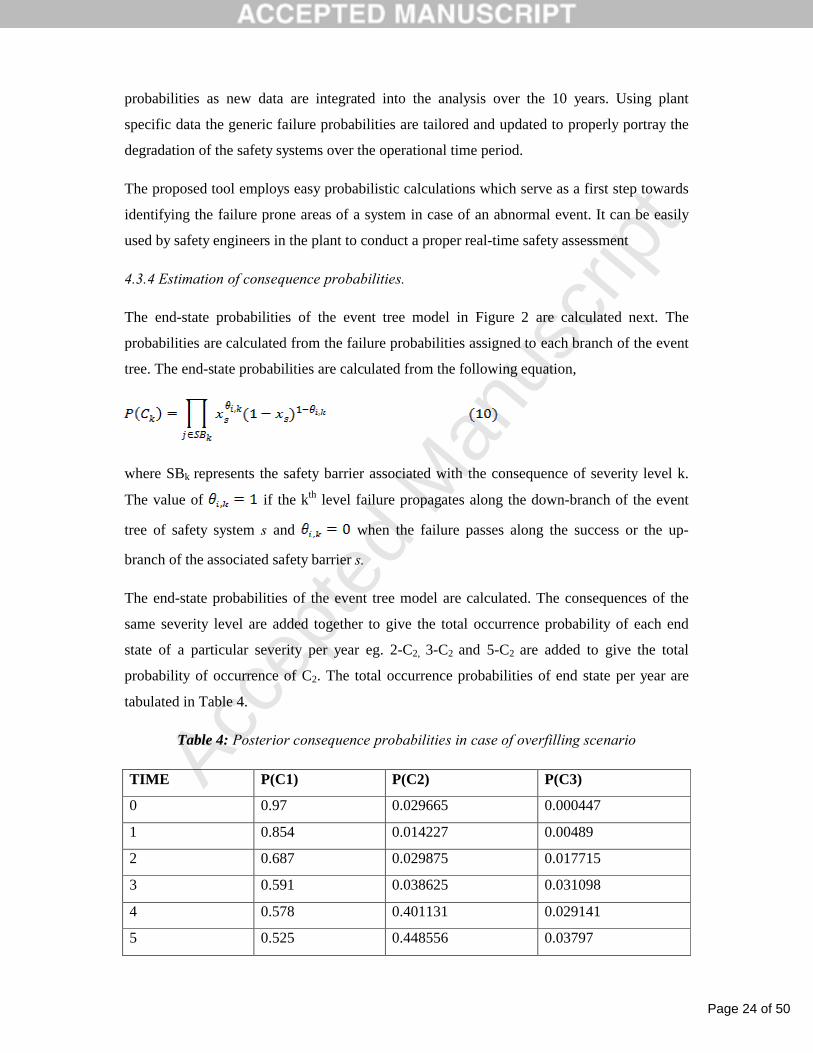
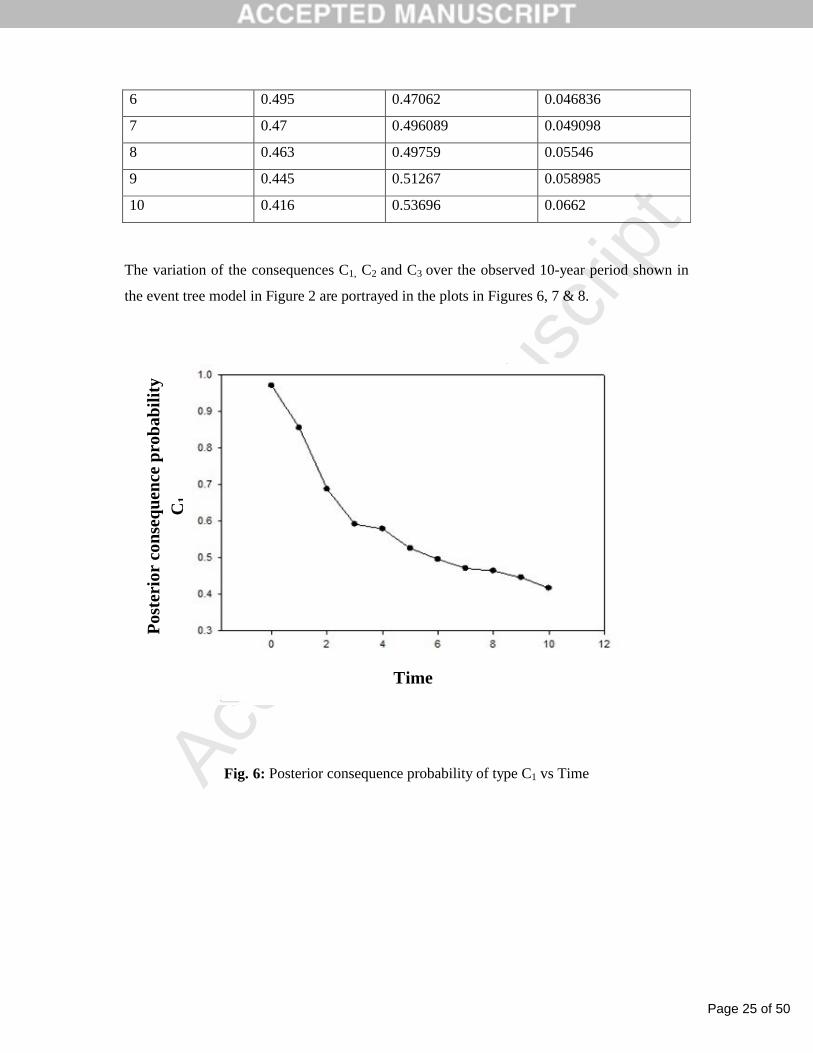
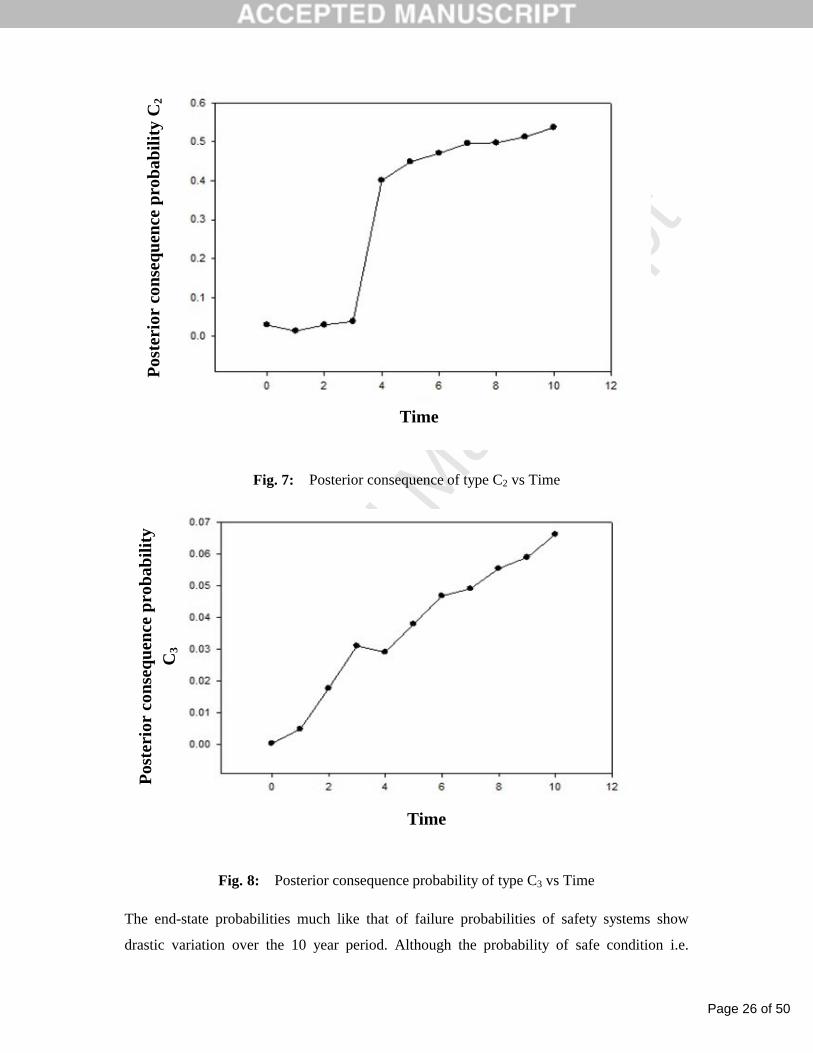
The variation of the consequences C1, C2 and C3 over the observed 10-year period shown in
the event tree model in Figure 2 are portrayed in the plots in Figures 6, 7 & 8.
Fig. 6: Posterior consequence probability of type C1 vs Time
Time
Pos
teri
or c
onse
qu
ence
pro
bab
ilit
y C
1
Page 26 of 50
Accep
ted
Man
uscr
ipt
Fig. 7: Posterior consequence of type C2 vs Time
Fig. 8: Posterior consequence probability of type C3 vs Time
The end-state probabilities much like that of failure probabilities of safety systems show
drastic variation over the 10 year period. Although the probability of safe condition i.e.
Time
Pos
teri
or c
onse
qu
ence
pro
bab
ilit
y C
2
Time
Pos
teri
or c
onse
qu
ence
pro
bab
ilit
y C
3
Page 27 of 50
Accep
ted
Man
uscr
ipt
continued operation C1 remains quite high but the value shows steep fall over the period. This
means that there is an increased probability that the abnormal event may propagate to an
accident as witnessed by the considerable rise in probabilities of unsafe events like C2 (shut
down) and C3 (tank failure due to overfilling scenario) . The occurrence probability C2 shows
a very steep rise between the 3rd and the 4th year of observation. It remains mostly stable
during the middle years again showing a rise towards the end depicting a bathtub curve. The
increasing failure probability of the level transmitter and the inlet valve has invariably
increased the occurrence probability of tank failure C3. The results show with time the
system has degraded and is giving reduced performance causing near-misses and incidents to
occur more. Towards the end of the observed time periods, from the 6th time period onwards,
the probability of C2 (shut down) and C3 (tank failure) exceeds that of a continued operation.
This indicates that there are design flaws within the system and a redesign of the system
and/or the safety systems concerned are recommended.
The plant specific data in the form of ASP data update the generic failure probabilities and
helps to develop a more realistic picture of the state of the system for the safety engineers.
They now have an idea of the vulnerable areas and aware of the increased probability of tank
failure or a shut down due to an overfilling scenario. The assessment also shows the dynamic
nature of the failure probabilities of a system in operation.
5. Overpressure scenario and safety systems concerned
The next abnormal scenario which can lead to tank failure is the overpressure situation.
Overpressure leads to the rupture of the tank body and thus can cause explosion and great
damage. Overpressure is mainly caused by a sudden drop of the barometric pressure,
blockage of the vapour outlet line or rollover. The maximum allowable working pressure in
case of the concerned tank is +98mbarg.
When the pressure inside the tank reaches a value of 70mbarg The pressure transmitter PT-1
is triggered to run the refrigerating package which leads to a safe condition albeit a shutdown
in operations. However, if it fails to do so the pressure inside increases and when it reaches
80mbarg the pressure transmitter PT-2 loads the refrigerating package to condense the
vapour. This also leads to a shutdown if successful but the condition is safe. If the pressure
increases further the pressure valve PV-1 is actuated which leads the extra vapour built up
inside the tank towards the flare. The failure of the pressure valve leaves the process safety
valve PSV-1 to vent off the vapour to a safe zone. Should this safety barrier fail an
Page 28 of 50
Accep
ted
Man
uscr
ipt
overpressure scenario is created which is beyond control and can lead to grave consequences.
This is because the tank can withstand a maximum allowable working pressure of +98mbarg.
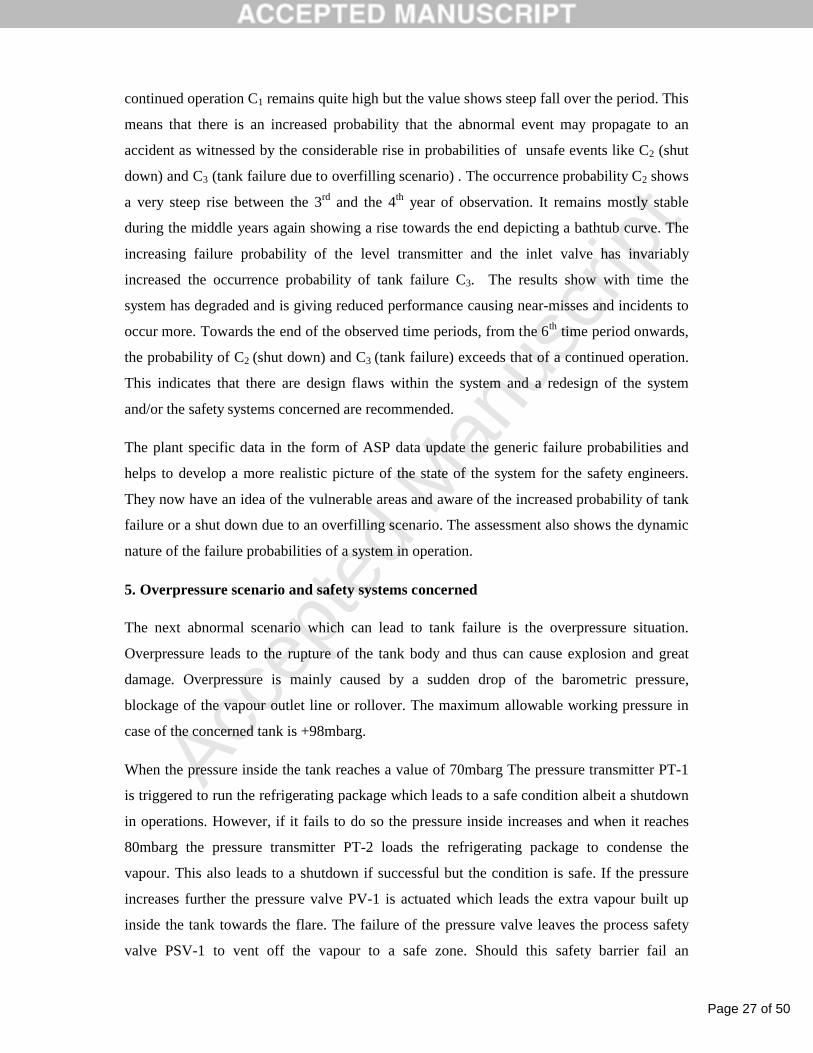
5.1 Event tree model of overpressure scenario
The event tree model is given in Figure 9 following the same procedure of construction as
described for the overfilling scenario in the Section 4.1. The safety systems concerned in this
case are the pressure transmitters PT-1 and PT-2, the pressure valve PV-1 and the process
safety valve PSV-1. The failure probabilities of the respective safety systems are denoted by
x5, x6, x7 and x8. The end states are represented by C4 and C5 denoting shutdown due to
overpressure and tank failure due to overpressure situation respectively. The failure
probabilities are independent of each other and the end state as stated earlier.
Fig. 9: Event tree model of overpressure scenario in ammonia storage unit
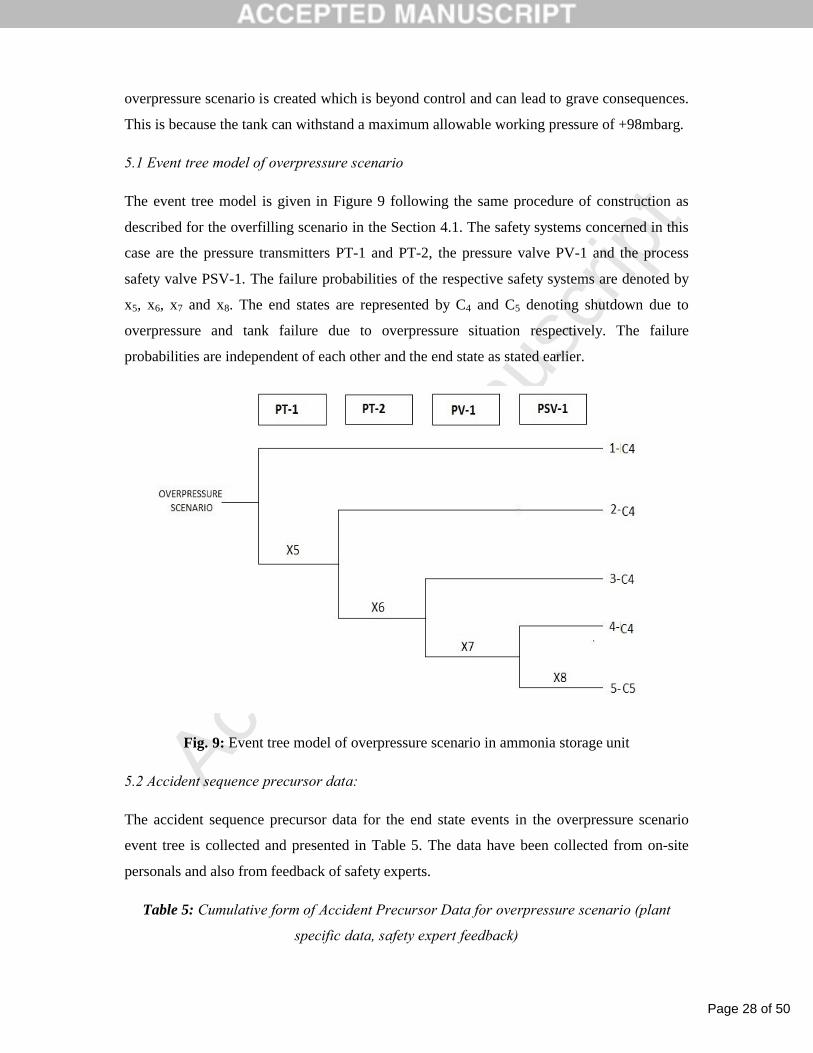
5.2 Accident sequence precursor data:
The accident sequence precursor data for the end state events in the overpressure scenario
event tree is collected and presented in Table 5. The data have been collected from on-site
personals and also from feedback of safety experts.
Table 5: Cumulative form of Accident Precursor Data for overpressure scenario (plant
specific data, safety expert feedback)
Page 29 of 50
Accep
ted
Man
uscr
ipt
TIME 1-C4 2-C4 3-C4 4-C4 5-C5
0 0 0 0 0 0
1 1 0 1 0 0
2 1 1 1 0 0
3 2 1 2 0 1
4 2 2 2 1 1
5 3 2 3 2 2
6 3 4 3 2 2
7 5 4 3 3 2
8 5 5 3 4 3
9 7 6 4 4 3
10 8 6 5 4 4
5.3 Mathematical models:
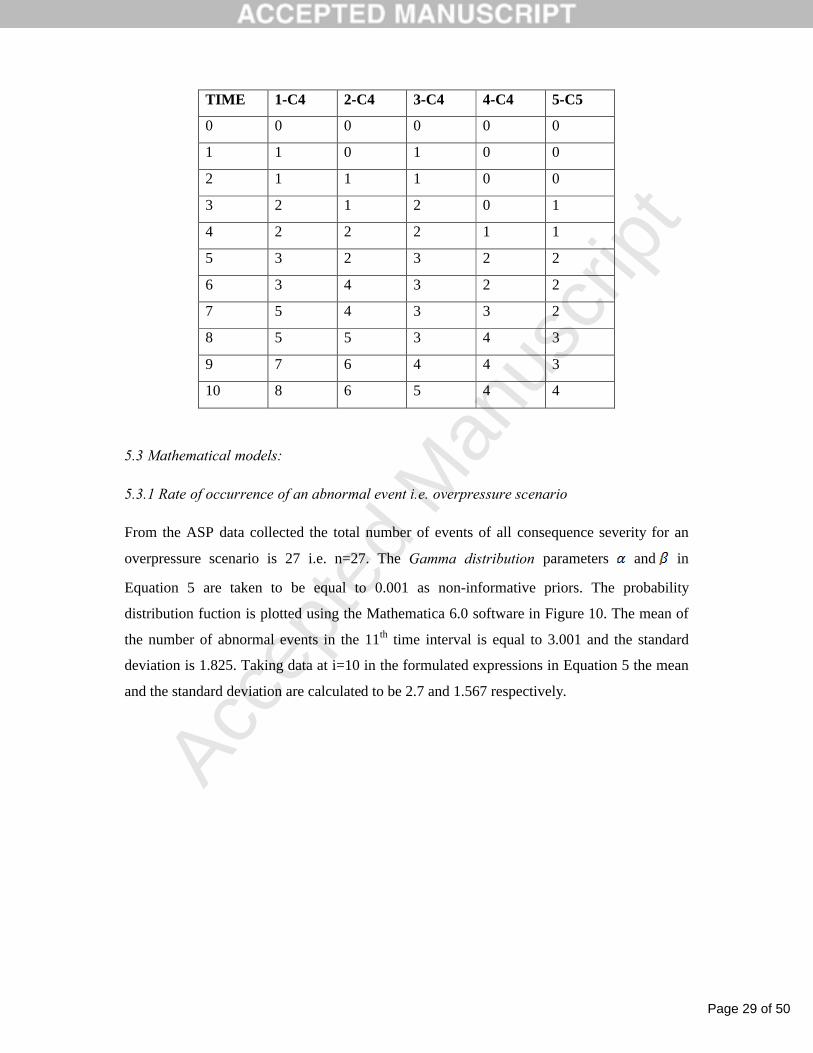
5.3.1 Rate of occurrence of an abnormal event i.e. overpressure scenario
From the ASP data collected the total number of events of all consequence severity for an
overpressure scenario is 27 i.e. n=27. The Gamma distribution parameters and in
Equation 5 are taken to be equal to 0.001 as non-informative priors. The probability
distribution fuction is plotted using the Mathematica 6.0 software in Figure 10. The mean of
the number of abnormal events in the 11th time interval is equal to 3.001 and the standard
deviation is 1.825. Taking data at i=10 in the formulated expressions in Equation 5 the mean
and the standard deviation are calculated to be 2.7 and 1.567 respectively.
Page 30 of 50
Accep
ted
Man
uscr
ipt
Fig.10: Probability mass function of discrete random variable in case of overpressure
scenario
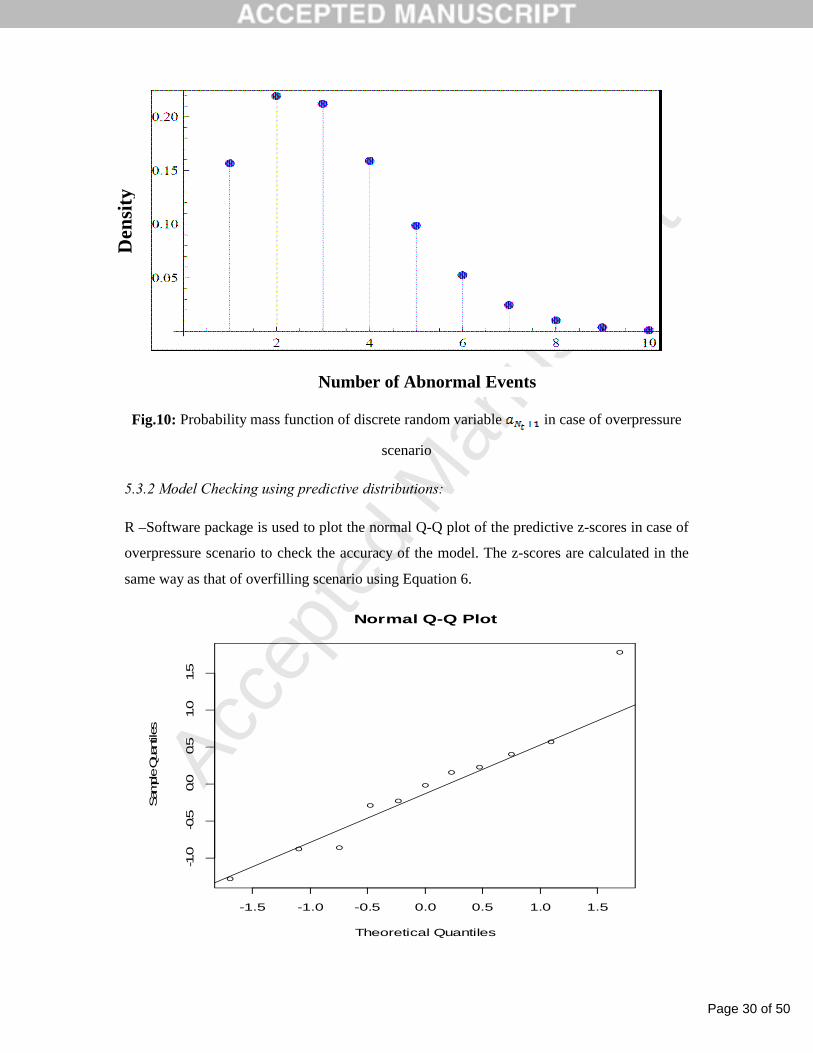
5.3.2 Model Checking using predictive distributions:
R –Software package is used to plot the normal Q-Q plot of the predictive z-scores in case of
overpressure scenario to check the accuracy of the model. The z-scores are calculated in the
same way as that of overfilling scenario using Equation 6.
-1.5 -1.0 -0.5 0.0 0.5 1.0 1.5
-1.0
-0.5
0.0
0.5
1.0
1.5
Normal Q-Q Plot
Theoretical Quantiles
Sample Q
uan
tiles
Number of Abnormal Events
Den
sity
Page 31 of 50
Accep
ted
Man
uscr
ipt
Fig. 11: Normal Q-Q plot of abnormal event frequency in case of overpressure scenario
Most of the values are in tandem with the straight line representing the normal distribution.
5.3.3 Estimation of failure probabilities of safety systems:
The failure probabilities of the safety systems concerned with the overpressure scenario are
denoted in the event tree model in Fig. 9. Following the earlier mentioned Bayesian model
the prior failure probabilities are represented by the Beta distribution as in Equation 7. The
generic values are collected and tabulated in Table 3 along with the Beta distribution
parameters.
Asp data is used to update the failure probabilities using the aforementioned procedure with
Equation 9. The variation of posterior failure probabilities of the safety systems is shown in
Fig. 12.
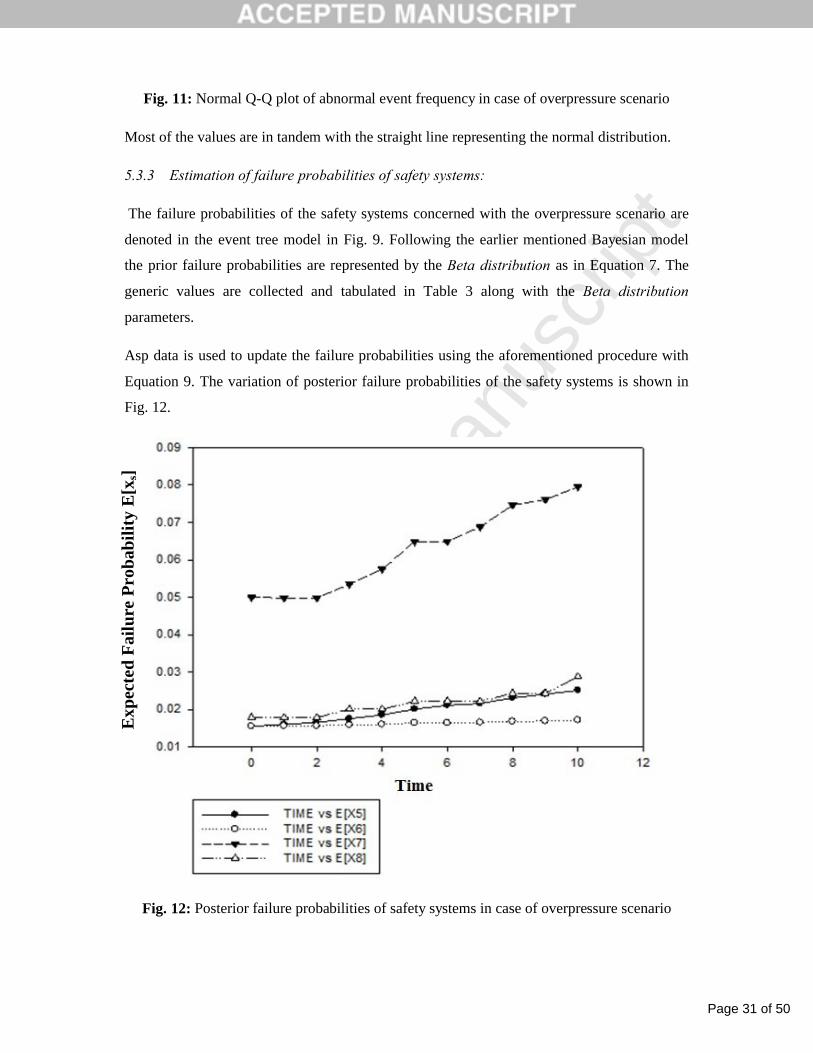
Fig. 12: Posterior failure probabilities of safety systems in case of overpressure scenario
Exp
ecte
d F
ailu
re P
rob
abil
ity
E[x
s]
Page 32 of 50
Accep
ted
Man
uscr
ipt
The results show the failure probabilities of the safety systems undergo considerable change
over the observed period. The failure probabilities of safety barriers PT-1 and PSV-1(x5 & x8
respectively) increases slightly in the initial period which shows that they are performing well
at the beginning of operation but towards the later stages shows a steeper rise which indicates
that degradation has set in. The failure probability of PT-2 remains more or less same during
the whole period. The failure probability of pressure valve PV-1, x7, shows maximum
increase. This indicates that more maintenance and possibly an equipment change are
required in this case. It is pertinent to mention here that the pressure valves are critical to the
safe operation of the storage unit and must be sincerely maintained and designed.
5.3.4 Estimation of consequence probabilities.
The consequences resulting from the operation of the safety systems as shown in the event
tree in Figure 9 are C4 (shutdown albeit safe condition) and C5 (critical overpressure
scenario). The consequence probabilities are calculated using Equation 10 .The consequences
of same severity level e.g. in this case 1-C4, 2-C4, 3-C4 and 4-C4 are added together to give
the value of total occurrence probability of consequence C4 in each time period. As the failure
probabilities are updated each year the consequence probabilities also suffer change annually.
The updated consequence probabilities are given in Table 6 and their dynamic nature are
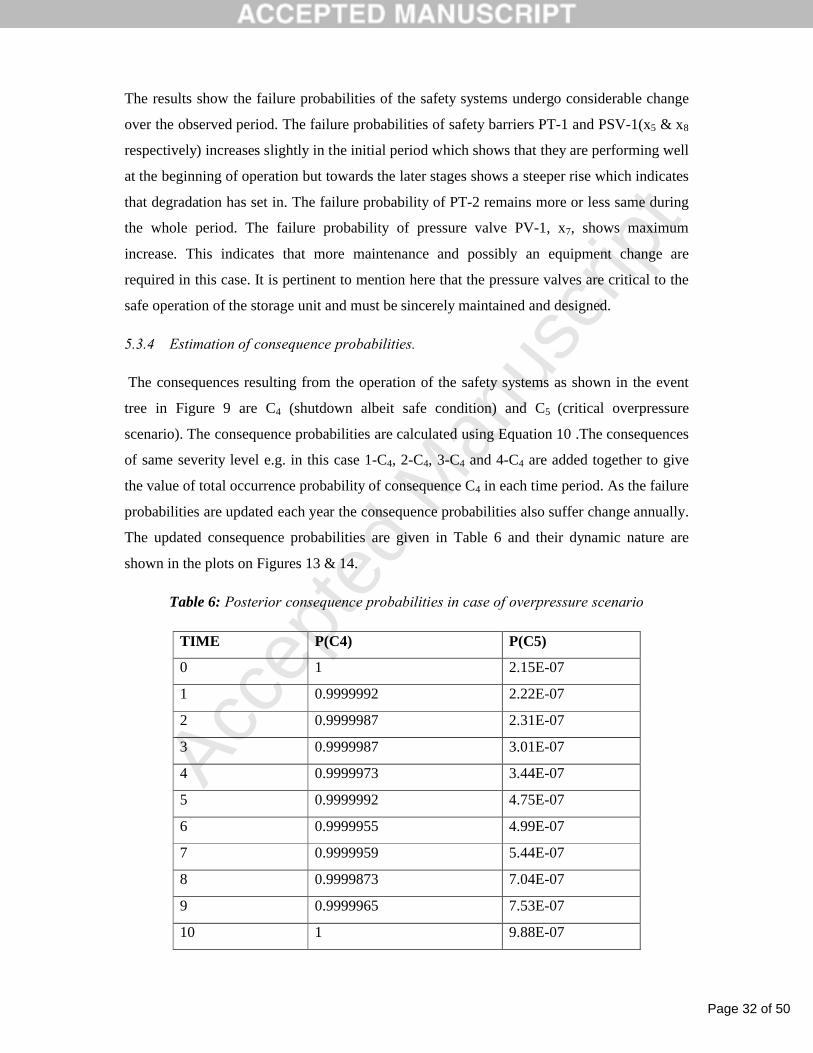
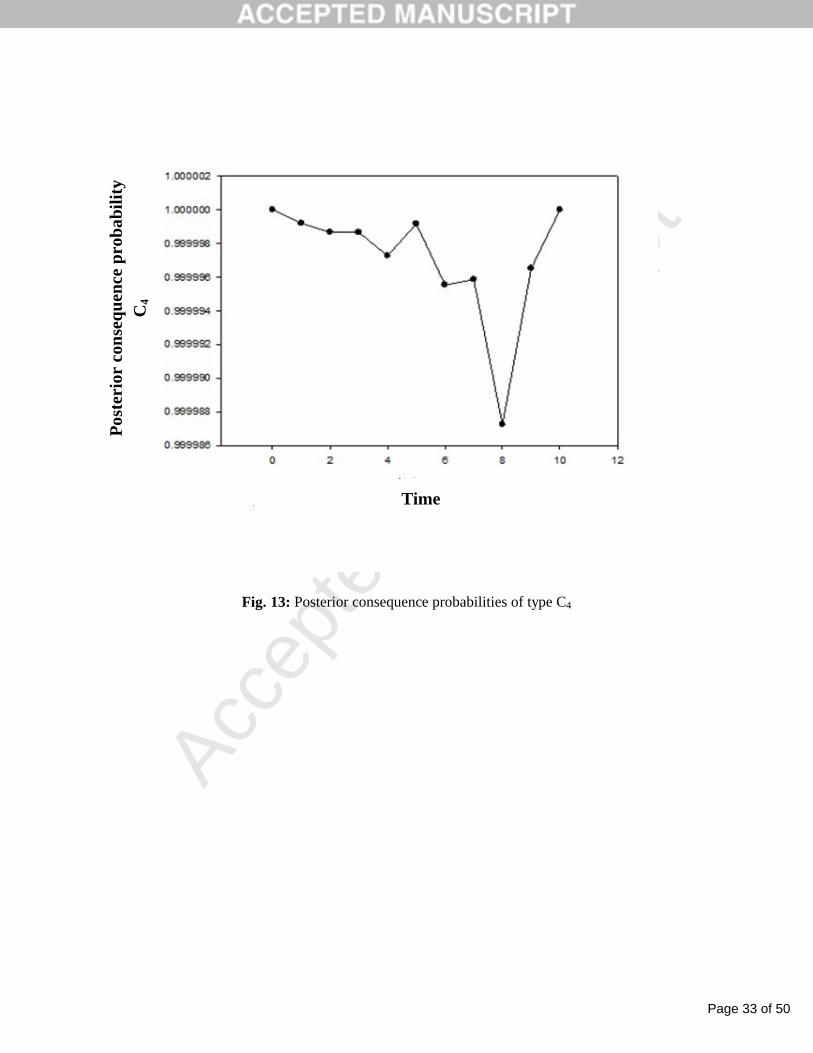
shown in the plots on Figures 13 & 14.
Table 6: Posterior consequence probabilities in case of overpressure scenario
TIME P(C4) P(C5)
0 1 2.15E-07
1 0.9999992 2.22E-07
2 0.9999987 2.31E-07
3 0.9999987 3.01E-07
4 0.9999973 3.44E-07
5 0.9999992 4.75E-07
6 0.9999955 4.99E-07
7 0.9999959 5.44E-07
8 0.9999873 7.04E-07
9 0.9999965 7.53E-07
10 1 9.88E-07
Page 33 of 50
Accep
ted
Man
uscr
ipt
Fig. 13: Posterior consequence probabilities of type C4
Time
Pos
teri
or c
onse
qu
ence
pro
bab
ilit
y C
4
Page 34 of 50
Accep
ted
Man
uscr
ipt
Fig. 14: Posterior consequence probabilities of type C5
The stableness of performance of majority of the safety systems shown in their posterior
failure probabilities is also conveyed in the consequence analysis over the 10 year period.
The abnormal shut down of the plant though in a safe condition shows high probability at the
beginning which is obvious due to the presence of a number of independent safety barriers.
Though it remains fairly high throughout varying little, it shows quite a drastic fall relatively
in the 8th time interval. A rise again in the following period indicates timely maintenance
work. The critical overpressure scenario C4 plot however rises more or less continuously
throughout the period. The contrasting plots show that though the system is performing well
in avoiding out-of-hand overpressure scenarios, the operators must be wary and should check
the rising occurrence probability of C4.
6. Underpressure scenario and safety systems concerned:
Ammonia storage unit are thin walled shells. So when the tank is subjected to vacuum in
situations of underpressure a potentially catastrophic scenario is created. Underpressure in the
storage tanks may be caused when the outlet flow exceeds the inlet flow or when the
barometric pressure rises abruptly. The present reference tank can withstand a minimum
working pressure of -6.5mbarg.When the pressure inside the tank drops below 60mbarg, the
pressure transmitter PT-2 tries to shut off the refrigerating package which leads to a safe
condition and continued operation. If it fails to do so PT-1 will try to do the same when the
Time
Pos
teri
or c
onse
qu
ence
pro
bab
ilit
y C
5
Page 35 of 50
Accep
ted
Man
uscr
ipt
pressure drops to 30mbarg. The very low pressure switch (PSLL) triggers off at 10 mbarg and
actuates the outlet valve V-1 to close automatically. If it fails to close automatically, the
operator can manually turn it off. The closure of the outlet valve leads to a shutdown in
operations but a safe condition. If however the pressure drops further, the process safety
valve PSV-2 will open at -6.5mbarg to let the tank breathe so that it does not buckle. The
failure of the safety valve leads to a critical tank failure and a severe underpressure scenario.
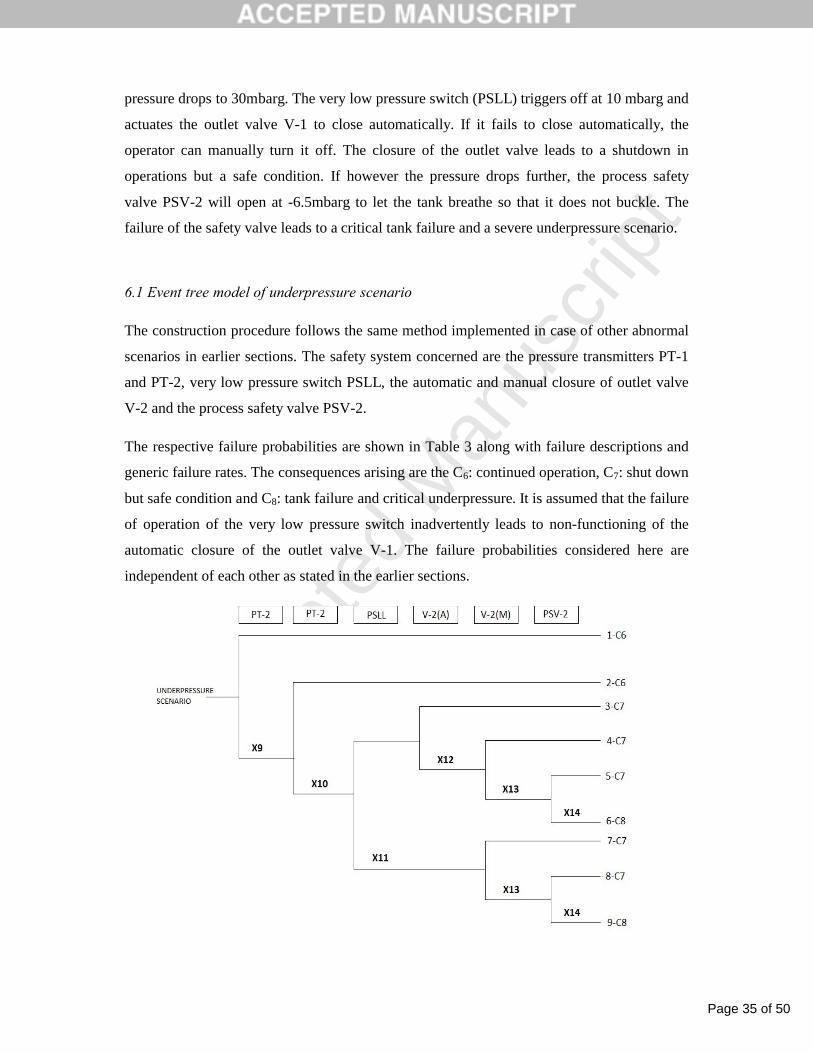
6.1 Event tree model of underpressure scenario
The construction procedure follows the same method implemented in case of other abnormal
scenarios in earlier sections. The safety system concerned are the pressure transmitters PT-1
and PT-2, very low pressure switch PSLL, the automatic and manual closure of outlet valve
V-2 and the process safety valve PSV-2.
The respective failure probabilities are shown in Table 3 along with failure descriptions and
generic failure rates. The consequences arising are the C6: continued operation, C7: shut down
but safe condition and C8: tank failure and critical underpressure. It is assumed that the failure
of operation of the very low pressure switch inadvertently leads to non-functioning of the
automatic closure of the outlet valve V-1. The failure probabilities considered here are
independent of each other as stated in the earlier sections.
Page 36 of 50
Accep
ted
Man
uscr
ipt
Fig. 15: Event tree model of underpressure scenario in ammonia storage unit
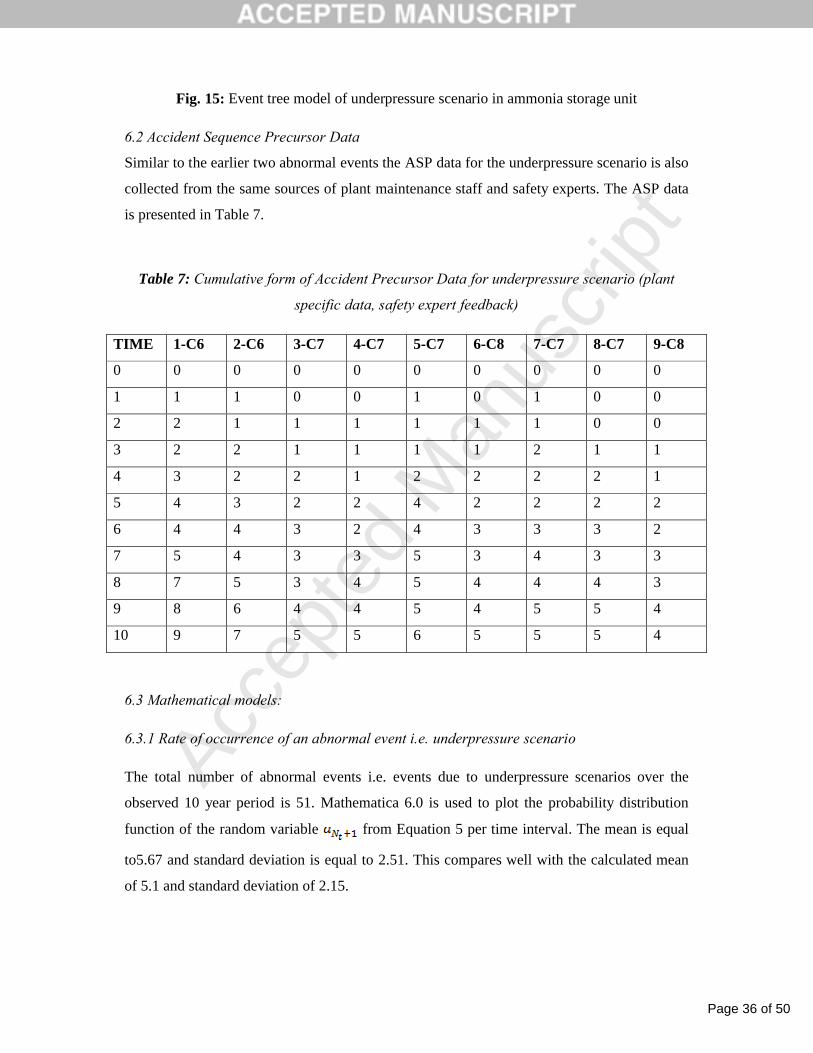
6.2 Accident Sequence Precursor Data
Similar to the earlier two abnormal events the ASP data for the underpressure scenario is also
collected from the same sources of plant maintenance staff and safety experts. The ASP data
is presented in Table 7.
Table 7: Cumulative form of Accident Precursor Data for underpressure scenario (plant
specific data, safety expert feedback)
TIME 1-C6 2-C6 3-C7 4-C7 5-C7 6-C8 7-C7 8-C7 9-C8
0 0 0 0 0 0 0 0 0 0
1 1 1 0 0 1 0 1 0 0
2 2 1 1 1 1 1 1 0 0
3 2 2 1 1 1 1 2 1 1
4 3 2 2 1 2 2 2 2 1
5 4 3 2 2 4 2 2 2 2
6 4 4 3 2 4 3 3 3 2
7 5 4 3 3 5 3 4 3 3
8 7 5 3 4 5 4 4 4 3
9 8 6 4 4 5 4 5 5 4
10 9 7 5 5 6 5 5 5 4
6.3 Mathematical models:
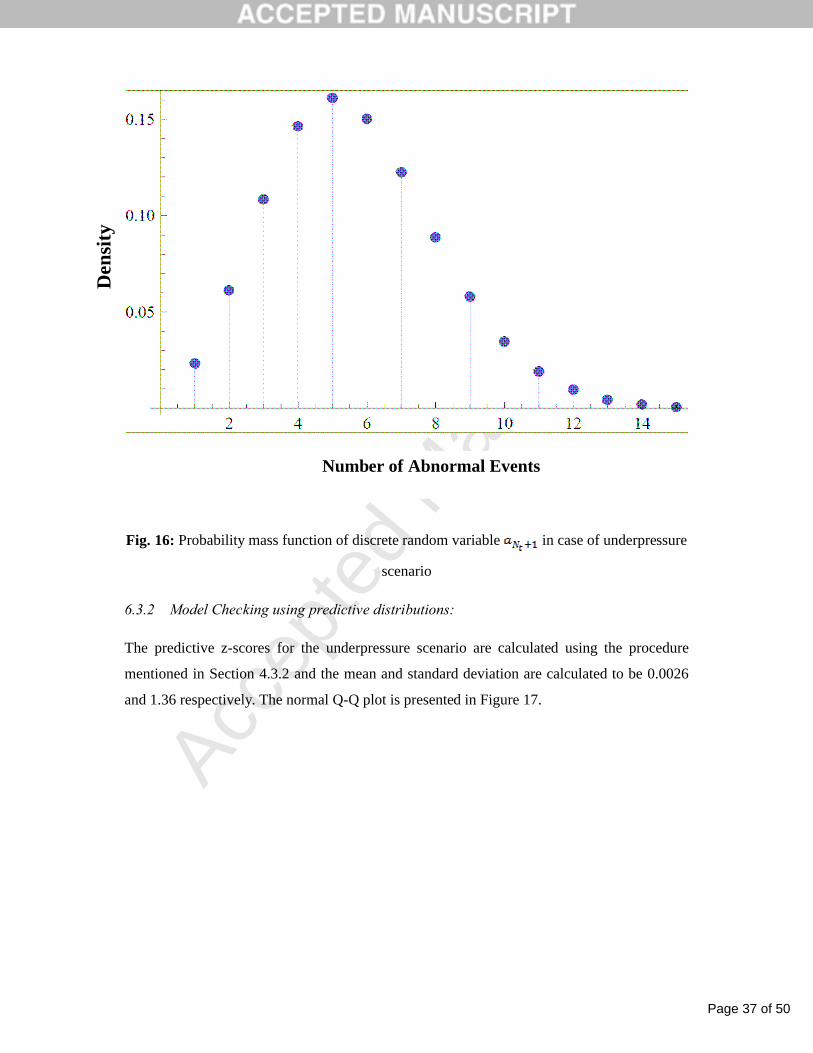
6.3.1 Rate of occurrence of an abnormal event i.e. underpressure scenario
The total number of abnormal events i.e. events due to underpressure scenarios over the
observed 10 year period is 51. Mathematica 6.0 is used to plot the probability distribution
function of the random variable from Equation 5 per time interval. The mean is equal
to5.67 and standard deviation is equal to 2.51. This compares well with the calculated mean
of 5.1 and standard deviation of 2.15.
Page 37 of 50
Accep
ted
Man
uscr
ipt
Fig. 16: Probability mass function of discrete random variable in case of underpressure
scenario
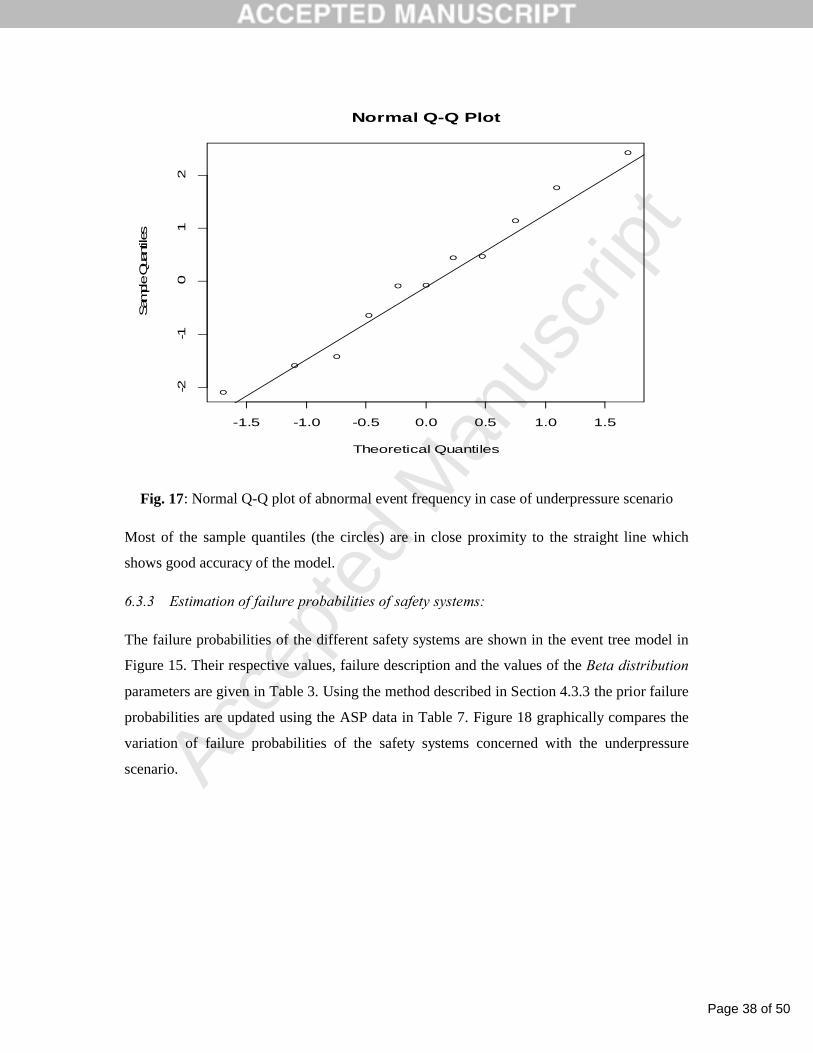
6.3.2 Model Checking using predictive distributions:
The predictive z-scores for the underpressure scenario are calculated using the procedure
mentioned in Section 4.3.2 and the mean and standard deviation are calculated to be 0.0026
and 1.36 respectively. The normal Q-Q plot is presented in Figure 17.
Number of Abnormal Events
Den
sity
Page 38 of 50
Accep
ted
Man
uscr
ipt
-1.5 -1.0 -0.5 0.0 0.5 1.0 1.5
-2-1
01
2
Normal Q-Q Plot
Theoretical Quantiles
Sam
ple Quan
tiles
Fig. 17: Normal Q-Q plot of abnormal event frequency in case of underpressure scenario
Most of the sample quantiles (the circles) are in close proximity to the straight line which
shows good accuracy of the model.
6.3.3 Estimation of failure probabilities of safety systems:
The failure probabilities of the different safety systems are shown in the event tree model in
Figure 15. Their respective values, failure description and the values of the Beta distribution
parameters are given in Table 3. Using the method described in Section 4.3.3 the prior failure
probabilities are updated using the ASP data in Table 7. Figure 18 graphically compares the
variation of failure probabilities of the safety systems concerned with the underpressure
scenario.
Page 39 of 50
Accep
ted
Man
uscr
ipt
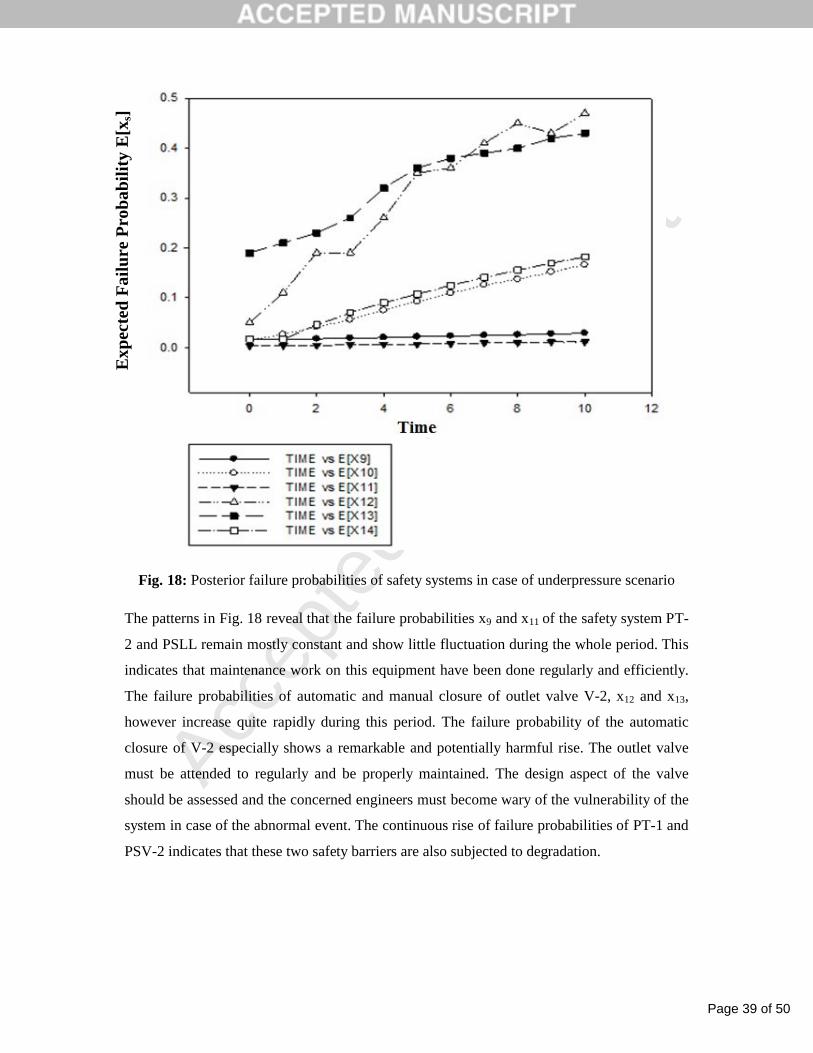
Fig. 18: Posterior failure probabilities of safety systems in case of underpressure scenario
The patterns in Fig. 18 reveal that the failure probabilities x9 and x11 of the safety system PT-
2 and PSLL remain mostly constant and show little fluctuation during the whole period. This
indicates that maintenance work on this equipment have been done regularly and efficiently.
The failure probabilities of automatic and manual closure of outlet valve V-2, x12 and x13,
however increase quite rapidly during this period. The failure probability of the automatic
closure of V-2 especially shows a remarkable and potentially harmful rise. The outlet valve
must be attended to regularly and be properly maintained. The design aspect of the valve
should be assessed and the concerned engineers must become wary of the vulnerability of the
system in case of the abnormal event. The continuous rise of failure probabilities of PT-1 and
PSV-2 indicates that these two safety barriers are also subjected to degradation.
Exp
ecte
d F
ailu
re P
rob
abil
ity
E[x
s]
Page 40 of 50
Accep
ted
Man
uscr
ipt
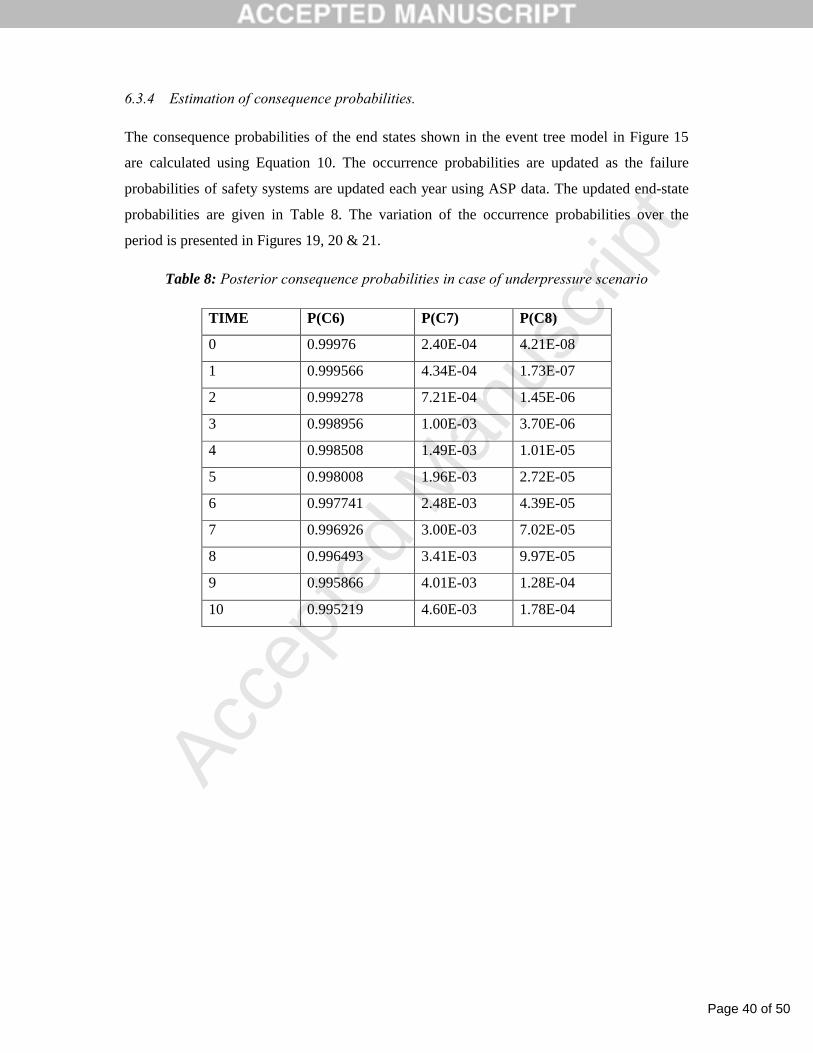
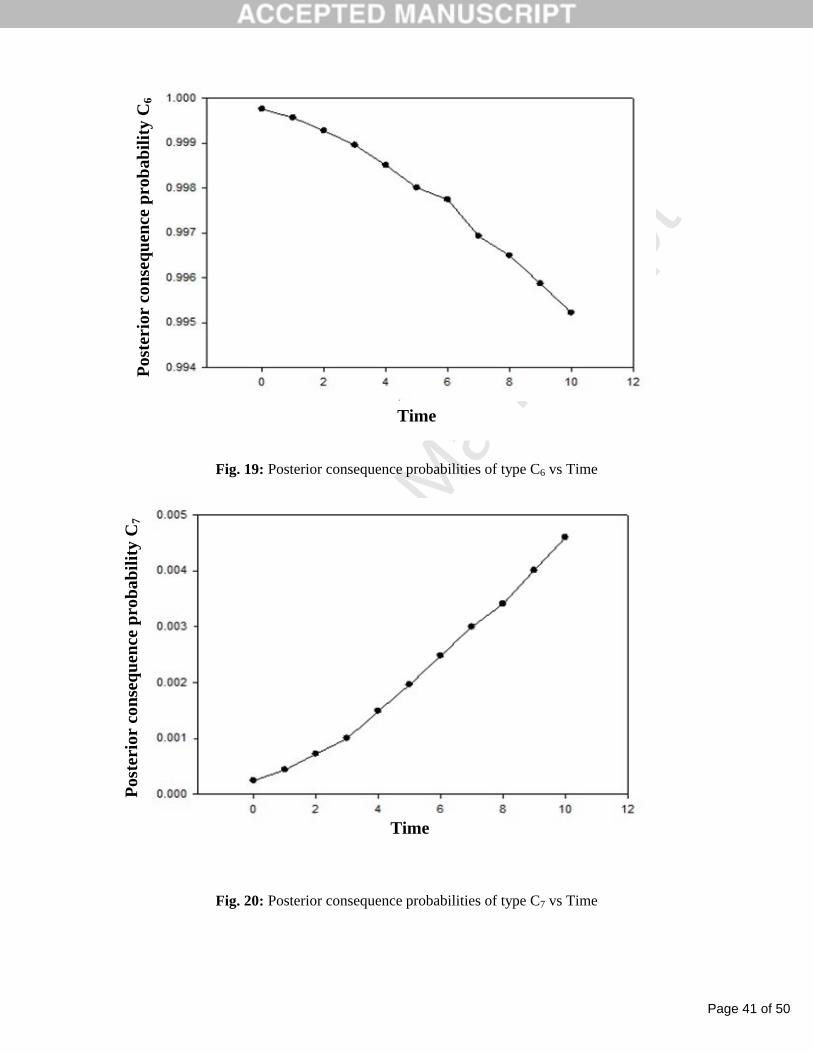
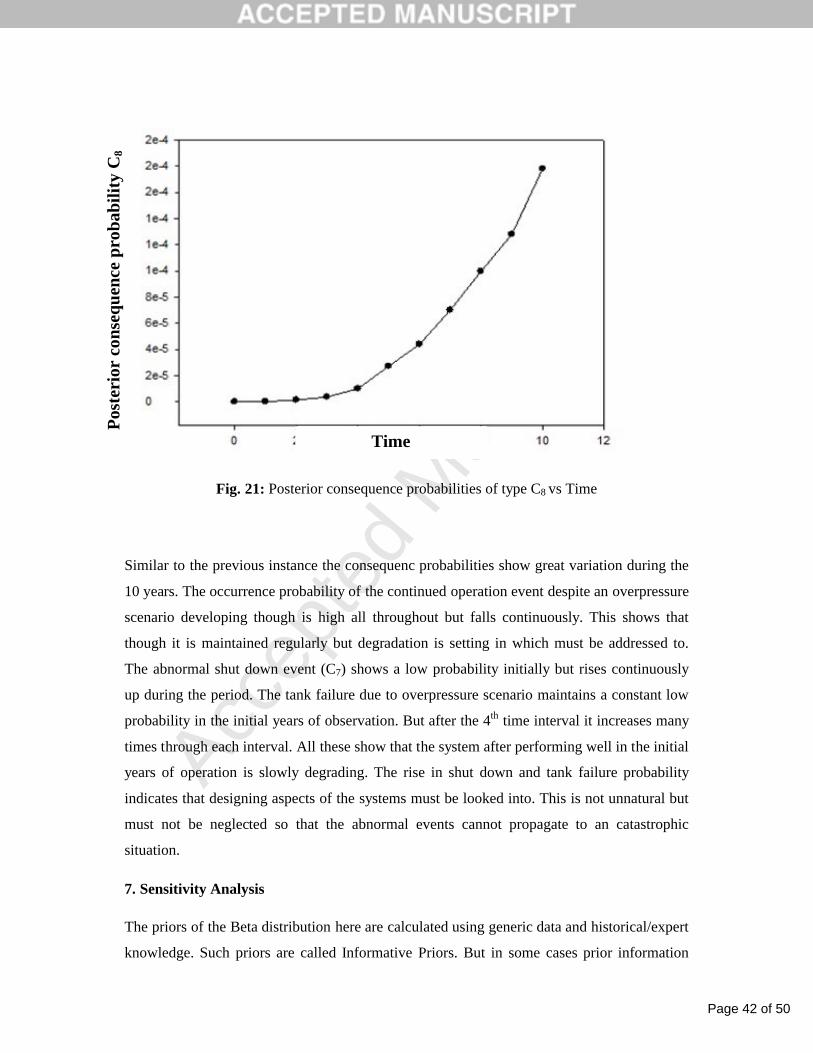
6.3.4 Estimation of consequence probabilities.
The consequence probabilities of the end states shown in the event tree model in Figure 15
are calculated using Equation 10. The occurrence probabilities are updated as the failure
probabilities of safety systems are updated each year using ASP data. The updated end-state
probabilities are given in Table 8. The variation of the occurrence probabilities over the
period is presented in Figures 19, 20 & 21.
Table 8: Posterior consequence probabilities in case of underpressure scenario
TIME P(C6) P(C7) P(C8)
0 0.99976 2.40E-04 4.21E-08
1 0.999566 4.34E-04 1.73E-07
2 0.999278 7.21E-04 1.45E-06
3 0.998956 1.00E-03 3.70E-06
4 0.998508 1.49E-03 1.01E-05
5 0.998008 1.96E-03 2.72E-05
6 0.997741 2.48E-03 4.39E-05
7 0.996926 3.00E-03 7.02E-05
8 0.996493 3.41E-03 9.97E-05
9 0.995866 4.01E-03 1.28E-04
10 0.995219 4.60E-03 1.78E-04
Page 41 of 50
Accep
ted
Man
uscr
ipt
Fig. 19: Posterior consequence probabilities of type C6 vs Time
Fig. 20: Posterior consequence probabilities of type C7 vs Time
Time
Pos
teri
or c
onse
qu
ence
pro
bab
ilit
y C
6
Time
Pos
teri
or c
onse
qu
ence
pro
bab
ilit
y C
7
Page 42 of 50
Accep
ted
Man
uscr
ipt
Fig. 21: Posterior consequence probabilities of type C8 vs Time
Similar to the previous instance the consequenc probabilities show great variation during the
10 years. The occurrence probability of the continued operation event despite an overpressure
scenario developing though is high all throughout but falls continuously. This shows that
though it is maintained regularly but degradation is setting in which must be addressed to.
The abnormal shut down event (C7) shows a low probability initially but rises continuously
up during the period. The tank failure due to overpressure scenario maintains a constant low
probability in the initial years of observation. But after the 4th time interval it increases many
times through each interval. All these show that the system after performing well in the initial
years of operation is slowly degrading. The rise in shut down and tank failure probability
indicates that designing aspects of the systems must be looked into. This is not unnatural but
must not be neglected so that the abnormal events cannot propagate to an catastrophic
situation.
7. Sensitivity Analysis
The priors of the Beta distribution here are calculated using generic data and historical/expert
knowledge. Such priors are called Informative Priors. But in some cases prior information
Time
Pos
teri
or c
onse
qu
ence
pro
bab
ilit
y C
8
Page 43 of 50
Accep
ted
Man
uscr
ipt
may not be available which prompt the use of non-informative priors. The non-informative
priors are formulated using different approaches.
Sensitivity analysis or Robustness analysis helps to assess the effect of the uncertainty in
input on the output of a mathematical model and to evaluate the effects of various
distributions. Herein sensitivity analysis is carried out by using non-informative priors in the
form of uniform distributions to assess the effect of different distributions.
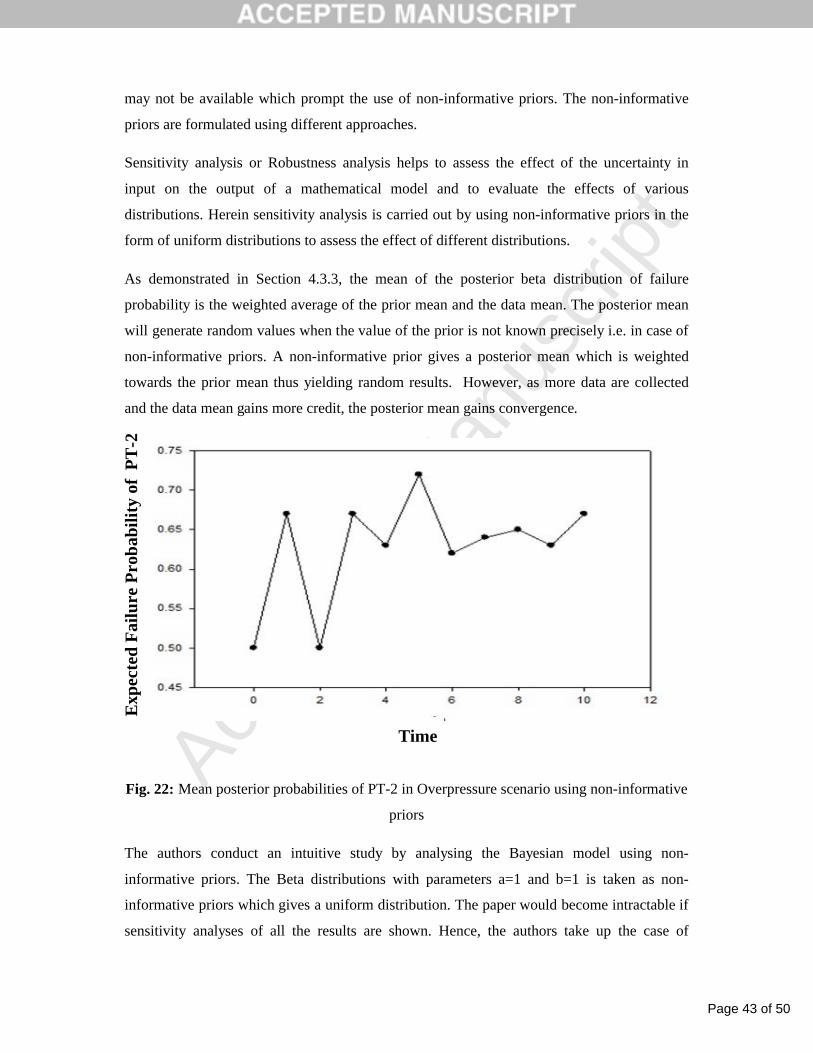
As demonstrated in Section 4.3.3, the mean of the posterior beta distribution of failure
probability is the weighted average of the prior mean and the data mean. The posterior mean
will generate random values when the value of the prior is not known precisely i.e. in case of
non-informative priors. A non-informative prior gives a posterior mean which is weighted
towards the prior mean thus yielding random results. However, as more data are collected
and the data mean gains more credit, the posterior mean gains convergence.
Fig. 22: Mean posterior probabilities of PT-2 in Overpressure scenario using non-informative
priors
The authors conduct an intuitive study by analysing the Bayesian model using non-
informative priors. The Beta distributions with parameters a=1 and b=1 is taken as non-
informative priors which gives a uniform distribution. The paper would become intractable if
sensitivity analyses of all the results are shown. Hence, the authors take up the case of
Time
Exp
ecte
d F
ailu
re P
rob
abil
ity
of P
T-2
Page 44 of 50
Accep
ted
Man
uscr
ipt
posterior failure probability of pressure transmitter PT-2 in case of an overpressure scenario
as a random example. The variation of failure probability using non-informative priors of the
safety system PT-2 in case of the overpressure scenario is shown in Fig. 22. Comparing with
Fig. 12 where informative priors are used we can see that the variations are higher in the
initial time periods. But as more data are collected the results start converging. This shows
that the posterior functions are more affected by the prior functions during the initial time
intervals which play an important role in risk estimation. It should be noted here that since
the prior parameters are not the same the posterior results differ in the two cases.
8. Conclusion
The study shows the effectiveness of the use of dynamic failure assessment tool in
conducting an failure assessment study of a utility in process industries. The method can be
used to detect the vulnerable areas of a system which helps to prevent escalation of an
abnormal event to a major accident. The dynamics of a plant must always be considered for a
proper safety assessment. Safety analysts and researchers thus are very must interested in
developing methods for assessing dynamic reliability. However, most of these methods
employ complex calculations and require large computational times.
The main motive of the authors is to develop a user friendly and intuitive dynamic failure
assessment methodology. The technique employs simple calculations using plant specific
data and requires nominal computational time. It can however sufficiently adapt to the
changing operating conditions of a process plant. Safety engineers can employ the tool during
their yearly safety reports to identify specific areas which require more checks and repair.
The authors acknowledge the fact that the tool is insufficient to address the design aspects of
the faulty system. It is the first step of a dynamic reliability assessment which can readily
identify the most vulnerable areas of a specific plant. This is of utmost importance during the
preparation of maintenance and safety reports in process plants.
Abnormal events are not as severe as accidents however if proper measures are not taken they
can escalate catastrophic accidents. These events occur regularly at plants but generally go
unreported due to their less-severe nature. Proper documentation of these events in industries
should be encouraged and must be made available to analysts. This data can be used
effectively to carry out operational risk assessment in process industries.
Page 45 of 50
Accep
ted
Man
uscr
ipt
The authors would like to recommend extending this study by incorporating the human
factors in case of an abnormal event. This will necessitate the incorporation of failure
dependency between the safety systems. Copula Theory can be used to express the joint
probability distributions and Alternative distributions for both the prior and likelihood
functions can also be explored. If the proper loss value for the abnormal events is known then
the risk values can be estimated. Plant specific loss values can be used in safety analysis
analyses to conduct plant specific risk assessment study. The methodology helps to identify
the most vulnerable areas of a process unit. This helps to narrow the domain when conducting
more design specific studies using Dynamic Fault Trees. Qualitative analysis using minimal
cut sets of component failures leading to system failure can be carried out.
Acknowledgment:
This study was supported by Indian Institute of Technology Roorkee, Roorkee INDIA and
MHRD INDIA.
References:
Aldemir, T., N. Siu, et al. (1994). Approaching Dynamic Reliability By Monte Carlo
Simulation. Reliability and Safety Assessment of Dynamic Process Systems, Springer Berlin
Heidelberg. 120
Aneziris O. N., Papazoglou I. A., Lygerou V., Dynamic safety analysis of process systems
with an application to a cryogenic ammonia storage tank, Journal of Loss Prevention in the
Process Industries, Volume 13, Issue 2, March 2000, Pages 153-165, ISSN 0950-4230,
http://dx.doi.org/10.1016/S0950-4230(99)00060-1.
Bolch G, Greiner S, Meer H, and Trivedi K S. 1998. Queueing Networks and Markov
Chains: Modeling and Performance Evaluation with Computer Science Applications. Wiley-
Interscience, New York, NY, USA.
Bucci P, Kirschenbaum J, Mangan L. Anthony, Aldemir T, Smith C, Wood T, Construction
of event-tree/fault-tree models from a Markov approach to dynamic system reliability,
Reliability Engineering & System Safety, Volume 93, Issue 11, November 2008, Pages 1616-
1627, ISSN 0951-8320,
Page 46 of 50
Accep
ted
Man
uscr
ipt
Chiacchio F, Compagno L, D'Urso D, Manno G, Trapani N, Dynamic fault trees resolution:
A conscious trade-off between analytical and simulative approaches, Reliability Engineering
& System Safety, Volume 96, Issue 11, November 2011, Pages 1515-1526, ISSN 0951-8320,
http://dx.doi.org/10.1016/j.ress.2011.06.014.
Codetta-Raiteri, D. "Modeling and simulating a benchmark on dynamic reliability, as a
Stochastic Activity Network." Proceedings of the European Modeling & Simulation
Symposium. 2011
Codetta-Raiteri, D. and L. Portinale "Approaching dynamic reliability with predictive and
diagnostic purposes by exploiting dynamic Bayesian networks." Proceedings of the
Institution of Mechanical Engineers, Part O: Journal of Risk and Reliability.(2014)
Component Reliability Data for use in Probabilistic Safety Assessment,© IAEA,1988,
(http://www-pub.iaea.org/books/IAEABooks/733/Component-Reliability-Data-for-Use-in-
Probabilistic-Safety-Assessment)
Crowl, D., Louvar, J.F., 2002. Chemical process safety. In: Fundamentals with Application,
Second ed. Prentice Hall Inc, NJ.
Devooght, J., & Smidts, C. (1992). Probabilistic reactor dynamics. I. The theory of
continuous event trees. Nuclear science and engineering, 111(3), 229-240.
Devooght J, Smidts C, Probabilistic dynamics as a tool for dynamic PSA, Reliability
Engineering & System Safety, Volume 52, Issue 3, June 1996, Pages 185-196, ISSN 0951-
8320, http://dx.doi.org/10.1016/0951-8320(95)00135-2.
Drogaris G., "MARS - Lessons Learned from Accidents Notified", CEC-JRC, EUR 13385
EN (1991).
Dugan, J B.; Bavuso, Salvatore J.; Boyd, M.A, "Dynamic fault-tree models for fault-tolerant
computer systems," Reliability, IEEE Transactions on , vol.41, no.3, pp.363,377, Sep 1992
doi: 10.1109/24.159800
Eckerman, I., 2005. The Bhopal Saga: Causes and Consequences of the World’s Largest
Industrial Disaster. Universities Press (India), India.
Gentleman, R., Ihaka, R., Bates, D., Chambers, J., Dalgaard, J., Hornik, K.,2005. The R
project for Statistical Computing. (http://www.r-project.org/).
Page 47 of 50
Accep
ted
Man
uscr
ipt
Griffiths R. F., Megson L. C., The effect of uncertainties in human toxic response on hazard
range estimation for ammonia and chlorine, Atmospheric Environment (1967), Volume 18,
Issue 6, 1984, Pages 1195-1206, ISSN 0004-6981, http://dx.doi.org/10.1016/0004-
6981(84)90151-3.
Guidelines for Process Equipment Reliability Data with Data Tables, Center for Chemical
Process Safety of the American Institute of Chemical Engineers, New York, NY, USA
(1989).
IEEE Standard Reliability Data for Pumps and Drivers, Valve Actuators, and Valves,"
ANSI/IEEE Std 500-1984 P&V , vol., no., pp.0_1,, 1984 doi: 10.1109/IEEESTD.1986.86307
Kalantarnia M, Khan F, Hawboldt K, Modelling of BP Texas City refinery accident using
dynamic risk assessment approach, Process Safety and Environmental Protection, Volume
88, Issue 3, May 2010, Pages 191-199, ISSN 0957-5820,
http://dx.doi.org/10.1016/j.psep.2010.01.004.
Kalantarnia M, Khan F, Hawboldt K, Dynamic risk assessment using failure assessment and
Bayesian theory, Journal of Loss Prevention in the Process Industries, Volume 22, Issue 5,
September 2009, Pages 600-606, ISSN 0950-4230,
http://dx.doi.org/10.1016/j.jlp.2009.04.006.
Khan F I, Abbasi S A, Risk analysis of a typical chemical industry using ORA procedure,
Journal of Loss Prevention in the Process Industries, Volume 14, Issue 1, January 2001,
Pages 43-59, ISSN 0950-4230, http://dx.doi.org/10.1016/S0950-4230(00)00006-1.
Khan F I, Abbasi S A, A criterion for developing credible accident scenarios for risk
assessment, Journal of Loss Prevention in the Process Industries, Volume 15, Issue 6,
November 2002, Pages 467-475, ISSN 0950-4230, http://dx.doi.org/10.1016/S0950-
4230(02)00050-5.
Khan F I, Abbasi S A, Analytical simulation and PROFAT II: a new methodology and a
computer automated tool for fault tree analysis in chemical process industries, Journal of
Hazardous Materials, Volume 75, Issue 1, 10 July 2000, Pages 1-27, ISSN 0304-3894,
http://dx.doi.org/10.1016/S0304-3894(00)00169-2.
Khan F I, Iqbal A, Ramesh N, Abbasi S.A., SCAP: a new methodology for safety
management based on feedback from credible accident-probabilistic fault tree analysis
Page 48 of 50
Accep
ted
Man
uscr
ipt
system, Journal of Hazardous Materials, Volume 87, Issues 1–3, 12 October 2001, Pages 23-
56, ISSN 0304-3894, http://dx.doi.org/10.1016/S0304-3894(01)00276-X.
Khan F I, Husain T, Abbasi S A, Design and evaluation of safety measures using a newly
proposed methodology “SCAP”, Journal of Loss Prevention in the Process Industries,
Volume 15, Issue 2, March 2002, Pages 129-146, ISSN 0950-4230,
http://dx.doi.org/10.1016/S0950-4230(01)00026-2.
Khakzad N, Khan F, Amyotte P, Quantitative risk analysis of offshore drilling operations: A
Bayesian approach, Safety Science, Volume 57, August 2013c, Pages 108-117, ISSN 0925-
7535, http://dx.doi.org/10.1016/j.ssci.2013.01.022.
Kirchsteiger C, Impact of accident precursors on risk estimates from accident databases,
Journal of Loss Prevention in the Process Industries, Volume 10, Issue 3, May 1997, Pages
159-167, ISSN 0950-4230, http://dx.doi.org/10.1016/S0950-4230(96)00047-2.
Knegtering B, Pasman H, The safety barometer: How safe is my plant today? Is
instantaneously measuring safety level utopia or realizable?, Journal of Loss Prevention in
the Process Industries, Volume 26, Issue 4, July 2013, Pages 821-829, ISSN 0950-4230,
http://dx.doi.org/10.1016/j.jlp.2013.02.012.
Labeau P.E., Smidts C, Swaminathan S, Dynamic reliability: towards an integrated platform
for probabilistic risk assessment, Reliability Engineering & System Safety, Volume 68, Issue
3, June 2000, Pages 219-254, ISSN 0951-8320, http://dx.doi.org/10.1016/S0951-
8320(00)00017-X.
Luo P, Hu Y, System risk evolution analysis and risk critical event identification based on
event sequence diagram, Reliability Engineering & System Safety, Volume 114, June 2013,
Pages 36-44, ISSN 0951-8320, http://dx.doi.org/10.1016/j.ress.2013.01.002.
Marseguerra M, Zio E. (1994). Approaching dynamic reliability by Monte Carlo simulation.
In Reliability and Safety Assessment of Dynamic Process Systems (pp. 44-58). Springer
Berlin Heidelberg
Page 49 of 50
Accep
ted
Man
uscr
ipt
Marseguerra M, Zio E, Monte Carlo approach to PSA for dynamic process systems,
Reliability Engineering & System Safety, Volume 52, Issue 3, June 1996, Pages 227-241,
ISSN 0951-8320, http://dx.doi.org/10.1016/0951-8320(95)00131-X.
Marseguerra M, Zio E, Devooght J, Labeau P E, A concept paper on dynamic reliability via
Monte Carlo simulation, Mathematics and Computers in Simulation, Volume 47, Issues 2–5,
1 August 1998, Pages 371-382, ISSN 0378-4754, http://dx.doi.org/10.1016/S0378-
4754(98)00112-8.
McGowan P. A., Advanced safety features of an ammonia tank, International Journal of
Pressure Vessels and Piping, Volume 77, Issue 13, November 2000, Pages 783-789, ISSN
0308-0161, http://dx.doi.org/10.1016/S0308-0161(00)00070-3.
Meel A, Seider W D, Plant-specific dynamic failure assessment using Bayesian theory,
Chemical Engineering Science, Volume 61, Issue 21, 6 November 2006, Pages 7036-7056,
ISSN 0009-2509, http://dx.doi.org/10.1016/j.ces.2006.07.007.
Meel A, O’Neill L M, Levin J H, Seider W D, Oktem U, Keren N, Operational risk
assessment of chemical industries by exploiting accident databases, Journal of Loss
Prevention in the Process Industries, Volume 20, Issue 2, March 2007, Pages 113-127, ISSN
0950-4230, http://dx.doi.org/10.1016/j.jlp.2006.10.003.
Pariyani A, Seider W D, Oktem U G, & Soroush M (2010). Improving process safety and
product quality using large databases. In 20th European symposium on computer aided
process engineering (ESCAPE).
Pariyani A, Seider W D, Oktem U G and Soroush M, (2012a), Dynamic risk analysis using
alarm databases to improve process safety and product quality: Part I—Data compaction.
AIChE J., 58: 812–825. doi: 10.1002/aic.12643
Pariyani A, Seider W D, Oktem U G and Soroush M, (2012b), Dynamic risk analysis using
alarm databases to improve process safety and product quality: Part II—Bayesian analysis.
AIChE J., 58: 826–841. doi: 10.1002/aic.12642
Pasman H, Rogers W, Bayesian networks make LOPA more effective, QRA more
transparent and flexible, and thus safety more definable!, Journal of Loss Prevention in the
Process Industries, Volume 26, Issue 3, May 2013, Pages 434-442, ISSN 0950-4230,
http://dx.doi.org/10.1016/j.jlp.2012.07.016.
Page 50 of 50
Accep
ted
Man
uscr
ipt
Siu N, Risk assessment for dynamic systems: An overview, Reliability Engineering &
System Safety, Volume 43, Issue 1, 1994, Pages 43-73, ISSN 0951-8320,
http://dx.doi.org/10.1016/0951-8320(94)90095-7.
Swaminathan S, Smidts C, Identification of missing scenarios in ESDs using probabilistic
dynamics, Reliability Engineering & System Safety, Volume 66, Issue 3, December 1999,
Pages 275-279, ISSN 0951-8320, http://dx.doi.org/10.1016/S0951-8320(99)00024-1.
T-Book, 3rd edition, Reliability Data of Components in Nordic Nuclear Power Plants,
Prepared by the ATV Office and Studsvik AB. Published by the ATV Office, Vattenfall AB,
1992
Weber P, Medina-Oliva G, Simon C, Iung B, Overview on Bayesian networks applications
for dependability, risk analysis and maintenance areas, Engineering Applications of Artificial
Intelligence, Volume 25, Issue 4, June 2012, Pages 671-682, ISSN 0952-1976,
http://dx.doi.org/10.1016/j.engappai.2010.06.002.