Embed Size (px)
Citation preview

Dynamic and structural stability of cubic
vanadium nitride
A. B. Mei, Olle Hellman, N. Wireklint, C. M. Schlepuetz, Davide Sangiovanni, Björn Alling,
A. Rockett, Lars Hultman, Ivan Petrov and Joseph E Greene
Linköping University Post Print
N.B.: When citing this work, cite the original article.
Original Publication:
A. B. Mei, Olle Hellman, N. Wireklint, C. M. Schlepuetz, Davide Sangiovanni, Björn Alling,
A. Rockett, Lars Hultman, Ivan Petrov and Joseph E Greene, Dynamic and structural stability
of cubic vanadium nitride, 2015, Physical Review B. Condensed Matter and Materials Physics,
(91), 5, 054101.
http://dx.doi.org/10.1103/PhysRevB.91.054101
Copyright: American Physical Society
http://www.aps.org/
Postprint available at: Linköping University Electronic Press
http://urn.kb.se/resolve?urn=urn:nbn:se:liu:diva-114566

PHYSICAL REVIEW B 91, 054101 (2015)
Dynamic and structural stability of cubic vanadium nitride
A. B. Mei,1 O. Hellman,2,3 N. Wireklint,4 C. M. Schleputz,5 D. G. Sangiovanni,2 B. Alling,2 A. Rockett,1 L. Hultman,2
I. Petrov,1,2 and J. E. Greene1,2
1Department of Materials Science and the Materials Research Laboratory, University of Illinois, 104 South Goodwin,Urbana, Illinois 61801, USA
2Department of Physics (IFM), Linkoping University, SE-58183 Linkoping, Sweden3Department of Applied Physics and Materials Science, California Institute of Technology, Pasadena, California 91125, USA
4Department of Applied Physics, Chalmers University of Technology, SE-41296 Goteborg, Sweden5X-Ray Science Division, Advanced Photon Source, Argonne National Laboratory, 9700 S. Cass Avenue, Argonne, Illinois 60439, USA
(Received 12 December 2014; published 2 February 2015)
Structural phase transitions in epitaxial stoichiometric VN/MgO(011) thin films are investigated usingtemperature-dependent synchrotron x-ray diffraction (XRD), selected-area electron diffraction (SAED), resis-tivity measurements, high-resolution cross-sectional transmission electron microscopy, and ab initio moleculardynamics (AIMD). At room temperature, VN has the B1 NaCl structure. However, below Tc = 250 K, XRD andSAED results reveal forbidden (00l) reflections of mixed parity associated with a noncentrosymmetric tetragonalstructure. The intensities of the forbidden reflections increase with decreasing temperature following the scalingbehavior I ∝ (Tc − T )1/2. Resistivity measurements between 300 and 4 K consist of two linear regimes resultingfrom different electron/phonon coupling strengths in the cubic and tetragonal-VN phases. The VN transportEliashberg spectral function α2
trF (�ω), the product of the phonon density of states F (�ω) and the transportelectron/phonon coupling strength α2
tr(�ω), is determined and used in combination with AIMD renormalizedphonon dispersion relations to show that anharmonic vibrations stabilize the NaCl structure at T > Tc. Free-energycontributions due to vibrational entropy, often neglected in theoretical modeling, are essential for understandingthe room-temperature stability of NaCl-structure VN, and of strongly anharmonic systems in general.
DOI: 10.1103/PhysRevB.91.054101 PACS number(s): 63.20.−e, 63.20.Ry, 64.70.K−
I. INTRODUCTION
Group-VB transition-metal (TM) nitrides with ten va-lence electrons per formula unit—VN, NbN, and TaN—areknown to have the B1 NaCl structure at room temperature[1–4]. However, first-principles density-functional theory(DFT) calculation results show that in the ideal B1 structure,these compounds exhibit dynamic instabilities characterizedby imaginary acoustic-phonon energies around the X pointat 0 K [5,6]. Physically, imaginary energies indicate thatthe restoring forces experienced by displaced atoms, in thepresence of lattice vibrational waves, are insufficient to returnatoms to their ideal positions; instead, atoms become trapped inpotential energy minima located at different crystallographiccoordinates, thus leading to a crystal structure transformation.Three decades ago, Kubel et al. [7] reported a cubic-to-tetragonal phase transition upon cooling bulk polycrystallinestoichiometric VN samples below 204 K. Lattice symmetrybreaking was observed by x-ray diffraction and confirmed byheat capacity measurements. Recently, Ivashchenko et al. [8]found, using density-functional perturbation theory, that thelow-temperature tetragonal-VN structure is dynamically stableat 0 K, with all phonon modes exhibiting positive, real energies.
A rigorous explanation of the thermodynamic stability ofroom-temperature stoichiometric NaCl-structure VN is lack-ing. Ivashchenko and Turchi [6] simulated vacancies on bothcation and anion VN sublattices by convolving the ideal VNband structure with Gaussian functions. They linked increasesin the electronic temperature, i.e., broadening of convolutedlinewidths, to increased vacancy concentrations and found thatthe cubic-VN structure becomes energetically favored over thetetragonal structure at absolute zero when the joint vacancy
concentration is greater than 6% on both sublattices. Weberet al. [9] determined room-temperature phonon dispersionrelations for bulk understoichiometric single-crystal VN0.86
using inelastic neutron scattering and showed that, in thepresence of anion vacancies, acoustic-phonon energies aroundthe X point are real, thus reflecting a dynamically stable cubicstructure. Kubel et al. [7] reported that polycrystalline under-stoichiometric bulk VN1−x samples with x > 0.03 remain inthe cubic phase when cooled to cryogenic temperatures and donot undergo the cubic-to-tetragonal phase transition observedin their stoichiometric samples.
We have previously shown that high-structural-qualitysingle-crystal stoichiometric VN/MgO(011) films have theNaCl structure [10]. Thus, vacancies are not necessary tostabilize the cubic phase. Instead, we show here that cubic VNis dynamically stabilized by anharmonic atomic vibrations.
We use temperature-dependent synchrotron x-ray diffrac-tion (XRD), high-resolution cross-sectional transmission elec-tron microscopy (HR-XTEM), selected-area electron diffrac-tion (SAED), ab initio molecular dynamics (AIMD), andresistivity ρ measurements to investigate structural phase tran-sitions in stoichiometric VN/MgO(011) thin films. Between300 and 250 K, XRD scans and SAED patterns consist onlyof single-crystal reflections with Miller indices which are alleven or all odd, consistent with the NaCl-structure factor.At lower temperatures, we observe forbidden reflections withMiller indices of mixed parity associated with a tetragonal-VNphase. The intensities I of the forbidden reflections increaseupon cooling below Tc = 250 K following the scaling rela-tionship I ∝ (Tc − T )1/2. Temperature-dependent resistivitymeasurements show that ρ(T ) contains two linear regions,at 250 � T � 300 K and 100 � T � 150 K, the latter due to
1098-0121/2015/91(5)/054101(11) 054101-1 ©2015 American Physical Society

A. B. MEI et al. PHYSICAL REVIEW B 91, 054101 (2015)
stronger electron/phonon interactions in the tetragonal versuscubic phase.
Computational endeavors aimed at predicting the stabilityof crystal phases often neglect vibrational entropies and relysolely on internal energies. In most crystal systems, thisassumption is justified since differences in crystal vibrationalentropies are relatively small compared to differences incrystal potential energies [11,12]. As a result, the differencein the Gibbs free energies �G—the thermodynamic quantitygoverning phase stability—between the competing phases is,at zero pressure, to a very good approximation, simply thedifference in their internal energies. For VN, however, weshow in the present work that the inclusion of anharmoniclattice vibrations and vibrational entropy is essential in orderto explain structural stability.
Using AIMD within the framework of the temperature-dependent effective potential method [13,14], we calculaterenormalized phonon dispersion relations (including many-body and self-interactions) for NaCl-structure VN as a functionof temperature between 400 and 200 K. The results showcubic VN to be dynamically stable above Tc = 250 K dueto anharmonic effects, with all phonon branches exhibitingreal energies. As the temperature is decreased, acoustic-phonon softening occurs around the X point, consistent witha transition to the tetragonal structure. From temperature-dependent resistivity measurements, we obtain, through anEinstein inversion procedure [15], the VN Eliashberg spectralfunction α2
trF (�ω), a measure of the phonon density of statesF (�ω) weighted by the electron/phonon interaction strengthsα2
tr(�ω). Spectral features corresponding to acoustic phononsare observed at �ω = 25 meV in the tetragonal-VN phase,significantly higher than the value �ω = 19 meV obtainedby room-temperature neutron-scattering measurements carriedout on bulk NaCl-structure VN. Together with results fromanharmonic perturbation theory, the lower phonon energiesof the cubic-VN phase yield higher vibrational entropieswhich, at T > Tc, stabilize the cubic structure comparedto the tetragonal phase, the thermodynamic ground stateat absolute zero. The results testify to the importanceof including many-body renormalization effects and vibra-tional entropies when describing the stability of materialsystems characterized by large anharmonicity at elevatedtemperatures.
II. EXPERIMENTAL PROCEDURE
Single-crystal, 300-nm-thick, stoichiometric B1 NaCl-structure VN layers are grown epitaxially on 10 × 10 ×0.5 mm3 MgO(011) substrates in pure N2 atmospheres at Ts =430 ◦C in a load-locked ultrahigh-vacuum magnetically unbal-anced stainless-steel dc reactive magnetron sputter-depositionsystem described in Ref. [16]. The system base pressureis 5 × 10⁻¹⁰ Torr (7 × 10⁻⁸ Pa). Ultrahigh purity (99.9999%)N2 is introduced through high-precision solenoid valves;the pressure is measured by a capacitance manometer andmaintained constant at PN2 = 20 mTorr (2.67 Pa) using anautomatic mass-flow controller. The power applied to the76-mm-diameter V target (purity 99.95%) is 100 W (467 Vand 0.222 A), yielding a VN deposition rate of 0.1 nm/s.
Prior to growth, polished MgO(011) substrates are cleanedand degreased by successive rinses in ultrasonic baths oftrichloroethane, acetone, methanol, and deionized water, andblown dry in dry N2. The substrates are then mounted onresistively heated Ta platens using Mo clips and inserted intothe sample introduction chamber for transport to the growthchamber where they are thermally degassed at 800 °C for1 h [17].
Composition and structure of as-deposited samples aredetermined using a combination of Rutherford backscatteringspectrometry (RBS), high-resolution x-ray diffraction (HR-XRD), HR-XTEM, and SAED. The RBS probe beam consistsof 2 MeV He+ ions, incident at 22.5° relative to the samplesurface normal, with a total accumulated ion dose of 100 μC;the detector is set at a 150° scattering angle. Backscatteredspectra are analyzed using the SIMNRA simulation program [18]yielding N/V ratios of 1.00 ± 0.03.
HR-XTEM images and SAED patterns are acquired in aJEOL 2100 transmission electron microscope equipped with aLaB6 crystal field-emission source operated at 200 keV. Cross-sectional specimens are prepared by gluing films to glass slidesand cutting vertical sections. The samples are mechanicallyground to thicknesses of �30 μm and then thinned to electrontransparency using a Gatan PIPS ion miller with two 3.5 keVAr+ beams incident simultaneously from above and below thesubstrate at shallow angles of 8°. Samples are rotated duringion etching. Final thinning is carried out using 100 eV Ar+ions.
XRD θ -2θ scans are acquired in a Philips Xpert MRDdiffractometer using Cu Kα radiation (wavelength λ =0.154 18 nm) in line focus. The primary optics on the diffrac-tometer consist of a parabolic mirror and a two-reflectionGe monochromator, providing an angular beam divergence of<12 arc sec with a wavelength spread of �λ/λ = 7 × 10⁻⁵;a high-speed linear detector serves as the secondary optics.
XRD pole figures, high-resolution reciprocal-space maps(HR-RSM), and scans along high-symmetry directions areobtained at beamline 33-BM of the Advanced Photon Source,Argonne National Laboratory. Experiments are performedwith the storage ring operating in top-up mode with an electronenergy of 7 GeV and an injection current of 100 mA. Usinga double-crystal Si(111) monochromator, the wavelengthof the x-ray probe beam is set to 0.08257 nm (15 keV).VN/MgO(011) samples, 5 × 5 mm2, are mounted on a Cu coldfinger, enclosed in a Be-dome-covered cryostat, and evacuatedto 1 × 10⁻⁶ Torr (1.3 × 10⁻⁴ Pa). Sample temperatures aremonitored using a Lake Shore Si diode thermometer andadjusted between 300 and 20 K by Joule heating. The x-rayprobe beam is focused onto the detector plane, yielding1 × 1012 photons/s incident on an 800 × 400 μm2 area of thesample surface.
Temperature-dependent VN resistivities between 300 and4 K are obtained using a Quantum Design physical propertymeasurement system. Ohmic contacts are fabricated by Ga+-ion etching, in a FEI Strata DB-235 focused ion-beam system,four 2-μm-diameter holes in the van der Pauw geometry [19],and then filling the holes with Pt without air exposure. Allcontacts are tested for Ohmic behavior. Current and voltagemeasurements are iterated through different contact pairs toaccount for geometric effects.
054101-2

DYNAMIC AND STRUCTURAL STABILITY OF CUBIC . . . PHYSICAL REVIEW B 91, 054101 (2015)
III. THEORETICAL PROCEDURE
Temperature-dependent VN phonon dispersion relationsare determined from AIMD simulations using the temperature-dependent effective potential technique (TDEP). The methodis described in detail in Refs. [13,14]. Briefly, anharmonicatomic displacement uj and forces Fi are obtained from AIMDsimulations carried out at finite temperatures and used togetherwith Hooke’s law to obtain temperature-dependent effectiveinteratomic force constant matrices �ij which obey cubicsymmetry and best reproduce the anharmonic behavior; thatis, which minimize �F = ∑
t,i |Fi − ∑j �ijuj | for all AIMD
time steps t . Indices i and j refer to crystallographic directions.By interpolating the finite-temperature set, together withresults obtained at absolute zero, of symmetry-irreducible [13]effective force constant matrices �ij, force constant matrices�ij at arbitrary temperatures are determined. From the Fouriertransformed �ij matrices, dynamical matrices Dij are obtainedand diagonalized to yield the temperature-dependent VNphonon dispersion relations.
Atomic forces F are computed at each molecular dynamicstime step from self-consistent electronic charge densities n[r]using the Hellmann-Feynman theorem [20,21]. The requiredn[r] values are obtained within the density-functional theoryframework by self-consistently solving the Kohn-Sham equa-tions [22] using the projector augmented wave method [23] asimplemented in VASP [24–26]. VN is modeled as a supercellconsisting of five repetitions of the B1 unit cell in eachCartesian direction (5 × 5 × 5), corresponding to 250 atoms.V pseudopotentials are based on s and d valence states;N pseudopotentials are based on s and p states. Electronicexchange and correlation effects are parametrized using theAM05 functional [27] and the plane wave expansion iscarried out up to a cut-off energy of 500 eV. Brillouin-zoneintegration is performed using the � point. Temperature-dependent effective force constant matrices �ij are obtainedfrom AIMD simulations at T = 300, 600, 900, and 1200 K.Thermal expansion effects are treated by minimizing, at eachtemperature, the Helmholtz free energy as a function ofvolume using a parabolic fit; for this purpose, simulationsare carried out using five supercell volumes based on latticeparameters 0.98, 0.99, 1.00, 1.01, and 1.02% of the equilibriumvalue at absolute zero. Simulations are run for approximately16 000 2-fs time steps; temperature is controlled using a Nosethermostat [28].
VN residual resistivities ρo due to the joint presence ofcation and anion vacancies are estimated from first-principleselectronic Green’s function calculations using the Kubo-Greenwood formalism [29–34]. The calculations are basedon the primitive face-centered-cubic unit cell with a two-atombasis set and the experimental VN lattice parameter valueao = 0.4132 nm. Vacancy-induced disorder is modeled withinthe coherent-potential approximation [35]. Expansion of theelectronic wave function in terms of atomic s, p, and d
spherical harmonics is performed using the atomic-sphereapproximation with equal, chemistry-independent, sphereradii; we find a posteriori that this configuration yields thesmallest ρo value and, thus, the highest, most conservative,estimate of the vacancy density [36]. Self-consistent VNelectronic Green’s functions are solved using the Korringa-
VN/MgO(011)t = 300 nmTs = 430 oC
VN 022
MgO 022
Lo
g In
ten
sity
[a.
u.]
20 40 60 80 110
FIG. 1. (Color online) θ -2θ XRD scan, acquired using Cu Kα
radiation, from a 300-nm-thick epitaxial VN/MgO(011) layer grownat Ts = 430 ◦C by reactive magnetron sputter deposition.
Kohn-Rostoker approximation [37,38] as implemented inSPR-KKR [32–34]. Electron exchange and correlation effectsare treated within the generalized gradient approximation asparametrized by Perdew, Burke, and Ernzerhof [39]. ResultingVN electronic band dispersion relations are found to be in goodagreement with those computed independently with VASP.
IV. RESULTS AND DISCUSSION
A. VN/MgO(011) film stoichiometry and nanostructure
RBS results establish that the VN/MgO(011) layers arestoichiometric, and compositionally uniform, with N/V =1.00 ± 0.03. Combined with XTEM measurements of filmthickness, RBS-determined atomic areal densities yield a VNmass density of 6.1 g/cm3, equal to reported results for bulkcrystals [40].
A typical XRD θ -2θ scan, acquired using Cu Kα radiation,from a VN/MgO(011) film is shown in Fig. 1; diffracted x-ray intensities are plotted logarithmically as a function of 2θ
between 10° and 110°. Over the entire 2θ range sampled, thescan exhibits only one pair of reflections, with peaks at 62.29and 63.59° 2θ assigned to MgO 022 and VN 022.
Figures 2(a) and 2(b) are typical synchrotron x-ray diffrac-tion {111} pole figures obtained from VN/MgO(011) samples.The pole figures are plotted as stereographic projectionsover azimuthal angles ϕ = 0◦−360◦ and polar angles χ =0◦−85◦ with diffracted intensities represented by logarithmicisointensity contours. The {111} VN(011) pole figure inFig. 2(a) exhibits two peaks, separated by ϕ = 180◦ andtilted χ = 35.26◦ from the surface normal, correspondingto the 111 and 111 reflections of a cubic structure. Noadditional reflections are observed. The {111} pole figure fromMgO(011) contains a pair of reflections positioned at ϕ andχ angles identical to those observed for VN(011), showingthat [111]VN||[111]MgO.VN(011) and MgO(011) {002} polefigures, presented in Fig. 2(b), also exhibit two peaks each,located, in this case, at ϕ = 0◦ and 180° with χ = 45◦,corresponding to 002 and 020 cubic reflections.
A typical VN/MgO(011) HR-XTEM image, acquiredalong the 011 zone axis, is shown in Fig. 3. Image contrastbetween the film and substrate arises predominately from
054101-3

A. B. MEI et al. PHYSICAL REVIEW B 91, 054101 (2015)
(b) {002} VN/MgO(011) pole figures
0180
VN(011) MgO(011)
30o 60
o 90o
90
270
(a) {111} VN/MgO(011) pole figuresVN(011) MgO(011)
FIG. 2. (Color online) Synchrotron x-ray diffraction VN andMgO (a) {111} and (b) {002} pole figures acquired from300-nm-thick epitaxial VN/MgO(011) layers grown at Ts = 430 ◦Cby reactive magnetron sputter deposition.
the large difference in mass between V (mV = 50.9 amu)and Mg (mMg = 24.3 amu). Based upon the combination ofx-ray θ−2θ and pole figure measurements, together with theobservation of well-ordered 001, 011, and 111 lattice fringesacross the film-substrate interface, we establish that the VNfilms are single crystals which are epitaxially oriented cube-on-cube with respect to their MgO substrates: (011)VN||(011)MgO
with [100]VN||[100]MgO. Film and substrate lattice parametersobtained from the fringe spacings are 0.413 and 0.421 nm,respectively.
Figure 4 is an x-ray diffraction HR-RSM, acquired usingCu Kα radiation, around the 022 film and substrate reflectionsand plotted as logarithmic isointensity contours as a function ofin-plane k|| and out-of-plane k⊥ reciprocal-lattice vectors. Peakpositions in reciprocal space are related to those in ω-2θ space
VN
VN/MgO(011)t = 300 nmTs = 430 oC
MgO
4 nm011
100111-
FIG. 3. High-resolution cross-sectional TEM image acquiredalong the [011] zone axis from a 300-nm-thick epitaxial VN layergrown on MgO(011) at Ts = 430 ◦C by reactive magnetron sputterdeposition.
k ⊥
VN 022
MgO 022
k||
0.1 nm-1
VN/MgO(011)t = 300 nmTs = 430 oC
FIG. 4. (Color online) High-resolution reciprocal-space x-raydiffraction map, acquired with Cu Kα radiation, about the symmetric022 reflection from a 300-nm-thick epitaxial VN layer grown onMgO(011) at Ts = 430 ◦C by reactive magnetron sputter deposition.
via k‖ = 2rE sin(θ ) cos(ω − θ ) and k⊥ = 2rE sin(θ ) sin(ω − θ )in which rE is the radius of the Ewald sphere [41,42].
VN(011) in-plane ξ|| and out-of-plane ξ⊥ x-ray coherencelengths, which serve as measures of crystalline quality,are obtained from the width of symmetric 022 reflectionsparallel �k|| and perpendicular �k⊥ to the diffraction vec-tor k through the relationships: ξ|| = 2π/|�k||| and ξ⊥ =2π/|�k⊥|. From the results shown in Fig. 4, ξ|| = 59 and ξ⊥ =140 nm. For comparison, high-structural-quality single-crystalZrN/MgO(001) films, 830 nm thick (nearly 3× thicker than thepresent VN film), grown under similar conditions exhibit ξ|| =18 and ξ⊥ = 161 nm [43]. Out-of-plane ξ⊥ values depend, inaddition to structural quality, on film thickness. The relativelylarge ξ values obtained here, comparable to well-ordered300-nm-thick VN(001), ξ|| = 57 and ξ⊥ = 159 nm [10], and260-nm-thick TiN(001), ξ|| = 86 and ξ⊥ = 142 nm [42], re-flect the high crystalline quality and low mosaicity of ourfilms.
In-plane a||, out-of-plane a⊥, and relaxed ao VN latticeparameters are determined, together with in-plane ε|| andout-of-plane ε⊥ film strains, from HR-RSMs about asymmetric311 reflections. Typical HR-RSM results are shown in Fig. 5as logarithmic isointensity contours plotted vs k‖ and k⊥reciprocal-lattice vectors. For a 311 reflection from a 011-oriented NaCl-structure sample, the in-plane a|| and out-of-plane a⊥ lattice parameters are related to the reciprocal-latticevectors through the relations a‖ = 3/k‖ and a⊥ = √
2/k⊥ [10].From measured k|| and k⊥ values, we obtain a|| = 0.4124and a⊥ = 0.4136 nm. Combining these results with the VNPoisson ratio ν = 0.19 [10], the relaxed VN lattice parameteris determined via the equation [44]
ao = a⊥(1 − ν) + a||(2ν)
(1 + ν), (1)
as ao = 0.4132 ± 0.0004 nm. The result is in agreement withthe HR-XTEM results and with published values for bulk VN,0.4134 nm [45,46]. The mild in-plane compressive strain,
054101-4

DYNAMIC AND STRUCTURAL STABILITY OF CUBIC . . . PHYSICAL REVIEW B 91, 054101 (2015)
k ⊥
0.1 nm-1
VN 311
MgO 311
VN/MgO(011)t = 300 nmTs = 430 oC
k||
FIG. 5. (Color online) High-resolution reciprocal-space x-raydiffraction map, acquired with Cu Kα radiation, about an asymmetric311 reflection from a 300-nm-thick epitaxial VN layer grown onMgO(011) at Ts = 430 ◦C by reactive magnetron sputter deposition.
ε|| = (a||/ao − 1) = −0.0019, is primarily accounted for bydifferential thermal contraction during cooling followingfilm deposition. Using the thermal contraction coefficientsfor MgO, αs = 13 × 10−6 K−1 [47], and VN, αf = 9.7 ×10⁻⁶ K−1 [48], we obtain a thermal strain of ε|| = −0.0017.Film out-of-plane strain ε⊥ = (a⊥/ao − 1) = 0.0010.
B. Temperature-dependent electron andsynchrotron x-ray diffraction
The thermal stability of stoichiometric VN in the NaClstructure is probed by temperature-dependent SAED, syn-chrotron x-ray diffraction, and resistivity measurements ρ(T ).SAED patterns are acquired at 300, 263, 258, 248, 228, 173,148, 133, and 97 K. Figure 6(a) is a typical room-temperatureSAED pattern obtained along the 011 zone axis with theselected-area aperture sampling the upper 200-nm portion ofthe film. Only single-crystal reflections are visible, consistent
000
011
000 200
022
200
022
211
(b) 97 K(a) 300 K
FIG. 6. Typical temperature-dependent selected-area electrondiffraction patterns, acquired along the [011] zone axis, from epitaxialstoichiometric VN/MgO(011) at (a) room temperature and (b) 97 Kwith the selected-area aperture sampling the upper 200 nm of the film.The VN(011) film was grown at Ts = 430 ◦C by reactive magnetronsputter deposition.
Γ X K Γ L
Lo
g. i
nte
nsi
ty [
a.u
.]
300 K 250 200 150 100 50 20
[222] [322] [222]
FIG. 7. (Color online) Temperature-dependent synchrotron x-ray diffraction intensities, acquired along high-symmetry reciprocal-space directions, from a 300-nm-thick epitaxial VN/MgO(011) layergrown at Ts = 450 ◦C. �, X, K , and L points correspond to [222],[322], [2.75 2.75 2], [222], and [2.5 2.5 2.5] positions in reciprocal[hkl] space.
with synchrotron x-ray diffraction pole figures [Figs. 2(a)and 2(b)], HR-XTEM observation of continuous lattice fringesacross the film-substrate interface (Fig. 3), and the relativelylarge x-ray coherence lengths obtained from HR-RSM results(Fig. 4). All SAED patterns obtained at T < 250 K, exhibitadditional forbidden reflections associated with Miller indicesof mixed parity, including 001, 003, and 211, due to astructural transition to a noncentrosymmetric tetragonal phase.Figure 6(b), acquired at 97 K, is a typical example.
The intensities of VN(011) forbidden reflections are ob-tained as a function of temperature from synchrotron XRDscans along high-symmetry reciprocal-space directions andHR-RSMs acquired over the temperature range from 300to 20 K. In NaCl-structure crystals, reciprocal-lattice posi-tions described by integer Miller indices of the same paritycorrespond to the [000] �-point Brillouin-zone center, whilepositions described by integer Miller indices of mixed paritycorrespond to the [100] X-point Brillouin-zone boundary.L-point [½½½] Brillouin-zone boundaries are represented byhalf-integer indices. Diffracted intensities are acquired alonghigh-symmetry directions in the Brillouin zone, centered aboutthe 222 Bragg reflection, and plotted logarithmically as afunction of temperature in Fig. 7. The curves are displacedvertically for clarity. At room temperature, Bragg conditionsare satisfied only at the Brillouin-zone center. Below 250 K,however, additional reflections, in agreement with the low-temperature SAED results in Fig. 6, appear at the X point. Theintensities of the forbidden peaks increase with decreasingtemperature.
VN/MgO(011) synchrotron HR-RSMs about forbidden003 VN reflections are acquired at temperatures between300 and 20 K. Typical maps plotted as diffracted intensityisocontours as a function of [100] and [010] reciprocal-lattice vectors k are presented in Figs. 8(a)–8(d) for T =275, 250, 200, and 100 K. Diffracted intensities are normal-ized at each temperature to highlight the absence of a peakat T = 275 K and the presence of a small 003 Bragg reflection
054101-5

A. B. MEI et al. PHYSICAL REVIEW B 91, 054101 (2015)
k 100
(d)(c)
(b)(a)k 10
0
k010 k010
FIG. 8. (Color online) Typical temperature-dependent high-resolution reciprocal-space synchrotron x-ray diffraction maps,plotted as a function of reciprocal-lattice vectors k100 and k010,about the asymmetric 003 reflection from a 300-nm-thick epitaxialstoichiometric VN/MgO(011) layer grown at Ts = 430 ◦C. Themaps are acquired at temperatures of (a) 275, (b) 250, (c) 200, and(d) 100 K. Scale bars correspond to 0.05 nm−1.
at T = 250 K. Maps at temperatures below 200 K [Figs. 8(c)and 8(d)] show well-defined 003 reflections, characterizedby asymmetric isointensity contours which extend fartheralong [100] than [011] directions. Additional 003 RSMs (notshown) acquired from 300-nm-thick VN overlayers grown onMgO(001) and MgO(111) also exhibit forbidden reflectionswith mixed-parity indices which appear at temperaturesbelow Tc = 250 K, indicating that the phase transition is notcontrolled by the film/substrate epitaxial orientation. This isin contrast to the neighboring Group-VIB compound CrN,for which 140-nm-thick films grown on MgO(001) havebeen shown to suppress the cubic-to-orthorhombic transitionobserved in bulk CrN at 280 K [49].
The temperature-dependent evolution of 003 VN reflectionintensities I (T ) is obtained by integrating three-dimensionalHR-RSM peaks acquired at temperatures between 300 and20 K; the resulting I (T ) values are plotted in Fig. 9. Over the
I2 [
a.u
.]
FIG. 9. Synchrotron XRD VN(011) forbidden 003 reflectionintensities squared, plotted as a function of temperature. Datapoints correspond to integrated 003 VN peak intensities obtainedfrom HR-RSM measurements carried out on 300-nm-thick epitaxialstoichiometric VN/MgO(011) layers, including those shown inFig. 8.
temperature range 250 � T � 300 K, the B1 cubic structurefactor is zero. Below the transition temperature Tc = 250 K,I (T ) values increase with decreasing T , following a scalingrelationship I (T ) ∝ (Tc − T )1/2.
Based on the phenomenological Landau formalism fordisplacive structural phase transitions, a temperature scalingexponent of ½, as observed here, suggests that the phasetransition is second order [50]. However, first-order phasetransitions can also exhibit a critical exponent of½ [51,52]. Inthat case, I (T ) discontinuously becomes zero at a temperatureTc
∗ prior to reaching Tc. The magnitude of the difference|Tc
∗ − Tc| is a measure of the degree to which the phasetransition is second order [53]. For VN, I (T ) appears todecrease continuously toward zero (see Fig. 9), indicating thatthe phase transition exhibits strong second-order characterwith T ∗
c � Tc. However, a second-order phase transition isforbidden by the incompatible symmetries of the VN parentcubic phase (space group Fm3m) and product tetragonal(P 42m) phase [7]. As a result, a discontinuous jump in I (T ),while below experimental detection limits, must occur at Tc
∗
near Tc. Thus, the cubic-to-tetragonal-VN phase transitionexhibits an apparent second-order character, but ultimatelyrequires, due to the symmetries of the parent and productphases, a discontinuous change in I (T ) and is therefore firstorder.
C. Ab initio molecular dynamics
Forbidden reflections of mixed parity, including 003 and211, correspond to scattering vectors k with crystal mo-menta translationally symmetric to the [001] X point in thefirst Brillouin zone. At room temperature, inelastic neutron-scattering measurements carried out on bulk VN samplesreveal phonon anomalies characterized by soft longitudinalphonon modes near the X point [9]. Quasiharmonic DFTcalculations [5] show that the anomalies become pronouncedat 0 K, with phonons exhibiting imaginary energies. Phononsare quantized lattice waves with amplitudes which depend ontime t through the factor exp( − iωt) [54], in which ω is thephonon frequency. For positive phonon energies �ω, the latticewave propagates with a group velocity vg = ∇kω. At zerophonon energy, the wave ceases to evolve with time and theatoms are frozen at their displaced coordinates, resulting in atransformed structure. Imaginary phonon energies correspondto a wave amplitude which grows increasingly large in anunphysical manner as time progresses. This is the signatureof a dynamically unstable system. In order to investigate thedynamic stability of VN, as influenced by phonon softening,temperature-dependent renormalized (including many-bodyand self-interactions) VN phonon dispersion relations arecomputed using TDEP.
Figure 10 shows calculated VN phonon dispersion relations�ωj (k) along high-symmetry directions for eight temperaturesbetween 400 and 200 K. At 400 K, VN phonon energies arereal over the entire Brillouin zone as a direct result of an-harmonic vibrations. Pronounced anomalies, characterized bysoft longitudinal and transverse acoustic (LA and TA) phononmodes (�ωLA = 8.7 and �ωTA = 12.4 meV), occur near the X
point. At lower temperatures, the LA modes soften further dueto attenuation of anharmonic atomic vibrations resulting from
054101-6
DYNAMIC AND STRUCTURAL STABILITY OF CUBIC . . . PHYSICAL REVIEW B 91, 054101 (2015)
Γ X LΓ
[
meV
]
10
20
30
40
50
60
70
80
0
400 K370 340 315 285 260 230 200
[000] [100] [000] [½½½]
FIG. 10. (Color online) Renormalized VN phonon dispersionrelations, at temperatures between 400 and 200 K, obtained usingab initio molecular dynamics with temperature-dependent effectivepotentials.
changes in the interatomic force constants and the potentialenergy landscape. The energy of [001]-zone-boundary LAphonons reaches zero at the critical temperature Tc = 250 K.Below Tc, �ωLA becomes imaginary (�ωLA
2 < 0 meV). As aresult, our TDEP simulations show that NaCl-structure VNbecomes dynamically unstable below Tc = 250 K, consistentwith the structural transformation observed by temperature-dependent synchrotron XRD and SAED analyses.
D. VN temperature-dependent resistivity
The acoustic-phonon density of states for the VN tetragonalphase is evaluated via the transport Eliashberg spectral func-tion α2
trF (�ω), an energy-resolved measure of the product ofthe electron/phonon coupling strength αtr
2(�ω) and the phonondensity of states F (�ω). For group-IVB nitrides, the transportelectron/phonon coupling function αtr
2(�ω) is essentiallyconstant as a function of energy [15]. Similarly, for thegroup-VB nitride NbN, the phonon density of states, obtainedby inelastic neutron-scattering measurements using bulk singlecrystals, exhibits peaks due to acoustic and optical phononsat �ωA = 25 and �ωO = 65 meV [55], in good agreementwith values obtained by Raman spectroscopy, �ωA = 25 and�ωO = 67 meV [56]. Since features in Raman spectroscopyare strongly influenced by electron/phonon interactions[57–63], we conclude that in both group-IVB and VB nitrides,α2
trF (�ω) effectively samples the phonon density of states,allowing the energies of features in F (�ω) to be obtained fromtemperature-dependent resistivity measurements.
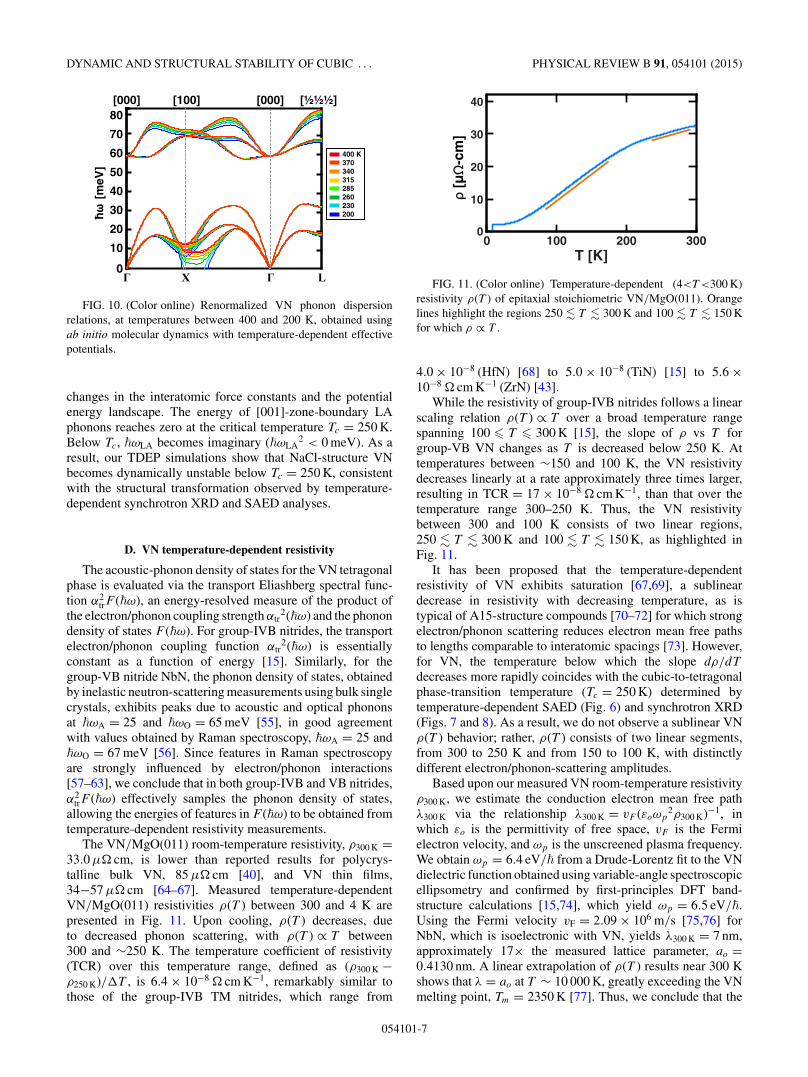
The VN/MgO(011) room-temperature resistivity, ρ300 K =33.0 μ� cm, is lower than reported results for polycrys-talline bulk VN, 85 μ� cm [40], and VN thin films,34−57 μ� cm [64–67]. Measured temperature-dependentVN/MgO(011) resistivities ρ(T ) between 300 and 4 K arepresented in Fig. 11. Upon cooling, ρ(T ) decreases, dueto decreased phonon scattering, with ρ(T ) ∝ T between300 and ∼250 K. The temperature coefficient of resistivity(TCR) over this temperature range, defined as (ρ300 K −ρ250 K)/�T , is 6.4 × 10⁻⁸ � cm K−1, remarkably similar tothose of the group-IVB TM nitrides, which range from
10
20
30
40
0 100 200 300T [K]
0
ρ [µ
Ω-c
m]
FIG. 11. (Color online) Temperature-dependent (4<T <300 K)resistivity ρ(T ) of epitaxial stoichiometric VN/MgO(011). Orangelines highlight the regions 250 � T � 300 K and 100 � T � 150 Kfor which ρ ∝ T .
4.0 × 10⁻⁸ (HfN) [68] to 5.0 × 10⁻⁸ (TiN) [15] to 5.6 ×10⁻⁸ � cm K−1 (ZrN) [43].
While the resistivity of group-IVB nitrides follows a linearscaling relation ρ(T ) ∝ T over a broad temperature rangespanning 100 � T � 300 K [15], the slope of ρ vs T forgroup-VB VN changes as T is decreased below 250 K. Attemperatures between ∼150 and 100 K, the VN resistivitydecreases linearly at a rate approximately three times larger,resulting in TCR = 17 × 10−8 � cm K−1, than that over thetemperature range 300–250 K. Thus, the VN resistivitybetween 300 and 100 K consists of two linear regions,250 � T � 300 K and 100 � T � 150 K, as highlighted inFig. 11.
It has been proposed that the temperature-dependentresistivity of VN exhibits saturation [67,69], a sublineardecrease in resistivity with decreasing temperature, as istypical of A15-structure compounds [70–72] for which strongelectron/phonon scattering reduces electron mean free pathsto lengths comparable to interatomic spacings [73]. However,for VN, the temperature below which the slope dρ/dT
decreases more rapidly coincides with the cubic-to-tetragonalphase-transition temperature (Tc = 250 K) determined bytemperature-dependent SAED (Fig. 6) and synchrotron XRD(Figs. 7 and 8). As a result, we do not observe a sublinear VNρ(T ) behavior; rather, ρ(T ) consists of two linear segments,from 300 to 250 K and from 150 to 100 K, with distinctlydifferent electron/phonon-scattering amplitudes.
Based upon our measured VN room-temperature resistivityρ300 K, we estimate the conduction electron mean free pathλ300 K via the relationship λ300 K = vF (εoωp
2ρ300 K)−1, inwhich εo is the permittivity of free space, vF is the Fermielectron velocity, and ωp is the unscreened plasma frequency.We obtain ωp = 6.4 eV/� from a Drude-Lorentz fit to the VNdielectric function obtained using variable-angle spectroscopicellipsometry and confirmed by first-principles DFT band-structure calculations [15,74], which yield ωp = 6.5 eV/�.Using the Fermi velocity vF = 2.09 × 10⁶ m/s [75,76] forNbN, which is isoelectronic with VN, yields λ300 K = 7 nm,approximately 17× the measured lattice parameter, ao =0.4130 nm. A linear extrapolation of ρ(T ) results near 300 Kshows that λ = ao at T ∼ 10 000 K, greatly exceeding the VNmelting point, Tm = 2350 K [77]. Thus, we conclude that the
054101-7

A. B. MEI et al. PHYSICAL REVIEW B 91, 054101 (2015)
proposed sublinear decrease in ρ(T ) arising from a reductionin the electron mean free path to less than ao does not occur.
The resistivity ρo of VN at temperatures T � 20 K remainsconstant at 2.12 μ� cm and is primarily determined by defectand impurity scattering. The presence of vacancies on bothcation and anion VN sublattices exceeding a vacancy fractionof fvac ∼ 0.06 has been suggested to have a stabilizing effecton the NaCl structure [6]. An upper bound on the vacancyconcentration in our VN films is obtained by comparingmeasured ρo values to those computed from first-principleselectronic Green’s function calculations using the Kubo-Greenwood formalism [29–34]. Self-consistent VN Green’sfunctions are solved using the Korringa-Kohn-Rostoker ap-proximation [37,38] as implemented in the simulations pack-age SPR-KKR [32–34]. Electron scattering rates and pertur-bations to the periodic crystal potential arising from equalconcentrations of cation and anion vacancies are modeledwithin the coherent-potential approximation [35]. Calculatedlow-temperature defect-controlled resistivities ρo increaselinearly with vacancy fraction fV following the empiri-cal relationship ρo(x) = 5.1 × 10² fvac μ� cm. Based on ourmeasured ρo value, we establish an upper limit, fvac < 0.005,to the vacancy fraction in our VN layers which is an orderof magnitude smaller than the value fvac ∼ 0.06 predicted inRef. [8] to influence the structural stability of VN. Thus, VNhas the NaCl structure at room temperature despite having amuch lower vacancy concentration.
For metallic conductors, the residual resistivity ratioRRR = ρ300 K/ρo serves as a metric for crystalline quality.Here, we obtain RRR = 16 for VN/MgO(011). Reportedvalues for high-crystalline-quality group-IVB ZrN/MgO(001)layers are 15 [15], while previous studies of VN thin filmsyield RRR values of 8.4 [65] and 10 [67]. The relativelylarge RRR value obtained here reflects the stoichiometryand high structural quality of the present VN films. As aresult, scattering events are independent and the temperature-dependent resistivity of the tetragonal-VN phase (T < 250 K)may be described by Matthiessen’s rule: ρ(T ) = ρo + ρph(T ),in which ρph(T ) is the phonon-scattering contribution toresistivity.
The VN resistivity between 100 and 10 K (Fig. 11) followsa power-law relationship ρph(T ) ∝ T 4, which is characteristicof electron/phonon scattering in metals for which the Fermisurface intersects Bragg planes. This is in contrast to thenormal ρph(T ) ∝ T 5 behavior [78], when Umklapp processesdominate scattering [79,80] and electrons are frequentlyscattered outside of the first Brillouin zone [81]. The transportEliashberg spectral function α2
trF (�ω) [78] describes theeffect of electron/phonon-scattering events on ρph(T ) via thetransform [82]:
ρph(T ) =πm∗
ne2
∫ ∞
0
�ω/kBT
sinh2(�ω/2kBT )α2
trF (�ω)d�ω. (2)
n, m∗, and e are the electron density, effective mass, andcharge. By discretizing the integral in Eq. (2) into a seriesof Einstein modes at fixed energies, the scattering amplitudefor each mode is adjusted through a least-squares procedureuntil the calculated ρph(T ) result matches the measured curve.Based upon a collection of 1000 Einstein mode energies andcorresponding amplitudes, obtained from approximately 100
20 40 60 80 100 120T [K]
20
01
R [
10-4]
-2
]
Exp.
o
ph
15
10
5
0
FIG. 12. (Color online) (a) Measured temperature-dependent re-sistivity ρ(T ) of epitaxial stoichiometric VN/MgO(011). ρ(T ) ismultiplied by a factor of 1/T (circles) to highlight contributions dueto defect scattering ρo (dashed orange line) and phonon scatteringρph(T ) (dashed blue line). The solid red curve is the calculated totalnormalized VN resistivity ρ(T )/T , for which ρ(T ) = ρo + ρph(T ).(b) Residuals R, the difference between measured and calculatedresistivities, as a function of temperature T .
fitting routines, a quasicontinuous Eliashberg spectral functiondescribing electron/phonon coupling in the low-temperaturetetragonal-VN phase is developed. A detailed account of theinversion procedure is presented in Ref. [15].
Figure 12 is a plot showing calculated VN temperature-dependent resistivities ρ(T ) = ρo + ρph(T ) between 125 and10 K, multiplied by a factor 1/T (red solid line) to highlightresistivity contributions from defects (orange dashed curve)and phonon scattering (blue dashed curve). There is nodiscernible discrepancy between calculated ρ(T )/T valuesand normalized experimental resistivity results (circles).Residuals R, defined as the difference between calculated andexperimental curves, are plotted in Fig. 12(b) and show thatthe agreement is excellent, R � 10−4, to within experimentaluncertainty. These results establish that while electron/phononscattering contributes essentially nothing to the VN resistivitybelow 20 K, it becomes the strongest electron scattering sourceabove 57 K.
The transport VN Eliashberg spectral function α2trF (�ω) for
the low-temperature tetragonal-VN phase is plotted in Fig. 13for phonon energies �ω between 0 and 60 meV. A strongcontribution from electron/acoustic-phonon interactions givesrise to a peak at �ω = 25 meV. For comparison, measurementsof phonon density of states F (�ω) obtained from room-temperature inelastic neutron-scattering experiments carriedout on bulk NaCl-structure VN reveal a softer acoustic-phononpeak at �ω = 19 meV [9]. The F (�ω) shoulder at 30 meVarises from phonon van Hove singularities, i.e., regions inreciprocal space, including near the L-point Brillouin-zoneboundary, for which the phonon group velocity vg = ∇kω iszero.
The Gibbs free energy of a dynamically stable, configura-tionally ordered, nonmagnetic, crystalline phase evolves with
054101-8

DYNAMIC AND STRUCTURAL STABILITY OF CUBIC . . . PHYSICAL REVIEW B 91, 054101 (2015)
0 10 20 30 40 50
tr2
tr2
FIG. 13. (Color online) Acoustic contributions to the tetragonal-VN transport Eliashberg spectral function α2
trF (�ω), obtained usingan Einstein inversion procedure [15] from temperature-dependent(10 < T < 125 K) resistivity measurements of epitaxial stoichiomet-ric VN/MgO(011) (blue circles). For comparison, room-temperaturecubic-VN acoustic-phonon density of states F (�ω) (gray squares),obtained from inelastic neutron-scattering measurements carried outwith bulk samples [9].
temperature T as
G = Go − T Svib − T Sel, (3)
in which Svib and Sel are vibrational and electronic entropiesand Go is a temperature-independent factor which includesenthalpies and zero-point energies. The electronic entropyfor VN is small (∼1% of the vibrational entropy) and thusneglected. The vibrational entropy Svib, for a dynamical stablephase, is given to leading order within anharmonic perturbationtheory [83] by the Mermin functional as
Svib(T )
= − ∂
∂T
{kBT
∫ ∞
0ln
[2 sinh
(�ω
2kBT
)]F (�ω)d�ω
}V
(4)
with the derivative evaluated at constant volume V . ConsiderEq. (4) with an Einstein phonon density of states F (�ω) =δ(�ω∗ − �ω), as would occur for a harmonic oscillator witha resonant energy �ω∗. In the limit of small �ω∗, thevibrational entropy simplifies to Svib(T ) = kB[1−ln(�ω∗) +ln(kBT) + · · · ], indicating that Svib(T ) is higher for crystalswith softer phonons, i.e., smaller �ω∗ values [84]. Physically,the higher entropy arises because smaller vibrational energies�ω∗ engender larger phonon populations, which, in turn, yieldmore configurational microstates.
Comparing the inverted low-temperature tetragonal-VNtransport Eliashberg spectral function α2
trF (�ω), which givesrise to a peak at �ω = 25 meV (Fig. 13), and measured cubic-VN room-temperature neutron-scattering phonon densities ofstates F (�ω), with a peak at �ω = 19 meV, we find thatthe entropy of the tetragonal phase S tet
vib is lower than thatof the cubic phase Scub
vib over their respective temperaturestability ranges. Additionally, the fact that VN adopts thetetragonal structure at low temperatures requires the enthalpyand zero-point vibrational energy [see Eq. (5)] of the tetragonalphase Gtet
o to be lower than that of the cubic phase Gcubo . Thus,
the relative Gibbs free energies of the tetragonal and cubic-VN
phases,
�G ≡ �Go − T �Svib, (5)
are related via
�Go ≡ Gteto − Gcub
o < 0, (6)
and
�Svib ≡ S tetvib − Scub
vib < 0. (7)
The tetragonal phase is thermodynamically stable withrespect to the cubic phase when �G < 0 or, equivalently,when the temperature T < Tc; while the cubic phase is stablewhen �G > 0 and T > Tc. At absolute zero, the temperature-independent free energy of the tetragonal phase is lower,rendering the cubic phase thermodynamically unstable. AsT is raised over the range 0 < T < 250 K, cubic VN remainsdynamically unstable with imaginary phonon modes. At thecritical phase-transition temperature Tc = 250 K, the differ-ence in vibrational entropy T �Svib balances the difference inthe temperature-independent free energy �Go. Additionally,anharmonic vibrations dynamically stabilize the cubic-VNphase so that all phonon energies become positive (see Fig. 10).At even higher temperatures, including at and above roomtemperature, the ground state of the VN system resides in thecubic phase, due to softer phonon modes and higher vibrationalentropies of this state.
V. CONCLUSIONS
Single-crystal stoichiometric B1 NaCl-structureVN/MgO(011) layers grow with a cube-on-cube orientationalrelationship to the substrate: (011)VN||(011)MgO and[100]VN||[100]MgO. At a critical transition temperatureTc = 250 K, temperature-dependent SAED and synchrotronXRD measurements reveal the presence of forbidden X-pointreflections associated with a cubic-to-tetragonal phasetransition. Upon further cooling, forbidden peak intensities I
increase following the scaling behavior I ∝ (Tc − T )1/2.Temperature-dependent VN/MgO(011) resistivities de-
crease from ρ300 K = 33.0 μ� cm (T = 300 K) to ρo =2.12 μ� cm (T � 20 K). Both the room-temperature ρ300 K
and residual ρo resistivity results are the lowest reported valuesfor bulk and thin film VN, reflecting the high structural qualityof our films. VN resistivities ρ(T ) over the temperature rangefrom 300 to 100 K contain two linear regions for which TCRvalues are 17 × 10−8 � cm K−1 (250 � T � 300 K) and 6.4 ×10⁻⁸ � cm K−1 (100 � T � 150 K). Smaller TCR values athigher temperatures were previously believed to be the result ofelectron/phonon scattering reducing VN conduction electronmean free paths λ to lengths comparable to interatomic dis-tances [72,85]. However, we find that λ = ao, the relaxed VNlattice parameter, only for temperatures greatly exceeding theVN melting point. Instead, we interpret the change in TCR asarising from the cubic-to-tetragonal phase transition at 250 K.
AIMD simulations based on the TDEP method reveal thatlattice vibrations in NaCl-structure VN are strongly anhar-monic. An analysis of temperature-dependent renormalizedVN phonon dispersion relations shows that VN is dynamicallyunstable in the NaCl structure below Tc = 250 K resultingin unphysical X-point longitudinal acoustic-phonon energies
054101-9

A. B. MEI et al. PHYSICAL REVIEW B 91, 054101 (2015)
(�ωLA2 < 0). However, above this temperature, the NaCl
structure is stabilized by anharmonic effects. Transport Eliash-berg spectral function results, obtained from temperature-dependent resistivity measurements, combined with anhar-monic perturbation theory, establish that NaCl-structure VNis thermodynamically stabilized at T > Tc relative to thetetragonal-VN phase due to lower phonon energies and,consequentially, higher vibrational entropies.
ACKNOWLEDGMENTS
The authors thank Sebastian Wimmer, Dr. KennethE. Gray, Professor Goran Grimvall, Professor Tai-ChangChiang, Professor Igor A. Abrikosov, and Professor John F.
Zasadzinski for valuable discussions. The financial supportof the Swedish Research Council (VR) program 637-2013-7296 as well as Grants No. 2014-5790, No. 2009-00971,and No. 2013-4018, and the Swedish Government StrategicResearch Area Grant in Materials Science (Grant No. SFOMat-LiU 2009-00971) on Advanced Functional Materials isgreatly appreciated. Supercomputer resources were providedby the Swedish National Infrastructure for Computing (SNIC).This work was carried out in part in the Frederick SeitzMaterials Research Laboratory Central Facilities, Universityof Illinois. This research used resources of the AdvancedPhoton Source, a U.S. Department of Energy (DOE) Officeof Science User Facility operated for the DOE Office ofScience by Argonne National Laboratory under Contract No.DE-AC02-06CH11357.
[1] H. Yusa, F. Kawamura, T. Taniguchi, N. Hirao, Y. Ohishi, andT. Kikegawa, J. Appl. Phys. 115, 103520 (2014).
[2] C.-S. Shin, Y.-W. Kim, D. Gall, J. E. Greene, and I. Petrov, ThinSolid Films 402, 172 (2002).
[3] S.-J. Kim and H. F. Franzen, J. Less-Common Met. 143, 339(1988).
[4] A. I. Gusev, Phys. Status Solidi B 209, 267 (1998).[5] E. I. Isaev, S. I. Simak, I. A. Abrikosov, R. Ahuja, Y. K. Vekilov,
M. I. Katsnelson, A. I. Lichtenstein, and B. Johansson, J. Appl.Phys. 101, 123519 (2007).
[6] V. I. Ivashchenko and P. E. A. Turchi, Phys. Rev. B 78, 224113(2008).
[7] F. Kubel, W. Lengauer, K. Yvon, K. Knorr, and A. Junod,Phys. Rev. B 38, 12908 (1988).
[8] V. I. Ivashchenko, P. E. A. Turchi, V. I. Shevchenko, and E. I.Olifan, Phys. Rev. B 84, 174108 (2011).
[9] W. Weber, P. Roedhammer, L. Pintschovius, W. Reichardt,F. Gompf, and A. N. Christensen, Phys. Rev. Lett. 43, 868(1979).
[10] A. B. Mei, R. B. Wilson, D. Li, D. G. Cahill, A. Rockett,J. Birch, L. Hultman, J. E. Greene, and I. Petrov, J. Appl. Phys.115, 214908 (2014).
[11] D. C. Wallace, Thermodynamics of Crystals (Courier DoverPublications, Mineola, NY, 1998).
[12] A. Thore, M. Dahlqvist, B. Alling, and J. Rosen, Comput. Mater.Sci. 91, 251 (2014).
[13] O. Hellman, P. Steneteg, I. A. Abrikosov, and S. I. Simak, Phys.Rev. B 87, 104111 (2013).
[14] O. Hellman, I. A. Abrikosov, and S. I. Simak, Phys. Rev. B 84,180301 (2011).
[15] A. B. Mei, A. Rockett, L. Hultman, I. Petrov, and J. E. Greene,J. Appl. Phys. 114, 193708 (2013).
[16] I. Petrov, F. Adibi, J. E. Greene, W. D. Sproul, and W.-D. Munz,J. Vac. Sci. Technol., A 10, 3283 (1992).
[17] R. C. Powell, N.-E. Lee, Y.-W. Kim, and J. E. Greene, J. Appl.Phys. 73, 189 (1993).
[18] M. Mayer, Nucl. Instrum. Methods B 332, 176 (2014).[19] L. J. van der Pauw, Philips Res. Repts. 13, 1 (1958).[20] R. P. Feynman, Phys. Rev. 56, 340 (1939).[21] H. Hellmann, Einfuhrung in die Quantenchemie (Franz
Deuticke, Vienna, Austria, 1937).[22] W. Kohn and L. J. Sham, Phys. Rev. 140, A1133 (1965).
[23] P. E. Blochl, Phys. Rev. B 50, 17953 (1994).[24] G. Kresse and J. Hafner, Phys. Rev. B 48, 13115 (1993).[25] G. Kresse and D. Joubert, Phys. Rev. B 59, 1758 (1999).[26] G. Kresse and J. Furthmuller, Phys. Rev. B 54, 11169 (1996).[27] R. Armiento and A. E. Mattsson, Phys. Rev. B 72, 085108
(2005).[28] S. Nose, Mol. Phys. 52, 255 (1984).[29] R. Kubo, J. Phys. Soc. Jpn. 12, 570 (1957).[30] W. H. Butler, Phys. Rev. B 31, 3260 (1985).[31] D. A. Greenwood, Proc. Phys. Soc. 71, 585 (1958).[32] H. Ebert, A. Vernes, and J. Banhart, Phys. Rev. B 54, 8479
(1996).[33] H. Ebert, in Electronic Structure and Physical Properies of
Solids, edited by P. H. Dreysse (Springer Berlin, Heidelberg,Germany, 2000), pp. 191–246.
[34] H. Ebert, D. Kodderitzsch, and J. Minar, Rep. Prog. Phys. 74,096501 (2011).
[35] J. S. Faulkner and G. M. Stocks, Phys. Rev. B 21, 3222(1980).
[36] In addition to the two atomic spheres located at the 0,0,0 and½,½,½ atomic sites of the NaCl cell, two empty spheres withequivalent radii are centered about ¼,¼,¼ and −¼,−¼,−¼.The additional spheres are required to extend the basis overwhich the electronic wave functions can be expanded into theirspherical harmonics; using the additional spheres, we obtainan electronic band structure which is in excellent agreementwith that obtained from VASP. Without the empty spheres, theband structure exhibits artifacts which arise from not properlydescribing the electronic wave functions.
[37] J. Korringa, Physica 13, 392 (1947).[38] W. Kohn and N. Rostoker, Phys. Rev. 94, 1111 (1954).[39] J. P. Perdew, K. Burke, and M. Ernzerhof, Phys. Rev. Lett. 77,
3865 (1996).[40] H. O. Pierson, Handbook of Refractory Carbides and Nitrides:
Properties, Characteristics, Processing and Applications, 1sted. (William Andrew, Westwood, NJ, 1997).
[41] P. van der Sluis, J. Phys. D Appl. Phys. 26, A188 (1993).[42] C.-S. Shin, S. Rudenja, D. Gall, N. Hellgren, T.-Y. Lee, I. Petrov,
and J. E. Greene, J. Appl. Phys. 95, 356 (2004).[43] A. B. Mei, B. M. Howe, C. Zhang, M. Sardela, J. N. Eckstein,
L. Hultman, A. Rockett, I. Petrov, and J. E. Greene, J. Vac. Sci.Technol., A 31, 061516 (2013).
054101-10

DYNAMIC AND STRUCTURAL STABILITY OF CUBIC . . . PHYSICAL REVIEW B 91, 054101 (2015)
[44] D. K. Bowen and B. K. Tanner, High Resolution X-RayDiffractometry and Topography (CRC Press, Bristol, PA, 1998).
[45] H. Hahn, Z. Anorg. Chem. 258, 58 (1949).[46] L. Toth, C. Wang, and G. Yen, Acta Metall. 14, 1403 (1966).[47] H. Holleck, J. Vac. Sci. Technol., A 4, 2661 (1986).[48] W. Lengauer and P. Ettmayer, Monatsh. Chem. 117, 713 (1986).[49] X. Y. Zhang, J. S. Chawla, R. P. Deng, and D. Gall, Phys. Rev.
B 84, 073101 (2011).[50] L. D. Landau and E. M. Lifshitz, Statistical Physics, Third Edi-
tion, Part 1, Course of Theoretical Physics Vol. 5 (Butterworth-Heinemann, Kidlington, England, 1980).
[51] R. Xu and T.-C. Chiang, Phase Transitions 83, 99 (2010).[52] R. Xu, J. Wong, P. Zschack, H. Hong, and T.-C. Chiang,
Europhys. Lett. 82, 26001 (2008).[53] G. Shirane, J. D. Axe, J. Harada, and J. P. Remeika, Phys. Rev.
B 2, 155 (1970).[54] G. Grimvall, B. Magyari-Kope, V. Ozoliņs, and K. A. Persson,
Rev. Mod. Phys. 84, 945 (2012).[55] A. N. Christensen, O. W. Dietrich, W. Kress, W. D. Teuchert,
and R. Currat, Solid State Commun. 31, 795 (1979).[56] X.-J. Chen, V. V. Struzhkin, S. Kung, H.-K. Mao, R. J. Hemley,
and A. N. Christensen, Phys. Rev. B 70, 014501 (2004).[57] K.-P. Bohnen, R. Heid, and B. Renker, Phys. Rev. Lett. 86, 5771
(2001).[58] M. d’Astuto, M. Calandra, S. Reich, A. Shukla, M. Lazzeri,
F. Mauri, J. Karpinski, N. D. Zhigadlo, A. Bossak, andM. Krisch, Phys. Rev. B 75, 174508 (2007).
[59] P. Zhang, Y. Xue, and P. Dev, Solid State Commun. 148, 151(2008).
[60] M. Monni, I. Pallecchi, C. Ferdeghini, V. Ferrando, A. Floris,E. G. d’Agliano, E. Lehmann, I. Sheikin, C. Tarantini, X. X. Xi,S. Massidda, and M. Putti, Europhys. Lett. 81, 67006 (2008).
[61] A. Y. Liu, I. I. Mazin, and J. Kortus, Phys. Rev. Lett. 87, 087005(2001).
[62] Y. Kong, O. V. Dolgov, O. Jepsen, and O. K. Andersen, Phys.Rev. B 64, 020501 (2001).
[63] A. G. Zaitsev, R. Schneider, O. de la Pe–a-Seaman, R. de Coss,R. Heid, K.-P. Bohnen, and J. Geerk, Phys. Procedia 36, 479(2012).
[64] M. B. Takeyama, T. Itoi, K. Satoh, M. Sakagami, and A. Noya,J. Vac. Sci. Technol., B 22, 2542 (2004).
[65] J. F. Zasadzinski, A. Saggese, K. E. Gray, R. T. Kampwirth, andR. Vaglio, Phys. Rev. B 38, 5065 (1988).
[66] B. R. Zhao, L. Chen, H. L. Luo, M. D. Jack, and D. P. Mullin,Phys. Rev. B 29, 6198 (1984).
[67] N. Tralshawala, J. F. Zasadzinski, L. Coffey, W. Gai, M. Romalis,Q. Huang, R. Vaglio, and K. E. Gray, Phys. Rev. B 51, 3812(1995).
[68] H. S. Seo, T. Y. Lee, J. G. Wen, I. Petrov, J. E. Greene, andD. Gall, J. Appl. Phys. 96, 878 (2004).
[69] A. Cassinese, M. Iavarone, R. Vaglio, M. Grimsditch, andS. Uran, Phys. Rev. B 62, 13915 (2000).
[70] F. Nava, O. Bisi, and K. N. Tu, Phys. Rev. B 34, 6143 (1986).[71] M. Gurvitch, A. K. Ghosh, H. Lutz, and M. Strongin, Phys. Rev.
B 22, 128 (1980).[72] M. Gurvitch, Phys. Rev. B 24, 7404 (1981).[73] O. Gunnarsson, M. Calandra, and J. E. Han, Rev. Mod. Phys.
75, 1085 (2003).[74] G. K. H. Madsen and D. J. Singh, Computer Phys. Commun.
175, 67 (2006).[75] S. P. Chockalingam, M. Chand, J. Jesudasan, V. Tripathi, and
P. Raychaudhuri, Phys. Rev. B 77, 214503 (2008).[76] M. Mondal, A. Kamlapure, S. C. Ganguli, J. Jesudasan,
V. Bagwe, L. Benfatto, and P. Raychaudhuri, Sci. Rep. 3, 1(2013).
[77] D. L. Perry, Handbook of Inorganic Compounds, 2nd ed. (Taylor& Francis US, Boca Raton, FL, 2011).
[78] G. Grimvall, The Electron-Phonon Interaction in Metals (North-Holland Pub. Co.: Sole distributors for the USA and Canada;Elsevier North-Holland, Amsterdam; New York, NY, 1981).
[79] J. Ekin, Experimental Techniques for Low-Temperature Mea-surements: Cryostat Design, Material Properties and Super-conductor Critical-Current Testing (Oxford University Press,London, England, 2006).
[80] W. E. Lawrence and J. W. Wilkins, Phys. Rev. B 6, 4466(1972).
[81] A. H. MacDonald, R. Taylor, and D. J. W. Geldart, Phys. Rev.B 23, 2718 (1981).
[82] G. v. Minnigerode, Berich. Bunsen Gesell. 87, 453 (1983).[83] W. Cochran and R. A. Cowley, in Light and Matter Ia/Licht Und
Materie Ia, edited by L. Genzel (Springer, Berlin, Heidelberg,Germany, 1967), pp. 59–156.
[84] Unstable phases do not appear in the equilibrium phase diagram,since their vibrational entropy is undefined. As a soft-modephase transition is approached, the phonon energies of the dy-namically stable phase approach zero, increasing the vibrationalentropy of the system. Since the energy of the unstable phononbranch varies parabolically near the point of instability, thedensity of states F (�ω) suppresses the logarithmic divergencein Eq. (4) yielding an entropy which is finite and slowly varyingas a function of temperature [54,86]. Thus, the excess entropyassociated with the vibrational instability can be modeled usinga smooth interpolation from the region where the correspondingphase is dynamically (and thermodynamically) stable [87].
[85] N. E. Hussey, K. Takenaka, and H. Takagi, Philos. Mag. 84,2847 (2004).
[86] A. Fernandez Guillermet, V. Ozoliņs, G. Grimvall, andM. Korling, Phys. Rev. B 51, 10364 (1995).
[87] P. E. A. Turchi, V. Drchal, J. Kudrnovsky, C. Colinet,L. Kaufman, and Z.-K. Liu, Phys. Rev. B 71, 094206 (2005).
054101-11