Embed Size (px)
Citation preview
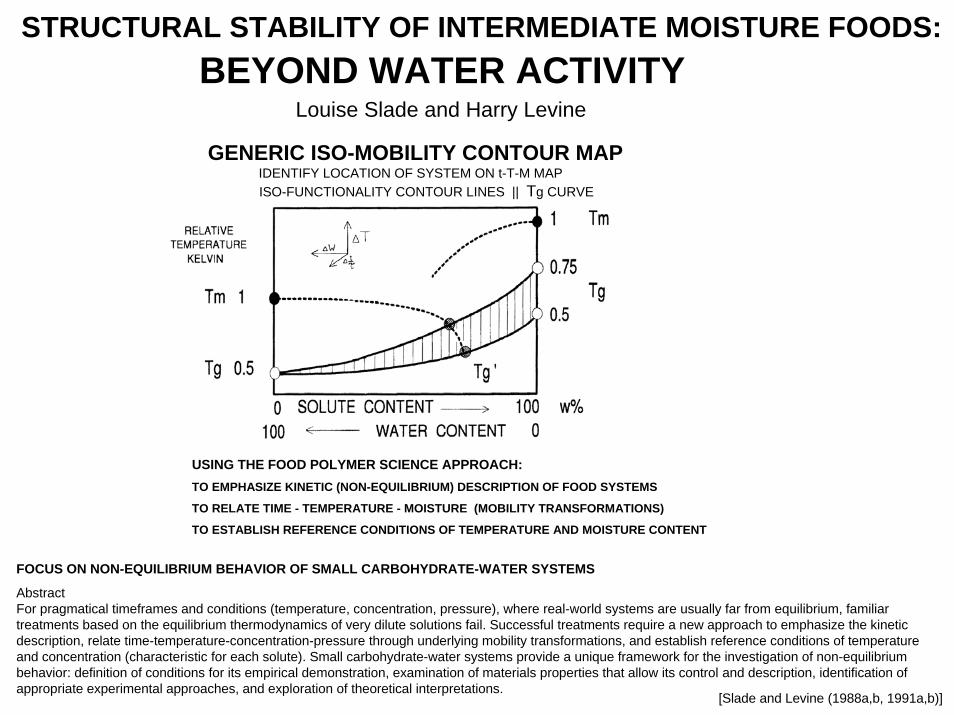
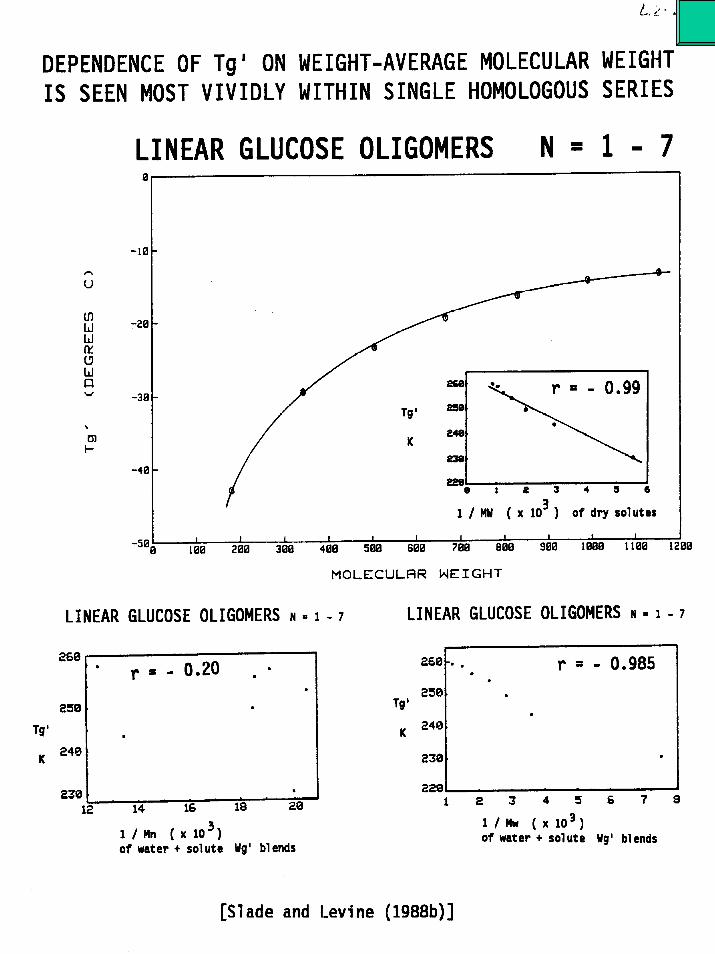
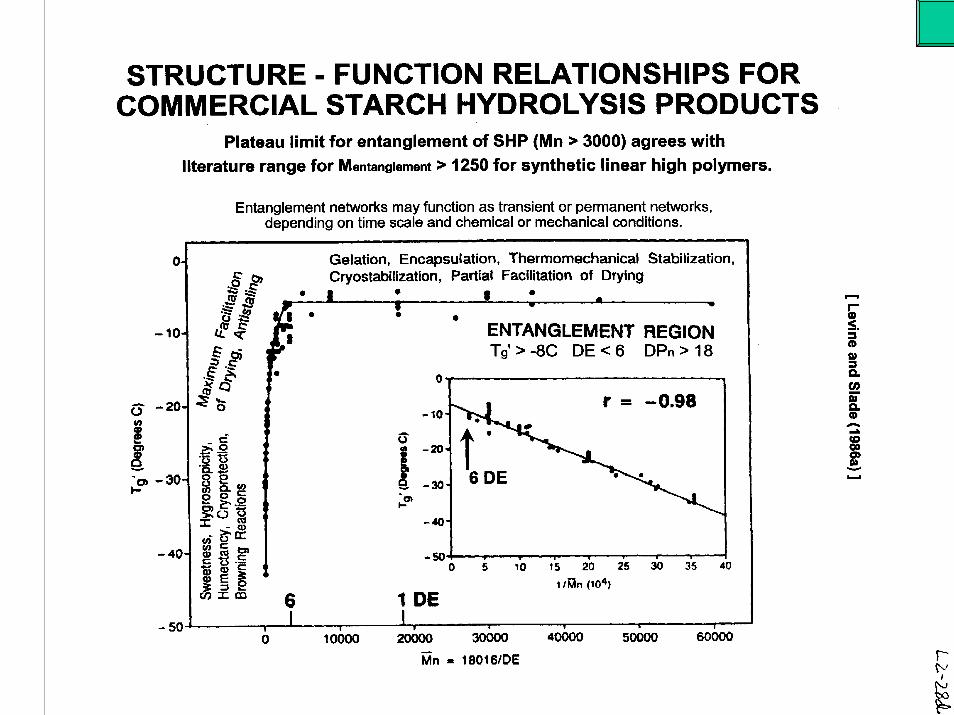
STRUCTURAL STABILITY OF INTERMEDIATE MOISTURE FOODS:
FOCUS ON NON-EQUILIBRIUM BEHAVIOR OF SMALL CARBOHYDRATE-WATER SYSTEMS
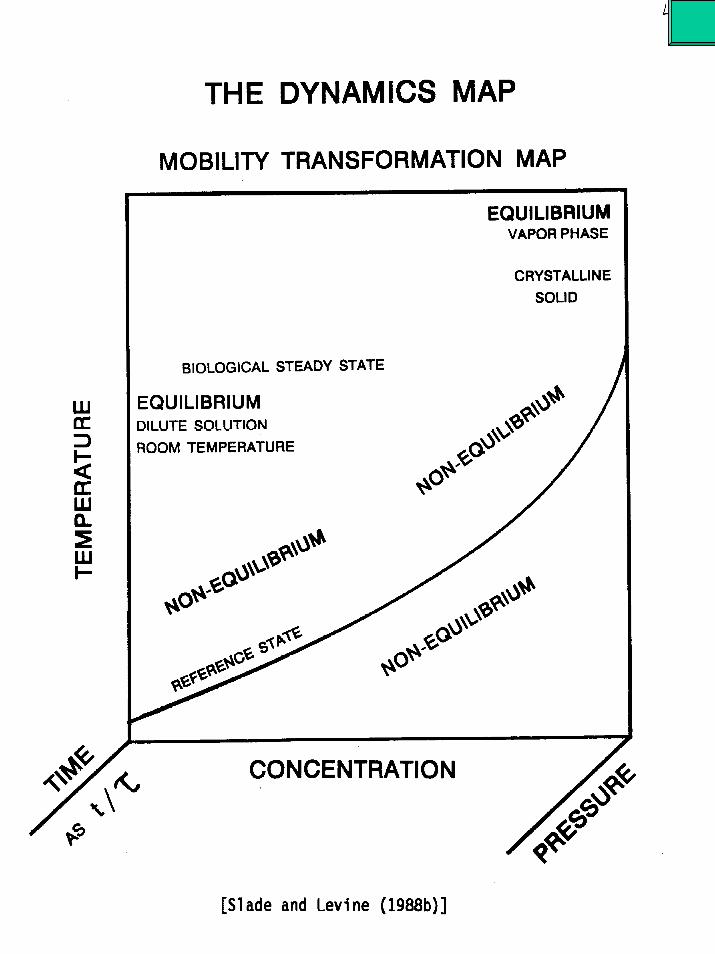
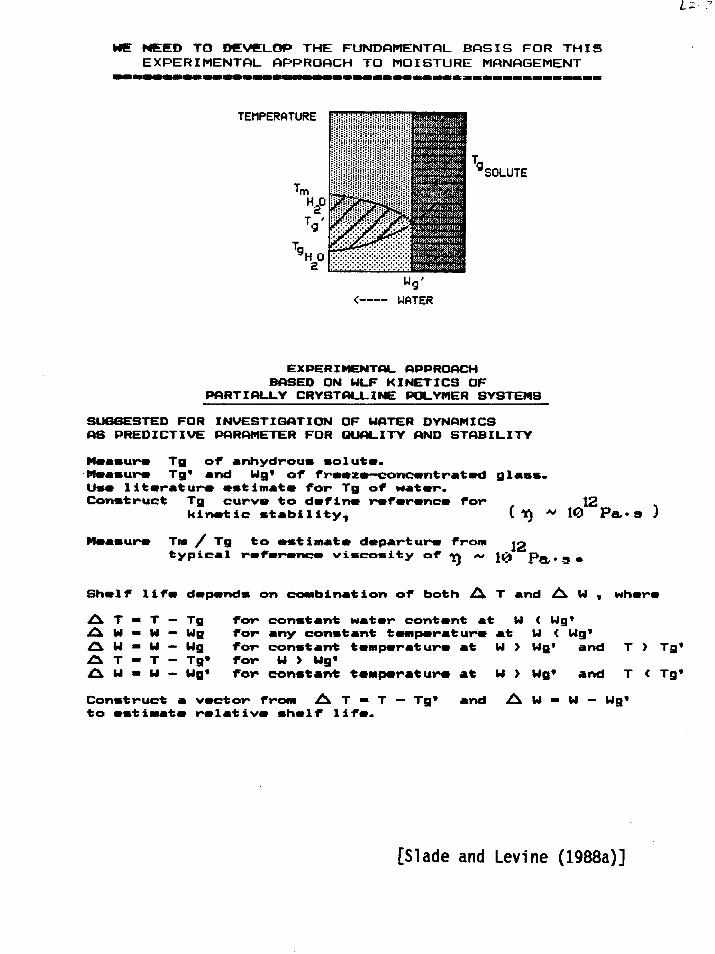
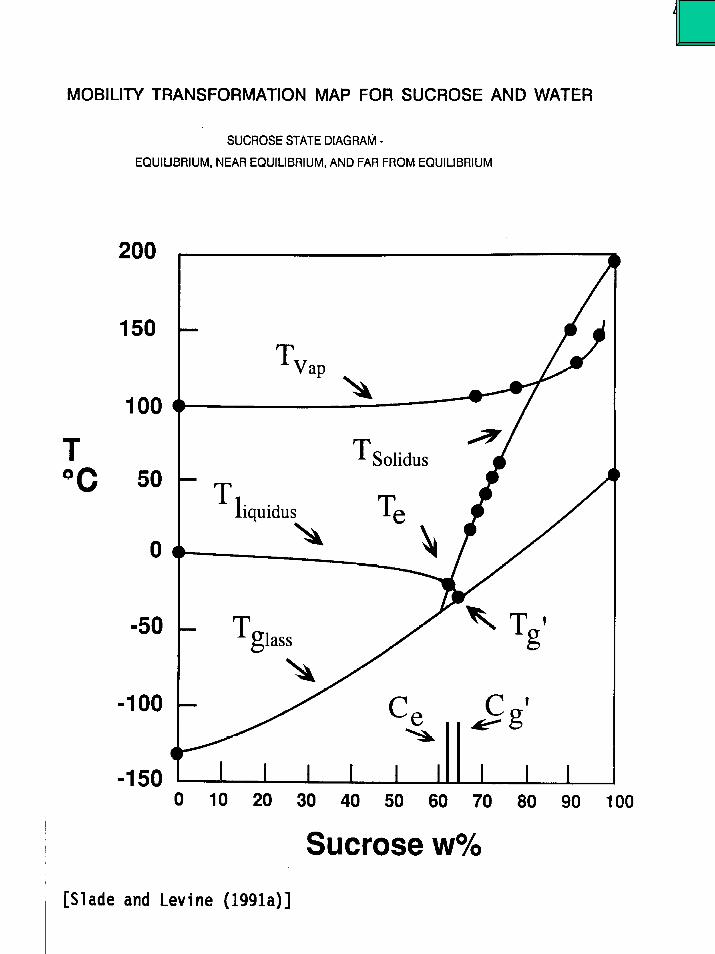
AbstractFor pragmatical timeframes and conditions (temperature, concentration, pressure), where real-world systems are usually far from equilibrium, familiar treatments based on the equilibrium thermodynamics of very dilute solutions fail. Successful treatments require a new approach to emphasize the kinetic description, relate time-temperature-concentration-pressure through underlying mobility transformations, and establish reference conditions of temperature and concentration (characteristic for each solute). Small carbohydrate-water systems provide a unique framework for the investigation of non-equilibrium behavior: definition of conditions for its empirical demonstration, examination of materials properties that allow its control and description, identification of appropriate experimental approaches, and exploration of theoretical interpretations.
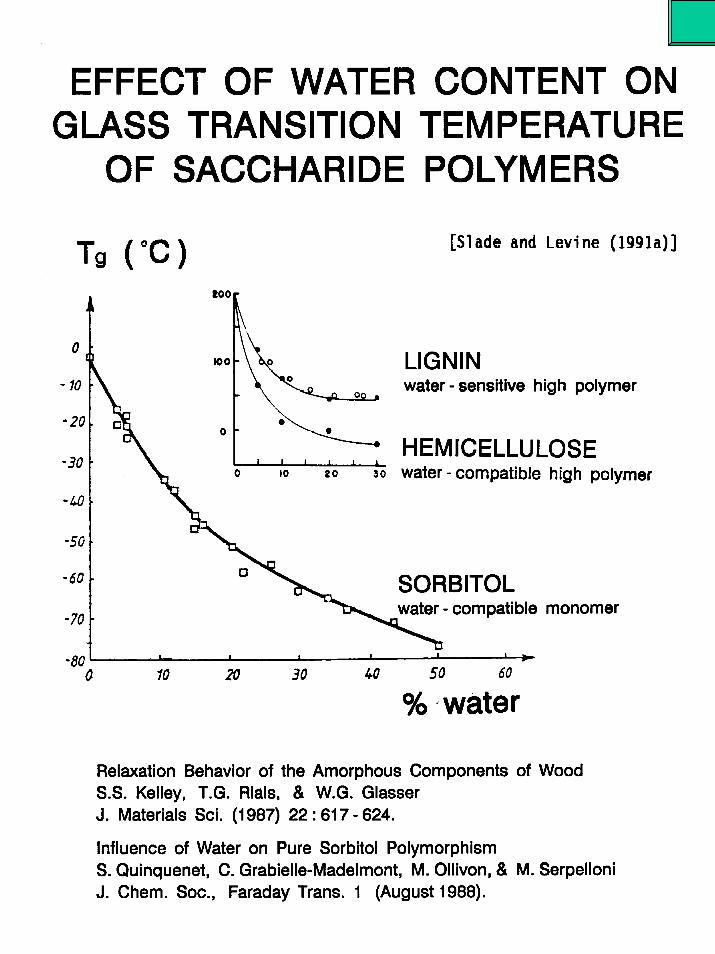
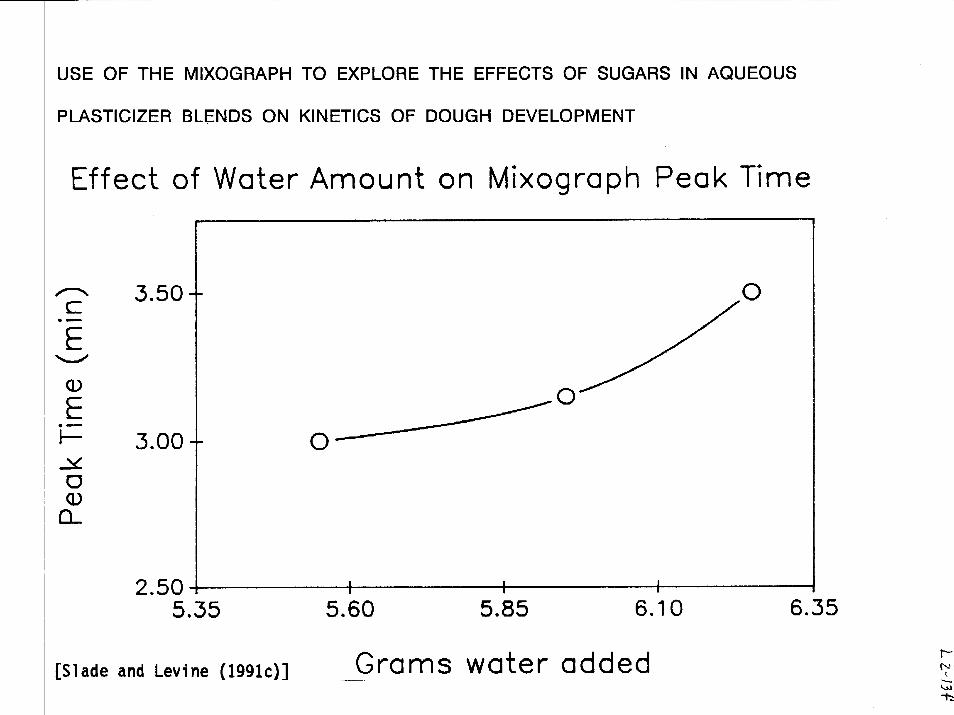
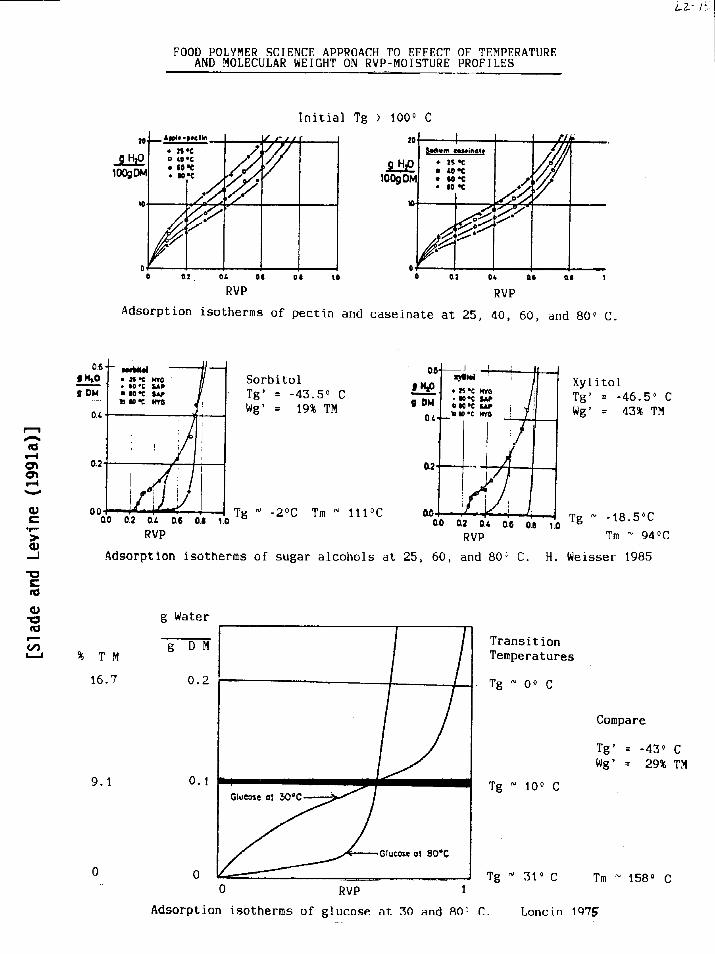
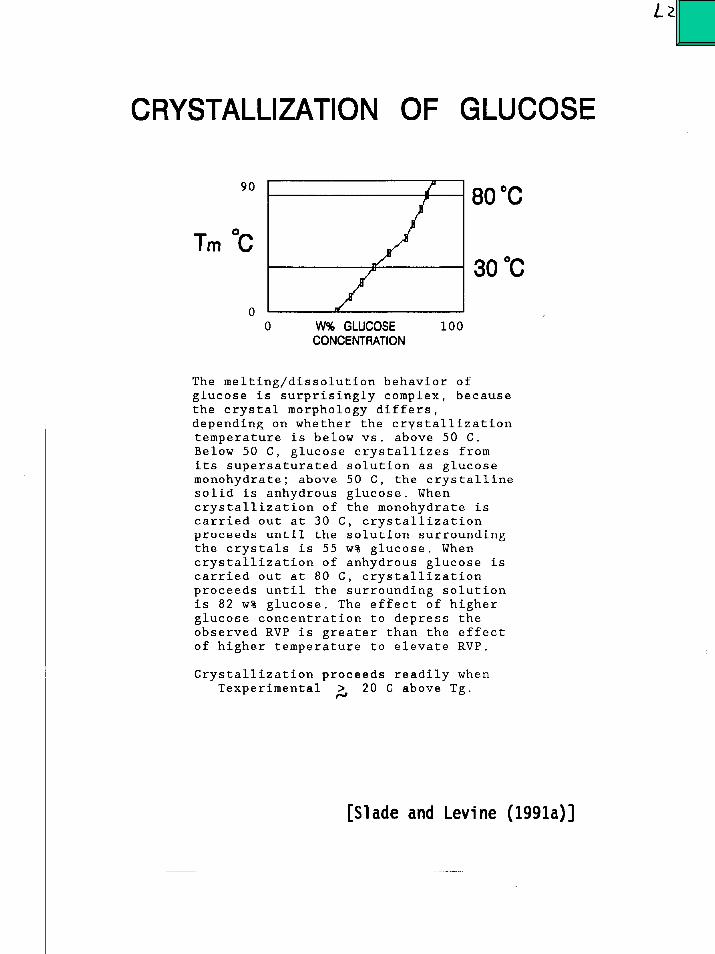
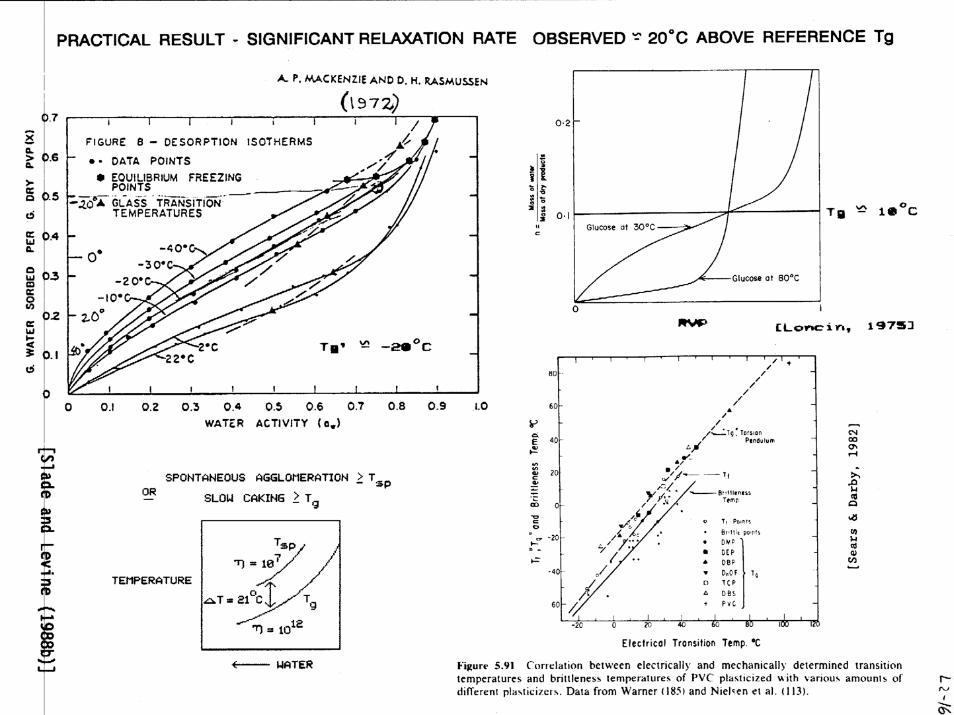
[Slade and Levine (1988a,b, 1991a,b)]
Louise Slade and Harry LevineBEYOND WATER ACTIVITY
USING THE FOOD POLYMER SCIENCE APPROACH:TO EMPHASIZE KINETIC (NON-EQUILIBRIUM) DESCRIPTION OF FOOD SYSTEMS
TO RELATE TIME - TEMPERATURE - MOISTURE (MOBILITY TRANSFORMATIONS)
TO ESTABLISH REFERENCE CONDITIONS OF TEMPERATURE AND MOISTURE CONTENT
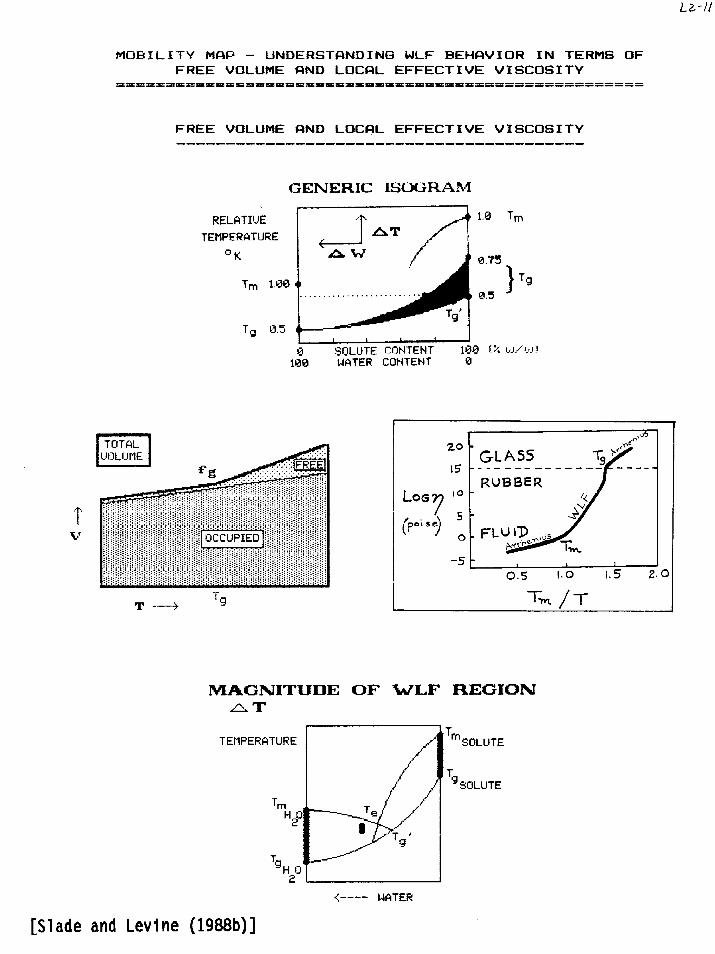
GENERIC ISO-MOBILITY CONTOUR MAPIDENTIFY LOCATION OF SYSTEM ON t-T-M MAPISO-FUNCTIONALITY CONTOUR LINES || Tg CURVE
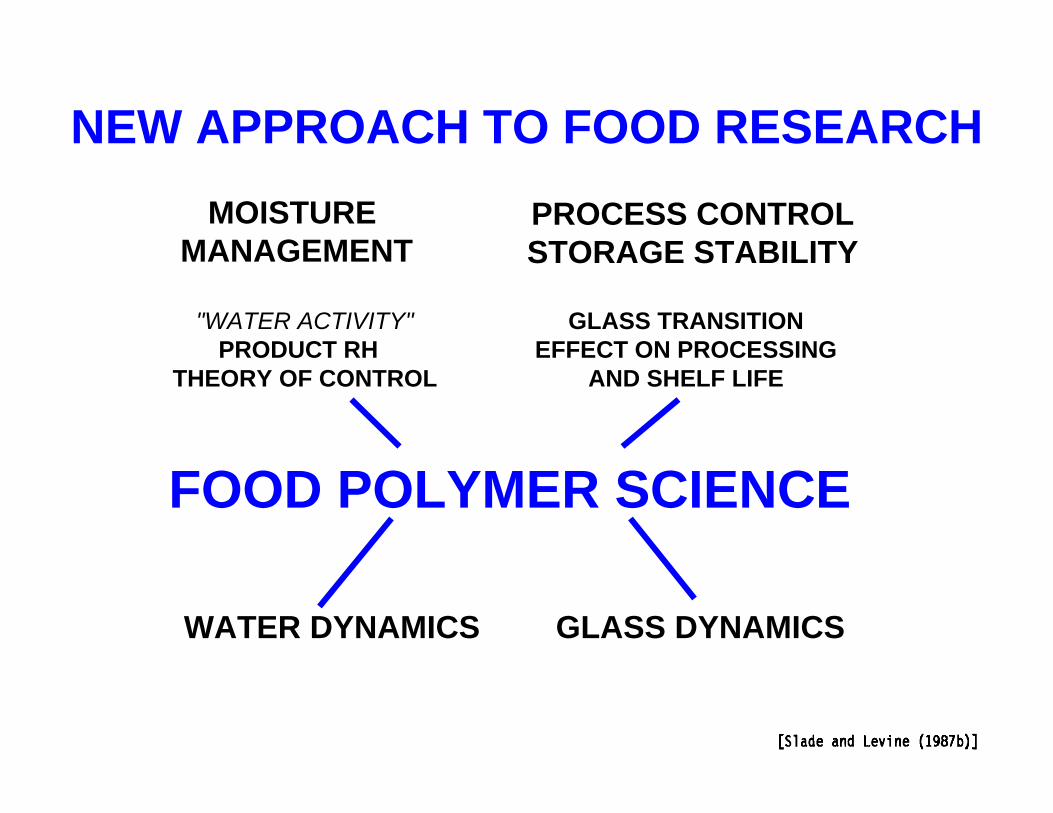
NEW APPROACH TO FOOD RESEARCHMOISTURE
MANAGEMENTPROCESS CONTROLSTORAGE STABILITY
WATER DYNAMICS GLASS DYNAMICS
FOOD POLYMER SCIENCE
"WATER ACTIVITY"PRODUCT RH
THEORY OF CONTROL
GLASS TRANSITIONEFFECT ON PROCESSING
AND SHELF LIFE
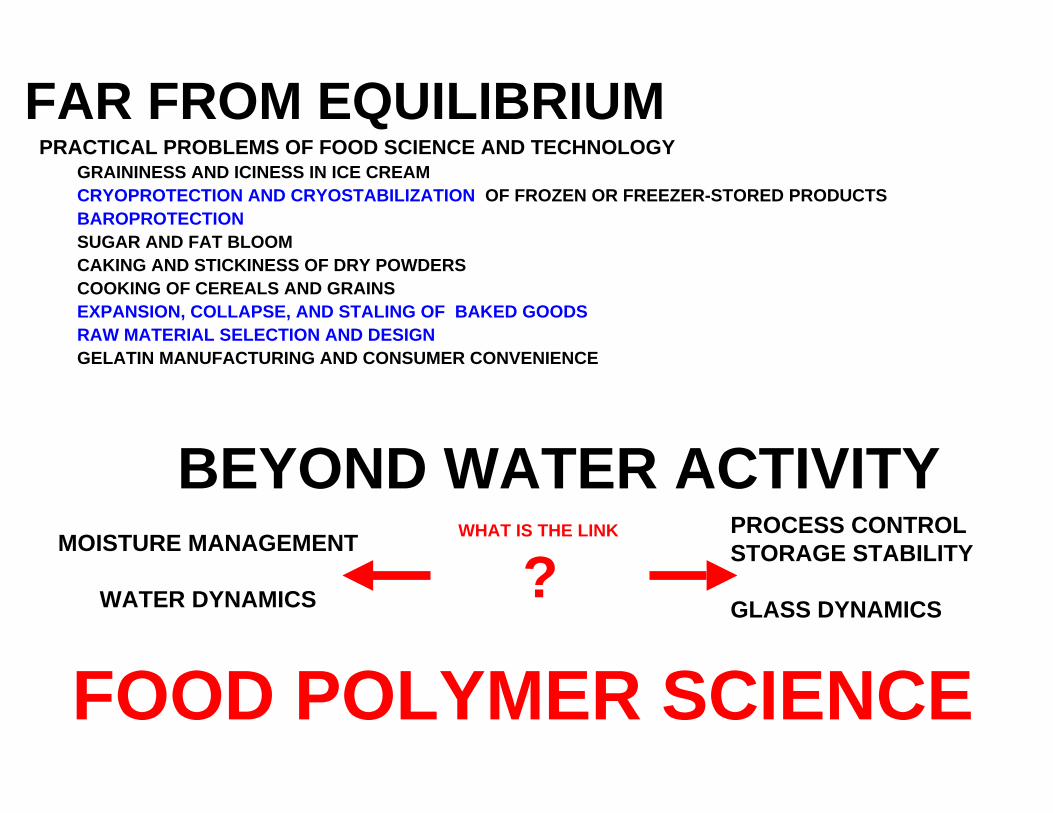
FAR FROM EQUILIBRIUMPRACTICAL PROBLEMS OF FOOD SCIENCE AND TECHNOLOGY
GRAININESS AND ICINESS IN ICE CREAMCRYOPROTECTION AND CRYOSTABILIZATION OF FROZEN OR FREEZER-STORED PRODUCTSBAROPROTECTIONSUGAR AND FAT BLOOMCAKING AND STICKINESS OF DRY POWDERSCOOKING OF CEREALS AND GRAINSEXPANSION, COLLAPSE, AND STALING OF BAKED GOODSRAW MATERIAL SELECTION AND DESIGNGELATIN MANUFACTURING AND CONSUMER CONVENIENCE
BEYOND WATER ACTIVITY
FOOD POLYMER SCIENCE
MOISTURE MANAGEMENT
WATER DYNAMICS
PROCESS CONTROLSTORAGE STABILITY
GLASS DYNAMICS
WHAT IS THE LINK
?
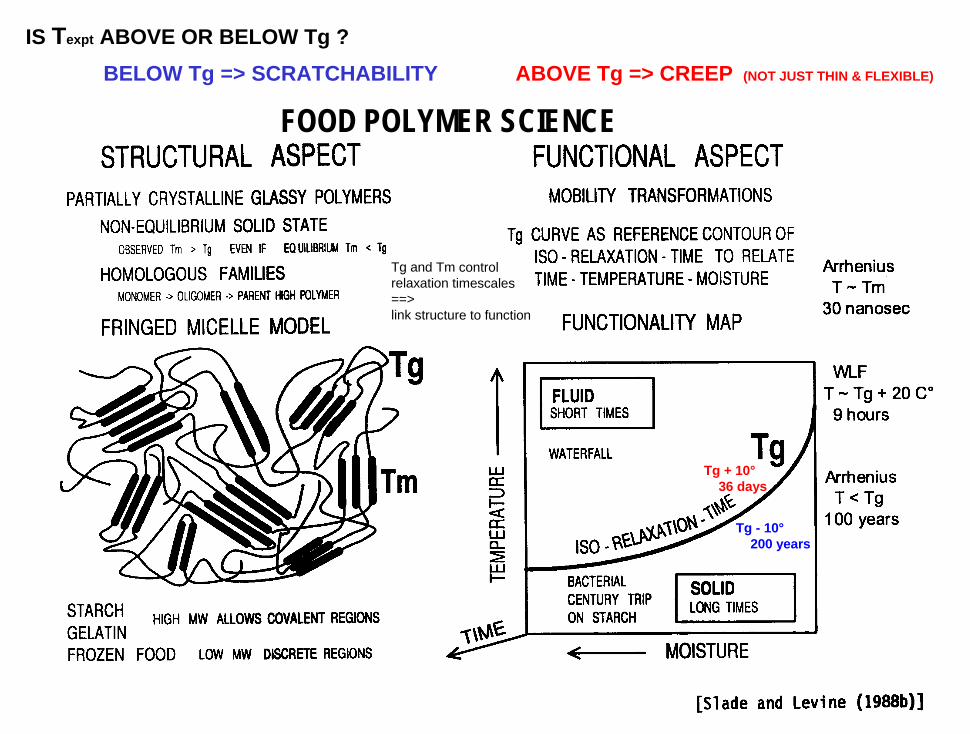
Tg and Tm control relaxation timescales==> link structure to function
Tg + 10°36 days
Tg - 10°200 years
IS Texpt ABOVE OR BELOW Tg ? BELOW Tg => SCRATCHABILITY ABOVE Tg => CREEP (NOT JUST THIN & FLEXIBLE)
FOOD POLYMER SCIENCE
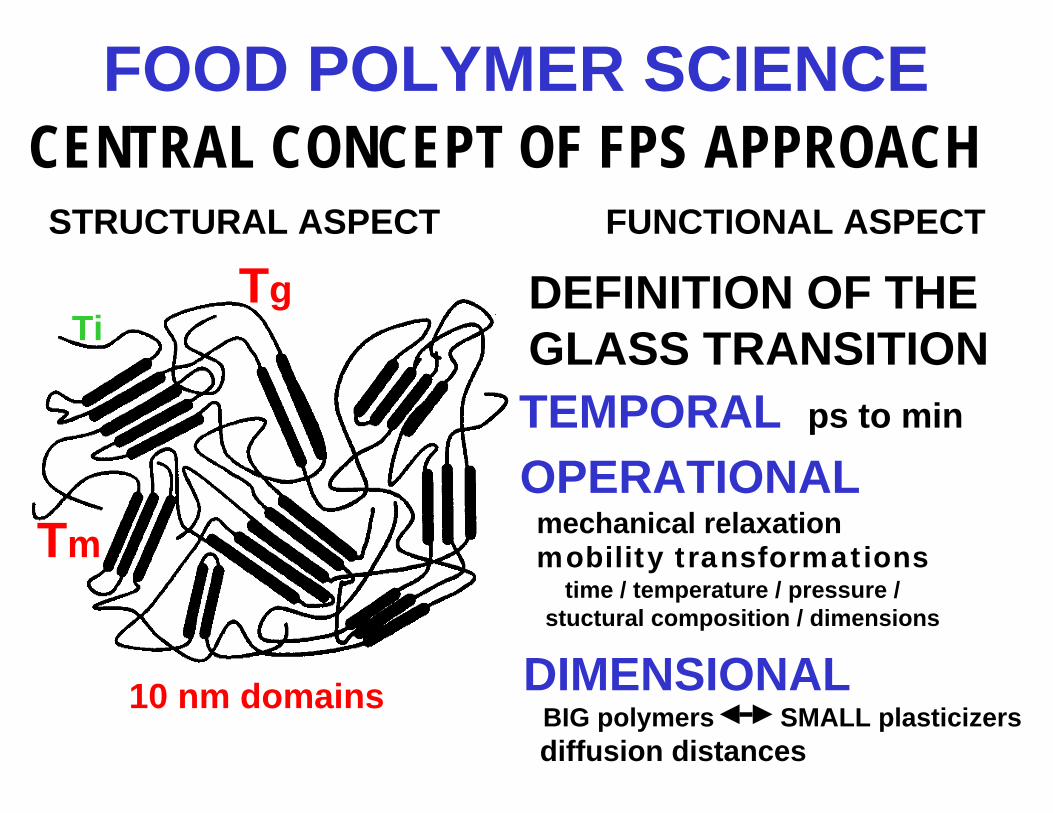
FOOD POLYMER SCIENCE
STRUCTURAL ASPECT FUNCTIONAL ASPECT
Tg
Tm
CENTRAL CONCEPT OF FPS APPROACH
DEFINITION OF THEGLASS TRANSITIONTEMPORAL ps to min
mechanical relaxationmobility transformations
Ti
DIMENSIONALBIG polymers SMALL plasticizersdiffusion distances
10 nm domains
OPERATIONAL
time / temperature / pressure /stuctural composition / dimensions
Pressure
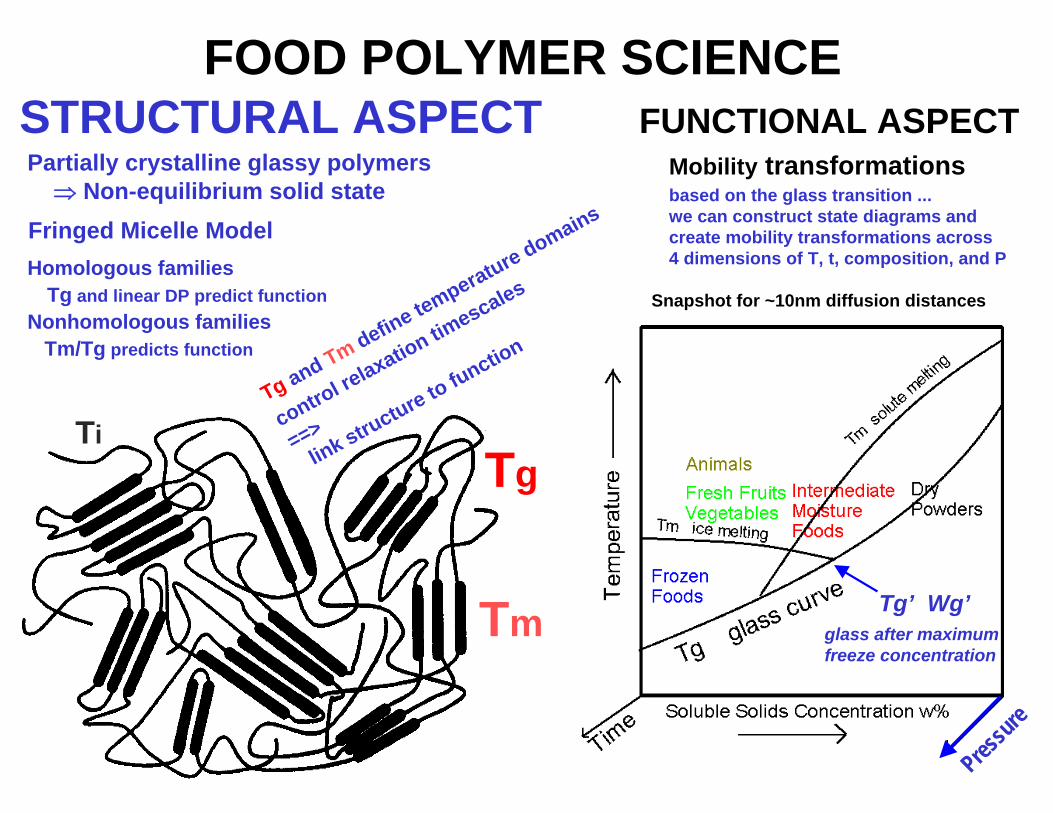
FOOD POLYMER SCIENCESTRUCTURAL ASPECT FUNCTIONAL ASPECTPartially crystalline glassy polymers
Non-equilibrium solid stateMobility transformations
Tg
Tm
Ti
Snapshot for ~10nm diffusion distances
Fringed Micelle ModelHomologous families
Tg and linear DP predict functionNonhomologous families
Tm/Tg predicts function
Tg and Tm define temperature domains
control relaxation tim
escales
==> link structure to function
Tg’ Wg’ glass after maximumfreeze concentration
based on the glass transition ...we can construct state diagrams andcreate mobility transformations across4 dimensions of T, t, composition, and P
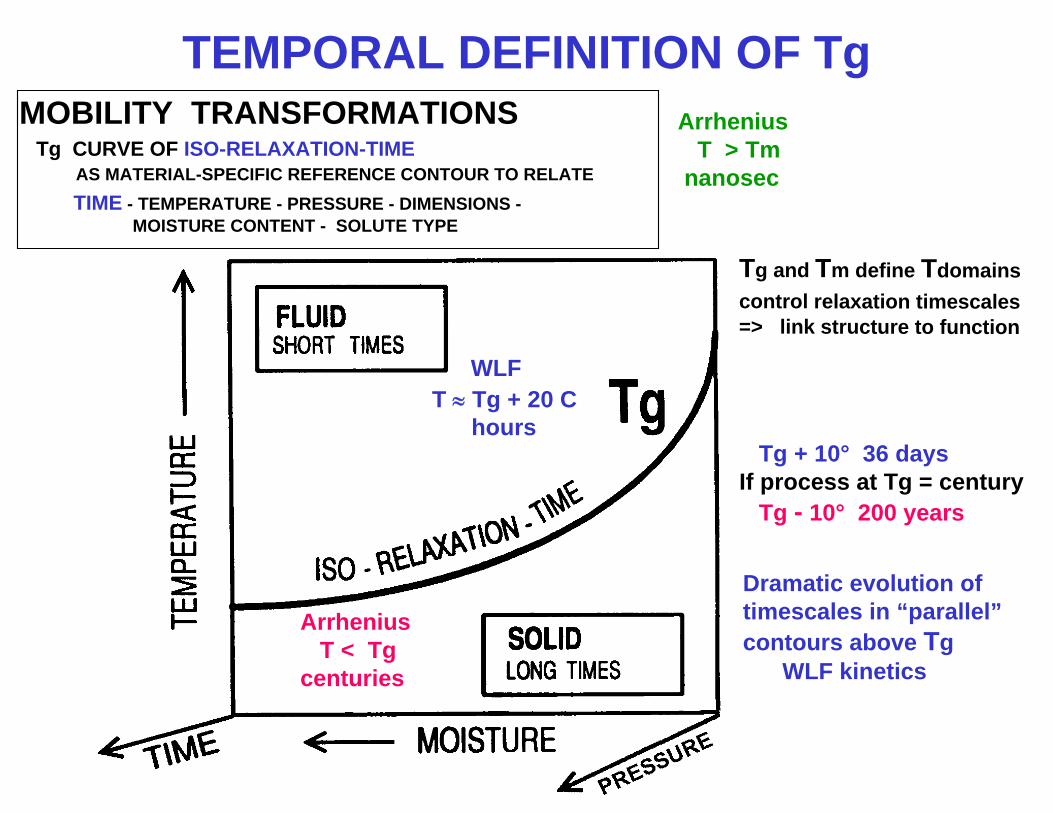
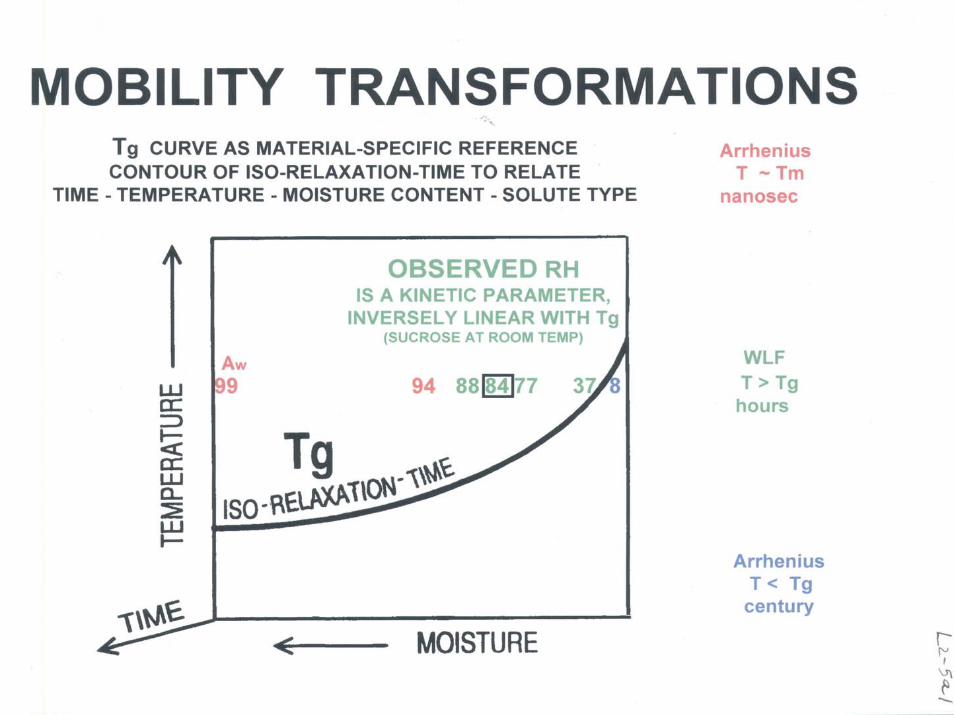
TEMPORAL DEFINITION OF TgMOBILITY TRANSFORMATIONS
Tg CURVE OF ISO-RELAXATION-TIME AS MATERIAL-SPECIFIC REFERENCE CONTOUR TO RELATETIME - TEMPERATURE - PRESSURE - DIMENSIONS -
MOISTURE CONTENT - SOLUTE TYPE
ArrheniusT < Tg
centuries
WLFT Tg + 20 C
hours
ArrheniusT > Tm
nanosec
Tg + 10° 36 daysIf process at Tg = century
Tg - 10° 200 years
Tg and Tm define Tdomains control relaxation timescales=> link structure to function
Dramatic evolution oftimescales in “parallel”contours above Tg
WLF kinetics
log / g
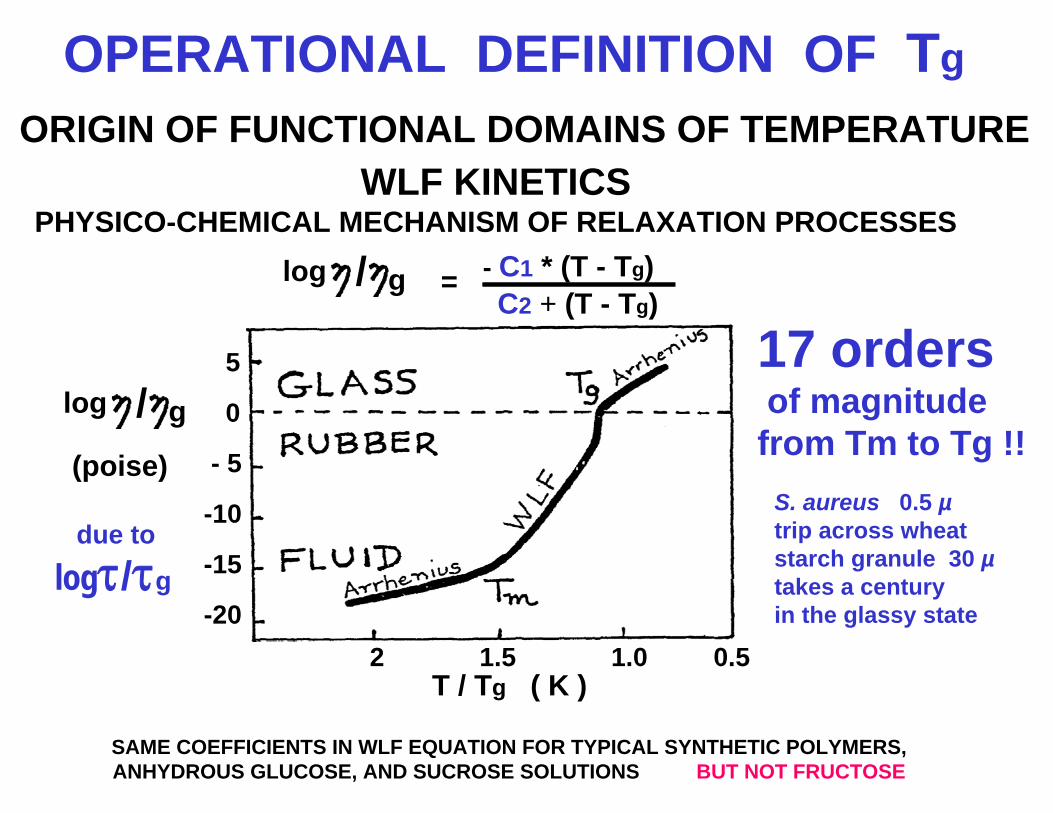
ORIGIN OF FUNCTIONAL DOMAINS OF TEMPERATUREWLF KINETICS
PHYSICO-CHEMICAL MECHANISM OF RELAXATION PROCESSES
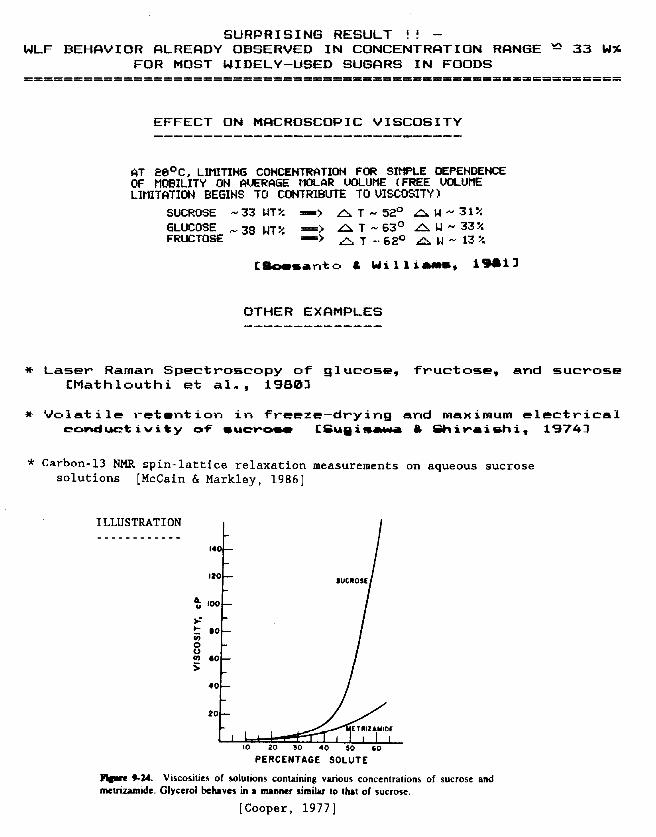
SAME COEFFICIENTS IN WLF EQUATION FOR TYPICAL SYNTHETIC POLYMERS, ANHYDROUS GLUCOSE, AND SUCROSE SOLUTIONS BUT NOT FRUCTOSE
- A ( T - Tg )B + ( T - Tg )=
T / Tg ( K )
OPERATIONAL DEFINITION OF Tg
(poise)
log / g
2 1.5 1.0 0.5
5
0
- 5
-10
-15
-20
due to
log/g
17 ordersof magnitudefrom Tm to Tg !!
S. aureus 0.5 µtrip across wheatstarch granule 30 µtakes a centuryin the glassy state
- C1 * (T - Tg)C2 + (T - Tg)
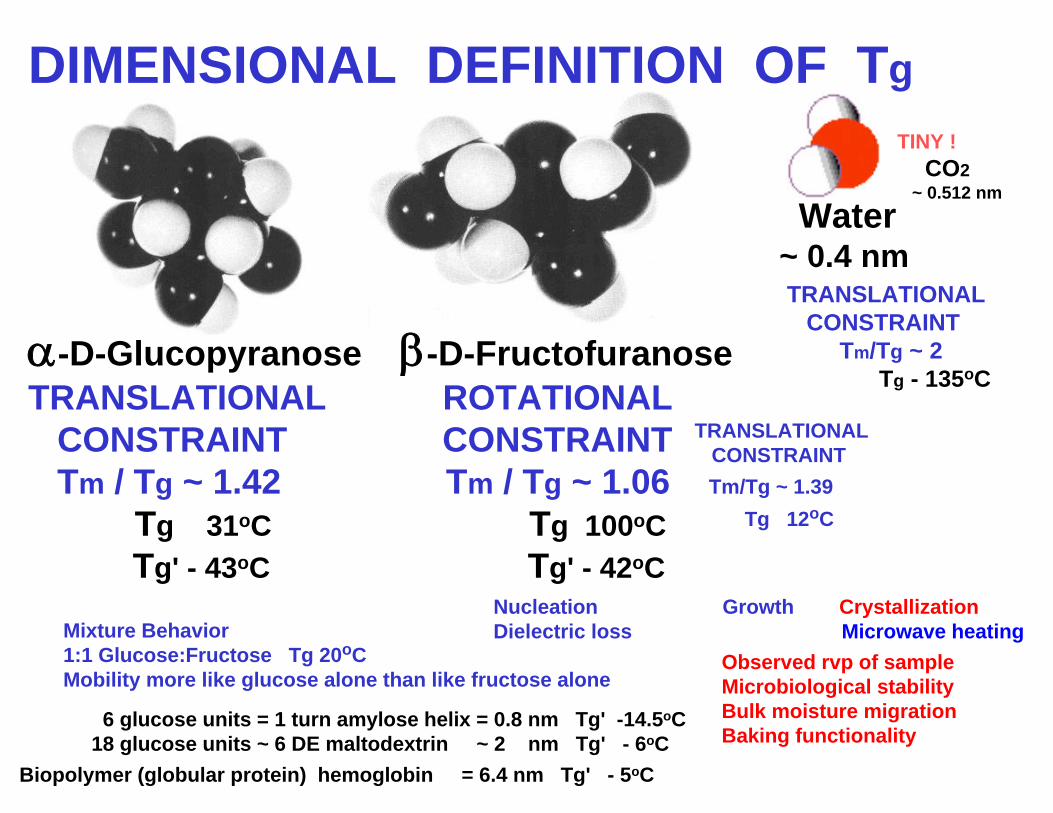
Mixture Behavior1:1 Glucose:Fructose Tg 20oCMobility more like glucose alone than like fructose alone
-D-Glucopyranose -D-FructofuranoseTRANSLATIONAL ROTATIONAL
CONSTRAINT CONSTRAINTTm / Tg ~ 1.42 Tm / Tg ~ 1.06 Tm/Tg ~ 1.39
Tg 31oC Tg 100oC Tg' - 43oC Tg' - 42oC
Water~ 0.4 nmTRANSLATIONAL
CONSTRAINTTm/Tg ~ 2
Tg - 135oC
DIMENSIONAL DEFINITION OF TgTINY !
CO2 ~ 0.512 nm
TRANSLATIONALCONSTRAINT
6 glucose units = 1 turn amylose helix = 0.8 nm Tg' -14.5oC18 glucose units ~ 6 DE maltodextrin ~ 2 nm Tg' - 6oC
Biopolymer (globular protein) hemoglobin = 6.4 nm Tg' - 5oC
Nucleation Growth CrystallizationDielectric loss Microwave heating
Tg 12oC
Observed rvp of sampleMicrobiological stabilityBulk moisture migrationBaking functionality
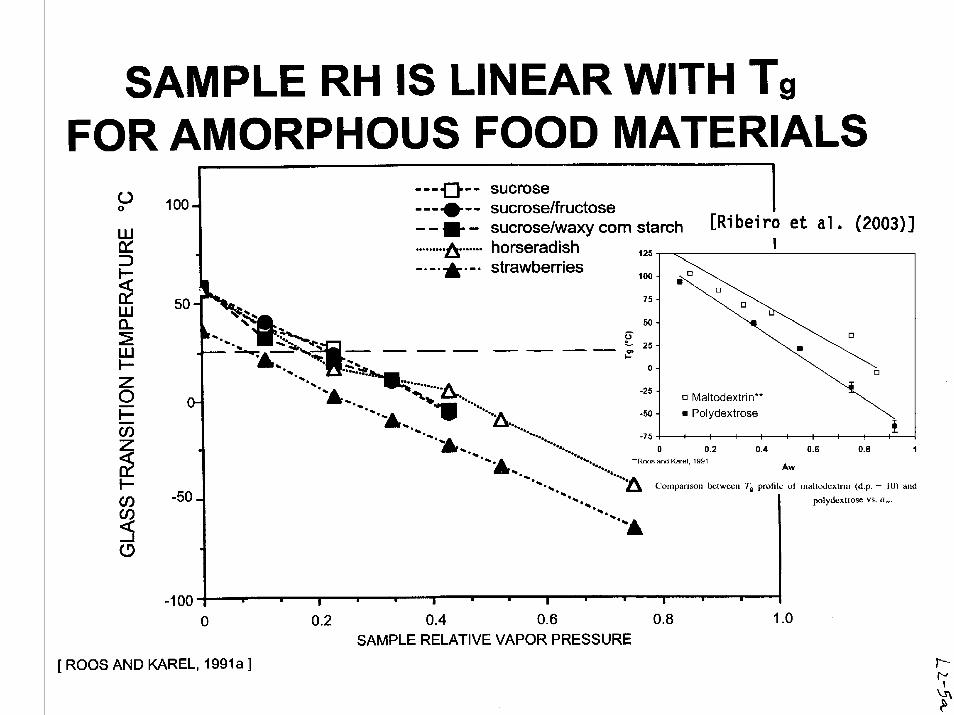
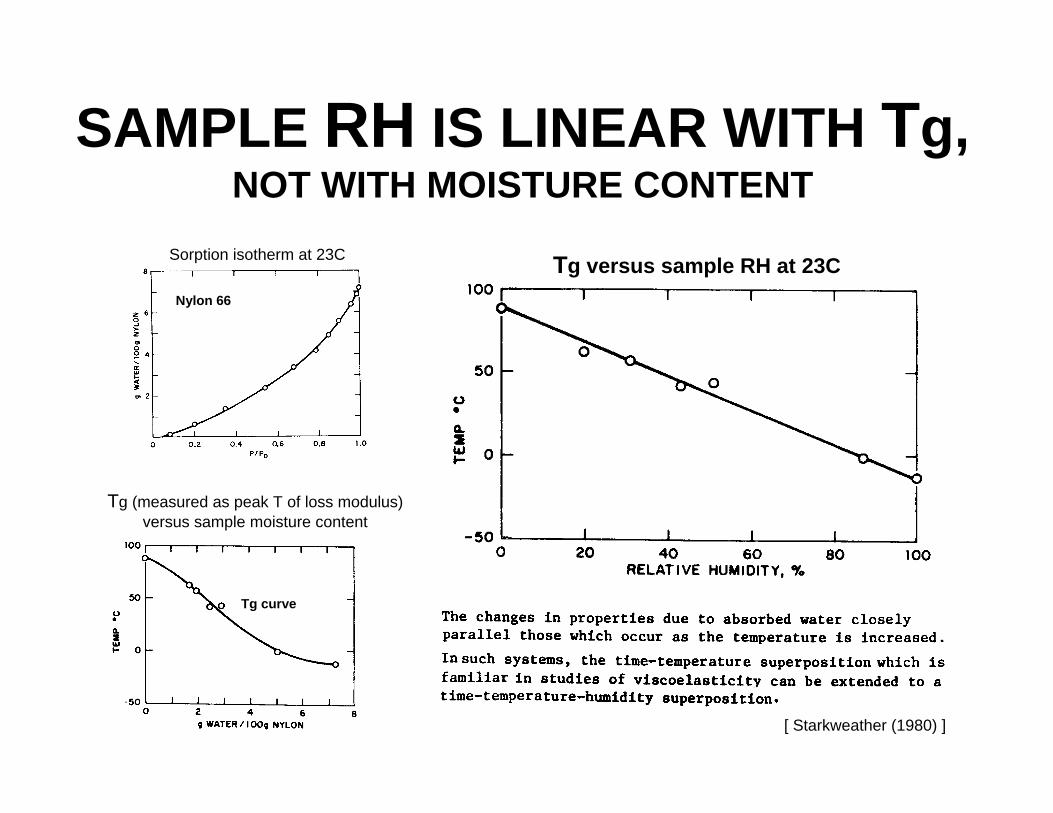
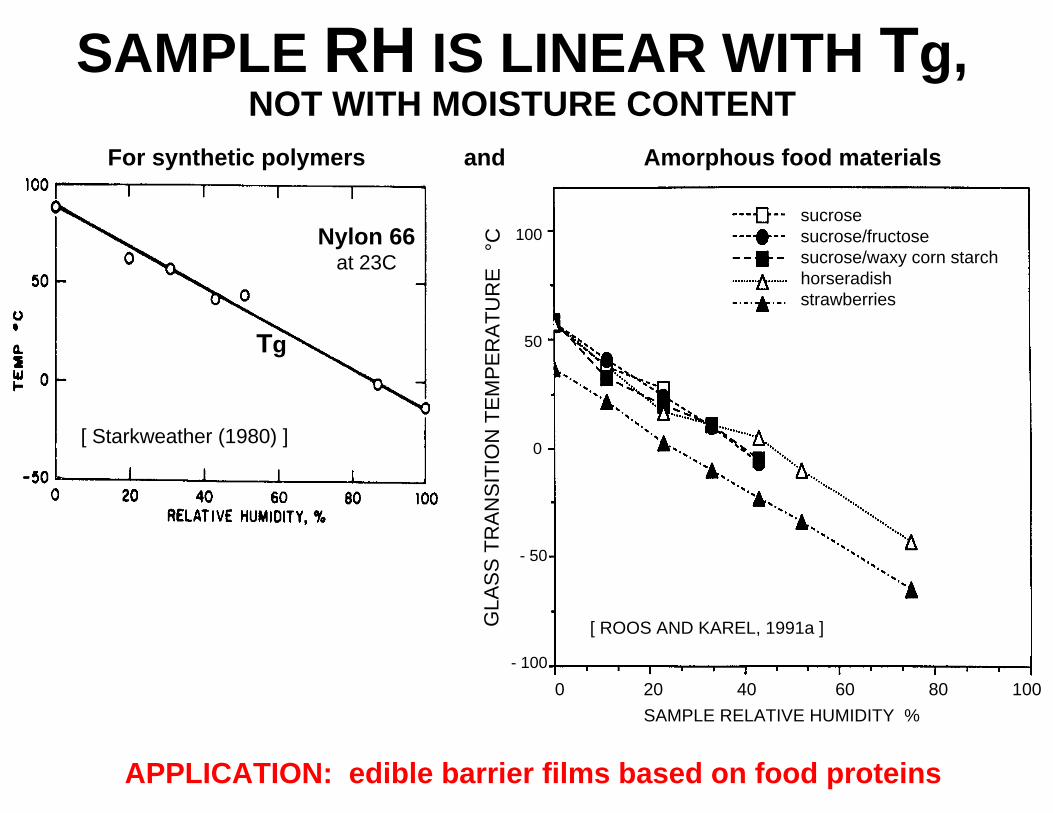
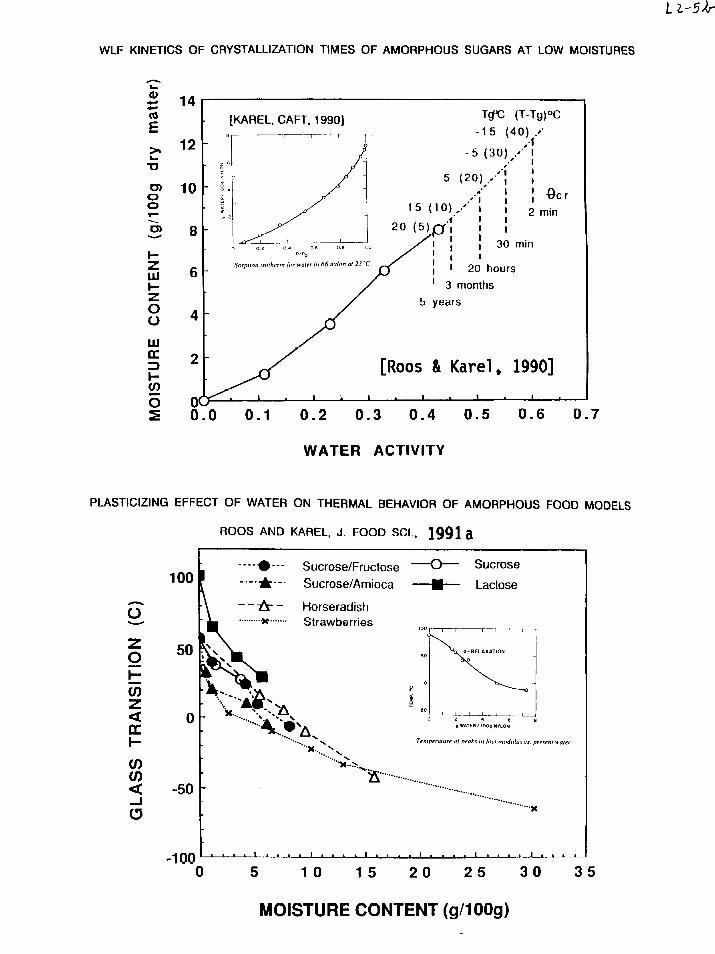
SAMPLE RH IS LINEAR WITH Tg, NOT WITH MOISTURE CONTENT
Tg curve
Tg (measured as peak T of loss modulus)versus sample moisture content
Sorption isotherm at 23C
Nylon 66
Tg versus sample RH at 23C
[ Starkweather (1980) ]
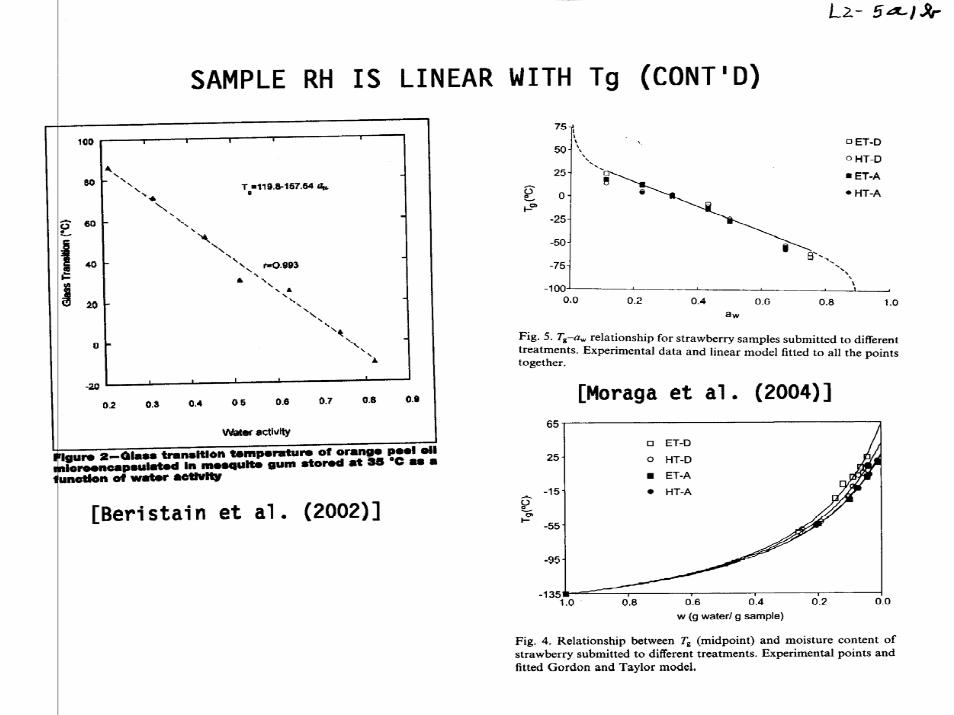
SAMPLE RH IS LINEAR WITH Tg, NOT WITH MOISTURE CONTENT
Nylon 66at 23C
For synthetic polymers and Amorphous food materials
Tg
sucrosesucrose/fructosesucrose/waxy corn starchhorseradishstrawberries
0 20 40 60 80 100SAMPLE RELATIVE HUMIDITY %
[ ROOS AND KAREL, 1991a ]GLA
SS
T RA N
SITI
ON
TE M
PER
AT U
RE
°C 100
50
0
- 50
- 100
[ Starkweather (1980) ]
APPLICATION: edible barrier films based on food proteins
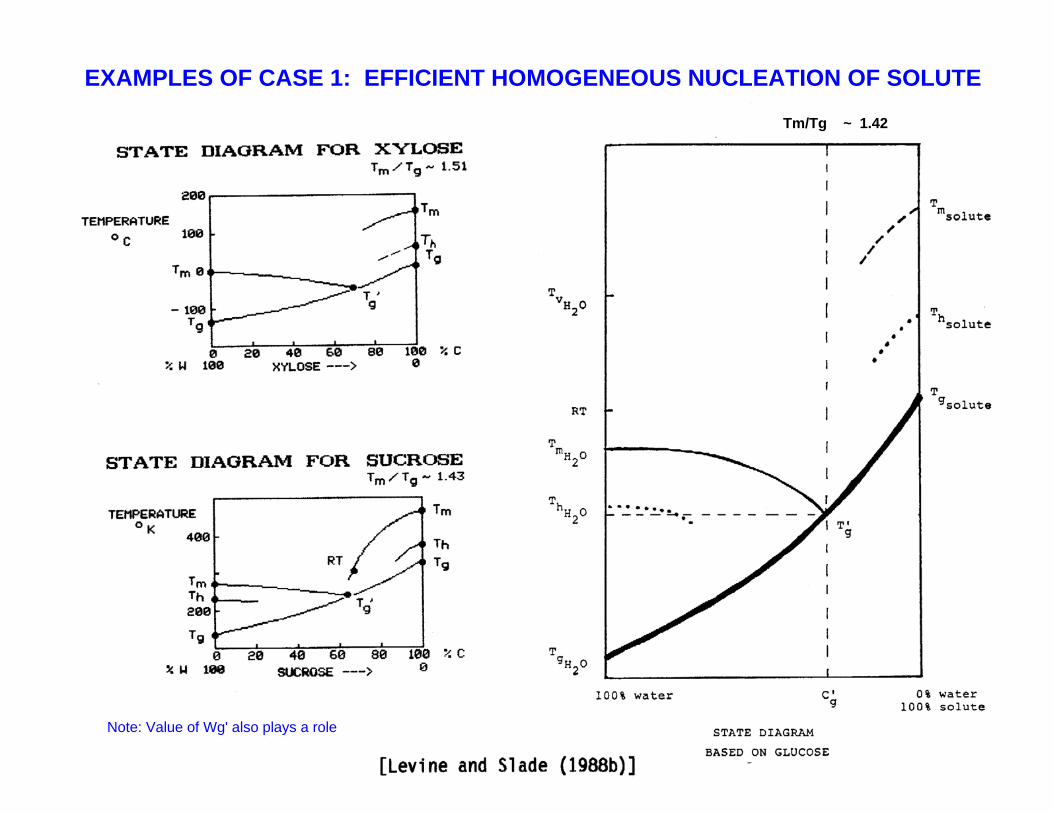
EXAMPLES OF CASE 1: EFFICIENT HOMOGENEOUS NUCLEATION OF SOLUTE
Note: Value of Wg' also plays a role
Tm/Tg ~ 1.42
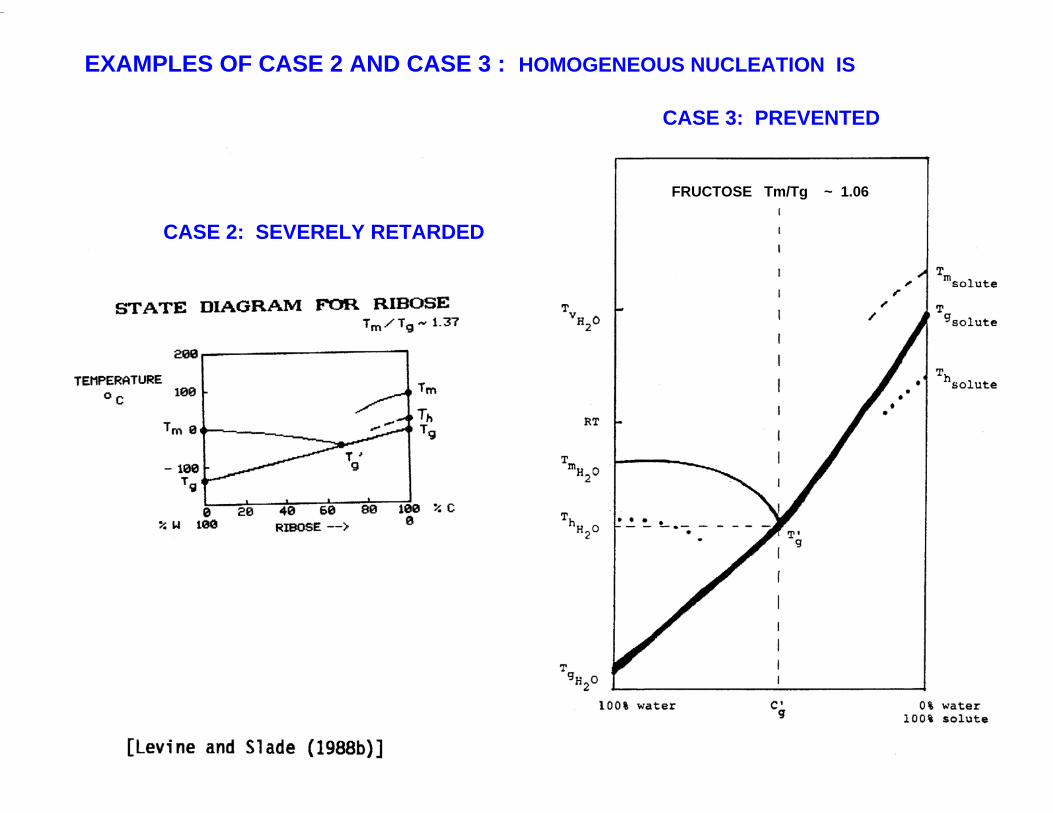
EXAMPLES OF CASE 2 AND CASE 3 : HOMOGENEOUS NUCLEATION IS
CASE 3: PREVENTED
CASE 2: SEVERELY RETARDED
FRUCTOSE Tm/Tg ~ 1.06
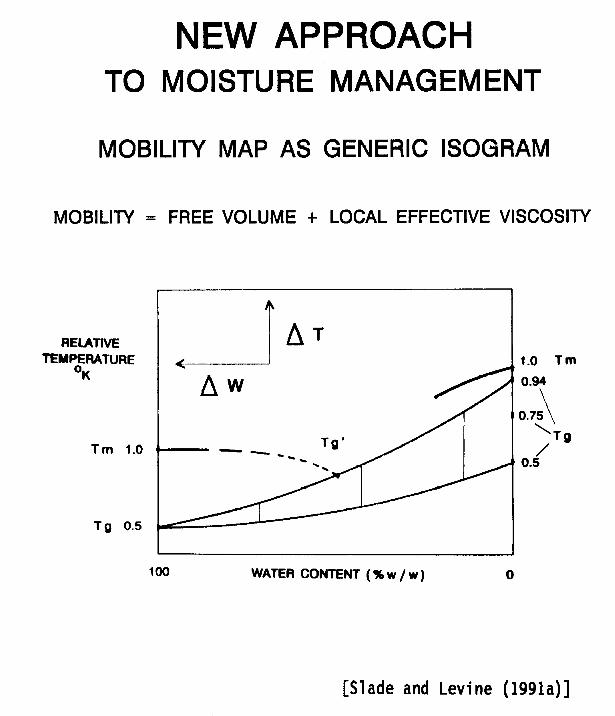
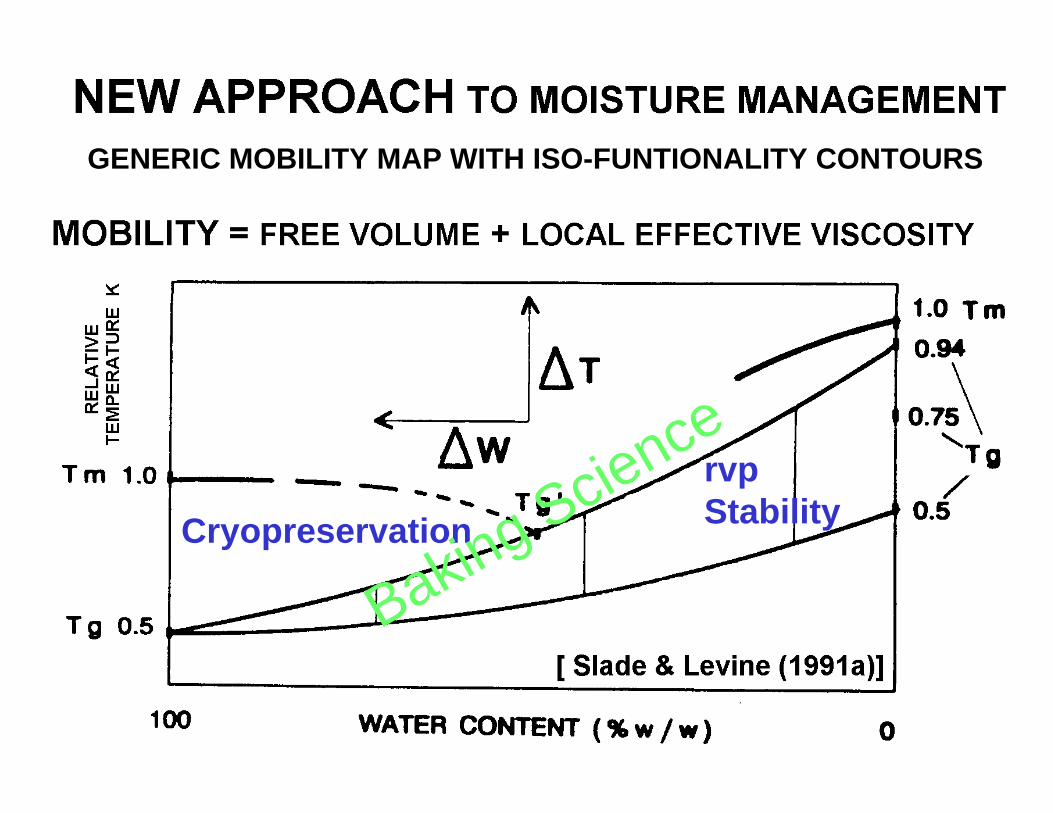
GENERIC MOBILITY MAP WITH ISO-FUNTIONALITY CONTOURS
Cryopreservation
rvp Stability
Baking Science
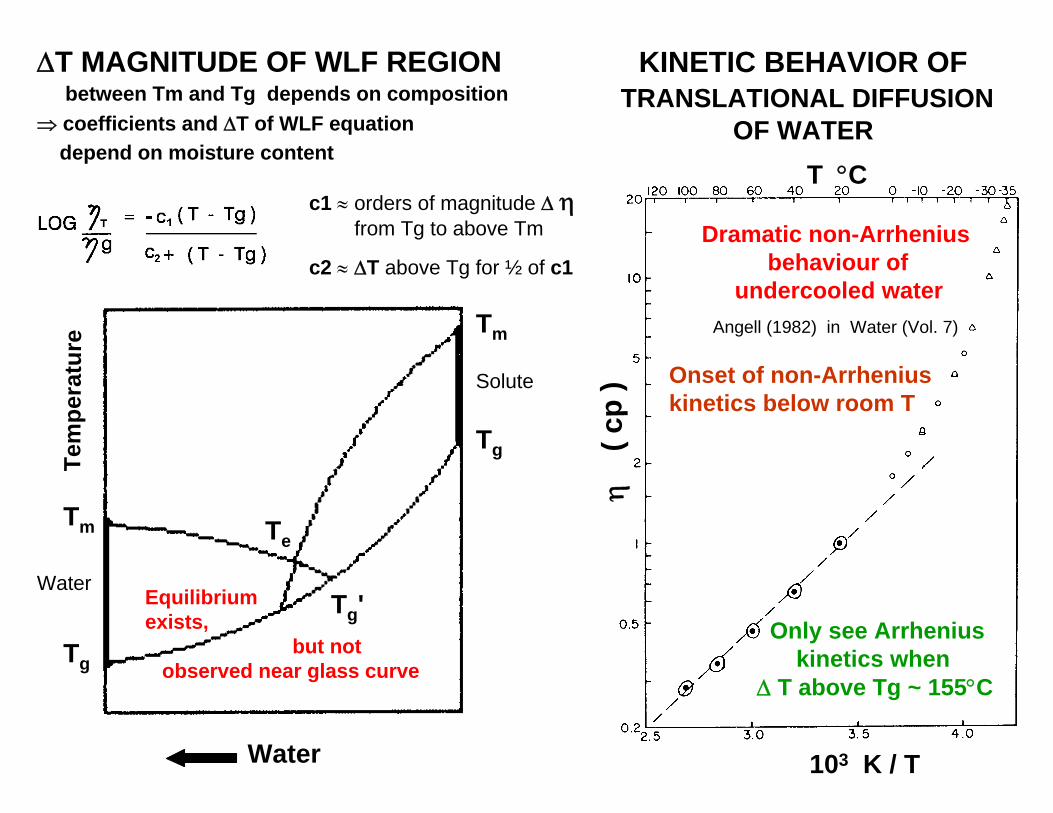
KINETIC BEHAVIOR OF TRANSLATIONAL DIFFUSION
OF WATERT C
( c
p )
103 K / T
Dramatic non-Arrheniusbehaviour of
undercooled water
Onset of non-Arrheniuskinetics below room T
Only see Arrheniuskinetics when
T above Tg ~ 155C
T MAGNITUDE OF WLF REGIONbetween Tm and Tg depends on composition
coefficients and T of WLF equation depend on moisture content
Angell (1982) in Water (Vol. 7)
Water
Tem
pera
ture
Tm
Tg
Tm
Tg
Te
Tg'Water
Solute
Equilibrium exists,
but notobserved near glass curve
c1 orders of magnitude from Tg to above Tm
c2 T above Tg for ½ of c1
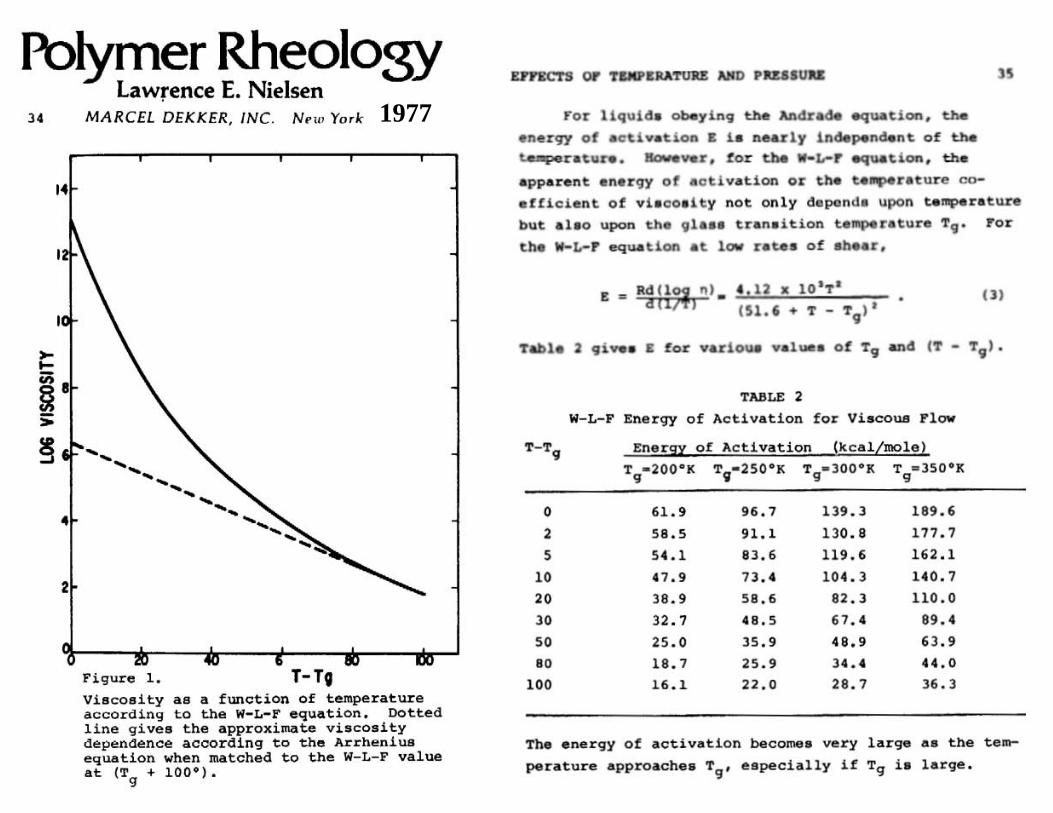
1977
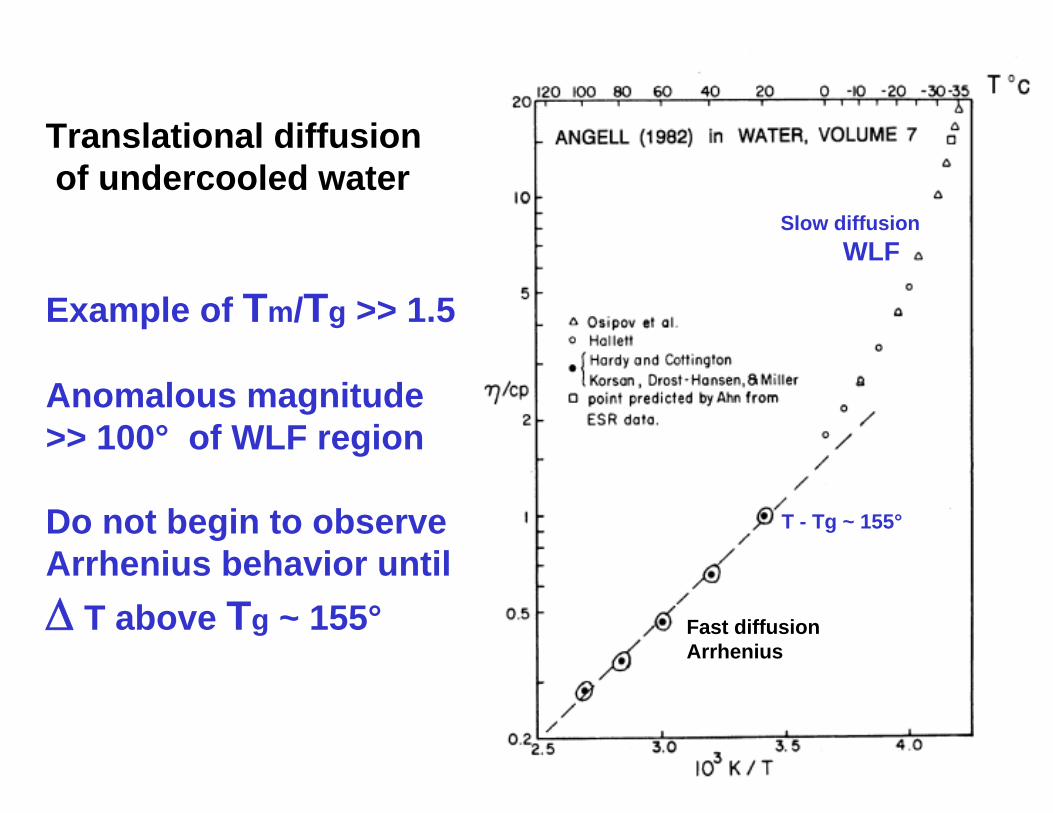
Translational diffusion of undercooled water
Example of Tm/Tg >> 1.5
Anomalous magnitude >> 100° of WLF region
Do not begin to observeArrhenius behavior until T above Tg ~ 155°
T - Tg ~ 155°
Fast diffusionArrhenius
Slow diffusionWLF
log LocalViscosity
logRelaxation Time
Fructose
Glucose
Water
6º3º
2º
HYPERBOLIC
Temperaturelog
Rel
axa t
ion
T IM
E
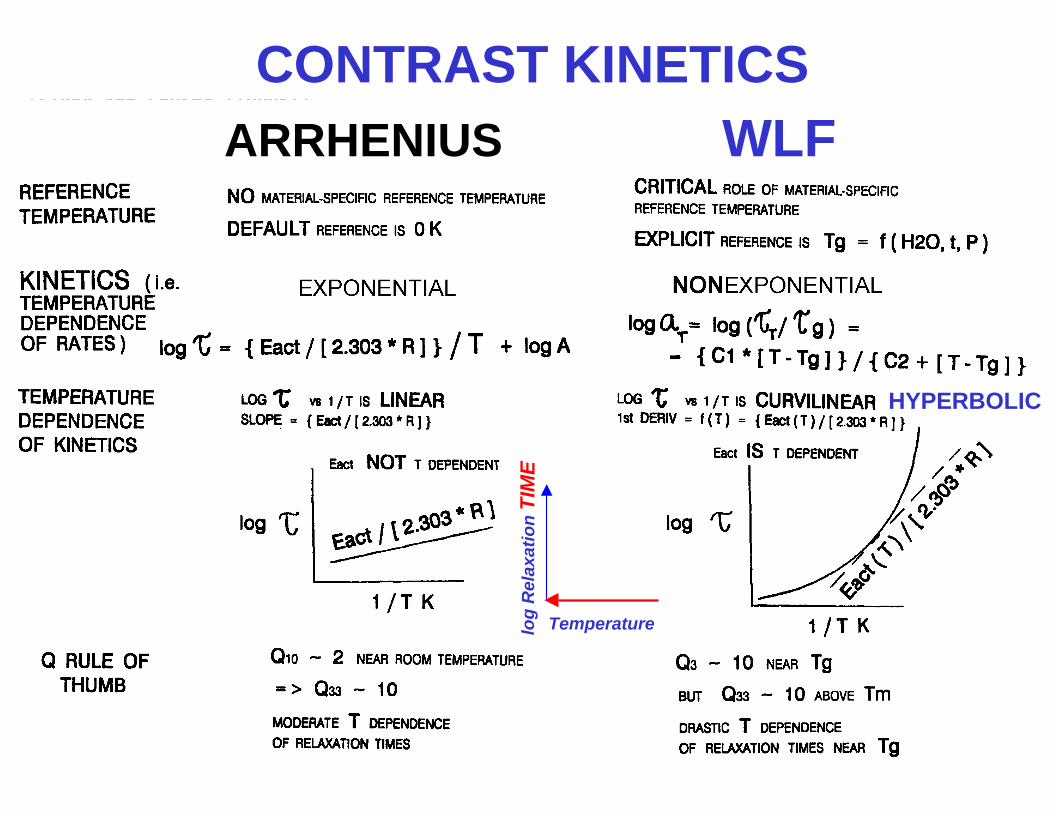
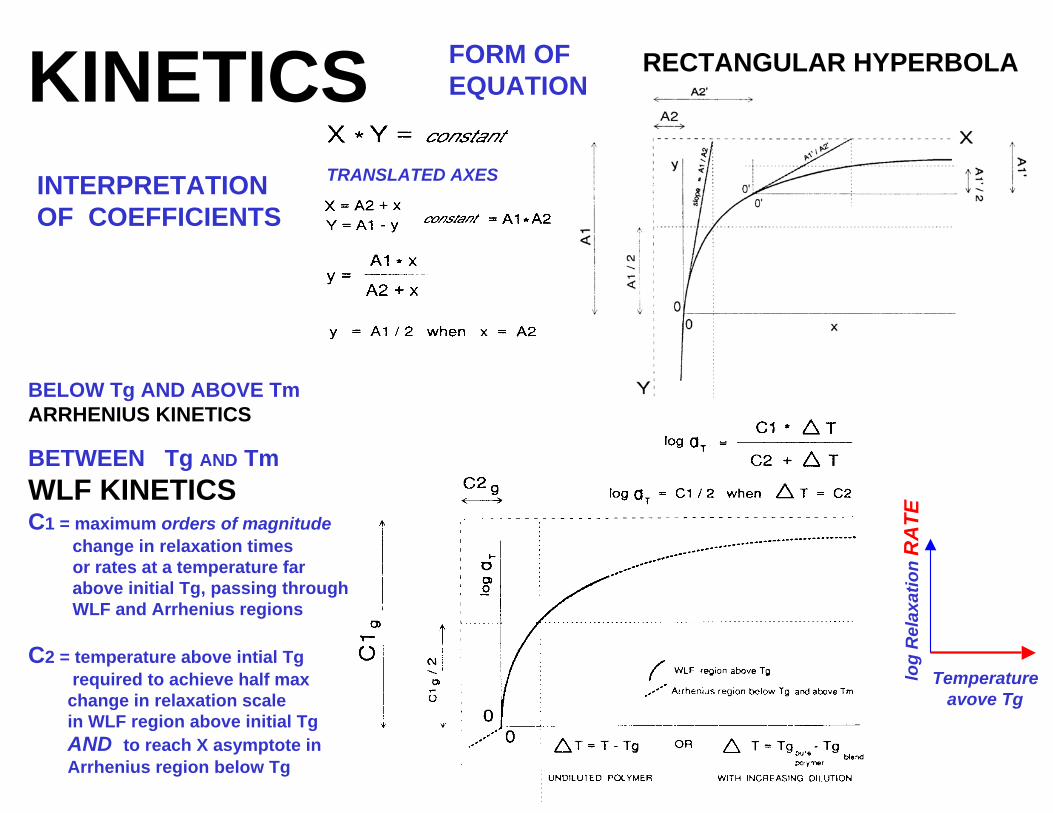
CONTRAST KINETICSARRHENIUS WLF
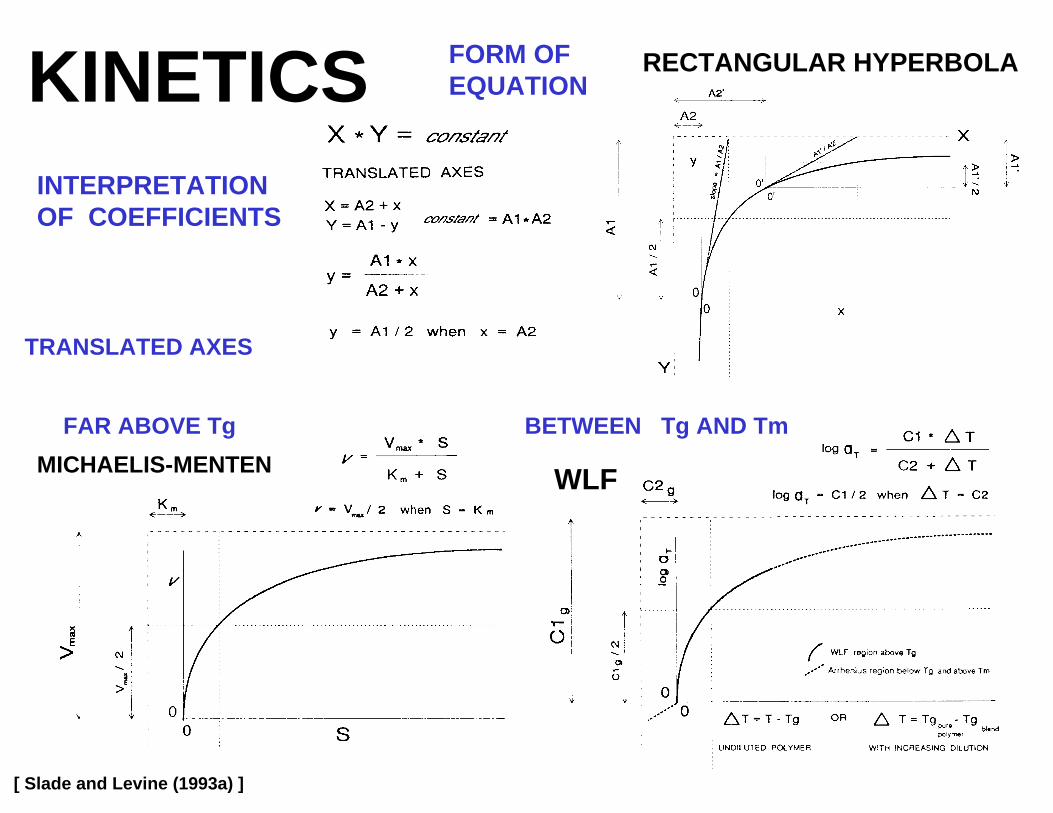
KINETICSINTERPRETATION OF COEFFICIENTS
FORM OFEQUATION
RECTANGULAR HYPERBOLA
TRANSLATED AXES
WLF
BETWEEN Tg AND TmFAR ABOVE TgMICHAELIS-MENTEN
[ Slade and Levine (1993a) ]
KINETICSINTERPRETATION OF COEFFICIENTS
FORM OFEQUATION
RECTANGULAR HYPERBOLA
TRANSLATED AXES
BETWEEN Tg AND TmWLF KINETICS
BELOW Tg AND ABOVE TmARRHENIUS KINETICS
Temperatureavove Tg
log
Rel
axa t
ion
RA
T EC1 = maximum orders of magnitudechange in relaxation times or rates at a temperature far above initial Tg, passing throughWLF and Arrhenius regions
C2 = temperature above intial Tg required to achieve half max
change in relaxation scale in WLF region above initial Tg AND to reach X asymptote in Arrhenius region below Tg
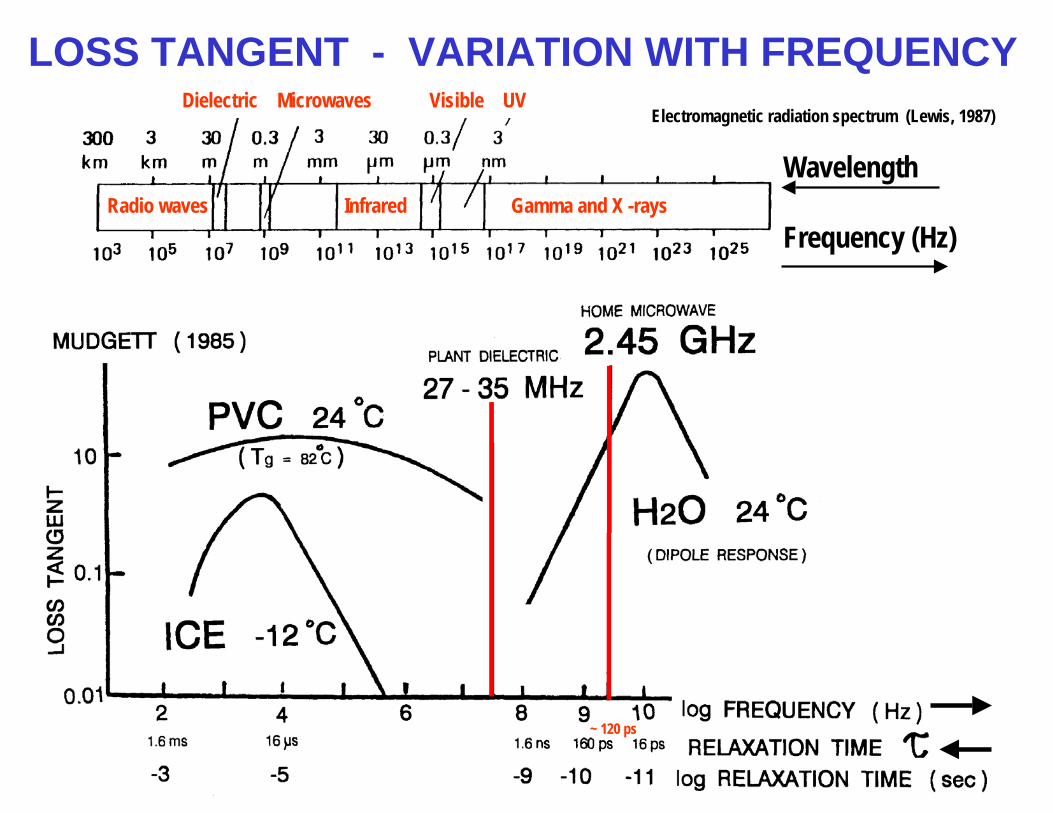
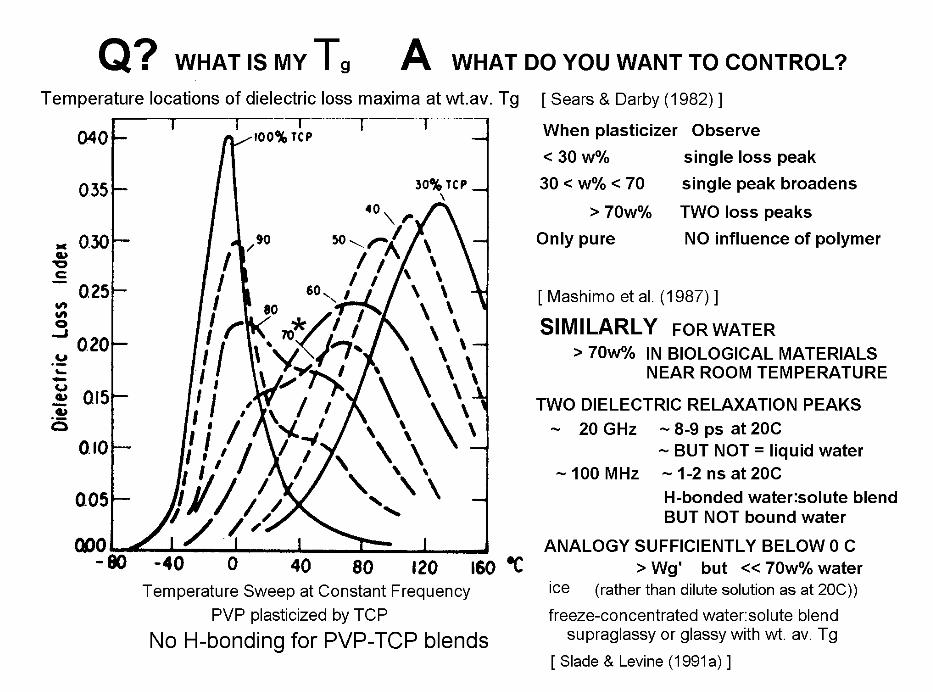
LOSS TANGENT - VARIATION WITH FREQUENCY
Radio wavesWavelength
Frequency (Hz)Gamma and X -raysInfrared
Dielectric Microwaves Visible UVElectromagnetic radiation spectrum (Lewis, 1987)
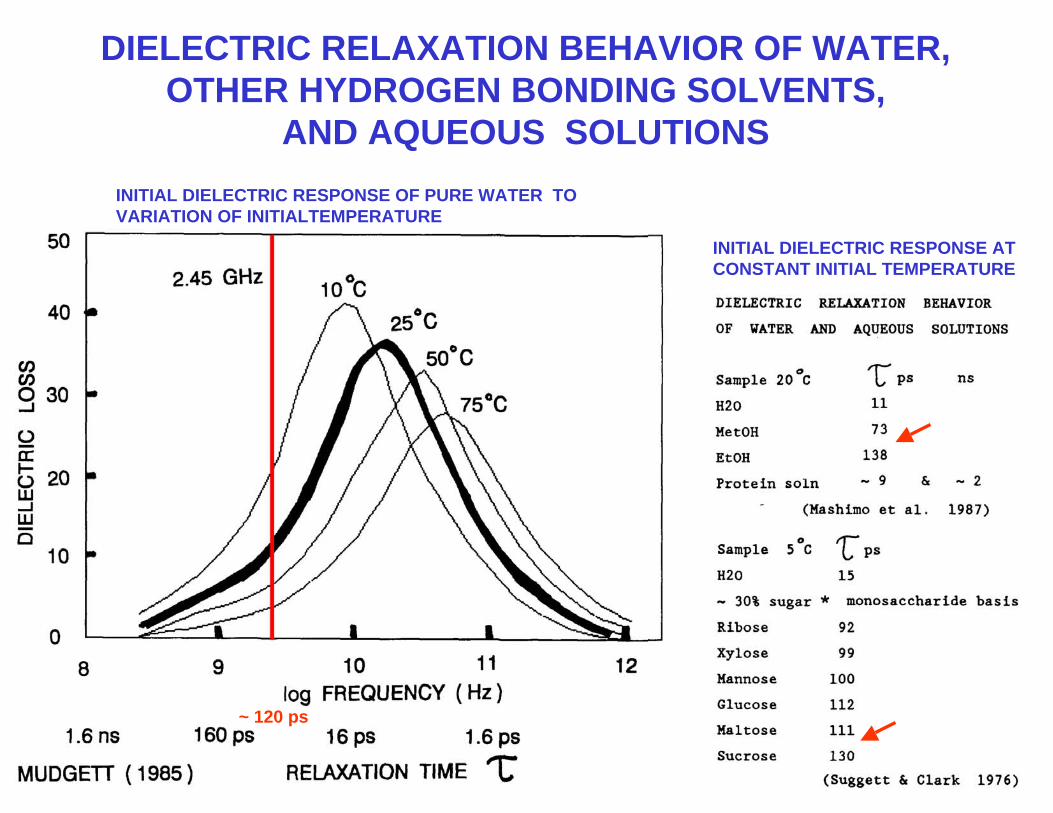
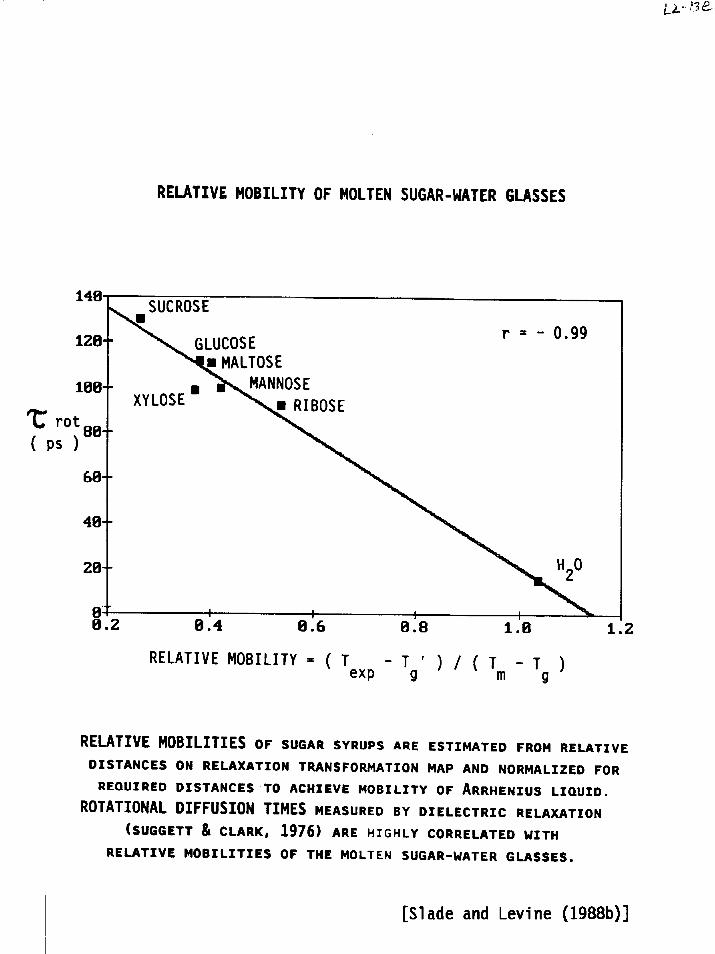
~ 120 ps
~ 120 ps
DIELECTRIC RELAXATION BEHAVIOR OF WATER, OTHER HYDROGEN BONDING SOLVENTS,
AND AQUEOUS SOLUTIONSINITIAL DIELECTRIC RESPONSE OF PURE WATER TOVARIATION OF INITIALTEMPERATURE
INITIAL DIELECTRIC RESPONSE AT CONSTANT INITIAL TEMPERATURE
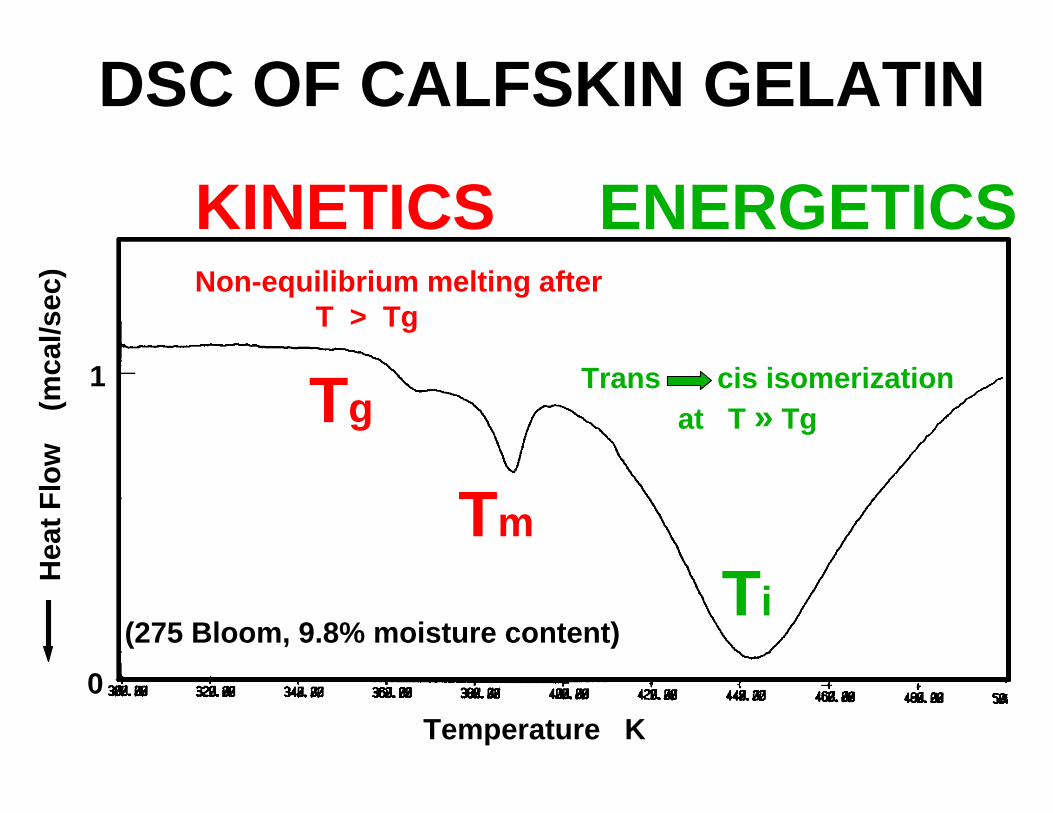
DSC OF CALFSKIN GELATIN
(275 Bloom, 9.8% moisture content)
Temperature K
Hea
t Flo
w
(mca
l/sec
)
1
0
Tg
Tm
Ti
KINETICSNon-equilibrium melting after
T > Tg
ENERGETICS
Trans cis isomerizationat T » Tg
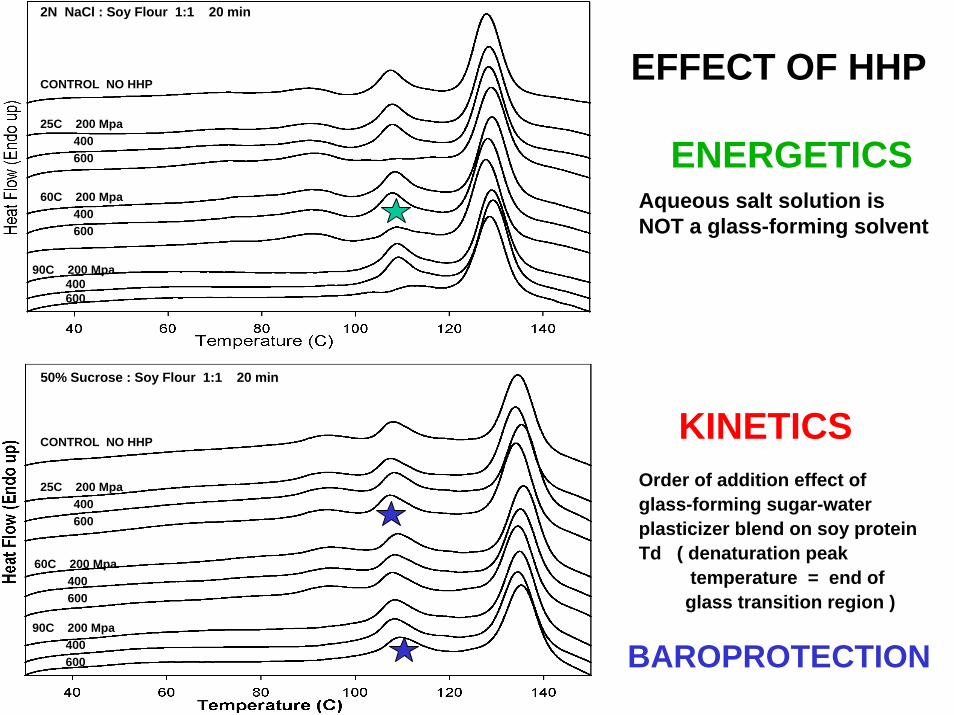
Order of addition effect ofglass-forming sugar-water plasticizer blend on soy proteinTd ( denaturation peak
temperature = end of glass transition region )
KINETICS
ENERGETICSAqueous salt solution isNOT a glass-forming solvent
EFFECT OF HHPCONTROL NO HHP
2N NaCl : Soy Flour 1:1 20 min
50% Sucrose : Soy Flour 1:1 20 min
CONTROL NO HHP
25C 200 Mpa400600
25C 200 Mpa400600
60C 200 Mpa400600
60C 200 Mpa400600
90C 200 Mpa400600
90C 200 Mpa400600 BAROPROTECTION
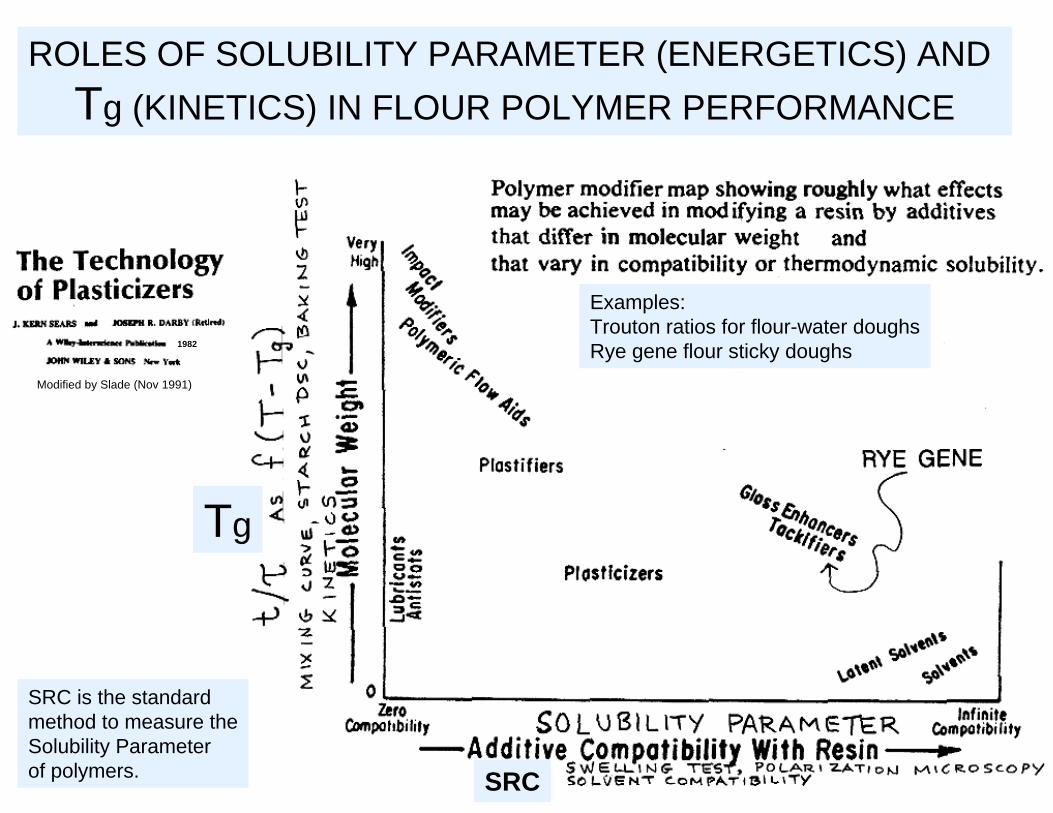
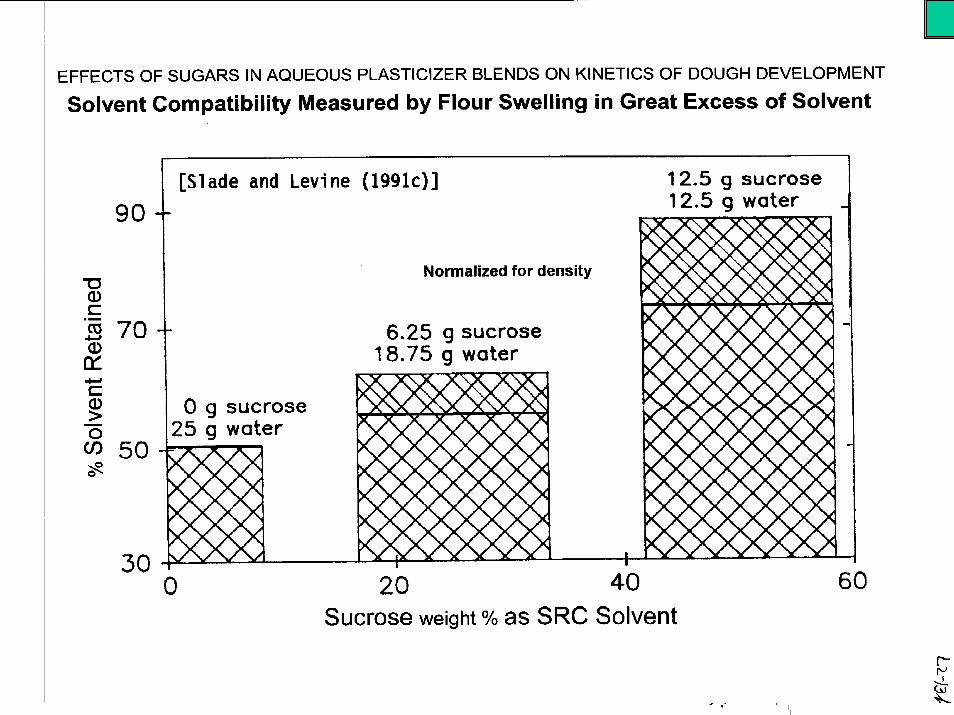
ROLES OF SOLUBILITY PARAMETER (ENERGETICS) AND Tg (KINETICS) IN FLOUR POLYMER PERFORMANCE
Tg
SRC
SRC is the standardmethod to measure theSolubility Parameterof polymers.
Examples: Trouton ratios for flour-water doughsRye gene flour sticky doughs
Modified by Slade (Nov 1991)
1982
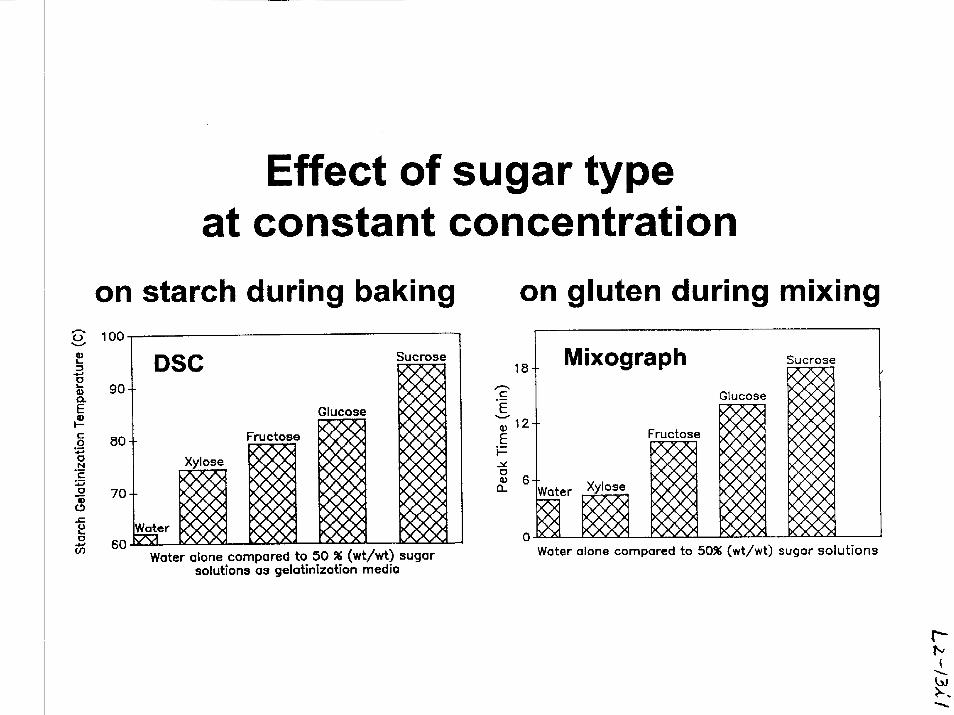
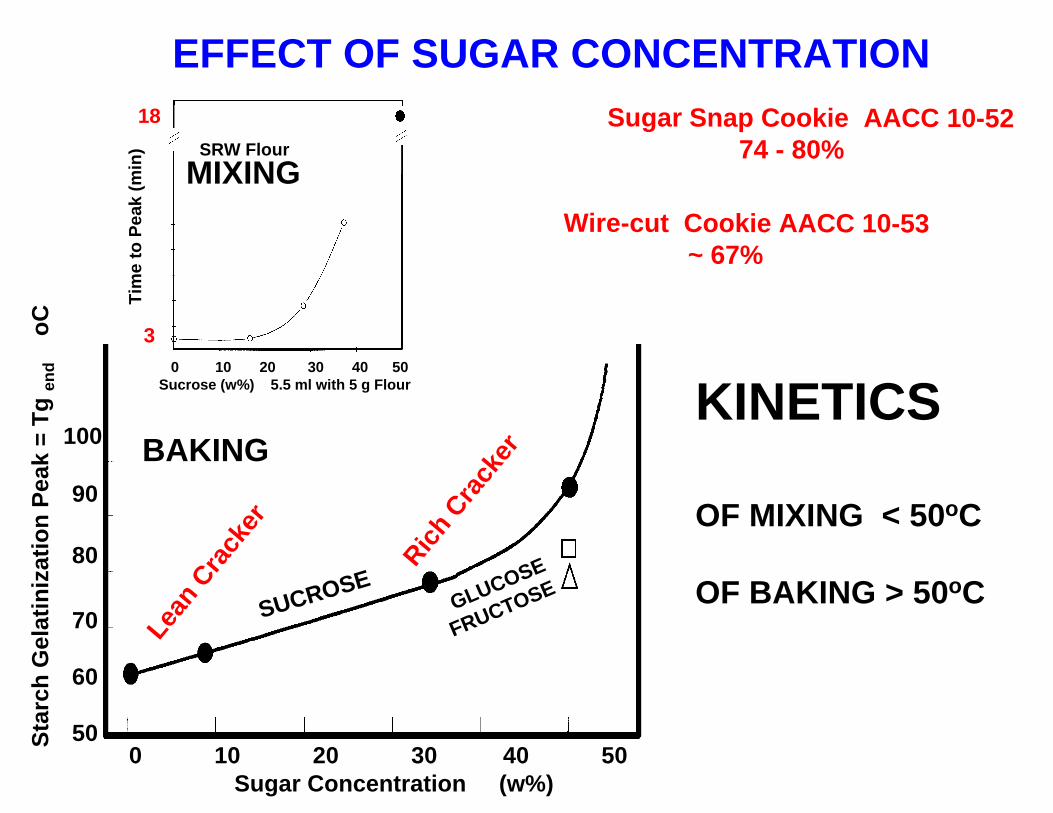
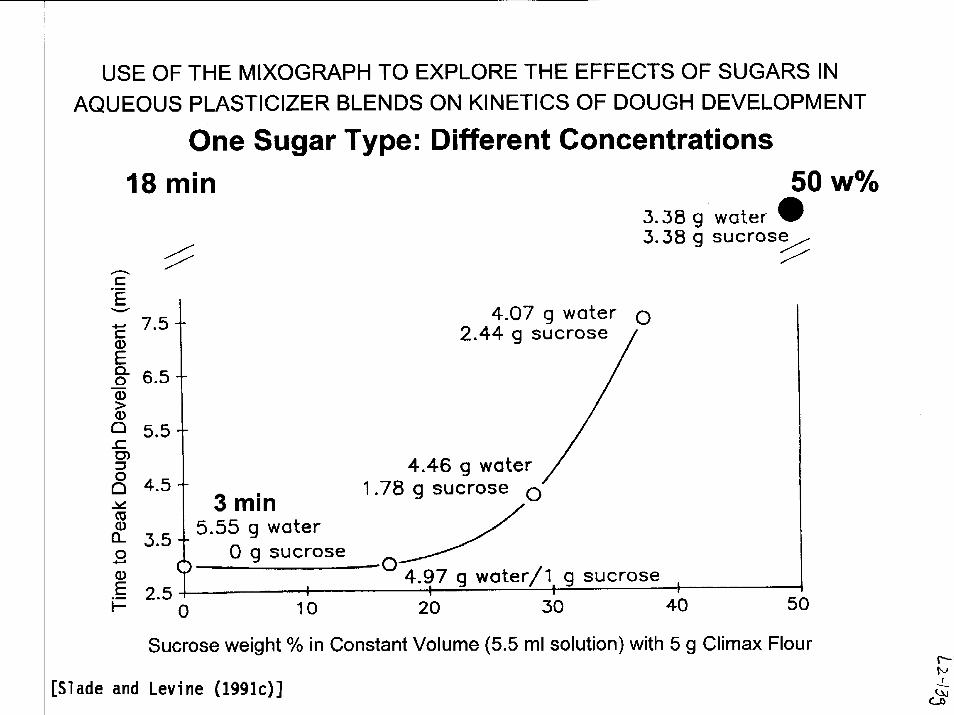
0 10 20 30 40 50Sugar Concentration (w%)
0 10 20 30 40 50Sucrose (w%) 5.5 ml with 5 g Flour
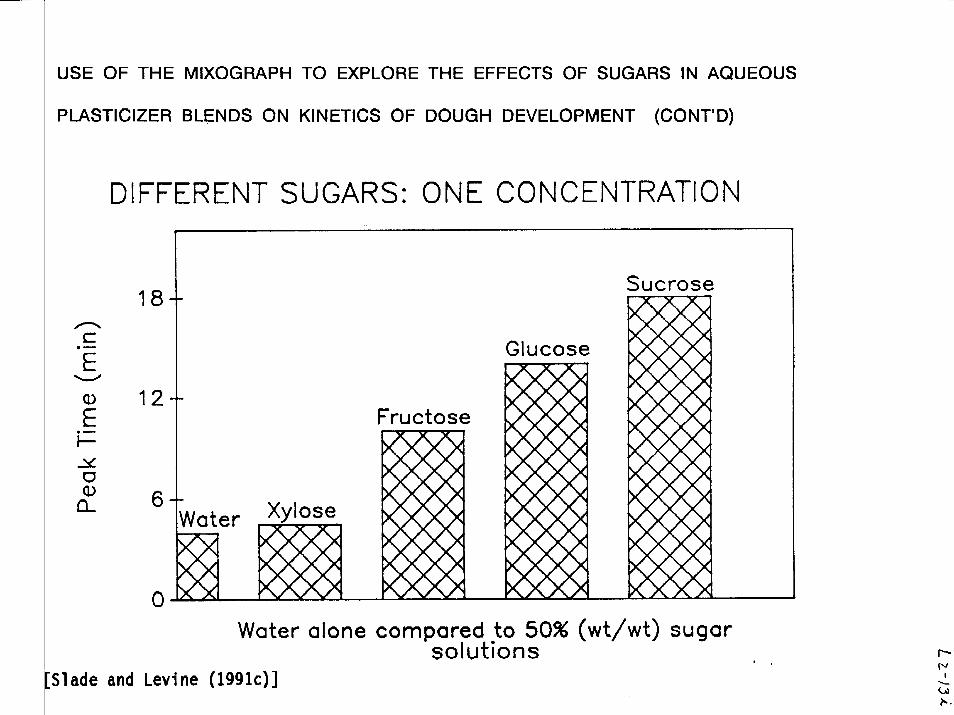
Tim
e to
Pea
k (m
in)
18
3
SRW Flour
Star
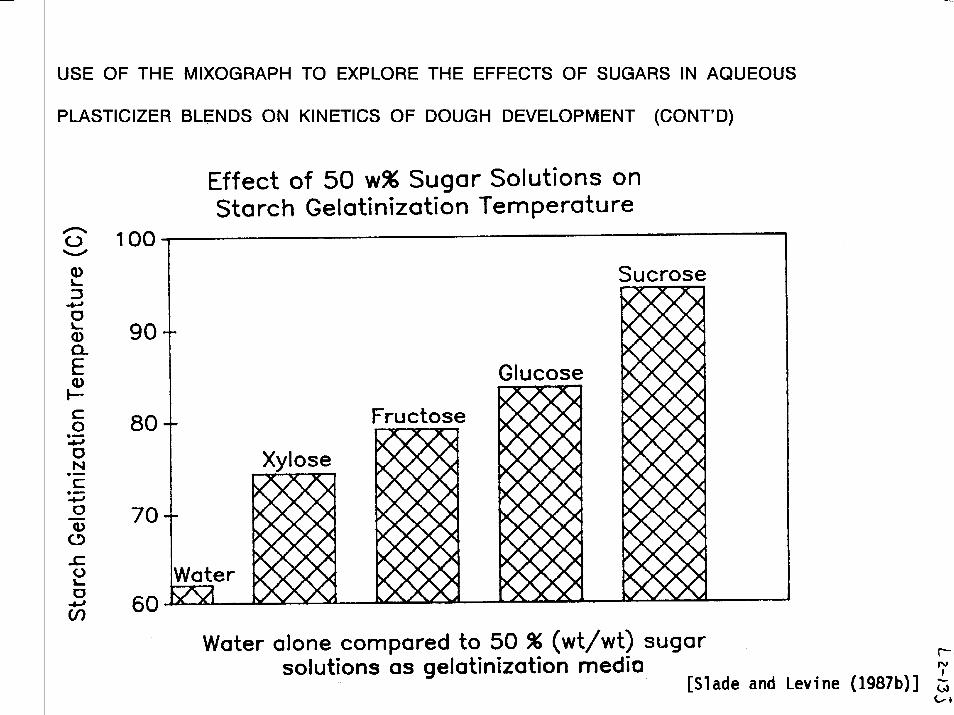
ch G
elat
iniz
atio
nPe
ak =
Tg
end
oC
SUCROSEGLUCOSE
FRUCTOSE
100
90
80
70
60
50
Lean
Cra
cker
Rich C
rack
er
Wire-cut Cookie AACC 10-53 ~ 67%
Sugar Snap Cookie AACC 10-5274 - 80%
KINETICS
OF MIXING < 50oC
OF BAKING > 50oC
MIXING
BAKING
EFFECT OF SUGAR CONCENTRATION
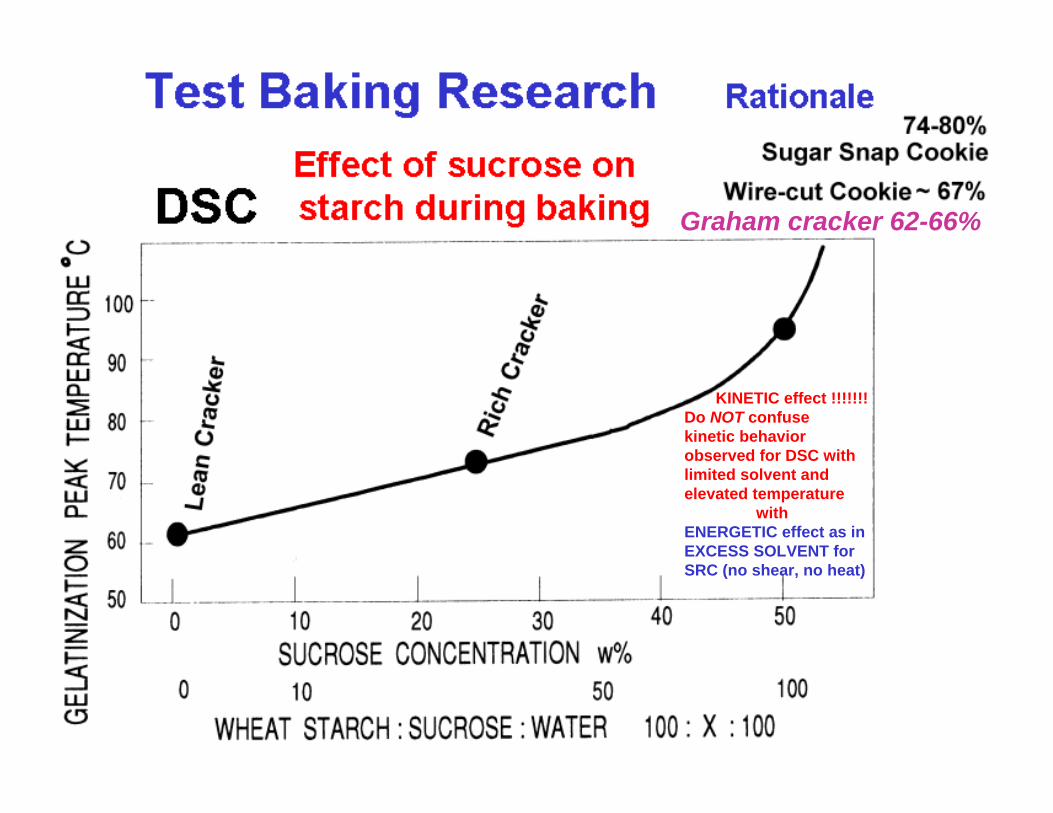
Graham cracker 62-66%
KINETIC effect !!!!!!!Do NOT confusekinetic behavior observed for DSC withlimited solvent andelevated temperature
with ENERGETIC effect as inEXCESS SOLVENT forSRC (no shear, no heat)
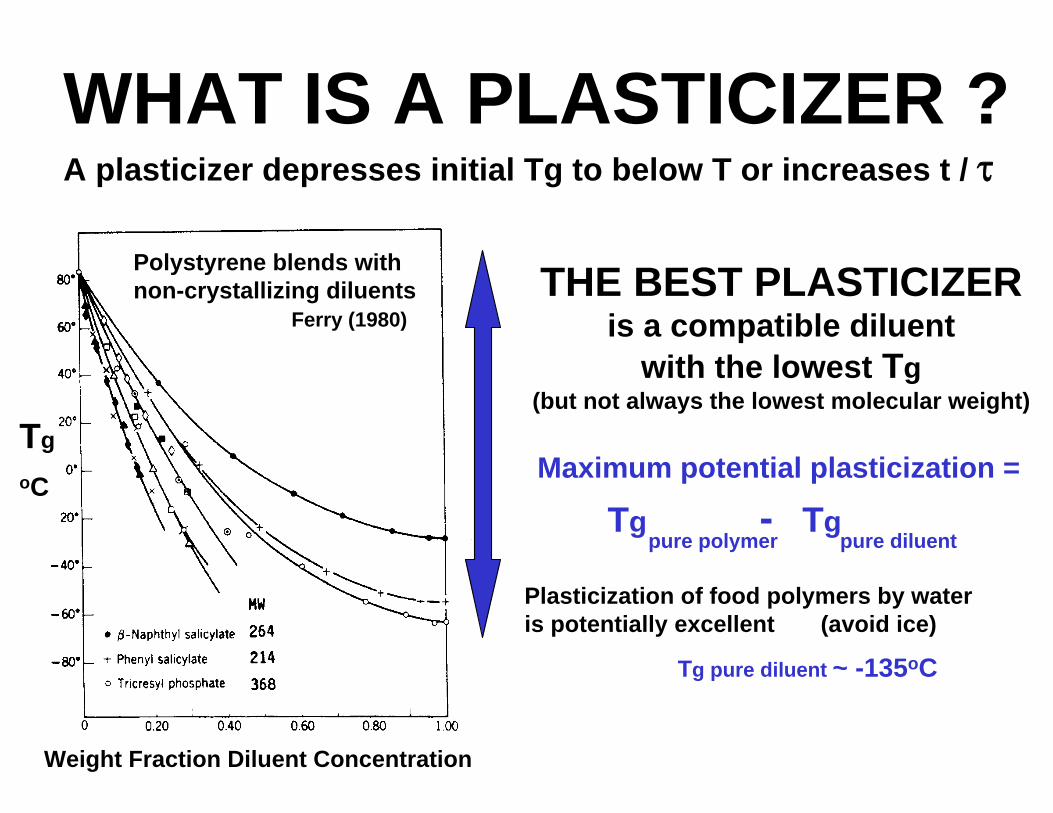
THE BEST PLASTICIZERis a compatible diluent
with the lowest Tg(but not always the lowest molecular weight)
WHAT IS A PLASTICIZER ?
Polystyrene blends withnon-crystallizing diluents
Ferry (1980)
Maximum potential plasticization =
Tg - Tg
TgoC
Weight Fraction Diluent Concentration
pure polymer pure diluent
A plasticizer depresses initial Tg to below T or increases t /
Plasticization of food polymers by wateris potentially excellent (avoid ice)
Tg pure diluent ~ -135oC
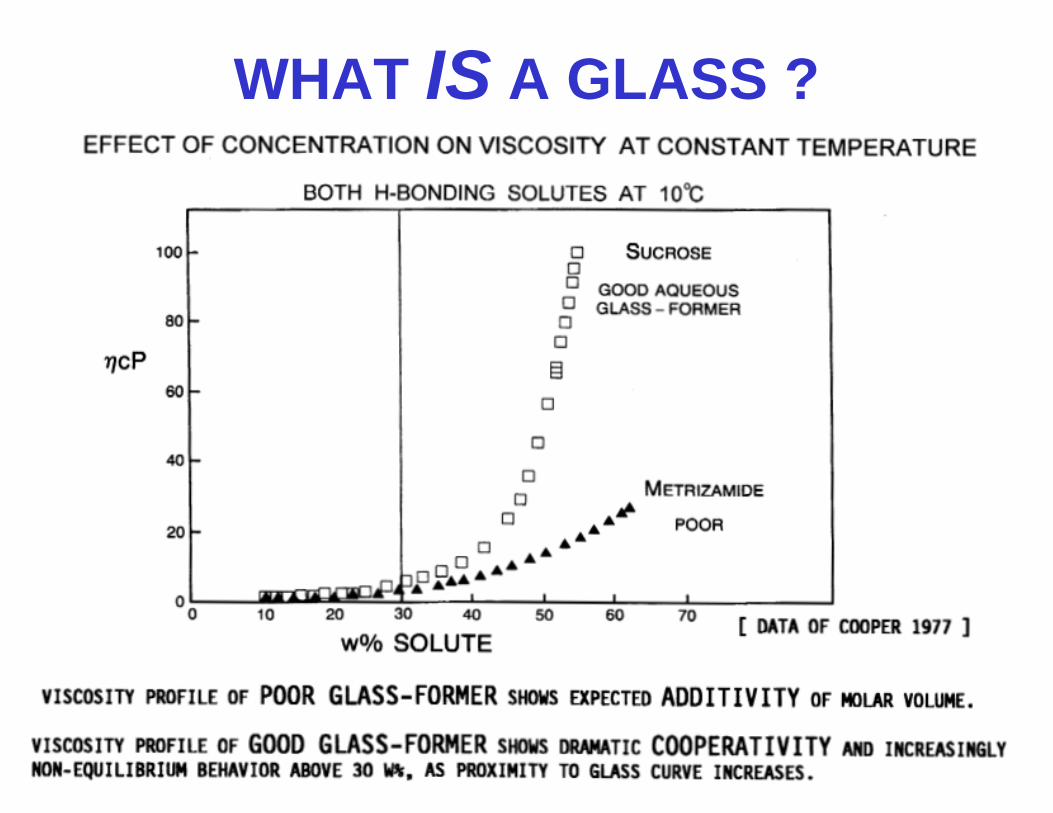
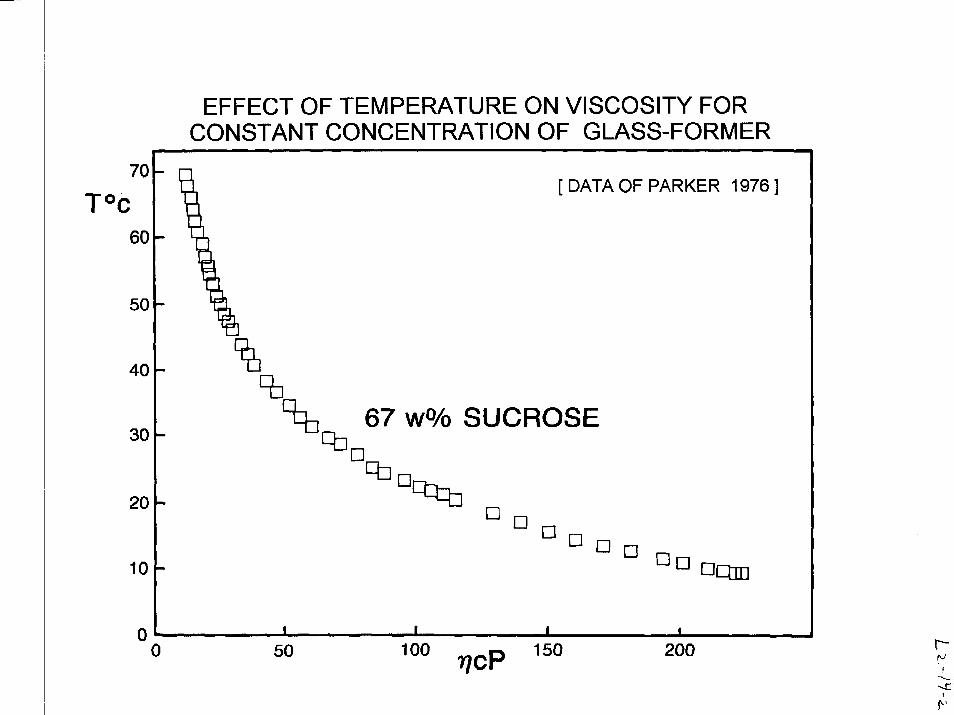
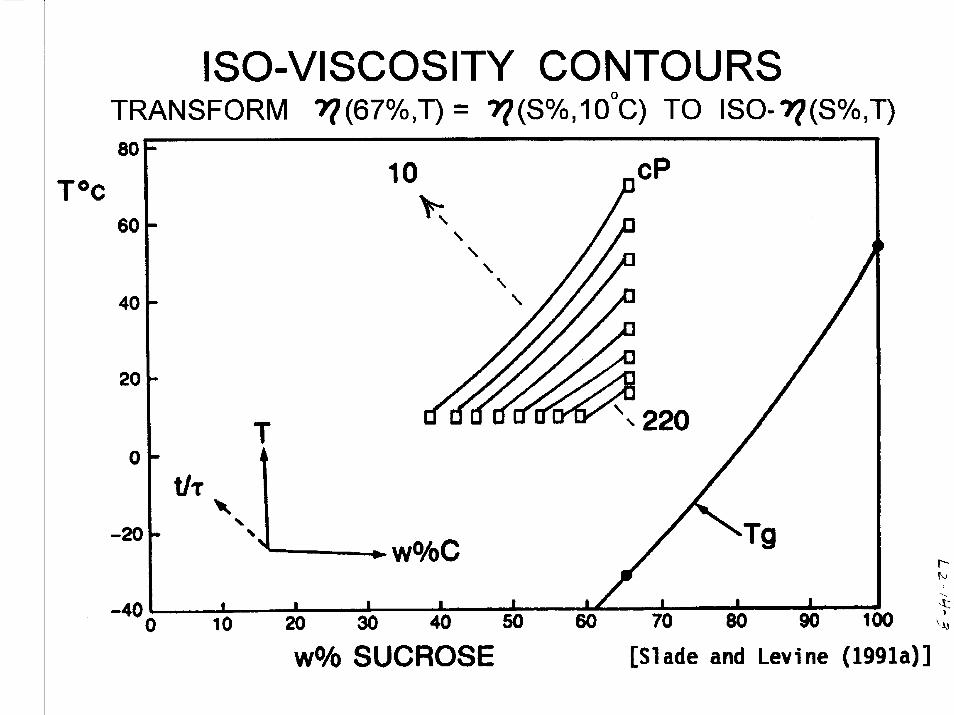
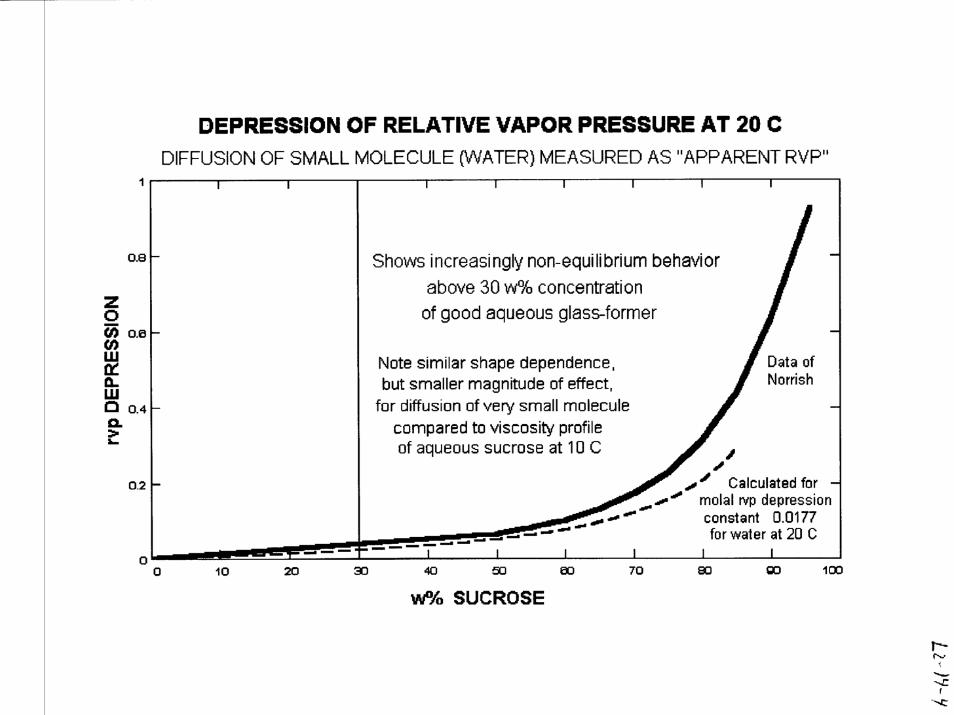
WHAT IS A GLASS ?
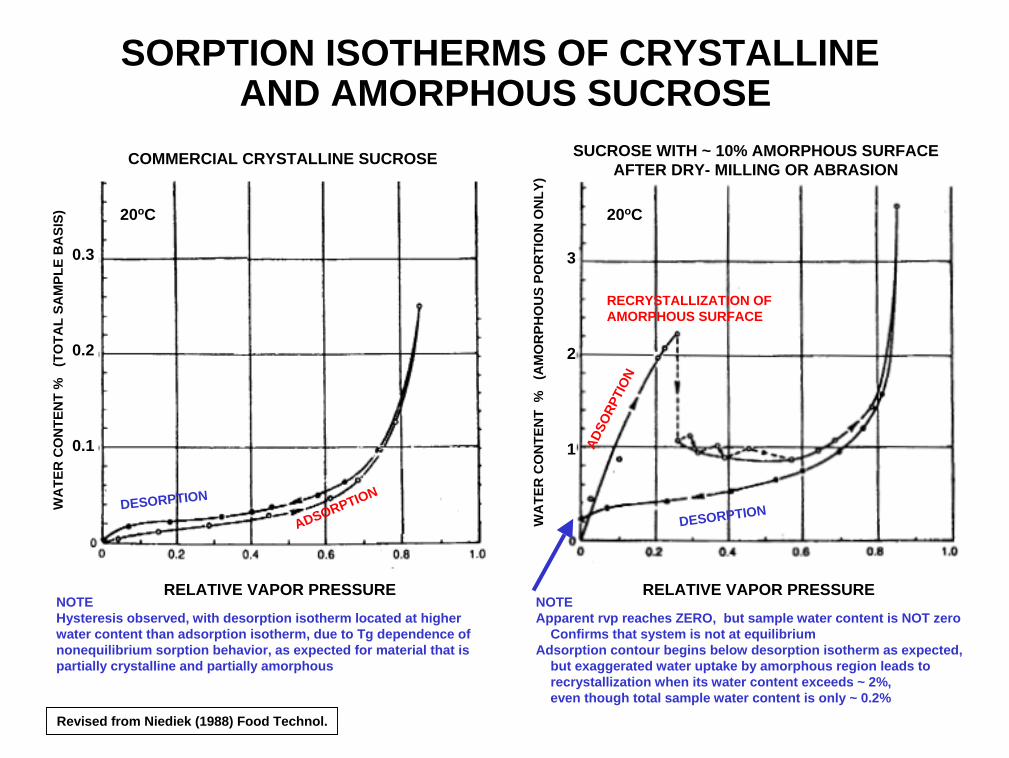
SORPTION ISOTHERMS OF CRYSTALLINE AND AMORPHOUS SUCROSE
COMMERCIAL CRYSTALLINE SUCROSE SUCROSE WITH ~ 10% AMORPHOUS SURFACEAFTER DRY- MILLING OR ABRASION
RELATIVE VAPOR PRESSURE RELATIVE VAPOR PRESSURE
WA
TER
CO
NTE
NT
%
(TO
TAL
SAM
PLE
BA
SIS)
WA
TER
CO
NTE
NT
%
(AM
OR
PHO
US
POR
TIO
N O
NLY
)
ADSO
RPTI
ON
ADSORPTION
RECRYSTALLIZATION OF AMORPHOUS SURFACE
NOTEApparent rvp reaches ZERO, but sample water content is NOT zero
Confirms that system is not at equilibriumAdsorption contour begins below desorption isotherm as expected,
but exaggerated water uptake by amorphous region leads torecrystallization when its water content exceeds ~ 2%, even though total sample water content is only ~ 0.2%
DESORPTIONDESORPTION
Revised from Niediek (1988) Food Technol.
20oC 20oC
0.3
0.2
0.1
3
2
1
NOTEHysteresis observed, with desorption isotherm located at higherwater content than adsorption isotherm, due to Tg dependence ofnonequilibrium sorption behavior, as expected for material that is partially crystalline and partially amorphous
w% H2O25
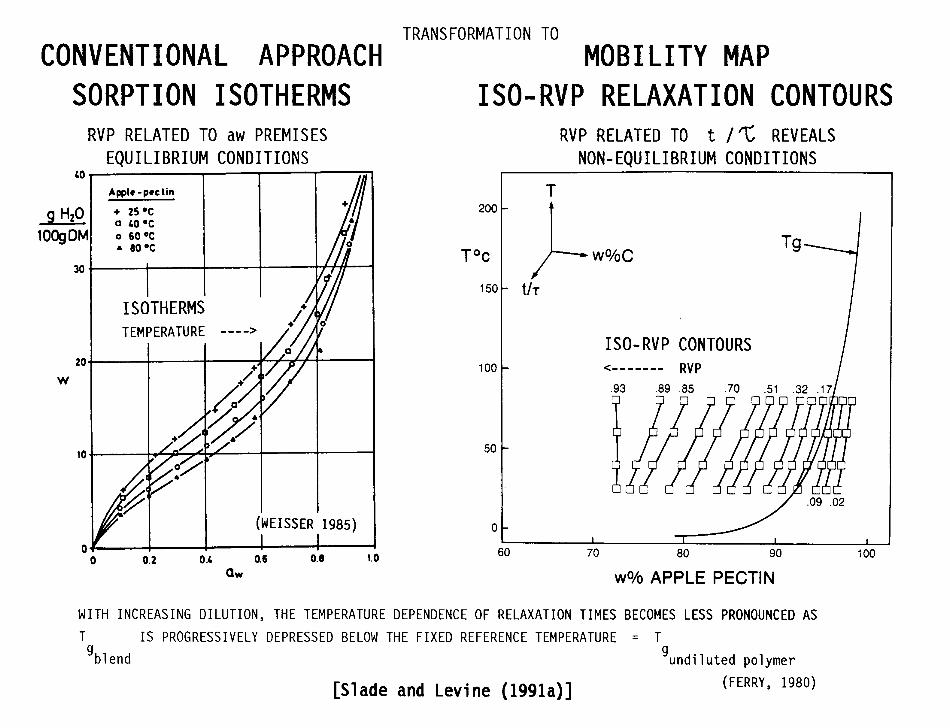
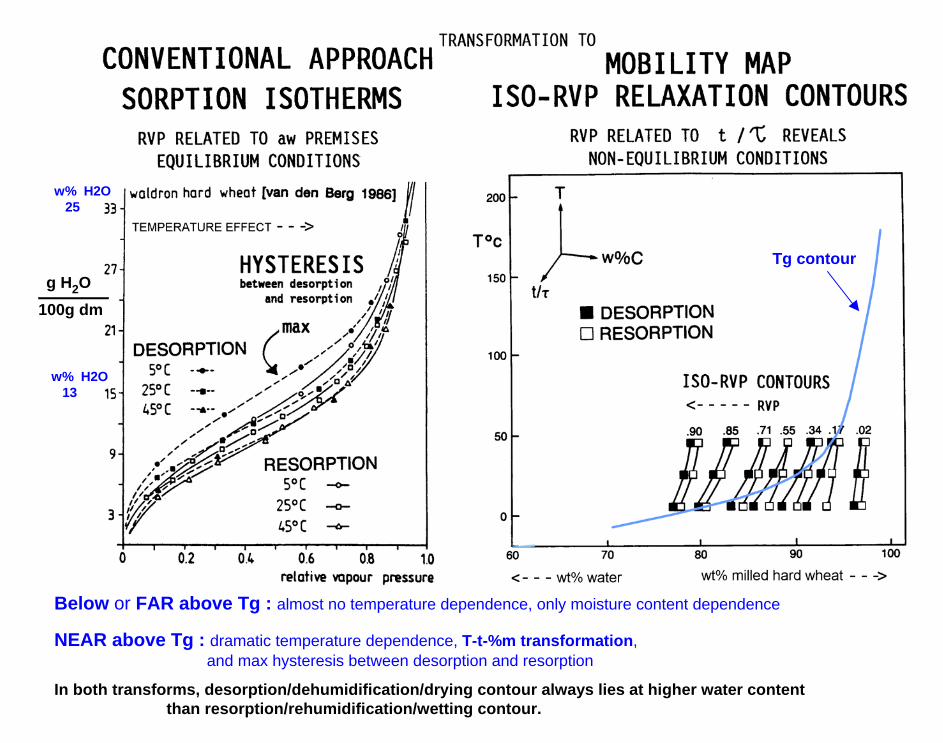
In both transforms, desorption/dehumidification/drying contour always lies at higher water contentthan resorption/rehumidification/wetting contour.
w% H2O13
Tg contour
Below or FAR above Tg : almost no temperature dependence, only moisture content dependence
NEAR above Tg : dramatic temperature dependence, T-t-%m transformation, and max hysteresis between desorption and resorption
________100g dmg H2O
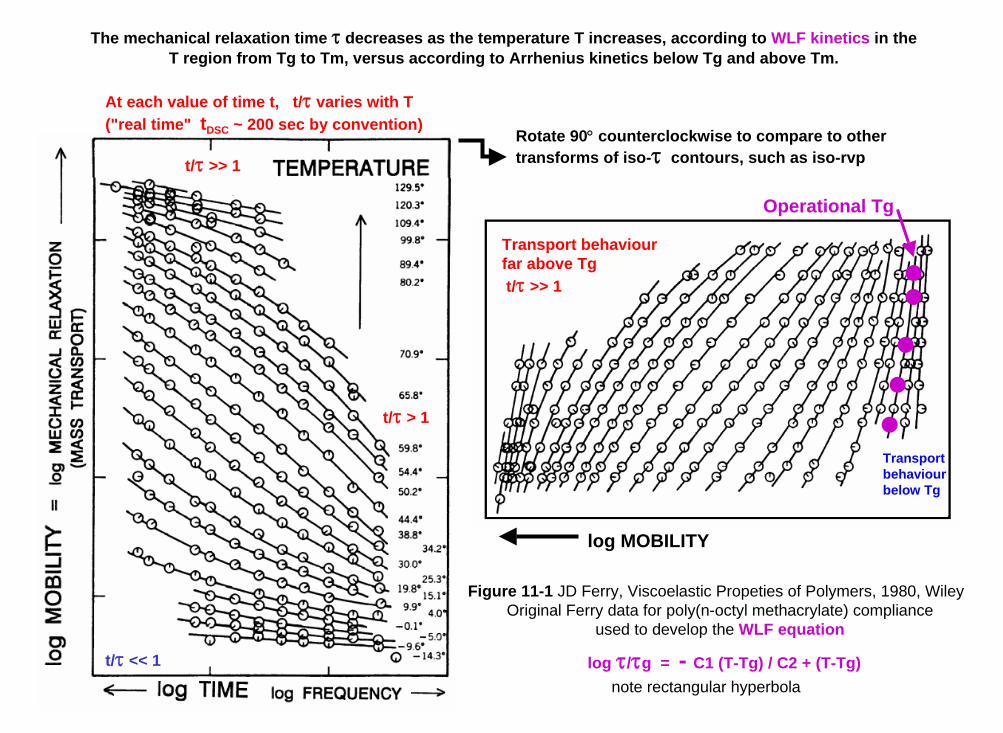
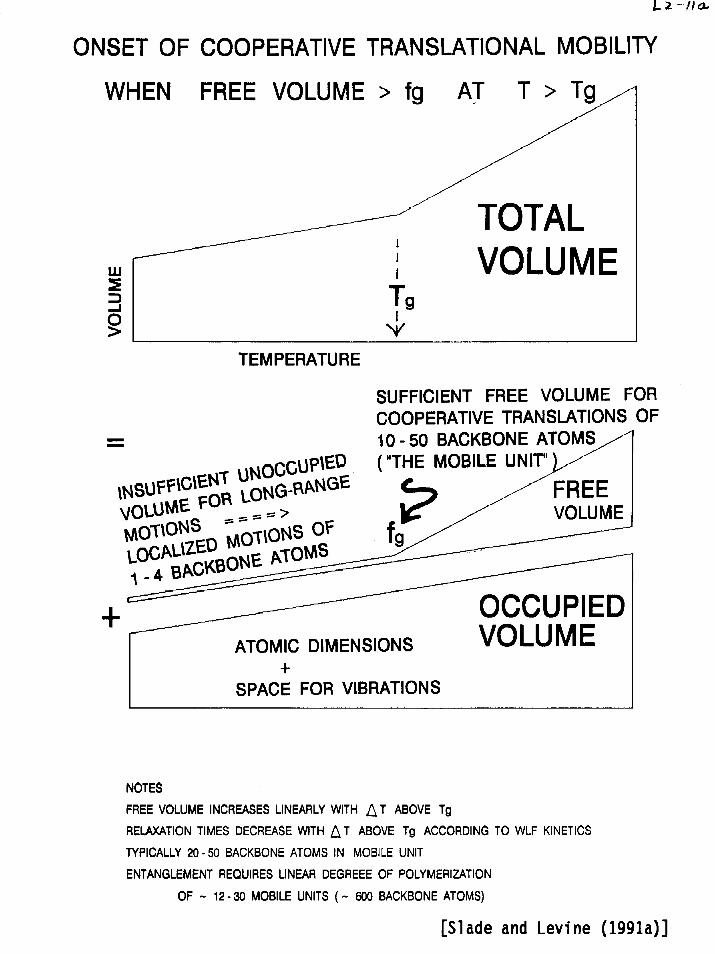
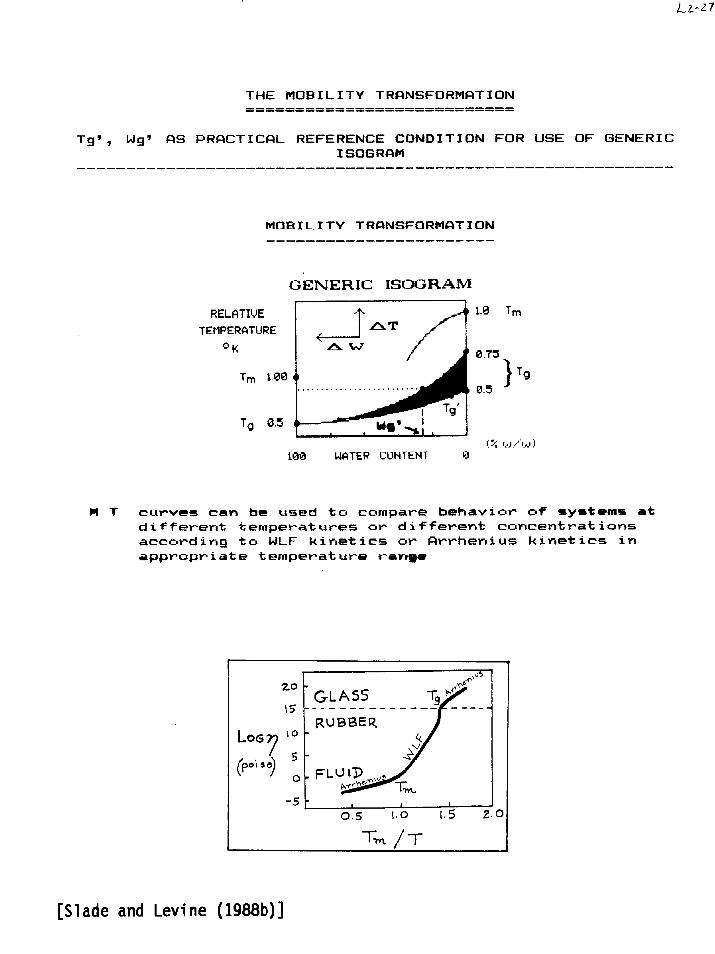
The mechanical relaxation time decreases as the temperature T increases, according to WLF kinetics in the T region from Tg to Tm, versus according to Arrhenius kinetics below Tg and above Tm.
At each value of time t, t/ varies with T ("real time" tDSC ~ 200 sec by convention)
t/ >> 1
t/ > 1
t/ << 1
Figure 11-1 JD Ferry, Viscoelastic Propeties of Polymers, 1980, WileyOriginal Ferry data for poly(n-octyl methacrylate) compliance
used to develop the WLF equation
log MOBILITY
Transport behaviourfar above Tg
Transport behaviourbelow Tg
Operational Tg
t/ >> 1
Rotate 90 counterclockwise to compare to othertransforms of iso- contours, such as iso-rvp
log /g = - C1 (T-Tg) / C2 + (T-Tg)note rectangular hyperbola
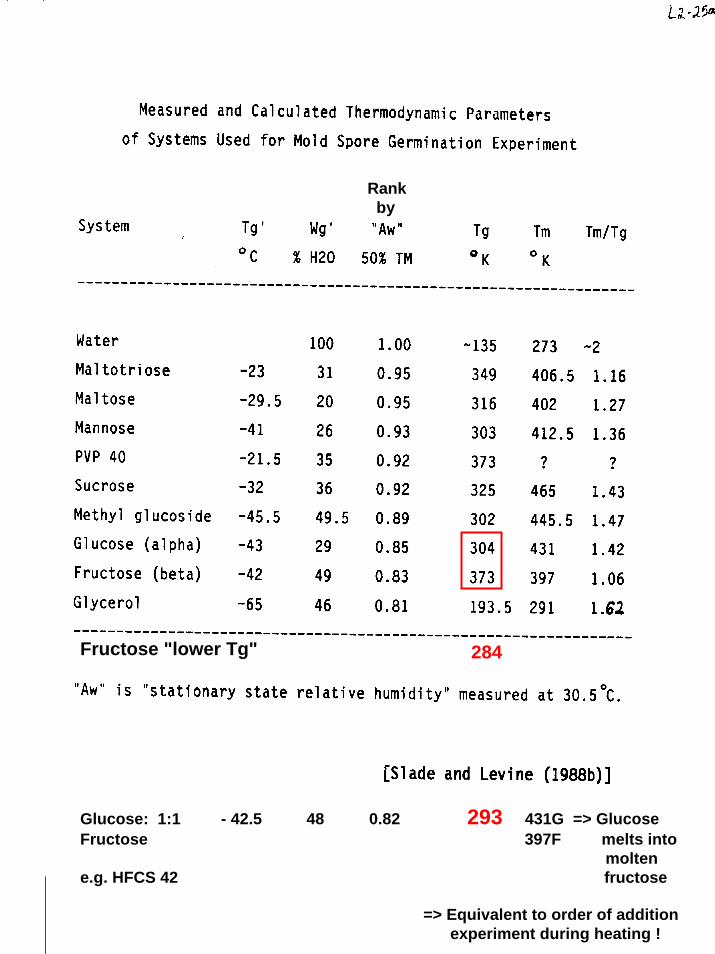
Rankby
Glucose: 1:1 - 42.5 48 0.82 293 431G => GlucoseFructose 397F melts into
moltene.g. HFCS 42 fructose
=> Equivalent to order of additionexperiment during heating !
284Fructose "lower Tg"
303 Kelvin
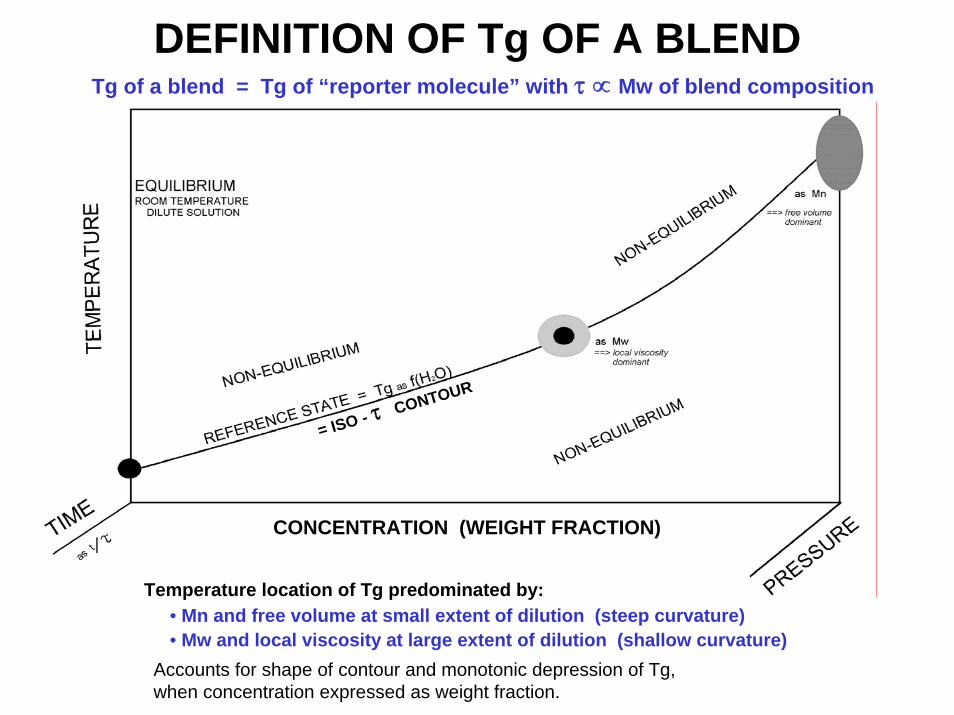
DEFINITION OF Tg OF A BLEND
CONCENTRATION (WEIGHT FRACTION)
= ISO - τ CONTOUR
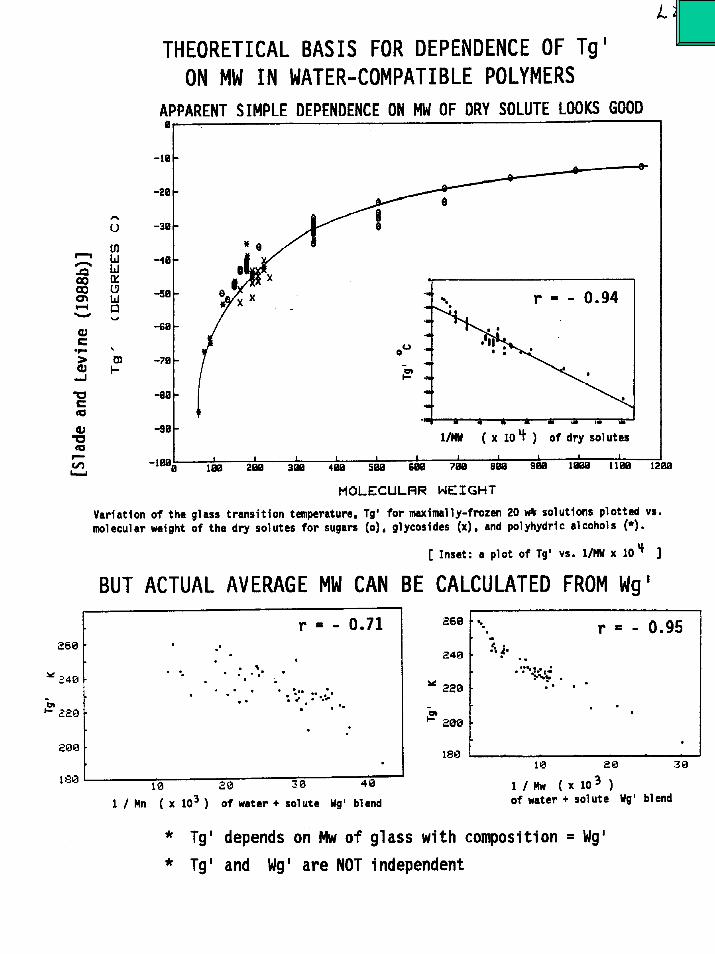
Tg of a blend = Tg of “reporter molecule” with τ ∝ Mw of blend composition
• Mn and free volume at small extent of dilution (steep curvature)• Mw and local viscosity at large extent of dilution (shallow curvature)
Temperature location of Tg predominated by:
Accounts for shape of contour and monotonic depression of Tg,when concentration expressed as weight fraction.
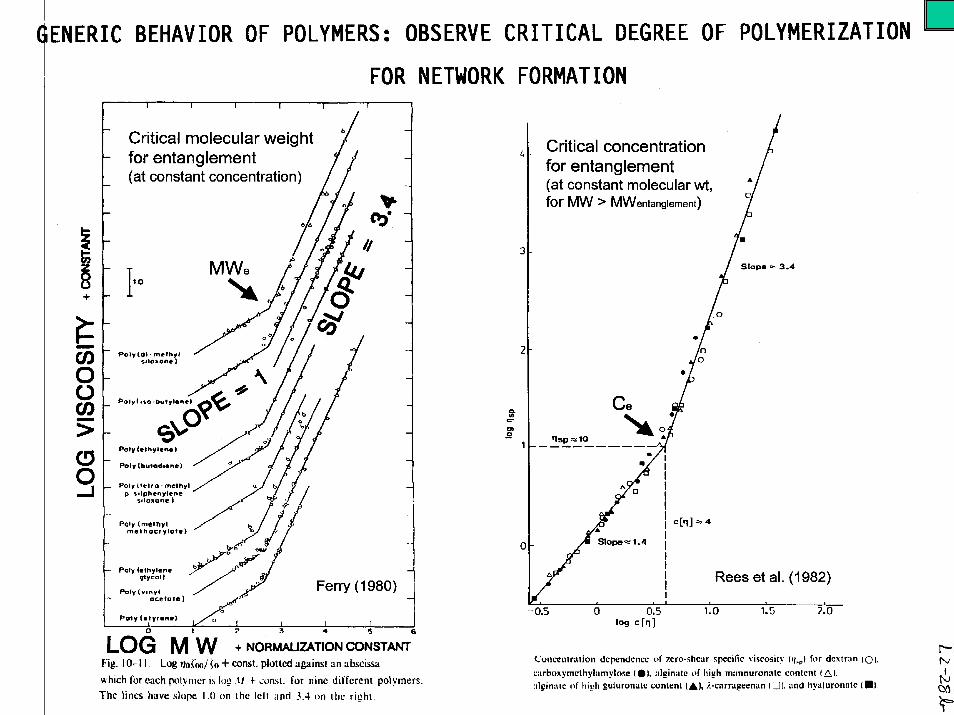
Bulk viscosity = microscopiclocal viscosity
Bulk viscosity =macroscopicnetworkviscosity High network modulus
but low local viscosity
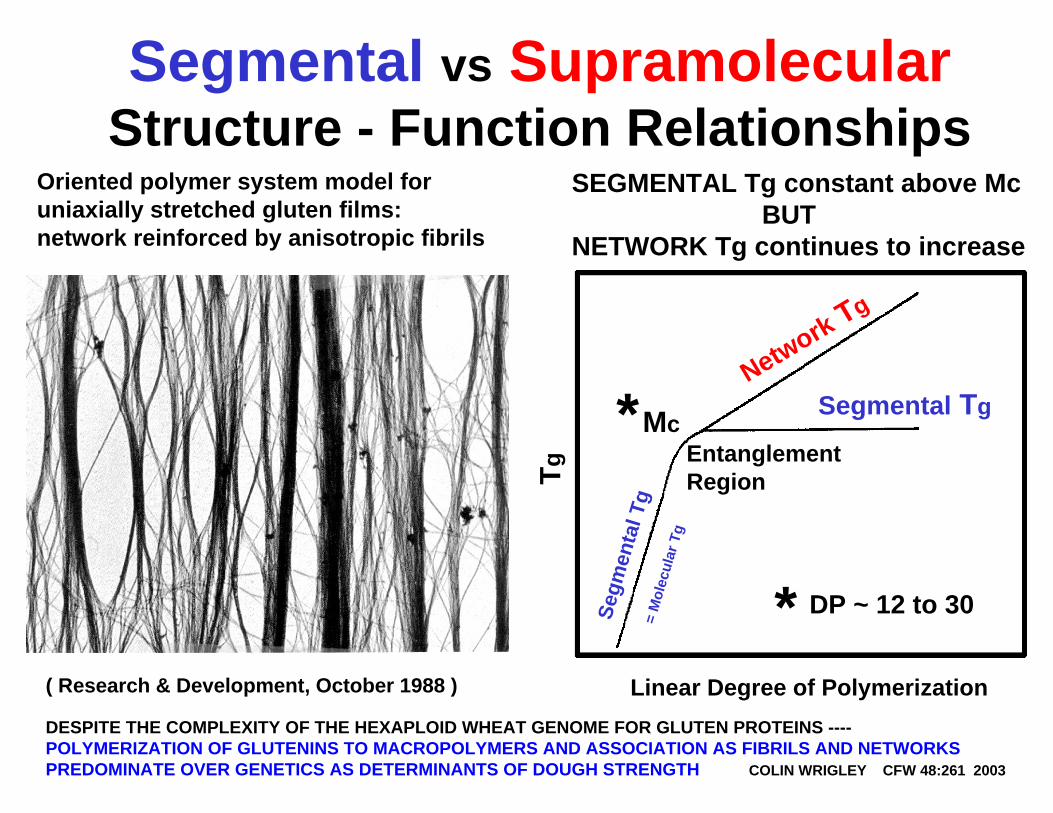
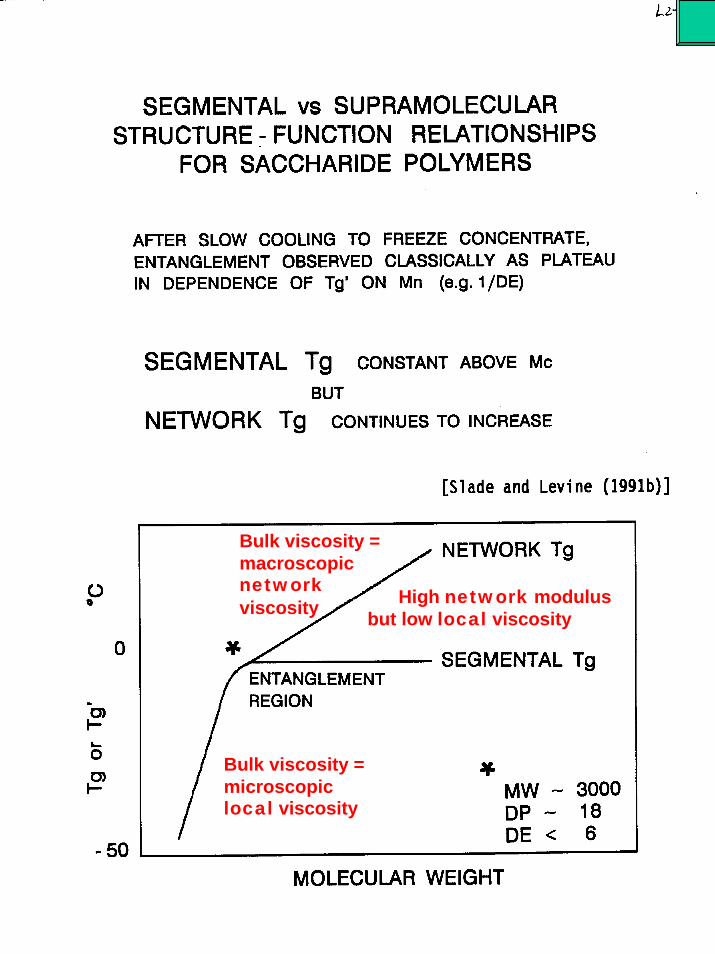
Segmental vs SupramolecularStructure - Function Relationships
SEGMENTAL Tg constant above McBUT
NETWORK Tg continues to increase
Tg
Linear Degree of Polymerization
Network Tg
Segmental Tg
EntanglementRegion
Mc*
* DP ~ 12 to 30Segm
enta
l Tg
Oriented polymer system model for uniaxially stretched gluten films: network reinforced by anisotropic fibrils
( Research & Development, October 1988 )
= M
olec
ular
Tg
DESPITE THE COMPLEXITY OF THE HEXAPLOID WHEAT GENOME FOR GLUTEN PROTEINS ----POLYMERIZATION OF GLUTENINS TO MACROPOLYMERS AND ASSOCIATION AS FIBRILS AND NETWORKS PREDOMINATE OVER GENETICS AS DETERMINANTS OF DOUGH STRENGTH COLIN WRIGLEY CFW 48:261 2003
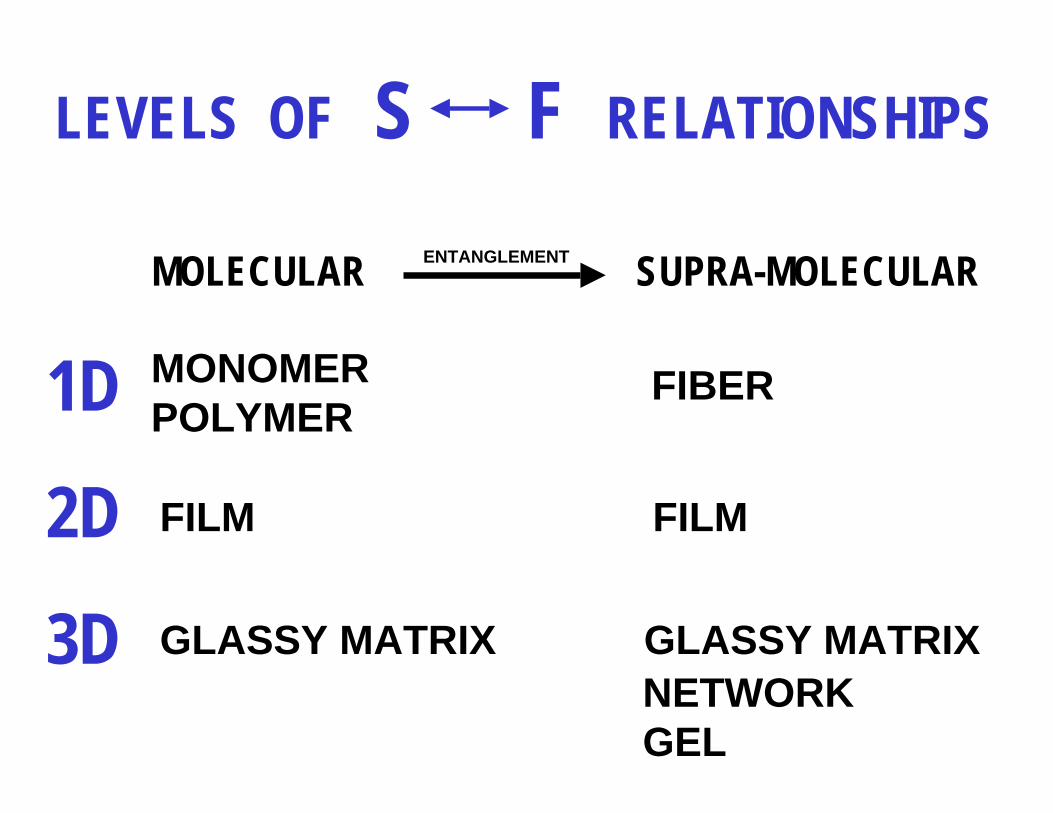
LEVELS OF S F RELATIONSHIPS
MOLECULAR SUPRA-MOLECULARENTANGLEMENT
1D
2D
3D
MONOMERPOLYMER
FIBER
FILM FILM
GLASSY MATRIX GLASSY MATRIXNETWORKGEL
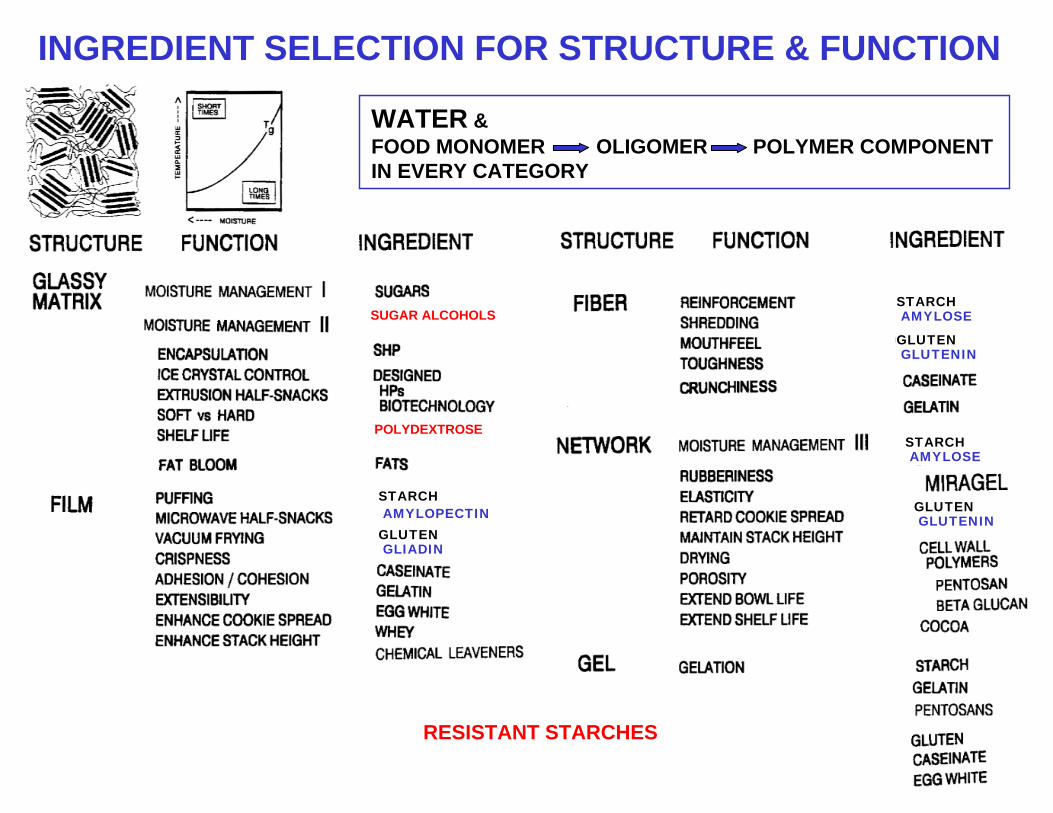
INGREDIENT SELECTION FOR STRUCTURE & FUNCTION
WATER & FOOD MONOMER OLIGOMER POLYMER COMPONENTIN EVERY CATEGORY
SUGAR ALCOHOLS
POLYDEXTROSE
RESISTANT STARCHES
GLUTENGLIADIN
GLUTENGLUTENIN
GLUTENGLUTENIN
STARCHAMYLOPECTIN
STARCHAMYLOSE
STARCHAMYLOSE
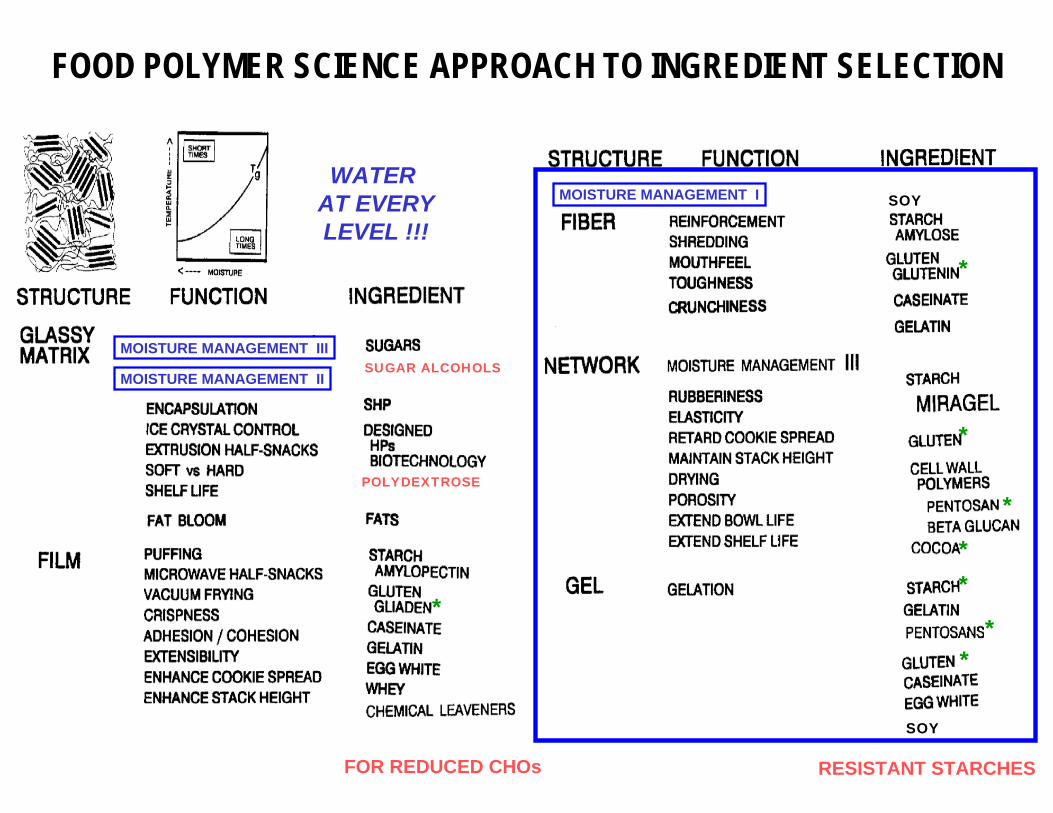
FOOD POLYMER SCIENCE APPROACH TO INGREDIENT SELECTION
WATER AT EVERYLEVEL !!!
SUGAR ALCOHOLS
POLYDEXTROSE
RESISTANT STARCHES
SOY
SOY
*
*
*
*
*
**
*
FOR REDUCED CHOs
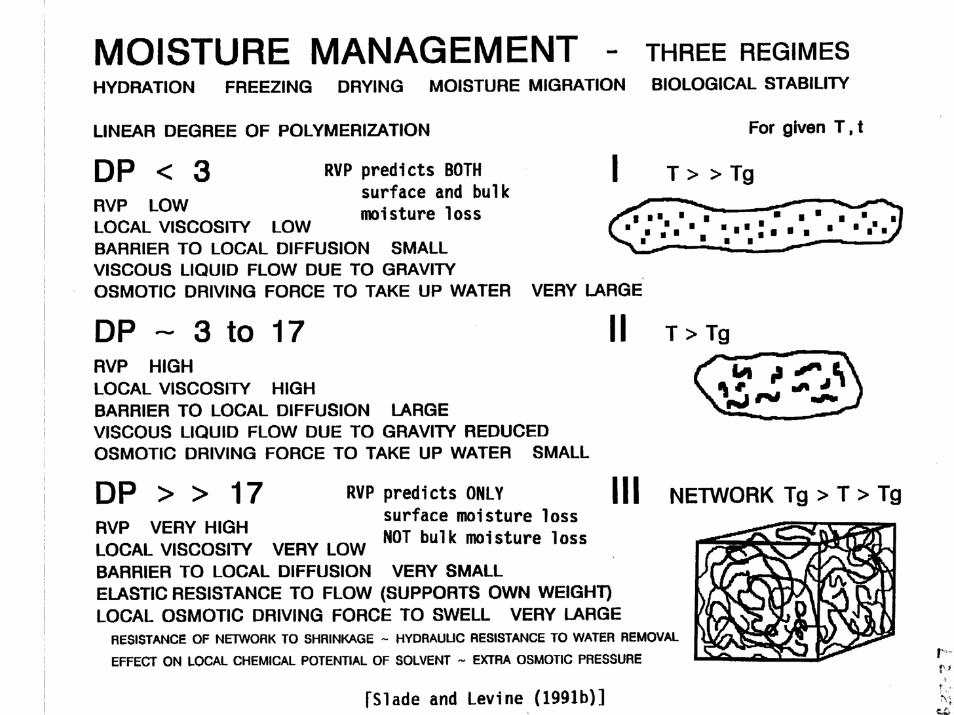
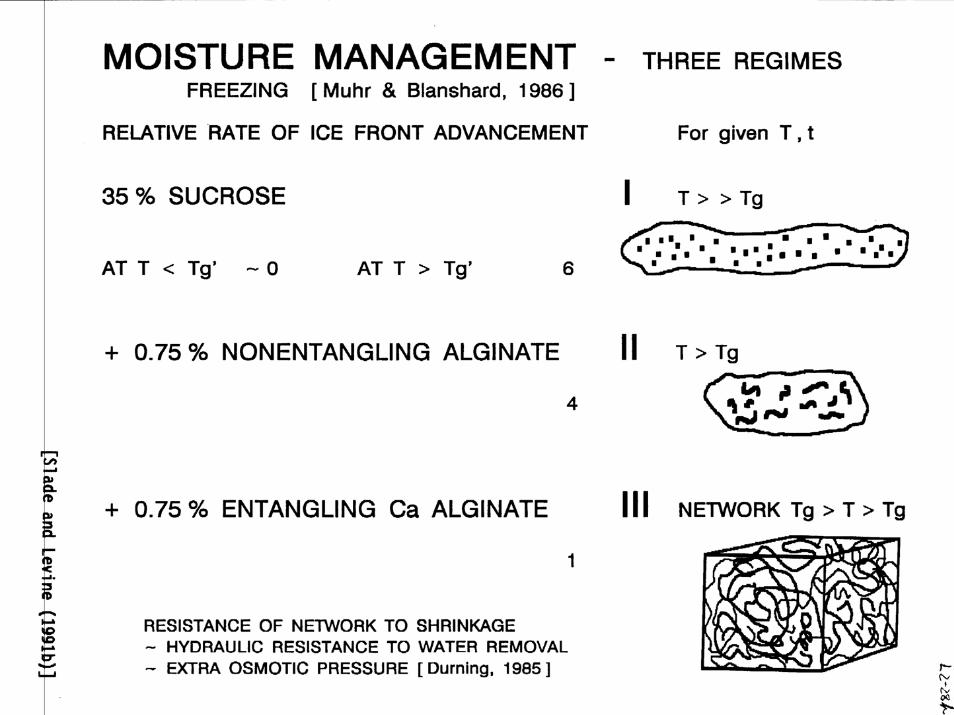
MOISTURE MANAGEMENT III
MOISTURE MANAGEMENT II
MOISTURE MANAGEMENT I
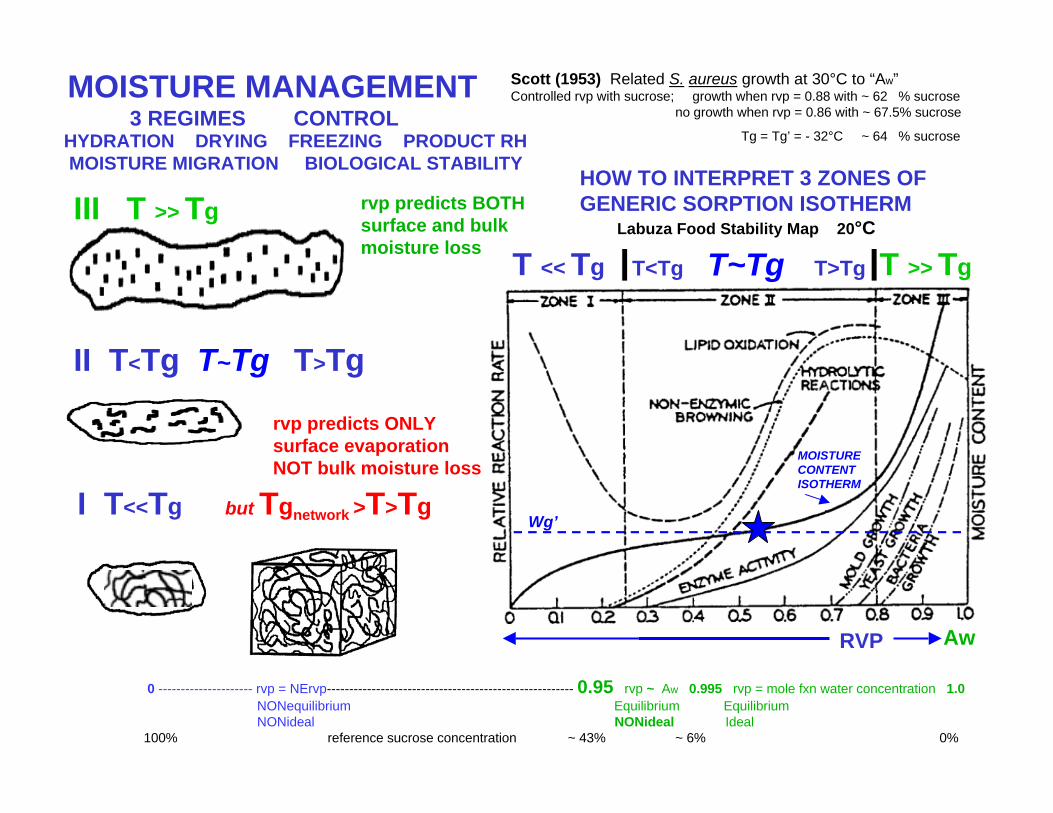
HOW TO INTERPRET 3 ZONES OF GENERIC SORPTION ISOTHERM
0 --------------------- rvp = NErvp------------------------------------------------------- 0.95 rvp ~ Aw 0.995 rvp = mole fxn water concentration 1.0NONequilibrium Equilibrium EquilibriumNONideal NONideal Ideal
100% reference sucrose concentration ~ 43% ~ 6% 0%
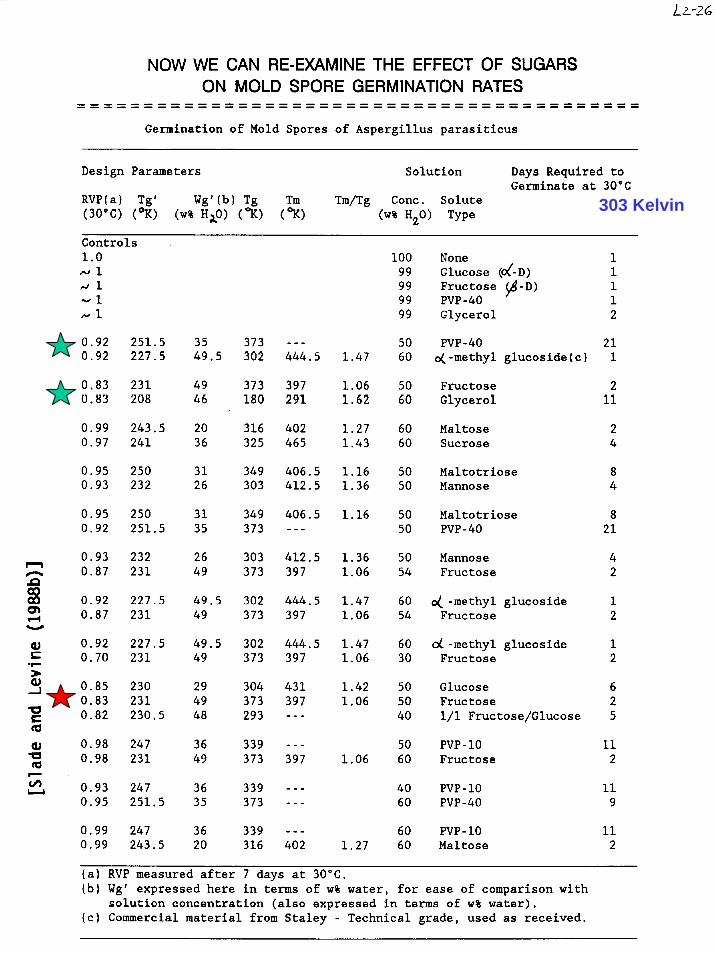
Scott (1953) Related S. aureus growth at 30°C to “Aw”Controlled rvp with sucrose; growth when rvp = 0.88 with ~ 62 % sucrose
no growth when rvp = 0.86 with ~ 67.5% sucrose
Tg = Tg’ = - 32°C ~ 64 % sucrose
Labuza Food Stability Map 20°C
MOISTURE MANAGEMENT3 REGIMES CONTROL
HYDRATION DRYING FREEZING PRODUCT RH MOISTURE MIGRATION BIOLOGICAL STABILITY
III T >> Tg
I T<<Tg
II T<Tg T~Tg T>Tg
MOISTURECONTENTISOTHERM
Wg’
T >> TgT<Tg T~Tg T>TgT << Tg
but Tgnetwork >T>Tg
rvp predicts BOTH surface and bulkmoisture loss
rvp predicts ONLY surface evaporation NOT bulk moisture loss
RVP Aw
% T
otal
Moi
stur
e
100
80
60
40
20
0
% RH
Temperature C
0 20 40 60 80 100
- 100 0 100 200
Tg biopolymerT
g sorbitol
milk
freshmeat
breaddough
sausage
jamcondensedsweet milk
breadflour
pastacookie candypotatochip
NFDM
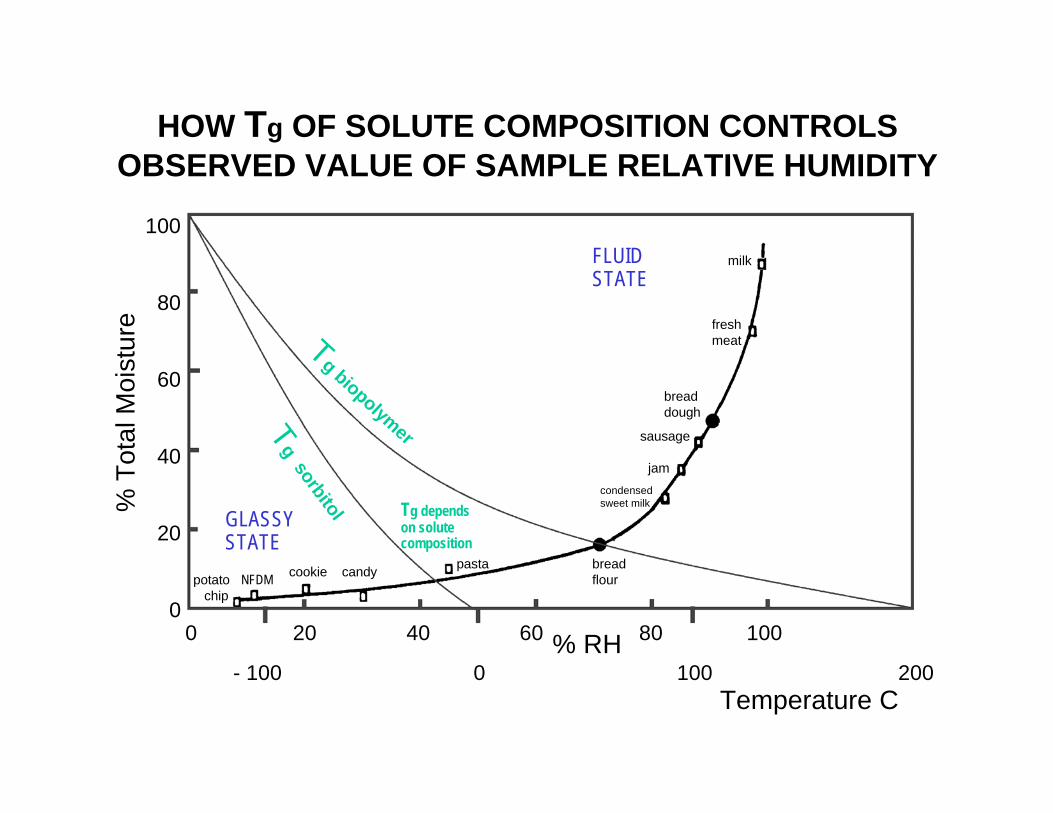
HOW Tg OF SOLUTE COMPOSITION CONTROLS OBSERVED VALUE OF SAMPLE RELATIVE HUMIDITY
GLASSY STATE
FLUID STATE
Tg depends on solute composition
% T
otal
Moi
stur
e
100
80
60
40
20
0
% RH
Temperature C
0 20 40 60 80 100
- 100 0 100 200
Tg biopolymerT
g sorbitol
milk
freshmeat
breaddough
sausage
jamcondensedsweet milk
breadflour
raisin
pastacookie candypotato
chipNFDM
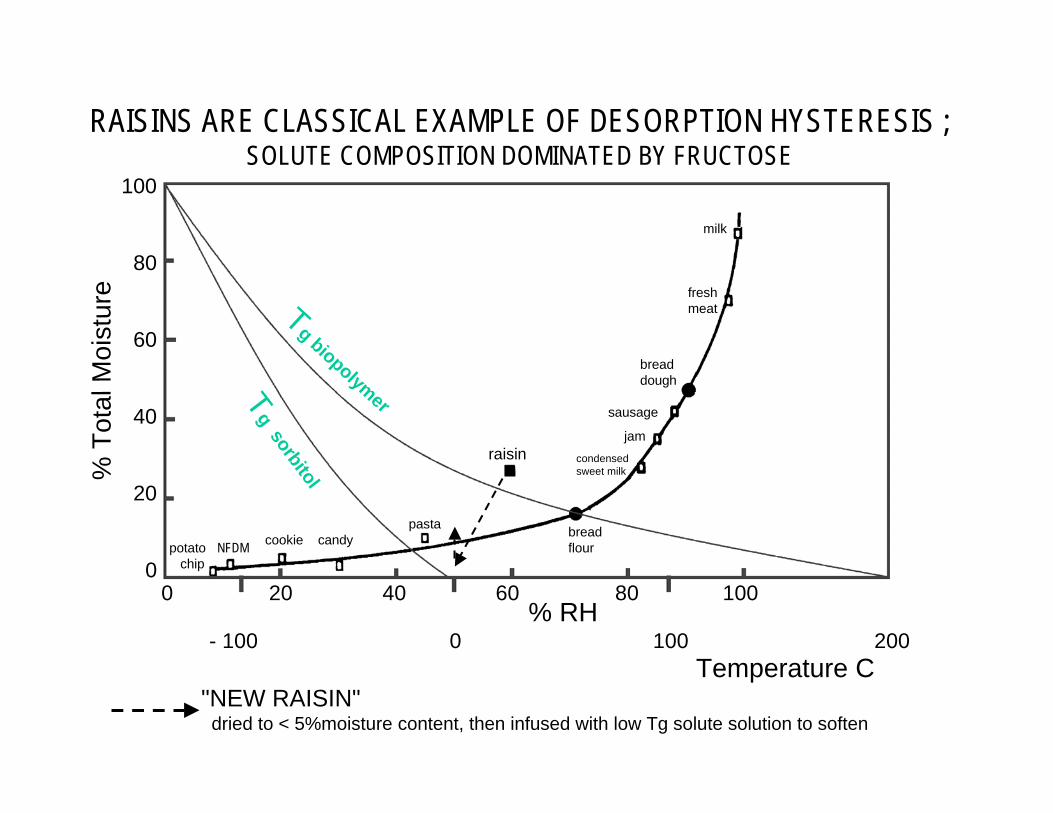
RAISINS ARE CLASSICAL EXAMPLE OF DESORPTION HYSTERESIS ;SOLUTE COMPOSITION DOMINATED BY FRUCTOSE
"NEW RAISIN"dried to < 5%moisture content, then infused with low Tg solute solution to soften
% T
otal
Moi
stur
e
100
80
60
40
20
0
% RH
Temperature C
0 20 40 60 80 100
- 100 0 100 200
Tg biopolymerT
g sorbitol
Tg permanentnetwork
milk
freshmeat
breaddough
sausage
jamcondensedsweet milk
breadflour
baked bread
cheese
pastacookie candypotato
chipNFDM
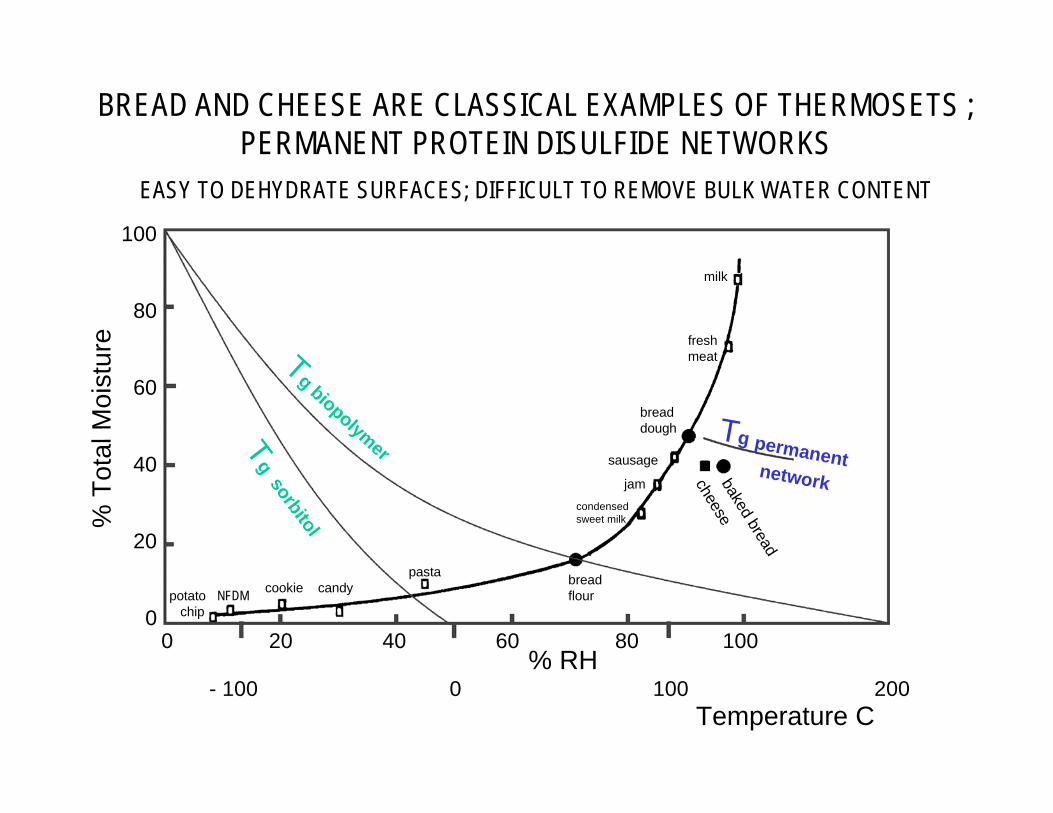
BREAD AND CHEESE ARE CLASSICAL EXAMPLES OF THERMOSETS ;PERMANENT PROTEIN DISULFIDE NETWORKS
EASY TO DEHYDRATE SURFACES; DIFFICULT TO REMOVE BULK WATER CONTENT
% T
otal
Moi
stur
e
100
80
60
40
20
0
% RHTemperature C
0 20 40 60 80 100 - 100 0 100 200
Tg biopolymerT
g sorbitol
Tg permanent
milk
freshmeat
breaddough
sausage
jamcondensedsweet milk
breadflour
baked bread
cheese
pastacookie candypotato
chipNFDM
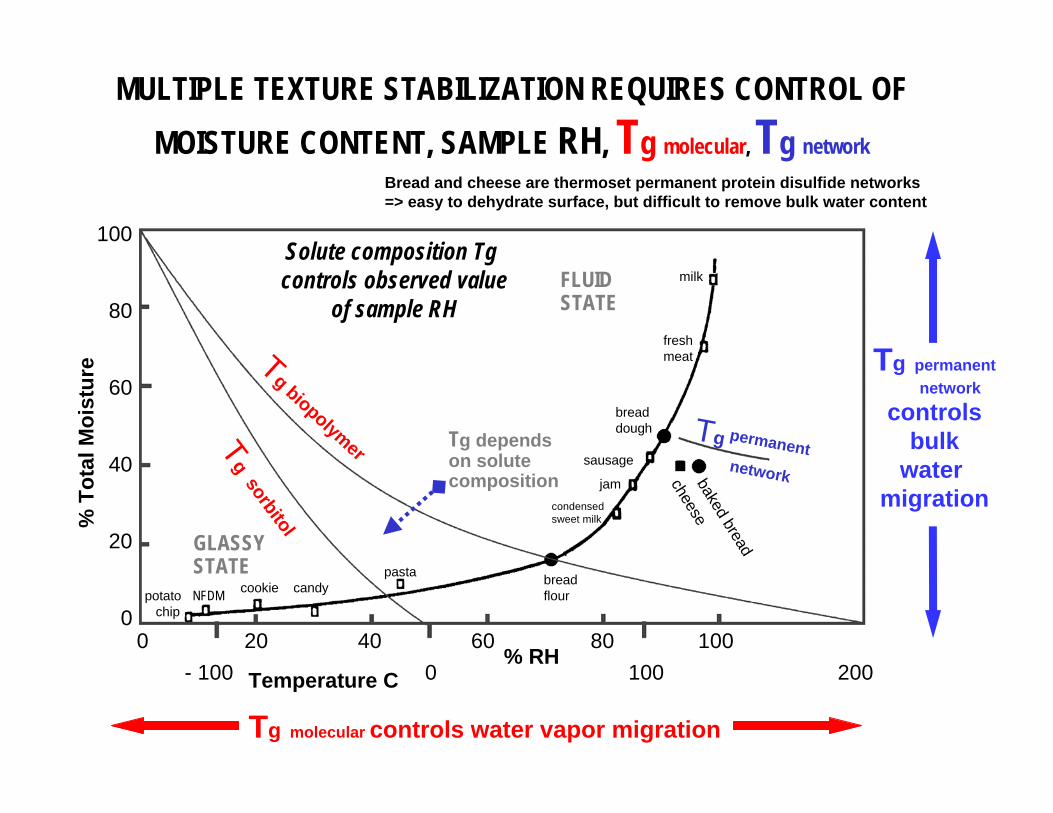
Bread and cheese are thermoset permanent protein disulfide networks => easy to dehydrate surface, but difficult to remove bulk water content
network
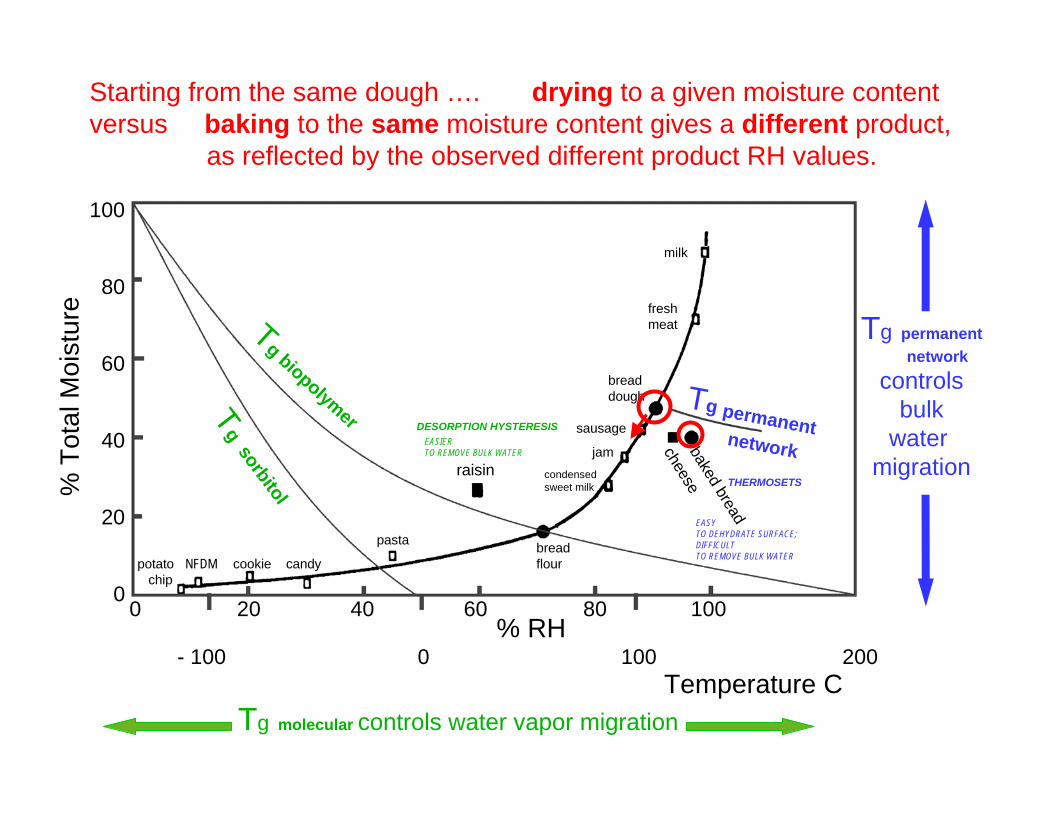
Tg molecular controls water vapor migration
Tg permanentnetwork
controlsbulk
water migration
MULTIPLE TEXTURE STABILIZATION REQUIRES CONTROL OF MOISTURE CONTENT, SAMPLE RH, Tg molecular, Tg network
GLASSY STATE
FLUID STATE
Tg depends on solute composition
Solute composition Tg controls observed value
of sample RH
% T
otal
Moi
stur
e
100
80
60
40
20
0
% RH
Temperature C
0 20 40 60 80 100
- 100 0 100 200
Tg biopolymerT
g sorbitol
Tg permanentnetwork
Tg permanentnetwork
controlsbulk
water migration
Tg molecular controls water vapor migration
Starting from the same dough …. drying to a given moisture contentversus baking to the same moisture content gives a different product,
as reflected by the observed different product RH values.
milk
freshmeat
breaddough
sausage
jamcondensedsweet milk
breadflour
raisin
baked bread
cheese
pasta
cookie candypotatochip
NFDM
EASY TO DEHYDRATE SURFACE; DIFFICULT TO REMOVE BULK WATER
EASIER TO REMOVE BULK WATER
DESORPTION HYSTERESIS
THERMOSETS
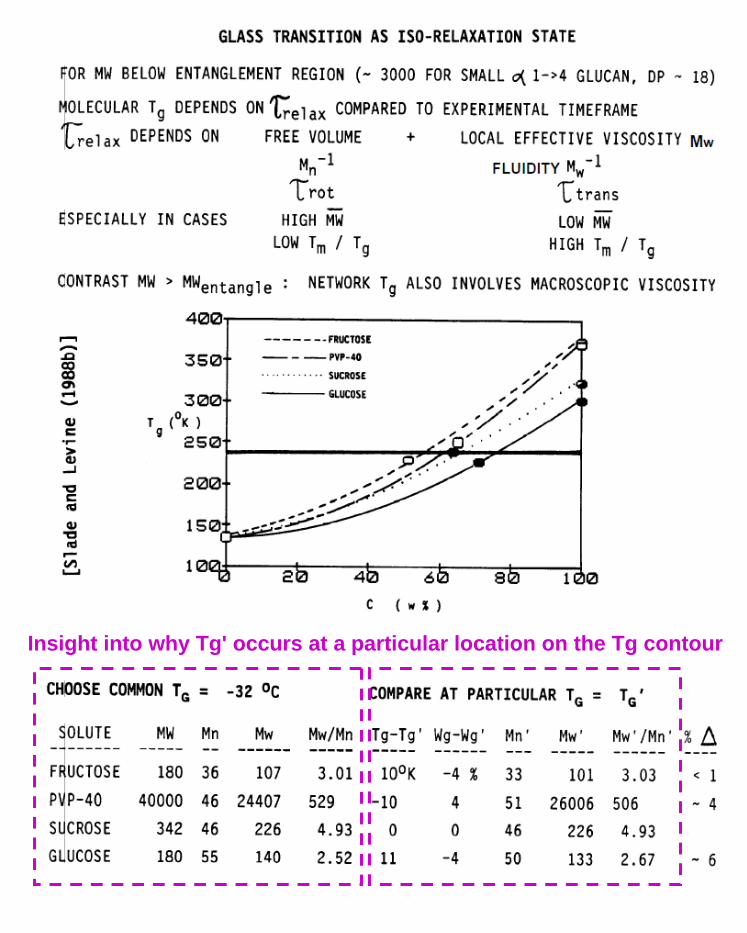
Insight into why Tg' occurs at a particular location on the Tg contour
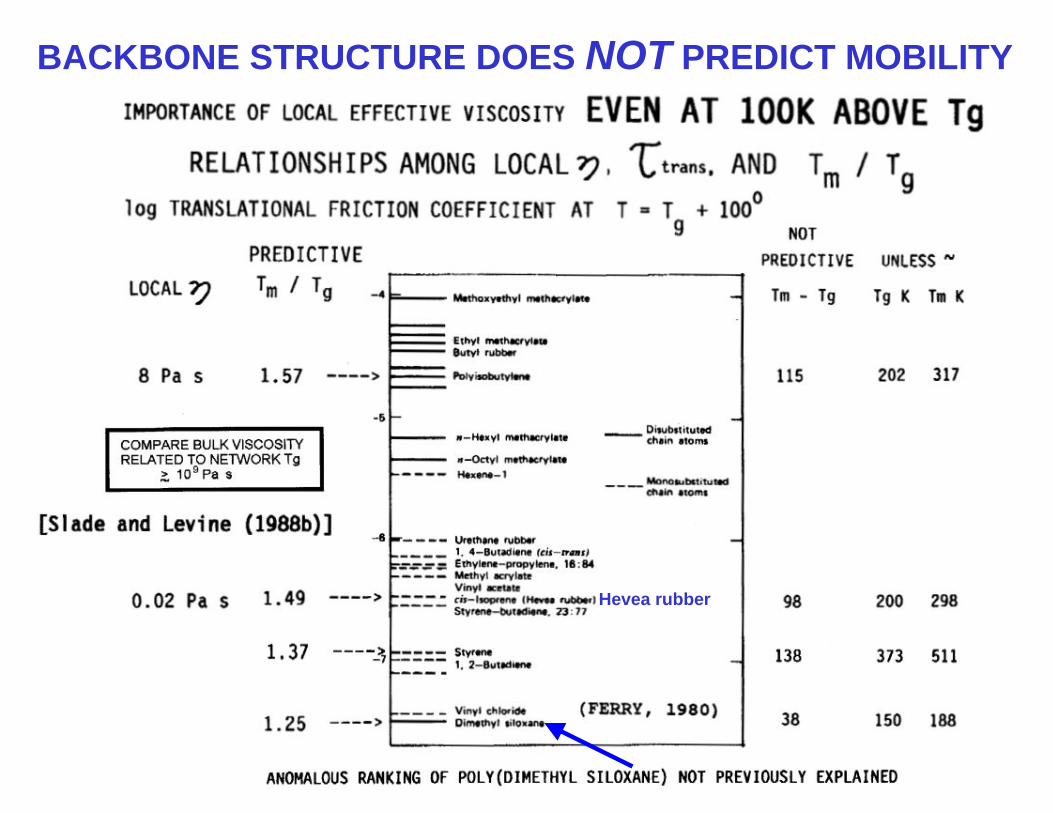
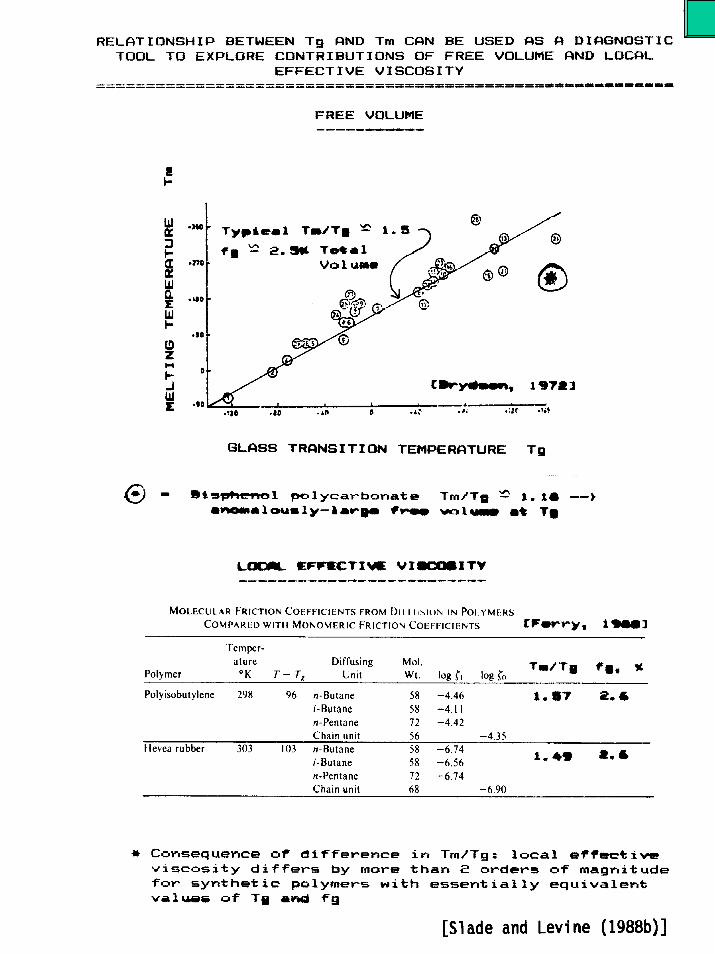
BACKBONE STRUCTURE DOES NOT PREDICT MOBILITY
Hevea rubber
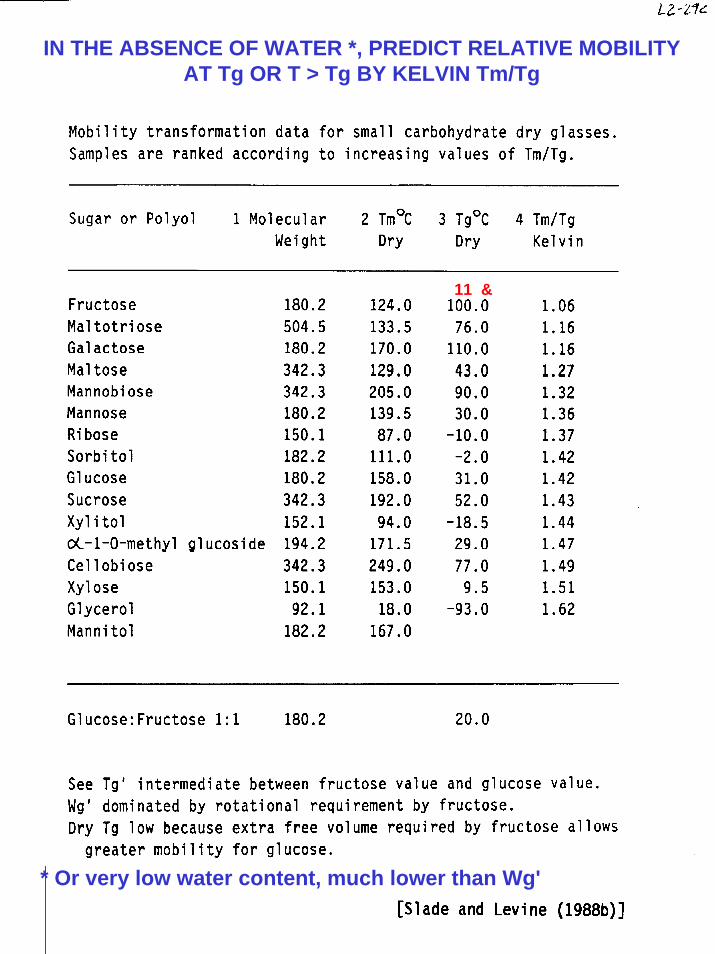
11 &
IN THE ABSENCE OF WATER *, PREDICT RELATIVE MOBILITY AT Tg OR T > Tg BY KELVIN Tm/Tg
* Or very low water content, much lower than Wg'
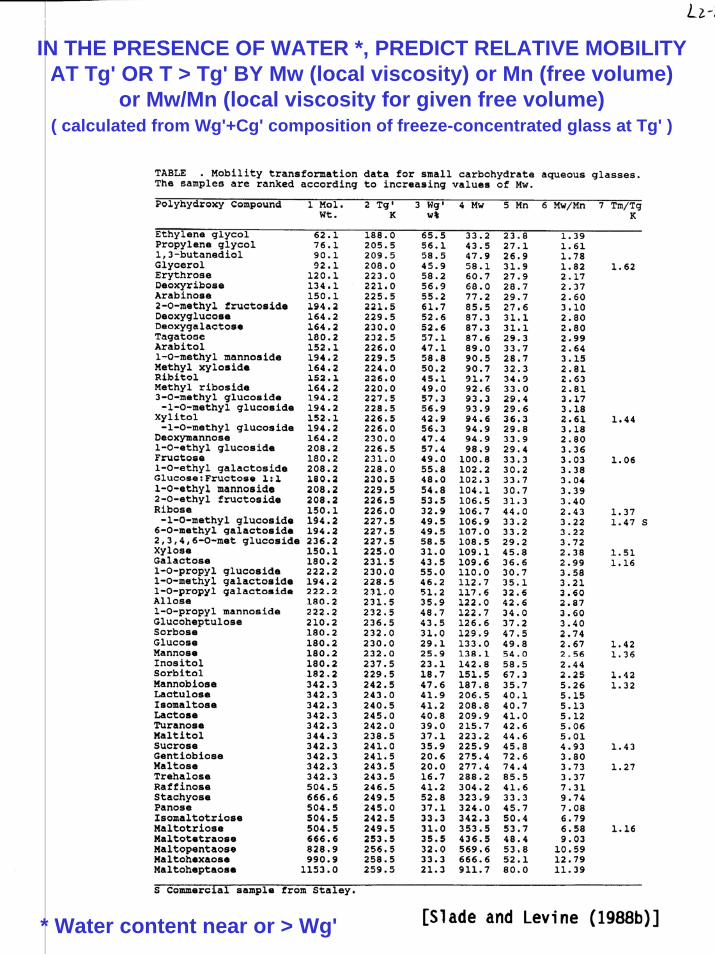
IN THE PRESENCE OF WATER *, PREDICT RELATIVE MOBILITY AT Tg' OR T > Tg' BY Mw (local viscosity) or Mn (free volume)
or Mw/Mn (local viscosity for given free volume)( calculated from Wg'+Cg' composition of freeze-concentrated glass at Tg' )
* Water content near or > Wg'
+
o
x
x
Moisture Content %
Relative Humidity % at 25C
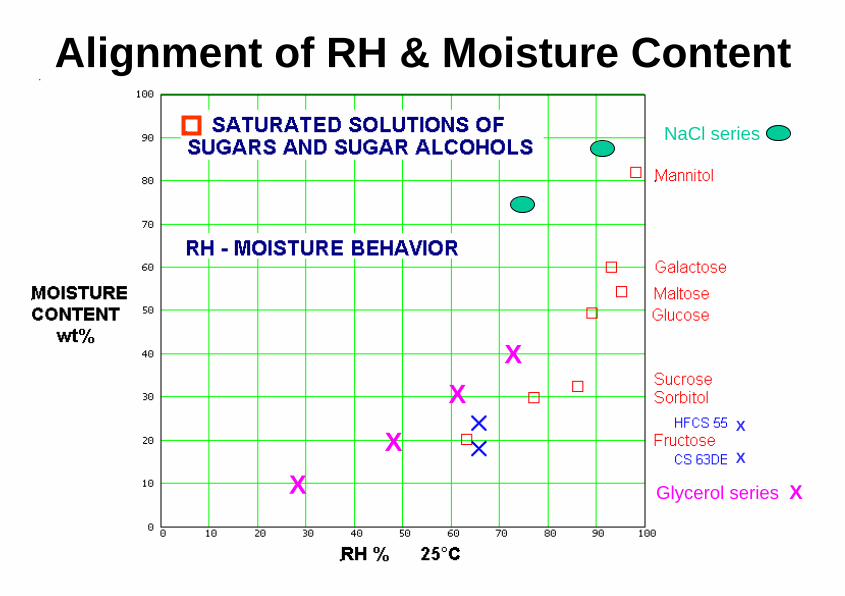
Alignment of RH & Moisture Content
XX
XX
Glycerol series X
NaCl series
X
X
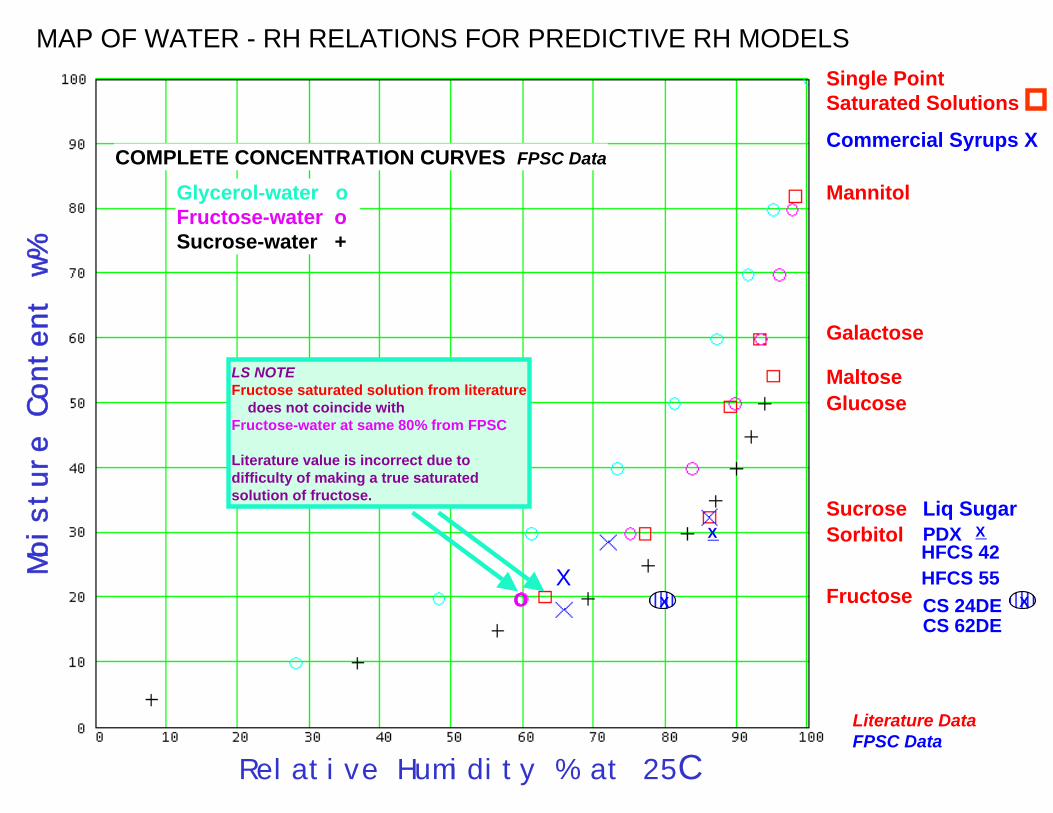
MAP OF WATER - RH RELATIONS FOR PREDICTIVE RH MODELS
COMPLETE CONCENTRATION CURVES FPSC Data
Single PointSaturated Solutions
Mannitol
Galactose
GlucoseMaltose
Sucrose
Fructose
Sorbitol
Commercial Syrups X
Liq Sugar
HFCS 42
Glycerol-water o Fructose-water o Sucrose-water +
Literature DataFPSC Data
Relative Humidity % at 25C
Moisture Content w%
X
CS 62DE
HFCS 55CS 24DEX X
XX PDX
LS NOTEFructose saturated solution from literature
does not coincide withFructose-water at same 80% from FPSC
Literature value is incorrect due to difficulty of making a true saturated solution of fructose.
o
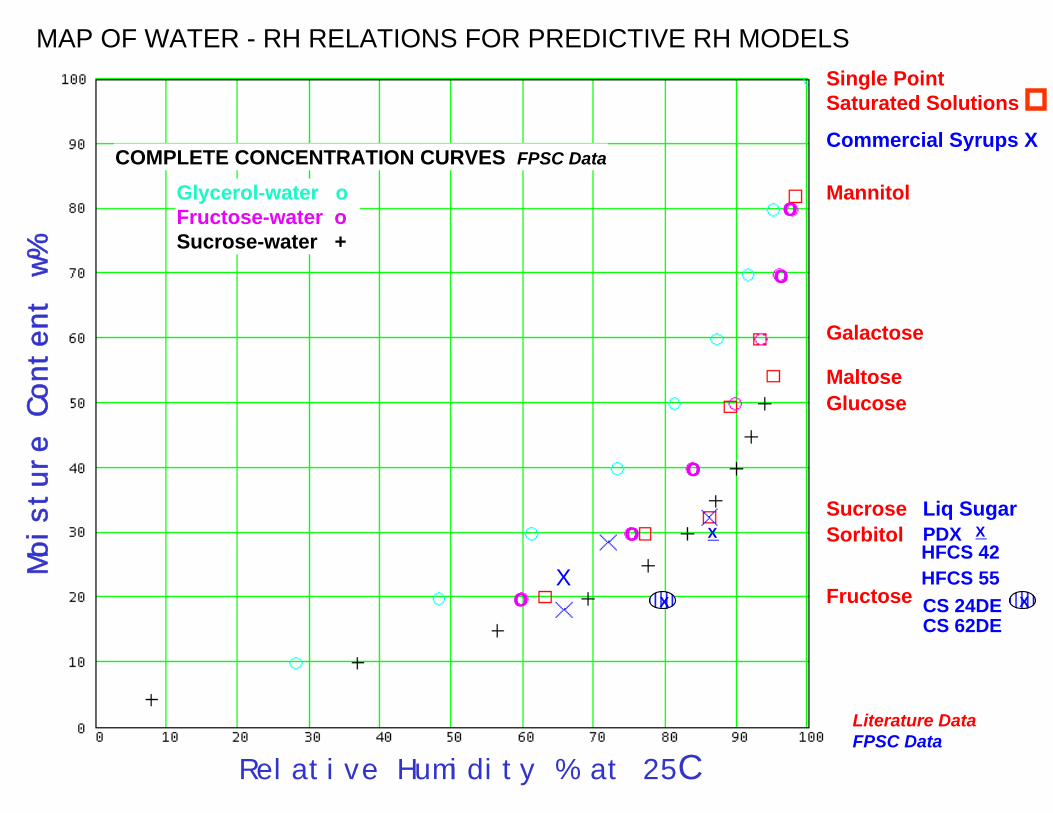
MAP OF WATER - RH RELATIONS FOR PREDICTIVE RH MODELS
COMPLETE CONCENTRATION CURVES FPSC Data
Single PointSaturated Solutions
Mannitol
Galactose
GlucoseMaltose
Sucrose
Fructose
Sorbitol
Commercial Syrups X
Liq Sugar
HFCS 42
Glycerol-water o Fructose-water o Sucrose-water +
Literature DataFPSC Data
Relative Humidity % at 25C
Moisture Content w%
X
CS 62DE
HFCS 55CS 24DEX X
XX PDX
o
o
o
o
o
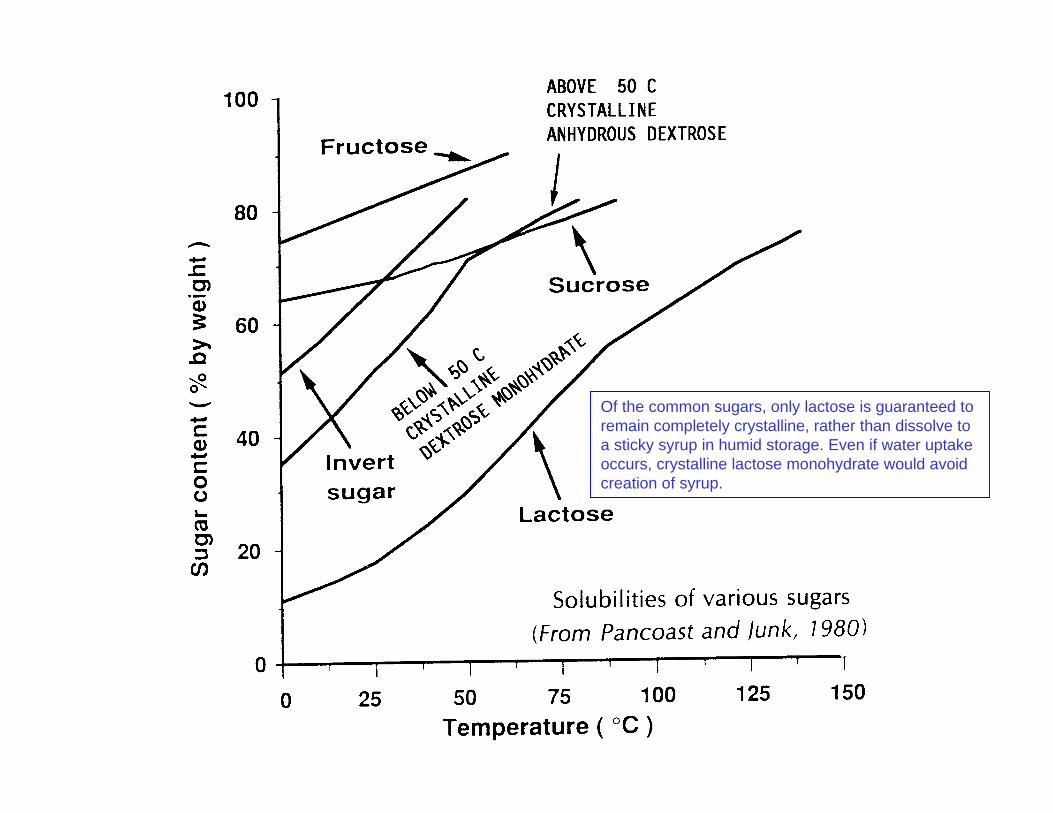
Of the common sugars, only lactose is guaranteed to remain completely crystalline, rather than dissolve to a sticky syrup in humid storage. Even if water uptake occurs, crystalline lactose monohydrate would avoid creation of syrup.
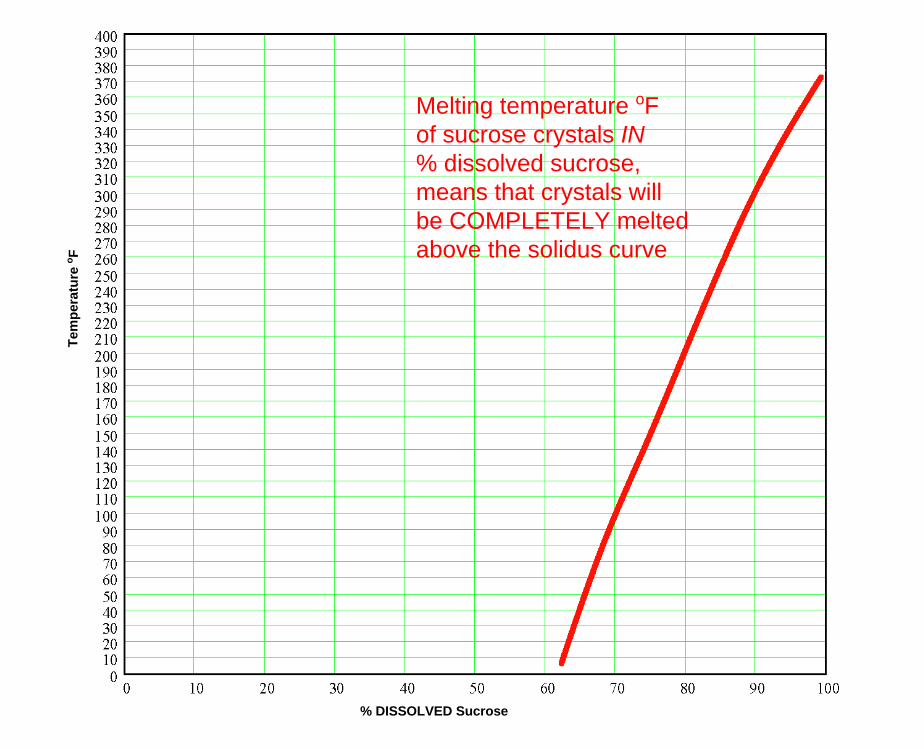
% DISSOLVED Sucrose
Tem
pera
ture
o F
Melting temperature oF of sucrose crystals IN% dissolved sucrose, means that crystals will be COMPLETELY meltedabove the solidus curve
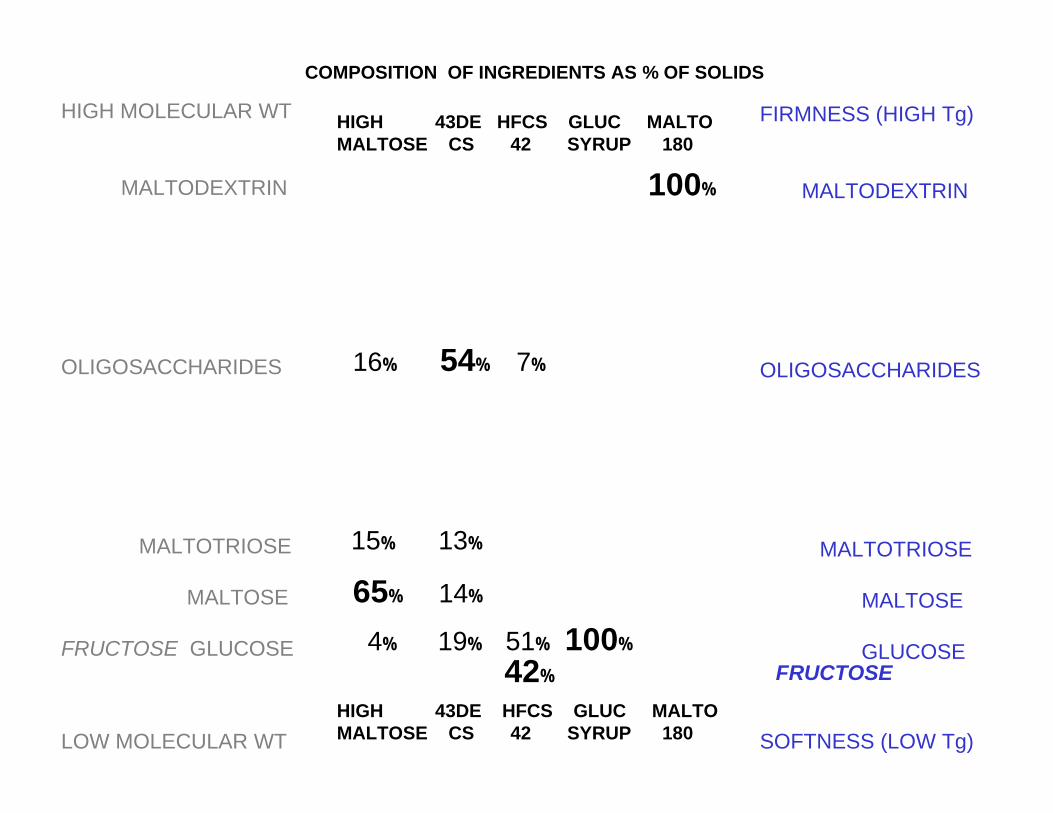
FIRMNESS (HIGH Tg)
MALTODEXTRIN
OLIGOSACCHARIDES
MALTOTRIOSE
MALTOSE
GLUCOSE
SOFTNESS (LOW Tg)
HIGH MOLECULAR WT
MALTODEXTRIN
OLIGOSACCHARIDES
MALTOTRIOSE
MALTOSE
FRUCTOSE GLUCOSE
LOW MOLECULAR WT
HIGH 43DE HFCS GLUC MALTOMALTOSE CS 42 SYRUP 180
100%
4% 19% 51% 100%
HIGH 43DE HFCS GLUC MALTOMALTOSE CS 42 SYRUP 180
65% 14%
FRUCTOSE42%
15% 13%
16% 54% 7%
COMPOSITION OF INGREDIENTS AS % OF SOLIDS
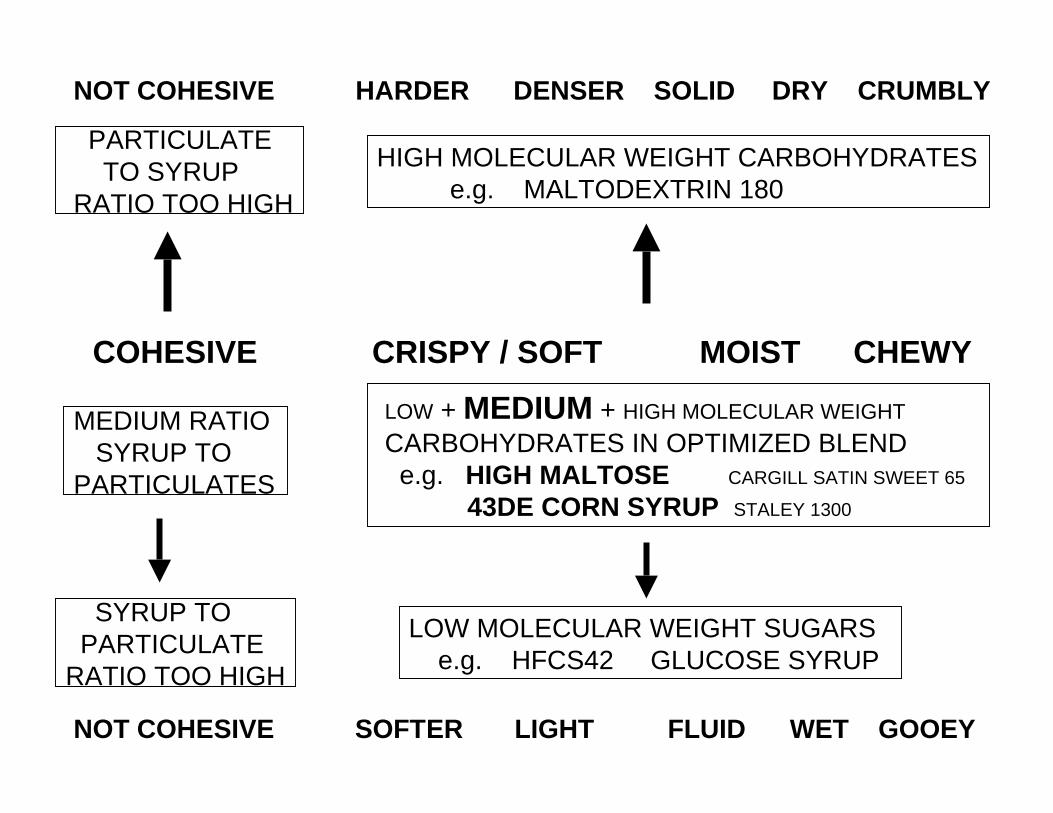
NOT COHESIVE SOFTER LIGHT FLUID WET GOOEY
NOT COHESIVE HARDER DENSER SOLID DRY CRUMBLY
COHESIVE CRISPY / SOFT MOIST CHEWY
SYRUP TOPARTICULATE
RATIO TOO HIGH
PARTICULATETO SYRUP
RATIO TOO HIGH
MEDIUM RATIOSYRUP TO
PARTICULATES
LOW MOLECULAR WEIGHT SUGARSe.g. HFCS42 GLUCOSE SYRUP
HIGH MOLECULAR WEIGHT CARBOHYDRATESe.g. MALTODEXTRIN 180
LOW + MEDIUM + HIGH MOLECULAR WEIGHTCARBOHYDRATES IN OPTIMIZED BLENDe.g. HIGH MALTOSE CARGILL SATIN SWEET 65
43DE CORN SYRUP STALEY 1300
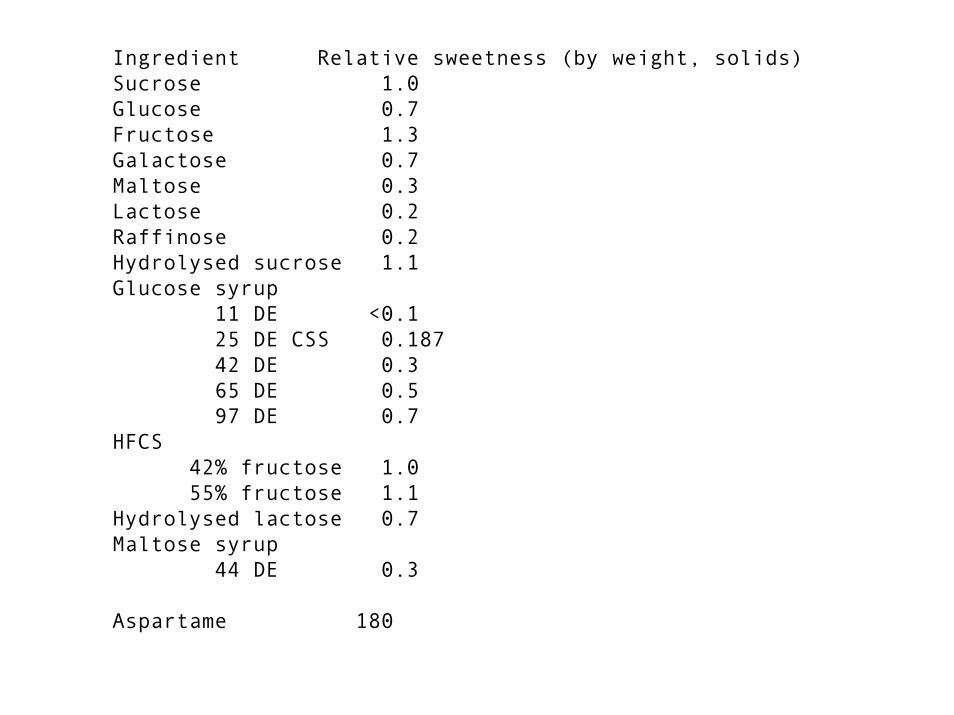
Ingredient Relative sweetness (by weight, solids)Sucrose 1.0Glucose 0.7Fructose 1.3Galactose 0.7Maltose 0.3Lactose 0.2Raffinose 0.2Hydrolysed sucrose 1.1Glucose syrup
11 DE <0.125 DE CSS 0.18742 DE 0.365 DE 0.597 DE 0.7
HFCS42% fructose 1.055% fructose 1.1
Hydrolysed lactose 0.7Maltose syrup
44 DE 0.3
Aspartame 180
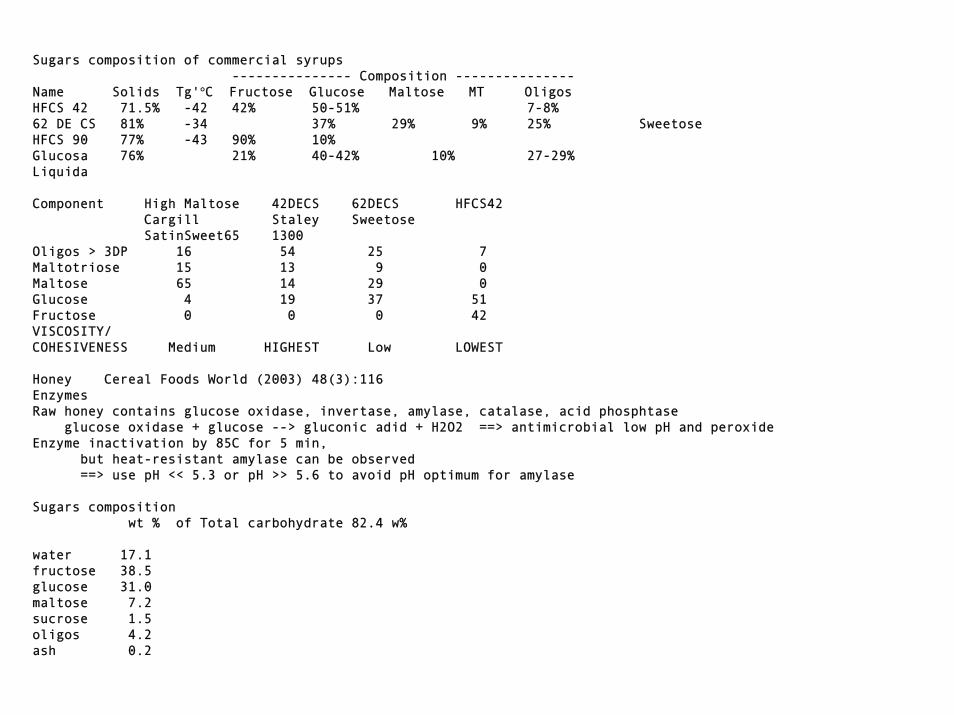
Sugars composition of commercial syrups--------------- Composition ---------------
Name Solids Tg'°C Fructose Glucose Maltose MT OligosHFCS 42 71.5% -42 42% 50-51% 7-8%62 DE CS 81% -34 37% 29% 9% 25% SweetoseHFCS 90 77% -43 90% 10%Glucosa 76% 21% 40-42% 10% 27-29%Liquida
Component High Maltose 42DECS 62DECS HFCS42Cargill Staley SweetoseSatinSweet65 1300
Oligos > 3DP 16 54 25 7Maltotriose 15 13 9 0Maltose 65 14 29 0Glucose 4 19 37 51Fructose 0 0 0 42VISCOSITY/COHESIVENESS Medium HIGHEST Low LOWEST
Honey Cereal Foods World (2003) 48(3):116EnzymesRaw honey contains glucose oxidase, invertase, amylase, catalase, acid phosphtase
glucose oxidase + glucose --> gluconic adid + H2O2 ==> antimicrobial low pH and peroxideEnzyme inactivation by 85C for 5 min,
but heat-resistant amylase can be observed==> use pH << 5.3 or pH >> 5.6 to avoid pH optimum for amylase
Sugars composition wt % of Total carbohydrate 82.4 w%
water 17.1fructose 38.5 glucose 31.0maltose 7.2sucrose 1.5oligos 4.2ash 0.2
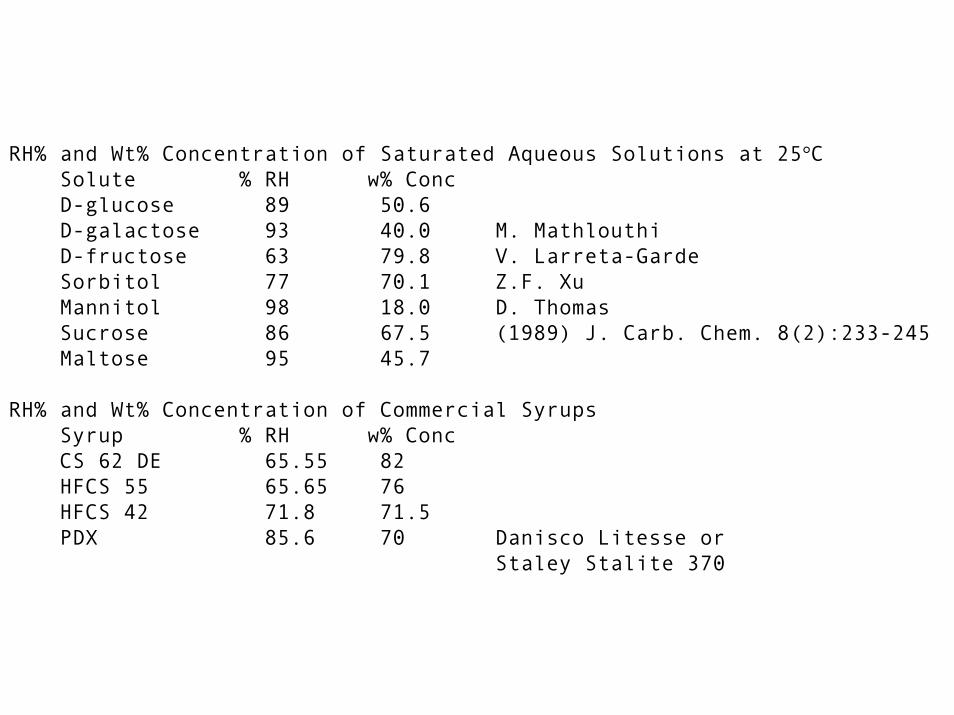
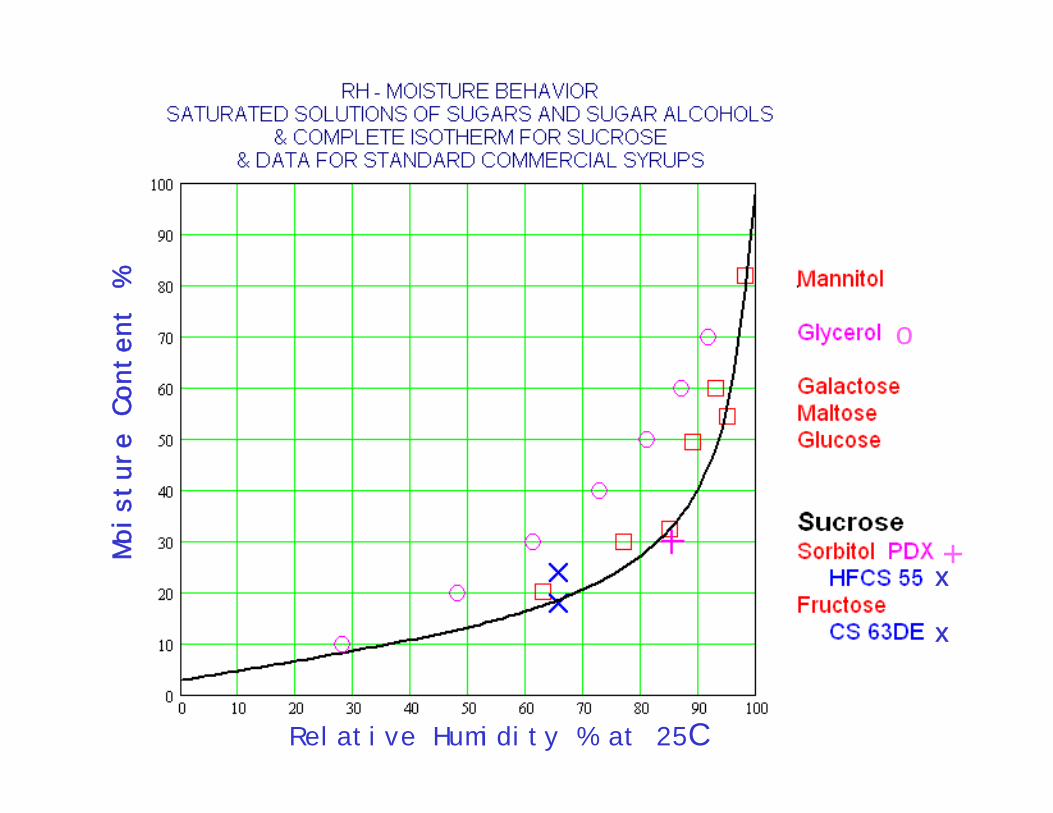
RH% and Wt% Concentration of Saturated Aqueous Solutions at 25°CSolute % RH w% ConcD-glucose 89 50.6D-galactose 93 40.0 M. MathlouthiD-fructose 63 79.8 V. Larreta-GardeSorbitol 77 70.1 Z.F. XuMannitol 98 18.0 D. ThomasSucrose 86 67.5 (1989) J. Carb. Chem. 8(2):233-245Maltose 95 45.7
RH% and Wt% Concentration of Commercial SyrupsSyrup % RH w% ConcCS 62 DE 65.55 82HFCS 55 65.65 76HFCS 42 71.8 71.5PDX 85.6 70 Danisco Litesse or
Staley Stalite 370