Embed Size (px)
Citation preview
HAL Id: tel-00786974https://tel.archives-ouvertes.fr/tel-00786974
Submitted on 11 Feb 2013
HAL is a multi-disciplinary open accessarchive for the deposit and dissemination of sci-entific research documents, whether they are pub-lished or not. The documents may come fromteaching and research institutions in France orabroad, or from public or private research centers.
L’archive ouverte pluridisciplinaire HAL, estdestinée au dépôt et à la diffusion de documentsscientifiques de niveau recherche, publiés ou non,émanant des établissements d’enseignement et derecherche français ou étrangers, des laboratoirespublics ou privés.
Développement des méthodes analytiques pour ladétection et la quantification de traces des HAP et depesticides dans l’eau. Application à l’évaluation de la
qualité des eaux libanaises.Abir Kouzayha
To cite this version:Abir Kouzayha. Développement des méthodes analytiques pour la détection et la quantification detraces des HAP et de pesticides dans l’eau. Application à l’évaluation de la qualité des eaux libanaises..Chimie analytique. Université Sciences et Technologies - Bordeaux I, 2011. Français. �tel-00786974�
Université Bordeaux 1Les Sciences et les Technologies au service de l’Homme et de l’environnement
N° d’ordre : 4414
THÈSE
PRÉSENTÉE A
L’UNIVERSITÉ BORDEAUX 1
ÉCOLE DOCTORALE DES SCIENCES CHIMIQUES
Par Abir KOUZAYHA
POUR OBTENIR LE GRADE DE
DOCTEUR
SPÉCIALITÉ : Chimie Analytique et Environnement
DÉVELOPPEMENT DES MÉTHODES ANALYTIQUES POUR LA DÉTECTION ET LA QUANTIFICATION
DE TRACES DES HAP ET DE PESTICIDES DANS L’EAU. APPLICATION À L’ÉVALUATION
DE LA QUALITÉ DES EAUX LIBANAISES
Directeur de recherche : Hélène BUDZINSKI, EPOC-LPTC, Bordeaux 1Farouk JABER, CLEA-LAPPO, Beyrouth
Soutenue le : 08 décembre 2011
Devant la Commission d’Examen formée de :
Mme CAMEL, ValérieMr LE BIZEC, BrunoMr SERVANT, LaurentMme BUDZINSKI, HélèneMr JABER, Farouk
Professeur, AgroParisTech, Paris Professeur, Laberca, Nantes Professeur, Université de Bordeaux 1 Directeur de recherche, Bordeaux 1Professeur, CLEA, Beyrouth
RapporteurRapporteurExaminateurDirecteur de thèseDirecteur de thèse

REMERCIEMENTS
Ces trois années de thèse ont été l’occasion de rencontres enrichissantes, tant sur le plan personnel que professionnel. Merci à toutes les personnes qui ont croisé mon chemin, et qui ont contribué à faire de moi ce que je suis aujourd’hui.
Je tiens tout d’abord à exprimer ma très grande reconnaissance à tous les membres de mon jury : madame Valérie CAMEL et monsieur Bruno LE BIZEC qui ont accepté de juger ce travail et d’en être les rapporteurs ainsi que monsieur Laurent SERVANT qui m’a fait l’honneur de participer au jury.
Ce travail de thèse a été réalisé principalement à la Commission Libanaise de l’Energie Atomique (CLEA) à Beyrouth, au sein du Laboratoire d’Analyse de Pesticides et de Polluants Organiques (LAPPO). Une partie des travaux a été menée à l’UniversitéBordeaux 1, au sein du Laboratoire de physico-toxicologie chimie LPTC.
J’aimerais remercier ma directrice de cette thèse Hélène BUDZINSKI, directrice du LPTC, pour m’avoir guidé et m’accorder une grande confiance pendant les trois années de thèse en me laissant une grande liberté. J’adresse ma profonde gratitude au co-directeur monsieur Farouk JABER, directeur du LAPPO, pour m’avoir encadrée avec rigueur tout au long de ce travail de thèse. Je le remercie très sincèrement pour la confiance et le soutien scientifique et humain qu’il m’a apporté depuis mon arrivée dans l’équipe du LAPPO jusqu’à l’aboutissement de ce travail de thèse.
Mes remerciements vont également au Conseil National de la Recherche Scientifique au Liban, représenté par son secrétaire général professeur Mouiin HAMZE, et à l’Agence Universitaire de la Francophonie AUF pour avoir financé ce travail.
Je remercie également monsieur Bilal NSOULI, directeur de CLEA, pour son accueil au sein de la commission.
Parmi ces remerciements, j’ai une pensée particulière pour mes collègues de l’équipe LAPPO pour leur participation précieuse au travail et pour l’ambiance chaleureux. Merci à docteur Mohamad Al Iskandarani, à Khaled Hawari, à Radwan Sidaoui pour son assistance en calculs statistiques et enfin à Samia Mokh pour les encouragements qu’elle m’a prodigué au cours de ces dernières années. Le travail à leurs côtés a été un réel plaisir !
Je remercie aussi très sincèrement mes collègues et amis de la commission CLEA Maria Aoun, Rana Baydoun, Hamze Jeaid, Moustafa Harb, Bassima Haddad, Najla Kayouf, Najla Kenaan, Rana Abou el Hoda, Adnan et Mohamad Dimashkiye, Salam Bazzi et tout le personnel pour leur présence pendant ces années. Merci aussi à Rola qui m’a beaucoup inspiré pendant la période très prenante de rédaction.
Au cours de cette thèse, j’ai par ailleurs été amené à effectuer plusieurs passages à l’LPTC. Je remercie donc vivement toutes les personnes pour leur accueil lors de mes venues à Bordeaux. Merci à Ninette, Angel, Nathalie, Patrick, Laurent, Pierre, Carine, Sylvie, Marie-Hélène, Nora, Mayelis, Nadia, Isabelle, Vincent, Yann, Justine, Caroline, Frederic, les autres doctorants ainsi que tous les stagiaires que j’ai eu la chance de les connaître et de passer avec eux de très bons moments.
Je remercie mes collègues et mes amis proches Ahmad Rifai, Wael Hneine, Ahmad Al Masri, Aisha El Ashi, Mohamad el Houssayni, Roumaysa Hazimeh, Hiba Abdallah et Lina Lamaa. Chacun d’eux m’a accompagnée et aidée au cours de mes travaux, avec beaucoup de gentillesse, de patience et de dévouement.
Pour toutes les personnes qui m’ont permis de passer des années agréables. Je pense en particulier à :
- Moustafa, Kinan, Jad, Nabil, Jihad, Hisham, Saba, Edward, Rida, Bilal, Sahar, Charles, Joumana, Dani, et toute l’équipe de la radiographie à l’Hôpital Rafik Hariri pour leur bonne humeur et les agréables soirées qu’on a partagées,
- Ma chère tante et amie Hasna et son mari Cédric pour les jolies balades dans les petites rues de bordeaux et toutes les discussions sociologiques et anthropologiques,
- Abdel Kader Zrein, mes amies tunisiennes Nesrine, Amal et Fida…etc..
Enfin, mes pensées reviennent tout particulièrement à mes parents, papa, maman, mes frères Ayman et l’adorable Chadi, mes petites sœurs Ola et Mariam, ma grande sœur Iman présente malgré les kilomètres, ma grand-mère et grand-père, ma chère tante Samia, tantes Randa et Mona el leurs familles que je remercie tous pour leur soutien et leur encouragement pendant toutes les longues années d’étude. Un merci tout particulier à mes amies de longue date, fidèles et soucieuses qui m’ont beaucoup supporté, Rawa, Mireille, Hiam, Sara, Israa, Iman, Zeina, Houda, Nada, Siham, Mira, et May.
Et pour finir, je voudrais remercier du fond du cœur mon fiancé Mouhamad qui m’a toujours soutenu moralement, qui était très patient et compréhensif pendant les moments de stress, mais avant tout, pour son amour sans limites.
A vous tous….
Abir
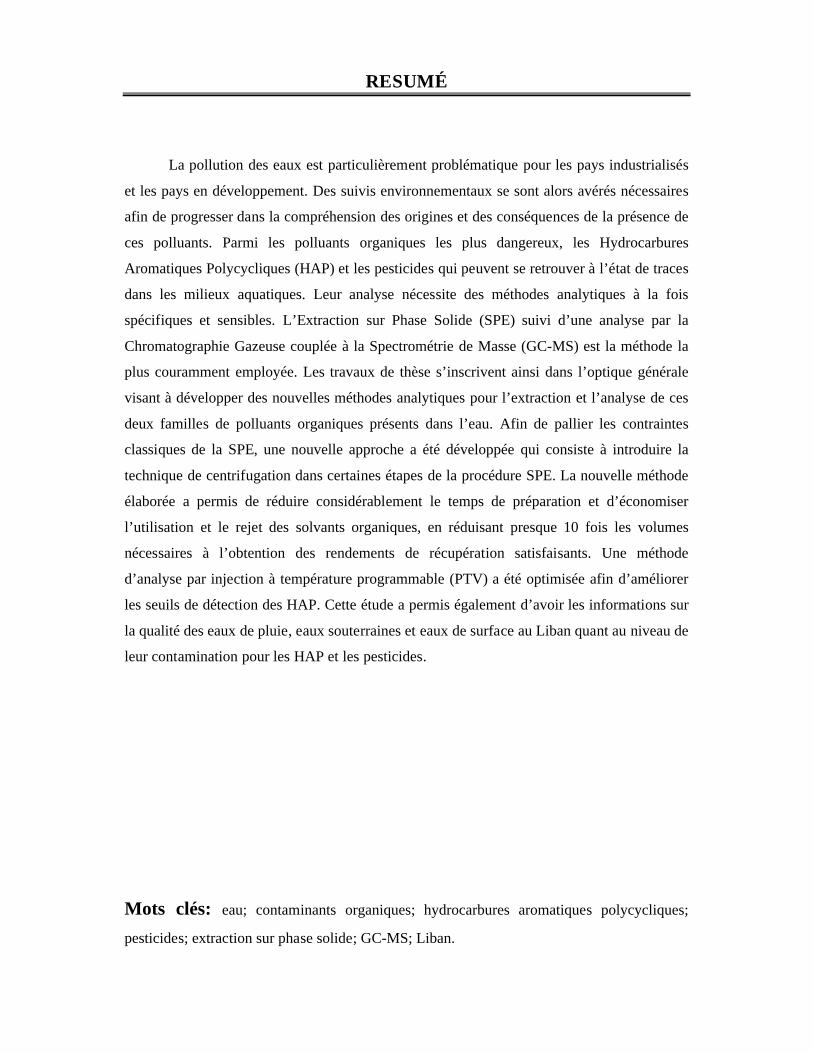
RESUMÉ
La pollution des eaux est particulièrement problématique pour les pays industrialisés
et les pays en développement. Des suivis environnementaux se sont alors avérés nécessaires
afin de progresser dans la compréhension des origines et des conséquences de la présence de
ces polluants. Parmi les polluants organiques les plus dangereux, les Hydrocarbures
Aromatiques Polycycliques (HAP) et les pesticides qui peuvent se retrouver à l’état de traces
dans les milieux aquatiques. Leur analyse nécessite des méthodes analytiques à la fois
spécifiques et sensibles. L’Extraction sur Phase Solide (SPE) suivi d’une analyse par la
Chromatographie Gazeuse couplée à la Spectrométrie de Masse (GC-MS) est la méthode la
plus couramment employée. Les travaux de thèse s’inscrivent ainsi dans l’optique générale
visant à développer des nouvelles méthodes analytiques pour l’extraction et l’analyse de ces
deux familles de polluants organiques présents dans l’eau. Afin de pallier les contraintes
classiques de la SPE, une nouvelle approche a été développée qui consiste à introduire la
technique de centrifugation dans certaines étapes de la procédure SPE. La nouvelle méthode
élaborée a permis de réduire considérablement le temps de préparation et d’économiser
l’utilisation et le rejet des solvants organiques, en réduisant presque 10 fois les volumes
nécessaires à l’obtention des rendements de récupération satisfaisants. Une méthode
d’analyse par injection à température programmable (PTV) a été optimisée afin d’améliorer
les seuils de détection des HAP. Cette étude a permis également d’avoir les informations sur
la qualité des eaux de pluie, eaux souterraines et eaux de surface au Liban quant au niveau de
leur contamination pour les HAP et les pesticides.
Mots clés: eau; contaminants organiques; hydrocarbures aromatiques polycycliques;
pesticides; extraction sur phase solide; GC-MS; Liban.
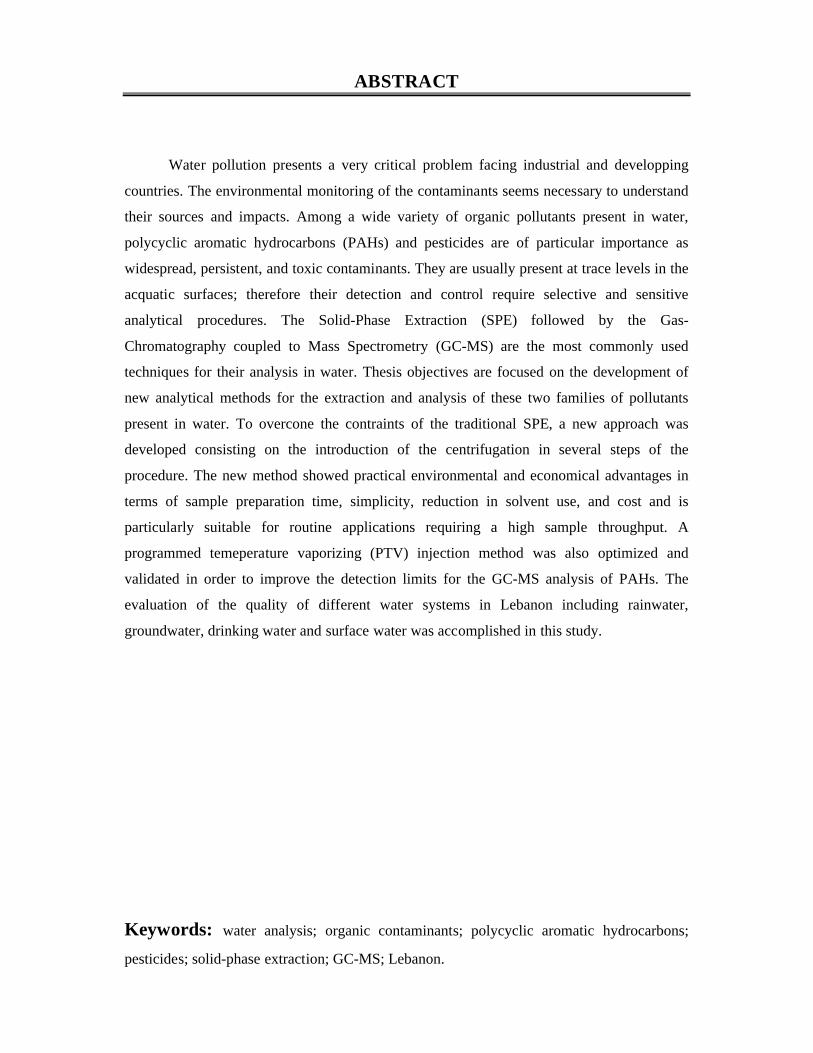
ABSTRACT
Water pollution presents a very critical problem facing industrial and developping
countries. The environmental monitoring of the contaminants seems necessary to understand
their sources and impacts. Among a wide variety of organic pollutants present in water,
polycyclic aromatic hydrocarbons (PAHs) and pesticides are of particular importance as
widespread, persistent, and toxic contaminants. They are usually present at trace levels in the
acquatic surfaces; therefore their detection and control require selective and sensitive
analytical procedures. The Solid-Phase Extraction (SPE) followed by the Gas-
Chromatography coupled to Mass Spectrometry (GC-MS) are the most commonly used
techniques for their analysis in water. Thesis objectives are focused on the development of
new analytical methods for the extraction and analysis of these two families of pollutants
present in water. To overcone the contraints of the traditional SPE, a new approach was
developed consisting on the introduction of the centrifugation in several steps of the
procedure. The new method showed practical environmental and economical advantages in
terms of sample preparation time, simplicity, reduction in solvent use, and cost and is
particularly suitable for routine applications requiring a high sample throughput. A
programmed temeperature vaporizing (PTV) injection method was also optimized and
validated in order to improve the detection limits for the GC-MS analysis of PAHs. The
evaluation of the quality of different water systems in Lebanon including rainwater,
groundwater, drinking water and surface water was accomplished in this study.
Keywords: water analysis; organic contaminants; polycyclic aromatic hydrocarbons;
pesticides; solid-phase extraction; GC-MS; Lebanon.
TABLE DES MATIERES
REMERCIEMENTS
RESUME
ABSTRACT
TABLE DE MATIERES
LISTE DE FIGURES
LISTE DES TABLEAUX
ACRONYMES ET ABREVIATIONS
INTRODUCTION………………………………………………………………………………………........1
CHAPITRE 1. SYNTHESE BIBLIOGRAPHIQUE ………………………………………...5
1. Les contaminants organiques dans l’environnement aquatique………………..….7
1.1. Les Hydrocarbures Aromatiques Polycycliques (HAP) ……………………………….8
1.1.1. Structure et caractéristiques physico-chimiques………………………..……………8
1.1.2. Origines des HAP………………………………………………………………………....10
a. Origine pyrolytique…………………………………………………………………..11
b. Origine pétrogénique………………………………………………………………...12
c. Origine diagénétique ………………………………………………………………..13
1.1.3. Caractérisation des sources de HAP…………………………………………………..14
1.1.4. Les HAP dans les systèmes aquatiques ……………………………………………...16
a. Distribution des HAP dans l’environnement aquatique ……………………..16
b. Niveaux des HAP dans les milieux aquatiques …………………………...…..18
1.1.5. Toxicité des HAP …………………………………………………………………………18
a. Mécanismes de génotoxicité et de cancérogénicité ……………………..........18
b. Classement des HAP en fonction de leur toxicité …………………………….21
c. Données toxicologiques …………………………………………………………….21
- Toxicité aiguë ………………………………………………………………………21
- Toxicité chronique ………………………………………………………………...22
1.1.6. Réglementations …………………………………………………………………………..23
1.2. Les Pesticides …………………………………………………………………………………......25
1.2.1. Définition et classification ……………………………………………………………...25
a. Premier système de classification ………………………………………………..26
b. Deuxième système de classification …………………………………………….27
1.2.2. Consommation des pesticides …………………………………………………………27
1.2.3. Pesticides etudiés et caractéristiques physico-chimique………………………….31
a. Les organochlorés (OC) ……………………………………………………………32
b. Les organophosphorés (OP) ………………………………………………………35
c. Les pyréthrinoïdes …………………………………………………………………..37
d. Les carbamates ………………………………………………………………………38
e. Les pyrimidines ……………………………………………………………………...39
f. Les azoles ……………………………………………………………………………..40
g. Les triazoles …………………………………………………………………………..40
h. Autres pesticides …………………………………………………………………….41
1.2.4. Les pesticides dans les eaux ……………………………………………………………43
a. Transfert vers les eaux souterraines : le lessivage ………………..…………..44
b. Transfert vers les eaux de surface : le ruissellement………………………….44
1.2.5. Toxicologie et écotoxicologie …………………………………………………………46
a. Impact sur l’homme…………………………………………………………………46
- Toxicité aiguë et chronique………………………………………………………48
b. Impact sur l’écosystème aquatique ……………………………………………...49
1.2.6. Réglementations…………………………………………………………………………..49
2. Méthode d’extraction sur phase solide (SPE)…………………………………………….51
2.1. Procédure classique de la SPE ………………………………………………………………....51
2.2. Paramètres clés de la SPE ………………………………………………………………………53
2.2.1. Choix de la phase d’extraction …………………………………………………………53
2.2.2. Volume de l’echantillon …………………………………………………………………54
2.3.3. Séchage de l’adsorbant …………………………………………………………………..54
2.3.4. Nature et volume de la phase d’elution ………………................................................55
REFERENCES BIBLIOGRAPHIQUES ……………………………………………………………….57
CHAPITRE 2. DEVELOPPEMENT ANALYTIQUE ……………………………………69
Introduction ……………………………………………………………………………………………...........70
3. Optimization of a Solid-Phase Extraction Method Using Centrifugation for the Determination of 16 Polycyclic Aromatic Hydrocarbons in Water……………………..73
Abstract……………………………………………………………………………………………...73
3.1. Introduction………………………….……………………………………………………………..74
3.2. Materials and Methods…………………………………………………………………………...75
3.2.1. Chemicals, Standards, Solvents, and Small Apparatus…………………………….75
3.2.2. SPE Experimental Procedure……………………………………………………………77
3.2.3 Gas Chromatographic-Mass Spectrometric (GC-MS) Analysis………………….77
3.3. Results and Discussion ………………………………………………………………………….78
3.3.1. Selection of Cartridge Type …………………………………………………………….78
3.3.2. Breakthrough Volume ……………………………………………………………………78
3.3.3. Drying after Sample Loading ………………………………………………………......79
3.3.4. Elution Conditions ………………………………………………………...……………...81
a. Nature of the Elution Phase………………………………………………………..81
b. Elution Phase Volume………………………………………………………………84
c. Effect of Centrifugation………………………………………………………….....84
3.3.5. Evaporation Step…………………………………………………………………………..85
a. Temperature Effect…………………………………………………………………..85
b. Type and Initial Volume of Solvent: Effect of the Addition of Isooctane…………………………………………………………………………….....88
3.3.6. Surrogate Standard Recoveries………………………………………………………....89
3.4. Conclusion……………………………………………………………………………………….....90
References……………………………………………………………………………………….....90
4. Optimization of a programmed temperature vaporization–gas chromatography–mass spectrometry method for the trace analysis of polycyclic aromatic hydrocarbons in waters after a solid phase extraction……………………………………...95
Abstract……………………………………………………………………………………………...95
4.1. Introduction………………………………………………………………………………………...96
4.2. Materials and methods…………………………………………………………………………...98
4.2.1. Reagents and materials…………………………………………………………………...98
4.2.2. Water sampling and extraction of PAHs……………………………………………...99
4.2.3. Instrumentation………………………………………………………………………….....99
4.2.4. Chromatographic conditions…………………………………………………………...100
4.2.5. Statistical software……………………………………………………………………….100
4.3. Results and discussion…………………………………………………………………………..101
4.3.1. Optimization of PTV injection parameters………………………………………….102
a. Plackett-Burman screening design……………………………………………...102
b. Box-Behnken design……………………………………………………………….104
4.3.2. Method validation ……………………………………………………………………….110
a. Linearity……………………………………………………………………………....110
b. Precision………………………………………………………………………….…..110
c. Recovery……………………………………………………………………………...110
d. Detection and quantification limits………………………………………..……111
4.3.3. Sensitivity of the optimized PTV method …………………………………………..111
4.3.4. Determination of PAHs in real water samples ……………………………...….….113
4.4. Conclusion………………………………………………………………………………………...115
References…………………………………………………………………………………….…...115
5. Multiresidue method for determination of 67 pesticides in water samples using solid-phase extraction with centrifugation and gas chromatography–mass spectrometry…………………………………………………………………………………………..117
Abstract………………………………………………………………………………………….....117
5.1. Introduction ……………………………………………………………………………………....118
5.2. Experimental……………………………………………………………………………………...119
5.2.1. Reagents, standards and small apparatus…………………………..…………….….119
5.2.2. Solid-phase extraction…………………………………………………………………..120
5.2.3. GC-MS analysis………………………………………………………………………….120
5.2.4. Quantification ……………………………………………………………………………121
5.3. Results and discussion……………………………………………………..……………….…..122
5.3.1. Selection of pesticides…………………………………………………………………...122
5.3.2. Development of the solid phase extraction procedure …………………………...122
a. Sorbent selection (SPE cartridge) ………………………………………………123
b. Solvent selection for analyte elution…………………………………………....123
c. Sample loading volume…………………………………………………………....129
d. Addition of organic solvent……………………………………………….……...130
e. Sorbent drying ……………………………………………………………………...130
f. Elute evaporation temperature…………………………………………………...131
5.3.3. Method validation………………………………………………………………………..141
a. Linearity……………………………………………………………………………...141
b. Recovery and Precision………………………………….………………………..141
c. Limit of Quantification …………………………………………………………...141
5.4. Conclusion ………………………………………………………………………………………..144
References……………………………………………………………….………………………..144
Conclusion ……………………………………………………………………………………………...........147
CHAPITRE 3. ETUDE DE LA QUALITE DES EAUX LIBANAISES …………..149
Introduction ………………………………………………………………………………………….............150
6. Polycyclic aromatic hydrocarbons in rainwater collected in Beirut, Lebanon …….151
Abstract …………………………………………………………………………………………....151
6.1. Introduction ……………………………………………………………………………………....152
6.2 Materials and methods ………………………………………………………………………….153
6.2.1. Chemicals, materials and small apparatus ………………………………………….153
6.2.2. Sample collection ………………………………………………………………………..154
6.2.3. Solid-phase extraction ……………………………………………………………….….155
6.2.4. GC-MS analysis and quantification ………………………………………………….155
6.3. Results and discussion ………………………………………………………………………....158
6.3.1. PAHs Concentrations in Rainwater ………………………………………………….158
6.3.2. Temporal variation and influencing factors ……………………………………..…160
6.3.3. Relationship between the concentration and the rainfall ………………………...162
6.3.4. Sources of PAHs ………………………………………………………………………....163
6.4. Conclusion ……………………………………………………………………………………..…164
References………………………………………………………………………………………...165
7. Occurrence and determination of pesticide residues in the Lebanese aquatic systems…………………………………………………………………………………………………..168
Abstract…………………………………………………………………………………………….168
7.1. Introduction…………………………………………………………………………………….....169
7.2 Materials and methods ……………………………………………………………………….…170
7.2.1. Selected pollutants ………………………………………………………………………171
7.2.2. Sampling locations ………………………………………………………………………171
a. Rainwater samples …………………………………………………………………171
b. Drinking water samples ………………………………………………………..…171
c. Groundwater samples ……………………………………………………….….…171
d. Surface water samples ………………………………………………………….…171
7.2.3. Sample preparation and solid-phase extraction…………………………………….172
7.2.4. Gas chromatography-mass spectrometry instrumentation…………………...…..172
7.3. Results and discussion…………………………………………………………………………..177
7.3.1. Rainwater …………………………………………………………………………...……..177
7.3.2. Drinking water ………………………………………………………………………...…177
7.3.3. Groundwater……………………………………………………………………………....178
7.3.4. Surface water ………………………………………………………………………….….178
7.4. Conclusion…………………………………………………………………………………….…..179
References……………………………………………………………………..………………..…194
Conclusion ……………………………………………………………………………………………...........197
CONCLUSION ET PERSPECTIVES ……………………………………………………...............199
ANNEXES…………………………………………………………………………………………………....203
Annexe 1. Propriétés physico-chimiques des 16 HAP prioritaires définis par l’US EPA……………………………………………………………………………..…….....204
Annexe 2. Propriétés physico-chimiques des pesticides étudiés …………………………....205
LISTE DE FIGURES
Figure 1.1. Les principales sources de pollution dans l’environnement aquatique. (Figure modifiée d’après www.lemonde.fr ; IFEN 2007) ……………………………………………………………………....6
Figure 1.2. Structures de 16 HAPs étudiés dans notre travail et classifiés comme substances prioritaires par l’US EPA ………………………………………………………………………………………9
Figure 1.3. Mécanisme de pyrosynthèse à partir de l'éthane proposé par Ravindra et al. 2008 ………12
Figure 1.4. Un schéma hypothétique pour l'aromatisation des précurseurs naturels: (a) β-amyrine, (b) lupéol, porposé par Laflamme & Hites, 1979 ………………………………………………………..……..14
Figure 1.5. Structure de benzo[a]pyrène-7,8-dihydrodiol-9,10-époxyde (BPDE) …………………..…20
Figure 1.6. Caractéristique structurale des HAP ayant un potentiel cancérogène ………………...……20
Figure 1.7. Consommation mondiale de pesticides de 1990 à 2001 (Source : www.acces.inrp.fr) ….29
Figure 1.8. Marché mondiale des pesticides en 2009 (UIPP, 2009) ……………………………………..29
Figure 1.9. Evolution des importations des pesticides au Liban (en milliers de dollars) entre 1985 et 2008 (Source : FAOSTAT, www.faostat.fao.org) …………………………………………………………30
Figure 1.10. Les importations de substances actives phytosanitaires vendues au Liban entre 1997 et 2006 par grand type de produit (Source FAOSTAT, www.faostat.fao.org) …………………………….30
Figure 1.11. Structure générale de deux groupes des pesticides chlorés ………………………………..33
Figure 1.12. Structures chimiques des pesticides organochlorés étudiés …………………………….....34
Figure 1.13. Structures des 22 pesticides organophosphorés étudiés ……………………………………36
Figure 1.14. Structure générale du groupe des pyréthrinoïdes ………………………………………..….37
Figure 1.15. Structures des trois pyréthrinoïdes étudiés …………………………………………………..38
Figure 1.16. Structures des deux carbamates étudiés …………………………………………………..….39
Figure 1.17. Structures des trois pyrimidines étudiés ………………………………………………….….40
Figure 1.18. Structure des deux azoles étudiés …………………………………………………………….40
Figure 1.19. Structure des triazoles étudiés ………………………………………………………………...41
Figure 1.20. Structures du groupe de 15 pesticides de familles variées étudiés ……………….……….42
Figure 1.21. Processus de dissipation des pesticides dans l’environnement (Source : Wohflahrt, 2008) …………………………………………………………………………………………………………………....45
Figure 2.1. Cartouche employée pour l’extraction sur phase solide et le dispositif à vide utilisé pour la préparation d’échantillon ……………………………………………………………………..……………….52
Figure 2.2. Protocole d’extraction sur phase solide …………………………………………...………... 52
Figure 3.1. Structures of the 16 U.S. EPA PAHs studied in our work. LMW, low molecular weight; MMW, medium molecular weight; HWW, high molecular weight HMW …………………………...…76
Figure 3.2. Extraction recovery (%) of the 16 PAHs obtained for a loaded sample volume between 500 and 1500 mL with 0.05 μg/L of analyte ………………………………………………………………..80
Figure 3.3. Recoveries (%) of Nap, AcP, and AcPy for a drying time between 10 and 60 min under vacuum. Sample volume was 500 mL with 0.05 μg/L of analyte ……………………………………….81
Figure 3.4. Influence of elution solvent polarity (DCM/EtOH, DCM, DCM/Hex, and Hex) on the recoveries of the 16 PAHs extracted from 500 mL of sample with 0.05 μg/L of analyte. Cartridges were dried with 2 min of centrifugation followed by 10 min under vacuum ……………………….…...82
Figure 3.5. Effect of the elution volume of DCM (3, 5, 7, and 9 mL) on the recoveries of the 16 PAHs extracted from 500 mL of sample with 0.05 μg/L of analyte. Cartridges were dried with 2 min of centrifugation followed by 10 min under vacuum ………………………………………………………..86
Figure 3.6. Comparison between recoveries obtained for elution on cartridge (3 and 9 mL of DCM) and elution with centrifugation using only (3 - 1mL) DCM. Sample volume was 500 mL with 0.05 μg/L of analyte. Cartridges were dried with 2 min of centrifugation followed by 10 min under vacuum …………………………………………………………………………………………………………………..87
Figure 3.7. Recoveries of the 16 PAHs in each 1 mL of DCM. Sample volume was 500 mL with 0.05 μg/L of analyte. Cartridges were dried with 2 min of centrifugation followed by 10 min under vacuum …………………………………………………………………………………………………………………..87
Figure 3.8. Effect of evaporation temperature (25, 40, 50, and 60 °C) on recoveries of Nap, AcPy, and AcP for the concentration of 1mL of DCM containing 0.05 μg of each analyte ……………..…..88
Figure 3.9. LMW PAH recoveries following concentration from 1 mL of DCM (0.05 μg of each analyte), with and without the addition of isooctane (200 μL and 1 mL) at 25 °C ……………………89
Figure 4.1. Response surfaces for naphthalene (Nap), fluoranthene (FL) and benzo[a]pyrene (B[a]P). Fixed conditions (A) Flowpurge: 35mL/min; Timepurge: 2.5 min; (B) Pressurevent: 35 psi, Timevent: 0.8 min ……………………………………………………………………………………………………………..106
Figure 4.2. The two ions (128 and 129) selected in selected ion monitoring (SIM) mode analysis of Naphthalene (Nap) …………………………………………………………………………………………...108
Figure 4.3. Selected ion monitoring (SIM) chromatograms of fluorene (Flu) (m/z 166), floranthene (FL) (m/z 202) and benzo[a]pyrene (B[a]P) (m/z 252) obtained with programmed temperature vaporization (PTV) injection (5 µL) and splitless injection (1 µL) of a standard solution at 10 ng/mL…………………………………………………………………………………………………………………..112
Figure 5.1. Schematic representation of SPE elution procedure using centrifugation ……………….121
Figure 5.2. GC-MS-SIM chromatogram of 67 pesticides in acetonitrile at 50 ng.mL-1 …………..….127
Figure 5.3. Schematic of the developed analytical method for the water sample extraction and analysis ……………………………………………………………………………………………………...…128
Figure 5.4. Effect of different eluents on the recoveries of the 67 analyzed pesticides adsorbed on C18
cartridge at a concentration of 50 ng/L. Procedure a: (2x) 1 mL of DCM; procedure b: 1 mL of DCM followed by 1 mL of MeOH; procedure c: (2x) 1 mL of DCM/MeOH (1:1, v/v); procedure d: (2x) 1 mL of Hex/Acetone (1:1, v/v) ………………………………………………………………………………132
Figure 5.5. Effect of different eluents on the recoveries of the 67 analyzed pesticides adsorbed on HLB cartridge at a concentration of 50 ng/L. Procedure e: (2x) 1 mL of MeOH; Procedure f: 1 mL of MeOH followed by 1 mL of DCM; Procedure c: (2x) 1 mL of DCM/MeOH (1:1, v/v); Procedure d: (2x) 1 mL of Hex/Acetone (1:1, v/v) …………………………………………………………………….....133
Figure 5.6. Average recoveries of pesticides for a loaded sample volume between 10 and 1000 mL on C18 cartridge ………………………………………………………………………………………………..…134
Figure 5.7. Average recoveries of pesticides for a loaded sample volume between 10 and 1000 mL on HLB cartridge ………………………………………………………………………………………………...135
Figure 5.8. Dependence of extraction efficiency on amount of organic solvent added to water sample prior to extraction on C18 cartridges ………………………………………………………………………..136
Figure 5.9. Dependence of extraction efficiency on amount of organic solvent added to water sample prior to extraction on HLB cartridges ……………………………………………………………………....137
Figure 5.10. Average recoveries of pesticide classes for a drying time between 15 and 60 min under vacuum for C18 solid phase …………………………………………………………………………….……138
Figure 5.11. Average recoveries of pesticide classes for a drying time between 15 and 60 min under vacuum for HLB solid phase ………………………………………………………………………………..139
Figure 5.12. Average recoveries of pesticide classes for an evaporation temperature between 40 and 70 °C ……………………………………………………………………………………………………..…….140
Figure 6.1. View of the Middle East region, Lebanon, and the position of AUB and the sampling site in Beirut …………………………………………………………………………………………………….…157
Figure 6.2. Relative contribution of PAH groups to the total sum of PAHs …………………………..159
Figure 6.3. Mean contribution of each individual PAH to the total PAHs in rainwater analyzed in Beirut between December 2010 and March 2011 ………………………………………………………..160
Figure 6.4. Monthly variation of the sum of PAH concentrations in rainwater in Beirut between December 2010 and March 2011 …………………………………………………………………………...161
Figure 6.5. Monthly variation of the high molecular weight PAH concentrations in rainwater in Beirut between December 2010 and March 2011 ………………………………………………………...162
Figure 6.6. Variation of PAH concentrations (ng/L) with the amount of Rainfall (mm) for the sampling period ………………………………………………………………………………………………163
Figure 7.1. Map of Lebanon showing major rivers and sampling sites for surface water, rainwater, groundwater and drinking water. Reproduced with modifications from El-Fadel & Zeinati 2000 ….173
Figure 7.2. Solid-phase extraction method for the analysis of pesticides in water sample …………..176
Figure 7.3. Concentration (ng.L-1) of organochlorines in rainwater collected in Beirut between December 2010 and March 2011 …………………………………………………………………………..180
Figure 7.4. Concentration (ng.L-1) of organophosphates in rainwater collected in Beirut between December 2010 and March 2011 …………………………………………………………………………...181
Figure 7.5. Concentration (ng.L-1) of different families of pesticides including carbamates, pyrethroids, pyrimidines, azoles and triazoles in rainwater collected in Beirut between December 2010 and March 2011 ………………………………………………………………………………………..182
Figure 7.6. Concentration (ng.L-1) of other different pesticides (classified in our study as other pesticides group) in rainwater collected in Beirut between December 2010 and March 2011 ……....183
Figure 7.7. Concentration (ng.L-1) of organochlorines in drinking water samples collected from different regions in Lebanon in the winter season 2011 ………………………………………………….184
Figure 7.8. Concentration (ng.L-1) of organophosphates in drinking water samples collected from different regions in Lebanon in the winter season 2011 ………………………………………………….185
Figure 7.9. Concentration (ng.L-1) of different families of pesticides including carbamates, pyrethroids, pyrimidines, azoles and triazoles in drinking water samples collected from different regions in Lebanon in the winter season 2011 …………………………………………………………….186
Figure 7.10. Concentration (ng.L-1) of different pesticides (classified in our study as other pesticides group) in drinking water samples collected from different regions in Lebanon in the winter season 2011 …………………………………………………………………………………………………………..187
Figure 7.11. Concentration (ng.L-1) of organochlorines in three groundwater samples collected in November 2011 ……………………………………………………………………………………………..188
Figure 7.12. Concentration (ng.L-1) of organophosphates in three groundwater samples collected in November 2011 ……………………………………………………………………………………………..188
Figure 7.13. Concentration (ng.L-1) of different families of pesticides including carbamates, pyrethroids, pyrimidines, azoles and triazoles in three groundwater samples collected in November 2011 ………………………………………………………………………………………………………….189
Figure 7.14. Concentration (ng.L-1) of different pesticides (classified in our study as other pesticides group) in three groundwater samples collected in November 2011 …………………………………….189
Figure 7.15. Concentration (ng.L-1) of organochlorines in Qaraoun Lake in March and May 2011…………………………………………………………………………………………………………………190
Figure 7.16. Concentration (ng.L-1) of organophosphates in Qaraoun Lake in March and May 2011.………………………………………………………………………………………………………………….190
Figure 7.17. Concentration (ng.L-1) of different families of pesticides including carbamates, pyrethroids, pyrimidines, azoles and triazoles in Qaraoun Lake in March and May 2011. ……….…191
Figure 7.18. Concentration (ng.L-1) of different pesticides (classified in our study as other pesticides group) in Qaraoun Lake in March and May 2011 ……………………………………………………….191
Figure 7.19. Comparison between concentrations of organochlorines pesticides in Litani River and Qaraoun Lake in May 2011 …………………………………………………………………………………192
Figure 7.20. Comparison between concentrations of organophosphates pesticides in Litani River and Qaraoun Lake in May 2011 …………………………………………………………………………………192
Figure 7.21. Comparison between concentrations of different families of pesticides including carbamates, pyrethroids, pyrimidines, azoles and triazoles in Litani River and Qaraoun Lake in May 2011 ……………………………………………………………………………………………………….….193
Figure 7.22. Comparison between concentrations of different pesticides (classified in our study as other pesticides group) in Litani River and Qaraoun Lake in May 2011 ………………………………193
LISTE DE TABLEAUX
Tableau 1.1. Comparaison de la composition du pétrole déversé au Liban à la station électrique du Jiyyeh avec d’autres déversements (Source : CEDRE, 2006) ………………………………………….…13
Tableau 1.2. Valeurs de quelques indices moléculaires caractérisant l’origine des HAP d’après l’étude bibliographique de Yunker et al. (2002) ……………………………………………………..……..16
Tableau 1.3. Contamination en HAP dans l’eau de divers environnements aquatiques ……………....19
Tableau 1.4. Classement des HAP en fonction de leur génotoxicité et de leur cancérogénicité ……..22
Tableau 1.5. Le moyen annuel (AA) et la concentration maximale acceptable (MAC) des normes de qualité environnementale (EQS) pour les HAP dans les eaux de surface (Source : UE, 2008) ………………………………………………………………………………………………………….....24
Tableau 1.6. Application des pesticides en kg/ha par type de culture (Source : MoE, 2001) …...……31
Table 3.1. Ions Monitored for Each Analyte Studied, Surrogate Standard, and Corresponding Internal Standard …………………………………………………………………………………………………….......83
Table 3.2. Recoveries and Relative Standard Deviations of Surrogate Standards for the Optimal Conditions ……………………………………………………………………………………………………..90
Table 4.1. The quantification, confirmation ions and retention time for each analyte, the corresponding surrogate standard and internal standard …………………………………………………101
Table 4.2. Experimental conditions employed for the estimation of the relative influence of all factors of the programmed temperature vaporization (PTV) injection in solvent vent mode by applying a Plackett-Burman experimental design. Fixed parameters were: final temperature of 280 ◦C andtemperature ramp of 600 °C/min …………………………………………………………………………...102
Table 4.3. Estimated effects and P-values (α = 0.1) of the seven factors of the Plackett-Burman design used for the estimation of the relative influence of factors ……………………………………………....105
Table 4.4. Experimental conditions and response (peak area) of the Box-Behnken design used for optimization of programmed temperature vaporization (PTV) injection in GC–MS analysis of PAHs.………………………………………………………………………………………………………………….109
Table 4.5. Optimized factor settings and the individual and composite desirability for PAHs determination by programmed temperature vaporization (PTV) and GC–MS ………………………..107
Table 4.6. Performance characteristics of the optimized programmed temperature vaporization (PTV) injection in solvent vent mode and GC–MS analysis method …………………………………………..114
Table 4.7. Signal-to-noise (S/N) ratios of GC–MS analysis applying the optimized programmed temperature vaporization (PTV) injection and splitless injection for the analysis of both a solution of the 16 EPA PAHs in acetonitrile (10 ng/mL) and an extract of a water samples fortified at the same concentration level …………………………………………………………………………………………...112
Table 4.8. PAHs levels (ng/L) found in ground water samples ………………………………...……….113
Table 5.1. Parameters for determination of 67 pesticide residues in waters by GC–MS …………….124
Table 5.2. Monitoring program of selected ions for 67 pesticides by GC-MS ……………………..…126
Table 5.3. Validation results: Linear range, recoveries, repeatability and limits of quantitation (LOQs) …………………………………………………………………………………………………………………..142
Table 6.1. Average recoveries of surrogate standards in rainwater samples ……………………..……156

Table 6.2. Statistical summary of PAHs normalized concentration (ng/L) in precipitation …………158
Table 6.3. Monthly ratios of isomeric PAH pairs ………………………………………………..…….…164
Table 7.1. Parameters for determination of 67 pesticide residues in waters by GC–MS in single ion monitoring (SIM) mode …………………………………………………………………………………..….174
ACRONYMES ET ABREVIATIONS
AA Annual Average ou moyen annuel ACN AcetonitrileAcP AcenaphtheneAcPy AcénaphtylèneACTA Association de Coordination Technique Agricole ADN Acide désoxyribonucléique Ant Anthracène ARN Acide ribonucléique ATSDR Agency for Toxic Substances and Disease RegistryB[a]A Benzo[a]anthracèneB[a]P Benzo[a]PyrèneB[b]FL Benzo[b]fluorantheneB[ghi]P Benzo[ghi]pérylène B[k]FL Benzo[k]fluoranthèneBP British PetrochemicaBPDE Benzo[a]pyrène-7,8-dihydrodiol-9,10-époxyde°C Degré Celcius
C8Octyle
C18Octadecyle
CEDRE Centre de Documentation, de Recherche et d'Expérimentations sur les pollutions accidentelles des Eaux
Chr Chrysène
CL50Concentration létale
cm3.g-1 Centimètre cube par grammeCN Cyano
CO2Dioxide de carbone
Da Dalton DBA Dibenzo[a,h]anthraceneDCE Directive Cadre Européenne sur l’Eau DCM DichloromethaneDCP Directive Cadre sur les PesticidesDDD DichlorodiphényldichloroéthaneDDE DichlorodiphényldichloroéthylèneDDT Dichlorodiphényltrichloroéthane DGPA Direction Générale de la Production Agricole
DT50Temps de demi-vie
EFSA Autorité Européenne de Sécurité des Aliments EI Electron IonisationEQS Environmental Quality Standards EtOH EthanolFAO Organisation of the United Nations FLR Fluorenthène Flu FluorèneGC Chromatographie en Phase Gazeuse HAP Hydrocarbures Aromatiques Polycycliques HCH Hexachlorocyclohexane Hex HexaneHLB Hydrophilic lipophylic balance
HMW High Molecular WeightIARC Agence International de Recherche sur le Cancer IFEN Institut Français de l’Environnement IFO Intermediate Fioul Oil INERIS Institut National de l’Environnement industriel et des RISques InP Indeno[1,2,3-cd]pyrène IPCS Programme International de Sécurité Chimique JOCE Journal Officiel des Communautés EuropéennesK Facteur de rétention du soluté
KcCoefficient de distribution dans le sol
KdCoefficient de partage entre le sédiment et l’eau
Kg.ha Organisation des Nations Unies pour l’Alimentation et l’Agriculture (Food and Agriculture kg par hectare
KhConstante de Henry
KocCoefficient de partage entre le carbone organique et l’eau
KowCoefficient de partage entre une phase aqueuse et une phase organique
KpCoefficient de partage entre la phase particulaire et la phase dissoute
LC Chromatographie en phase Liquide LLE Liquid-Liquid ExtractionLMW Low Molecular WeightLOEC Lowest Observed Effect ConcentrationLOD Limit of DetectionLOQ Limit of QuantificationLVI Large Volume Injectionµg.L-1 Microgramme par litreMg.L-1 Milligramme par litremL.min-1 Millilitre par minuteμm Micromètre m2.g-1 Mètre carré par grammeMAC Maximum Allowable Concentration ou Concentration maximale acceptable MES Matières en suspension MeOH MethanolMMI Multi-Mode InletMMW Medium Molecular WeightMoA Ministère de l’Agriculture libanaisMoE Ministère de l’Environnement libanais MS Spectrométrie de Masse MS-MS Tandem Mass SpectrometryNap Naphtalène ng.L-1 Nanogramme par litreNOEC No Observed Effect ConcentrationOC OrganochlorésOMS L’Organisation Mondiale pour la Santé OP OrganophosphorésPAH Polycyclic Aromatic HydrocarbonsPa.m3.mol-1 Pascal par mètre cube par unité de molPCB PolychlorobiphénylesPer PérylènePhe Phénanthrène ppm Concentration en partie par millionPS-DVB Polystyrène-di vinylbenzène
PTFE PolytetrafluoroéthylènePTV Injecteur à température programmable ou Programmed Temperature
VaporizationPyr PyrèneR2 Coefficient of determinationRPM Revolutions per minuteRSDi Intermediate PrecisionRSDr Relative repeatability Standard DeviationsSIM Selective Ion MonitoringS/N Signal to NoiseSPE Solid-phase extractiont.an-1 Tonne par an
TD50Temps de demi vie
UE Union Européenne UIPP Union des Industries de la Protection des Plantes US-EPA Agence pour la Protection de l’Environnement des Etats-Unis ou US
Environmental Protection Agency
VfVolume de fin de fixation
VmVolume maximal correspondant à 99 % de l’absorbance
WFD Water Framework DirectiveWHO World Health Organization
1
Introduction
Introduction
2
Depuis l’explosion de l’industrie chimique au début du XXème siècle et l’utilisation de
produits de synthèse dans la vie quotidienne, des quantités croissantes de substances
chimiques d’origines industrielles, agricoles ou domestiques, n’ont cessé d’être émises dans
l’environnement. Cet accroissement parfois immodéré de ces activités est à l’origine de
pollutions anthropiques de natures très diverses (physiques, chimiques, microbiologique…).
Certains contaminants de nature chimique ont un caractère global par leur étendue
géographique ; c’est le cas de nombreux composés organiques dont certains sont dorénavant
imbriqués dans les cycles biogéochimiques naturels, tels que les HAP (hydrocarbures
aromatiques polycycliques), issus prioritairement des rejets des activités urbaines et
industrielles ainsi que certains pesticides (organochlorés, organophosphorés…), utilisés dans
l’agriculture et d’autres applications de biocides. Des nombreuses études ont révélé les
propriétés toxiques de ces deux familles de contaminants et leur capacité d’altérer les
fonctions biologiques chez les êtres vivants.
Quelles que soient les sources de pollution et le compartiment de l’environnement dans
lequel les contaminants sont émis, une grande partie de ces substances rejetées passent dans
les milieux aquatiques. L’enjeu écologique et humain que représente cette ressource, la
pollution des eaux est particulièrement problématique pour les pays industrialisés et les pays
en développement. Des suivis environnementaux se sont alors avérés nécessaires afin de
progresser dans la compréhension des origines et des conséquences de la présence de ces
polluants dans l’environnement aquatique. Les HAP et les pesticides, notamment, se
retrouvent à l’état de traces dans les milieux aquatiques. Leur analyse nécessite des méthodes
analytiques à la fois spécifiques et sensibles. Bien que les techniques de séparation et de
détection soient de plus en plus performantes suite aux nombreux développements
technologiques, ces outils mis à la disposition des laboratoires de contrôle et de recherche ne
permettent pas systématiquement d’identifier et de quantifier les espèces recherchés présents
en faibles teneurs dans des matrices très diluées. Une étape de prétraitement s’avère alors
nécessaire pour la préconcentration de polluants, et/ou la purification de l’échantillon afin de
s’affranchir d’éventuels effets de matrice. Cette étape est souvent laissée en retrait, alors
qu’elle représente la deuxième importante source d’erreurs de la méthode analytique après
l’échantillonnage et que l’analyste lui consacre approximativement plus de 50% de temps de
l’analyse.
Introduction
3
Les méthodes de prétraitement utilisées mettent en jeu des principes différents selon
les propriétés physico-chimiques des composés à extraire (polarité, volatilité..) et la nature de
la matrice de l’échantillon (eaux de surface, eaux usées, eaux de mer...). L’extraction sur
phase solide ou Solid-Phase Extraction (SPE) est la méthode la plus couramment employée
pour l’analyse des HAP et de pesticides dans l’eau. Elle est basée sur la distribution des
composés à extraire entre la phase liquide, l’échantillon, et la phase solide, l’adsorbant.
L’évolution de la SPE a été facilitée par la commercialisation de phases de natures très
variées et dédiées à des composés et à des échantillons différents. Cependant, même si elle
est simple et efficace, la technique SPE présente quelques inconvénients au niveau de la
consommation des solvants et du nombre d’étapes d’extraction qui peuvent conduire à des
pertes de certains composés. Actuellement, la tendance est plutôt de s’orienter vers des
protocoles efficaces, rapides et peu coûteux, mais aussi facilement utilisables pour les
analyses de routine. Un point important est également de réduire le volume de solvants
utilisés afin de minimiser les risques liés à la santé et à l’environnement.
Nos travaux de thèse s’inscrivent ainsi dans l’optique générale visant à développer des
nouvelles méthodes analytiques pour l’extraction et l’analyse des deux familles de polluants
organiques présents dans l’eau, les HAP et les pesticides. Afin de pallier les contraintes de la
SPE classique, une nouvelle approche a été développée qui consiste à introduire la
centrifugation lors de la procédure SPE. La comparaison avec la méthode SPE
conventionnelle a été réalisée afin de relever les avantages des méthodes développées. Cette
étude a également pour objectif de vérifier la validité des méthodes optimisées au laboratoire
et faire l’évaluation de la qualité des eaux libanaises.
Ces travaux de thèse ont été effectués dans le cadre d’un projet commun financé par
l’Agence Universitaire de la Francophonie (AUF) et le Conseil National de la Recherche
Scientifique Libanais (CNRSL). Les travaux ont été menés alternativement dans
l’établissement d’accueil, le Laboratoire de Physico- et Toxico-Chimie de l'environnement
(LPTC) à l’Université de Bordeaux 1 et dans l’établissement de l’origine, le Laboratoire
d’Analyse de Pesticides et de Polluants Organiques (LAPPO) de la Commission Libanaise de
l’Energie Atomique (CLEA-CNRSL) à Beyrouth.
Le mémoire de thèse est organisé en trois chapitres. Dans le chapitre 1, une synthèse
bibliographique présente l’état des connaissances actuelles sur les deux familles de
contaminants organiques étudiés : Les HAP et les pesticides. Les différents aspects abordés
Introduction
4
directement ou indirectement au cours de ces travaux, sont traités : Natures, propriétés
physico-chimiques, sources d’introduction dans l’environnement, présences et devenirs dans
les différents compartiments environnementaux surtout aquatique et toxicité. Ce chapitre
décrit également les réglementations européennes et internationales sur la présence des
contaminants étudiés dans l’environnement aquatique. Ce 1er chapitre sera finalisé par une
exposition de la technique SPE pour l’extraction des HAP et des pesticides à partir de l’eau:
Principe, formats, différents adsorbants utilisés, en insistant sur les paramètres clés de la
méthode.
Le chapitre 2 est constitué de trois articles exposant les travaux et les résultats du
développement analytique réalisé suivant les objectifs de la thèse. Les deux premières
publications reprennent les optimisations de la technique d’extraction (SPE combinée avec la
centrifugation) et d’analyse (par GC-MS avec injection en mode PTV) appliquées pour la
quantification des HAP dans les eaux, ainsi qu’une comparaison avec les techniques
conventionnelles. La troisième publication présente l’élaboration et l’optimisation de la
technique d’extraction SPE pour l’analyse d’un large groupe de pesticides dans les eaux.
Enfin, le chapitre 3 s’intéresse aux applications des méthodes analytiques
développées dans le cadre de l’évaluation de la qualité des eaux au Liban pour les deux types
de contaminants étudiés. Ces applications sont présentées sous la forme de deux articles ; le
premier concerne l’analyse, la distribution, et l’évaluation des sources possibles des HAP
dans les eaux de pluie, alors que le deuxième porte sur l’évaluation de la présence des
pesticides dans les différents systèmes aquatiques au Liban.
5
Chapitre 1. Synthèse Bibliographique
Chapitre 1. Synthèse Bibliographique
6
Le premier chapitre présente synthétiquement l’état des connaissances actuelles sur
les différents contaminants étudiés au cours de ces travaux, leurs caractéristiques, leurs effets
sur les organismes ainsi que leurs concentrations dans l’environnement aquatique.
De plus, une attention particulière sera portée sur la méthode de traitement
d’échantillons aqueux la plus employée lors de l’analyse de composés à l’état de traces sera
détaillée : l’extraction sur phase solide.
Chapitre 1. Synthèse Bibliographique
7
1. Les contaminants organiques dans l’environnement aquatique
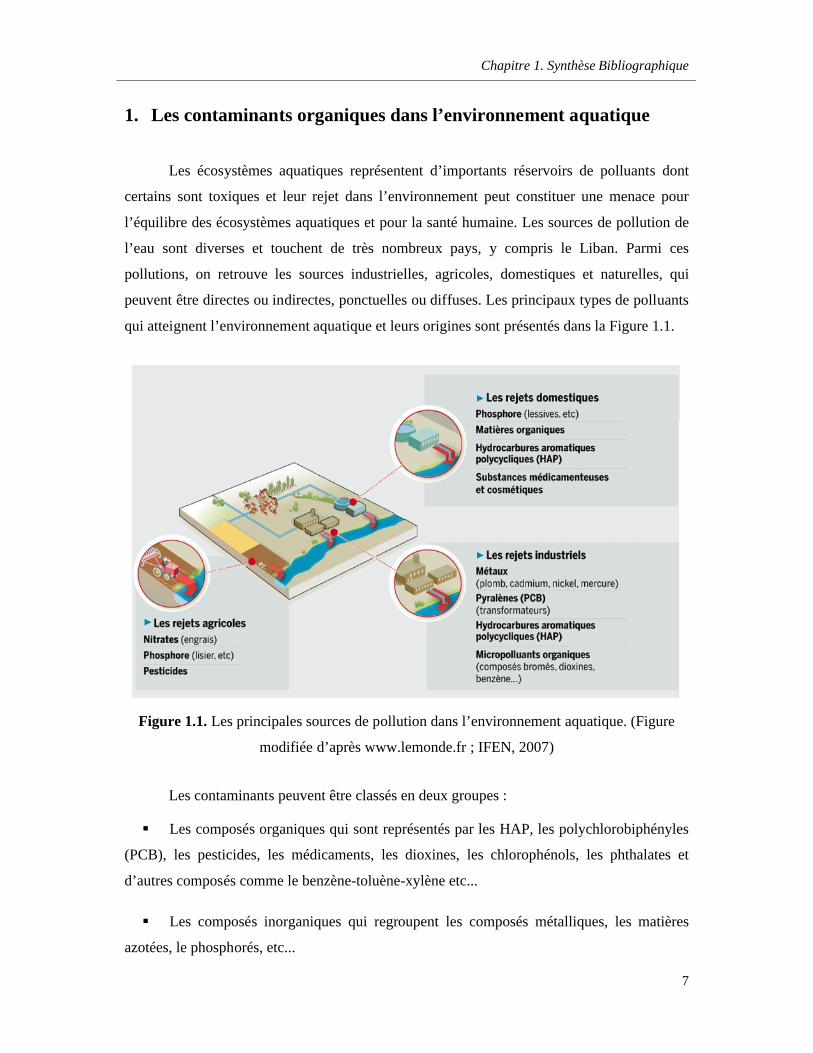
Les écosystèmes aquatiques représentent d’importants réservoirs de polluants dont
certains sont toxiques et leur rejet dans l’environnement peut constituer une menace pour
l’équilibre des écosystèmes aquatiques et pour la santé humaine. Les sources de pollution de
l’eau sont diverses et touchent de très nombreux pays, y compris le Liban. Parmi ces
pollutions, on retrouve les sources industrielles, agricoles, domestiques et naturelles, qui
peuvent être directes ou indirectes, ponctuelles ou diffuses. Les principaux types de polluants
qui atteignent l’environnement aquatique et leurs origines sont présentés dans la Figure 1.1.
Figure 1.1. Les principales sources de pollution dans l’environnement aquatique. (Figure
modifiée d’après www.lemonde.fr ; IFEN, 2007)
Les contaminants peuvent être classés en deux groupes :
Les composés organiques qui sont représentés par les HAP, les polychlorobiphényles
(PCB), les pesticides, les médicaments, les dioxines, les chlorophénols, les phthalates et
d’autres composés comme le benzène-toluène-xylène etc...
Les composés inorganiques qui regroupent les composés métalliques, les matières
azotées, le phosphorés, etc...
Chapitre 1. Synthèse Bibliographique
8
Dans le cadre de ces travaux de thèse, deux classes de contaminants ont été étudiées,
les HAP et les pesticides, sur des critères de concentrations élevées dans les milieux
aquatiques, de rémanence, de toxicité élevée et de risque de
bioaccumulation/bioconcentration dans le compartiment biologique.
1.1. Les Hydrocarbures Aromatiques Polycycliques (HAP)
1.1.1. Structure et caractéristiques physico-chimiques
Les HAP sont des composés organiques constitués d’atomes de carbone et
d’hydrogène dont la structure des molécules comprend au moins deux noyaux aromatiques
condensés. La famille des HAP comprend de nombreuses substances qui diffèrent entre elles
par le nombre et la position de cycles benzéniques (Neff, 1979), mais une centaine seulement
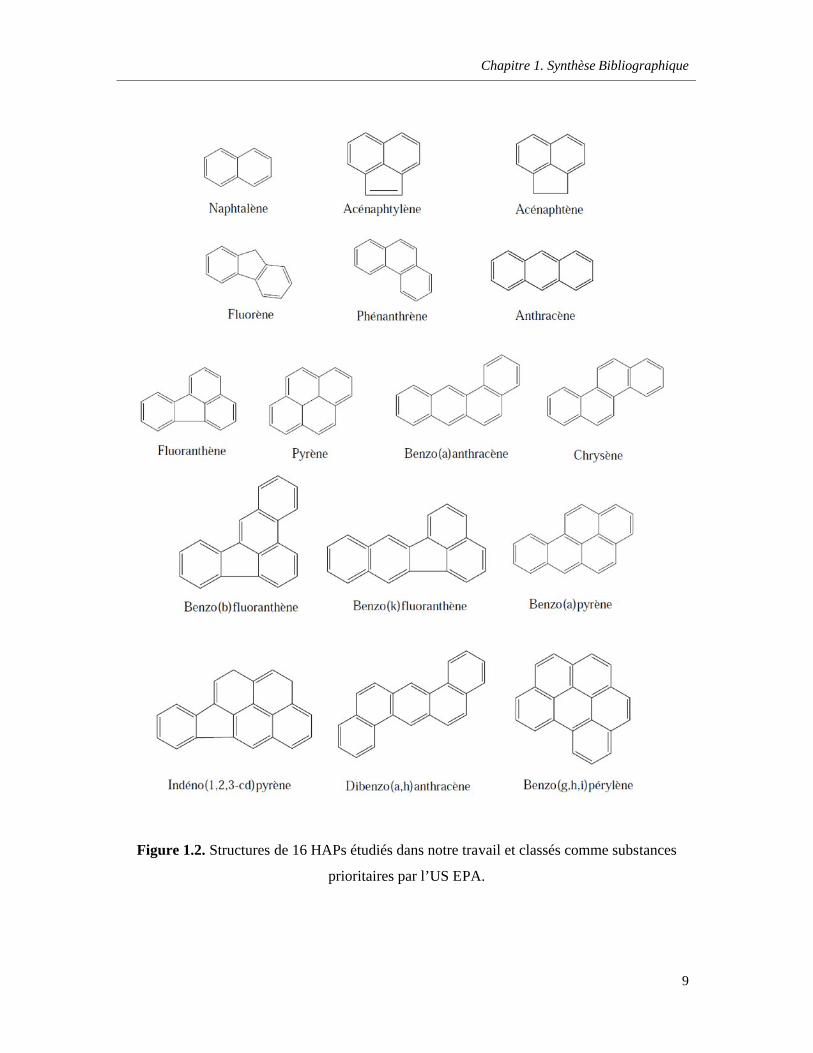
de ces molécules ont été identifiées dans l’environnement. Seize HAP ont été retenus par
l’Agence pour la Protection de l’Environnement des Etats-Unis (US EPA) comme polluants
organiques prioritaires et suscitent donc un intérêt particulier dans la surveillance de
l’environnement (ATSDR, 1990). Les structures de 16 HAP de l’US EPA étudiés sont
représentées dans la Figure 1.2.
Les propriétés physico-chimiques des HAP dépendent de leurs structures et leurs
masses moléculaire et conditionnent leur devenir et leur distribution dans l’environnement.
Selon leur nombre de cycles benzéniques, ces composés sont classés en HAP "légers" (≤ 3
cycles) et HAP "lourds" (≥ 4 cycles). Leurs propriétés sont résumées dans l’Annexe 1. En
général, les HAP sont considérés comme des molécules apolaires, hydrophobes, et peu
solubles dans l’eau. Leur caractère hydrophobe augmente avec le nombre de cycles
aromatiques, alors que leur solubilité diminue. Les HAP susceptibles d’être présents dans le
milieu aquatique ont entre deux et dix noyaux aromatiques. Au-delà, leur solubilité est trop
faible pour qu’ils soient détectés dans les environnements aqueux. Les faibles pressions de
vapeur des HAP leur confèrent une faible volatilité qui diminue avec le poids moléculaire, à
l’exception du HAP di-aromatique, le naphtalène (Nap), qui peut se volatiliser de la surface
de l’eau ou du sol (INERIS, 2006).
Chapitre 1. Synthèse Bibliographique
9
Figure 1.2. Structures de 16 HAPs étudiés dans notre travail et classés comme substances
prioritaires par l’US EPA.
Chapitre 1. Synthèse Bibliographique
10
En plus de ces paramètres classiques, les coefficients de partage sont utilisés pour
décrire la distribution des HAP dans les différents compartiments environnementaux : partage
entre une phase aqueuse et une phase organique (Kow), le sédiment et l’eau (Kd), le carbone
organique et l’eau (Koc). Les valeurs de ces coefficients de partage, présentées dans l’Annexe
1, augmentent avec la masse moléculaire. En effet, les HAP lourds (penta- à hexa-
aromatiques) présentent une lipophilie/hydrophobie, ainsi que des affinités pour la matière
organique, les particules et les sédiments, plus importantes que les HAP légers (di- à tétra-
aromatiques).
1.1.2. Origines des HAP
La formation des HAP peut résulter de processus naturels, mais l’activité anthropique
est généralement considérée comme la source majeure d’introduction des HAP dans
l’environnement. Les sources naturelles regroupent les éruptions volcaniques, la combustion
de biomasse lors des feux de forêt et les fuites de réservoirs naturels de pétrole (Freeman et
al., 1990; Hoyau et al., 1996; Pozzoli et al., 2004). La majorité des émissions en HAP
anthropique est issue de la combustion des dérivés du pétrole, du charbon, du gaz naturel ou
encore d’ordures ménagères (Besombes et al., 2001). En 2004, l’estimation de l’émission
atmosphérique mondiale de 16 HAP était de 520 000 tonnes, avec un pourcentage de 56,7%
provenant de la combustion de biocarburants et 17% des incendies de forêts (Zhang et Tao,
2009).
Trois sources principales peuvent être considérées pour les HAP (Neff, 1979;
McElroy, 1989). La plus importante, qualifiée de source pyrolytique, provient de la
combustion incomplète de la matière organique à haute température. Les HAP peuvent être
également générés par la maturation de la matière organique soumise à un gradient
géothermique naturel et se trouve donc dans le pétrole et le charbon. Cette source est appelée
la source pétrogénique. Une troisième source dite diagénétique, qui est plutôt minoritaire,
correspond à la diagenèse précoce. Dans tous les cas, les HAP peuvent pénétrer directement
dans le milieu aquatique par de sources ponctuelles, comme les effluents industriels et
urbains, ou à travers de sources diffuses, comme les eaux de ruissellement en zones rurales et
en zones urbaines et les retombées atmosphériques.
Chapitre 1. Synthèse Bibliographique
11
a. Origine pyrolytique
Les HAP d’origine pyrolytiques sont générés lors de la combustion incomplète de la
matière organique à haute température (˃ 500°C) et dans une période de temps extrêmement
courte (Hase et Hites, 1978). Les mécanismes de formation des HAP générés thermiquement
ne sont pas encore totalement connus, mais ils semblent toutefois impliquer deux mécanismes
de pyrolyse et pyrosynthèse (Neff, 1979; Glarborg, 2007; Appel et al., 2000; Rockne et al.,
2002; Frenklach, 2002; Ledesma et al., 2000; Dobbins et al., 2006). L’importance relative des
deux mécanismes dépend de la nature de la matière organique et des processus de combustion
(Baek et al., 1991 ; Collier et al., 1995 ; Marr et al., 1999). Sous l’effet de la température, les
substances organiques se fragmentent en composés instables (Ledesma et al., 2000). Ces
fragments, principalement des radicaux libres très réactifs, ont des temps de vie très courts.
Une partie d’entre eux vont réagir avec l’oxygène présent pour former du CO2 et de l’eau.
Mais l’oxygène étant généralement insuffisant pour accomplir une oxydation totale, une
partie de ces fragments vont réagir entre eux pour former de l'acétylène qui se condense
davantage en formant des structures cycliques aromatiques résistants à la dégradation
thermique. La recombinaison de ces fragments va conduire lors du refroidissement à des
composés organiques de plus en plus complexes (Mastral et Callèn, 2000 ; Richter et
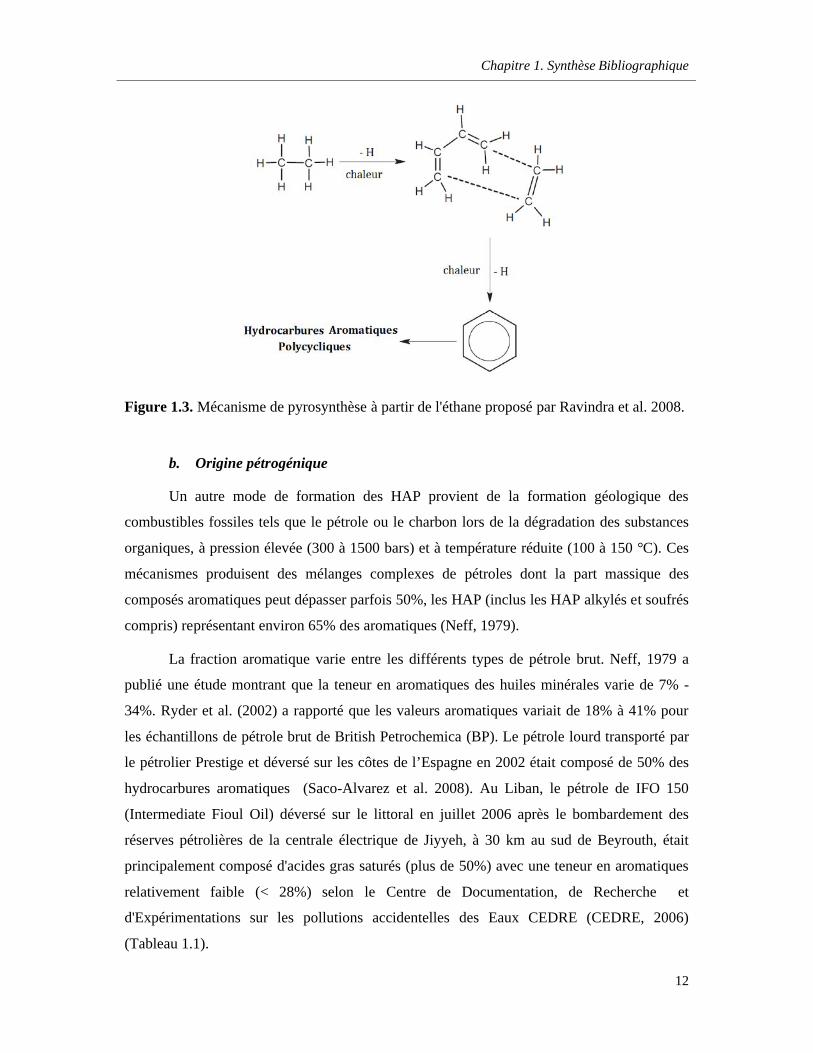
Howards, 2000 ; Ravindra et al., 2008). La Figure 1.3 illustre la formation de ces anneaux
aromatiques à partir de l'éthane (Ravindra et al., 2008). Plus récemment, une publication de
Richter et Howard en 2000 a discuté les mécanismes potentiels de formation des HAP par
pyrolyse. Plusieurs démarches cinétiques ont été proposées : 1) l'oxydation, ce qui entraîne la
formation du premier cycle aromatique (benzène) et des HAP lourds (500 - 1000 Da), 2) la
nucléation ou la création de particules de suie naissante (2000 Da, φ 1,5 nm), 3) la croissance
de la masse des particules par ajout de molécules en phase gazeuse, y compris les HAP
radicaux et 4) la coagulation par collision entre les particules.
Les hautes températures auxquelles les processus pyrolytiques se réalisent favorisent
la formation des HAP les plus lourds (tétra- à hexa-aromatiques) et des HAP non substitués.
D’autres paramètres tels que la composition du combustible de base (le rendement de
formation des HAP augmente avec le pourcentage des composés aromatiques, d'alcènes
cycliques, d'alcènes, et d'alcanes), et la proportion d’oxygène influencent également la nature
et l’abondance des HAP formés par les processus de combustion (Manahan, 1994 ; Mastral et
Callén, 2000 ; Revuelta et al., 1999).
Chapitre 1. Synthèse Bibliographique
12
Figure 1.3. Mécanisme de pyrosynthèse à partir de l'éthane proposé par Ravindra et al. 2008.
b. Origine pétrogénique
Un autre mode de formation des HAP provient de la formation géologique des
combustibles fossiles tels que le pétrole ou le charbon lors de la dégradation des substances
organiques, à pression élevée (300 à 1500 bars) et à température réduite (100 à 150 °C). Ces
mécanismes produisent des mélanges complexes de pétroles dont la part massique des
composés aromatiques peut dépasser parfois 50%, les HAP (inclus les HAP alkylés et soufrés
compris) représentant environ 65% des aromatiques (Neff, 1979).
La fraction aromatique varie entre les différents types de pétrole brut. Neff, 1979 a
publié une étude montrant que la teneur en aromatiques des huiles minérales varie de 7% -
34%. Ryder et al. (2002) a rapporté que les valeurs aromatiques variait de 18% à 41% pour
les échantillons de pétrole brut de British Petrochemica (BP). Le pétrole lourd transporté par
le pétrolier Prestige et déversé sur les côtes de l’Espagne en 2002 était composé de 50% des
hydrocarbures aromatiques (Saco-Alvarez et al. 2008). Au Liban, le pétrole de IFO 150
(Intermediate Fioul Oil) déversé sur le littoral en juillet 2006 après le bombardement des
réserves pétrolières de la centrale électrique de Jiyyeh, à 30 km au sud de Beyrouth, était
principalement composé d'acides gras saturés (plus de 50%) avec une teneur en aromatiques
relativement faible (< 28%) selon le Centre de Documentation, de Recherche et
d'Expérimentations sur les pollutions accidentelles des Eaux CEDRE (CEDRE, 2006)
(Tableau 1.1).
Chapitre 1. Synthèse Bibliographique
13
En raison de la température relativement basse lors de la formation du pétrole, les
HAP sont formés plus lentement et la proportion des HAP alkylés augmente. Le Nap, le
phénanthrène (Phe) et leurs dérivés alkylés, sont les principaux HAP présents dans les
matériels pétrogéniques du fait de leur grande stabilité thermodynamique (Ho et al., 1974 ;
Wakeham et al., 1980a ; Budzinski, 1993 ; Wang et al., 2004). Le soufre est également un
élément abondant dans les pétroles (0,05 - 14%) et peut être incorporé à de nombreuses
molécules organiques lors des diagénèses précoces, formant notamment des HAP soufrés
(dibenzothiophène, benzothiophène) (Wakeham et al., 1995 ; Sripada, 2005).
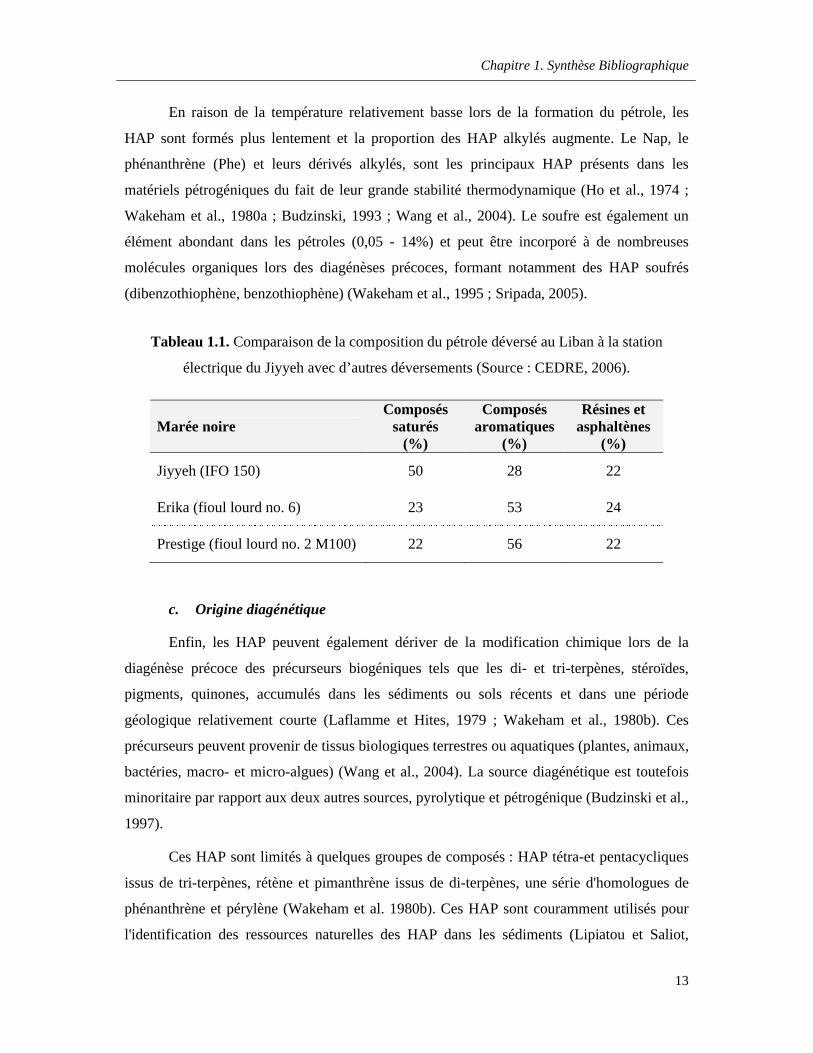
Tableau 1.1. Comparaison de la composition du pétrole déversé au Liban à la station
électrique du Jiyyeh avec d’autres déversements (Source : CEDRE, 2006).
Marée noireComposés
saturés(%)
Composés aromatiques
(%)
Résines et asphaltènes
(%)
Jiyyeh (IFO 150) 50 28 22
Erika (fioul lourd no. 6) 23 53 24
Prestige (fioul lourd no. 2 M100) 22 56 22
c. Origine diagénétique
Enfin, les HAP peuvent également dériver de la modification chimique lors de la
diagénèse précoce des précurseurs biogéniques tels que les di- et tri-terpènes, stéroïdes,
pigments, quinones, accumulés dans les sédiments ou sols récents et dans une période
géologique relativement courte (Laflamme et Hites, 1979 ; Wakeham et al., 1980b). Ces
précurseurs peuvent provenir de tissus biologiques terrestres ou aquatiques (plantes, animaux,
bactéries, macro- et micro-algues) (Wang et al., 2004). La source diagénétique est toutefois
minoritaire par rapport aux deux autres sources, pyrolytique et pétrogénique (Budzinski et al.,
1997).
Ces HAP sont limités à quelques groupes de composés : HAP tétra-et pentacycliques
issus de tri-terpènes, rétène et pimanthrène issus de di-terpènes, une série d'homologues de
phénanthrène et pérylène (Wakeham et al. 1980b). Ces HAP sont couramment utilisés pour
l'identification des ressources naturelles des HAP dans les sédiments (Lipiatou et Saliot,
Chapitre 1. Synthèse Bibliographique
14
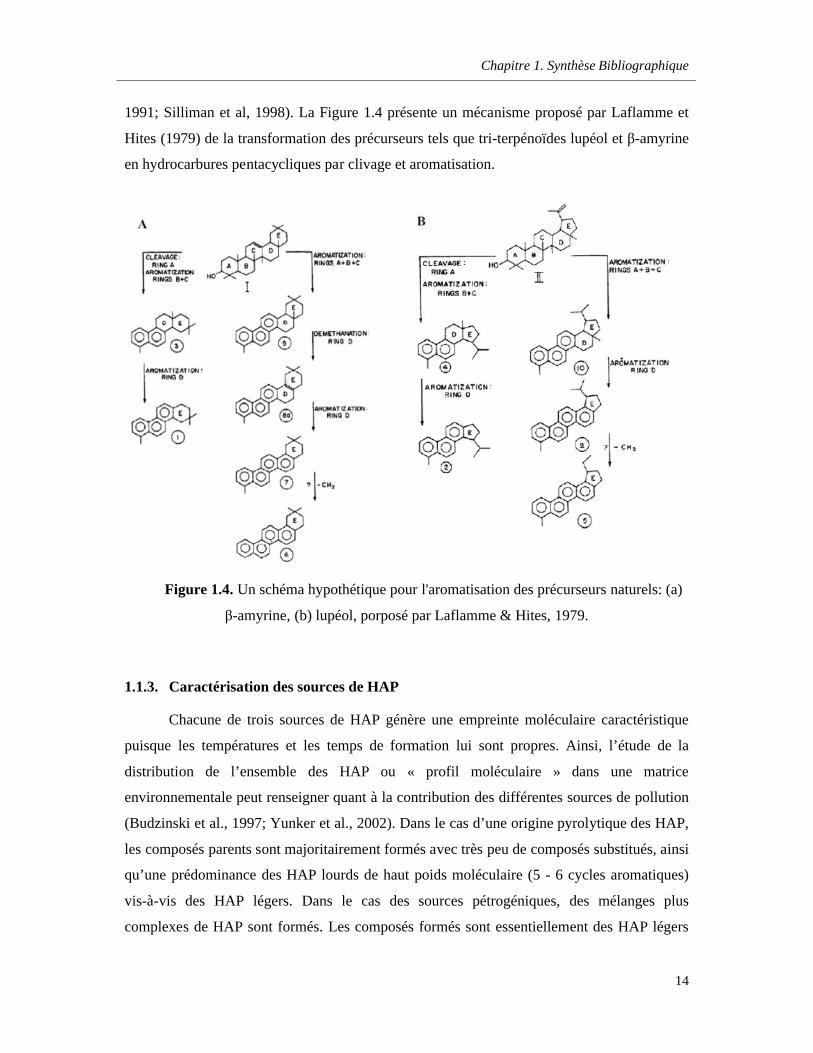
1991; Silliman et al, 1998). La Figure 1.4 présente un mécanisme proposé par Laflamme et
Hites (1979) de la transformation des précurseurs tels que tri-terpénoïdes lupéol et β-amyrine
en hydrocarbures pentacycliques par clivage et aromatisation.
Figure 1.4. Un schéma hypothétique pour l'aromatisation des précurseurs naturels: (a)
β-amyrine, (b) lupéol, porposé par Laflamme & Hites, 1979.
1.1.3. Caractérisation des sources de HAP
Chacune de trois sources de HAP génère une empreinte moléculaire caractéristique
puisque les températures et les temps de formation lui sont propres. Ainsi, l’étude de la
distribution de l’ensemble des HAP ou « profil moléculaire » dans une matrice
environnementale peut renseigner quant à la contribution des différentes sources de pollution
(Budzinski et al., 1997; Yunker et al., 2002). Dans le cas d’une origine pyrolytique des HAP,
les composés parents sont majoritairement formés avec très peu de composés substitués, ainsi
qu’une prédominance des HAP lourds de haut poids moléculaire (5 - 6 cycles aromatiques)
vis-à-vis des HAP légers. Dans le cas des sources pétrogéniques, des mélanges plus
complexes de HAP sont formés. Les composés formés sont essentiellement des HAP légers
Chapitre 1. Synthèse Bibliographique
15
(2 - 3 cycles aromatiques) de faible masse moléculaire avec une présence plus forte des HAP
alkylés (C1-C4) et/ou soufrés. Le profil d’une contamination par des produits pétrogéniques
est caractérisé par une distribution C0<C1<C2<C3<C4, Cx étant le nombre de carbones
ramifiés.
Afin de caractériser la distribution des HAP en fonction du processus qui les a
générés, les indices moléculaires basés sur les concentrations en HAP parents ou en HAP
alkylés ont été développés. Pourtant, ces comparaisons simples ne suffisent pas à
l'identification des sources des HAP car les matrices environnementales en milieu urbain
présentent des contaminations diverses. Il est nécessaire d'utiliser des outils plus élaborés
combinant divers rapports caractéristiques. Des indices moléculaires basés sur les
caractéristiques de stabilité thermodynamique ont été développés pour mettre en évidence
l’origine de ces composés. Le Phe est l’HAP triaromatique le plus stable
thermodynamiquement et il est présent à de fortes concentrations dans les HAP
pétrogéniques, qui ont maturé pendant des très longues périodes de temps. A haute
température, la réaction est rapide et les propriétés cinétiques de synthèse des HAP sont
déterminantes et un autre isomère, l’anthracène (Ant) est plus facilement formé. Le rapport
Ant/Ant+Phe dépend de la température de formation, et permet de différencier les sources,
pyrolytique ou pétrogénique; les valeurs Ant/Ant+Phe < 0,1 sont générées par une source
pétrogénique alors que des rapports plus élevés Ant/Ant+Phe > 0,1 caractérisent la source
pyrolytique (Soclo, 1986). Les mêmes considérations peuvent être appliquées à de nombreux
autres indices décrits dans la littérature (Sicre et al., 1987 ; Colombo et al., 1989 ; Budzinski
et al., 1997 ; Yunker et al., 2002). Dans une étude bibliographique publiée en 2002 sur
l’utilisation et la fiabilité des indices moléculaires, Yunker et al. (2002) a indiqué que les
isomères de masse moléculaire 228 (benzo[a]anthracène/chrysène ou B[a]A/Chr) ne semblent
pas avoir des énergies de formation suffisamment distinctes pour pouvoir les utiliser comme
des indices discriminants alors que les isomères de masses moléculaires 276
(indéno[1,2,3cd]pyrène/benzo[g,h,i]pérylène ou InP/B[ghi]P) et 202 (fluoranthène/pyrène
FL/Pyr) présentent les plus grandes différences en énergie de formation nécessaire et peuvent
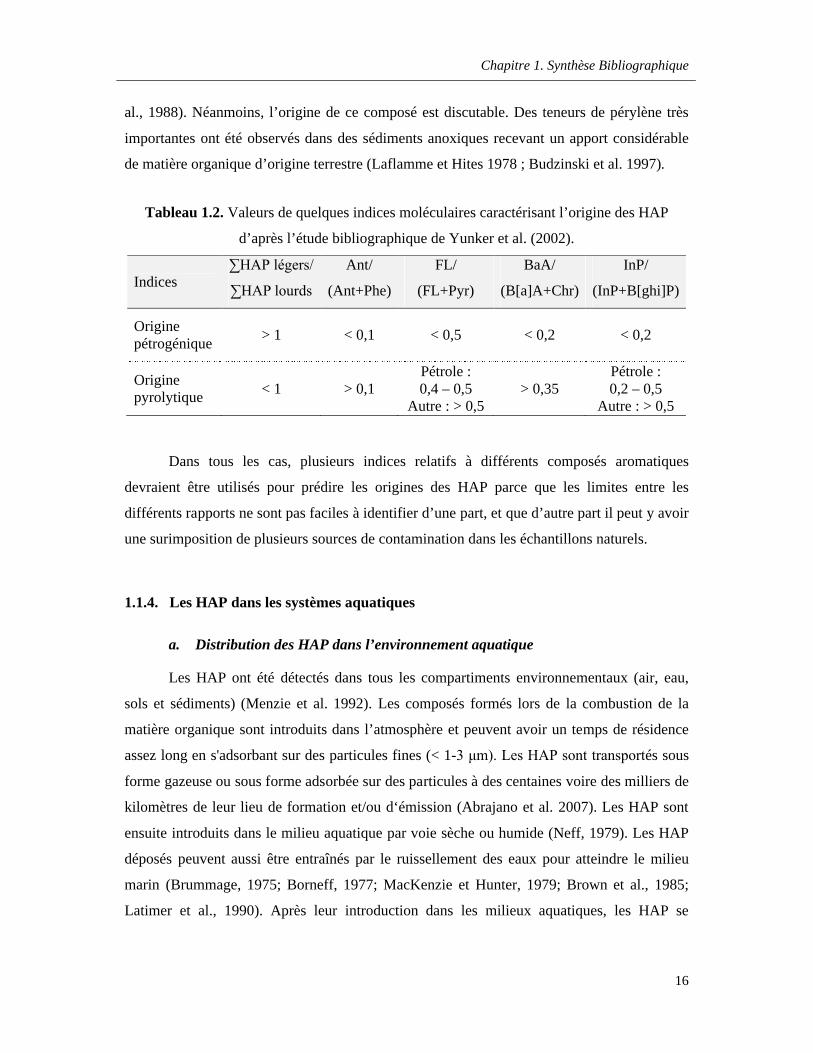
être de bons indicateurs. Le Tableau 1.2 résume les valeurs seuils de discrimination pour
quelques indices moléculaires.
Le pérylène pourrait être un marqueur spécifique de source diagénétique en étant un
dérivé de précurseurs biogéniques généré de la matière organique aquatique (Venkatesam et
Chapitre 1. Synthèse Bibliographique
16
al., 1988). Néanmoins, l’origine de ce composé est discutable. Des teneurs de pérylène très
importantes ont été observés dans des sédiments anoxiques recevant un apport considérable
de matière organique d’origine terrestre (Laflamme et Hites 1978 ; Budzinski et al. 1997).
Tableau 1.2. Valeurs de quelques indices moléculaires caractérisant l’origine des HAP
d’après l’étude bibliographique de Yunker et al. (2002).
Indices∑HAP légers/
∑HAP lourds
Ant/
(Ant+Phe)
FL/
(FL+Pyr)
BaA/
(B[a]A+Chr)
InP/
(InP+B[ghi]P)
Origine pétrogénique
> 1 < 0,1 < 0,5 < 0,2 < 0,2
Origine pyrolytique
< 1 > 0,1Pétrole : 0,4 – 0,5
Autre : > 0,5> 0,35
Pétrole : 0,2 – 0,5
Autre : > 0,5
Dans tous les cas, plusieurs indices relatifs à différents composés aromatiques
devraient être utilisés pour prédire les origines des HAP parce que les limites entre les
différents rapports ne sont pas faciles à identifier d’une part, et que d’autre part il peut y avoir
une surimposition de plusieurs sources de contamination dans les échantillons naturels.
1.1.4. Les HAP dans les systèmes aquatiques
a. Distribution des HAP dans l’environnement aquatique
Les HAP ont été détectés dans tous les compartiments environnementaux (air, eau,
sols et sédiments) (Menzie et al. 1992). Les composés formés lors de la combustion de la
matière organique sont introduits dans l’atmosphère et peuvent avoir un temps de résidence
assez long en s'adsorbant sur des particules fines (< 1-3 μm). Les HAP sont transportés sous
forme gazeuse ou sous forme adsorbée sur des particules à des centaines voire des milliers de
kilomètres de leur lieu de formation et/ou d‘émission (Abrajano et al. 2007). Les HAP sont
ensuite introduits dans le milieu aquatique par voie sèche ou humide (Neff, 1979). Les HAP
déposés peuvent aussi être entraînés par le ruissellement des eaux pour atteindre le milieu
marin (Brummage, 1975; Borneff, 1977; MacKenzie et Hunter, 1979; Brown et al., 1985;
Latimer et al., 1990). Après leur introduction dans les milieux aquatiques, les HAP se
Chapitre 1. Synthèse Bibliographique
17
distribuent sous forme dissoute, adsorbée sur la matière organique ou adsorbée sur les
particules en suspension.
Le partage des HAP entre les différentes phases du milieu aquatique est
principalement gouverné par leur caractère hydrophobe évalué par Kow. Les HAP les plus
solubles dans l’eau, ayant de faibles masses moléculaire sont généralement les plus
concentrés dans la phase dissoute alors que les HAP de plus grande masse moléculaire, plus
hydrophobes, ont plus tendance à s’adsorber sur les matières en suspension. Leur
concentration dans la phase dissoute est très faible. La fraction dissoute des composés les
moins solubles (Kow > 6) diminue dramatiquement en présence de particules organiques en
suspension dans la colonne d’eau (Gobas et Zhang, 1994). Le coefficient de partage entre la
phase particulaire et la phase dissoute (Kp) est calculé par le rapport des concentrations du
contaminant dans chaque phase ; les composés les plus hydrophobes sont caractérisés par des
coefficients de partage Kp élevés.
En plus de leurs propriétés intrinsèques, la partition des HAP entre l’eau et les phases
solides dépend des caractéristiques du milieu. Ainsi, l’affinité des HAP pour les particules en
suspension ou les sédiments peut varier en fonction de différents paramètres liés au milieu
(Landrum et al., 1992; Harkey et al., 1994). La nature et la concentration en matières
organiques dissoutes et en Matières en Suspension (MES), la granulométrie et le temps de
contact avec le polluant sont des paramètres déterminants (Harkey et al., 1994). L’affinité des
HAP pour les MES augmente avec la teneur en carbone organique et pour les particules de
faible granulométrie (Knezovich et al., 1987 ; Gobas et Zhang, 1994).
Les particules et les colloïdes subissent ensuite des processus de sédimentation directe
ou indirecte ; la masse sédimentaire constitue ainsi le réservoir majeur des composés
hydrophobes (Neff, 1979). En 1997, une étude de Lipiatou et Saliot (1991) concernant la
zone ouest de la Méditerranée a estimé que 50% des HAP introduits dans cette zone finissent
incorporés dans les sédiments côtiers (0-200 m de profondeur) et près de 13% dans les
sédiments compris entre 1000 et 2000 m de profondeur. Les HAP peuvent être libérés de
nouveau dans la colonne d’eau par des phénomènes de remise en suspension dus aux courants
marins ainsi que par la bioturbation (Windsor et Hites, 1979; Karickhoff et Morris, 1985).
Des phénomènes de biodégradation (aérobie ou anaérobie) peuvent avoir lieu dans les
sédiments et affectent particulièrement les HAP de faible masse moléculaire (Bailey et al.,
1973; Gardner et al., 1979; Bence et al. 1996; Douglas et al. 1996; Venosa et al., 1996;
Chapitre 1. Synthèse Bibliographique
18
Sugiura et al., 1997), alors que les HAP de hauts masse moléculaire semblent plus résistants
aux processus de dégradation bactérienne et tendent à persister plus longtemps (Abrajano et
al. 2007). Les HAP peuvent être également sujets à la photodégradation dans la zone
photique de l'eau à cause de leur aromaticité et leurs liaisons chimiques conjuguées (Abrajano
et al. 2007), mais la dégradation bactérienne reste le processus le plus dominant pour éliminer
les HAP des environnements contaminés. Au cours de ces cycles géochimiques, les HAP
peuvent être ingérés puis accumulés ou transformés par les organismes vivants.
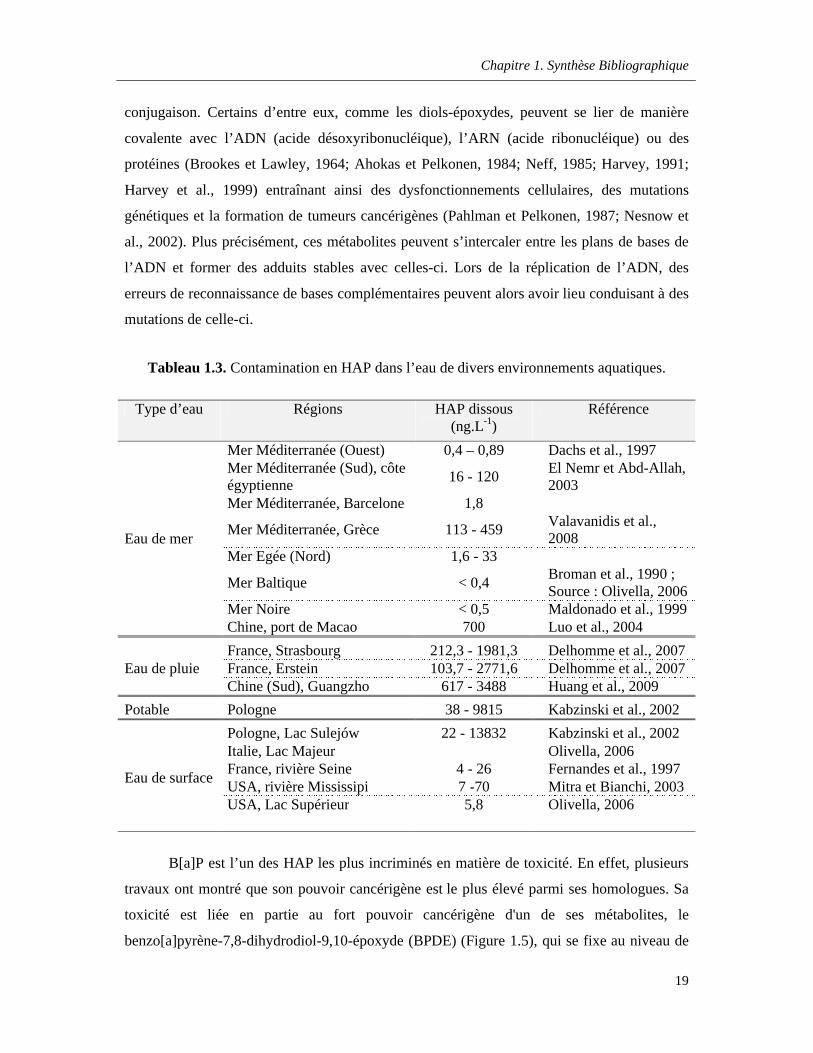
b. Niveaux des HAP dans les milieux aquatiques
Les niveaux de contamination par les HAP dans les systèmes aquatiques sont très
variés d’un milieu à un autre, que ce soit à une échelle régionale ou à l’échelle mondiale. Le
tableau 1.3 présente quelques-unes des données obtenues lors des différentes études à travers
le monde pour divers types d’eau : Eau de surface, eau de mer, eau pluviale et eau potable. La
gamme de concentrations mesurées varie de quelques ng.L-1 à la dizaine de µg.L-1 et cette
variabilité est liée à la répartition spatiale des activités anthropiques et des sources naturelles,
ainsi qu’aux fluctuations temporelles de celles-ci.
1.1.5. Toxicité des HAP
Depuis plusieurs décennies, les HAPs ont été identifiés comme responsables d'effets
toxiques chez l’animal et sur la santé humaine (Kennaway et Hieger, 1930, Kennaway,
1955).
Les principaux effets toxiques des HAP sont la cancérogénicité, la génotoxicité,
tératogénécité (Barbieri et al, 1986 ; De Flora et al., 1991), ainsi qu’une immunotoxicité chez
le biota (Dean et al., 1983; Blanton et al., 1986 ; Deal, 1995 ; Klaasen, 1997). De plus,
certains HAP sont aussi suspectés de modifier l'activité du système endocrinien (Lintelmann
et al., 2003).
a. Mécanismes de génotoxicité et de cancérogénicité
Les caractères génotoxiques (mutagènes) et cancérigènes des HAP sont les aspects les
plus étudiés à ce jour. Lors de la première phase de biotransformation des HAP, les
intermédiaires électrophiles formés peuvent ne pas être pris en charge par la phase de
Chapitre 1. Synthèse Bibliographique
19
conjugaison. Certains d’entre eux, comme les diols-époxydes, peuvent se lier de manière
covalente avec l’ADN (acide désoxyribonucléique), l’ARN (acide ribonucléique) ou des
protéines (Brookes et Lawley, 1964; Ahokas et Pelkonen, 1984; Neff, 1985; Harvey, 1991;
Harvey et al., 1999) entraînant ainsi des dysfonctionnements cellulaires, des mutations
génétiques et la formation de tumeurs cancérigènes (Pahlman et Pelkonen, 1987; Nesnow et
al., 2002). Plus précisément, ces métabolites peuvent s’intercaler entre les plans de bases de
l’ADN et former des adduits stables avec celles-ci. Lors de la réplication de l’ADN, des
erreurs de reconnaissance de bases complémentaires peuvent alors avoir lieu conduisant à des
mutations de celle-ci.
Tableau 1.3. Contamination en HAP dans l’eau de divers environnements aquatiques.
Type d’eau Régions HAP dissous(ng.L-1)
Référence
Eau de mer
Mer Méditerranée (Ouest) 0,4 – 0,89 Dachs et al., 1997Mer Méditerranée (Sud), côte égyptienne
16 - 120El Nemr et Abd-Allah, 2003
Mer Méditerranée, Barcelone 1,8
Mer Méditerranée, Grèce 113 - 459Valavanidis et al., 2008
Mer Egée (Nord) 1,6 - 33
Mer Baltique < 0,4Broman et al., 1990 ; Source : Olivella, 2006
Mer Noire < 0,5 Maldonado et al., 1999Chine, port de Macao 700 Luo et al., 2004
Eau de pluieFrance, Strasbourg 212,3 - 1981,3 Delhomme et al., 2007France, Erstein 103,7 - 2771,6 Delhomme et al., 2007Chine (Sud), Guangzho 617 - 3488 Huang et al., 2009
Potable Pologne 38 - 9815 Kabzinski et al., 2002
Eau de surface
Pologne, Lac Sulejów 22 - 13832 Kabzinski et al., 2002Italie, Lac Majeur Olivella, 2006France, rivière Seine 4 - 26 Fernandes et al., 1997USA, rivière Mississipi 7 -70 Mitra et Bianchi, 2003USA, Lac Supérieur 5,8 Olivella, 2006
B[a]P est l’un des HAP les plus incriminés en matière de toxicité. En effet, plusieurs
travaux ont montré que son pouvoir cancérigène est le plus élevé parmi ses homologues. Sa
toxicité est liée en partie au fort pouvoir cancérigène d'un de ses métabolites, le
benzo[a]pyrène-7,8-dihydrodiol-9,10-époxyde (BPDE) (Figure 1.5), qui se fixe au niveau de
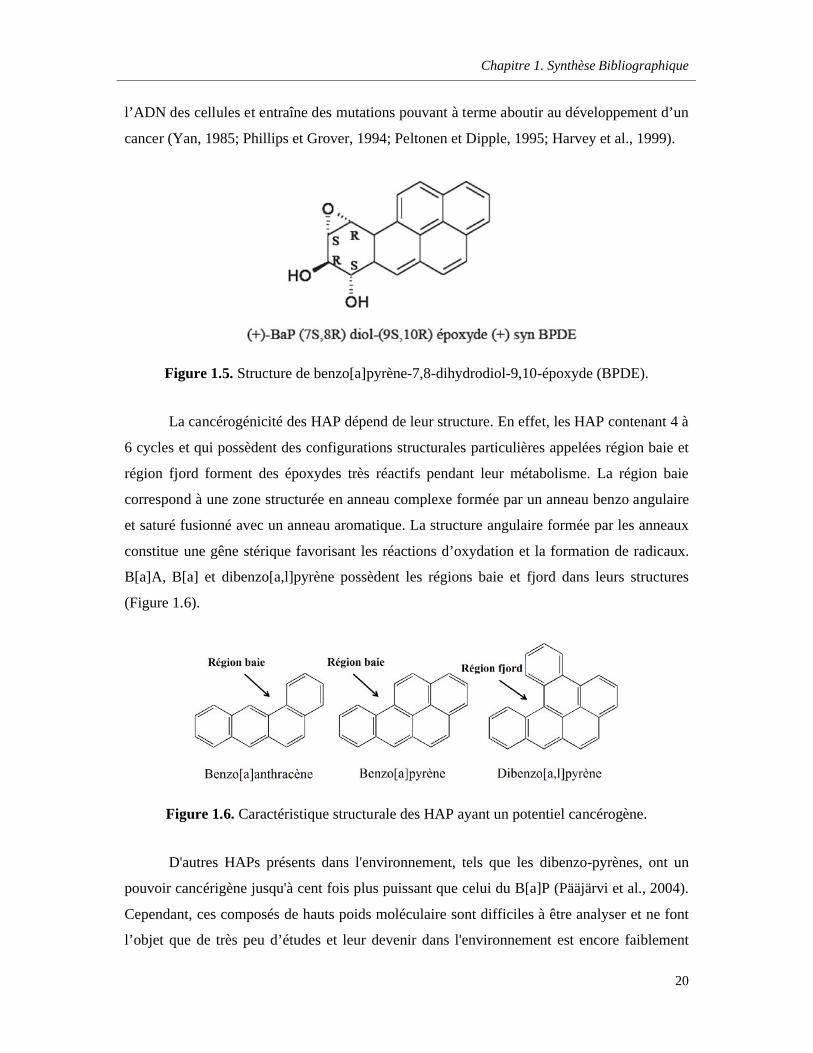
Chapitre 1. Synthèse Bibliographique
20
l’ADN des cellules et entraîne des mutations pouvant à terme aboutir au développement d’un
cancer (Yan, 1985; Phillips et Grover, 1994; Peltonen et Dipple, 1995; Harvey et al., 1999).
Figure 1.5. Structure de benzo[a]pyrène-7,8-dihydrodiol-9,10-époxyde (BPDE).
La cancérogénicité des HAP dépend de leur structure. En effet, les HAP contenant 4 à
6 cycles et qui possèdent des configurations structurales particulières appelées région baie et
région fjord forment des époxydes très réactifs pendant leur métabolisme. La région baie
correspond à une zone structurée en anneau complexe formée par un anneau benzo angulaire
et saturé fusionné avec un anneau aromatique. La structure angulaire formée par les anneaux
constitue une gêne stérique favorisant les réactions d’oxydation et la formation de radicaux.
B[a]A, B[a] et dibenzo[a,l]pyrène possèdent les régions baie et fjord dans leurs structures
(Figure 1.6).
Figure 1.6. Caractéristique structurale des HAP ayant un potentiel cancérogène.
D'autres HAPs présents dans l'environnement, tels que les dibenzo-pyrènes, ont un
pouvoir cancérigène jusqu'à cent fois plus puissant que celui du B[a]P (Pääjärvi et al., 2004).
Cependant, ces composés de hauts poids moléculaire sont difficiles à être analyser et ne font
l’objet que de très peu d’études et leur devenir dans l'environnement est encore faiblement
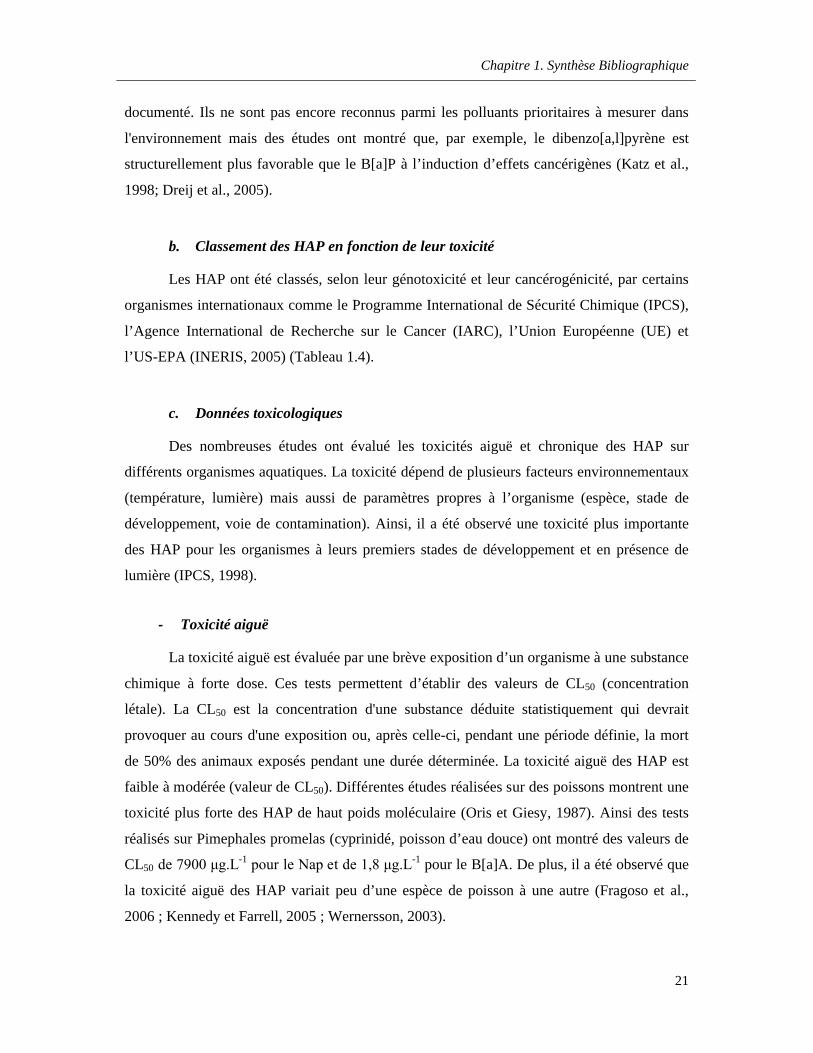
Chapitre 1. Synthèse Bibliographique
21
documenté. Ils ne sont pas encore reconnus parmi les polluants prioritaires à mesurer dans
l'environnement mais des études ont montré que, par exemple, le dibenzo[a,l]pyrène est
structurellement plus favorable que le B[a]P à l’induction d’effets cancérigènes (Katz et al.,
1998; Dreij et al., 2005).
b. Classement des HAP en fonction de leur toxicité
Les HAP ont été classés, selon leur génotoxicité et leur cancérogénicité, par certains
organismes internationaux comme le Programme International de Sécurité Chimique (IPCS),
l’Agence International de Recherche sur le Cancer (IARC), l’Union Européenne (UE) et
l’US-EPA (INERIS, 2005) (Tableau 1.4).
c. Données toxicologiques
Des nombreuses études ont évalué les toxicités aiguë et chronique des HAP sur
différents organismes aquatiques. La toxicité dépend de plusieurs facteurs environnementaux
(température, lumière) mais aussi de paramètres propres à l’organisme (espèce, stade de
développement, voie de contamination). Ainsi, il a été observé une toxicité plus importante
des HAP pour les organismes à leurs premiers stades de développement et en présence de
lumière (IPCS, 1998).
- Toxicité aiguë
La toxicité aiguë est évaluée par une brève exposition d’un organisme à une substance
chimique à forte dose. Ces tests permettent d’établir des valeurs de CL50 (concentration
létale). La CL50 est la concentration d'une substance déduite statistiquement qui devrait
provoquer au cours d'une exposition ou, après celle-ci, pendant une période définie, la mort
de 50% des animaux exposés pendant une durée déterminée. La toxicité aiguë des HAP est
faible à modérée (valeur de CL50). Différentes études réalisées sur des poissons montrent une
toxicité plus forte des HAP de haut poids moléculaire (Oris et Giesy, 1987). Ainsi des tests
réalisés sur Pimephales promelas (cyprinidé, poisson d’eau douce) ont montré des valeurs de
CL50 de 7900 μg.L-1 pour le Nap et de 1,8 μg.L-1 pour le B[a]A. De plus, il a été observé que
la toxicité aiguë des HAP variait peu d’une espèce de poisson à une autre (Fragoso et al.,
2006 ; Kennedy et Farrell, 2005 ; Wernersson, 2003).
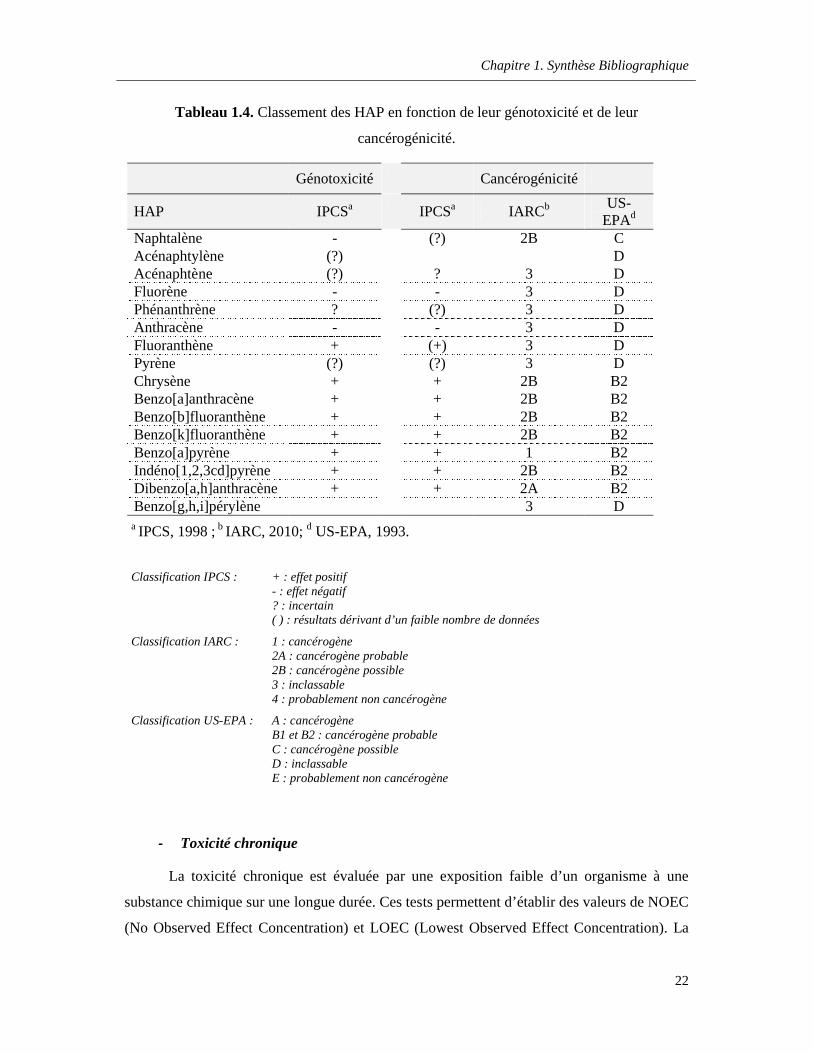
Chapitre 1. Synthèse Bibliographique
22
Tableau 1.4. Classement des HAP en fonction de leur génotoxicité et de leur
cancérogénicité.
Génotoxicité Cancérogénicité
HAP IPCSa IPCSa IARCb US-EPAd
Naphtalène - (?) 2B CAcénaphtylène (?) DAcénaphtène (?) ? 3 DFluorène - - 3 DPhénanthrène ? (?) 3 DAnthracène - - 3 DFluoranthène + (+) 3 DPyrène (?) (?) 3 DChrysène + + 2B B2Benzo[a]anthracène + + 2B B2Benzo[b]fluoranthène + + 2B B2Benzo[k]fluoranthène + + 2B B2Benzo[a]pyrène + + 1 B2Indéno[1,2,3cd]pyrène + + 2B B2Dibenzo[a,h]anthracène + + 2A B2Benzo[g,h,i]pérylène 3 D
a IPCS, 1998 ; b IARC, 2010; d US-EPA, 1993.
Classification IPCS : + : effet positif- : effet négatif? : incertain( ) : résultats dérivant d’un faible nombre de données
Classification IARC : 1 : cancérogène 2A : cancérogène probable 2B : cancérogène possible 3 : inclassable4 : probablement non cancérogène
Classification US-EPA : A : cancérogène B1 et B2 : cancérogène probable C : cancérogène possible D : inclassableE : probablement non cancérogène
- Toxicité chronique
La toxicité chronique est évaluée par une exposition faible d’un organisme à une
substance chimique sur une longue durée. Ces tests permettent d’établir des valeurs de NOEC
(No Observed Effect Concentration) et LOEC (Lowest Observed Effect Concentration). La
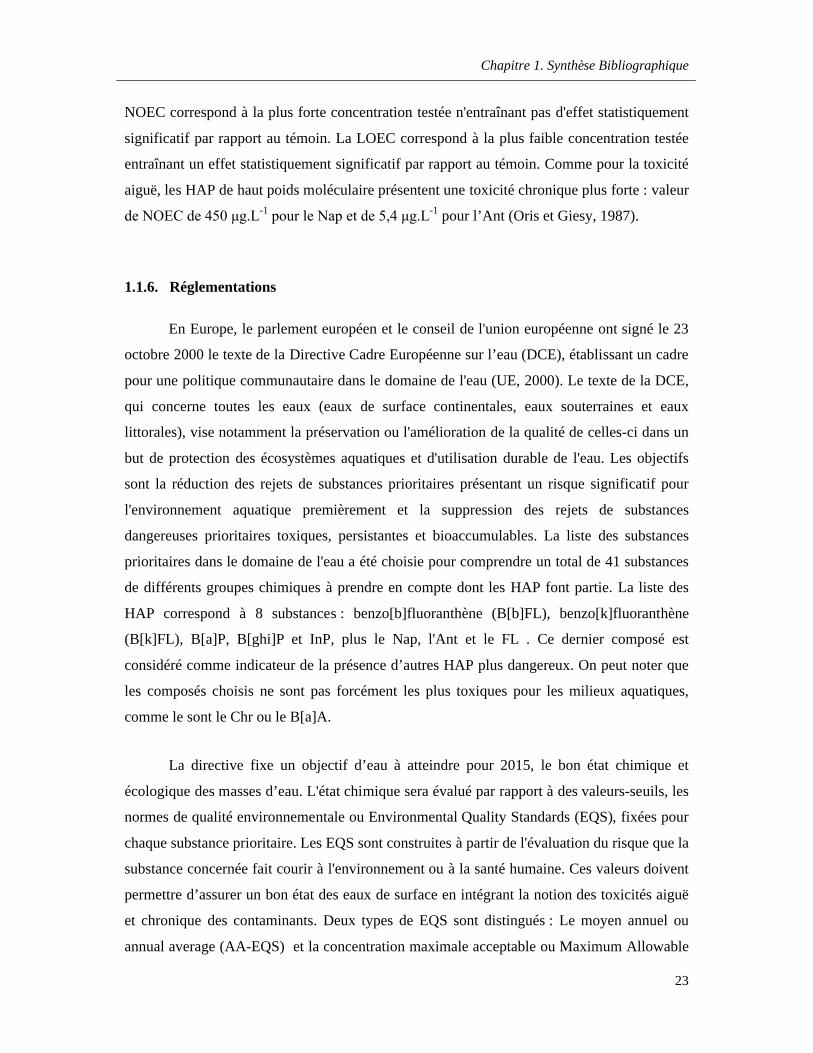
Chapitre 1. Synthèse Bibliographique
23
NOEC correspond à la plus forte concentration testée n'entraînant pas d'effet statistiquement
significatif par rapport au témoin. La LOEC correspond à la plus faible concentration testée
entraînant un effet statistiquement significatif par rapport au témoin. Comme pour la toxicité
aiguë, les HAP de haut poids moléculaire présentent une toxicité chronique plus forte : valeur
de NOEC de 450 μg.L-1 pour le Nap et de 5,4 μg.L-1 pour l’Ant (Oris et Giesy, 1987).
1.1.6. Réglementations
En Europe, le parlement européen et le conseil de l'union européenne ont signé le 23
octobre 2000 le texte de la Directive Cadre Européenne sur l’eau (DCE), établissant un cadre
pour une politique communautaire dans le domaine de l'eau (UE, 2000). Le texte de la DCE,
qui concerne toutes les eaux (eaux de surface continentales, eaux souterraines et eaux
littorales), vise notamment la préservation ou l'amélioration de la qualité de celles-ci dans un
but de protection des écosystèmes aquatiques et d'utilisation durable de l'eau. Les objectifs
sont la réduction des rejets de substances prioritaires présentant un risque significatif pour
l'environnement aquatique premièrement et la suppression des rejets de substances
dangereuses prioritaires toxiques, persistantes et bioaccumulables. La liste des substances
prioritaires dans le domaine de l'eau a été choisie pour comprendre un total de 41 substances
de différents groupes chimiques à prendre en compte dont les HAP font partie. La liste des
HAP correspond à 8 substances : benzo[b]fluoranthène (B[b]FL), benzo[k]fluoranthène
(B[k]FL), B[a]P, B[ghi]P et InP, plus le Nap, l'Ant et le FL . Ce dernier composé est
considéré comme indicateur de la présence d’autres HAP plus dangereux. On peut noter que
les composés choisis ne sont pas forcément les plus toxiques pour les milieux aquatiques,
comme le sont le Chr ou le B[a]A.
La directive fixe un objectif d’eau à atteindre pour 2015, le bon état chimique et
écologique des masses d’eau. L'état chimique sera évalué par rapport à des valeurs-seuils, les
normes de qualité environnementale ou Environmental Quality Standards (EQS), fixées pour
chaque substance prioritaire. Les EQS sont construites à partir de l'évaluation du risque que la
substance concernée fait courir à l'environnement ou à la santé humaine. Ces valeurs doivent
permettre d’assurer un bon état des eaux de surface en intégrant la notion des toxicités aiguë
et chronique des contaminants. Deux types de EQS sont distingués : Le moyen annuel ou
annual average (AA-EQS) et la concentration maximale acceptable ou Maximum Allowable
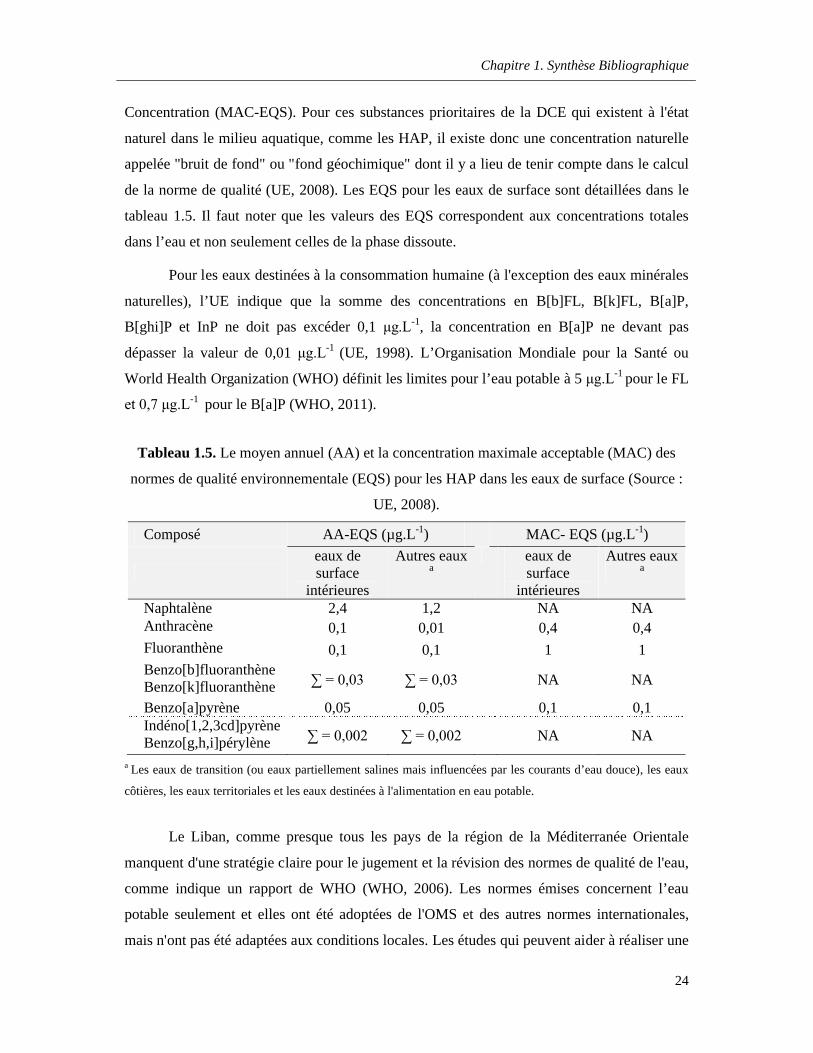
Chapitre 1. Synthèse Bibliographique
24
Concentration (MAC-EQS). Pour ces substances prioritaires de la DCE qui existent à l'état
naturel dans le milieu aquatique, comme les HAP, il existe donc une concentration naturelle
appelée "bruit de fond" ou "fond géochimique" dont il y a lieu de tenir compte dans le calcul
de la norme de qualité (UE, 2008). Les EQS pour les eaux de surface sont détaillées dans le
tableau 1.5. Il faut noter que les valeurs des EQS correspondent aux concentrations totales
dans l’eau et non seulement celles de la phase dissoute.
Pour les eaux destinées à la consommation humaine (à l'exception des eaux minérales
naturelles), l’UE indique que la somme des concentrations en B[b]FL, B[k]FL, B[a]P,
B[ghi]P et InP ne doit pas excéder 0,1 μg.L-1, la concentration en B[a]P ne devant pas
dépasser la valeur de 0,01 μg.L-1 (UE, 1998). L’Organisation Mondiale pour la Santé ou
World Health Organization (WHO) définit les limites pour l’eau potable à 5 μg.L-1 pour le FL
et 0,7 μg.L-1 pour le B[a]P (WHO, 2011).
Tableau 1.5. Le moyen annuel (AA) et la concentration maximale acceptable (MAC) des
normes de qualité environnementale (EQS) pour les HAP dans les eaux de surface (Source :
UE, 2008).
Composé AA-EQS (µg.L-1) MAC- EQS (µg.L-1)
eaux de surface
intérieures
Autres eauxa
eaux de surface
intérieures
Autres eauxa
Naphtalène 2,4 1,2 NA NAAnthracène 0,1 0,01 0,4 0,4Fluoranthène 0,1 0,1 1 1Benzo[b]fluoranthèneBenzo[k]fluoranthène ∑ = 0,03 ∑ = 0,03 NA NA
Benzo[a]pyrène 0,05 0,05 0,1 0,1Indéno[1,2,3cd]pyrène Benzo[g,h,i]pérylène ∑ = 0,002 ∑ = 0,002 NA NA
a Les eaux de transition (ou eaux partiellement salines mais influencées par les courants d’eau douce), les eaux
côtières, les eaux territoriales et les eaux destinées à l'alimentation en eau potable.
Le Liban, comme presque tous les pays de la région de la Méditerranée Orientale
manquent d'une stratégie claire pour le jugement et la révision des normes de qualité de l'eau,
comme indique un rapport de WHO (WHO, 2006). Les normes émises concernent l’eau
potable seulement et elles ont été adoptées de l'OMS et des autres normes internationales,
mais n'ont pas été adaptées aux conditions locales. Les études qui peuvent aider à réaliser une
Chapitre 1. Synthèse Bibliographique
25
adaptation plus rationnelle et déterminer les normes convenables sont pratiquement
inexistantes. En 1996, le Ministère de l’Environnement libanais (MoE) a adopté un décret
(No.52/1) établissant les normes pour la minimisation de la pollution de l'air, l'eau et du sol
(MoE, 1996). Les limites sont fixées pour plusieurs substances chimiques définies comme
prioritaires et les valeurs seuils ont été adoptées de la directive de l'OMS pour l’eau potable.
Pourtant, la norme libanaise a exclu les HAP et même le B[a]P.
1.2. Les pesticides
1.2.1. Définition et Classification
Les pesticides ou produits phytosanitaires, sont définis comme des substances dont les
propriétés chimiques contribuent à la protection des plantes cultivées et des produits récoltés
des attaques de champignons, parasites, d’insectes, d’acariens, de rongeurs champêtres ou
encore à détruire les adventices ou « mauvaises herbes ». Ils révèlent de la directive
91/414/CE (UE, 1991). Ce sont des formulations contenant une ou plusieurs substances
chimiques minérales ou organiques, synthétiques ou naturelles. Les formulations sont en
général composées d’une ou de plusieurs substances actives et d’un ou de plusieurs
adjuvants. La substance active exerce une action générale ou spécifique sur les organismes
nuisibles ou sur les végétaux ; c’est elle qui confère au produit l’effet désiré. L’adjuvant
quant à lui est une substance dépourvue d’activité biologique jugée suffisante dans la pratique
mais capable de modifier les propriétés physiques, chimiques ou biologiques des produits
phytosanitaires. Il renforce l’efficacité, la sécurité du produit et sa facilité d’utilisation
(Couteux et Lejeune, 2006).
Avant la mise en œuvre de la Directive 91/414/CE, 800 substances actives d’origine
végétale, minérale ou de synthèse pouvaient être utilisées en tant que pesticides en Europe
(UE, 1991). La révision des substances actives se traduit par un retrait progressif de
nombreux produits et la plupart de celles utilisées aujourd’hui sont de nature organique dont
un petit nombre est extrait ou dérivé des plantes. En 2005, 489 substances actives,
appartenant à environ 150 familles chimiques différentes, sont encore disponibles et se
répartissent en fonction de leurs usages. Ces substances actives sont formulées et
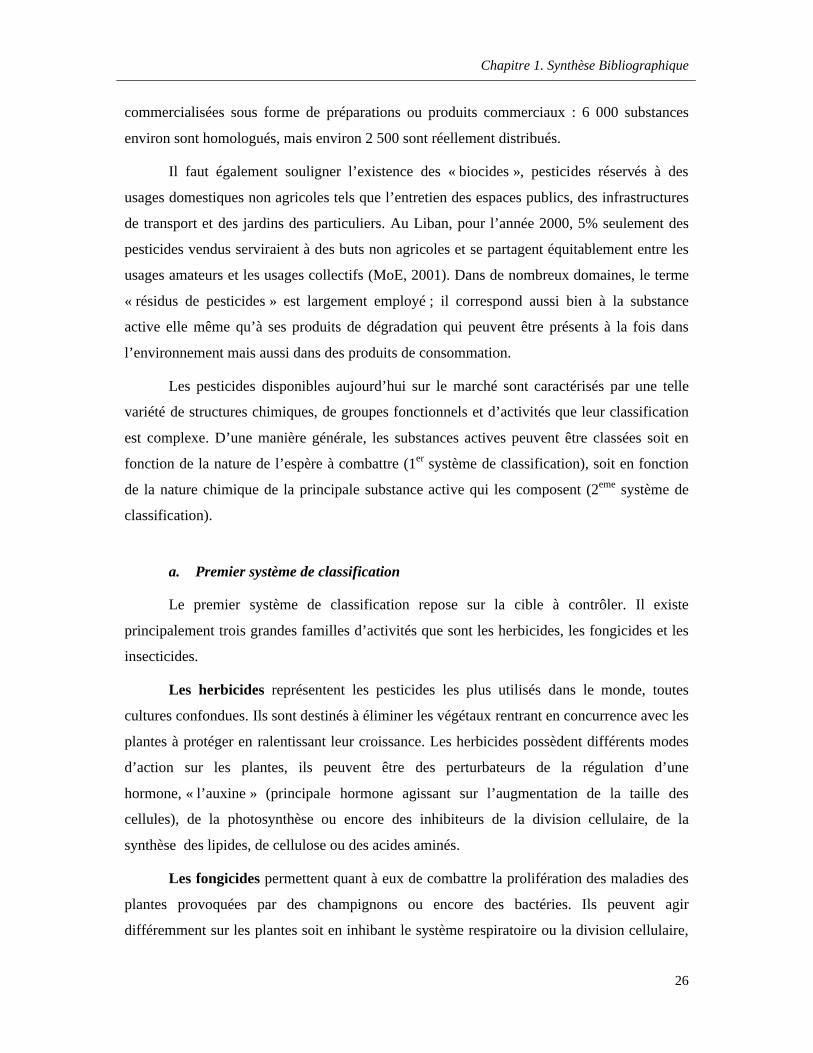
Chapitre 1. Synthèse Bibliographique
26
commercialisées sous forme de préparations ou produits commerciaux : 6 000 substances
environ sont homologués, mais environ 2 500 sont réellement distribués.
Il faut également souligner l’existence des « biocides », pesticides réservés à des
usages domestiques non agricoles tels que l’entretien des espaces publics, des infrastructures
de transport et des jardins des particuliers. Au Liban, pour l’année 2000, 5% seulement des
pesticides vendus serviraient à des buts non agricoles et se partagent équitablement entre les
usages amateurs et les usages collectifs (MoE, 2001). Dans de nombreux domaines, le terme
« résidus de pesticides » est largement employé ; il correspond aussi bien à la substance
active elle même qu’à ses produits de dégradation qui peuvent être présents à la fois dans
l’environnement mais aussi dans des produits de consommation.
Les pesticides disponibles aujourd’hui sur le marché sont caractérisés par une telle
variété de structures chimiques, de groupes fonctionnels et d’activités que leur classification
est complexe. D’une manière générale, les substances actives peuvent être classées soit en
fonction de la nature de l’espère à combattre (1er système de classification), soit en fonction
de la nature chimique de la principale substance active qui les composent (2eme système de
classification).
a. Premier système de classification
Le premier système de classification repose sur la cible à contrôler. Il existe
principalement trois grandes familles d’activités que sont les herbicides, les fongicides et les
insecticides.
Les herbicides représentent les pesticides les plus utilisés dans le monde, toutes
cultures confondues. Ils sont destinés à éliminer les végétaux rentrant en concurrence avec les
plantes à protéger en ralentissant leur croissance. Les herbicides possèdent différents modes
d’action sur les plantes, ils peuvent être des perturbateurs de la régulation d’une
hormone, « l’auxine » (principale hormone agissant sur l’augmentation de la taille des
cellules), de la photosynthèse ou encore des inhibiteurs de la division cellulaire, de la
synthèse des lipides, de cellulose ou des acides aminés.
Les fongicides permettent quant à eux de combattre la prolifération des maladies des
plantes provoquées par des champignons ou encore des bactéries. Ils peuvent agir
différemment sur les plantes soit en inhibant le système respiratoire ou la division cellulaire,
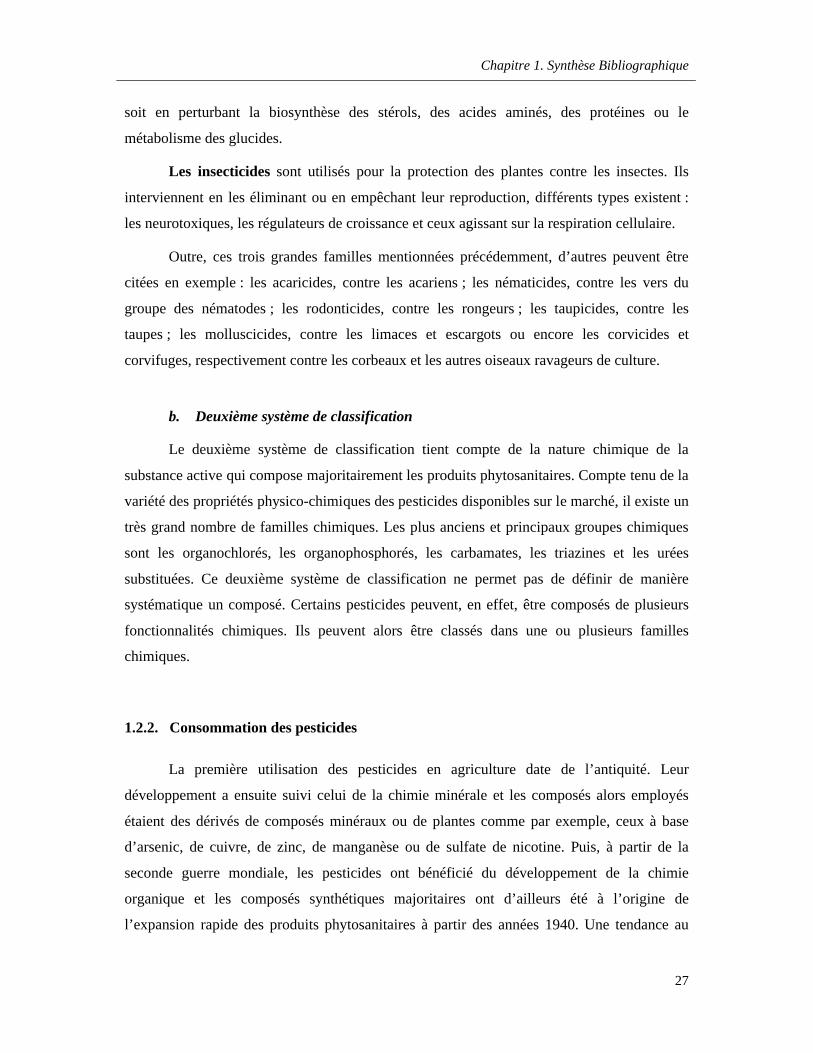
Chapitre 1. Synthèse Bibliographique
27
soit en perturbant la biosynthèse des stérols, des acides aminés, des protéines ou le
métabolisme des glucides.
Les insecticides sont utilisés pour la protection des plantes contre les insectes. Ils
interviennent en les éliminant ou en empêchant leur reproduction, différents types existent :
les neurotoxiques, les régulateurs de croissance et ceux agissant sur la respiration cellulaire.
Outre, ces trois grandes familles mentionnées précédemment, d’autres peuvent être
citées en exemple : les acaricides, contre les acariens ; les nématicides, contre les vers du
groupe des nématodes ; les rodonticides, contre les rongeurs ; les taupicides, contre les
taupes ; les molluscicides, contre les limaces et escargots ou encore les corvicides et
corvifuges, respectivement contre les corbeaux et les autres oiseaux ravageurs de culture.
b. Deuxième système de classification
Le deuxième système de classification tient compte de la nature chimique de la
substance active qui compose majoritairement les produits phytosanitaires. Compte tenu de la
variété des propriétés physico-chimiques des pesticides disponibles sur le marché, il existe un
très grand nombre de familles chimiques. Les plus anciens et principaux groupes chimiques
sont les organochlorés, les organophosphorés, les carbamates, les triazines et les urées
substituées. Ce deuxième système de classification ne permet pas de définir de manière
systématique un composé. Certains pesticides peuvent, en effet, être composés de plusieurs
fonctionnalités chimiques. Ils peuvent alors être classés dans une ou plusieurs familles
chimiques.
1.2.2. Consommation des pesticides
La première utilisation des pesticides en agriculture date de l’antiquité. Leur
développement a ensuite suivi celui de la chimie minérale et les composés alors employés
étaient des dérivés de composés minéraux ou de plantes comme par exemple, ceux à base
d’arsenic, de cuivre, de zinc, de manganèse ou de sulfate de nicotine. Puis, à partir de la
seconde guerre mondiale, les pesticides ont bénéficié du développement de la chimie
organique et les composés synthétiques majoritaires ont d’ailleurs été à l’origine de
l’expansion rapide des produits phytosanitaires à partir des années 1940. Une tendance au
Chapitre 1. Synthèse Bibliographique
28
ralentissement s’est observée depuis les années 80, liée en partie à la découverte de
substances plus actives nécessitant des tonnages plus faibles et aussi à cause des graves
problèmes écologiques et toxicologiques, soulevés par certaines de ces substances (Figure
1.7).
Aujourd’hui, le marché mondial des pesticides représentait plus de 37 milliards de
dollars en 2009 d’après l’Union des Industries de la Protection des Plantes (UIPP, 2009). En
particulier, l’Europe et les États Unis sont respectivement le premier et deuxième
consommateur mondial (Figure 1.8). Concernant la nature des pesticides, les herbicides sont
les pesticides les plus utilisés sur l’ensemble des cultures du monde (≈ 46% du marché),
suivis par les fongicides (26%) et les insecticides (25%) (Figure 1.8). La disposition
géographique joue un rôle important. En effet, les herbicides représentent 70 à 80% des
pesticides utilisés en Europe et États-Unis, alors que sous les tropiques, 50% des produits
utilisés sont des insecticides. Au niveau de la répartition des traitements sur les cultures, la
production de fruits et légumes (en incluant la vigne) représente un quart de la consommation
des traitements réalisés (Morin, 2002).
Au Liban, une exploitation des chiffres de la banque de données «FAOSTAT»
(www.faostat.fao.org) de l’Organisation des Nations Unies pour l’Alimentation et
l’Agriculture FAO (Food and Agriculture Organisation of the United Nations) sur les
importations de pesticides fournit un premier niveau d’appréhension des pratiques
d’utilisation des produits phytosanitaires au Liban et de leur évolution. La Figure 1.9 montre
l’évolution des ventes de matières actives phytosanitaires au Liban, de 1985 à 2008. Après
une augmentation lente et régulière depuis 1985, les importations de substances actives
phytosanitaires amorcent une diminution à partir de 1997 : les valeurs totales passent de 29
millions en 1997 à 20 millions de $ en 2001, soit une baisse globale de 30% sur le total des
pesticides. Cette diminution de consommation concerne surtout les insecticides avec une
diminution de 24%. Cette tendance à première vue encourageante est cependant à nuancer par
l’apparition de nouvelles molécules s’utilisant à de très faibles doses par hectare et la
limitation d’usage des substances actives dont la dose d'emploi homologuée est élevée. Les
importations ont d'ailleurs remonté depuis 2001 pour se doubler en 2008 avec un creus en
2006, conséquence du conflit israélo-libanais pendant le mois de juillet.
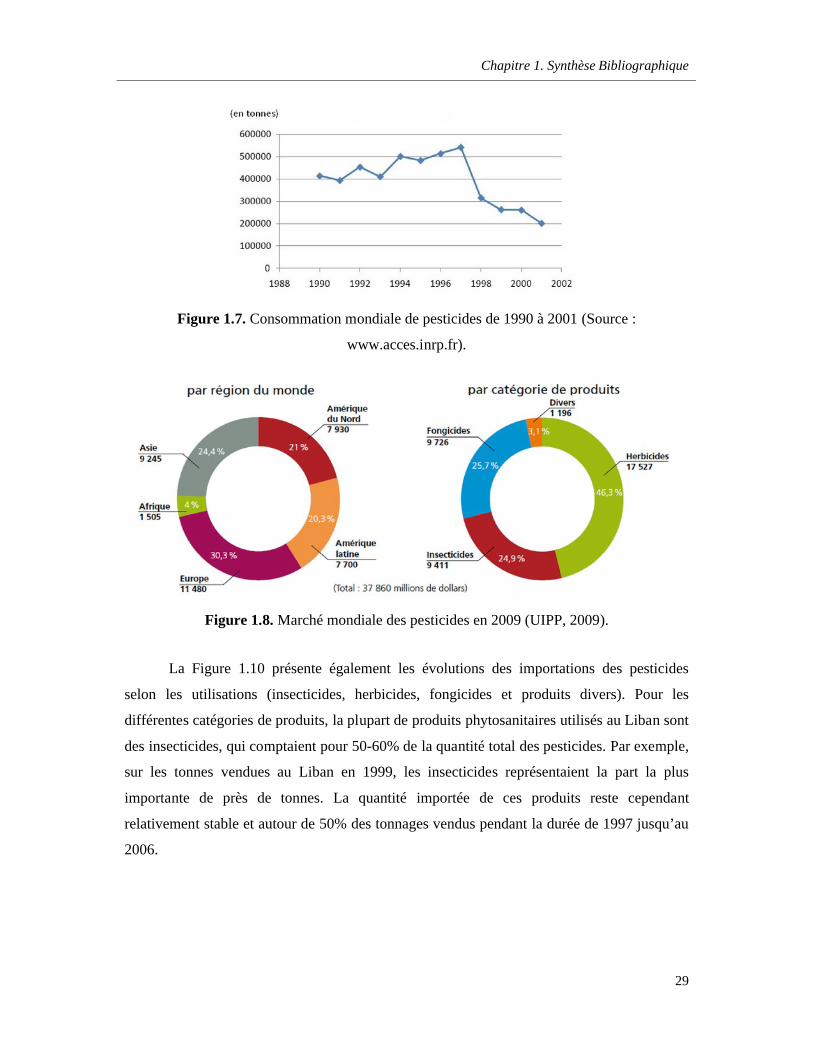
Chapitre 1. Synthèse Bibliographique
29
Figure 1.7. Consommation mondiale de pesticides de 1990 à 2001 (Source :
www.acces.inrp.fr).
Figure 1.8. Marché mondiale des pesticides en 2009 (UIPP, 2009).
La Figure 1.10 présente également les évolutions des importations des pesticides
selon les utilisations (insecticides, herbicides, fongicides et produits divers). Pour les
différentes catégories de produits, la plupart de produits phytosanitaires utilisés au Liban sont
des insecticides, qui comptaient pour 50-60% de la quantité total des pesticides. Par exemple,
sur les tonnes vendues au Liban en 1999, les insecticides représentaient la part la plus
importante de près de tonnes. La quantité importée de ces produits reste cependant
relativement stable et autour de 50% des tonnages vendus pendant la durée de 1997 jusqu’au
2006.
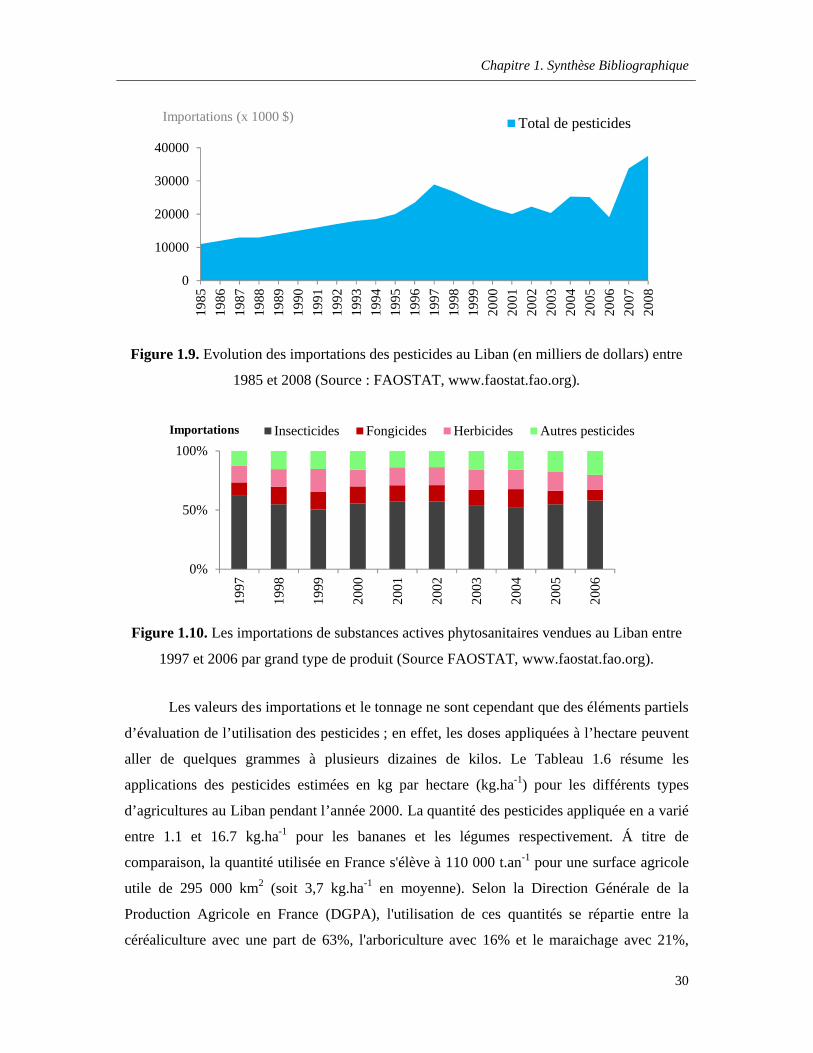
Chapitre 1. Synthèse Bibliographique
30
Figure 1.9. Evolution des importations des pesticides au Liban (en milliers de dollars) entre
1985 et 2008 (Source : FAOSTAT, www.faostat.fao.org).
Figure 1.10. Les importations de substances actives phytosanitaires vendues au Liban entre
1997 et 2006 par grand type de produit (Source FAOSTAT, www.faostat.fao.org).
Les valeurs des importations et le tonnage ne sont cependant que des éléments partiels
d’évaluation de l’utilisation des pesticides ; en effet, les doses appliquées à l’hectare peuvent
aller de quelques grammes à plusieurs dizaines de kilos. Le Tableau 1.6 résume les
applications des pesticides estimées en kg par hectare (kg.ha-1) pour les différents types
d’agricultures au Liban pendant l’année 2000. La quantité des pesticides appliquée en a varié
entre 1.1 et 16.7 kg.ha-1 pour les bananes et les légumes respectivement. Á titre de
comparaison, la quantité utilisée en France s'élève à 110 000 t.an-1 pour une surface agricole
utile de 295 000 km2 (soit 3,7 kg.ha-1 en moyenne). Selon la Direction Générale de la
Production Agricole en France (DGPA), l'utilisation de ces quantités se répartie entre la
céréaliculture avec une part de 63%, l'arboriculture avec 16% et le maraichage avec 21%,
1985
1986
1987
1988
1989
1990
1991
1992
1993
1994
1995
1996
1997
1998
1999
2000
2001
2002
2003
2004
2005
2006
2007
2008
0
10000
20000
30000
40000
Total de pesticidesImportations (x 1000 $)
0%
50%
100%
1997
1998
1999
2000
2001
2002
2003
2004
2005
2006
Importations Insecticides Fongicides Herbicides Autres pesticides
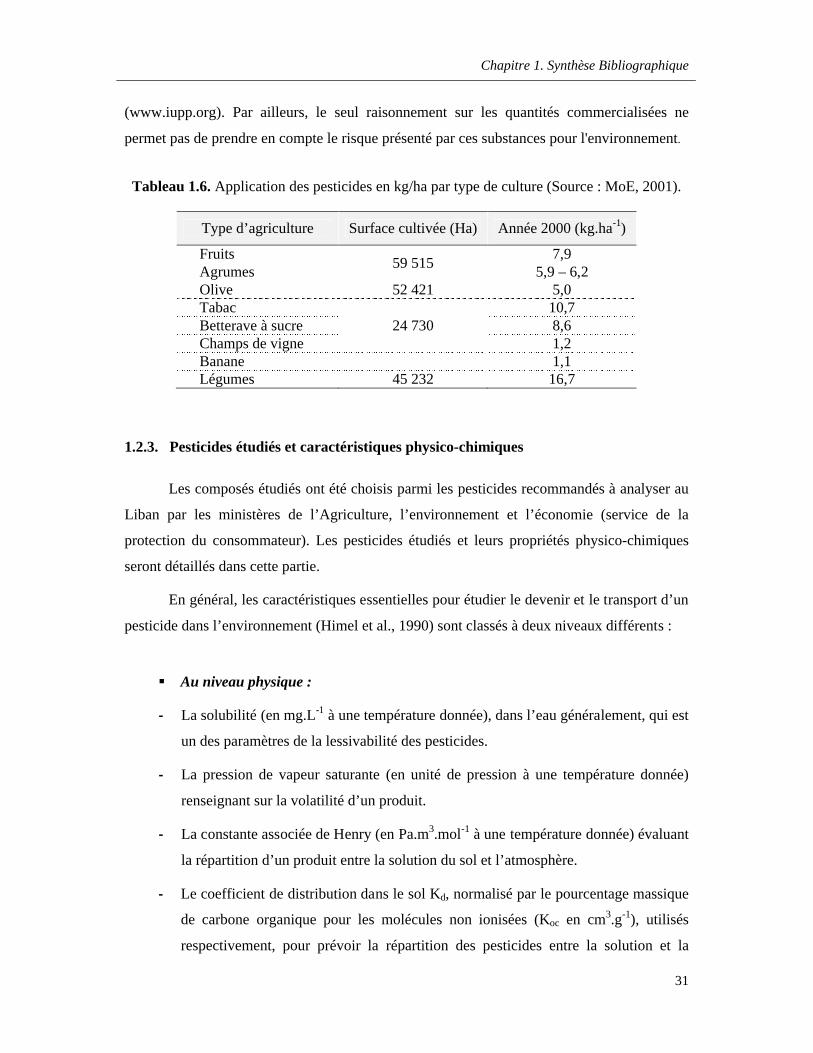
Chapitre 1. Synthèse Bibliographique
31
(www.iupp.org). Par ailleurs, le seul raisonnement sur les quantités commercialisées ne
permet pas de prendre en compte le risque présenté par ces substances pour l'environnement.
Tableau 1.6. Application des pesticides en kg/ha par type de culture (Source : MoE, 2001).
Type d’agriculture Surface cultivée (Ha) Année 2000 (kg.ha-1)
Fruits59 515
7,9Agrumes 5,9 – 6,2Olive 52 421 5,0Tabac
24 73010,7
Betterave à sucre 8,6Champs de vigne 1,2Banane 1,1Légumes 45 232 16,7
1.2.3. Pesticides étudiés et caractéristiques physico-chimiques
Les composés étudiés ont été choisis parmi les pesticides recommandés à analyser au
Liban par les ministères de l’Agriculture, l’environnement et l’économie (service de la
protection du consommateur). Les pesticides étudiés et leurs propriétés physico-chimiques
seront détaillés dans cette partie.
En général, les caractéristiques essentielles pour étudier le devenir et le transport d’un
pesticide dans l’environnement (Himel et al., 1990) sont classés à deux niveaux différents :
Au niveau physique :
- La solubilité (en mg.L-1 à une température donnée), dans l’eau généralement, qui est
un des paramètres de la lessivabilité des pesticides.
- La pression de vapeur saturante (en unité de pression à une température donnée)
renseignant sur la volatilité d’un produit.
- La constante associée de Henry (en Pa.m3.mol-1 à une température donnée) évaluant
la répartition d’un produit entre la solution du sol et l’atmosphère.
- Le coefficient de distribution dans le sol Kd, normalisé par le pourcentage massique
de carbone organique pour les molécules non ionisées (Koc en cm3.g-1), utilisés
respectivement, pour prévoir la répartition des pesticides entre la solution et la
Chapitre 1. Synthèse Bibliographique
32
fraction organique insoluble du sol (Koc) ou simplement entre la solution et une
masse de sol (Kd), globalement il est le paramètre évaluant la capacité d’adsorption.
Au niveau chimique :
- Les états ioniques (cationique, anionique, basique ou acide).
- Les caractères hydrophiles/hydrophobes.
- La réactivité chimique, photochimique et biologique (constante de transformation
de premier ordre par exemple).
Ces propriétés, combinées avec le taux de pesticide appliqué et entrant dans
l’environnement peuvent déterminer la distribution des pesticides dans les différents
compartiments environnementaux (sol, solution du sol, air, végétaux…) et donc leur
potentialité à être transportés le long de chaque voie de transport (atmosphère, eau
superficielle…). La persistance environnementale du pesticide est également reliée aux
propriétés de celui-ci (Carsel et Smith, 1987).
Les principales caractéristiques physico-chimiques des différents composés étudiés,
appartenant aux différentes familles chimiques, sont résumées dans l’Annexe 2. Ces
informations proviennent des diverses bases de données assemblées dans le CRL Datapool
des Laboratoires de référence de l'UE pour les résidus de pesticides (www.crl-pesticides-
datapool.eu).
a. Les organochlorés (OC)
Les pesticides chlorés, aussi connus sous le nom « organochlorés », se répartissent en
trois groupes de composés. Le premier est le groupe des dichlorodiphényléthanes, dont le
plus connu est le dichlorodiphényltrichloroéthane ou DDT, et ses produits de dégradation
anaérobie DDD (dichlorodiphényldichloroéthane) et aérobie DDE
(dichlorodiphényldichloroéthylène). Le deuxième groupe est le groupe des cyclodiènes, alors
que le troisième regroupe les autres composés qui ont des structures différentes. Les
structures chimiques générales des deux premiers groupes sont données en Figure 1.11.
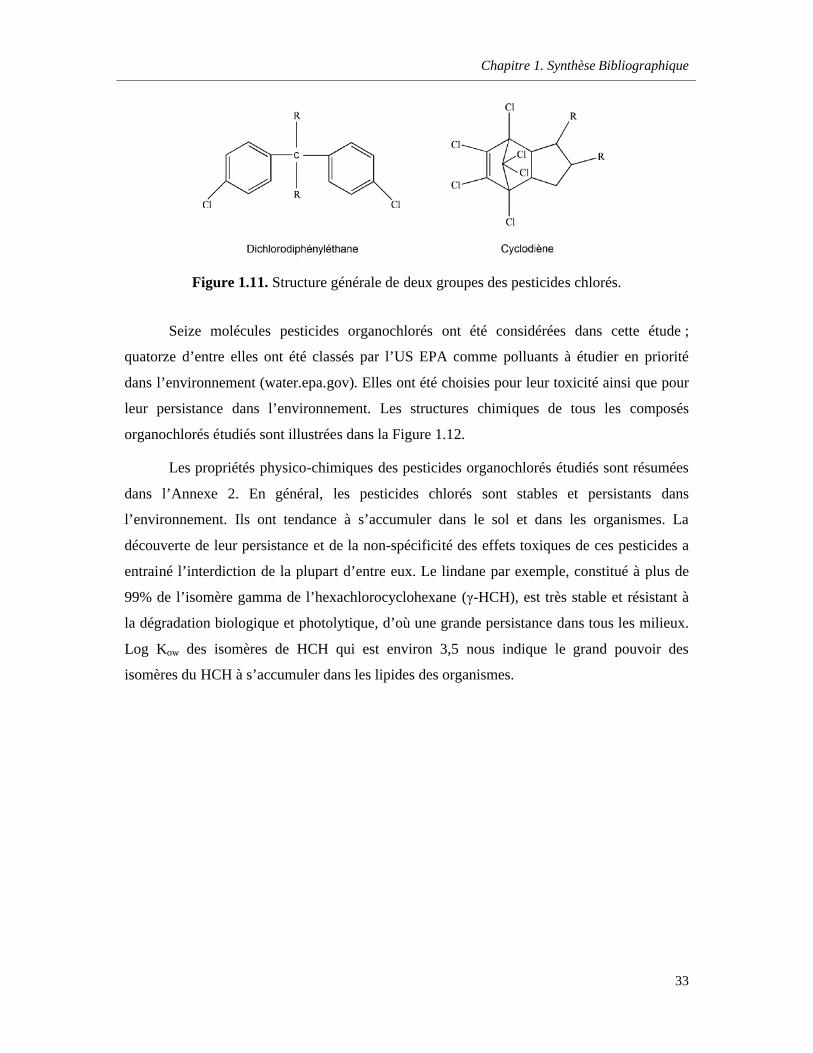
Chapitre 1. Synthèse Bibliographique
33
Figure 1.11. Structure générale de deux groupes des pesticides chlorés.
Seize molécules pesticides organochlorés ont été considérées dans cette étude ;
quatorze d’entre elles ont été classés par l’US EPA comme polluants à étudier en priorité
dans l’environnement (water.epa.gov). Elles ont été choisies pour leur toxicité ainsi que pour
leur persistance dans l’environnement. Les structures chimiques de tous les composés
organochlorés étudiés sont illustrées dans la Figure 1.12.
Les propriétés physico-chimiques des pesticides organochlorés étudiés sont résumées
dans l’Annexe 2. En général, les pesticides chlorés sont stables et persistants dans
l’environnement. Ils ont tendance à s’accumuler dans le sol et dans les organismes. La
découverte de leur persistance et de la non-spécificité des effets toxiques de ces pesticides a
entrainé l’interdiction de la plupart d’entre eux. Le lindane par exemple, constitué à plus de
99% de l’isomère gamma de l’hexachlorocyclohexane (γ-HCH), est très stable et résistant à
la dégradation biologique et photolytique, d’où une grande persistance dans tous les milieux.
Log Kow des isomères de HCH qui est environ 3,5 nous indique le grand pouvoir des
isomères du HCH à s’accumuler dans les lipides des organismes.
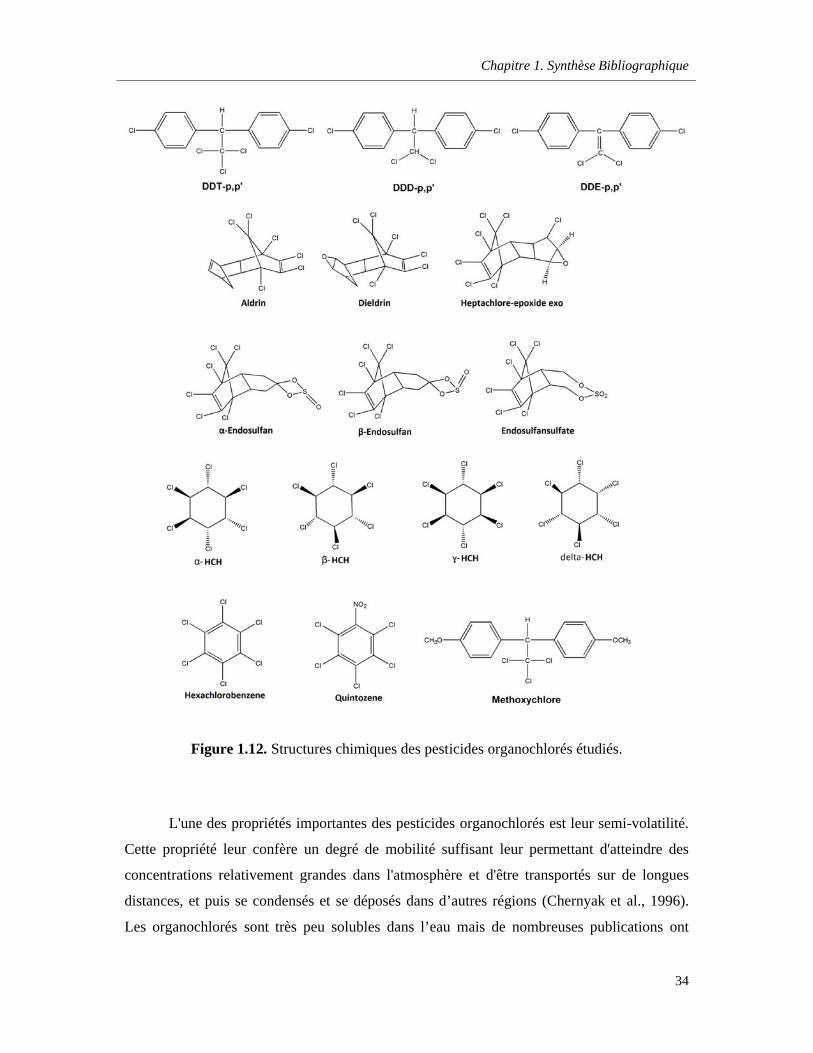
Chapitre 1. Synthèse Bibliographique
34
Figure 1.12. Structures chimiques des pesticides organochlorés étudiés.
L'une des propriétés importantes des pesticides organochlorés est leur semi-volatilité.
Cette propriété leur confère un degré de mobilité suffisant leur permettant d'atteindre des
concentrations relativement grandes dans l'atmosphère et d'être transportés sur de longues
distances, et puis se condensés et se déposés dans d’autres régions (Chernyak et al., 1996).
Les organochlorés sont très peu solubles dans l’eau mais de nombreuses publications ont
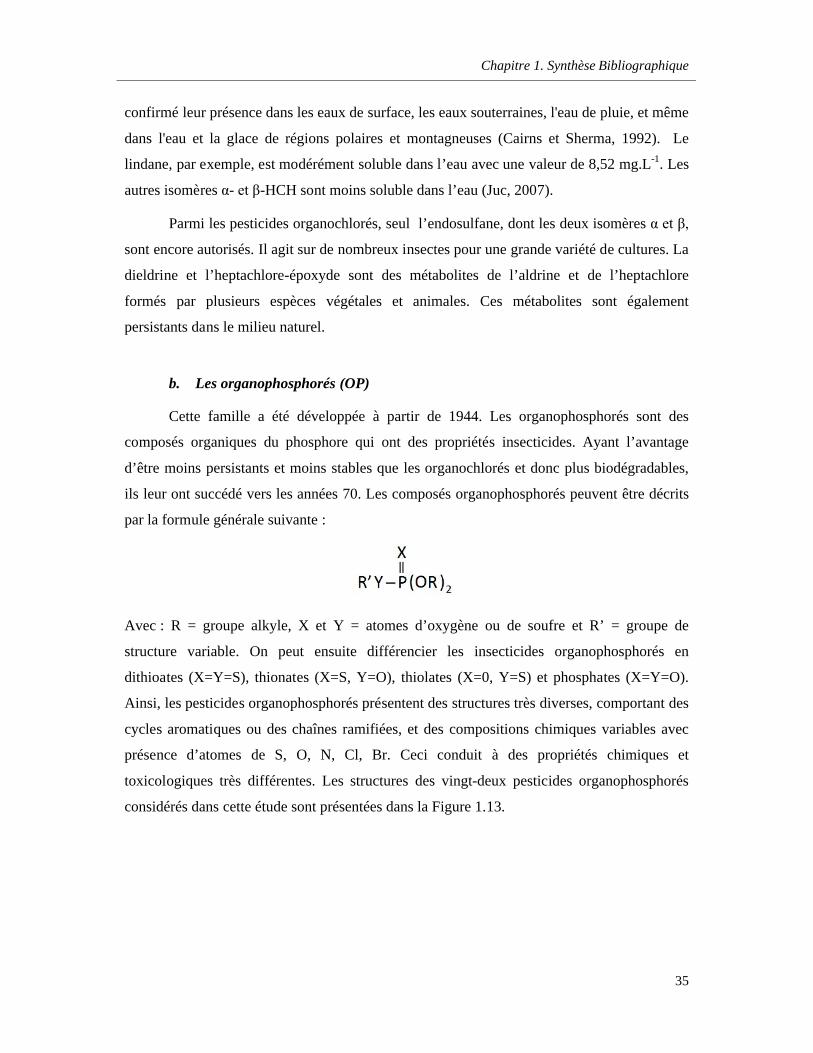
Chapitre 1. Synthèse Bibliographique
35
confirmé leur présence dans les eaux de surface, les eaux souterraines, l'eau de pluie, et même
dans l'eau et la glace de régions polaires et montagneuses (Cairns et Sherma, 1992). Le
lindane, par exemple, est modérément soluble dans l’eau avec une valeur de 8,52 mg.L-1. Les
autres isomères α- et β-HCH sont moins soluble dans l’eau (Juc, 2007).
Parmi les pesticides organochlorés, seul l’endosulfane, dont les deux isomères α et β,
sont encore autorisés. Il agit sur de nombreux insectes pour une grande variété de cultures. La
dieldrine et l’heptachlore-époxyde sont des métabolites de l’aldrine et de l’heptachlore
formés par plusieurs espèces végétales et animales. Ces métabolites sont également
persistants dans le milieu naturel.
b. Les organophosphorés (OP)
Cette famille a été développée à partir de 1944. Les organophosphorés sont des
composés organiques du phosphore qui ont des propriétés insecticides. Ayant l’avantage
d’être moins persistants et moins stables que les organochlorés et donc plus biodégradables,
ils leur ont succédé vers les années 70. Les composés organophosphorés peuvent être décrits
par la formule générale suivante :
Avec : R = groupe alkyle, X et Y = atomes d’oxygène ou de soufre et R’ = groupe de
structure variable. On peut ensuite différencier les insecticides organophosphorés en
dithioates (X=Y=S), thionates (X=S, Y=O), thiolates (X=0, Y=S) et phosphates (X=Y=O).
Ainsi, les pesticides organophosphorés présentent des structures très diverses, comportant des
cycles aromatiques ou des chaînes ramifiées, et des compositions chimiques variables avec
présence d’atomes de S, O, N, Cl, Br. Ceci conduit à des propriétés chimiques et
toxicologiques très différentes. Les structures des vingt-deux pesticides organophosphorés
considérés dans cette étude sont présentées dans la Figure 1.13.
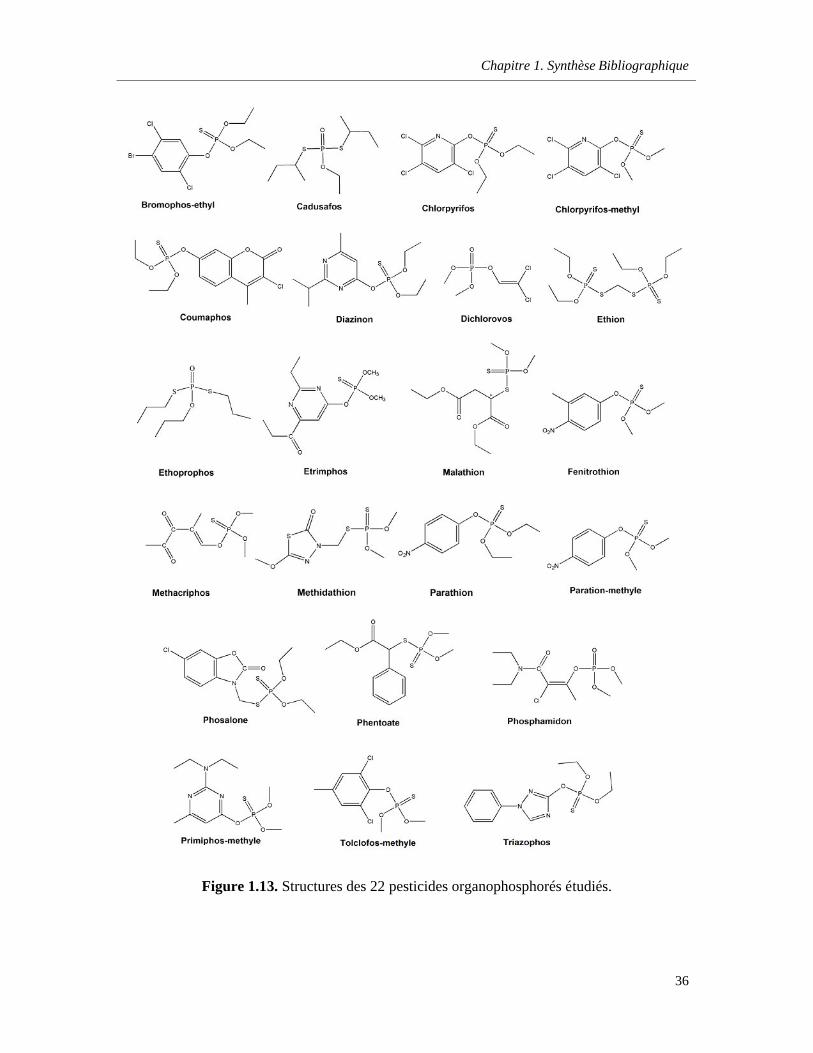
Chapitre 1. Synthèse Bibliographique
36
Figure 1.13. Structures des 22 pesticides organophosphorés étudiés.
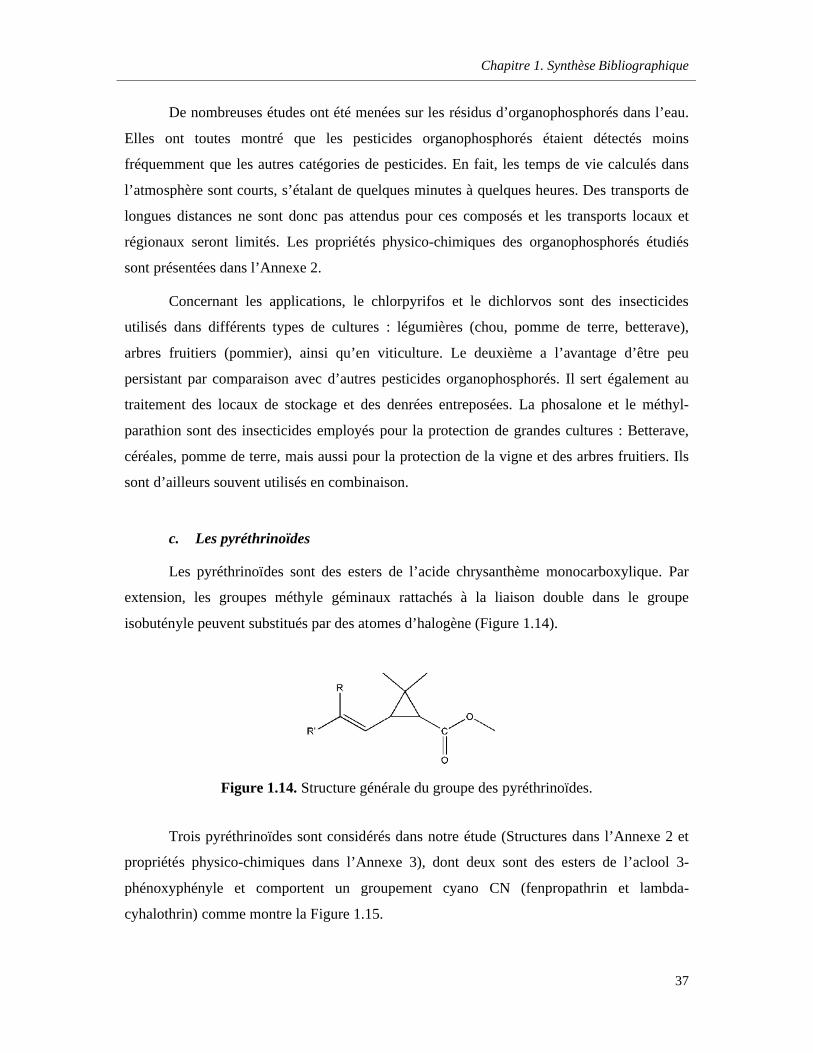
Chapitre 1. Synthèse Bibliographique
37
De nombreuses études ont été menées sur les résidus d’organophosphorés dans l’eau.
Elles ont toutes montré que les pesticides organophosphorés étaient détectés moins
fréquemment que les autres catégories de pesticides. En fait, les temps de vie calculés dans
l’atmosphère sont courts, s’étalant de quelques minutes à quelques heures. Des transports de
longues distances ne sont donc pas attendus pour ces composés et les transports locaux et
régionaux seront limités. Les propriétés physico-chimiques des organophosphorés étudiés
sont présentées dans l’Annexe 2.
Concernant les applications, le chlorpyrifos et le dichlorvos sont des insecticides
utilisés dans différents types de cultures : légumières (chou, pomme de terre, betterave),
arbres fruitiers (pommier), ainsi qu’en viticulture. Le deuxième a l’avantage d’être peu
persistant par comparaison avec d’autres pesticides organophosphorés. Il sert également au
traitement des locaux de stockage et des denrées entreposées. La phosalone et le méthyl-
parathion sont des insecticides employés pour la protection de grandes cultures : Betterave,
céréales, pomme de terre, mais aussi pour la protection de la vigne et des arbres fruitiers. Ils
sont d’ailleurs souvent utilisés en combinaison.
c. Les pyréthrinoïdes
Les pyréthrinoïdes sont des esters de l’acide chrysanthème monocarboxylique. Par
extension, les groupes méthyle géminaux rattachés à la liaison double dans le groupe
isobutényle peuvent substitués par des atomes d’halogène (Figure 1.14).
Figure 1.14. Structure générale du groupe des pyréthrinoïdes.
Trois pyréthrinoïdes sont considérés dans notre étude (Structures dans l’Annexe 2 et
propriétés physico-chimiques dans l’Annexe 3), dont deux sont des esters de l’aclool 3-
phénoxyphényle et comportent un groupement cyano CN (fenpropathrin et lambda-
cyhalothrin) comme montre la Figure 1.15.

Chapitre 1. Synthèse Bibliographique
38
Malgré leur utilisation à faible dose, les pyréthrinoïdes ont un spectre d’activité assez
large. En effet, ils sont largement utilisés dans le traitement des fruits, d’olive...Très peu
volatils et très lipophiles, les pyréthrinoïdes sont quasiment insolubles dans l’eau. Les
propriétés physico-chimiques des pyréthrinoïdes étudiés sont résumées dans l’Annexe 2.
Figure 1.15. Structures des trois pyréthrinoïdes étudiés.
d. Les carbamates
La famille de carbamates regroupe les dérivés de l’acide carbamique, habituellement
ses esters, avec la formule générale suivante :
Les carbamates sont utilisés dans le monde entier pour combattre les insectes, les
champignons, les mauvaises herbes, et en tant que régulateurs de croissance. Leur mode
d’action étant des insecticides se fait par blocage de la transmission de l’influx nerveux en
inhibant l’enzyme acétylcholinestérase. Les structures de deux carbamates étudiés, propoxur
et chlorprophame, sont présentées dans la Figure 1.16. Leurs propriétés physico-chimiques
sont résumées dans l’Annexe 2.
Parmi les carbamates étudiés, le propoxur est très soluble dans l’eau (1900 mg.L-1 à
20°C). Sa faible pression de vapeur (0,0013 Pa à 20°C) nous indique qu’il est modérément
volatil et qu’il ne devrait pas s’évaporer à partir d’un sol humide ou de l’eau. Il est
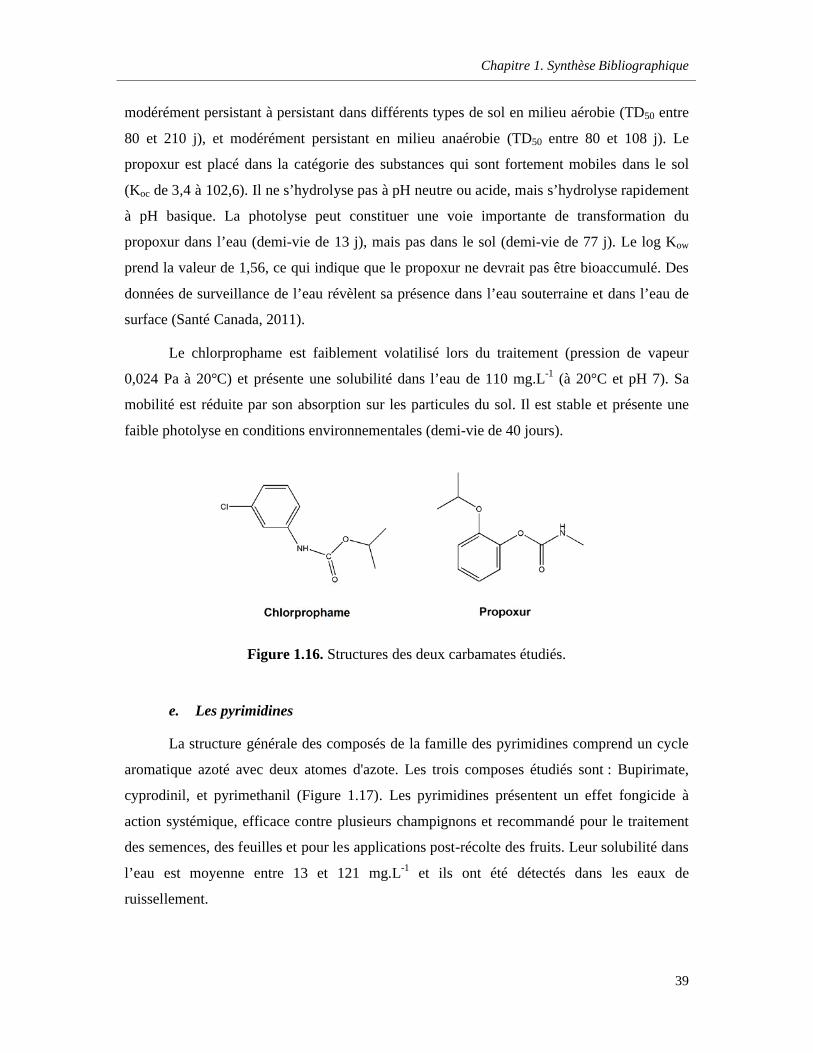
Chapitre 1. Synthèse Bibliographique
39
modérément persistant à persistant dans différents types de sol en milieu aérobie (TD50 entre
80 et 210 j), et modérément persistant en milieu anaérobie (TD50 entre 80 et 108 j). Le
propoxur est placé dans la catégorie des substances qui sont fortement mobiles dans le sol
(Koc de 3,4 à 102,6). Il ne s’hydrolyse pas à pH neutre ou acide, mais s’hydrolyse rapidement
à pH basique. La photolyse peut constituer une voie importante de transformation du
propoxur dans l’eau (demi-vie de 13 j), mais pas dans le sol (demi-vie de 77 j). Le log Kow
prend la valeur de 1,56, ce qui indique que le propoxur ne devrait pas être bioaccumulé. Des
données de surveillance de l’eau révèlent sa présence dans l’eau souterraine et dans l’eau de
surface (Santé Canada, 2011).
Le chlorprophame est faiblement volatilisé lors du traitement (pression de vapeur
0,024 Pa à 20°C) et présente une solubilité dans l’eau de 110 mg.L-1 (à 20°C et pH 7). Sa
mobilité est réduite par son absorption sur les particules du sol. Il est stable et présente une
faible photolyse en conditions environnementales (demi-vie de 40 jours).
Figure 1.16. Structures des deux carbamates étudiés.
e. Les pyrimidines
La structure générale des composés de la famille des pyrimidines comprend un cycle
aromatique azoté avec deux atomes d'azote. Les trois composes étudiés sont : Bupirimate,
cyprodinil, et pyrimethanil (Figure 1.17). Les pyrimidines présentent un effet fongicide à
action systémique, efficace contre plusieurs champignons et recommandé pour le traitement
des semences, des feuilles et pour les applications post-récolte des fruits. Leur solubilité dans
l’eau est moyenne entre 13 et 121 mg.L-1 et ils ont été détectés dans les eaux de
ruissellement.
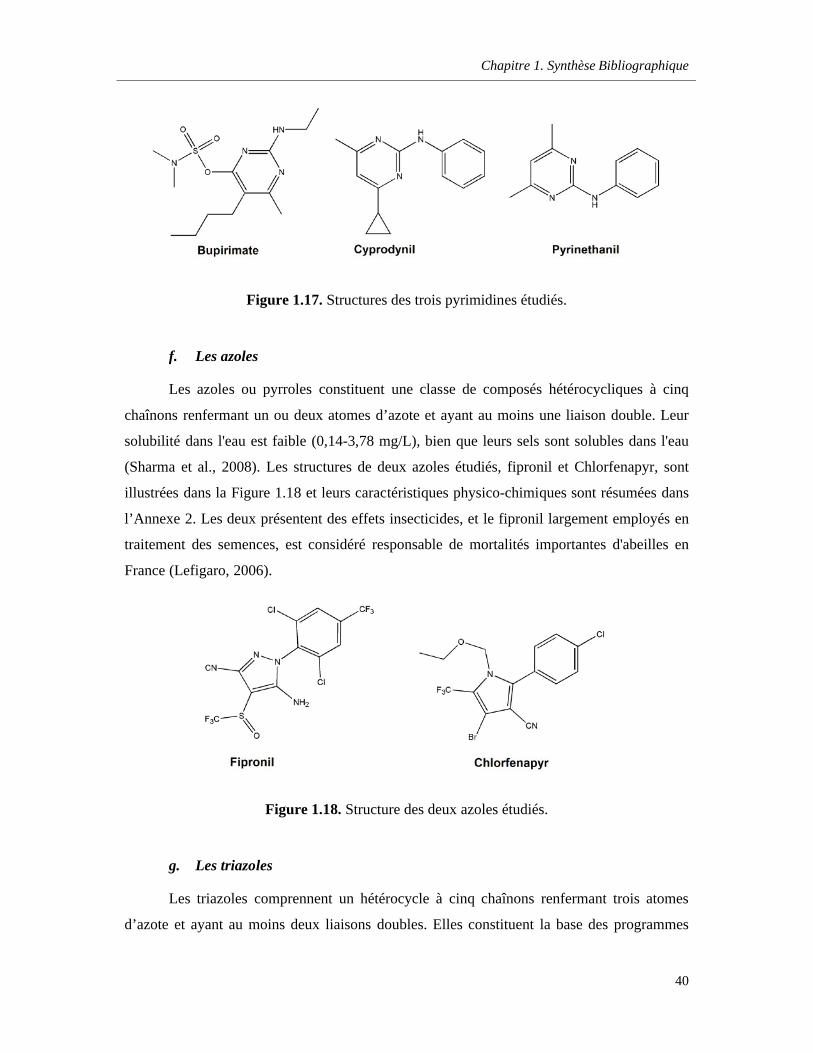
Chapitre 1. Synthèse Bibliographique
40
Figure 1.17. Structures des trois pyrimidines étudiés.
f. Les azoles
Les azoles ou pyrroles constituent une classe de composés hétérocycliques à cinq
chaînons renfermant un ou deux atomes d’azote et ayant au moins une liaison double. Leur
solubilité dans l'eau est faible (0,14-3,78 mg/L), bien que leurs sels sont solubles dans l'eau
(Sharma et al., 2008). Les structures de deux azoles étudiés, fipronil et Chlorfenapyr, sont
illustrées dans la Figure 1.18 et leurs caractéristiques physico-chimiques sont résumées dans
l’Annexe 2. Les deux présentent des effets insecticides, et le fipronil largement employés en
traitement des semences, est considéré responsable de mortalités importantes d'abeilles en
France (Lefigaro, 2006).
Figure 1.18. Structure des deux azoles étudiés.
g. Les triazoles
Les triazoles comprennent un hétérocycle à cinq chaînons renfermant trois atomes
d’azote et ayant au moins deux liaisons doubles. Elles constituent la base des programmes
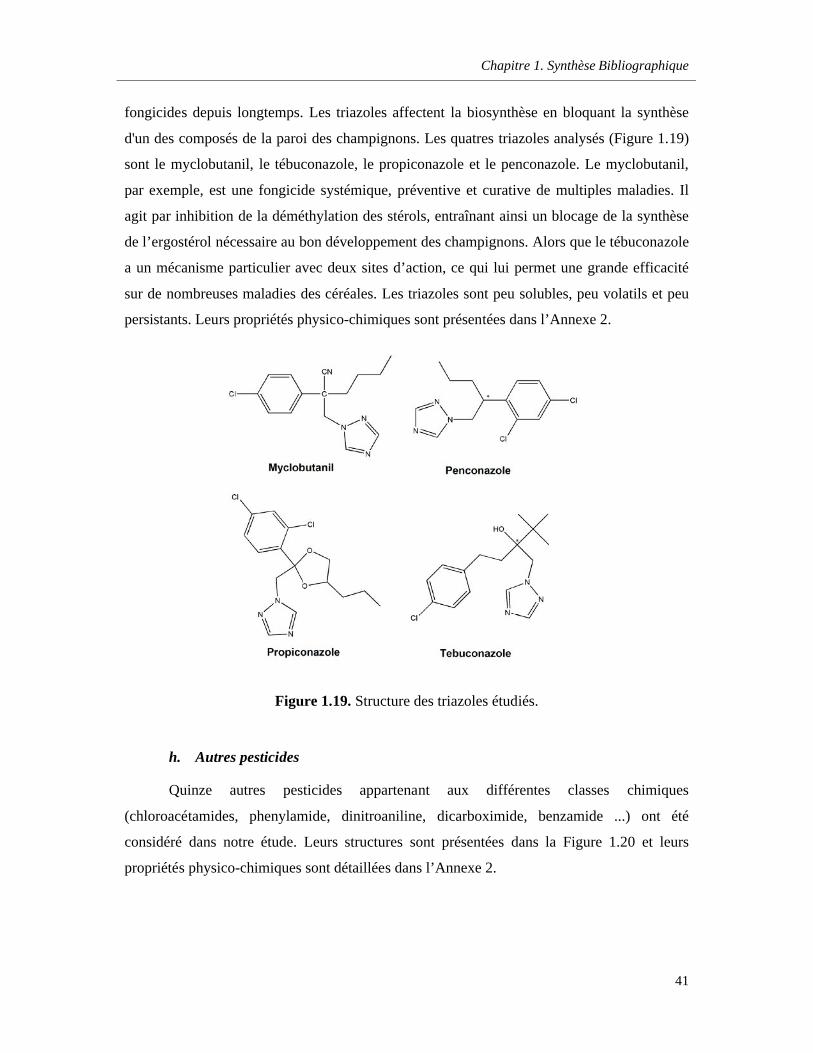
Chapitre 1. Synthèse Bibliographique
41
fongicides depuis longtemps. Les triazoles affectent la biosynthèse en bloquant la synthèse
d'un des composés de la paroi des champignons. Les quatres triazoles analysés (Figure 1.19)
sont le myclobutanil, le tébuconazole, le propiconazole et le penconazole. Le myclobutanil,
par exemple, est une fongicide systémique, préventive et curative de multiples maladies. Il
agit par inhibition de la déméthylation des stérols, entraînant ainsi un blocage de la synthèse
de l’ergostérol nécessaire au bon développement des champignons. Alors que le tébuconazole
a un mécanisme particulier avec deux sites d’action, ce qui lui permet une grande efficacité
sur de nombreuses maladies des céréales. Les triazoles sont peu solubles, peu volatils et peu
persistants. Leurs propriétés physico-chimiques sont présentées dans l’Annexe 2.
Figure 1.19. Structure des triazoles étudiés.
h. Autres pesticides
Quinze autres pesticides appartenant aux différentes classes chimiques
(chloroacétamides, phenylamide, dinitroaniline, dicarboximide, benzamide ...) ont été
considéré dans notre étude. Leurs structures sont présentées dans la Figure 1.20 et leurs
propriétés physico-chimiques sont détaillées dans l’Annexe 2.
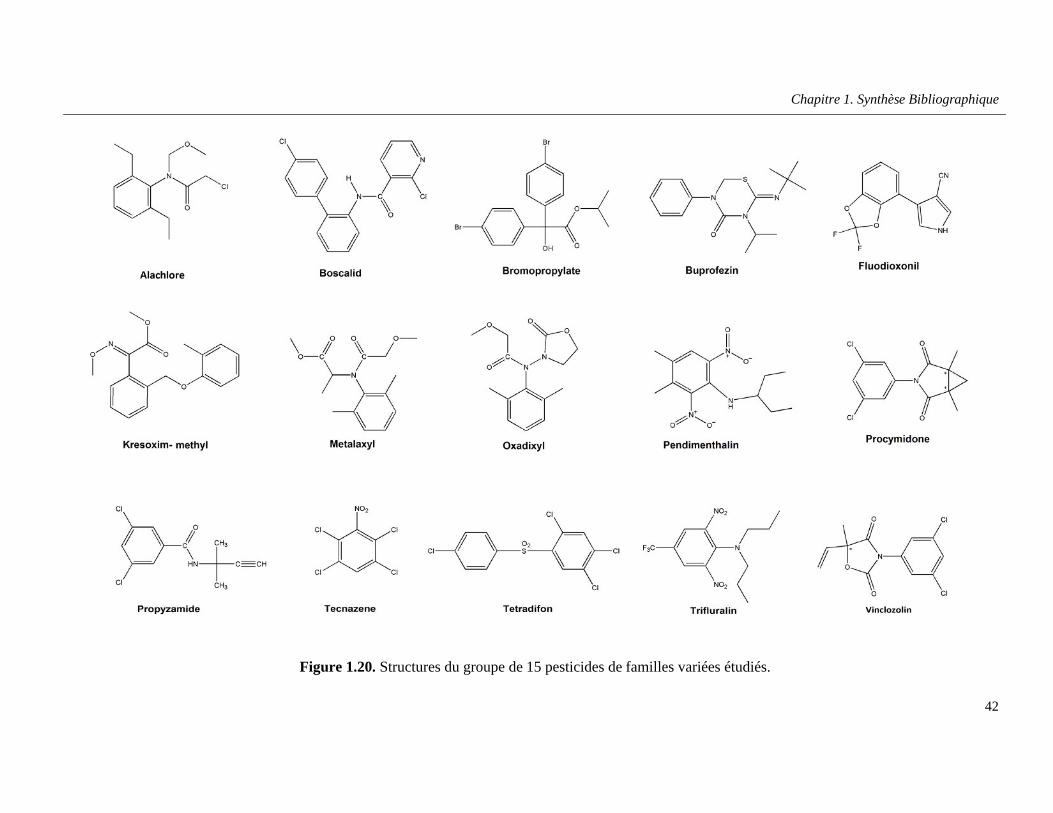
Chapitre 1. Synthèse Bibliographique
42
Figure 1.20. Structures du groupe de 15 pesticides de familles variées étudiés.
Chapitre 1. Synthèse Bibliographique
43
Parmi les pesticides plus détectés dans les eaux, figurent l’alachlore et l’oxadixyl
(IFEN, 2007). L'alachlore est un herbicide de la famille des chloroacétamides, principalement
utilisé pour le désherbage du maiis et appliqué en pré-levée ou en post-levée précoce. Il
présente un effet inhibiteur de la synthèse des lipides et il est souvent formulé en
combinaison avec l’atrazine. Les doses d’alachlore appliquées sont en moyenne de 2,5 kg/ha.
Souvent détecté dans les eaux superficielles (IFEN, 2007) du fait de sa forte solubilité (170.3
mg/L) et sa mobilité dans le sol, l’alachlore est inscrit comme substance prioritaire dans la
DCE. L’oxadixyl, agissant comme fongicide systémique, appartient à la famille des
phénylamides souvent détectés dans les eaux souterraines. En plus, il a a été mis en évidence
à de faibles teneurs dans les eaux superficielles (IFEN, 2007). Ce composé est fortement
soluble, légèrement dégradable et présente une mobilité élevée à travers le sol. L’oxadixyl est
utilisé d’habitude en association avec d'autres substances sur les vignes et ponctuellement sur
les laitues, les tomates, les pommes de terre.
1.2.4. Les pesticides dans les eaux
Malgré un souci de protection de l’environnement constant et croissant lors de
l’utilisation des pesticides, il y a toujours une forte partie qui n’atteint pas sa cible, la plante à
protéger et qui se retrouve dans les divers compartiments de l’environnement non cibles. La
dose de pesticides appliquée efficacement sur la plante à traiter est comprise entre 0 et 23%
de la quantité totale épandue, et elle peut varier suivant les propriétés physicochimiques de la
molécule et d’autres facteurs externes concernent essentiellement les pratiques culturales
(mode d’épandage) et les facteurs climatiques (Colin, 2000).
La grande part de la substance active apportée qui n’atteint pas sa cible sera alors
susceptible, à plus ou moins long terme, d’être transférée vers les eaux au terme d’un certain
nombre de processus (Figure 1.21) : la volatilisation dans l’atmosphère, la dérive, la rétention
et l’adsorption dans le sol, le ruissellement à la surface et le lessivage dans la profondeur du
sol (Leonard, 1990). Les processus de dégradation (biodégradation et photodégradation) et la
décomposition chimique jouent également un rôle dans la contamination environnementale et
aquatique.
L’introduction des pesticides dans l’environnement aquatique peut se faire soit de
manière directe, soit de façon indirecte. L’introduction directe est en général ponctuelle et
Chapitre 1. Synthèse Bibliographique
44
peu fréquente ; elle peut résulter d’un accident mais aussi correspondre à une démoustication
du milieu, un traitement de cultures inondées ou situées en bordure d’un cours d’eau. Le cas
général reste quand même celui d’une introduction indirecte liée au traitement d’une zone
éloignée du milieu aquatique.
a. Transfert vers les eaux souterraines : le lessivage
Le processus de lessivage des pesticides correspond au transfert des molécules de la
surface du sol, ou des couches superficielles du sol, vers les eaux de profondeur (nappe
phréatique), soit de la zone non saturée à la zone saturée du sol. Ce transfert se fait
essentiellement via la dilution des pesticides dans la solution du sol. Deux types de transfert
sont à différencier, le transfert matriciel où la percolation de l’eau dans le sol entraîne la
lixiviation des molécules. La vitesse de transfert dépend alors des caractéristiques de la
molécule, des propriétés du sol, de la vitesse d’infiltration et de l’épaisseur de la zone non
saturée, décrite par l’équation de convection dispersion.
Le deuxième type de transfert des pesticides de la surface vers la zone saturée est le
transfert préférentiel. Ce dernier peut être décrit comme un transfert vertical rapide de la
solution du sol via la macroporosité ce qui peut aggraver la contamination des eaux
souterraines, le temps de dissipation des pesticides dans le sol étant alors limité (Delphin et
Chapot, 2006). L’écoulement préférentiel engendrerait la présence de molécules difficilement
lessivables (p.e., fort Koc) dans les eaux souterraines (Jarvis et Dubus, 2006). La modélisation
des transferts préférentiels est encore limitée de par la difficile estimation de la présence et du
rôle exacte des macropores dans ce processus.
b. Transfert vers les eaux de surface : le ruissellement
Le transfert de produits phytosanitaires vers les eaux de surface se fait essentiellement
par ruissellement. Les produits phytosanitaires vont pouvoir être transportés de plusieurs
façons : en solution dans l’eau qui ruisselle, en suspension ou accrochés à des particules de
sol qui sont arrachées par l’eau qui ruisselle (Leonard, 1990).
Il existe deux sortes de ruissellement : le ruissellement hortonien qui est le fait d’un
dépassement de la capacité d’infiltration du sol et le ruissellement hypodermique ou
écoulement de sub-surface, qui se produit lorsque la conductivité latérale est plus importante
que la conductivité verticale.
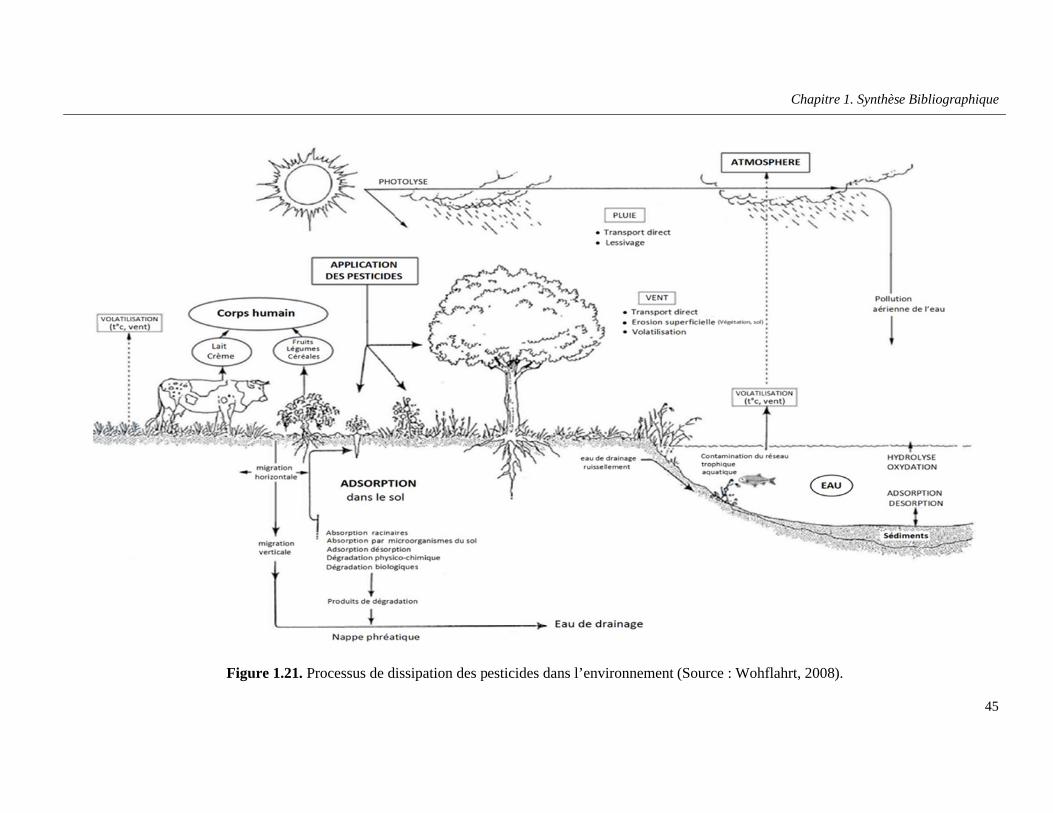
Chapitre 1. Synthèse Bibliographique
45
Figure 1.21. Processus de dissipation des pesticides dans l’environnement (Source : Wohflahrt, 2008).
Chapitre 1. Synthèse Bibliographique
46
1.2.5. Toxicologie et écotoxicologie
L’ensemble de la communauté scientifique s’accorde sur le danger et la nocivité des
produits phytosanitaires et de leurs métabolites dans l’environnement.
a. Impact sur l’homme
L’homme et les animaux en général, absorbent les pesticides et leurs produits dérivés
via la nourriture, l’eau, par contact avec la peau et les cuticules, ou encore par inhalation. Une
étude conduite aux Etats Unis a mis en évidence la présence de résidus de pesticides dans
différentes matrice tels que l’urine, le sang, les tissus adipeux et même le lait maternel
(www.observatoire-pesticides.gouv.fr).
En dépit de leur sélectivité et mode d’action spécifique, les pesticides exercent leur
nocivité envers les organismes involontairement exposés, suite à la contamination de
l’environnement et de la chaîne alimentaire. Les résultats issus de différentes études indique
que les pesticides sont cytotoxiques, neurotoxiques, embryotoxiques, mutagènes, tératogènes
ou carcinogènes. Ils exercent leur action toxique par génotoxicité directe, ils peuvent donc
subir une activation métabolique et former des intermédiaires électrophiles capables
d’interagir avec les acides nucléiques ; ou par d’autres moyens indirects tel que le stress
oxydatif, l’inhibition de la communication intercellulaire, la formation de récepteurs activés
ou autres. Certains pesticides et leurs produits de dégradation ont été identifiés comme des
agents susceptibles de nuire à la fertilité masculine en particulier via une toxicité testiculaire
(Sánchez-Peña et al., 2004). Il a été effectivement mis en évidence qu’une exposition à
certaines substances pouvait entrainer un dérèglement du système immunitaire (Rekha et al.,
2006). Certains pesticides sont aussi considérés comme étant des perturbateurs endocriniens,
c’est-à-dire qu’ils interfèrent avec les hormones en simulant leur action. Une étude libanaise
de Salameh et al. a signalé que l'exposition chronique aux pesticides a été associée avec des
symptômes de maladies respiratoires chroniques chez les enfants, surtout l’asthme (Salameh
et al., 2003).
Les agriculteurs et les ouvriers qui préparent les mélanges et réalisent les traitements
ont plus de risque que le reste de la population d’être atteints. Ainsi, chez les agriculteurs, il a
été remarqué que la mortalité et l’incidence de certains types de cancers ont augmentés. Il
s’agit en général de cancers peu fréquents voire rares tels que les cancers des lèvres, de
l’ovaire, du cerveau, de mélanome cutané et de la plupart des cancers du système
Chapitre 1. Synthèse Bibliographique
47
hématopoïétique (leucémies, myélomes, lymphomes). Le cancer de la prostate et de
l’estomac, cancers nettement plus fréquents, seraient également concernés (Meyer et al,
2003). Sur le plan local, une étude menée dans 2 centres hospitaliers, étalée sur les années
1979 à 1992 révèle que les dérivés chimiques représentés essentiellement par les produits
phytosanitaires sont responsables de 19 % de la totalité des intoxications (Geahchan et Abi
Zeid Daou, 1995). Des enquêtes sont souvent menées auprès des personnes considérées
comme exposées à un risque relativement direct par leur mode de vie quotidienne et les
adduits à l’ADN sont les biomarqueurs adoptés pour la génotoxicité. Dans ce cadre, des
adduits à l’ADN ont été détectés dans les cellules sanguines de personnes travaillant dans la
floriculture et exposées quotidiennement à des mélanges de pesticides ; 60 % présentent six
différents types d’adduits avec une moyenne de 8,5 adduits par 109 nucléotides par rapport
aux témoins présentant 2 adduits par 109 nucléotides (Munnia et al, 1999). Aussi, une
formation d’adduit à l’ADN ont été mesurées dans des échantillons de placenta de femmes
résidant dans des zones côtières de rivières polluées. Ces femmes sont considérées
préexposées à des doses faibles et chroniques d’organochlorés par leur alimentation à base de
poissons et l’enquête a été réalisée suite à des effets notés chez les nouveaux nés (Lagueux et
al, 1999).
En plus, les effets produits par la combinaison de plusieurs matières actives sont
supérieurs aux effets individuels additionnés à cause de l’interaction entre les molécules
simultanément présentes. Ainsi, le penconazole stimule la toxicité des organophosphorés
envers les mammifères, ceci résulterait de la réaction d’activation des organophosphorés en
leur métabolite toxique l’oxon (Levine et Oris, 1999). Pareillement, le propiconazole
augmente l’action toxique du parathion en activant la formation du paraoxon ; la toxicité des
pesticides organophosphorés envers des organismes non ciblés serait donc induite par une
exposition antérieure au propiconazole (Levine et Oris, 1999). Aussi, le mélange diméthoate,
azinphos-méthyle, diazinon, pyrimiphos-méthyle, et bénomyl exerce une toxicité très élevée
par rapport aux substances testées individuellement sur des cellules humaines ; les
concentrations habituellement trouvées sur les fruits (0,4 à 100 ppm) entraînent une inhibition
de l’acétylcholine estérase et de la synthèse protéique, et l’effet du mélange ne peut pas être
estimé à partir des tests réalisés séparément pour chaque matière active (Marinovich et al,
1996).
Chapitre 1. Synthèse Bibliographique
48
Il s’est également avéré que des produits de dégradation des pesticides peuvent être
aussi toxiques, ou même plus toxiques, que la molécule d’origine. Par exemple, les dérivés
de chlorpyrifos et du malathion ont été 100 fois au moins plus toxiques que les composés
parents, et les dérivés de diazinon sont 10 fois plus toxiques (Jokanović, 2001 et 2009 ;
Kamel et al., 2009).
- Toxicité aiguë et chronique
L’intoxication aigue se manifeste à la suite d’une exposition unique ou de courte
durée. Les symptômes apparaissent normalement dans un délai de quelques minutes à
plusieurs heures après l’exposition. Le delà d’apparition varie en fonction de la toxicité du
produit, de la dose reçue, de la voie d’absorption (orale, cutanée ou respiratoire) et de la
sensibilité de la personne. En général, les insecticides présentent une plus forte toxicité aiguë
pour l’être humain que les herbicides ou les fongicides. Les signes ou symptômes le plus
souvent rapportes lors d’une intoxication aigue aux pesticides sont des maux de tête, des
nausées, des vomissements, des étourdissements, une fatigue anormale, une perte d’appétit et
des irritations cutanées, oculaires ou respiratoires. Les intoxications aigues résultent souvent
d’une exposition accidentelle à la suite du non-respect des recommandations en matière
d’utilisation ou d’entreposage des pesticides.
Outre les effets à court terme qui peuvent se produire lors d’une exposition à des
doses de pesticides relativement élevées, des effets à long terme peuvent aussi être
appréhendes. L’intoxication chronique survient normalement à la suite de l’absorption
répétée de faibles doses de pesticides pendant plusieurs jours, plusieurs mois ou plusieurs
années. Les signes d’une intoxication chronique sont souvent difficiles à reconnaitre et leur
délai d’apparition peut être relativement long. Parfois, ils peuvent même survenir alors que la
personne n’est plus exposée aux pesticides depuis de nombreuses années. Par ailleurs, en
raison de cette période de latence caractéristique, il est souvent difficile de faire le lien entre
l’exposition chronique aux pesticides et les symptômes observés. Même si les signes ou
symptômes d’une intoxication chronique peuvent parfois s’apparenter à ceux d’une
intoxication aigue, certaines études indiquent un lien potentiel entre l’exposition aux
pesticides et certains effets néfastes tels que le cancer, les effets sur la reproduction, des
perturbations du système endocrinien et du système immunitaire ainsi que des effets
neurologiques.
Chapitre 1. Synthèse Bibliographique
49
b. Impact sur l’écosystème aquatique
Les voies de transfert et les propriétés des substances conditionnent l'état (dissous ou
adsorbé à des particules) dans lequel les pesticides arrivent dans les milieux aquatiques. La
forme chimique des molécules peut fortement conditionner leur biodisponibilité et donc
fréquemment leur toxicité pour les organismes aquatiques. Tous les groupes d'organismes
aquatiques ne sont pas exposés de la même façon, en fonction de leurs caractéristiques
anatomiques, physiologiques et écologiques (habitat, ressources alimentaires utilisées, etc.).
Quelle que soit la substance, les conséquences de l'exposition sur les organismes
aquatiques peuvent découler d'effets directs ou indirects, ou de la combinaison des deux types
d'effets. Au sein des écosystèmes, les effets directs des pesticides affectent les quatre
compartiments de l’environnement aquatique: producteurs primaires, zooplancton-
macrobenthos, poissons et amphibiens (Tissut et al., 2006). Les effets toxiques directs
peuvent entraîner des modifications des interactions biologiques et de divers processus qui
impliquent des espèces qui sont moins sensibles à ces substances. Ces modifications sont
appelées effets secondaires ou indirects (Aubertot, 2005). Ces effets reposent essentiellement
sur une modification des relations de compétition au sein d'un même niveau trophique et/ou
des relations de consommation entre des niveaux trophiques successifs. Certains de ces effets
ont parfois été observés dans des écosystèmes aquatiques naturels, mais les données valides à
ce propos sont rares.
Les études des impacts possibles des pesticides sur les organismes vivants nécessitent
des mesures fiables des niveaux d’exposition de ces organismes pour faire évaluer le lien
entre les effets biologiques mesures et la contamination des milieux par les pesticides.
1.2.6. Réglementations
A travers les différents études cites dans le paragraphe 1.2.5, il semble clair que les
pesticides constituent un danger sanitaire réel et peuvent avoir des effets néfastes sur la santé
humaine et l’environnement. La protection contre les pesticides constitue donc un enjeu
majeur de santé publique, c’est pourquoi, des réglementations portant sur les pesticides ont
été mises en place par les différentes autorités gouvernementales.
Depuis le début des années 80, l’Union européenne a progressivement encadré
l’utilisation des pesticides par diverses réglementations visant à réduire les impacts avérés
Chapitre 1. Synthèse Bibliographique
50
pour l’environnement et les risques plausibles pour la santé humaine. La directive 91/414/CE
adoptée en 1991, par le conseil européen, vise à évaluer les risques pour la santé et
l’environnement des pesticides utilisés en agriculture afin d’optimiser la protection de
l’homme et des milieux (UE, 2001). Parmi les mesures adoptées figurent l’évolution
européenne des substances actives, ainsi qu’une revue d’ensemble des substances actives
existant sur le marché en 1993. Ce programme a été organisé en phases successives et
entraine la disparition d’un certain nombre de substances actives. La principale cause de non-
inscription et de retrait à une substance peuvent être diverses : les propriétés toxicologiques,
écotoxicologues ou environnementales ne correspondent plus aux normes actuelles qui ont
beaucoup évolués, surtout sur le plan environnemental. Parmi les exemples les plus
marquants, on peut citer le retrait en 1998 du lindane utilisé en traitement de sol contre les
ravageurs souterrains, et récemment le retrait des triazines, herbicides les plus utilisés, en
raison de la présence de résidus dans les eaux souterraines et superficielles, supérieures aux
normes européennes, et enfin la suspension du fipronil et de l’imidaclopride, insecticides
utilises en traitement des semences, pour un éventuel risque pour les abeilles. Plus
récemment, une Directive Cadre sur les Pesticides (DCP) est actuellement en cours
d’élaboration pour la réduction des risques liés aux pesticides, et elle devrait être rendu public
prochainement.
Au Liban, le Ministère de l’Agriculture (MoA) a interdit une liste de 110 pesticides
(Décision 94/1, date 20/05/98) dont l’aldrine, le dieldrine, le DDT et d’autres pesticides
persistants dans l’environnement (MoA, 1998). En 2001, le gouvernement libanais a signé le
protocole de la convention de Stockholm sur les polluants organiques persistants et par
conséquence trois pesticides ont été ajoutés à la liste des pesticides interdits: le lindane, le
monocrotophos et le méthyl-parathion (Décision 261/1, date 26/09/2001) (MoA, 2001).
Malheureusement, les restrictions et l’interdiction sur l’utilisation de certains pesticides ne
sont pas vraiment applicables au Liban à cause de l’absence des inspections régulières.
Pour les milieux aquatiques, la DCE contraint la mise en place de projets de réduction
des traitements et/ou des projets de limitation des pertes de pesticides vers les eaux. Pour
l’eau destinée à la consommation humaine, la directive 98/83/CE a fixé une valeur de 0,1
µg/L pour chaque pesticide (sauf pour quatre composés : l'aldrine, la dieldrine, l'heptachlore
et l'époxyde d'heptachlore, pour lesquelles la limite applicable est de 0.03 µg/L) et 0,5 µg/L
pour le total des pesticides quantifiés (UE, 1998).
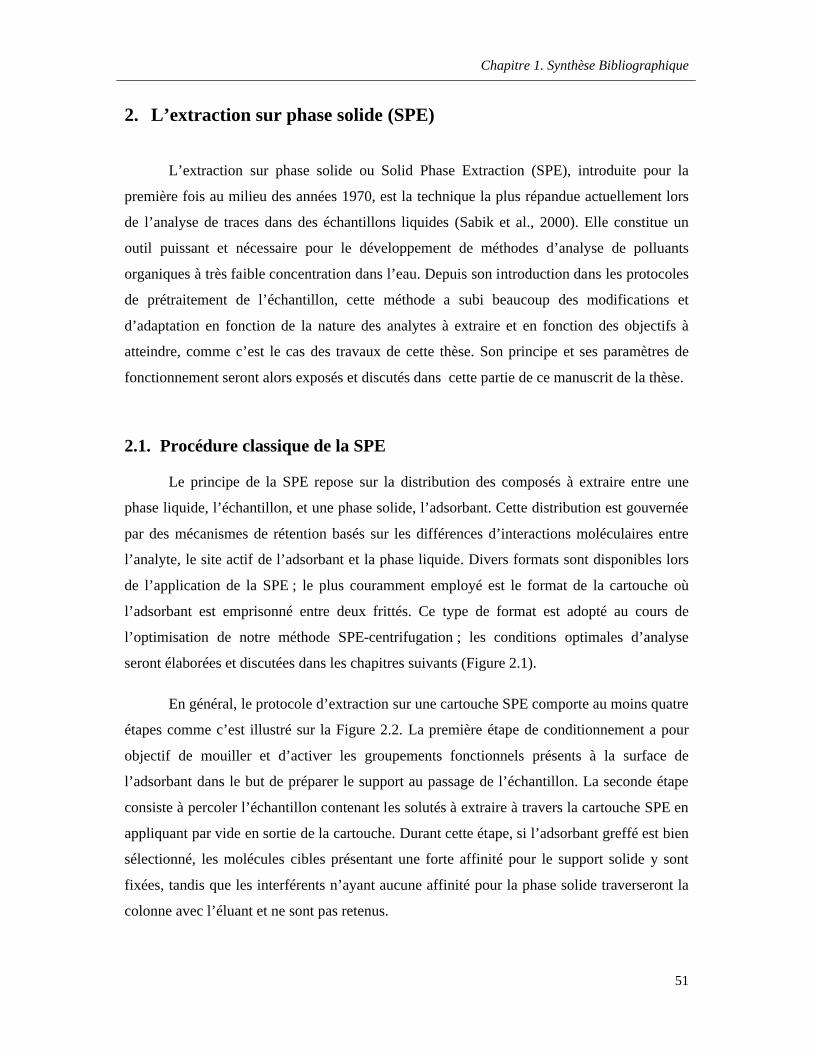
Chapitre 1. Synthèse Bibliographique
51
2. L’extraction sur phase solide (SPE)
L’extraction sur phase solide ou Solid Phase Extraction (SPE), introduite pour la
première fois au milieu des années 1970, est la technique la plus répandue actuellement lors
de l’analyse de traces dans des échantillons liquides (Sabik et al., 2000). Elle constitue un
outil puissant et nécessaire pour le développement de méthodes d’analyse de polluants
organiques à très faible concentration dans l’eau. Depuis son introduction dans les protocoles
de prétraitement de l’échantillon, cette méthode a subi beaucoup des modifications et
d’adaptation en fonction de la nature des analytes à extraire et en fonction des objectifs à
atteindre, comme c’est le cas des travaux de cette thèse. Son principe et ses paramètres de
fonctionnement seront alors exposés et discutés dans cette partie de ce manuscrit de la thèse.
2.1. Procédure classique de la SPE
Le principe de la SPE repose sur la distribution des composés à extraire entre une
phase liquide, l’échantillon, et une phase solide, l’adsorbant. Cette distribution est gouvernée
par des mécanismes de rétention basés sur les différences d’interactions moléculaires entre
l’analyte, le site actif de l’adsorbant et la phase liquide. Divers formats sont disponibles lors
de l’application de la SPE ; le plus couramment employé est le format de la cartouche où
l’adsorbant est emprisonné entre deux frittés. Ce type de format est adopté au cours de
l’optimisation de notre méthode SPE-centrifugation ; les conditions optimales d’analyse
seront élaborées et discutées dans les chapitres suivants (Figure 2.1).
En général, le protocole d’extraction sur une cartouche SPE comporte au moins quatre
étapes comme c’est illustré sur la Figure 2.2. La première étape de conditionnement a pour
objectif de mouiller et d’activer les groupements fonctionnels présents à la surface de
l’adsorbant dans le but de préparer le support au passage de l’échantillon. La seconde étape
consiste à percoler l’échantillon contenant les solutés à extraire à travers la cartouche SPE en
appliquant par vide en sortie de la cartouche. Durant cette étape, si l’adsorbant greffé est bien
sélectionné, les molécules cibles présentant une forte affinité pour le support solide y sont
fixées, tandis que les interférents n’ayant aucune affinité pour la phase solide traverseront la
colonne avec l’éluant et ne sont pas retenus.
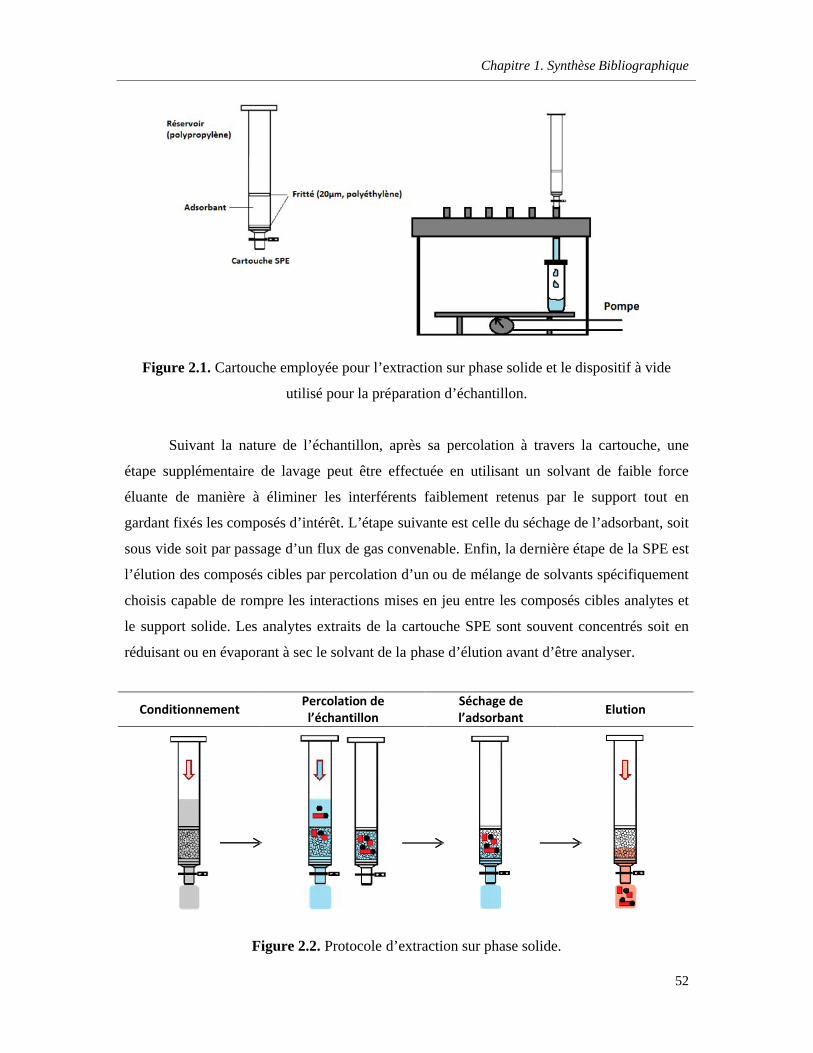
Chapitre 1. Synthèse Bibliographique
52
Figure 2.1. Cartouche employée pour l’extraction sur phase solide et le dispositif à vide
utilisé pour la préparation d’échantillon.
Suivant la nature de l’échantillon, après sa percolation à travers la cartouche, une
étape supplémentaire de lavage peut être effectuée en utilisant un solvant de faible force
éluante de manière à éliminer les interférents faiblement retenus par le support tout en
gardant fixés les composés d’intérêt. L’étape suivante est celle du séchage de l’adsorbant, soit
sous vide soit par passage d’un flux de gas convenable. Enfin, la dernière étape de la SPE est
l’élution des composés cibles par percolation d’un ou de mélange de solvants spécifiquement
choisis capable de rompre les interactions mises en jeu entre les composés cibles analytes et
le support solide. Les analytes extraits de la cartouche SPE sont souvent concentrés soit en
réduisant ou en évaporant à sec le solvant de la phase d’élution avant d’être analyser.
ConditionnementPercolation de l’échantillon
Séchage de l’adsorbant Elution
Figure 2.2. Protocole d’extraction sur phase solide.
Chapitre 1. Synthèse Bibliographique
53
2.2. Paramètres clés de la SPE
Les paramètres qui guident le développement d’une procédure SPE sont nombreux
comme par exemple : Nature de l’adsorbant, volume de l’échantillon, nature de la phase
éluant,…; certains de ces paramètres ont une influence directe sur l’efficacité, d’autres sur le
temps d’analyse etc… ; l’optimisation de chacun de ses paramètres semble nécessaire dans le
but de développer une méthode efficace, rapide et fiable.
2.2.1. Choix de la phase d’extraction
La mise en place d’un protocole SPE débute par le choix de l’adsorbant. Les
propriétés physico-chimiques des composés à analyser ainsi que la quantité et la nature de
l’échantillon permettent de choisir la nature et la quantité de l’adsorbant. Plusieurs types
d’adsorbants ont été utilisés pour l’extraction des polluants organiques de l’eau, mais la silice
greffée octadecyle C18 reste l’adsorbant le plus couramment employé utilisé pour les
échantillons aqueux, car l’eau présente une très faible force éluante sur ce type de support
(Reemtsma, 1996 ; Sargenti et McNair, 1998 ; Nirmaier et al., 1996 ; Urbe et Ruana, 1997).
La chaîne C18 présente de bonnes propriétés de rétention, par interactions hydrophobes, des
composés apolaires et moyennement polaires, comme dans c’est le cas des HAP et de
plusieurs familles de pesticides : Organochlorés, organophosphorés...etc. Sargenti et McNair
(1998) ont comparé trois adsorbants différents de la silice greffée soit avec le groupement
octadecyle C18, avec le groupement cyano ou avec le groupement phényl, utilisés pour
extraire quinze HAP de l’eau. Les meilleurs résultats ont été observés pour les cartouches
contenant la silice - C18. En revanche, des adsorbants plus polaires sont nécessaires pour
extraire les composés polaires qui contiennent de groupes fonctionnels renfermant des
hétéroatomes tels que les hydroxyles, les carbonyles et les amines, comme certains pesticides
et leurs produits de dégradation. Pour cette raison, des polymères fonctionnalisés par des
groupements polaires ont été synthétisés de manière à améliorer le contact des analytes
polaires avec l’échantillon aqueux pendant la percolation, comme la phase Oasis HLB de
marque Waters basée sur une copolymérisation de divinylbenzène avec le monomère polaire
de N-vinylpyrolidone. L’adsorbant HLB, appartenant à la nouvelle génération de polymères,
est conçu pour simplifier et améliorer la préparation d'échantillons par extraction d’une large
Chapitre 1. Synthèse Bibliographique
54
gamme de composés hydrophiles et hydrophobes en utilisant la même cartouche SPE
(Fontanals et al., 2005).
2.2.2. Volume de l’échantillon
Pour la recherche de micropolluants organiques tels que des HAP ou des pesticides
dans les eaux, le volume d’échantillon percolé peut varier de quelques millilitres jusqu’aux
quelques litres selon la nature de l’échantillon, les composés à analyser et selon le facteur
d’enrichissement nécessaire pour atteindre une concentration suffisamment détectable par le
système analytique. Si l’adsorbant a une bonne capacité de rétention, la quantité d’analytes
fixés augmentera proportionnellement avec le volume d’échantillon percolé, améliorant ainsi
le facteur d’enrichissement. Cependant, à partir d’un certain volume appelé volume de fin de
fixation, les solutés commencent à être élués par le solvant qui constitue l’échantillon ou
l’eau (Liska et al., 1990). Lors de la mise en place d’un protocole d’extraction, la
détermination de ce volume est donc indispensable, afin d’établir le volume de l’échantillon à
percoler pour obtenir un facteur d’enrichissement satisfaisant avec de bons rendements
d’extraction. Le volume de fin de fixation peut être déterminé expérimentalement en
percolant un volume d’échantillon croissant, tout en maintenant la quantité de composé
constante. Le volume de fin de fixation pour un analyte est déterminé quand la réponse des
analytes commence à décroître et par conséquent le rendement de récupération.
2.2.3. Séchage de l’adsorbant
Le séchage de la cartouche après la percolation de l'échantillon est une étape
importante de la procédure SPE. Une élution immédiate, sans séchage, va conduire à un
solvant organique renfermant des traces d'eau gênantes pour le système d’analyse GC-MS.
Egalement, l'étape de séchage est un facteur important, à prendre en considération, lors d'une
élution ultérieure avec un solvant apolaire. En effet, les pores de l’adsorbant remplis d'eau,
empêchent le solvant d'élution d’y pénétrer ; par conséquence, le rendement de récupération
et la répétabilité de l’étape d’élution sont influencés négativement (Fladung, 1995).
Chapitre 1. Synthèse Bibliographique
55
D’autre part, la durée de séchage est une étape critique dans le cas de l’extraction des
composés organiques volatils tels que les HAP légers. Oleszczuk et Baran (2004) ont montré
que le séchage complet de la colonne SPE peut entraîner des pertes des HAP volatiles de 10 à
20%. Lorsque la cartouche a été séché sous vide pendant environ 20 minutes, les travaux de
Delhomme et al., (2007) ont montré une perte totale du naphtalène et une récupération de
10% pour l’acénaphtylène
2.2.4. Nature et volume de la phase d’élution
Le choix de la phase d’élution dépend, en premier lieu, de la nature du ou des analytes
à extraire, du type d’adsorbant et enfin de la méthode d’analyse (chromatographie en phase
liquide ou gazeuse). Une réflexion préalable doit être menée, en effet, afin de définir la nature
des interactions impliquées dans le mécanisme de rétention des analytes d’intérêt sur
l’adsorbant. Le solvant ou le mélange des solvants adéquats doivent rompre ces interactions
et aboutir à une récupération totale des analytes. Pour les composés volatils comme les HAP
légers, les rendements de récupération sont plus élevée en utilisant des solvants non volatils,
alors qu’un solvant non polaire est nécessaire afin d’éluer les HAP lourds les plus retenus sur
un adsorbant de type C18 (Sun et al., 1998). A titre d’exemple, Sargenti et McNair (1998) ont
comparé différents solvants pour l’élution des HAP à partir d’une cartouche C18, ils ont
obtenu les meilleurs rendements avec le dichlorométhane. Di Corcia et Marchetti (1991) ont
montré que des mélanges de solvants sont parfois recommandés, comme dichloromethane-
methanol, 80:20, v/v par exemple, afin d’assurer l’élution complète d'un ensemble de
pesticides ayant des propriétés physico-chimiques différentes retenus sur une même
cartouche SPE.
Le volume de la phase d’élution est généralement choisi de manière à avoir un
volume final 2 à 3 fois le volume de la cartouche (Simpson et Van Home, 1993). Cependant,
il peut être augmenté, selon les propriétés des analytes sélectionnés, la nature de l’adsorbant
et de la phase éluante (Sabik et Jeannot, 1998). Un volume plus important est toujours
nécessaire pour éluer les composés les plus retenus sur la cartouche. Le volume le plus
couramment employé pour l’élution des analytes retenus sur des cartouches ayant des
capacités variant entre 100 et 500 mg d’adsorbant ne dépassent pas généralement une
trentaine de mL. Martinez et al. (2004) ont utilisé un volume total de 25 mL de solvants
Chapitre 1. Synthèse Bibliographique
56
organiques pour éluer les HAP adsorbés sur des cartouches, de natures différentes, remplies
avec 500 mg d’adsorbant. Alors que Belmonte Vega et al. (2005) ont appliqué un volume de
10 mL lors de l’élution d’un mélange de 32 pesticides à partir d’une cartouche HLB de 200
mg.
En conclusion, la technique SPE est une méthode bien adaptée à l’analyse de
polluants organiques dans l’eau, mais elle nécessite une optimisation des différentes étapes et
des divers paramètres qui peuvent influencer son efficacité lors de son application dans
l’analyse multi résidus. Récemment, les tendances s’orientent vers le développement des
nouvelle méthodes analytiques de traitement d’échantillons qui répondent aux demandes
actuelles de diminution de volume des solvants organiques utilisés, de temps d’analyses et du
coût totale de la procédure. L’optimisation de la méthode traditionnelle SPE semble, alors,
nécessaire afin d’avoir une méthode analytique efficace, rapide utilisables dans les analyses
de routine.
57
Références Bibliographiques
Références Bibliographiques
58
Abrajano Jr.T.A., Yan B., Song J., Bopp R., O'Malley V., Heinrich D.H., Karl K.T., 2007. High Molecular Weight Petrogenic and Pyrogenic Hydrocarbons in Aquatic Environments. Treatise on Geochemistry 9:1-50.
ATSDR (Agency for Toxic Substances and Disease Registry), 1990. Toxicological Profilefor Polycyclic Aromatic Hydrocarbons. U.S. Department of Health and Human ervices, Public Health Service: Washington, DC, p 231.
Ahokas J.T., Pelkonen O., 1984. Metabolic activation of polycyclic aromatic hydrocarbons by fish liver cytochrome P-450. Marine Environmental Research 14:59-69.
Appel J., Bockhorn H., Frenklach M., 2000. Kinetic modelling of soot formation with detailed chemistry and physics: laminar premixed flames of C2 hydrocarbons. Combustion and Flame 121:122-136.
Couteux A., Lejeune V., 2006. Index Phytosanitaire ACTA 2006. 41eme edition, ACTA, Paris.
Aubertot J.N., Barbier J.M., Carpentier A., Gril J.J., Guichard L., Lucas P., Savary S., Savini I., Voltz M., 2005. Pesticides, agriculture et environnement. Réduire l'utilisation des pesticides et limiter leurs impacts environnementaux. Rapport d'Expertise scientifique collective, INRA et Cemagref (France).
Baek S.O., Field R.A., Goldstone M.E., Kirk P.W., Lester J.N., Perry R., 1991. A review of atmospheric polycyclic aromatic hydrocarbons: Sources, fate and behavior. Water Air Soil Pollut 60:279-300.
Bailey N.J.L., Krouse H.H., Evans C.R., Rogers M.A., 1973. Alteration of crude oil by waters and bacteria - Evidence from geochemical and isotope studies. AAPG Bulletin 57:1276-1290.
Barbieri O., Ognio E., Rossi O., 1986. Embryotoxicity of benzo(a)pyrene and some of its synthetic derivatives in swiss mice. Cancer Research 46(1):94-98.
Belmonte Vega A., Garrido Frenich A., Martinez Vidal J.L., 2005. Monitoring of pesticides in agricultural water and soil samples from Andalusia by liquid chromatography coupled to mass spectrometry. Analytica Chimica Acta 538:117-127.
Bence A.E., Kvenvolden K.A., Kennicutt M.C., 1996. Organic geochemistry applied to environmental assessments of Prince William Sound, Alaska, after the Exxon Valdez oil spill- a review. Organic Geochemistry 24(1):7-42.
Besombes J.L., Maitre A., Patissier O., Marchand N., Chevron N., Stoklov M., Masclet P., 2001. Particulate PAHs observed in the surrounding of a municipal incinerator. Atmospheric Environment 35:6093-6104.
Blanton R.H., Lyte M., Myers M.J., Bick P.H., 1986. Immunomodulation by polyaromatic hydrocarbons in mice and murine cells. Cancer Research 46(6):2735-2739.
Borneff J, 1977. Fate of carcinogens in aquatic environments. In Fate of pollutants in the air and water environments, part 2, Suffet IH (ed), 393-408. Wiley, New York.
Broman D., Naf C., Lundbergh I., Zebuhr Y., 1990. An in situ study on the distribution, biotransformation and flux of polycyclic aromatic hydrocarbons (PAHs) in an aquatic food chain (seston-mytilus edulis l.-Somateria mollissima L.) from the Baltic: An ecotoxicological perspective. Environmental Toxicology and Chemistry 9(4):429-442.
Références Bibliographiques
59
Brookes P., Lawley P.D., 1964. Evidence of the binding of polynuclear aromatic hydrocarbons to the nucleic acids of mouse skin: Relation between carcinogenic power of hydrocarbons and their binding to deoxyribonucleic acid. Nature 202:781-784.
Brown R.C., Pierce R.H., and Rice S.A., 1985. Hydrocarbon contamination in sediments from urban stormwater runoff. Marine Pollution Bulletin 16:236-240.
Brummage K.G., 1975. The sources of oil entering the sea. In Background papers for a workshop on inputs, fate and effects of petroleum in the environment, 1-6. National academy of science, Washington, DC.
Budzinski H., 1993. Les composés aromatiques alkylés dans les échantillons pétroliers : aspect physico chimiques et thermodynamiques. Thèse : Université Bordeaux 1, Bordeaux, France.
Budzinski H., Jones I., Bellocq J., Pierard C. and Garrigues P., 1997. Evaluation of sediment contamination by polycyclic aromatic hydrocarbons in the Gironde estuary. MarineChemistry 58: 85-97.
Cairns T., Sherma J.,1992 (ed). Emerging Strategies for Pesticide Analysis. CRC Press, Boca Raton, Florida, USA.
Carsel R.F., Smith C. N., 1987. Impact of pesticides on ground water contamination. In G.J. Marco et al (ed), Silent spring revisited. American Chemical Society, Washington, DC: 71-83.
Centre de Documentation, de Recherche et d'Expérimentations sur les pollutions accidentelles des Eaux (CEDRE), August 2006. Analysis of oil samples collected on the lebanese and syrian shorelines. Report GC.06-19 KD/JG.
Chernyak S.M., Rice C.P., McConnell L.L., 1996. Evidence of currently-used pesticides in air, ice, fog, seawater and surface microlayer in the Bering and Chukchi Seas. Marine Pollution Bulletin 32:410-419.
Colin F., 2000. Approche spatiale de la pollution chronique des eaux de surface par les produits phytosanitaires: cas de l'atrazine dans le bassin versant du Sousson (Gers, France). Thèse : Sciences de l'Eau, ENGREF, Montpellier.
Collier A.R., Rhead M.M., Trier C.J., Bell M.A., 1995. Polycyclic aromatic compound profiles from a light-duty direct-injection diesel engine. Fuel 74: 362-367.
Colombo J. C., Pelletler E., Brochu C., Khalil M., Catoggio J.A., 1989. Determination of hydrocarbon sources using n-alkane and polyaromatic hydrocarbon distribution indexes. Case study: Rio de La Plata estuary, Argentina. Environmental Science & Technology 23(7):888-894.
Dachs J., Bayona J.M., Raoux C., Albaihes J., 1997. Spatial, Vertical Distribution and Budget of Polycyclic Aromatic Hydrocarbons in the Western Mediterranean Seawater. Environmental Science and Technology 31:682-688.
Deal C.L., 1995. The role of metabolic activation in BaP-induced suppression of the humoral immune response. Thèse: Université Virginia Commonwealth University, Richmond, Virginia.
Dean J.H., Luster M.I., Boorman G.A., 1983. Selective immunosuppression resulting from exposure to the carcinogenic congener of benzopyrene in B6C3F1 mice. Clinical and Experimental Immunology 52(1):199-206.
Références Bibliographiques
60
De Flora S., Bagnasco M., Zanacchi P., 1991. Genotoxic, carcinogenic, and teratogenic hazards in the marine environment, with special reference to the Mediterranean Sea. Mutation Research - Reviews in Mutation Research 258(3):285-320.
Delhomme O., Rieb E., Millet M., 2007. Solid-phase extraction and LC with fluorescence detection for analysis of PAHs in rainwater. Chromatographia 65:163-171.
Delphin J.E., Chapot J.Y., 2006. Leaching of atrazine, metolachlor and diuron in the field inrelation to their injection depth into a silt loam soil. Chemosphere 64:1862-1869.
Di Corcia A., Marchetti M., 1991. Multiresidue method for pesticides in drinking water using a graphitized carbon black cartridge extraction and liquid chromatographic analysis. Analytical Chemistry 63:580-585.
Dobbins R.A., Fletcher R.A., Benner Jr.B.A., Hoeft S., 2006. Polycyclic aromatic hydrocarbons in flames, in diesel fuels, and in diesel emissions. Combustion and Flame144:773-781.
Douglas G.S., Bence A.E., Prince R.C., Mcmillen S., Butler E.L., 1996. Environmental stability of selected hydrocarbon source and weathering ratios. Environmental Science and Technology 30:2332-2339.
Dreij K., Seidel A., Jernstrom B., 2005. Differential removal of DNA adducts derived from anti-diol epoxides of dibenzo[a,l]pyrene and benzo[a]pyrene in human cells. Chemical Research in Toxicology 18:655-664.
El Nemr A., Abd-Allah A. M. A., 2003. Contamination of polycyclic aromatic hydrocarbons (PAHs) in microlayer and subsurface waters along Alexandria coast, Egypt. Chemosphere 52(10):1711-1716.
Fernandes M.B., Sicre M.A., Boireau A., Tronczynski J., 1997. Polycyclic aromatic hydrocarbon (PAH) distributions in the Seine River and its estuary. Marine Pollution Bulletin 34(11):857-867.
Fladung N.C., 1995. Optimization of automated solid-phase extraction for quantitation of polycyclic aromatic hydrocarbons in aqueous media by high-performance liquid chromatography_UV detection. Journal of Chromatography A 692:21-26.
Fontanals N., Marcé R.M., Borrull F., 2005. New hydrophilic materials for solid-phase extraction. Trends in Analytical Chemistry 24:394-406.
FAOSTAT (Food and agriculture organization). www.faostat.fao.org.
Fragoso N.M., Hodson P.V., Zambon S., 2006. Evaluation of an Exposure Assay to Measure Uptake of Sediment Pah by Fish. Environmental Monitoring and Assessment 116:481-511.
Freeman D.J., Cattell F.C.R., 1990. Woodburning as a source of atmospheric polycyclic aromatic hydrocarbons. Environmental Science and Technology 24: 1581-1585.
Frenklach M., 2002. Reaction mechanism of soot formation in flames. Physical Chemistry Chemical Physics 4:2028-2037.
Gardner W.S., Lee R.F., Tenore K.R., Smith L.W., 1979. Degradation of polycyclic aromatic hydrocarbons in coastal sediments: importance of microbes and polychaete worms. Water Air and Soil Pollution 11:339-347.
Références Bibliographiques
61
Geahchan A., Abi Zeid Daou A., 1995. Répertoire des produits phytosanitaires, Beyrouth, Liban : 244.
Glarborg P., 2007. Hidden interactions - trace species governing combustion and emissions. Proceedings of the Combustion Institute 31:77-98.
Gobas F.A.P.C., Zhang X., 1994. Interactions of Organic Chemicals with Organic Matter in the Aquatic Environment. Environmental Toxicology and Chemistry, Special Publication on "Bioavailability: Physical, Chemical and Biological Interactions 83-91. Lewis Publishers(ed). Chelsea, MI.
Harkey G.A., Landrum P.F., Klaine S.J., 1994. Comparison of whole-sediment, elutriate, and pore-water exposures for use in assessing sediment-associated organic contaminants in bioassays. Environmental Toxicology and Chemistry 13(8):1315-1329.
Harvey R.G., 1991. Polycyclic aromatic hydrocarbons: Chemistry and carcinogenicity. Cambridge University Press. Cambridge.
Harvey R.G., Penning T.M., Jarabak J., Zhang F-J., 1999. Role of quinone metabolites in PAH carcinogenesis. Polycyclic Aromatic Compounds 16:13-20.
Hase A., Hites R.A., 1978. On the origin of polycyclic aromatic hydrocarbons in the aqueous environment. In Identification and analysis of organic pollutants in water (Keith LH ed). Ann Arbor Science, MI.: 205-214.
Himel C.M., Loats H., Bailey G.W., 1990. Pesticide sources to the soil and principles of sprays physics. Pesticides in the soil environment: Processes, impacts and modeling SSSA Book series 2:7-50.
Ho T.Y., Rogers M.A., Drushel H.V., Kroons C.B., 1974. Evolution of sulfur compounds in crude oils. American Association of Petroleum Geologists 58: 2238-2248.
Hoyau V., Laffrezo J.L., Garrigues P.H., Clain M.P., Masclet P., 1996. Deposition of aerosols in polar regions-contamination of the ice sheet by polycyclic aromatic hydrocarbons. Polycyclic Aromatic Compounds 8: 35-44.
Huang D., Peng P.A., Xu Y., Deng Y., Deng H., 2009. Distribution and deposition of polycyclic aromatic hydrocarbons in precipitation in Guangzhou, South China. Journal of Environmental Sciences 21:654-660.
IARC (Agence International de Recherche sur le Cancer), 2010. Monographs on the evaluation of carcinogenic risk to humans, vol. 92, Lyon, 2010.
IFEN (Institut Français de l’Environnement), Décembre 2007. Les pesticides dans les eaux.
INERIS (Institut National de l’Environnement Industriel et des Risques), 2005. Fiches de données toxicologiques et environnementales des substances chimiques. Rapport technique.
INERIS (Institut National de l’Environnement Industriel et des Risques), 2006. Fiche de données toxicologiques et environnementales de substances chimiques : Naphtalene.Document INERIS –DRC-02-25590-02DR49.doc. Version N°1-3.
IPCS (International Program on Chemical Safety), 1998. Selected Non-Heterocyclic Polycyclic Aromatic Hydrocarbons. World Health Organization, Geneva, Switzerland.(http://www.inchem.org/documents/ehc/ehc/ehc202.htm), consulté le septembre 2011.
Références Bibliographiques
62
Jarvis N., Dubus I.G., 2006. State-of-the-art review on preferential flow. Report DL6 of the FP6 EU-funded FOOTPRINT project [www.eu-footprint.org] p:60.
Juc L., 22 novembre 2007. Etude des risques liés à l’utilisation des pesticides organochlorés et impact sur l’environnement et la santé humaine. Thèse : L’Université Claude Bernard Lyon1.
Jokanović M., 2001. Biotransformation of organophosphorus compounds. Toxicology 166:139-160.
Jokanović M., 2009. Medical treatment of acute poisoning with organophosphorus and carbamate pesticides. Toxicology Letters 190(2):107-115.
Kabzinski A.K.M., Cyran J., Juszczak R., 2002. Determination of polycyclic aromatic hydrocarbons in water (including drinking water) of Lódź. Polish journal of environmental studies 11(6):695-706.
Kamel A., Byrne C., Vigo C., Ferrario J., Stafford C., Verdin G., Siegelman F., Knizner S., Hetrick J., 2009. Oxidation of selected organophosphate pesticides during chlorination of simulated drinking water. Water Research 43(2):522-34.
Karickhoff S.W., Morris K.R., 1985. Sorption dynamics of hydrophobic pollutants in sediment suspensions. Environmental Toxicology and Chemistry 4:469-479.
Katz, A.K., Carrell, H.L., Glusker, J.P., 1998. Dibenzo[a,l]pyrene (dibenzo[def,p]chrysene): Fjordregion distortions. Carcinogenesis 19:1641-1648.
Kennaway E.L., Hieger I., 1930.Carcinogenic substances and their fluorescence spectra. British Medecine Journal 1044-1046.
Kennaway E.L., 1955. The identification of a carcinogenic compound in coal-tar. British Medecine Journal 749-752.
Kennedy, C.J. and Farrell, A. P., 2005. Ion homeostasis and interrenal stress responses in juvenile Pacific herring, Clupea pallasi, exposed to the water-soluble fraction of crude oil. Journal of Experimental Marine Biology and Ecology 323(1):43-56.
Klaasen C.D., 1997. Cassarett and Doull’s toxicology: the basic science of poisons, 5th ed. McGraw-Hill(ed).
Knezovich J.P., Harrison F.L., Wilhelm R.G., 1987. The bioavailability of sediment-sorbed organic chemicals: a review. Water Air and Soil Pollution 32:233-245.
Laflamme R.E., Hites R.A., 1978. The global distribution of polycyclic aromatic hydrocarbons in recent sediments. Geochimica et Cosmochimica Acta 42: 289-303.
Laflamme R.E., Hites R.A., 1979. Tetra- and pentacyclic, naturally-occurring, aromatic hydrocarbons in recent sediments. Geochimica et Cosmochimica Acta 43: 1687-1691.
Lagueux J., Pereg D., Ayotte P., Dewailly E., Poirier G. G., 1999. Cytochrome P450 CYP1A1 Enzyme Activity and DNA Adducts in Placenta of Women Environmentally Exposed to Organochlorines. Environmental Research Section A 80:369-382.
Landrum P.F., Lee H., Lydy M.J., 1992. Toxicokinetics in aquatic systems: Model comparisons and use in hazard assessment. Environmental Toxicology and Chemistry11:1709-1725
Références Bibliographiques
63
Latimer J.S., Hoffman E.J., Hoffman G., Fasching J.L., Quinn J.G., 1990. Sources of petroleum hydrocarbons in urban runoff. Water air soil pollution 52:1-21.
Ledesma E.B., Kalish M.A., Nelson P.F., Wornat M.J., Mackie J.C., 2000. Formation and fate of PAH during the pyrolysis and fuel-rich combustion of coal primary tar. Fuel 79: 1801-1814.
Lefigaro, 2006. http://www.lefigaro.fr/sciences/2006/05/11/01008-20060511ARTFIG90194-mortalite_des_abeilles_pas_de_verite_etablie.php.
Leonard R.A., 1990. Pesticide movement into surface waters. Pesticides in the soil environment : Processes, impacts and modeling. In CHENG H.H.(ed). SSSA Bookseries: 9 :303-349. Soil Science Society of America: Madison, USA.
Levine S.L., Oris J.T., 1999. Enhancement of Acute Parathion Toxicity to Fathead Minnows Following Pre-exposure to Propiconazole. Pesticide biochemistry and Physiology65:102-109.
Lintelmann J., Katayama A., Kurihara N., Shore L., Wenzel A., 2003. Endocrine disruptors in the environment, IUPAC technical report. Pure and Applied Chemistry 75: 631-681.
Lipiatou E., Saliot A., 1991. Fluxes and transport of anthropogenic and natural polycyclic aromatic hydrocarbons in the western Mediterranean Sea. Marine Chemistry 32: 51-71.
Liska I., Kuhan A., Krupcik J., 1990. Comparison of sorbents for solid-phase extraction of polar compounds from water. Journal of Chromatography, A 509:123-134.
Luo X., Mai B., Yang Q., Fu J., Sheng G., Wang Z., 2004. Polycyclic aromatic hydrocarbons (PAHs) and organochlorine pesticides in water columns from the Pearl River and the Macao harbor in the Pearl River Delta in South China. Marine Pollution Bulletin 48:1102-1115.
MacKenzie M.J., Hunter J.V., 1979. Sources and fates of aromatic compounds in urban storm water runoff. Environmental Science Technology 13:179-183.
Maldonado C., Bayona J. M., Bodineau L., 1999. Sources, distribution, and water column processes of aliphatic and polycyclic aromatic hydrocarbons in the Northwestern Black Sea Water. Environmental Science & Technology 33(16): 2693-2702.
Manahan S.E., 1994. Environmental chemistry. 6th edition. Lewis publishers (ed). Boca Raton, Fl.
Marinovich M., Ghilardi F., Galli C.L., 1996. Effect of pesticide mixtures on in vitro nervous cells: Comparison with single pesticides. Toxicology 108:201-206.
Marr L.C., Kirchstetter T.W., Harley R.A., Miguel A., Hering S.V., Hammond S.K., 1999. Characterization of PAH’s in motor vehicle fuels and exhaust emissions. Environmental Science Technology 33: 3091-3099.
Martinez E., Gros M., Lacorte S., Barcelo D., 2004. Simplified procedures for the analysis of polycyclic aromatic hydrocarbons in water, sediments and mussels. Journal of Chromatogaphy A 1047:181-188.
Mastral A.M., Callén S., 2000. A review on polycyclic aromatic hydrocarbon (PAH) emissions from energy generation. Environmental Science Technology 34: 3051-3057.
Références Bibliographiques
64
McElroy, A.E., Farrington, J.W., Teal, J.M., 1989. Bioavailability of polycyclic aromatic hydrocarbons in the aquatic environment. In: Varanasi U (ed). CRC, Boca Raton, FL, USA: 1-40.
Menzie C.A., Potocki B.B., Santodonato J., 1992. Exposure to carcinogenic PAHs in the environment. Environmental Science and Technology 26(7): 1278-1284.
Meyer A., Chrisman J., Moreira J.C., Koifman S., 2003. Cancer mortality among agricultural workers from Serrana Region, state of Rio de Janeiro, Brazil. Environmental Research93:264-271.
MoA (Ministry of Agriculture in Lebanon), 1998. Decision No. 94/1, date 20/05/98 : www.agriculture.gov.lb
MoA (Ministry of Agriculture in Lebanon), 2001. Decision No. 261/1, date 26/09/2001 : www.agriculture.gov.lb
MoE (Ministry of Environement in Lebanon), 1996. Standards for the minimization of pollution of air, water and soil. Ministere de l’environnement. Decret No. 52/1.
MoE (Ministry of Environement in Lebanon), 2001. State of the Environment Report, MoE-UNDP-ECODIT, chapitre 2.
Mitra S., Bianchi T.S., 2003. A preliminary assessment of polycyclic aromatic hydrocarbon distributions in the lower Mississippi River and Gulf of Mexico. Marine Chemistry 82(3-4):273-288.
Morin C., 2002. Marché et distribution des produits phytosanitaires. In pesticide et protection phytosanitaire dans une agriculture en mouvement, ACTA (ed). PARIS:413-149.
Munnia A., Puntoni R., Merlo F., Parodi S., Peluso M., 1999. Exposure to Agrochemicals and DNA Adducts in Western Liguria, Italy. Environmental and molecular mutagenesis 34:52-56.
Neff J. M., 1979. Polycyclic aromatic hydrocarbons in the aquatic environment - Sources, Fates and Biological Effects. Applied Science Publishers LTD (ed).
Neff J.M., 1985. Polycyclic aromatic hydrocarbons. In Fundamentals of aquatic toxicology: Methods and applications. Rand G.M., and Petrocelli S.R.(eds). Hemisphere Publishing Corporation. New York, USA: 416-454.
Nesnow S., Davis C., Nelson G.B., Lambert G., Padgett W., Pimentel M., Tennant A.H., Kligerman A.D., and Ross J.A., 2002. Comparison of the genotoxic activities of the K-region dihydrodiol of benzo[a]pyrene with benzo[a]pyrene in mammalian cells: morphological cell transformation, DNA damage, and stable covalent DNA adducts. Mutation Research 521:91-102.
Nirmaier H.P., Fischer E., Meyer A., Henze G., 1996. Determination of PAHs in water samples using HPLC with amperometric detection. Journal of Chromatography A730:169-175.
Oleszczuk P., Baran S., 2004. Application of solid-phase extraction to determination of polycyclic aromatic hydrocarbons in sewage sludge extracts. Journal of Hazardous Materials B 113:237-245.
Olivella M.A., 2006. Polycyclic aromatic hydrocarbons in rainwater and surface waters of Lake Maggiore, a subalpine lake in Northern Italy. Chemosphere 63(1):116-131.
Références Bibliographiques
65
Oris J.T., Giesy J.P., 1987. The photo-induced toxicity of polycyclic aromatic hydrocarbons to larvae of the fathead minnow ( ). Chemosphere 16(7):1395-1404.
Pääjärvi G., Jernström B., Stenius U., Seidel A., 2004. Exposure of mammalian cells to diol epoxides from benzo[a]pyrene and dibenzo[a,l]pyrene and effects on Mdm2 and P53. Polycyclic Aromatic Compounds 24:537-5348.
Pahlman R., Pelkonen O., 1987. Mutagenicity studies of different polycyclic aromatic hydrocarbons: The significance of enzymatic factors and molecular structure. Carcinogenesis 8:773-778.
Peltonen K., Dipple A., 1995. Polycyclic aromatic hydrocarbons chemistry of DNA adduct formation. Journal of Occupational and Environmental Medicine 37:52-58.
Phillips D.H., Grover P.L., 1994. Polycyclic hydrocarbon activation: bay regions and beyond. Drug Metabolism Reviews 26:443-467.
Pozzoli L., Gilardoni S., Perrone M.G., De Gennaro G., De Rienzo M., Vione D., 2004. Polycyclic aromatic hydrocarbons in the atmosphere: Monitoring, sources, sinks and fate. I: Monitoring and sources. Annali di Chimica 94: 17-32.
Ravindra K., Sokhi R., Van Grieken R., 2008. Atmospheric polycyclic aromatic hydrocarbons: source attribution, emission factors and regulation. Atmospheric Environment 42: 2895-2921.
Reemtsma T., 1996. Methods of analysis of polar aromatic sulfonates from aquatic environments. Journal of Chromatography A 733:473-489.
Rekha, Naik S.N., Prasad R., 2006. Pesticide residue in organic and conventional food-risk analysis. Journal of Chemical Health and Safety 13(6):12-19.
Revuelta C.C.¸ De la Fuente S.E., Rodriguez Vasquez J.A., 1999. Characterization of polycyclic aromatic hydrocarbons in emissions from coal-fired power plants: the influence of operation parameters. Environmental technology 20: 61-68.
Richter H., Howard J.B., 2000. Formation of polycyclic aromatic hydrocarbons and their growth to soot - a review of chemical reaction pathways. Progress in Energy andCombustion Science 26: 565-608.
Rockne K.J., Shor L.M., Young L.Y., Taghon G.L., Kosson D.S., 2002. Distribution sequestration and release of PAHs in weathered sediment: the role of sediment structure and organic carbon properties. Environmental Science and Technology 36: 2636-2644.
Ryder A.G., Glynn T.J., Feely M., Barwise A.J.G., 2002. Characterization of crude oils using fluorescence lifetime data. Spectrochimica Acta Part A 58:1025-1037.
Sabik H., Jeannot R., 1998. Determination of organonitrogen pesticides in large volumes of surface water by liquid–liquid and solid-phase extraction using gas chromatography with nitrogen–phosphorus detection and liquid chromatography with atmospheric pressure chemical ionization mass spectrometry. Journal of Chromatography A818:197-207.
Sabik H., Jeannot R., Rondeau B., 2000. Multiresidue methods using solid-phase extractiontechniques for monitoring priority pesticides, including triazines and degradation products, in ground and surface waters. Journal of Chromatography A 885:217-236.
Références Bibliographiques
66
Saco-Alvarez, Bellas J., Nieto O., Bayona J.M., Albaiges J., Beiras R., 2008. Toxicity and phototoxicity of water-accomodated fraction from Prestige fuel oil and marine fuel oil evaluated by marine bioassays. Science of the Total Envrionment 394: 275-282.
Salameh P.R., Baldi I., Brochard P., Raherison C., Abi Saleh B., Salamon R., 2003. Respiratory symptoms in children and exposure to pesticides. European Respiratory Journal 22:507-512.
Sanchez-Pena L.C., Reyes B.E., Lopez-Carillo L., Recio R., Moran-Martinez J., Cebrian M. E., Quintanilla-Vega B., 2004. Organophosphorous pesticide exposure alters sperm chromatin structure in Mexican agricultural workers. Toxicology and Applied Pharmacology 196:108-113.
Santé Canada, Agence de réglementation de la lutte antiparasitaire, 03 MARS 2011. Propoxur PRVD2011-09, ISSN : Numéro de catalogue : H113-27/2011-9F-PDF (version PDF).
Sargenti S.R., McNair H.M., 1998. Comparison of solid-phase extraction and supercritical fluid extraction for extraction of polycyclic aromatic hydrocarbons from drinking water. Journal of Microcolumn Seperations 10:125-131.
Sharma K., Kalpana, Sharma V., Gupta P., Jaya M., Kumar A., and Singh B., 2008. Persistence and vertical distribution of termiticide fipronil in modified ground board test. Environmental Monitoring and Assessment 137:179-184.
Sicre M.A., Marty J.C., Saliot A., Aparicio X., Grimalt J., Albaigés J., 1987. Aliphatic and Aromatic hydrocarbons in different sized aerosols over the Mediterranean Sea: occurrence and origin. Atmospheric Environment 21: 2247-2259.
Silliman J.E., Meyers P.A., Eadie B.J., 1998. Perylene: an indicator of alteration processes or precursor materials?. Organic Geochemistry 29(5-7): 1737-1744.
Simpson N., Van Home K.C., 1993. Sorbent Extraction Technology Handbook, 2nd ed, Varian Sample Preparation Products, Harbor City, CA.
Soclo, H., 1986. Etude de la distribution des hydrocarbures aromatiques polycycliques dans les sediments marins récents, identification des sources. Thèse N° 50: Université de Bordeaux1, Bordeaux, France, page 158.
Sripada K., 2005. Metal ion containing liquid chromatographic stationary phases for the analysis of polycyclic aromatic sulfur heterocycles in fossil fuels. Thèse: Université Münster, Allemagne.
Sugiura K., Ishihara M., Shimauchi T., Harayama S., 1997. Physicochemical properties and biodegradability of crude oil. Environmental Science and Technology 31:45-51.
Sun F., Littlejohn D., Gibson M.D., 1998. Ultrasonication extraction and solid phase extraction clean-up for determination of US EPA 16 priority pollutant polycyclic aromatic hydrocarbons in soils by reversed-phase liquid chromatography with ultraviolet absorption detection. Analytica Chimica Acta 364:1-11.
Tissut M., Delval P., Mamarot J., Ravanel P., 2006. Plantes, herbicides et désherbage. Acta, p : 635.
UE (Union Européenne), 1991. Directive 91/414/CEE concernant la mise sur le marché de produits phytopharmaceutiques.
Références Bibliographiques
67
UE (Union Européenne), 1998. Directive n°98/83/CE, relative à la qualité des eaux destinées à la consommation humaine.
UE (Union Européenne), 2000. Directive n°2000/60/CE, établissant un cadre pour une politique communautaire dans le domaine de l'eau.
UE (Union Européenne), 2001. Décision n°2455/2001/CE du Parlement européen et du Conseil du 20 novembre 2001 établissant la liste des substances prioritaires dans le domaine de l'eau et modifiant la directive 2000/60/CE
UE (Union Européenne), 2008. Directive n°2008/105/EC, on environmental quality standards in the field of water policy, amending and subsequently repealing Council Directives 82/176/EEC, 83/513/EEC, 84/156/EEC, 84/491/EEC, 86/280/EEC and amending Directive 2000/60/EC of the European Parliament and of the Council.
UIPP (Union des Industries de la Protection des Plantes), 2009. http://www.uipp.org/var/uipp/storage/images/uipp.org/accueil/chiffres-cles/reperes-monde-et-europe/marche-mondial-2009/118102-9-fre-FR/Marche-mondial-2009_chiffres_cles.gif.
US-EPA (United States Environmental Protection Agency), 1993. Provisional Guidance for Quantitative Risk Assessment of Polycyclic Aromatic Hydrocarbons. Office of Research and Development, Office of Health and Environmental Assessment, Washington, DC, EPA/600/R-93/089 (NTIS PB94116571).
Urbe I., Ruana J., 1997. Application of solid-phase extraction discs with a glass fiber matrix to fast determination of polycyclic aromatic hydrocarbons in water. Journal ofChromatography A 778:337-345.
Valavanidis A., Vlachogianni Th., Triantafillaki S., Dassenakis M., Androutsos F., Scoullos M., 2008. Polycyclic aromatic hydrocarbons in surface seawater and in indigenous mussels (Mytilus galloprovincialis) from coastal areas of the Saronikos Gulf (Greece) Estuarine. Coastal and Shelf Science 79:733–739.
Venkatesam M.I., 1988. Occurrence and possible sources of pérylène in marine sediments-a review. Marine Chemistry 25:1-27.
Venosa A.D., Suidan M.T., Wrenn B.A., Strohmeier K.L., Haines J.R., Eberhart B.L., King D., Holder E., 1996. Bioremediation of an Experimental Oil Spill on the Shoreline of Delaware Bay. Environmental Science and Technology 30:1764-1775.
Wakeham S. G., Schaffner C., Giger W., 1980a. Polycyclic aromatic hydrocarbons in Recent lake sediments I. Compounds having anthropogenic origins. Geochimica et Cosmochimica Acta 44(3):403-413.
Wakeham SG, Schaffner C and Giger W, 1980b. Polycyclic aromatic hydrocarbons in recent lake sediments. II- Compounds derived from biogenic precursors during early diagenesis. Geochimica et Cosmochimica Acta 44:415-429.
Wakeham S. G., Sinninghe Damstà J. S., Kohnen M. E. L., De Leeuw J. W., 1995. Organic sulfur compounds formed during early diagenesis in Black Sea sediments. Geochimica et Cosmochimica Acta 59(3):521-533.
Références Bibliographiques
68
Wang Z., Fingas M., Lambert P., Zeng G., Yang C., Hollebone B., 2004. Characterization and identification of the Detroit River mystery oil spill (2002). Journal of Chromatography A 1038(1-2):201-214.
water.epa.gov/scitech/methods/cwa/pollutants.cfm.
Wernersson A.S., 2003. Predicting petroleum phototoxicity. Ecotoxicology and Environmental Safety 54(3):355-365.
Windsor J.G., Hites R.A., 1979. Polycyclic aromatic hydrocarbons in Gulf of Maine sediments and Nova Scotia soils. Geochimica et Cosmochimica Acta 43:27-33.
Wohflahrt J., 9 décembre 2008. Développement d’un indicateur d’exposition des eaux de surface aux pertes de pesticides à l’échelle du bassin versant. These: Institut National Polytechnique de Lorraine.
WHO (World Health Organization), 2006. A compendium of drinking-water quality standards in the Eastern Mediterranean region. Document WHO-EM/CEH/143/E.
WHO (World Health Organization), 2011. Region Guidelines for Drinking-water Quality, 4ème edition. ISBN 9789241548151.
www.acces.inrp.fr
www.crl-pesticides-datapool.eu
www.lemonde.fr/planete/infographie/2008/03/19/les-differentes-sources-de-pollution-de-l-eau_1025229_3244.html.
www.observatoire-pesticides.gouv.fr.
www.uipp.org
Yan L-S, 1985. Study of the carcinogenic mechanism for polycyclic aromatic hydrocarbons-extended bay region theory and its quantitative model. Carcinogenesis 6:1-6.
Yunker M., Macdonald R., Vingarzan R., Mitchell R., Goyette D., Sylvestre S., 2002. PAHs in the Fraser River basin : a critical appraisal of PAH ratios as indicators of PAH source and composition. Organic Geochemistry 33(4):489-515.
Zhang Y., Tao S., 2009. Global atmospheric emission inventory of polycyclic aromatic hydrocarbons (PAHs) for 2004. Atmospheric Environment 43: 812-819.
69
Chapitre 2.Développement Analytique
Chapitre 2. Développement Analytique
70
Introducion
La reproductibilité, la sélectivité et l’adaptation à l’analyse de traces font de la SPE la
méthode la plus adéquate pour l'analyse des contaminants organiques, comme les HAP et les
pesticides, dans les milieux aqueux. Cependant, les études relatives à son développement et à
son optimisation sont peu nombreuses. Souvent, les développements des méthodes d’analyses
par SPE se fixent sur le taux de récupération de la totalité des analytes cibles, sans tenir
compte, des consommations importantes de solvants organiques et du temps de préparation et
de concentration.
Le chapitre suivant développement analytique expose une nouvelle approche pour la
technique SPE, qui consiste à introduire la technique de centrifugation dans certaines étapes
de la procédure SPE afin de développer une méthode efficace et économique pour l'extraction
de polluants organiques de l'eau. Cette nouvelle méthode prendra en considération, les
demandes de diminution de la consommation des solvants organiques et du temps d'analyse.
Les différents étapes et paramètres influençant le taux de récupération seront étudiés et
optimisés: Sélection du type de cartouche, volume de l’échantillon, séchage de l’adsorbant
après la percolation de l’échantillon et les conditions d’élution et d'évaporation de solvant
avant analyse.
D’autre part, du fait de leurs faibles concentrations dans les eaux, les traces de HAP et
des pesticides, présents dans les systèmes aquatiques, nécessitent des méthodes d’analyse
suffisamment sensibles. L’association de la SPE avec l’analyse par GC-MS en mode
d’injection splitless est souvent précédée par une étape de concentration de l’éluat afin
d’atteindre les limites de quantification demandés, ce qui augmente les erreurs associées au
processus analytique et prolonge le temps d’analyse. Donc, afin de réduire la durée du
prétraitement de l’échantillon l’étape de la concentration de l’échantillon avant l’analyse par
GC-MS est supprimée alors que, la sensibilité de la méthode sera améliorée par l’injection
Chapitre 2. Développement Analytique
71
d’un grand volume d’échantillon par l’intermédiaire de l’injecteur à température programmée
(PTV). Les paramètres de fonctionnement seront explorés et optimisés.
Ce chapitre, constitué de trois articles, expose les travaux et les résultats des
développements analytiques réalisés durant les travaux de cette thèse. La première publication
présente les diverses étapes de l’optimisation de la technique d’extraction SPE combinée avec
la centrifugation et la discussion associée à l’élaboration d’une nouvelle méthode rapide,
économique et peu consommatrice de solvants organiques.
La deuxième publication détaille l’utilisation de l’injecteur PTV sur GC-MS lors de la
quantification des HAP dans les eaux. Les différentes conditions d’optimisation sont évoquées
et les améliorations considérables apportées par rapport à la GC-MS en mode splitless sont
clairement identifiées et indiquées.
La troisième publication présente l’élaboration et l’optimisation de la technique
d’extraction SPE – centrifugation pour l’analyse d’un large groupe de pesticides appartenant à
différentes familles chimiques dans les eaux.
Chapitre 2. Développement Analytique
72
J. Agric. Food Chem. 2011, 59, 7592-7600
Optimization of a Solid-Phase Extraction Method Using Centrifugation for the Determination of 16 Polycyclic
Aromatic Hydrocarbons in Water
Abir Kouzayha,† Mohamad Al Iskandarani,† Samia Mokh,† Abdul Rahman Rabaa,§ Helene Budzinski,# and Farouk Jaber*,†,§
†National Council for Scientific Research CNRS, Lebanese Atomic Energy Commission LAEC, Analysis of Pesticides and Organic Pollutants Laboratory LAPPO, Beirut, Lebanon§Laboratory of Analysis of Organic Compounds (509), Faculty of Sciences I, Lebanese University, Hadath, Beirut, Lebanon#ISM-LPTC-UMR 5255 (Laboratory of Physico- and Toxico-Chemistry), CNRS, Universit_e Bordeaux 1, 351Cours de la Liberation, 33405 Talence, France
Special Issue: Florida Residue Workshop 2010
Received: October 1, 2010
Revised: April 6, 2011
Accepted: April 8, 2011
Published: April 08, 2011
© 2011 American Chemical Society
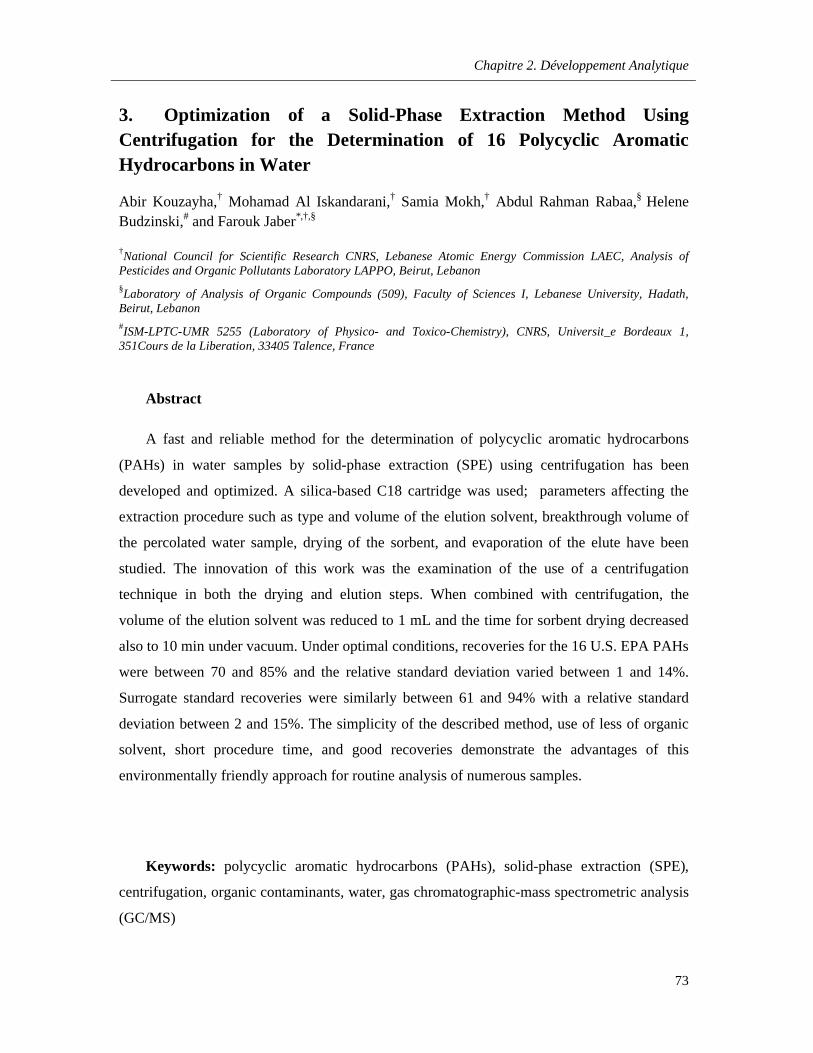
Chapitre 2. Développement Analytique
73
3. Optimization of a Solid-Phase Extraction Method Using Centrifugation for the Determination of 16 Polycyclic Aromatic Hydrocarbons in Water
Abir Kouzayha,† Mohamad Al Iskandarani,† Samia Mokh,† Abdul Rahman Rabaa,§ Helene Budzinski,# and Farouk Jaber*,†,§
†National Council for Scientific Research CNRS, Lebanese Atomic Energy Commission LAEC, Analysis of Pesticides and Organic Pollutants Laboratory LAPPO, Beirut, Lebanon§Laboratory of Analysis of Organic Compounds (509), Faculty of Sciences I, Lebanese University, Hadath, Beirut, Lebanon#ISM-LPTC-UMR 5255 (Laboratory of Physico- and Toxico-Chemistry), CNRS, Universit_e Bordeaux 1, 351Cours de la Liberation, 33405 Talence, France
Abstract
A fast and reliable method for the determination of polycyclic aromatic hydrocarbons
(PAHs) in water samples by solid-phase extraction (SPE) using centrifugation has been
developed and optimized. A silica-based C18 cartridge was used; parameters affecting the
extraction procedure such as type and volume of the elution solvent, breakthrough volume of
the percolated water sample, drying of the sorbent, and evaporation of the elute have been
studied. The innovation of this work was the examination of the use of a centrifugation
technique in both the drying and elution steps. When combined with centrifugation, the
volume of the elution solvent was reduced to 1 mL and the time for sorbent drying decreased
also to 10 min under vacuum. Under optimal conditions, recoveries for the 16 U.S. EPA PAHs
were between 70 and 85% and the relative standard deviation varied between 1 and 14%.
Surrogate standard recoveries were similarly between 61 and 94% with a relative standard
deviation between 2 and 15%. The simplicity of the described method, use of less of organic
solvent, short procedure time, and good recoveries demonstrate the advantages of this
environmentally friendly approach for routine analysis of numerous samples.
Keywords: polycyclic aromatic hydrocarbons (PAHs), solid-phase extraction (SPE),
centrifugation, organic contaminants, water, gas chromatographic-mass spectrometric analysis
(GC/MS)
Chapitre 2. Développement Analytique
74
3.1. Introduction
Water pollution by organic compounds has caused considerable concern worldwide.
The evaluation and monitoring of trace levels of the contaminants in environmental samples
are important objectives. Among a wide variety of organic pollutants present in water,
polycyclic aromatic hydrocarbons (PAHs) are of particular importance as widespread,
persistent, and toxic contaminants.1,2 Due to their mutagenic and carcinogenic characteristics,3
PAHs have been listed as priority pollutants by the U.S. Environmental Protection Agency
(EPA) and the European Union (EU).4,5 These organic compounds, which mainly contain two
or more fused aromatic rings of carbon and hydrogen atoms, originate from a wide variety of
natural and anthropogenic sources.6 They are generally formed during incomplete combustion
or pyrolysis of organic matter. Their sources in the aquatic environment include various
routes, such as fossil fuel, oil spills, and domestic and industrial wastewater discharges, as
well as atmospheric fallout deposition. Due to their low water solubility and high
hydrophobicity, PAHs are usually present in water samples at nanogram per liter levels and
lower. As a result, selective and sensitive analytical procedures are required for their detection
and control. One of the high performance methods in sample preparation is solid-phase
extraction (SPE), which has been increasingly used for extracting and concentrating different
target components from liquid samples including PAHs.7,8 For instance, two U.S. EPA
methods, 525.2 and 3535, describe the use of a SPE method for the determination of the low
microgram per liter levels of organic compounds such as PAHs from aqueous samples.9,10
Other analytical protocols based on the SPE technique are proposed and described in the
literature for PAH extraction at trace level from environmental water samples. 11_13
Although SPE has been extensively used for the analysis of PAHs in aqueous media,
relatively few studies were reported for its development and optimization.14,15 Low recoveries
of the low molecular weight (LMW) PAHs are obtained especially for the two-ring PAH
naphthalene (Nap) (16% for Kicinski et al.16 and 28% for Kabzinski et al.17). For these
reasons, there is an interest in developing a more efficient SPE method that achieves higher
recoveries for the extraction of these pollutants from water, decreasing the analysis time and
reducing the excessive amounts of organic solvents used. Rather than using traditional vacuum
flow based SPE, centrifugation is an alternate format to overcome the inconveniences in the
typical SPE techniques. Although investigation of the use of centrifugation with SPE has not
Chapitre 2. Développement Analytique
75
been carried out widely, it has been reported that centrifugation in SPE was utilized to force
the sample through the cartridge for the analysis of peptides, proteins, and DNA.18
In the present work, a new approach for an economical, fast, and efficient SPE method
using centrifugation was proposed and developed for the analysis of the 16 U.S. EPA PAHs in
aqueous samples. Parameters affecting the recovery, extraction time, and solvent consumption
were studied and optimized: Selection of the Cartridge Type (section 3.1), Breakthrough
Volume (section 3.2), Drying after Sample Loading (section 3.3), Elution Solvent (section
3.4), and Evaporation Step (section 3.5).
3.2. Materials and methods
3.2.1. Chemicals, Standards, Solvents, and Small Apparatus.
All chemicals were of analytical reagent grade and were used without further
purification. The 16 U.S. EPA PAHs (Figure 3.1) were purchased from ChemService as mix
Standard Reference Solution of 100 mg/L in methanol (PPH-10 rpm), Chem Service, West
Chester, PA): naphthalene (Nap), acenaphthylene (AcPy), acenaphthene (AcP), fluorene (Flu),
phenanthrene (Phe), anthracene (Ant), fluoranthene (FL), pyrene (Pyr), benzo[a]anthracene
(B[a]A), chrysene (Chr), benzo[b]fluoranthene (B[b]FL), benzo[k]fluoranthene (B[k]FL),
benzo[a]pyrene (B[a]P), indeno[1,2,3-cd]pyrene (InP), dibenzo[a,h]anthracene (DBA), and
benzo-[ghi]perylene (B[ghi]P). Intermediary solutions (containing 10 mg/L of each analyte)
were prepared by diluting the standard reference solution of PAHs with an appropriate solvent
(ethanol, acetone, or isooctane). From the intermediary solutions, PAH working solutions at a
level of 1 mg/L were prepared. The pure solid surrogate standards, naphthalene-d8 (Nap-d8),
phenanthrene-d10 (Phe-d10), anthracene-d10 (Ant-d10), fluoranthene-d10 (FL-d10), chrysene-d12
(Chr-d12), benzo[e]pyrene-d12 (B[e]P-d12), benzo-[a]pyrene-d12 (B[a]P-d12), and
benzo[ghi]perylene-d12 (B[ghi]P-d12), were purchased from Supelco (Bellefonte, PA) with two
additional deuterated PAHs, pyrene-d10 (Pyr-d10) and benzo[b]fluoranthene-d12 (B[b]FL-d12),
used as internal standard at the end of the protocol. Separate 1000 mg/L stock solutions of
each deuterated standard were prepared by dissolving about 0.01000 g of the corresponding
compound in isooctane or ethanol. Intermediary 50 mg/L deuterated mix solutions of
surrogate and internal standards were prepared in different solvents (ethanol, acetone, or
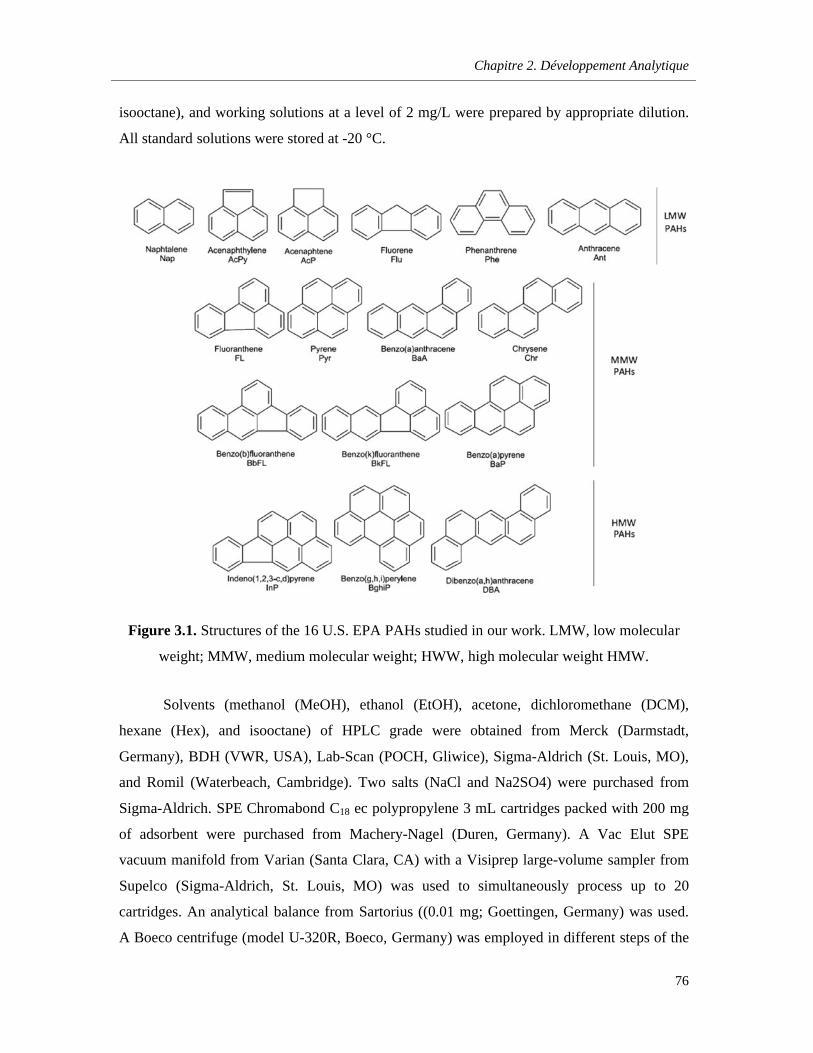
Chapitre 2. Développement Analytique
76
isooctane), and working solutions at a level of 2 mg/L were prepared by appropriate dilution.
All standard solutions were stored at -20 °C.
Figure 3.1. Structures of the 16 U.S. EPA PAHs studied in our work. LMW, low molecular
weight; MMW, medium molecular weight; HWW, high molecular weight HMW.
Solvents (methanol (MeOH), ethanol (EtOH), acetone, dichloromethane (DCM),
hexane (Hex), and isooctane) of HPLC grade were obtained from Merck (Darmstadt,
Germany), BDH (VWR, USA), Lab-Scan (POCH, Gliwice), Sigma-Aldrich (St. Louis, MO),
and Romil (Waterbeach, Cambridge). Two salts (NaCl and Na2SO4) were purchased from
Sigma-Aldrich. SPE Chromabond C18 ec polypropylene 3 mL cartridges packed with 200 mg
of adsorbent were purchased from Machery-Nagel (Duren, Germany). A Vac Elut SPE
vacuum manifold from Varian (Santa Clara, CA) with a Visiprep large-volume sampler from
Supelco (Sigma-Aldrich, St. Louis, MO) was used to simultaneously process up to 20
cartridges. An analytical balance from Sartorius ((0.01 mg; Goettingen, Germany) was used.
A Boeco centrifuge (model U-320R, Boeco, Germany) was employed in different steps of the
Chapitre 2. Développement Analytique
77
preparation method. A sample concentrator from Techne (Staffordshire, U.K.) was used for
sample concentration under nitrogen. Other small apparatus such as an ultrasonic bath and a
vortex shaker were used.
3.2.2. SPE Experimental Procedure
During a regular SPE process a sequence of operations must be reproduced carefully to
avoid additional changes; this was taken into account in the optimization carried in our study.
The sum of the 16 PAHs analyzed in this study was evaluated in a high-quality Lebanese
drinking water (mineral spring water), and its low value was considered to be negligible, so it
was used as a blank during the experiments. Samples were prepared by spiking blank water
with target analytes at a known concentration (0.05 μg/L). The eight deuterated PAHs used as
surrogate standards were added at this stage at the same concentration. For the
preconcentration step, the Chromabond C18 cartridges were preconditioned and activated at
the beginning with 3 mL of methanol and then 3 mL of water. Each water sample was
percolated using a regulated vacuum through the SPE cartridge with a flow rate of 5 – 10
mL/min, and then the cartridge was dried. The analytes were eluted by percolating the elution
solvent on the SPE cartridge at atmospheric pressure. When the centrifugation was used for
sample elution, the solvent was added to the cartridge with the valve closed, then the cartridge
was centrifuged, and finally the elute was recovered. The extract, if necessary, was stored at
about -20 °C until analysis or was evaporated directly to about 100 μL with a weak nitrogen
stream. The obtained extract was reconstituted in 200 μL of isooctane, and the solution of
recovery internal standards (Pyr-d10 and B[b]FL-d12) was added. Samples were stored in the
dark at about -20 °C until measurement.
3.2.3. Gas Chromatographic_Mass Spectrometric (GC-MS) Analysis
The analysis of PAHs was carried out on an Agilent 6890N gas chromatograph
coupled to an Agilent 5975 mass spectrometer system (GC-MS) with an Agilent 7683B
autosampler (Agilent Technologies, Santa Clara, CA). Chromatographic separation was
performed on a HP-5MS fused silica capillary column (30 m, 0.25 mm, 0.25 μm, Agilent
J&W GC columns). Helium (purity > 99.999%) was used as the carrier gas at a flow rate of
1.5 mL/min. The split-splitless injector temperature was set at 240 °C. The GC oven was
initially held at 50 °C for 2 min and then programmed to 155 °C at a rate of 5 °C/min. After
Chapitre 2. Développement Analytique
78
being kept at 155 °C for 2 min, the oven was programmed to 280 °C at a rate of 3 °C/min.
Finally, it was held for 2 min to achieve a running time of 69 min. The mass spectrometer was
operated in the electron ionization mode (EI, 70 eV). Transfer line, ion source, and quadrupole
analyzer temperatures were maintained at 280, 230, and 150 °C, respectively, and a solvent
delay of 10 min was selected. The injection volume was 1 μL, and all injections were in
splitless mode. Selective ion monitoring (SIM) mode was adopted for quantitative
determination of the analytes using two or three ions for each compound. The ions monitored
for each analyte, the surrogate standards, and the corresponding internal standards are
summarized in Table 3.1. The first ion, which in all cases corresponded to the molecular mass,
was used as quantifier, and the second and the third ions were used as qualifiers.
3.3. Results and Discussion
The purpose of this study was to develop and optimize a new SPE method using
centrifugation for the analysis and ultratrace quantification of the 16 PAHs identified by the
U.S. EPA as priority pollutants in water samples. Experiments were performed to evaluate the
different SPE parameters and carried out in triplicates. The purpose was to determine the
recoveries of the compounds in each individual step to evaluate the optimal conditions.
3.3.1. Selection of Cartridge Type
PAHs belong to the class of weak polarity organic compounds. According to the rule
of like dissolves like, a SPE sorbent with similar polarity will facilitate enrichment. At present,
the preferred SPE sorbent for the extraction of PAHs from water is reversed-phase carbon 18
bonded-silica (C18) as it gives the best performance among the different SPE polymeric and
carbon-based sorbents.19,20 On the basis of the theoretical principle as well as literature
account, SiO2-C18 was selected as the SPE sorbent in this study.
3.3.2. Breakthrough Volume
Breakthrough of the analyte occurs either when the analyte is no longer retained by the
sorbent or when the capacity of the sorbent has been overloaded.21 In practical environmental
analysis, the need to determine trace amounts of organic compounds has led to an increase of
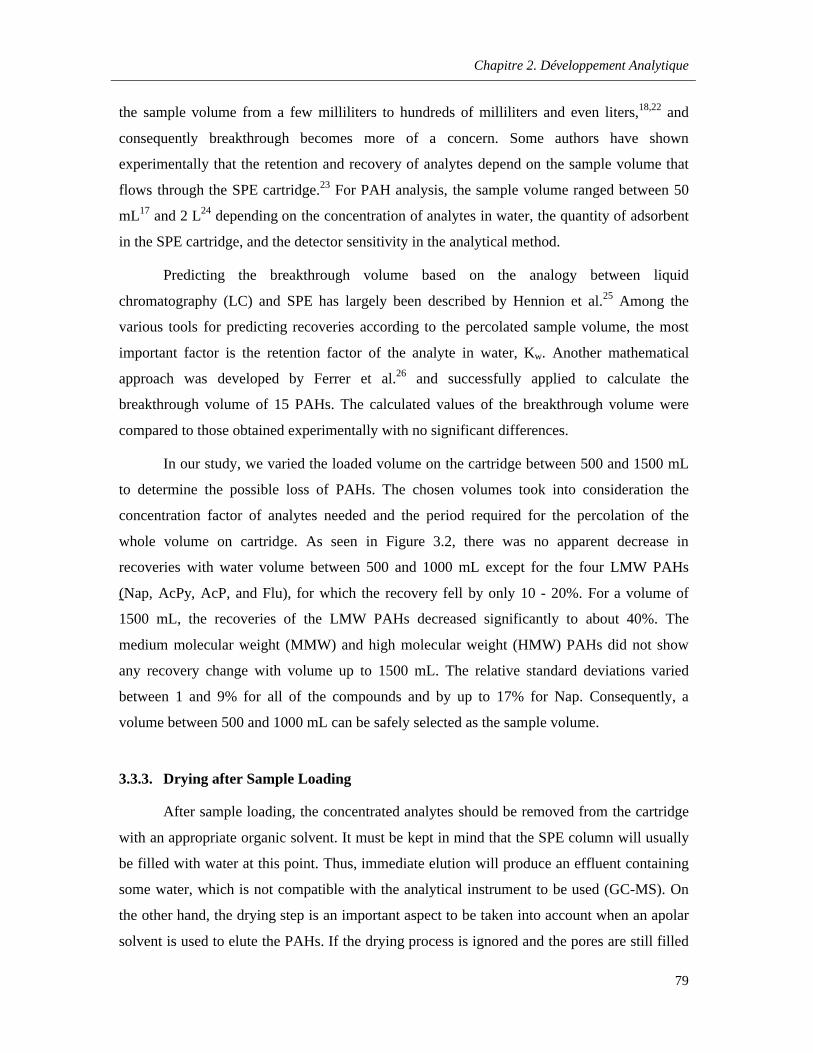
Chapitre 2. Développement Analytique
79
the sample volume from a few milliliters to hundreds of milliliters and even liters,18,22 and
consequently breakthrough becomes more of a concern. Some authors have shown
experimentally that the retention and recovery of analytes depend on the sample volume that
flows through the SPE cartridge.23 For PAH analysis, the sample volume ranged between 50
mL17 and 2 L24 depending on the concentration of analytes in water, the quantity of adsorbent
in the SPE cartridge, and the detector sensitivity in the analytical method.
Predicting the breakthrough volume based on the analogy between liquid
chromatography (LC) and SPE has largely been described by Hennion et al.25 Among the
various tools for predicting recoveries according to the percolated sample volume, the most
important factor is the retention factor of the analyte in water, Kw. Another mathematical
approach was developed by Ferrer et al.26 and successfully applied to calculate the
breakthrough volume of 15 PAHs. The calculated values of the breakthrough volume were
compared to those obtained experimentally with no significant differences.
In our study, we varied the loaded volume on the cartridge between 500 and 1500 mL
to determine the possible loss of PAHs. The chosen volumes took into consideration the
concentration factor of analytes needed and the period required for the percolation of the
whole volume on cartridge. As seen in Figure 3.2, there was no apparent decrease in
recoveries with water volume between 500 and 1000 mL except for the four LMW PAHs
(Nap, AcPy, AcP, and Flu), for which the recovery fell by only 10 - 20%. For a volume of
1500 mL, the recoveries of the LMW PAHs decreased significantly to about 40%. The
medium molecular weight (MMW) and high molecular weight (HMW) PAHs did not show
any recovery change with volume up to 1500 mL. The relative standard deviations varied
between 1 and 9% for all of the compounds and by up to 17% for Nap. Consequently, a
volume between 500 and 1000 mL can be safely selected as the sample volume.
3.3.3. Drying after Sample Loading
After sample loading, the concentrated analytes should be removed from the cartridge
with an appropriate organic solvent. It must be kept in mind that the SPE column will usually
be filled with water at this point. Thus, immediate elution will produce an effluent containing
some water, which is not compatible with the analytical instrument to be used (GC-MS). On
the other hand, the drying step is an important aspect to be taken into account when an apolar
solvent is used to elute the PAHs. If the drying process is ignored and the pores are still filled
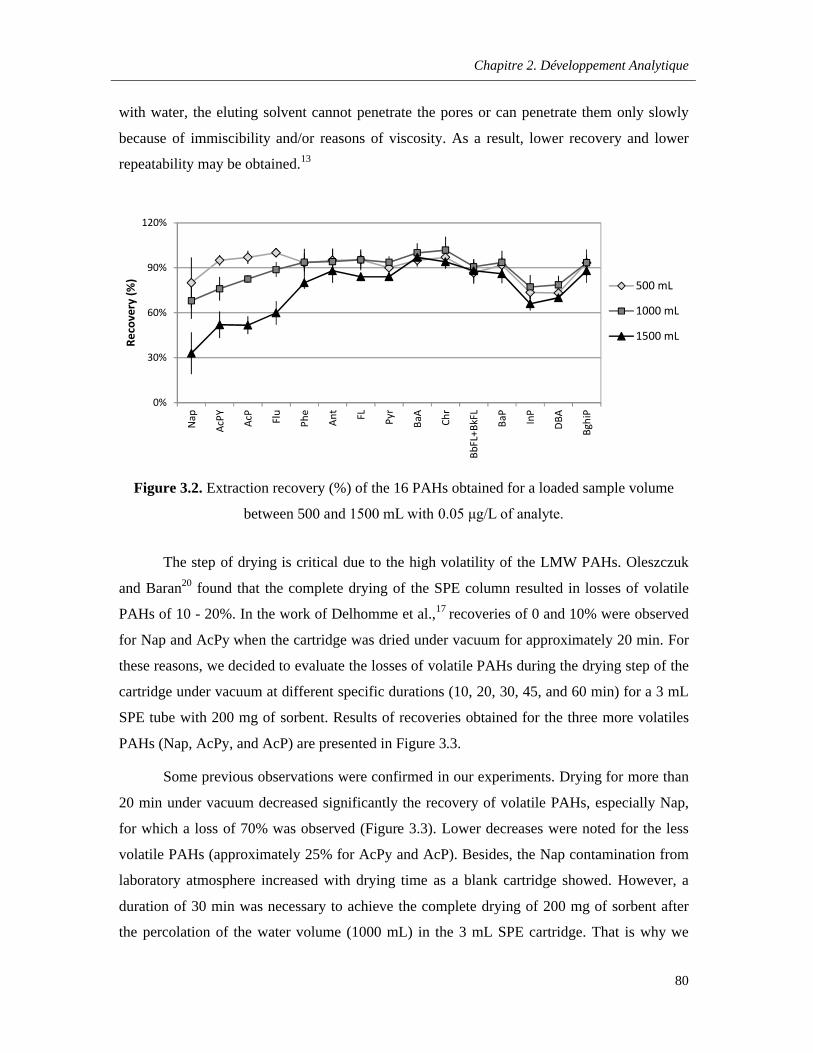
Chapitre 2. Développement Analytique
80
with water, the eluting solvent cannot penetrate the pores or can penetrate them only slowly
because of immiscibility and/or reasons of viscosity. As a result, lower recovery and lower
repeatability may be obtained.13
Figure 3.2. Extraction recovery (%) of the 16 PAHs obtained for a loaded sample volume
between 500 and 1500 mL with 0.05 μg/L of analyte.
The step of drying is critical due to the high volatility of the LMW PAHs. Oleszczuk
and Baran20 found that the complete drying of the SPE column resulted in losses of volatile
PAHs of 10 - 20%. In the work of Delhomme et al.,17 recoveries of 0 and 10% were observed
for Nap and AcPy when the cartridge was dried under vacuum for approximately 20 min. For
these reasons, we decided to evaluate the losses of volatile PAHs during the drying step of the
cartridge under vacuum at different specific durations (10, 20, 30, 45, and 60 min) for a 3 mL
SPE tube with 200 mg of sorbent. Results of recoveries obtained for the three more volatiles
PAHs (Nap, AcPy, and AcP) are presented in Figure 3.3.
Some previous observations were confirmed in our experiments. Drying for more than
20 min under vacuum decreased significantly the recovery of volatile PAHs, especially Nap,
for which a loss of 70% was observed (Figure 3.3). Lower decreases were noted for the less
volatile PAHs (approximately 25% for AcPy and AcP). Besides, the Nap contamination from
laboratory atmosphere increased with drying time as a blank cartridge showed. However, a
duration of 30 min was necessary to achieve the complete drying of 200 mg of sorbent after
the percolation of the water volume (1000 mL) in the 3 mL SPE cartridge. That is why we
0%
30%
60%
90%
120%
Nap
AcPY Ac
P
Flu
Phe
Ant FL Pyr
BaA
Chr
BbFL
+BkF
L
BaP
InP
DBA
Bghi
P
Reco
very
(%) 500 mL
1000 mL
1500 mL
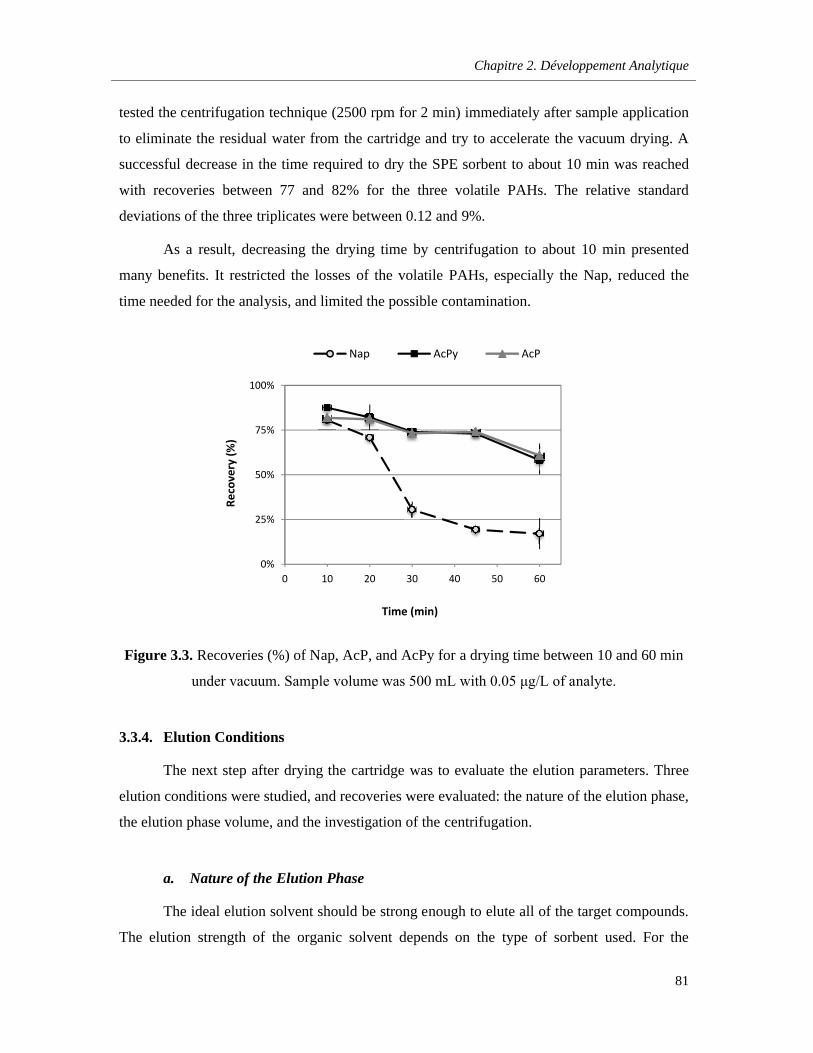
Chapitre 2. Développement Analytique
81
tested the centrifugation technique (2500 rpm for 2 min) immediately after sample application
to eliminate the residual water from the cartridge and try to accelerate the vacuum drying. A
successful decrease in the time required to dry the SPE sorbent to about 10 min was reached
with recoveries between 77 and 82% for the three volatile PAHs. The relative standard
deviations of the three triplicates were between 0.12 and 9%.
As a result, decreasing the drying time by centrifugation to about 10 min presented
many benefits. It restricted the losses of the volatile PAHs, especially the Nap, reduced the
time needed for the analysis, and limited the possible contamination.
Figure 3.3. Recoveries (%) of Nap, AcP, and AcPy for a drying time between 10 and 60 min
under vacuum. Sample volume was 500 mL with 0.05 μg/L of analyte.
3.3.4. Elution Conditions
The next step after drying the cartridge was to evaluate the elution parameters. Three
elution conditions were studied, and recoveries were evaluated: the nature of the elution phase,
the elution phase volume, and the investigation of the centrifugation.
a. Nature of the Elution Phase
The ideal elution solvent should be strong enough to elute all of the target compounds.
The elution strength of the organic solvent depends on the type of sorbent used. For the
0%
25%
50%
75%
100%
0 10 20 30 40 50 60
Reco
very
(%)
Time (min)
Nap AcPy AcP
Chapitre 2. Développement Analytique
82
reversed phase sorbent, an organic solvent with lower polarity will exhibit stronger elution. In
the surveyed scientific literature, a considerable number of single organic solvents and
mixtures with low polarities have been used for the elution of PAHs from a C18 cartridge.
DCM,27 Hex,28 and their mixture (50:50 (v/v))29 have been used extensively for this purpose
with acceptable recoveries. These elution phases with a sufficient volume of 9 mL were tested
in our study for the elution of the 16 analyzed PAHs. A more polar mixture of DCM/EtOH
(50:50, (v/v)) was also tested to study the influence of the polarity.
According to the results shown in Figure 3.4, recoveries of all PAHs increased when
the polarity of the elution phase was decreased, especially for the HMW PAHs. Recoveries of
61, 70, and 83% were obtained for InP, DBA, and BghiP with DCM/EtOH; 79, 92, and 99%
with DCM, 82, 88, and 96% with DCM/ Hex; and 82, 76, and 90% with Hex. The relative
standard deviations were below 10% for the HMW compounds. Therefore, to ensure higher
recoveries of PAHs, DCM, DCM/Hex, or Hex is recommended as elution solvent. In addition
to the elution strength, DCM presents another advantage, which is the high vapor pressure
necessary to achieve quick and effective solvent evaporation. Therefore, remaining
experiments were conducted with DCM.
Figure 3.4. Influence of elution solvent polarity (DCM/EtOH, DCM, DCM/Hex, and Hex) on
the recoveries of the 16 PAHs extracted from 500 mL of sample with 0.05 μg/L of analyte.
Cartridges were dried with 2 min of centrifugation followed by 10 min under vacuum.
0%
30%
60%
90%
120%
Nap
AcPY Ac
P
Flu
Phe
Ant FL Pyr
BaA
Chr
BbFL
+BkF
L BaP
InP
DBA
Bghi
P
Reco
very
%
DCM/EtOH DCM DCM/Hex Hex
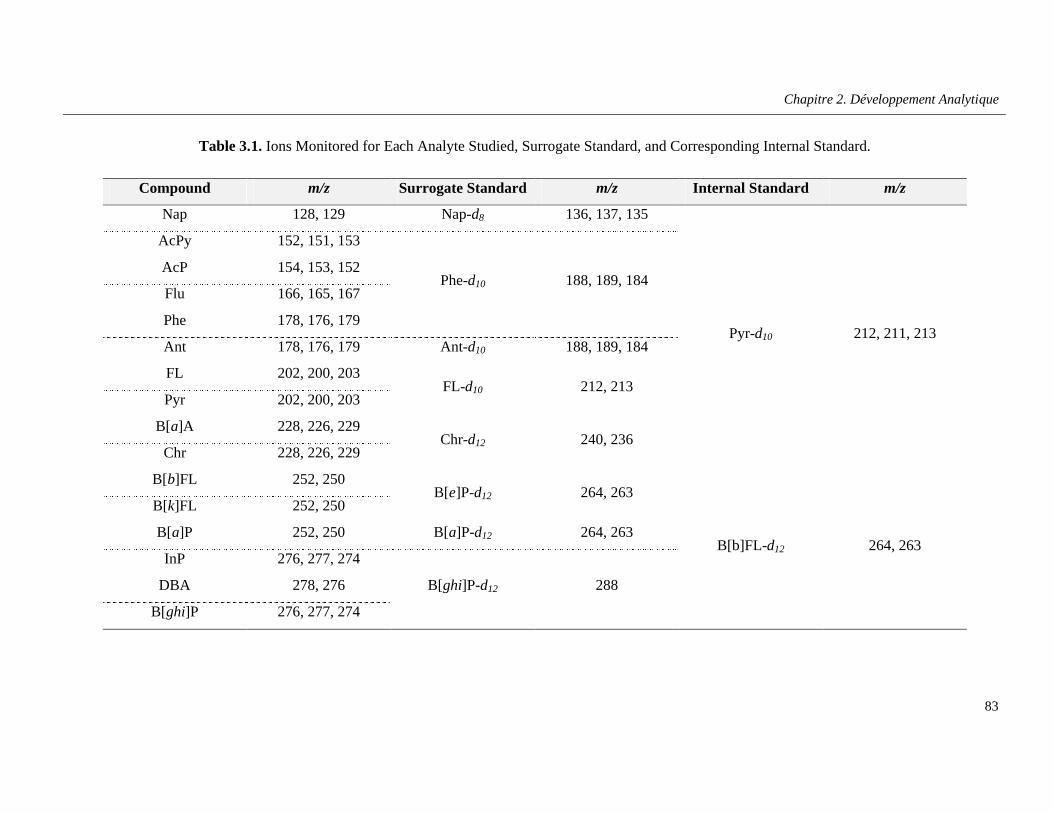
Chapitre 2. Développement Analytique
83
Table 3.1. Ions Monitored for Each Analyte Studied, Surrogate Standard, and Corresponding Internal Standard.
Compound m/z Surrogate Standard m/z Internal Standard m/z
Nap 128, 129 Nap-d8 136, 137, 135
Pyr-d10 212, 211, 213
AcPy 152, 151, 153
Phe-d10 188, 189, 184AcP 154, 153, 152
Flu 166, 165, 167
Phe 178, 176, 179
Ant 178, 176, 179 Ant-d10 188, 189, 184
FL 202, 200, 203FL-d10 212, 213
Pyr 202, 200, 203
B[a]A 228, 226, 229Chr-d12 240, 236
Chr 228, 226, 229
B[b]FL 252, 250B[e]P-d12 264, 263
B[b]FL-d12 264, 263
B[k]FL 252, 250
B[a]P 252, 250 B[a]P-d12 264, 263
InP 276, 277, 274
B[ghi]P-d12 288DBA 278, 276
B[ghi]P 276, 277, 274
Chapitre 2. Développement Analytique
84
b. Elution Phase Volume
After the nature of the elution phase has been chosen, it is important to find the
appropriate volume needed for a complete elution of the 16 analyzed PAHs. Different
volumes of DCM, 3, 5, 7, and 9mL, were evaluated, and recoveries are presented in Figure
3.5.
Using only 3 mL of DCM, the less hydrophobic PAHs or LMW PAHs were
completely eluted (77% for Nap, 72% for AcPy, 69% for AcP, 81% for Flu, and 86% for
Phe), but the volume of 3 mL was not sufficient for the elution of the HMW PAHs (48% for
BghiP as for DBA and 51% for InP). When the amount of DCM was increased from 3 to 5
mL, recoveries increased slightly (11% for BghiP, 5% for DBA, and no significant difference
for InP). Further increases to 7 and 9 mL resulted in remarkable additional increases in the
recoveries of HMW PAHs (by as much as 17% for BghiP, 23% for DBA, and 35% for InP).
As a result, 9 mL of DCM was required to ensure a maximum elution of the 16 PAHs,
especially the HMW PAHs. The relative standard deviations of the three repetitions at each
elution volume were between 0.23 and 16.19%.
c. Effect of Centrifugation
Previous experiments proved that 9 mL of DCM per sample is required for the
quantitative elution of all 16 PAHs from the SPE cartridge. The 9 mL per sample is not an
enormous quantity of solvent when only a few samples are being analyzed, but during
monitoring programs and routine analyses of PAHs, thousands of samples are analyzed
annually, which greatly increases the consumption of DCM and the costs of the analysis.
Moreover, the evaporation of 9 mL of DCM under a weak stream of nitrogen may take up to
an hour, which is a waste of time. Therefore, reducing the elution volume is a necessity to
decrease the need for a long evaporation step and consequently the risk of loss of high vapor
pressure compounds.
For this purpose, centrifugation was investigated as an alternate technique for elution.
In the first experiment, we applied a centrifugation technique for 1 min at 2300 rpm using 1
mL of DCM three times. The total volume of elution solvent of 3 mL was analyzed and
compared to the regular elution directly on cartridge using 3 and 9 mL of DCM. It is clear in
the results illustrated in Figure 3.6 that the recoveries obtained using only 3mL of DCM with
Chapitre 2. Développement Analytique
85
centrifugation were comparable to those with 9 mL of DCM for the HMW PAHs and better
for the LMW PAHs. In fact, the rapid rotation of the centrifuge with the valve closed ensures
that the adsorbent is well impregnated with the elution solvent, enabling a complete
desorption of the analytes into the solvent; thus, when the valve was open, a complete elution
of analytes, even the strongly adsorbed HMW PAHs, was done using a small volume of
solvent. The relative standard deviations of the 16 PAHs were all below 5%.
During elution using centrifugation, each 1 mL of DCM was recovered and analyzed
separately by GC-MS (Figure 3.7). For all 16 PAHs analyzed, a recovery of >70% was
achieved with only 1mL of DCM, and the relative standard deviations were below 10%. In
the second and third elution volumes, an insignificant amount of analytes was found.
Centrifugation speed and time are not critical factors in the elution as long as they are
sufficient to ensure that the stationary phase is well impregnated with the elution solvent.
3.3.5. Evaporation Step
Evaporation is an important step in sample preparation to be considered and discussed,
because it affects directly the recoveries and the time needed for sample analysis. The 16
PAHs selected in our study are a group of compounds with different physicochemical
properties; the LMW PAHs present a high vapor pressure that could lead to loss during the
evaporation, contrary to the HMW PAHs. Several factors influence the evaporation rate and
losses of compounds: type of solvent, initial solvent volume, applied temperature, and
nitrogen flow.
a. Temperature Effect
Heating should be supplied to the sample to obtain a rapid and efficient evaporation.
In the absence of any external heating source, the sample under nitrogen flow evaporates and
cools until the vapor pressure is very low and the evaporation slows dramatically. The applied
temperature is a critical factor during the evaporation step because overheating can lead to
high losses of the more volatile two and three ring PAHs.
For reasons of simplicity the three more volatile PAHs (Nap, AcPY, and AcP) were
selected to determine the optimal operating conditions. Triplicate samples of 1 mL of DCM
containing 0.05 μg of each analyte were concentrated at 25, 40, 50, and 60 °C, and the results
are illustrated in Figure 3.8.
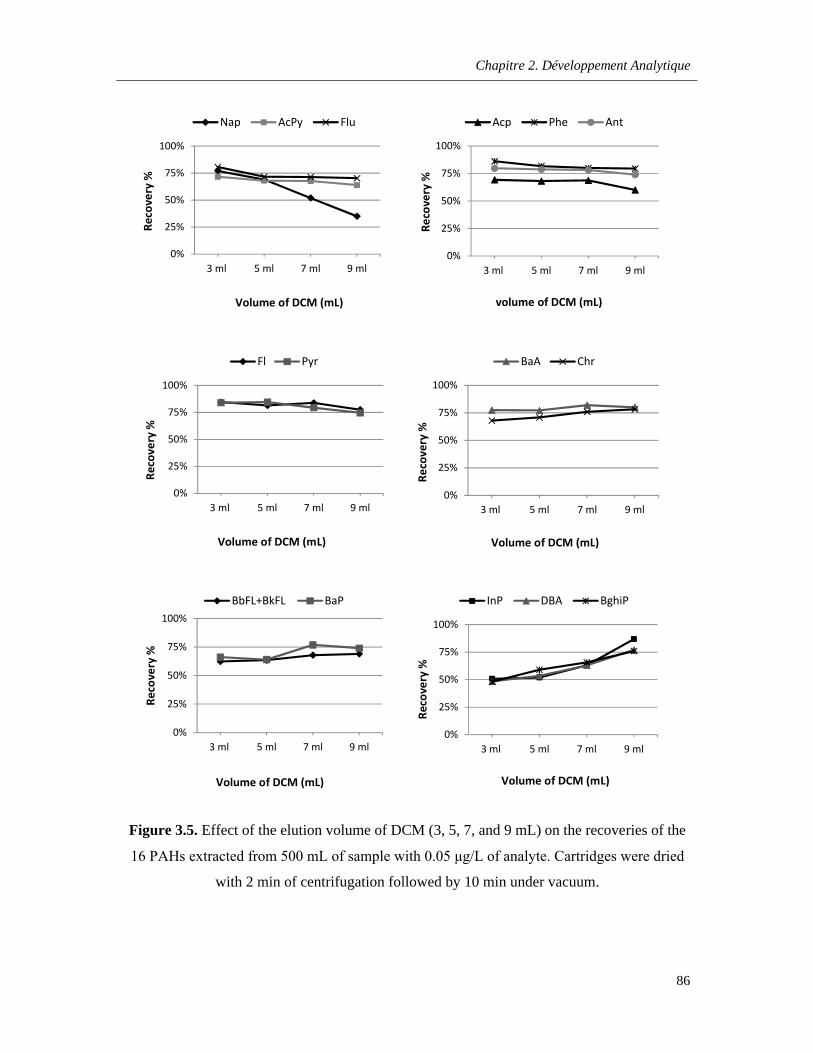
Chapitre 2. Développement Analytique
86
Figure 3.5. Effect of the elution volume of DCM (3, 5, 7, and 9 mL) on the recoveries of the
16 PAHs extracted from 500 mL of sample with 0.05 μg/L of analyte. Cartridges were dried
with 2 min of centrifugation followed by 10 min under vacuum.
0%
25%
50%
75%
100%
3 ml 5 ml 7 ml 9 ml
Reco
very
%
Volume of DCM (mL)
Nap AcPy Flu
0%
25%
50%
75%
100%
3 ml 5 ml 7 ml 9 ml
Reco
very
%
volume of DCM (mL)
Acp Phe Ant
0%
25%
50%
75%
100%
3 ml 5 ml 7 ml 9 ml
Reco
very
%
Volume of DCM (mL)
Fl Pyr
0%
25%
50%
75%
100%
3 ml 5 ml 7 ml 9 ml
Reco
very
%
Volume of DCM (mL)
BaA Chr
0%
25%
50%
75%
100%
3 ml 5 ml 7 ml 9 ml
Reco
very
%
Volume of DCM (mL)
BbFL+BkFL BaP
0%
25%
50%
75%
100%
3 ml 5 ml 7 ml 9 ml
Reco
very
%
Volume of DCM (mL)
InP DBA BghiP
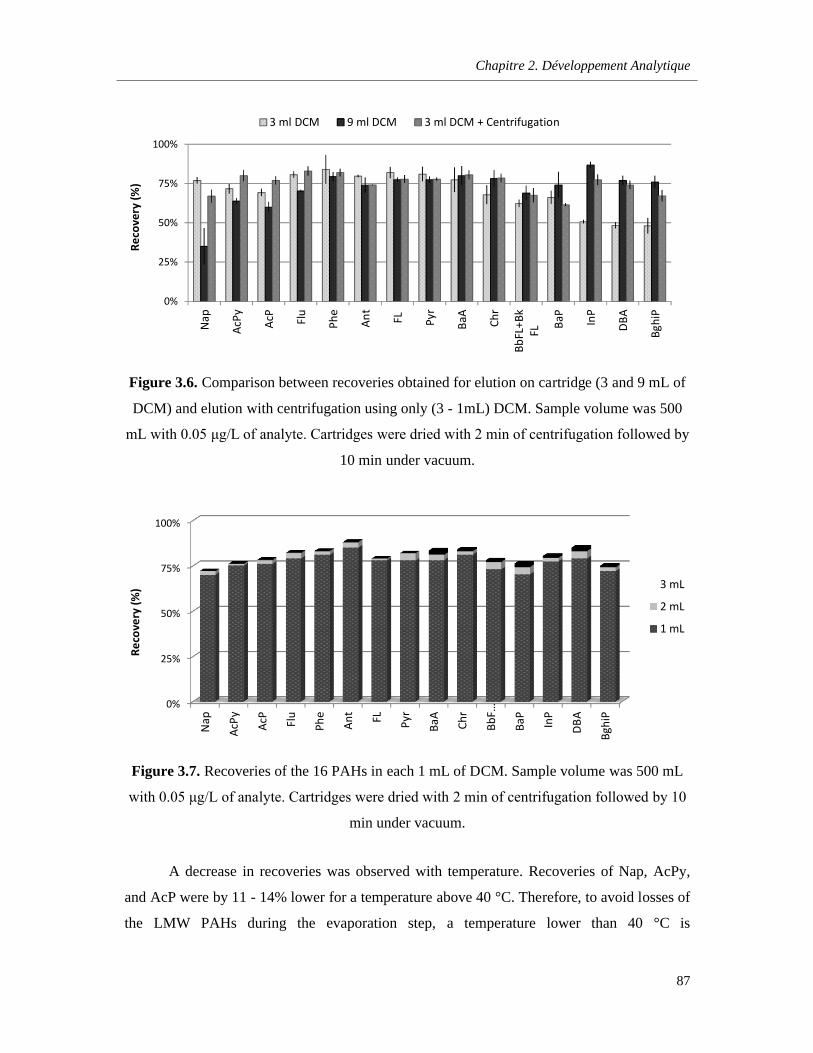
Chapitre 2. Développement Analytique
87
Figure 3.6. Comparison between recoveries obtained for elution on cartridge (3 and 9 mL of
DCM) and elution with centrifugation using only (3 - 1mL) DCM. Sample volume was 500
mL with 0.05 μg/L of analyte. Cartridges were dried with 2 min of centrifugation followed by
10 min under vacuum.
Figure 3.7. Recoveries of the 16 PAHs in each 1 mL of DCM. Sample volume was 500 mL
with 0.05 μg/L of analyte. Cartridges were dried with 2 min of centrifugation followed by 10
min under vacuum.
A decrease in recoveries was observed with temperature. Recoveries of Nap, AcPy,
and AcP were by 11 - 14% lower for a temperature above 40 °C. Therefore, to avoid losses of
the LMW PAHs during the evaporation step, a temperature lower than 40 °C is
0%
25%
50%
75%
100%
Nap
AcPy AcP
Flu
Phe
Ant
FL Pyr
BaA
Chr
BbFL
+Bk
FL
BaP
InP
DBA
Bghi
P
Reco
very
(%)
3 ml DCM 9 ml DCM 3 ml DCM + Centrifugation
0%
25%
50%
75%
100%
Nap
AcPy Ac
P
Flu
Phe
Ant FL Pyr
BaA
Chr
BbF…
BaP
InP
DBA
Bghi
P
Reco
very
(%) 3 mL
2 mL
1 mL
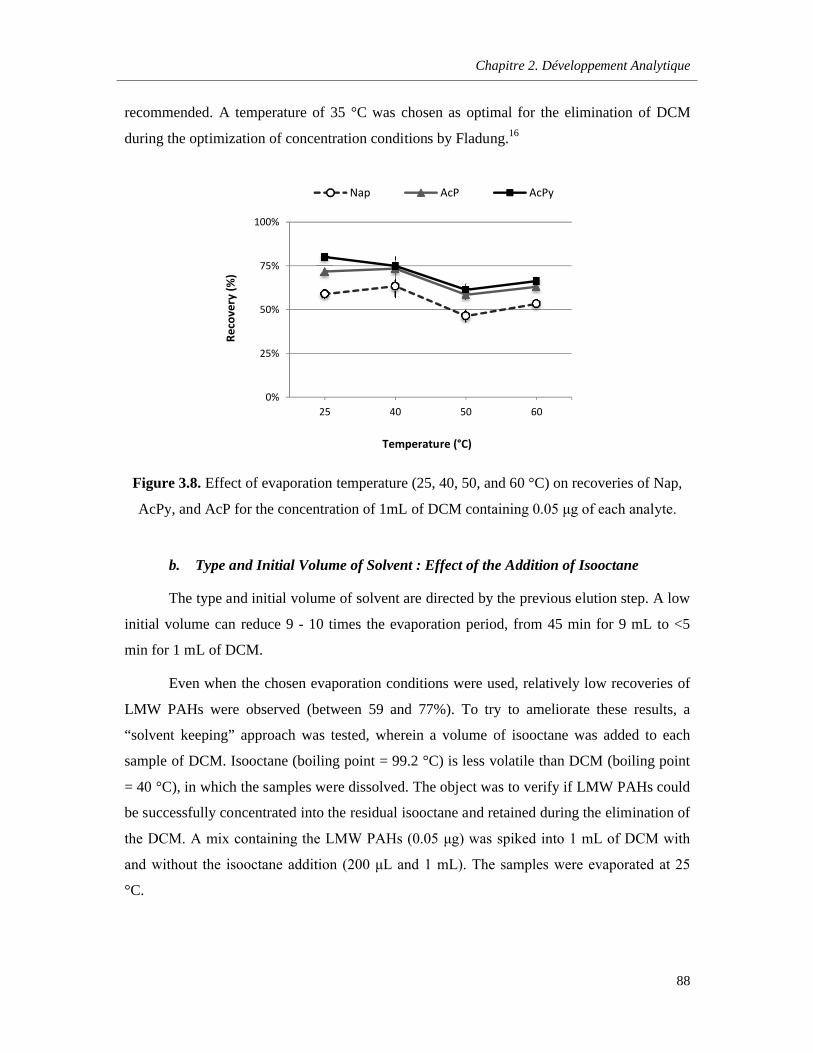
Chapitre 2. Développement Analytique
88
recommended. A temperature of 35 °C was chosen as optimal for the elimination of DCM
during the optimization of concentration conditions by Fladung.16
Figure 3.8. Effect of evaporation temperature (25, 40, 50, and 60 °C) on recoveries of Nap,
AcPy, and AcP for the concentration of 1mL of DCM containing 0.05 μg of each analyte.
b. Type and Initial Volume of Solvent : Effect of the Addition of Isooctane
The type and initial volume of solvent are directed by the previous elution step. A low
initial volume can reduce 9 - 10 times the evaporation period, from 45 min for 9 mL to <5
min for 1 mL of DCM.
Even when the chosen evaporation conditions were used, relatively low recoveries of
LMW PAHs were observed (between 59 and 77%). To try to ameliorate these results, a
“solvent keeping” approach was tested, wherein a volume of isooctane was added to each
sample of DCM. Isooctane (boiling point = 99.2 °C) is less volatile than DCM (boiling point
= 40 °C), in which the samples were dissolved. The object was to verify if LMW PAHs could
be successfully concentrated into the residual isooctane and retained during the elimination of
the DCM. A mix containing the LMW PAHs (0.05 μg) was spiked into 1 mL of DCM with
and without the isooctane addition (200 μL and 1 mL). The samples were evaporated at 25
°C.
0%
25%
50%
75%
100%
25 40 50 60
Reco
very
(%)
Temperature (°C)
Nap AcP AcPy
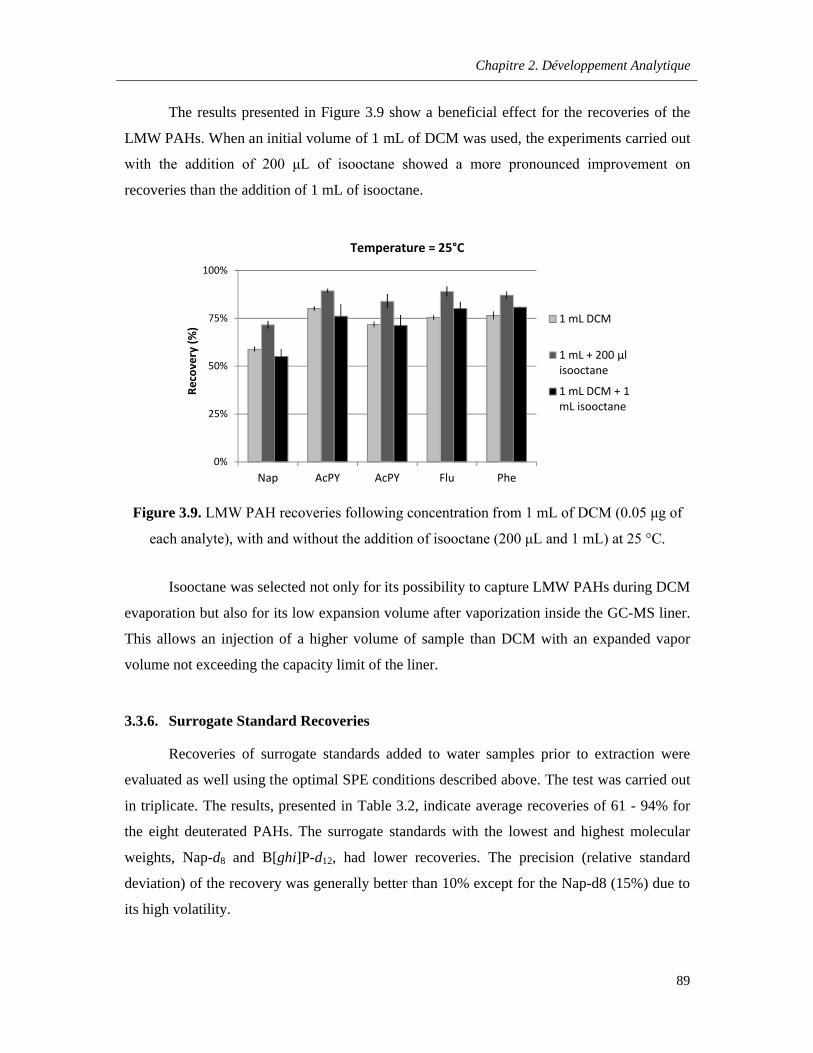
Chapitre 2. Développement Analytique
89
The results presented in Figure 3.9 show a beneficial effect for the recoveries of the
LMW PAHs. When an initial volume of 1 mL of DCM was used, the experiments carried out
with the addition of 200 μL of isooctane showed a more pronounced improvement on
recoveries than the addition of 1 mL of isooctane.
Figure 3.9. LMW PAH recoveries following concentration from 1 mL of DCM (0.05 μg of
each analyte), with and without the addition of isooctane (200 μL and 1 mL) at 25 °C.
Isooctane was selected not only for its possibility to capture LMW PAHs during DCM
evaporation but also for its low expansion volume after vaporization inside the GC-MS liner.
This allows an injection of a higher volume of sample than DCM with an expanded vapor
volume not exceeding the capacity limit of the liner.
3.3.6. Surrogate Standard Recoveries
Recoveries of surrogate standards added to water samples prior to extraction were
evaluated as well using the optimal SPE conditions described above. The test was carried out
in triplicate. The results, presented in Table 3.2, indicate average recoveries of 61 - 94% for
the eight deuterated PAHs. The surrogate standards with the lowest and highest molecular
weights, Nap-d8 and B[ghi]P-d12, had lower recoveries. The precision (relative standard
deviation) of the recovery was generally better than 10% except for the Nap-d8 (15%) due to
its high volatility.
0%
25%
50%
75%
100%
Nap AcPY AcPY Flu Phe
Reco
very
(%)
Temperature = 25°C
1 mL DCM
1 mL + 200 μl isooctane
1 mL DCM + 1mL isooctane
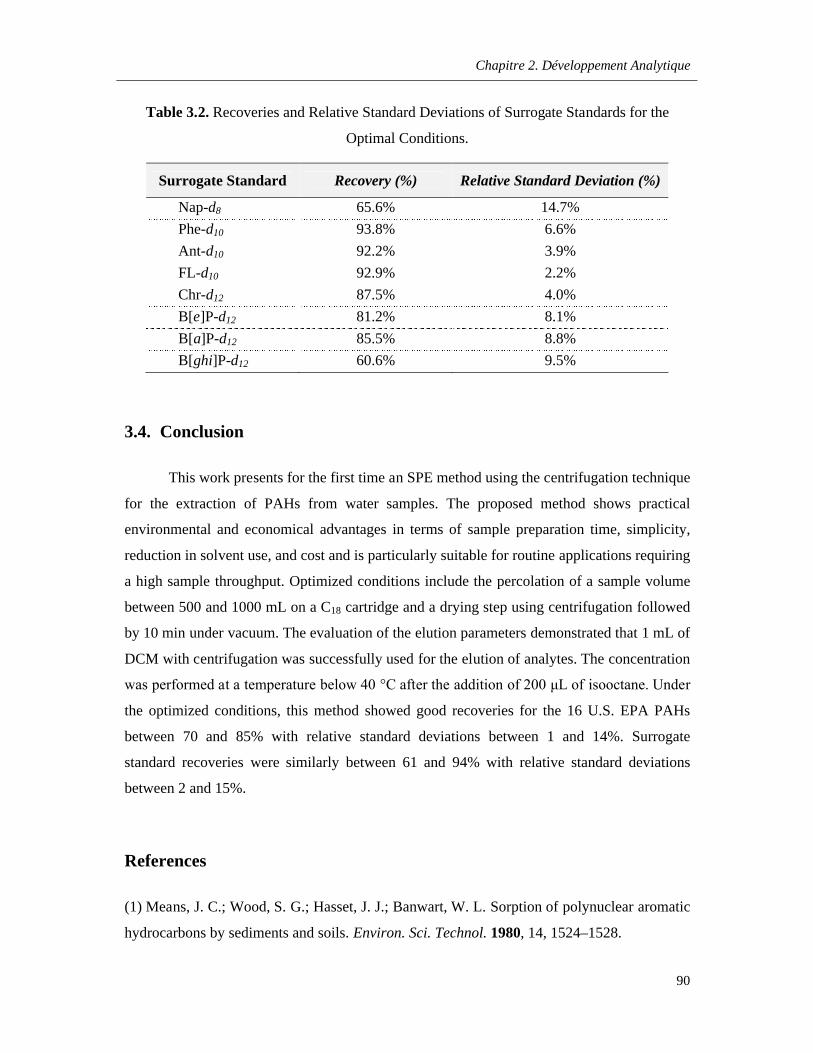
Chapitre 2. Développement Analytique
90
Table 3.2. Recoveries and Relative Standard Deviations of Surrogate Standards for the
Optimal Conditions.
Surrogate Standard Recovery (%) Relative Standard Deviation (%)
Nap-d8 65.6% 14.7%
Phe-d10 93.8% 6.6%
Ant-d10 92.2% 3.9%
FL-d10 92.9% 2.2%
Chr-d12 87.5% 4.0%
B[e]P-d12 81.2% 8.1%
B[a]P-d12 85.5% 8.8%
B[ghi]P-d12 60.6% 9.5%
3.4. Conclusion
This work presents for the first time an SPE method using the centrifugation technique
for the extraction of PAHs from water samples. The proposed method shows practical
environmental and economical advantages in terms of sample preparation time, simplicity,
reduction in solvent use, and cost and is particularly suitable for routine applications requiring
a high sample throughput. Optimized conditions include the percolation of a sample volume
between 500 and 1000 mL on a C18 cartridge and a drying step using centrifugation followed
by 10 min under vacuum. The evaluation of the elution parameters demonstrated that 1 mL of
DCM with centrifugation was successfully used for the elution of analytes. The concentration
was performed at a temperature below 40 °C after the addition of 200 μL of isooctane. Under
the optimized conditions, this method showed good recoveries for the 16 U.S. EPA PAHs
between 70 and 85% with relative standard deviations between 1 and 14%. Surrogate
standard recoveries were similarly between 61 and 94% with relative standard deviations
between 2 and 15%.
References
(1) Means, J. C.; Wood, S. G.; Hasset, J. J.; Banwart, W. L. Sorption of polynuclear aromatic
hydrocarbons by sediments and soils. Environ. Sci. Technol. 1980, 14, 1524–1528.
Chapitre 2. Développement Analytique
91
(2) Edwards, N. T. Polycyclic aromatic hydrocarbon (PAHs) in the terrestrial environment: a
review. J. Environ. Qual. 1983, 12, 427–441.
(3) U.S. Public Health Service. Toxicological Profile for Polycyclic Aromatic Hydrocarbons;
Agency for Toxic Substances and Disease Registry, Public Health Service, U.S. Department
of Health and Human Services: Washington, DC, 1990; p 231.
(4) U.S. Environmental Protection Agency. Guidelines establishing test procedures for the
analysis of pollutants. Fed. Regist. 2000, 49, 209.
(5) Directive 2000/60/EC of the European Parliament and of the Council of 23 October 2000
Establishing a Framework for Community Action in the Field of Water Policy Official J. L
327, 22 December. Off. J. Eur Communities 2000, 0001_0073.
(6) Manoli, E.; Samara, C. Polycyclic aromatic hydrocarbons in natural waters: sources,
occurrence and analysis. Trends. Anal. Chem. 1999, 18, 417–428.
(7) Urbe, I.; Ruana, J. Application of solid-phase extraction discs with a glass fiber matrix to
fast determination of polycyclic aromatic hydrocarbons in water. J. Chromatogr., A 1997,
778, 337–345.
(8) Burkhardt, M. R.; Zaugg, S. D.; Burbank, T. L.; Olson, M. C.; Iverson, J. L. Pressurized
liquid extraction using water/isopropanol coupled with solid-phase extraction cleanup for
semivolatile organic compounds, polycyclic aromatic hydrocarbons (PAH), and alkylated
PAH homolog groups in sediment. Anal. Chim. Acta 2005, 549, 104–116.
(9) U.S. Environmental Protection Agency. Determination of Organic Compounds in
DrinkingWater by Liquid_Solid Extraction and GC_MS Method. Method 525-2, 1995.
(10) U.S. Environmental Protection Agency. Solid-Phase Extraction (SPE). Method 3535,
1996.
(11) Kiss, G.; Varga-Puchony, Z.; Hlavay, J. Determination of polycyclic aromatic
hydrocarbons in precipitation using solid phase extraction and column liquid
chromatography. J. Chromatogr., A 1996, 725, 261–272.
Chapitre 2. Développement Analytique
92
(12) Chee, K. K.; Wong, M. K.; Lee, H. K. Microwave-assisted solvent elution technique for
the extraction of organic pollutants in water. Anal. Chim. Acta 1996, 330, 217–227.
(13) Crozier, P. W.; Plomley, J. B.; Matchuk, L. Trace level analysis of PAHs in surface
waters by SPE and gas chromatography ion trap mass spectrometry (GC-ITMS). Analyst
2001, 126, 1974–1979.
(14) Fladung, N. C. Optimization of automated solid-phase extraction for quantitation of
polycyclic aromatic hydrocarbons in aqueous media by high-performance liquid
chromatography_UV detection. J. Chromatogr., A 1995, 692, 21–26.
(15) Delhomme, O.; Rieb, E.; Millet, M. Solid-phase extraction and LC with fluorescence
detection for analysis of PAHs in rainwater. Chromatographia 2007, 65, 163–171.
(16) Kicinski, H. G.; Adamek, S.; Kettrup, A. Trace enrichment and HPLC analysis of
polycyclic aromatic hydrocarbons in environmental samples using solid phase extraction in
connection with UV/VIS diodearray and fluorescence detection. Chromatographia 1989, 28,
203–208.
(17) Kabzinski, A. K. M.; Cyran, J.; Juszczak, R. Determination of polycyclic aromatic
hydrocarbons in water (including drinking water) of Lodz. Polish J. Environ. Stud. 2002, 11
(6), 695–706.
(18) Gilar, M.; Belenky, A.; Wang, B. H. High-throughput biopolymer desalting by solid-
phase extraction prior to mass spectrometric analysis. J. Chromatogr., A 2001, 921, 3–13.
(19) Martinez, E.; Gros, M.; Lacorte, S.; Barcelo, D. Simplified procedures for the analysis of
polycyclic aromatic hydrocarbons in water, sediments and mussels. J. Chromatogr., A 2004,
1047, 181–188.
(20) Oleszczuk, P.; Baran, S. Application of solid-phase extraction to determination of
polycyclic aromatic hydrocarbons in sewage sludge extracts. J. Hazard. Mater. B 2004, 113,
237–245.
(21) Pichon, V.; Charpak, M.; Hennion, M. C. Multiresidue analysis of pesticides using new
laminar extraction disks and liquid chromatography and application to the French priority list.
J. Chromatogr., A 1998, 795, 83–92.
Chapitre 2. Développement Analytique
93
(22) Wan, H. B.; Lan, W. G.; Wong, M. K.; Mok, C. Y.; Poh, Y. H. Orthogonal array designs
for the optimization of solid-phase extraction. J. Chromatogr., A 1994, 77, 255–263.
(23) Liska, I.; Kuhan, A.; Krupcik, J. Comparison of sorbents for solid-phase extraction of
polar compounds from water. J. Chromatogr., A 1990, 509, 123–134.
(24) Law, R. J.; Dawes, V. J.; Woodhead, R. J.; Matthiessen, P. Polycyclic aromatic
hydrocarbons (PAH) in seawater around England and Wales. Mar. Pollut. Bull. 1997, 34 (5),
306–322.
(25) Hennion, M. C.; Cau-Dit-Coumes, C.; Pichon, V. Trace analysis of polar organic
pollutants in aqueous samples. Tools for the rapid prediction and optimization of the solid-
phase extraction parameters. J. Chromatogr. A 1998, 823, 147–161.
(26) Ferrer, R.; Beltran, J. L.; Guiteras, J. Mathematical procedure for the determination of
the breakthrough volumes of polycyclic aromatic hydrocarbons (PAHs). Anal. Chim. Acta
1997, 346, 253–258.
(27) Nirmaier, H. P.; Fischer, E.;Meyer, A.; Henze, G. Determination of PAHs in water
samples using HPLC with amperometric detection. J. Chromatogr., A. 1996, 730, 169–175.
(28) Garcia-Falcon, M. S.; Perez-Lamela, M.; Simal-Gandara, J. Comparison of strategies for
extraction of high molecular weight polycyclic aromatic hydrocarbons from drinking waters.
J. Agric. Food Chem. 2004, 52, 6897–6903.
(29) Valavanidis, A.; Vlachogianni, Th.; Triantafillaki, S.; Dassenakis, M.; Androutsos, F.;
Scoullos, M. Polycyclic aromatic hydrocarbons in surface seawater and in indigenous mussels
(Mytilus galloprovincialis) from coastal areas of the Saronikos Gulf (Greece). Estuarine,
Coastal Shelf Sci. 2008, 79, 733–739.
Chapitre 2. Développement Analytique
94
Optimization of a programmed temperature vaporization–gas chromatography–mass spectrometry method for the trace analysis of polycyclic aromatic hydrocarbons in waters after a solid phase extraction
Abir Kouzayha1, Aisha Al Ashi2, Mohamad AL Iskandarani1, Abdul Rahman Rabaa2, Haifa Abdul Rahim2, Hélène Budzinski3 and Farouk Jaber1&2*
1 National Council for Scientific Research CNRS - Lebanese Atomic Energy Commission LAEC - Analysis of Pesticides and Organic Pollutants Laboratory LAPPO - Beirut, Lebanon.2 Lebanese University - Faculty of Sciences I - Laboratory of Analysis of Organic Compounds (509) - Hadath, Beirut, Lebanon.3 Université Bordeaux 1, CNRS, ISM–LPTC–UMR 5255 (Laboratory of Physico- and Toxico-Chemistry), 351 Cours de la Libération, 33405 Talence, France.
(Accepted for publication in TALANTA)
© 2011 Elsevier B.V. All rights reserved.
Chapitre 2. Développement Analytique
95
4. Optimization of a programmed temperature vaporization–gas chromatography–mass spectrometry method for the trace analysis of polycyclic aromatic hydrocarbons in waters after a solid phase extraction
Abir Kouzayha1, Aisha Al Ashi2, Mohamad AL Iskandarani1, Abdul Rahman Rabaa2, Haifa Abdul Rahim2, Hélène Budzinski3 and Farouk Jaber1&2*
1 National Council for Scientific Research CNRS - Lebanese Atomic Energy Commission LAEC - Analysis of Pesticides and Organic Pollutants Laboratory LAPPO - Beirut, Lebanon.2 Lebanese University - Faculty of Sciences I - Laboratory of Analysis of Organic Compounds (509) - Hadath, Beirut, Lebanon.3 Université Bordeaux 1, CNRS, ISM–LPTC–UMR 5255 (Laboratory of Physico- and Toxico-Chemistry), 351 Cours de la Libération, 33405 Talence, France.
Abstract
This paper presents the optimization of a programmed temperature vaporization (PTV)
injection-gas chromatographic mass spectrometric (GC–MS) method for the analysis of the 16
EPA priority polycyclic aromatic hydrocarbons (PAHs) at trace levels in water samples. The
extraction was accomplished using the solid phase extraction (SPE) method with centrifugation.
The injection parameters (injection speed, inlet temperature, vent flow, vent pressure, vent time,
purge flow, and purge time) were optimized using two statistical designs of experiments. A
Plackett-Burman design showed that among factors, only four have a significant effect on the
analytical response of the target PAHs, and a Box-Behnken design was applied to determine the
optimum values of the significant factors. Analytical characteristics expressed in terms of
linearity, precision, recovery, detection and quantification limits have been determined.
Recoveries between 82 and 106% were obtained for all PAHs tested with a good precision (4.7 -
8.9%). Detection and quantification limits ranged from 0.01 to 0.91 ng/mL. Compared to the
conventional 1µL splitless injection, the PTV injection of 5 µL provided an enhancement of
sensitivity in the S/N ratios from 2 to 100 times for all target PAHs. Finally, the developed
method was successfully applied to the ultratrace analysis of PAHs in Lebanese groundwater
samples.
Keywords: Programmed temperature vaporization (PTV) – Polycyclic aromatic
hydrocarbons (PAHs) – Gas chromatography mass spectrometry (GC-MS) – Solid phase
extraction (SPE) – Water analysis – Organic pollutants.
Chapitre 2. Développement Analytique
96
4.1. Introduction
Polycyclic aromatic hydrocarbons (PAHs) are semi volatile organic pollutants widely
spread in the environment and mainly arise from the incomplete combustion of organic matter,
from industrial process and from other human activities [1]. PAHs have received increased
attention in the last years because some of them are potentially carcinogenic or mutagenic, such
as benzo[a]pyrene [2]. Sixteen of these compounds are included in the U.S. Environmental
Protection Agency (EPA) list as priority contaminants which should be monitored in the
environment [3].
Increased public concern over potential health hazards associated with exposure to PAHs
has led to the development of highly sensitive and selective analytical procedures to determine
these compounds in a variety of environmental and food matrices. Though, papers concerning
the analysis of PAHs in water samples are scarce due to their very low concentrations in
comparison with the concentrations in wastes, sewage, soils and marine sediments [4]. The
PAHs concentrations in relatively unpolluted rivers are usually from 10 to 250 ng/L and lower
levels are found in seawaters 0.01–10 ng/L [5, 6]. Such low concentration levels often make in-
depth investigation of PAHs in water samples difficult or even impossible sometimes. Therefore,
ensuring the needed sensitivities for detection and quantitation is often the key to the success of
many studies dealing with trace amounts of PAHs.
Solid-phase extraction (SPE) technique followed by gas chromatographic with mass
spectrometric detection methods (GC-MS) have used successfully for a long time in analytical
laboratories for the extraction and analysis of PAHs in water [7, 8]. Thus, many laborious steps
are required such as conditioning, enrichment, washing, drying, elution and concentration [9].
Because PAHs are present at low concentrations in aqueous media, a concentration step up to 10-
20 times is frequently required prior to analysis to achieve the limits of quantification (LOQ) of
the GC-MS. These routine steps prolong analysis time and increase the errors associated with the
analytical process [10, 11]. On the other hand, high discrimination of the signal intensities of low
and high molecular weight (LMW and HMW) compounds is a problem in the analysis of PAHs
by GC-MS using splitless injection mode [12, 13]. The lower abundance of the heavier
compounds causes also smaller signal-to-noise (S/N) ratios which result in the increase of the
limits of detections (LOD). Therefore, the very high sensitivity that is required for the trace or
Chapitre 2. Développement Analytique
97
ultratrace analysis of PAHs in water samples makes it necessary to improve the detection limits
reached by GC-MS with traditional splitless injection mode.
Recently, large-volume injection (LVI) technique such as programmed temperature
vaporization (PTV) injection was explored to improve method sensitivity in the GC
determination of trace analytes. PTV injection allows us to introduce larger volumes of the final
extract up to 100 µL in some cases [14]. Several studies have been recently published using PTV
methods for the determination of organic trace pollutants, such as phenols [15], pesticides [16],
polychlorinated biphenyls [17] and some of them tackled the study of PTV injection for PAHs
analysis [18, 19, 20, 21]. They reported a significant increase in sensitivity by the use of PTV
injection if compared to splitless injection. Furthermore, PTV injection has also been used to
reduce discrimination of the signal intensities between the LMW and HMW PAHs compared to
classical splitless injection [12, 13]. PTV offers more operating parameters than splitless
injection that affect the solvent elimination efficiency and the transfer of the analytes during the
injection. Some authors studied the optimization of the PTV parameters by univariate procedures
[16], whereas others applied multivariate statistical experimental designs for that purpose [22].
The use of statistically based experimental designs can simplify the optimization of PTV
injection of PAHs through the use of a selected number of experiments that randomly combines
the desired variables. This approach provides a method for the simultaneous investigation of
multiple variables, estimating any interaction among them, and requires fewer experiments to
complete the optimization [22].
In our previous paper [23], we described a simple and fast SPE method using
centrifugation technique for the determination of PAHs in water samples. The described SPE-
centrifugation method used less of organic solvent and showed good recoveries in a short
procedure time. In this paper, we will investigate the application of the PTV injection as an
alternative tool to splitless injection for GC-MS analysis of water samples extracted by the SPE-
centrifugation method described by Kouzayha et al., 2011[23]. It must be stressed that none of
the cited studies covered the combination of the SPE method and PTV injection for the analysis
of the 16 EPA PAHs at trace level in water samples. This combination could lead to a practical
and quick method, where the concentration step is discarded, to be used in studies where many
samples have to be analyzed in routine.
Chapitre 2. Développement Analytique
98
The aim of the present study is the optimization of a PTV-GC-MS analysis method for
the determination of the 16 EPA priority PAHs at trace levels in water samples. The extraction is
accomplished using the SPE with centrifugation technique [23]. The optimization of different
operating parameters of the PTV injection is carried out by application of statistically based
experimental designs. Firstly and in order to reduce the number of variables that require
optimization, a Plackett-Burman factorial design is applied to determine which factors affect the
injection efficiency. Then, the optimum values of the significant factors are found by a Box-
Behnken design. Different performance parameters of the analytical procedure such as linearity,
precision, recovery, LOD and LOQ were evaluated. The sensitivity of the developed method was
also compared with the traditional splitless injection. Finally the optimized method was
successfully applied to the analysis of groundwater samples.
4.2. Materials and methods
4.2.1. Reagents and materials
All solvents were purchased in chromatographic grade from Sigma-Aldrich (GmbH,
Taufkirchen, Germany). The 16 EPA PAHs were purchased from Restek as mix Standard
Reference Solution of 1000 µg/mL in dichloromethane (Cat. 31458, Restek, Bellefonte, PA):
naphthalene (Nap), acenaphthylene (AcPy), acenaphthene (AcP), fluorene (Flu), phenanthrene
(Phe), anthracene (Ant), fluoranthene (FL), pyrene (Pyr), benzo[a]anthracene (B[a]A), chrysene
(Chr), benzo[b]fluoranthene (B[b]FL), benzo[k]fluoranthene (B[k]FL), benzo[a]pyrene (B[a]P),
indeno[1,2,3-cd]pyrene (InP), dibenzo[a,h]anthracene (DBA), and benzo-[ghi]perylene
(B[ghi]P). Intermediary solutions (containing 25 µg/mL of each analyte) were prepared by
diluting the standard reference solution of PAHs with an appropriate solvent.
The pure solid surrogate standards, naphthalene-d8 (Nap-d8), phenanthrene-d10 (Phe-d10),
anthracene-d10 (Ant-d10), fluoranthene-d10 (FL-d10), chrysene-d12 (Chr-d12), and perylene-d12
(Per-d12), were purchased from Supelco (Bellefonte, PA) with an additional deuterated PAH,
pyrene-d10 (Pyr-d10), used as internal standard at the end of the protocol. Separate 1000 µg/mL
stock solutions of each deuterated standard were prepared gravimetrically in dichloromethane.
Intermediary 25 µg/mL deuterated mix solutions of surrogate and internal standards were
prepared in appropriate solvents. The different working solutions were prepared in acetonitrile at
Chapitre 2. Développement Analytique
99
different concentrations (between 1 µg/mL and 5 ng/mL). All standard solutions were stored in
amber vials at -20 °C.
4.2.2. Water sampling and extraction of PAHs
For method validation, the sum of the 16 PAHs analyzed in this study was evaluated in a
high-quality Lebanese drinking water (mineral spring water), and its low value was considered to
be negligible, so it was used as a blank during the experiments. Spiked water samples were
prepared by spiking blank water with target analytes at a known concentration. The surrogate
deuterated PAHs were added at this stage at a fixed concentration of 50 ng/L.
The similar procedure described in our previous paper [23] was used for extraction of
PAHs in water samples. In brief, water samples (1000 mL) were concentrated on SPE
Chromabond C18 cartridge, then the cartridge was dried immediately using the centrifugation
technique (2500 rpm for 2 min) followed by a vacuum drying for 10 min. The centrifugation was
also used for sample elution, where 1 mL of dichloromethane was added to the cartridge with the
valve closed, then the cartridge was centrifuged (2300 rpm for 1 min), and finally the elute was
recuperated directly in the GC-MS injection vial. All sample extracts were transferred to
acetonitrile before analysis.
Groundwater samples were collected in 2.5 L dark glass bottles from three different
geographic points located in North Lebanon (Denniyeh), East Bekaa (Terbol) and in South
Lebanon (Abbassieh). Sampling was performed in November 2010 and samples were filtered
immediately through a Whatman GF/F filter (0.7 μm porosity), extracted and analyzed.
4.2.3. Instrumentation
A GC Agilent 7890A (Agilent Technologies, Waldbronn, Germany) with a multi-mode
inlet (MMI), PTV and split/splitless injectors, was used for the analysis of the target PAHs. The
GC was coupled to an Agilent 5975C single quadrupole mass spectrometer operated in electron
ionization (EI) mode at 70 eV. Injection was carried out using an Agilent 7693A autosampler
system. ChemStation was the data processor. A single taper glass wool liner (Part number 5062-
3587), with a volume of 900 µL, was purchased from Agilent. The separation was achieved with
Chapitre 2. Développement Analytique
100
an HP-5MS Ultra Inert fused silica capillary column (30 m×0.25 mm internal diameter, 0.25 µm
film thickness) from Agilent Technologies.
An analytical balance from Sartorius (0.01 mg; Goettingen, Germany) was used. A Boeco
centrifuge (model U-320R, Boeco, Germany) was employed in different steps of the preparation
method. A sample concentrator from Techne (Staffordshire, U.K.) was used for sample
concentration under nitrogen. Other small apparatus such as an ultrasonic bath and a vortex
shaker were used.
4.2.4. Chromatographic conditions
The GC oven temperature program was 40 ◦C (hold 2min), increased to 200 ◦C at
15◦C/min (hold 2 min), and finally increased to 280 ◦C at 5 ◦C/min (hold 5 min). The total run
time was about 35 min. Helium (purity > 99.999%) was used as carrier gas at 1.5 mL/min flow
rate.
The analyses were performed in selected ion monitoring (SIM) mode. Transfer line
temperature and ion source temperature were maintained at 280 ◦C and 250 ◦C, respectively. The
selected conditions for GC-MS in SIM mode are showed in (Table 4.1). Confirmation criteria for
the detection of PAHs should include the following: (a) retention time for two monitored ions for
a given analyte should maximize simultaneously ±0.1 s; (b) the ratio between the two monitored
ions should be within 15% of the theoretical value. Quantitation was performed by internal
standard calibration using a six-point regression line ranging from 1 to 100 ng/mL.
MMI splitless injection was performed to set reference values on which basis the
performance characteristics of the MMI PTV injection method were evaluated. The experimental
conditions for splitless injection were: injection volume 1 µL, injection speed of 6000 µL/min
and injector temperature of 280 ◦C. The purge valve was opened after 2 min and the split vent
flow was 30 ml/min. The parameters of the PTV injection were subject of the optimization
process and are discussed later in this paper.
4.2.5. Statistical software
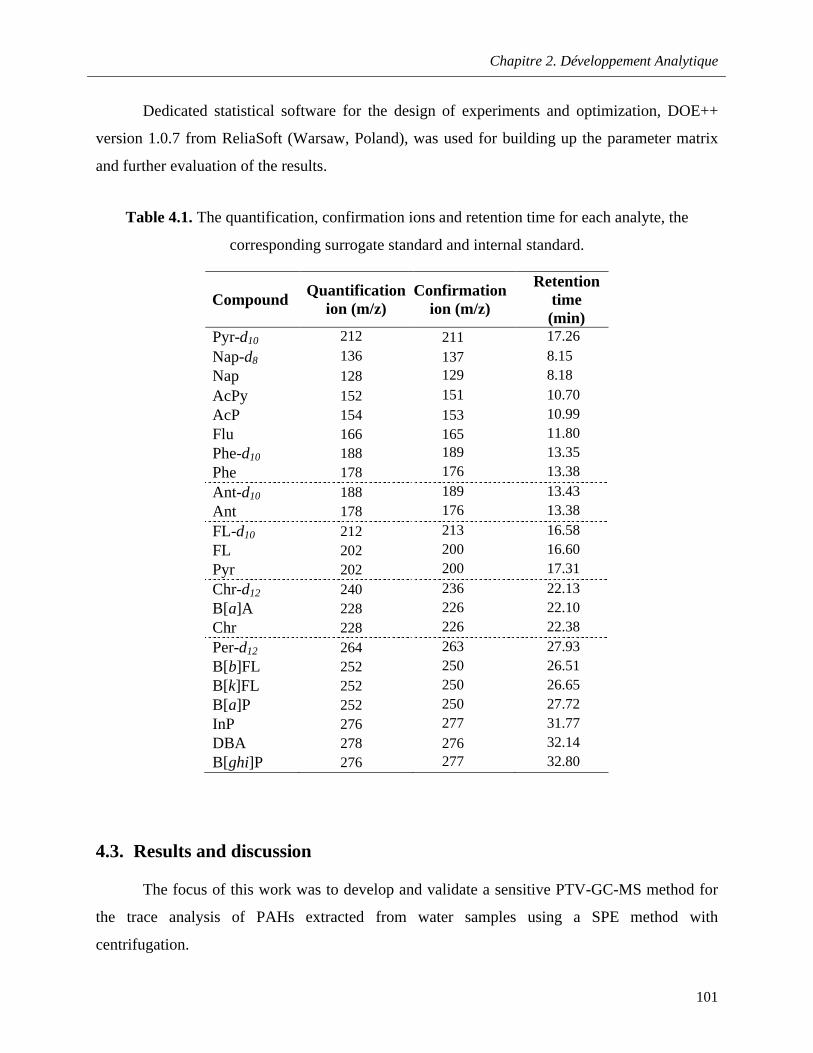
Chapitre 2. Développement Analytique
101
Dedicated statistical software for the design of experiments and optimization, DOE++
version 1.0.7 from ReliaSoft (Warsaw, Poland), was used for building up the parameter matrix
and further evaluation of the results.
Table 4.1. The quantification, confirmation ions and retention time for each analyte, the
corresponding surrogate standard and internal standard.
CompoundQuantification
ion (m/z)Confirmation
ion (m/z)
Retention time (min)
Pyr-d10 212 211 17.26
Nap-d8 136 137 8.15
Nap 128 129 8.18
AcPy 152 151 10.70
AcP 154 153 10.99
Flu 166 165 11.80
Phe-d10 188 189 13.35
Phe 178 176 13.38
Ant-d10 188 189 13.43
Ant 178 176 13.38
FL-d10 212 213 16.58
FL 202 200 16.60
Pyr 202 200 17.31
Chr-d12 240 236 22.13
B[a]A 228 226 22.10
Chr 228 226 22.38
Per-d12 264 263 27.93
B[b]FL 252 250 26.51
B[k]FL 252 250 26.65
B[a]P 252 250 27.72
InP 276 277 31.77
DBA 278 276 32.14
B[ghi]P 276 277 32.80
4.3. Results and discussion
The focus of this work was to develop and validate a sensitive PTV-GC-MS method for
the trace analysis of PAHs extracted from water samples using a SPE method with
centrifugation.
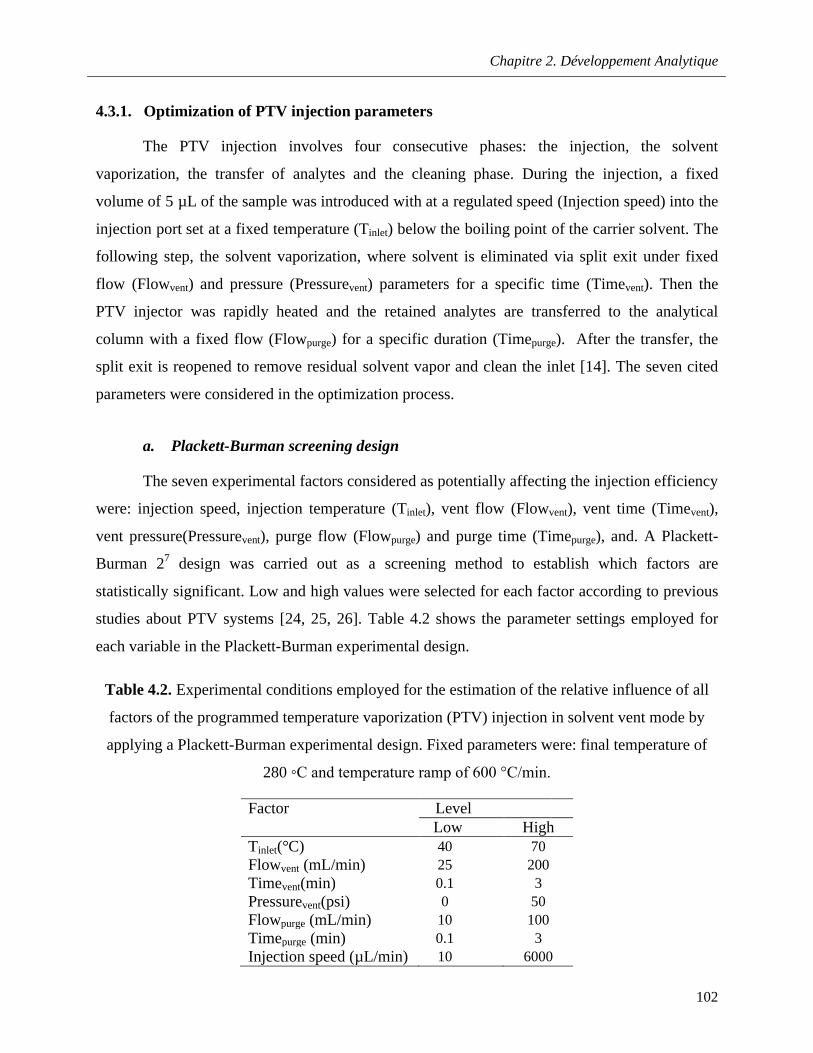
Chapitre 2. Développement Analytique
102
4.3.1. Optimization of PTV injection parameters
The PTV injection involves four consecutive phases: the injection, the solvent
vaporization, the transfer of analytes and the cleaning phase. During the injection, a fixed
volume of 5 µL of the sample was introduced with at a regulated speed (Injection speed) into the
injection port set at a fixed temperature (Tinlet) below the boiling point of the carrier solvent. The
following step, the solvent vaporization, where solvent is eliminated via split exit under fixed
flow (Flowvent) and pressure (Pressurevent) parameters for a specific time (Timevent). Then the
PTV injector was rapidly heated and the retained analytes are transferred to the analytical
column with a fixed flow (Flowpurge) for a specific duration (Timepurge). After the transfer, the
split exit is reopened to remove residual solvent vapor and clean the inlet [14]. The seven cited
parameters were considered in the optimization process.
a. Plackett-Burman screening design
The seven experimental factors considered as potentially affecting the injection efficiency
were: injection speed, injection temperature (Tinlet), vent flow (Flowvent), vent time (Timevent),
vent pressure(Pressurevent), purge flow (Flowpurge) and purge time (Timepurge), and. A Plackett-
Burman 27 design was carried out as a screening method to establish which factors are
statistically significant. Low and high values were selected for each factor according to previous
studies about PTV systems [24, 25, 26]. Table 4.2 shows the parameter settings employed for
each variable in the Plackett-Burman experimental design.
Table 4.2. Experimental conditions employed for the estimation of the relative influence of all
factors of the programmed temperature vaporization (PTV) injection in solvent vent mode by
applying a Plackett-Burman experimental design. Fixed parameters were: final temperature of
280 ◦C and temperature ramp of 600 °C/min.
Factor LevelLow High
Tinlet(°C) 40 70Flowvent (mL/min) 25 200Timevent(min) 0.1 3Pressurevent(psi) 0 50Flowpurge (mL/min) 10 100Timepurge (min) 0.1 3Injection speed (µL/min) 10 6000
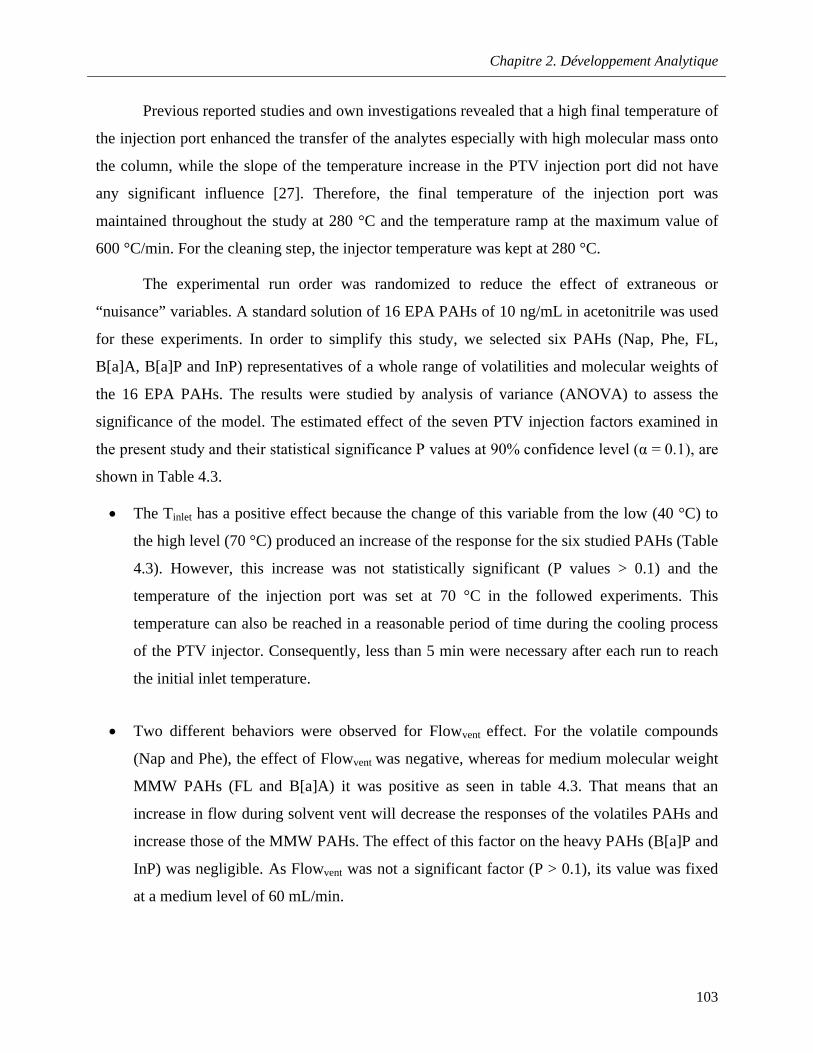
Chapitre 2. Développement Analytique
103
Previous reported studies and own investigations revealed that a high final temperature of
the injection port enhanced the transfer of the analytes especially with high molecular mass onto
the column, while the slope of the temperature increase in the PTV injection port did not have
any significant influence [27]. Therefore, the final temperature of the injection port was
maintained throughout the study at 280 °C and the temperature ramp at the maximum value of
600 °C/min. For the cleaning step, the injector temperature was kept at 280 °C.
The experimental run order was randomized to reduce the effect of extraneous or
“nuisance” variables. A standard solution of 16 EPA PAHs of 10 ng/mL in acetonitrile was used
for these experiments. In order to simplify this study, we selected six PAHs (Nap, Phe, FL,
B[a]A, B[a]P and InP) representatives of a whole range of volatilities and molecular weights of
the 16 EPA PAHs. The results were studied by analysis of variance (ANOVA) to assess the
significance of the model. The estimated effect of the seven PTV injection factors examined in
the present study and their statistical significance P values at 90% confidence level (α = 0.1), are
shown in Table 4.3.
The Tinlet has a positive effect because the change of this variable from the low (40 °C) to
the high level (70 °C) produced an increase of the response for the six studied PAHs (Table
4.3). However, this increase was not statistically significant (P values > 0.1) and the
temperature of the injection port was set at 70 °C in the followed experiments. This
temperature can also be reached in a reasonable period of time during the cooling process
of the PTV injector. Consequently, less than 5 min were necessary after each run to reach
the initial inlet temperature.
Two different behaviors were observed for Flowvent effect. For the volatile compounds
(Nap and Phe), the effect of Flowvent was negative, whereas for medium molecular weight
MMW PAHs (FL and B[a]A) it was positive as seen in table 4.3. That means that an
increase in flow during solvent vent will decrease the responses of the volatiles PAHs and
increase those of the MMW PAHs. The effect of this factor on the heavy PAHs (B[a]P and
InP) was negligible. As Flowvent was not a significant factor (P > 0.1), its value was fixed
at a medium level of 60 mL/min.
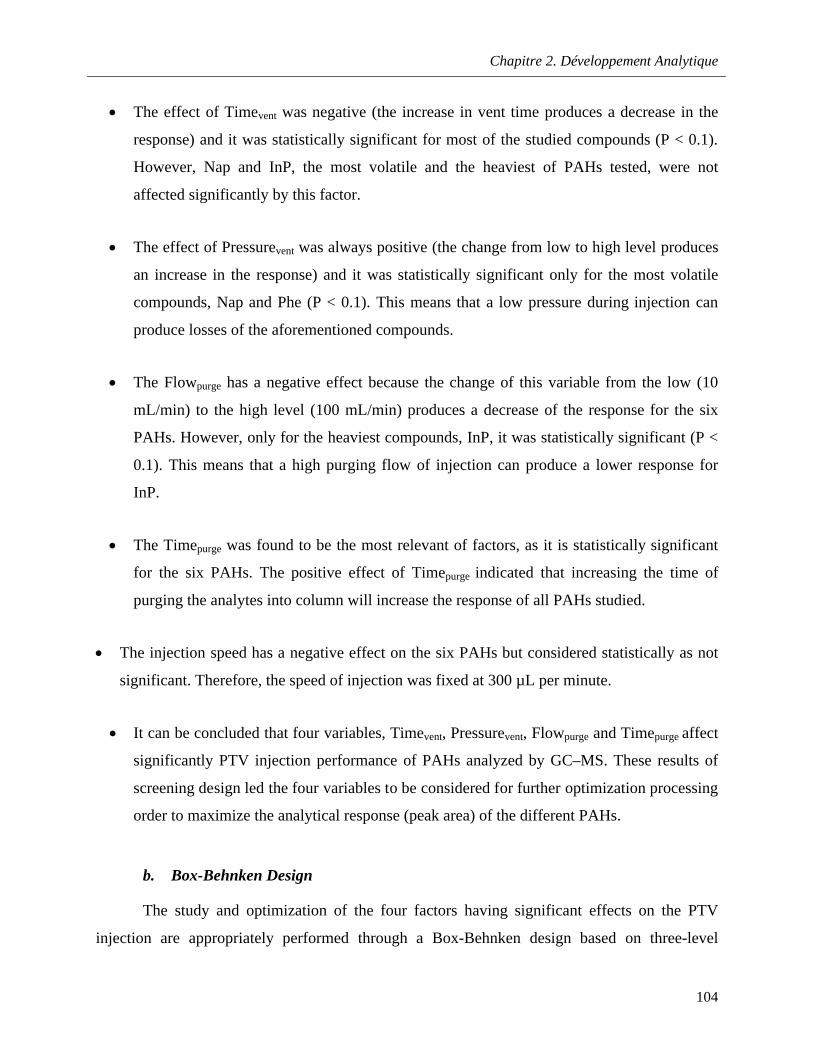
Chapitre 2. Développement Analytique
104
The effect of Timevent was negative (the increase in vent time produces a decrease in the
response) and it was statistically significant for most of the studied compounds (P < 0.1).
However, Nap and InP, the most volatile and the heaviest of PAHs tested, were not
affected significantly by this factor.
The effect of Pressurevent was always positive (the change from low to high level produces
an increase in the response) and it was statistically significant only for the most volatile
compounds, Nap and Phe (P < 0.1). This means that a low pressure during injection can
produce losses of the aforementioned compounds.
The Flowpurge has a negative effect because the change of this variable from the low (10
mL/min) to the high level (100 mL/min) produces a decrease of the response for the six
PAHs. However, only for the heaviest compounds, InP, it was statistically significant (P <
0.1). This means that a high purging flow of injection can produce a lower response for
InP.
The Timepurge was found to be the most relevant of factors, as it is statistically significant
for the six PAHs. The positive effect of Timepurge indicated that increasing the time of
purging the analytes into column will increase the response of all PAHs studied.
The injection speed has a negative effect on the six PAHs but considered statistically as not
significant. Therefore, the speed of injection was fixed at 300 µL per minute.
It can be concluded that four variables, Timevent, Pressurevent, Flowpurge and Timepurge affect
significantly PTV injection performance of PAHs analyzed by GC–MS. These results of
screening design led the four variables to be considered for further optimization processing
order to maximize the analytical response (peak area) of the different PAHs.
b. Box-Behnken Design
The study and optimization of the four factors having significant effects on the PTV
injection are appropriately performed through a Box-Behnken design based on three-level
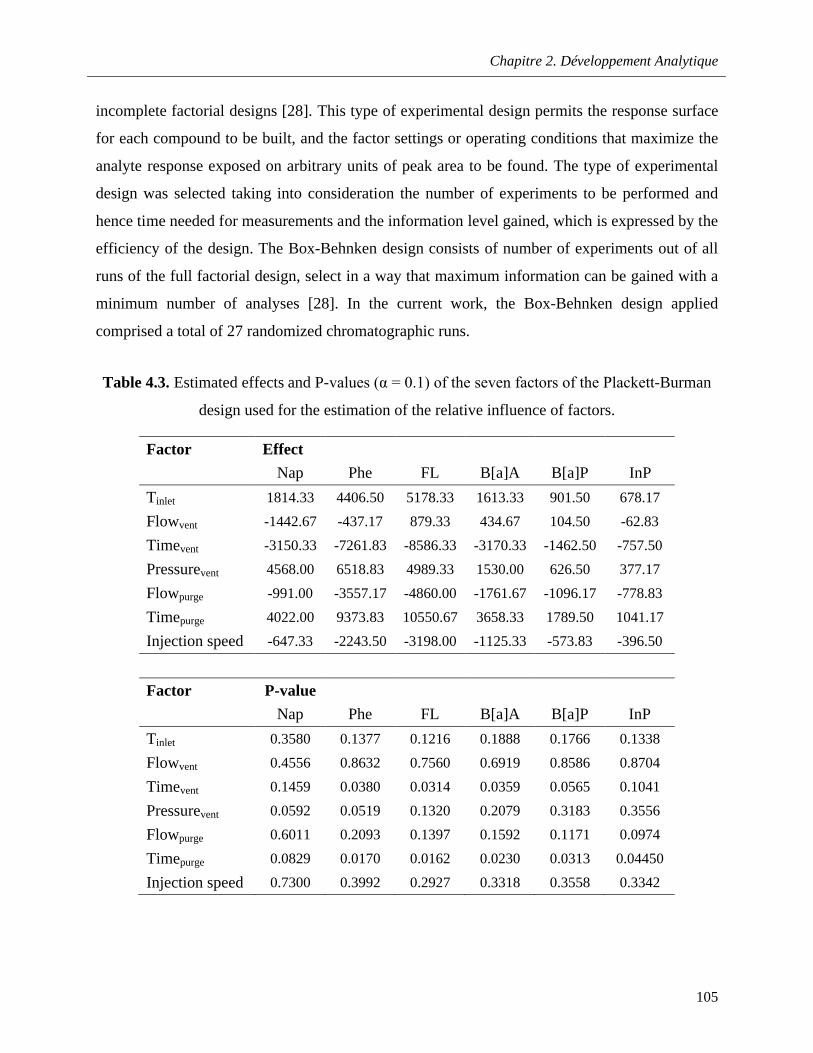
Chapitre 2. Développement Analytique
105
incomplete factorial designs [28]. This type of experimental design permits the response surface
for each compound to be built, and the factor settings or operating conditions that maximize the
analyte response exposed on arbitrary units of peak area to be found. The type of experimental
design was selected taking into consideration the number of experiments to be performed and
hence time needed for measurements and the information level gained, which is expressed by the
efficiency of the design. The Box-Behnken design consists of number of experiments out of all
runs of the full factorial design, select in a way that maximum information can be gained with a
minimum number of analyses [28]. In the current work, the Box-Behnken design applied
comprised a total of 27 randomized chromatographic runs.
Table 4.3. Estimated effects and P-values (α = 0.1) of the seven factors of the Plackett-Burman
design used for the estimation of the relative influence of factors.
Factor Effect
Nap Phe FL B[a]A B[a]P InP
Tinlet 1814.33 4406.50 5178.33 1613.33 901.50 678.17
Flowvent -1442.67 -437.17 879.33 434.67 104.50 -62.83
Timevent -3150.33 -7261.83 -8586.33 -3170.33 -1462.50 -757.50
Pressurevent 4568.00 6518.83 4989.33 1530.00 626.50 377.17
Flowpurge -991.00 -3557.17 -4860.00 -1761.67 -1096.17 -778.83
Timepurge 4022.00 9373.83 10550.67 3658.33 1789.50 1041.17
Injection speed -647.33 -2243.50 -3198.00 -1125.33 -573.83 -396.50
Factor P-value
Nap Phe FL B[a]A B[a]P InP
Tinlet 0.3580 0.1377 0.1216 0.1888 0.1766 0.1338
Flowvent 0.4556 0.8632 0.7560 0.6919 0.8586 0.8704
Timevent 0.1459 0.0380 0.0314 0.0359 0.0565 0.1041
Pressurevent 0.0592 0.0519 0.1320 0.2079 0.3183 0.3556
Flowpurge 0.6011 0.2093 0.1397 0.1592 0.1171 0.0974
Timepurge 0.0829 0.0170 0.0162 0.0230 0.0313 0.04450
Injection speed 0.7300 0.3992 0.2927 0.3318 0.3558 0.3342
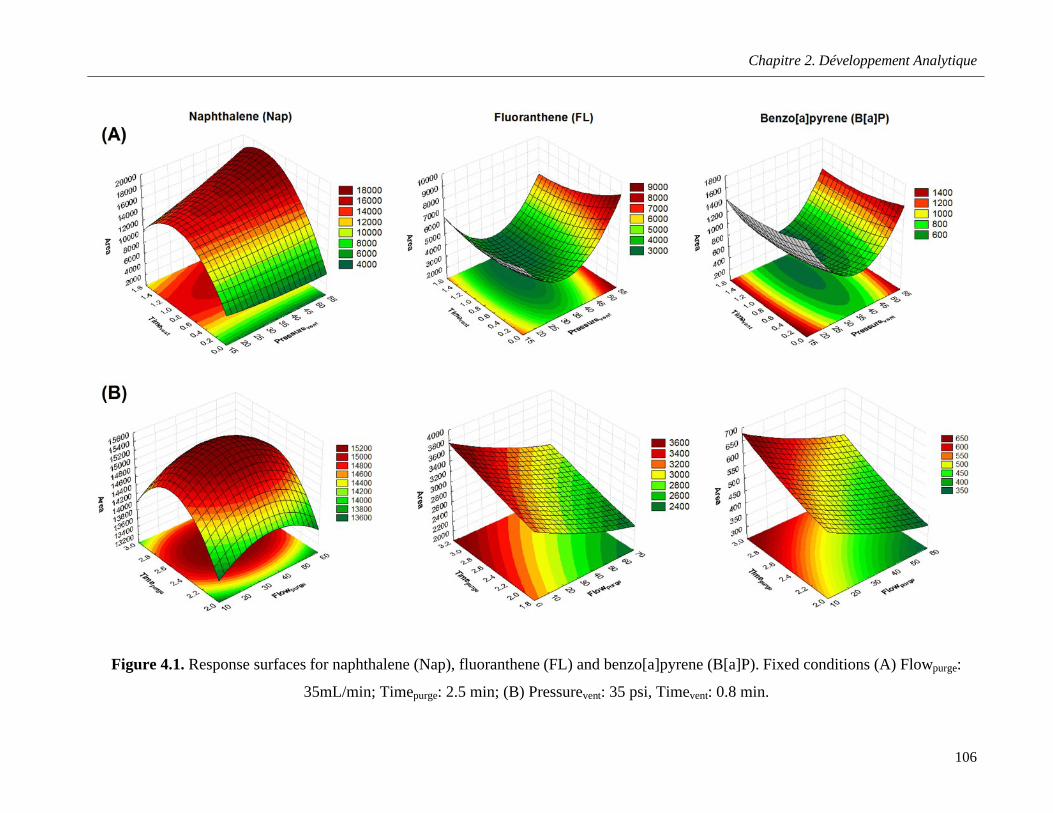
Chapitre 2. Développement Analytique
106
Figure 4.1. Response surfaces for naphthalene (Nap), fluoranthene (FL) and benzo[a]pyrene (B[a]P). Fixed conditions (A) Flowpurge:
35mL/min; Timepurge: 2.5 min; (B) Pressurevent: 35 psi, Timevent: 0.8 min.
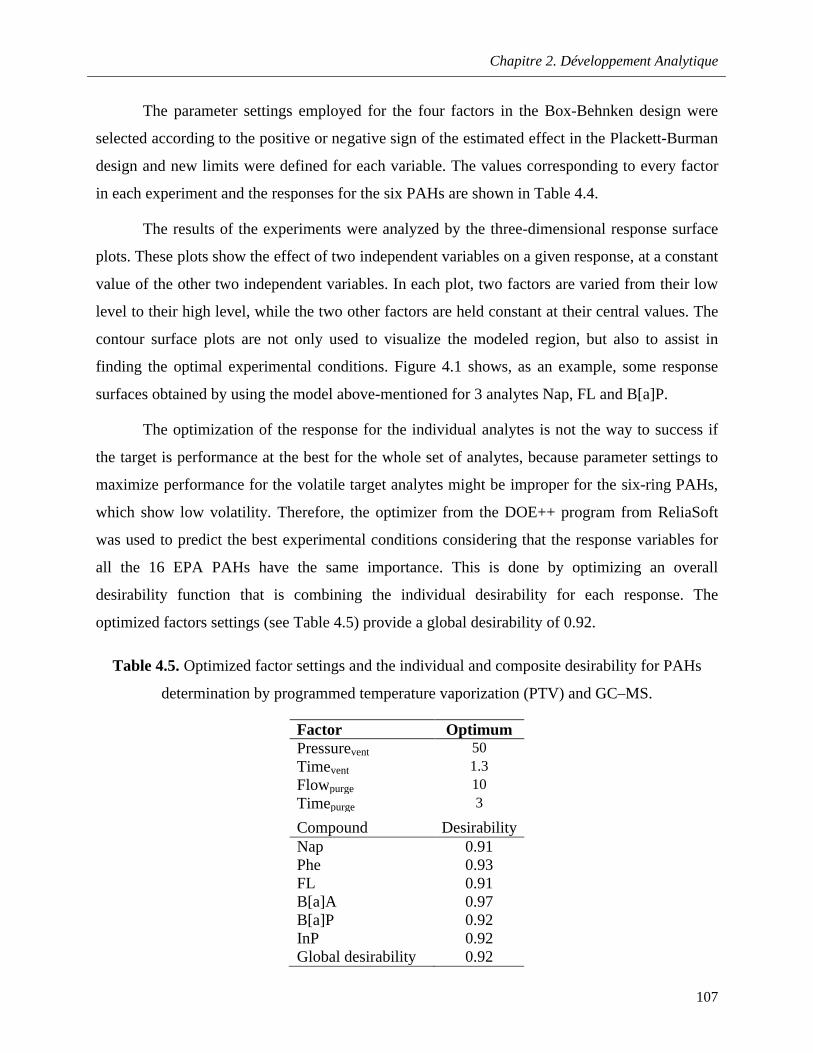
Chapitre 2. Développement Analytique
107
The parameter settings employed for the four factors in the Box-Behnken design were
selected according to the positive or negative sign of the estimated effect in the Plackett-Burman
design and new limits were defined for each variable. The values corresponding to every factor
in each experiment and the responses for the six PAHs are shown in Table 4.4.
The results of the experiments were analyzed by the three-dimensional response surface
plots. These plots show the effect of two independent variables on a given response, at a constant
value of the other two independent variables. In each plot, two factors are varied from their low
level to their high level, while the two other factors are held constant at their central values. The
contour surface plots are not only used to visualize the modeled region, but also to assist in
finding the optimal experimental conditions. Figure 4.1 shows, as an example, some response
surfaces obtained by using the model above-mentioned for 3 analytes Nap, FL and B[a]P.
The optimization of the response for the individual analytes is not the way to success if
the target is performance at the best for the whole set of analytes, because parameter settings to
maximize performance for the volatile target analytes might be improper for the six-ring PAHs,
which show low volatility. Therefore, the optimizer from the DOE++ program from ReliaSoft
was used to predict the best experimental conditions considering that the response variables for
all the 16 EPA PAHs have the same importance. This is done by optimizing an overall
desirability function that is combining the individual desirability for each response. The
optimized factors settings (see Table 4.5) provide a global desirability of 0.92.
Table 4.5. Optimized factor settings and the individual and composite desirability for PAHs
determination by programmed temperature vaporization (PTV) and GC–MS.
Factor OptimumPressurevent 50Timevent 1.3Flowpurge 10Timepurge 3
Compound DesirabilityNap 0.91Phe 0.93FL 0.91B[a]A 0.97B[a]P 0.92InP 0.92Global desirability 0.92
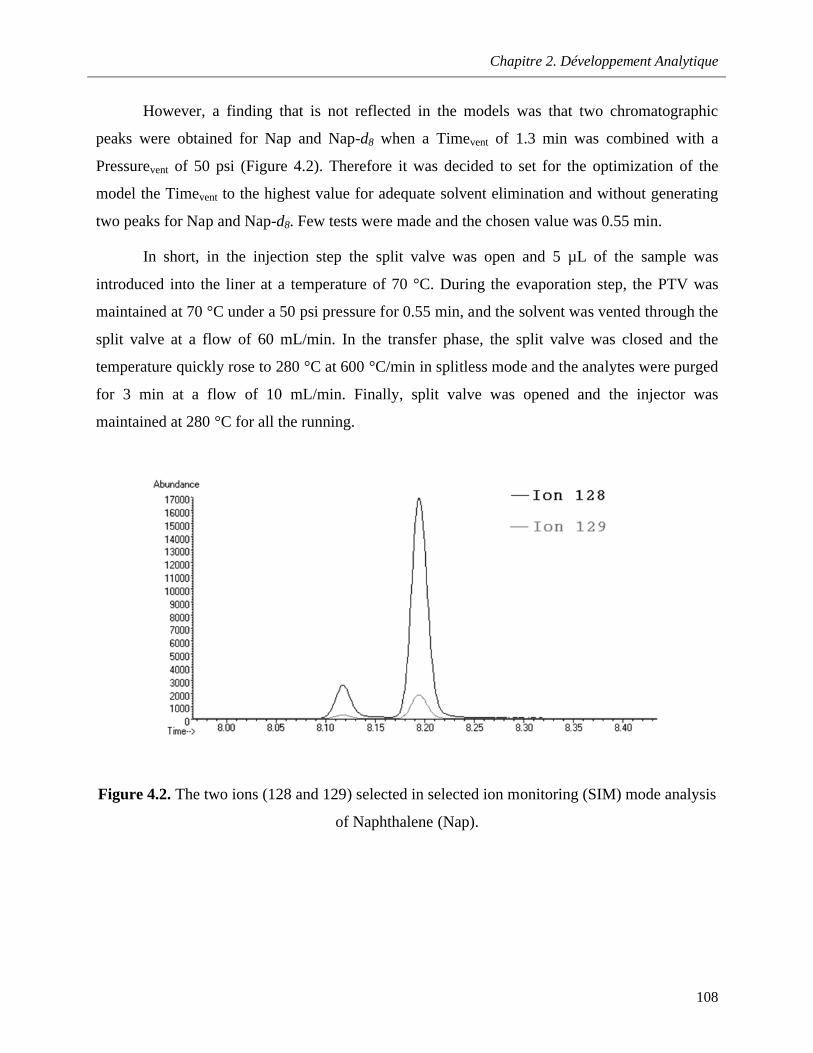
Chapitre 2. Développement Analytique
108
However, a finding that is not reflected in the models was that two chromatographic
peaks were obtained for Nap and Nap-d8 when a Timevent of 1.3 min was combined with a
Pressurevent of 50 psi (Figure 4.2). Therefore it was decided to set for the optimization of the
model the Timevent to the highest value for adequate solvent elimination and without generating
two peaks for Nap and Nap-d8. Few tests were made and the chosen value was 0.55 min.
In short, in the injection step the split valve was open and 5 µL of the sample was
introduced into the liner at a temperature of 70 °C. During the evaporation step, the PTV was
maintained at 70 °C under a 50 psi pressure for 0.55 min, and the solvent was vented through the
split valve at a flow of 60 mL/min. In the transfer phase, the split valve was closed and the
temperature quickly rose to 280 °C at 600 °C/min in splitless mode and the analytes were purged
for 3 min at a flow of 10 mL/min. Finally, split valve was opened and the injector was
maintained at 280 °C for all the running.
Figure 4.2. The two ions (128 and 129) selected in selected ion monitoring (SIM) mode analysis
of Naphthalene (Nap).
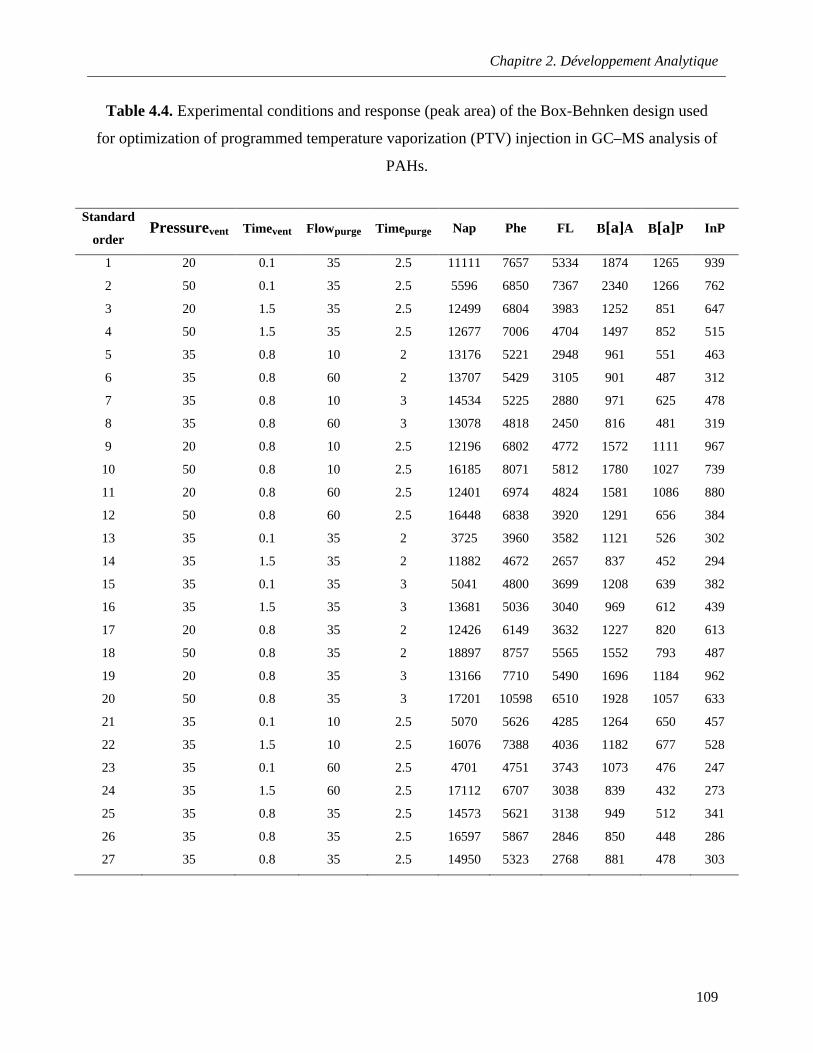
Chapitre 2. Développement Analytique
109
Table 4.4. Experimental conditions and response (peak area) of the Box-Behnken design used
for optimization of programmed temperature vaporization (PTV) injection in GC–MS analysis of
PAHs.
Standard
orderPressurevent Timevent Flowpurge Timepurge Nap Phe FL B[a]A B[a]P InP
1 20 0.1 35 2.5 11111 7657 5334 1874 1265 939
2 50 0.1 35 2.5 5596 6850 7367 2340 1266 762
3 20 1.5 35 2.5 12499 6804 3983 1252 851 647
4 50 1.5 35 2.5 12677 7006 4704 1497 852 515
5 35 0.8 10 2 13176 5221 2948 961 551 463
6 35 0.8 60 2 13707 5429 3105 901 487 312
7 35 0.8 10 3 14534 5225 2880 971 625 478
8 35 0.8 60 3 13078 4818 2450 816 481 319
9 20 0.8 10 2.5 12196 6802 4772 1572 1111 967
10 50 0.8 10 2.5 16185 8071 5812 1780 1027 739
11 20 0.8 60 2.5 12401 6974 4824 1581 1086 880
12 50 0.8 60 2.5 16448 6838 3920 1291 656 384
13 35 0.1 35 2 3725 3960 3582 1121 526 302
14 35 1.5 35 2 11882 4672 2657 837 452 294
15 35 0.1 35 3 5041 4800 3699 1208 639 382
16 35 1.5 35 3 13681 5036 3040 969 612 439
17 20 0.8 35 2 12426 6149 3632 1227 820 613
18 50 0.8 35 2 18897 8757 5565 1552 793 487
19 20 0.8 35 3 13166 7710 5490 1696 1184 962
20 50 0.8 35 3 17201 10598 6510 1928 1057 633
21 35 0.1 10 2.5 5070 5626 4285 1264 650 457
22 35 1.5 10 2.5 16076 7388 4036 1182 677 528
23 35 0.1 60 2.5 4701 4751 3743 1073 476 247
24 35 1.5 60 2.5 17112 6707 3038 839 432 273
25 35 0.8 35 2.5 14573 5621 3138 949 512 341
26 35 0.8 35 2.5 16597 5867 2846 850 448 286
27 35 0.8 35 2.5 14950 5323 2768 881 478 303
Chapitre 2. Développement Analytique
110
4.3.2. Method validation
The optimized PTV-GC-MS method following the SPE with centrifugation extraction
was validated to assess its applicability for the analysis of the 16 EPA PAHs in water samples.
Different parameters such as linearity, precision (repeatability and intermediate precision),
recovery, detection and quantification limits of the whole analytical method (SPE-PTV-GC-MS)
were evaluated.
a. Linearity
The linearity of the optimized PTV-GC-MS method was assayed by injecting three series
of standard solutions in the range from 1 ng/mL to 100 ng/mL with the surrogate and internal
standards at 50 ng/mL. All calibration functions were found linear in the range of concentrations
studied with determination coefficients (R2) ≥ 0.9910 for all the compounds. Table 4.6
summarizes the calibration data for the studied 16 EPA PAHS.
b. Precision
The repeatability of the PTV-GC-MS measurements was established performing the
analysis of three consecutive injections, on the same day, of one PAHs standard solution in
acetonitrile at 10 ng/mL of each analyte. The repeatability of the SPE method followed by PTV-
GC-MS analysis method was determined as well performing replicate extraction of a fortified
water sample on the same day. The relative repeatability standard deviations (RSDr) of the PTV-
GC-MS measurements were satisfactory and ranged between 0.03% for Phe and 3.21% for
B[a]A for the PAHs solution in acetonitrile. The repeatability estimates for SPE-PTV-GC-MS
method were somewhat higher than the respective estimates for the solvent solution, which was
to be expected, and they ranged between 1.18% for Ant and 7.36% for B[k]FL (Table 4.6).
Regarding intermediate precision (RSDi), the relative standard deviations ranged between
0.35 % and 6.58 % for all the studied compounds and they were evaluated performing replicate
standard solution injection and analysis of a fortified water sample during different days. Hence
the calculated precisions (RSDr and RSDi) reflect the overall precision of the complete analytical
method.
c. Recovery
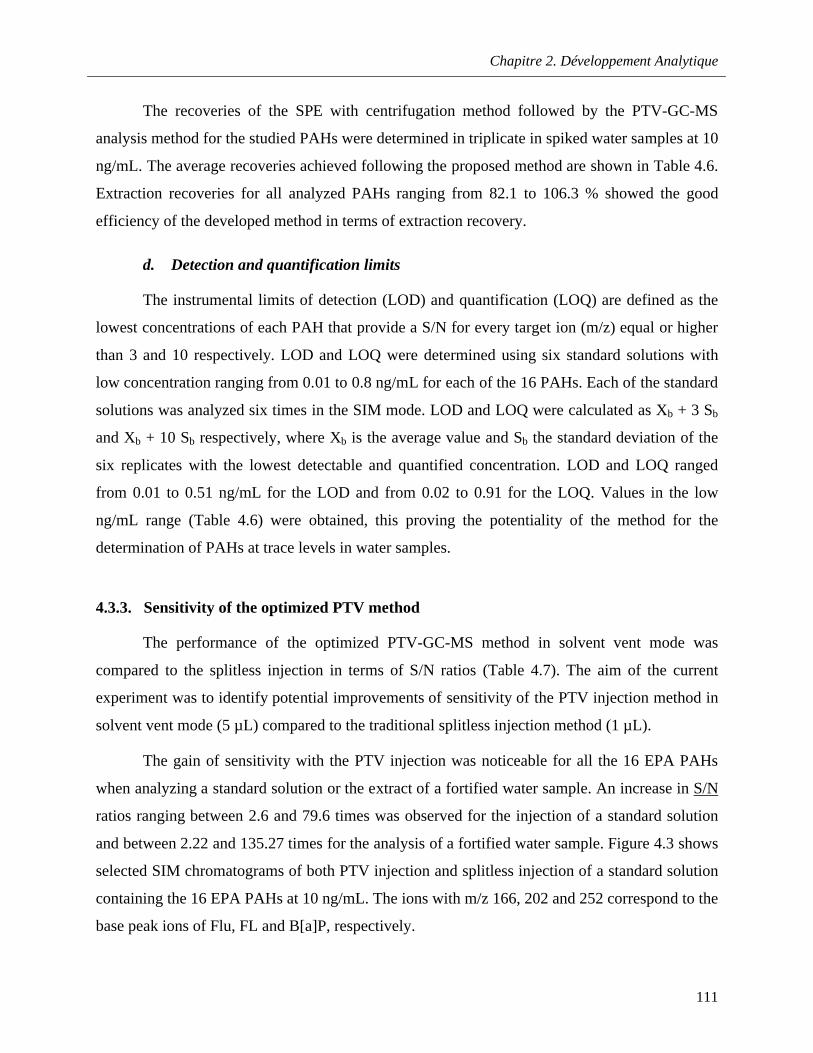
Chapitre 2. Développement Analytique
111
The recoveries of the SPE with centrifugation method followed by the PTV-GC-MS
analysis method for the studied PAHs were determined in triplicate in spiked water samples at 10
ng/mL. The average recoveries achieved following the proposed method are shown in Table 4.6.
Extraction recoveries for all analyzed PAHs ranging from 82.1 to 106.3 % showed the good
efficiency of the developed method in terms of extraction recovery.
d. Detection and quantification limits
The instrumental limits of detection (LOD) and quantification (LOQ) are defined as the
lowest concentrations of each PAH that provide a S/N for every target ion (m/z) equal or higher
than 3 and 10 respectively. LOD and LOQ were determined using six standard solutions with
low concentration ranging from 0.01 to 0.8 ng/mL for each of the 16 PAHs. Each of the standard
solutions was analyzed six times in the SIM mode. LOD and LOQ were calculated as Xb + 3 Sb
and Xb + 10 Sb respectively, where Xb is the average value and Sb the standard deviation of the
six replicates with the lowest detectable and quantified concentration. LOD and LOQ ranged
from 0.01 to 0.51 ng/mL for the LOD and from 0.02 to 0.91 for the LOQ. Values in the low
ng/mL range (Table 4.6) were obtained, this proving the potentiality of the method for the
determination of PAHs at trace levels in water samples.
4.3.3. Sensitivity of the optimized PTV method
The performance of the optimized PTV-GC-MS method in solvent vent mode was
compared to the splitless injection in terms of S/N ratios (Table 4.7). The aim of the current
experiment was to identify potential improvements of sensitivity of the PTV injection method in
solvent vent mode (5 µL) compared to the traditional splitless injection method (1 µL).
The gain of sensitivity with the PTV injection was noticeable for all the 16 EPA PAHs
when analyzing a standard solution or the extract of a fortified water sample. An increase in S/N
ratios ranging between 2.6 and 79.6 times was observed for the injection of a standard solution
and between 2.22 and 135.27 times for the analysis of a fortified water sample. Figure 4.3 shows
selected SIM chromatograms of both PTV injection and splitless injection of a standard solution
containing the 16 EPA PAHs at 10 ng/mL. The ions with m/z 166, 202 and 252 correspond to the
base peak ions of Flu, FL and B[a]P, respectively.
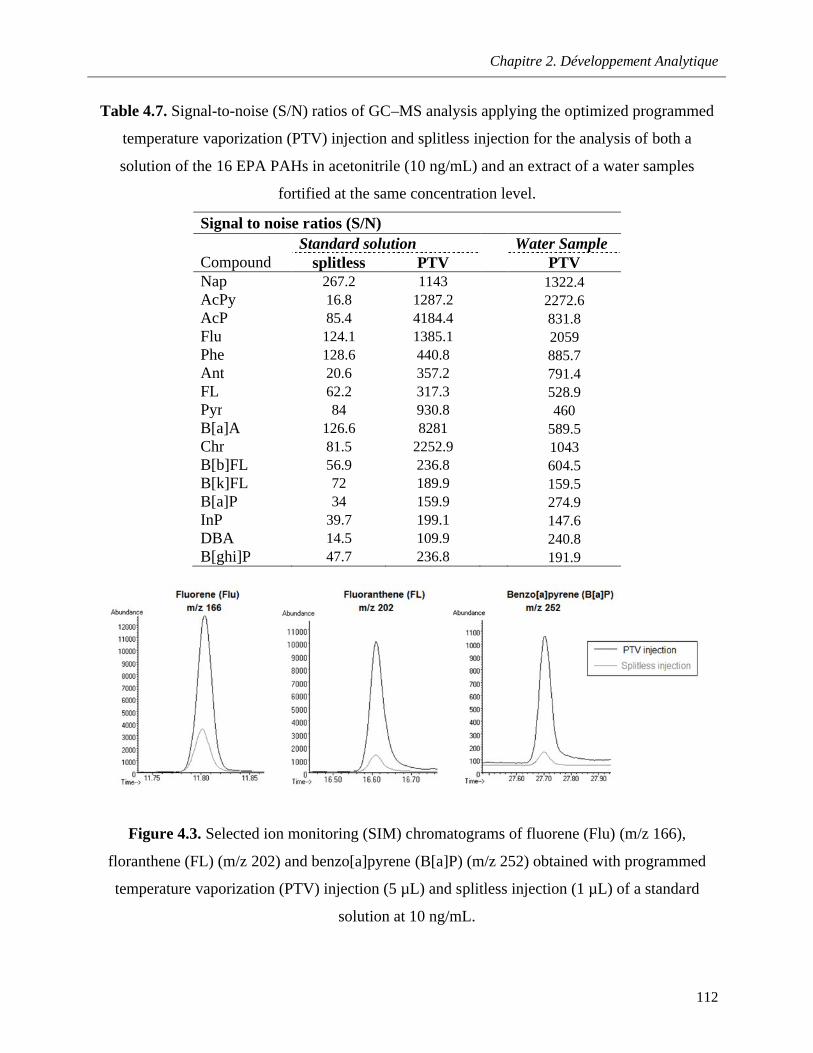
Chapitre 2. Développement Analytique
112
Table 4.7. Signal-to-noise (S/N) ratios of GC–MS analysis applying the optimized programmed
temperature vaporization (PTV) injection and splitless injection for the analysis of both a
solution of the 16 EPA PAHs in acetonitrile (10 ng/mL) and an extract of a water samples
fortified at the same concentration level.
Signal to noise ratios (S/N)Standard solution Water Sample
Compound splitless PTV PTVNap 267.2 1143 1322.4AcPy 16.8 1287.2 2272.6AcP 85.4 4184.4 831.8Flu 124.1 1385.1 2059Phe 128.6 440.8 885.7Ant 20.6 357.2 791.4FL 62.2 317.3 528.9Pyr 84 930.8 460B[a]A 126.6 8281 589.5Chr 81.5 2252.9 1043B[b]FL 56.9 236.8 604.5B[k]FL 72 189.9 159.5B[a]P 34 159.9 274.9InP 39.7 199.1 147.6DBA 14.5 109.9 240.8B[ghi]P 47.7 236.8 191.9
Figure 4.3. Selected ion monitoring (SIM) chromatograms of fluorene (Flu) (m/z 166),
floranthene (FL) (m/z 202) and benzo[a]pyrene (B[a]P) (m/z 252) obtained with programmed
temperature vaporization (PTV) injection (5 µL) and splitless injection (1 µL) of a standard
solution at 10 ng/mL.
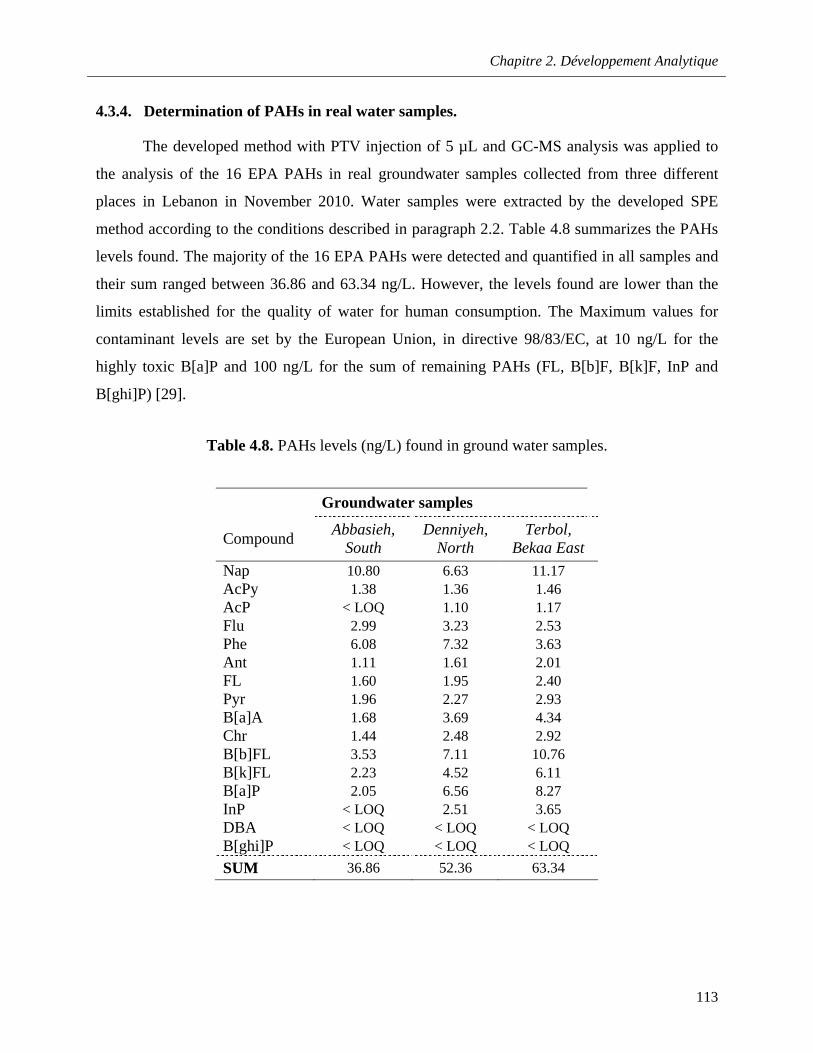
Chapitre 2. Développement Analytique
113
4.3.4. Determination of PAHs in real water samples.
The developed method with PTV injection of 5 µL and GC-MS analysis was applied to
the analysis of the 16 EPA PAHs in real groundwater samples collected from three different
places in Lebanon in November 2010. Water samples were extracted by the developed SPE
method according to the conditions described in paragraph 2.2. Table 4.8 summarizes the PAHs
levels found. The majority of the 16 EPA PAHs were detected and quantified in all samples and
their sum ranged between 36.86 and 63.34 ng/L. However, the levels found are lower than the
limits established for the quality of water for human consumption. The Maximum values for
contaminant levels are set by the European Union, in directive 98/83/EC, at 10 ng/L for the
highly toxic B[a]P and 100 ng/L for the sum of remaining PAHs (FL, B[b]F, B[k]F, InP and
B[ghi]P) [29].
Table 4.8. PAHs levels (ng/L) found in ground water samples.
Groundwater samples
CompoundAbbasieh,
SouthDenniyeh,
NorthTerbol,
Bekaa East
Nap 10.80 6.63 11.17AcPy 1.38 1.36 1.46AcP < LOQ 1.10 1.17Flu 2.99 3.23 2.53Phe 6.08 7.32 3.63Ant 1.11 1.61 2.01FL 1.60 1.95 2.40Pyr 1.96 2.27 2.93B[a]A 1.68 3.69 4.34Chr 1.44 2.48 2.92B[b]FL 3.53 7.11 10.76B[k]FL 2.23 4.52 6.11B[a]P 2.05 6.56 8.27InP < LOQ 2.51 3.65DBA < LOQ < LOQ < LOQB[ghi]P < LOQ < LOQ < LOQ
SUM 36.86 52.36 63.34
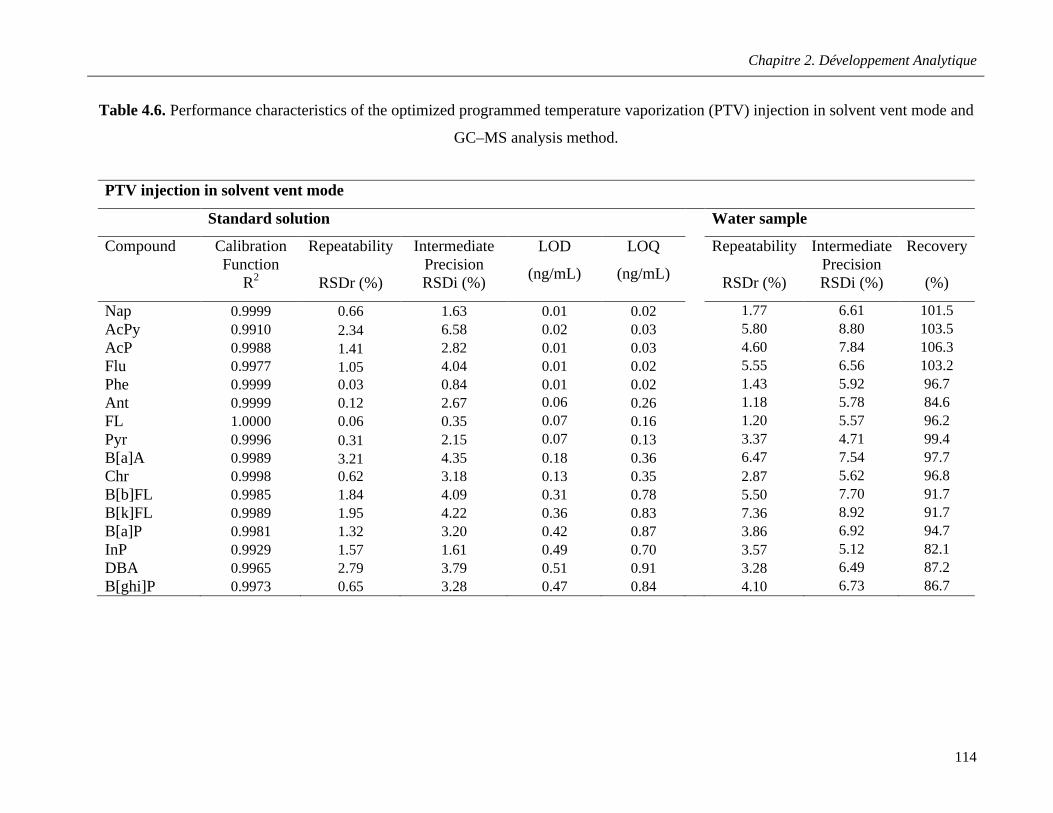
Chapitre 2. Développement Analytique
114
Table 4.6. Performance characteristics of the optimized programmed temperature vaporization (PTV) injection in solvent vent mode and
GC–MS analysis method.
PTV injection in solvent vent mode
Standard solution Water sample
Compound Calibration Function
R2
Repeatability
RSDr (%)
Intermediate PrecisionRSDi (%)
LOD
(ng/mL)
LOQ
(ng/mL)
Repeatability
RSDr (%)
Intermediate PrecisionRSDi (%)
Recovery
(%)
Nap 0.9999 0.66 1.63 0.01 0.02 1.77 6.61 101.5AcPy 0.9910 2.34 6.58 0.02 0.03 5.80 8.80 103.5AcP 0.9988 1.41 2.82 0.01 0.03 4.60 7.84 106.3Flu 0.9977 1.05 4.04 0.01 0.02 5.55 6.56 103.2Phe 0.9999 0.03 0.84 0.01 0.02 1.43 5.92 96.7Ant 0.9999 0.12 2.67 0.06 0.26 1.18 5.78 84.6FL 1.0000 0.06 0.35 0.07 0.16 1.20 5.57 96.2Pyr 0.9996 0.31 2.15 0.07 0.13 3.37 4.71 99.4B[a]A 0.9989 3.21 4.35 0.18 0.36 6.47 7.54 97.7Chr 0.9998 0.62 3.18 0.13 0.35 2.87 5.62 96.8B[b]FL 0.9985 1.84 4.09 0.31 0.78 5.50 7.70 91.7B[k]FL 0.9989 1.95 4.22 0.36 0.83 7.36 8.92 91.7B[a]P 0.9981 1.32 3.20 0.42 0.87 3.86 6.92 94.7InP 0.9929 1.57 1.61 0.49 0.70 3.57 5.12 82.1DBA 0.9965 2.79 3.79 0.51 0.91 3.28 6.49 87.2B[ghi]P 0.9973 0.65 3.28 0.47 0.84 4.10 6.73 86.7
Chapitre 2. Développement Analytique
115
4.4. Conclusion
A PTV injection method was optimized and validated for the GC-MS analysis of the 16
EPA PAHs in water samples after SPE extraction. The PTV injection parameters were optimized
using two multivariate designs, Plackett-Burman and Box-Behnken designs. For the injection of
5 µL, a temperature of 70°C with a split flow of 60 mL/min for 0.55 min under a pressure of 50
psi were the conditions chosen for the solvent vent. The analytes purge was accomplished in
splitless mode with a flow of 10 mL/min for 3 min at a temperature of 280°C. The reliability and
performance of the technique were evaluated considering the parameters of linearity, precision,
recovery and limits of detection and quantification. As compared to the splitless injection, the
optimized PTV method provided higher sensitivity for all studied analytes when injecting a
standard solution or extracting analytes from water sample. An improvement of 2 to more than
100 fold in the S/N ratios was achieved with the proposed PTV-GC–MS method. Finally, the
proposed method was successfully applied to analyze ground water samples collected from
different places in Lebanon.
References
[1] K. Ravindra, R. Sokhi, R. Van Grieken, Atmos. Environ. 42 (2008) 2895.
[2] IARC, Monographs on the evaluation of carcinogenic risk to humans, vol. 43–53.
International Agency for Reseach on Cancer, Lyon, 1991.
[3] U.S. Environmental Protection Agency. Guidelines establishing test procedures for the
analysis of pollutants. Fed. Regist. 2000, 49, 209.
[4] G. Kiss, Z. Varga-Puchony, J. Hlavay, J. of Chromatogr. A 725 (1996)
[5] G. Witt, Mar. Pollut. Bull. 31 (1995) 237.
[6] G. Witt, Mar. Chem. 79 (2002) 49.
[7] D. L. Poster, M. M. Schantz, L. C. Sander, S. A. Wise, Anal. Bioanal. Chem. (2006)
386:859–881
[8] R.M. Marce´and F. Borrull, J. of Chromatogr. A, 885 (2000) 273–290
[9] N. C. Fladung, J. of Chromatogr. A, 692 (1995) 21-26
[10] F.E. Ahmed, Trends in Anal. Chem., 20 (2001) 649-661
Chapitre 2. Développement Analytique
116
[11] Namies’nik J., Gorecki T., Polish J. of Environ. Studies, 10 (2001) 77-84
[12] E. Martinez, M. Gros, S. Lacorte, D. Barceló, J.of Chromatogr. A 1047 (2004) 181.
[13] A. Filipkowska, L. Lubecki, G. Kowalewska, Anal. Chim. Act. 547 (2005) 243.
[14] E. Hoh, K. Mastovska, J. of Chromatogr. A, 1186 (2008) 2–15
[15] A. Vermeulen, K. Welvaert, J. Vercammen, J. of Chromatogr. A 1071 (2005) 41.
[16] D. Štajnbaher, L. Zupan čič-Krajl, J. of Chromatogr. A 1190 (2008) 316.
[17] A. Esteve-Turrillas, E. Caupos, I. Llorca, A. Pastor, M. de la Guardia, J. Agric. Food
Chem. 56 (2008) 1797.
[18] F.M. Norlock, J.-K. Jang, Q. Zou, T.M. Schoonover, A. Li, J. Air Waste Manage. Assoc.
52 (2002) 19.
[19] V. Yusà, G. Quintas, O. Pardo, A. Pastor, M. de la Guardia, Talanta 69 (2006) 807.
[20] V. Fernández-González, E. Concha-Gra˜na, S. Muniategui-Lorenzo, P. López-Mahía, D.
Prada-Rodríguez, Talanta 74 (2008) 1096.
[21] J. Á. Gómez-Ruiz, F. Cordeiro, P. López, T. Wenzl, Talanta 80 (2009) 643–650.
[22] N. León, V. Yusá, O. Pardo, A. Pastor, Talanta 75 (2008) 824.
[23] A. Kouzayha, M. Al Iskandarani, S. Mokh, A. R. Rabaa, H. Budzinski, F. Jaber, J. Agric.
Food Chem. (2011) 59, 7592–7600
[24] E. Concha Graña, M.I. Turnes Carou, S. Muniategui Lorenzo, P.López Mahía, E.
Fernández Fernández, D. Prada Rodríguez, J. of Chromatogr. A 958 (2002) 17.
[25] E. Concha-Graña, I. Turnes-Carou, S. Muniategui-Lorenzo, P. López-Mahía, E.
Fernández-Fernández, D. Prada-Rodriguez, Anal. Bioanal. Chem. 379 (2004) 1120.
[26] M. Miñones-Vázquez, M.E. Vázquez-Blanco, S. Muniategui-Lorenzo, P. López-Mahía,
E. Fernández-Fernández, D. Prada-Rodríguez, J. of Chromatogr. A 919 (2001) 363.
[27] B. Veyrand, A. Brosseaud, L. Sarcher, V. Varlet, F. Monteau, P. Marchand, F. Andre, B.
Le Bizec, J. of Chromatogr. A 1149 (2007) 333.
[28] S.L.C. Ferreira, R.E. Bruns, H.S. Ferreira, G.D. Matos, J.M. David,G.C. Brandão, E.G.P.
da Silva, L.A. Portugal, P.S. dos Reis, A.S. Souza, W.N.L. dos Santos, Ana. Chim. Act.
597 (2007) 179–186
[29] European Commission, Council Directive n°98/83/CE on the quality of water intended
for human consumption, 3 November 1998.
Chapitre 2. Développement Analytique
117
5. Multiresidue method for determination of 67 pesticides in water samples using solid-phase extraction with centrifugation and gas chromatography–mass spectrometry
Abir Kouzayha1, Hélène Budzinski3 and Farouk Jaber1&2*
1 National Council for Scientific Research CNRS - Lebanese Atomic Energy Commission LAEC - Analysis of Pesticides and Organic Pollutants Laboratory LAPPO - Beirut, Lebanon.2 Lebanese University - Faculty of Sciences I - Laboratory of Analysis of Organic Compounds (509) - Hadath, Beirut, Lebanon.3 Université Bordeaux 1, CNRS, ISM–LPTC–UMR 5255 (Laboratory of Physico- and Toxico-Chemistry), 351 Cours de la Libération, 33405 Talence, France.
(Article prepared for submission)
Abstract
A new multi-residue method based on solid-phase extraction (SPE) with centrifugation was
developed for determination and quantitation of 67 pesticides in surface water by gas
chromatography–mass spectrometry (GC–MS). Two SPE cartridges were tested : Chromabond
C18 and Oasis HLB. Parameters that influence the extraction efficiency such as the eluent
volume, the sample loading volume, the addition of organic solvent to water sample, sorbent
drying and elute concentration were optimized. Under the optimized conditions, this method
showed good recoveries higher than 65-68 % for the 67 analyzed pesticides using the C18 and
HLB cartridges with relative standard deviations lower than 9.7-12.3%. Limits of quantification
were between 2 and 20 ng.L-1.
Keywords: Multi-residue; Pesticides; Solid-phase extraction; Centrifugation; Gas
chromatography–mass spectrometry.
Chapitre 2. Développement Analytique
118
5.1. Introduction
Organic contaminants present in the environment are a result of different sources of
pollution from anthropogenic activities (Reemtsma and Jekel, 2006). The pesticides, generated
by the intensification of agriculture, are regarded as some of the most dangerous contaminants of
the environment, despite their numerous merits. Not only are they toxic; they are also mobile and
capable of bioaccumulation. On top of this, they can take part in various physical, chemical and
biological processes. Many of these pesticides are characterized by a strong persistence which
explains their wide presence in the different compartments of the environment (Barth et al.,
2007; Reemtsma and Jekel, 2006). Due to these physicochemical characteristics and their
extensive use, many of these pesticides end-up in surface and ground water. They are found
nowadays in all surface waters and in a growing number of aquifers. Their presence in water is
considered as a potential risk not only for drinking water quality and human health, but also for
ecosystems (Bailey et al., 2000).
In this context, strict regulations for the control of pesticide residues concentration levels
in environment have been established. According to the European Union Directive on drinking
water quality (98/83/EC), the admissible concentration for pesticides is 0.1 µg.L-1 for each
individual substance and 0.5 µg.L-1 for the sum of pesticides (including their metabolites) (EU,
1998). In the field of environmental water policy, the European Union adopted the Water
Framework Directive (WFD) (2000/60/EC), whose objectives are to improve, protect and
prevent further deterioration of water quality. The maximal concentrations authorized can vary
from the ng.L-1 order to few µg.L-1 (EU, 2000). Such imposed regulations have driven the
development of novel analytical techniques and improvement of existing ones, so that the largest
possible number of compounds at low levels can be determined in one sensitive method.
For instrumental analysis, gas chromatography (GC) or liquid chromatography (LC)
followed by mass spectrometry detection (MS) or tandem mass spectrometry (MS-MS) are the
most commonly used techniques for the quantification of pesticides in water. However, in spite
of the recent technical progress, the pesticide quantification in water requires a first step of
extraction and preconcentration (Vreuls et al., 1999). This sample preparation step is, in fact, the
critical step of the whole analysis. The most common method is solid- phase extraction (SPE)
(Baez et al., 1997; Sabik et al., 2000; Wells & Yu, 2000), which can be used to determine a
Chapitre 2. Développement Analytique
119
broad range of pesticides in one analysis. While liquid-liquid extractions (LLE) are time-
consuming, expensive and hazardous to health due to high volume of potentially toxic solvents
used, SPE methods are rapid, present good recoveries and low detection limits.
Modern trends in sample preparation are towards the simplification of the process and
minimizing the organic solvent used. In our previous paper (Kouzayha et al., 2011), we have
reported a rapid and reliable method based on SPE with centrifugation for the extraction and
followed by GC/MS detection for the determination of the 16 PAH identified by the US
environmental protection agency (US-EPA) as priority pollutants in water samples. The focus of
the present research is the development of a similar rapid multi-residue method for the analysis
and ultra-trace quantification of 67 pesticides from different classes in waters. The potential
factors affecting SPE extraction of the analytes were optimized and discussed in details. Then,
the whole procedure was validated.
5.2. Experimental
5.2.1. Reagents, standards and small apparatus
Acetonitrile (ACN), acetone, dichloromethane (DCM), hexane (Hex) and methanol
(MeOH) (HPLC grade ≥ 99.9%) were purchased from Sigma-Aldrich (Sigma-Aldrich, St Louis,
MO, USA). Pesticide standards of high purity level (98-99.8%) were purchased from Dr.
Ehrenstorfer GmbH (Augsburg, Germany) and ChemService (West Chester, PA, USA).
Individual standard pesticide solutions were prepared in acetonitrile with a concentration of
about 1000 mg.L-1. Three standard mixture pesticide solutions were prepared by diluting each
individual standard solution with acetonitrile, in order to get a concentration of about 35 mg.L-1
for each compound. Working standards solutions were prepared by diluting the three standard
mixture pesticide solutions with acetonitrile at a concentration of 1.0 mg.L-1. All standard
solutions should be stored in dark below - 20 °C.
An analytical balance (0.01 mg, Sartorius, Germany), an ultrasonic bath (Type T 760 DH,
Prolabo, VWR International, France), a vortex shaker (Model VM-300P, Gemmy industrial
corporation, Taiwan), a centrifuge (model U-320R, Boeco, Germany) and a nitrogen sample
concentrator (Techne, U.K.) were used during experiments.
Chapitre 2. Développement Analytique
120
5.2.2. Solid-phase extraction
Two different SPE cartridges were evaluated: Chromabond C18 ec, 200 mg, 3 mL, 45 µm
from Machery-Nagel (Düren, Germany) and Oasis® HLB (hydrophilic-lipophilic balance) 60
mg, 3 mL, 50 µm from Waters (Milford, MA, USA). The SPE procedure was performed using a
Vac Elut vacuum manifold from Varian (Santa Clara, CA, USA) with a Visiprep large-volume
sampler from Supelco (Sigma-Aldrich, St. Louis, MO, USA).
For SPE optimization, blank water samples were spiked with the working standard mixed
solution and with the surrogate standard (PCB 52) prepared in MeOH, and then they were shaken
manually and with ultrasonic bath to enhance homogenization. The outlines of the SPE
procedure used for the extraction of pesticides in water samples were described in our previous
paper (Kouzayha et al., 2011). The Chromabond C18 and Oasis HLB cartridges were
preconditioned and activated at the beginning with 3 mL of methanol and then 3 mL of water.
Each water sample was percolated using a regulated vacuum through the SPE cartridge with a
flow rate of 5-10 mL.min-1, and then the cartridge was dried immediately either under vacuum or
using centrifugation technique (2500 rpm for 2 min) followed by 10 min under vacuum. The
analytes were eluted using the centrifugation technique, where 1 mL of the elution solvent was
added to the cartridge with the valve closed, then the cartridge was centrifuged (2300 rpm for 1
min), and finally the elute was recovered (Figure 5.1). This step was repeated if necessary. The
extract was collected and evaporated to about 100 μL with a weak nitrogen stream. The obtained
extract was reconstituted in 200 μL of acetonitrile, and the solution of recovery internal standards
(PCB 153) was added. Samples were stored in the dark at about - 20 °C until GC-MS analysis.
5.2.3. GC-MS analysis
An Agilent 6890N GC connected to an Agilent 5975 MS was used (Agilent technologies,
USA). The GC-MS was equipped with Agilent 7683B autosampler and split/splitless injector
with electronic pressure control. The column used was a capillary column (HP-5MS, 30 m, 0.25
mm i.d., 0.25 µm, Agilent J&W GC columns). The temperature program was the following:
initial temperature 70 °C, held for 1 min, 10 °C.min-1 ramp to 160 °C then held for 5 min, finally
by 3 °C.min-1 to 240 °C and held for 18.5 min. The total analysis time was 60.17 min and the
equilibration time 0.5 min. The temperature of the injection port was 250 °C and a 1 µL volume
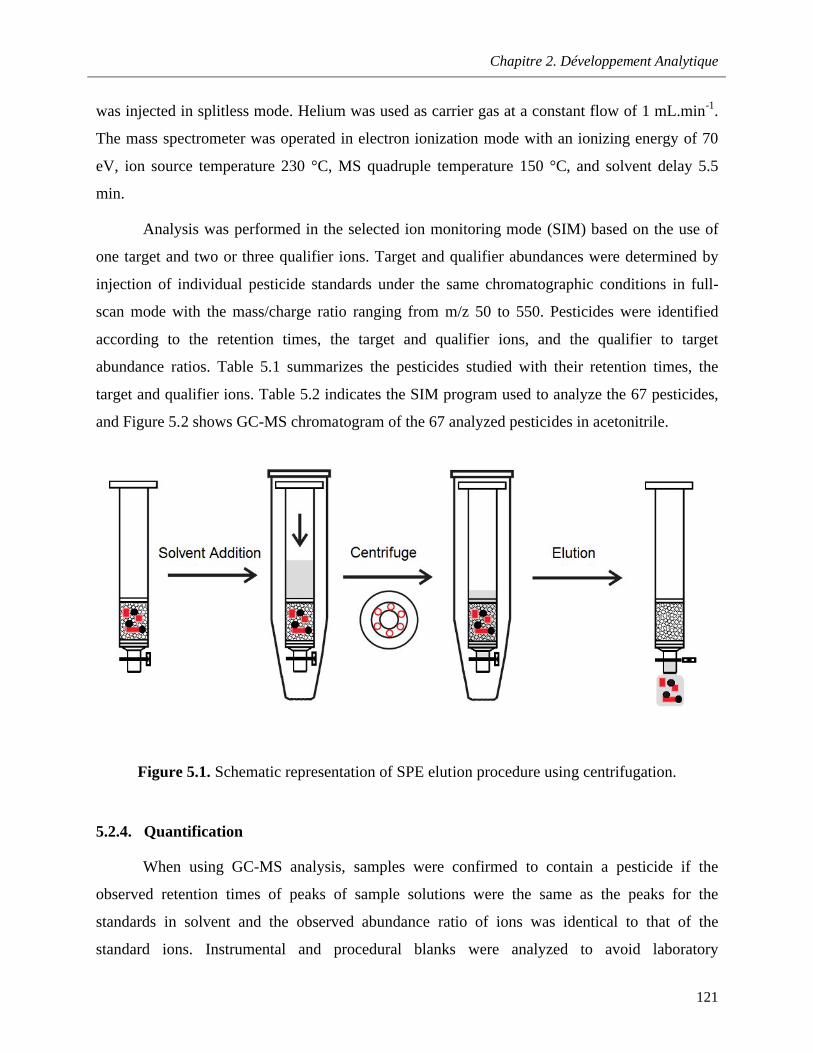
Chapitre 2. Développement Analytique
121
was injected in splitless mode. Helium was used as carrier gas at a constant flow of 1 mL.min-1.
The mass spectrometer was operated in electron ionization mode with an ionizing energy of 70
eV, ion source temperature 230 °C, MS quadruple temperature 150 °C, and solvent delay 5.5
min.
Analysis was performed in the selected ion monitoring mode (SIM) based on the use of
one target and two or three qualifier ions. Target and qualifier abundances were determined by
injection of individual pesticide standards under the same chromatographic conditions in full-
scan mode with the mass/charge ratio ranging from m/z 50 to 550. Pesticides were identified
according to the retention times, the target and qualifier ions, and the qualifier to target
abundance ratios. Table 5.1 summarizes the pesticides studied with their retention times, the
target and qualifier ions. Table 5.2 indicates the SIM program used to analyze the 67 pesticides,
and Figure 5.2 shows GC-MS chromatogram of the 67 analyzed pesticides in acetonitrile.
Figure 5.1. Schematic representation of SPE elution procedure using centrifugation.
5.2.4. Quantification
When using GC-MS analysis, samples were confirmed to contain a pesticide if the
observed retention times of peaks of sample solutions were the same as the peaks for the
standards in solvent and the observed abundance ratio of ions was identical to that of the
standard ions. Instrumental and procedural blanks were analyzed to avoid laboratory
Chapitre 2. Développement Analytique
122
contamination and analytical interferences, and the blank value must be deducted from the
results. For the SPE optimization, the quantification was based on peak area ratio of the target
ion divided by the internal standard (PCB 153) in order to evaluate the recoveries of the analyzed
pesticides. For the method validation, the quantification was done according to the surrogate
standard (PCB 52) added from the beginning of the analytical procedure.
5.3. Results and discussion
5.3.1. Selection of pesticides
After the study of the pesticides most commonly used in Lebanon, a total of 104
pesticides were initially considered for this study. Under the instrumental conditions given
above, efforts were undertaken to optimize the tuning parameters of all the pesticides in the GC-
MS in flow injection mode and then their analytical performances were tested in different scan
modes. Out of the total pesticides selected, only 67 pesticides were finally found to be suitable
for GC–MS analysis. The others were eliminated because either no peaks were observed or their
sensitivity was extremely low and did not meet the requirements. Some pesticides were removed
due to poor stability; they either decomposed rapidly after preparation of the mixed standard
solutions or failed a series of experiments, for example recovery after fortification. Eventually,
67 pesticides from different chemical families including organochlorines, organophosphates,
carbamates, pyrethroids, pyrimidine, azoles, triazoles and others, were chosen to be applicable to
GC-MS determination. The analyzed pesticides cover a wide range of compounds employed in
agriculture, like insecticides, herbicides, fungicides and acaricides. The studied pesticides are
listed in Table 5.1.
5.3.2. Development of the solid phase extraction procedure
For the optimization of the SPE, several parameters were studied including sorbent
selection (a), elution solvent (b), sample volume (c), addition of organic solvent to water sample
(d), sorbent drying (e), and elute concentration (f). The complete extraction protocol is outlined
in figure 5.3.
Chapitre 2. Développement Analytique
123
a. Sorbent selection (SPE cartridge)
The pesticide compounds exhibit a wide range of polarities; they fall into the highly
polar, medium polar and non-polar category with octanol-water partition coefficient (log Kow)
between 0.7 and 7.3 for oxadixyl and bifenthrin respectively. With this in mind, two solid phase
sorbents were chosen, Chromabond C18 and Oasis HLB. Both sorbents have been applied widely
in the research of environmental pollutant chemistry (Asi et al., 2008; Concha-Grana et al.,
2006), and they proved to be suitable for pesticides extraction from water samples (Baez et al.,
1997; de la Colina et al., 1993; EPA 525; Forcada et al., 2000; Waters, 2002). Preliminary
extraction experiments were first conducted with both sorbents to evaluate the efficiency of each
cartridge in the analysis of the target pesticides. Three independent recovery assays were
performed for each studied cartridge. The elution was done with solvents described in literature:
DCM for C18 cartridges (Tahara et al., 2006) and MeOH for HLB cartridges (Rodrigues et al.,
2007). The volume used for elution was (x3) 3 mL. Recoveries showed that both cartridges allow
good recovery percentage (higher than 50%) for most of the target compounds, except for
tebuconazole, metalaxyl and oxadixyl which showed lower recoveries on C18 cartridges (< 10%).
The poor recovery for the three polar pesticides (log Kow between 0.7 and 3.7) is rather due to the
elution step than an adsorption process. Therefore both cartridges, C18 and HLB, were found
suitable for the extraction of the selected pesticides from water and so considered for further
optimization in this study.
b. Solvent selection for analyte elution
The elution strength of the organic solvent depends on the type of sorbent used, so
different elution solvents and procedure were evaluated for Chromabond C18 and Oasis HLB
cartridges. The organic solvents considered in elution procedures were from different polarities
including acetone, DCM, Hex, and MeOH.
For traditional elution, a large volume of the elution phase is percolated slowly on SPE
cartridge to ensure desorption of analytes from the stationary phase. In our work, the
centrifugation technique was applied as an alternate to traditional elution, in order to reduce the
volume of the elution phase required. The efficiency of this technique was proved in our
previous paper (Kouzayha et al., 2011), where recoveries obtained using a small volume of
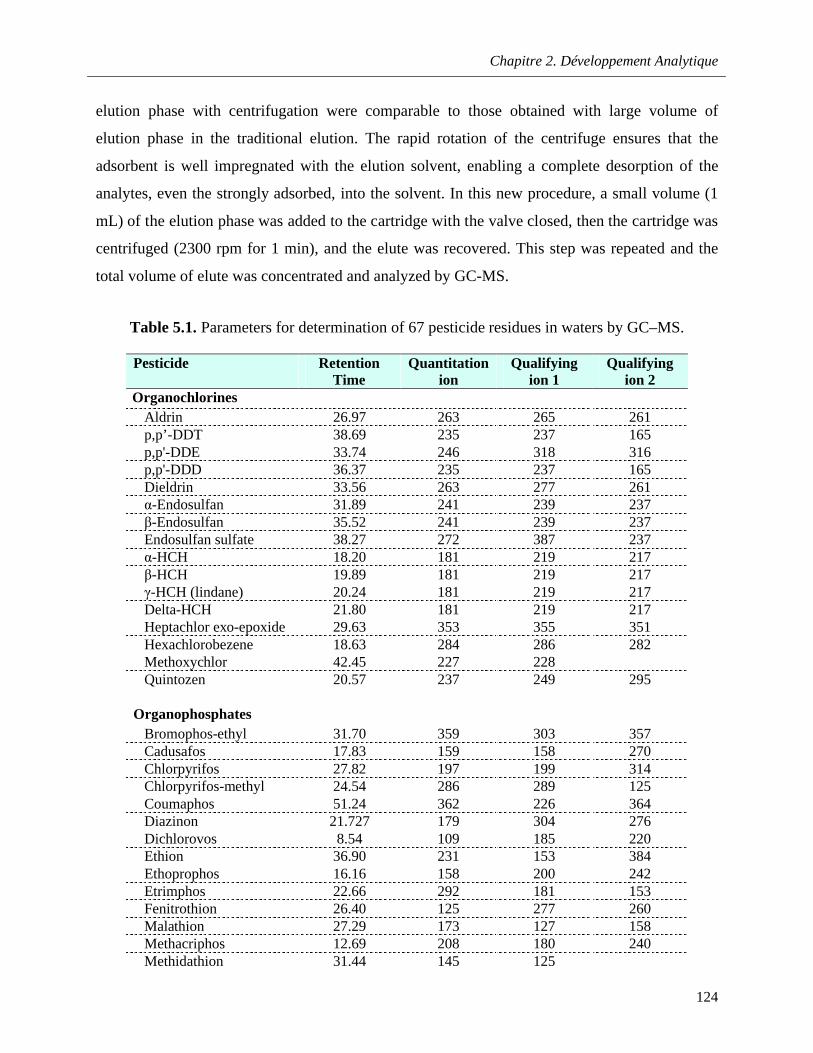
Chapitre 2. Développement Analytique
124
elution phase with centrifugation were comparable to those obtained with large volume of
elution phase in the traditional elution. The rapid rotation of the centrifuge ensures that the
adsorbent is well impregnated with the elution solvent, enabling a complete desorption of the
analytes, even the strongly adsorbed, into the solvent. In this new procedure, a small volume (1
mL) of the elution phase was added to the cartridge with the valve closed, then the cartridge was
centrifuged (2300 rpm for 1 min), and the elute was recovered. This step was repeated and the
total volume of elute was concentrated and analyzed by GC-MS.
Table 5.1. Parameters for determination of 67 pesticide residues in waters by GC–MS.
Pesticide Retention Time
Quantitation ion
Qualifying ion 1
Qualifying ion 2
OrganochlorinesAldrin 26.97 263 265 261p,p’-DDT 38.69 235 237 165p,p'-DDE 33.74 246 318 316p,p'-DDD 36.37 235 237 165Dieldrin 33.56 263 277 261α-Endosulfan 31.89 241 239 237β-Endosulfan 35.52 241 239 237Endosulfan sulfate 38.27 272 387 237α-HCH 18.20 181 219 217β-HCH 19.89 181 219 217γ-HCH (lindane) 20.24 181 219 217Delta-HCH 21.80 181 219 217Heptachlor exo-epoxide 29.63 353 355 351Hexachlorobezene 18.63 284 286 282Methoxychlor 42.45 227 228Quintozen 20.57 237 249 295
OrganophosphatesBromophos-ethyl 31.70 359 303 357Cadusafos 17.83 159 158 270Chlorpyrifos 27.82 197 199 314Chlorpyrifos-methyl 24.54 286 289 125Coumaphos 51.24 362 226 364Diazinon 21.727 179 304 276Dichlorovos 8.54 109 185 220Ethion 36.90 231 153 384Ethoprophos 16.16 158 200 242Etrimphos 22.66 292 181 153Fenitrothion 26.40 125 277 260Malathion 27.29 173 127 158Methacriphos 12.69 208 180 240Methidathion 31.44 145 125
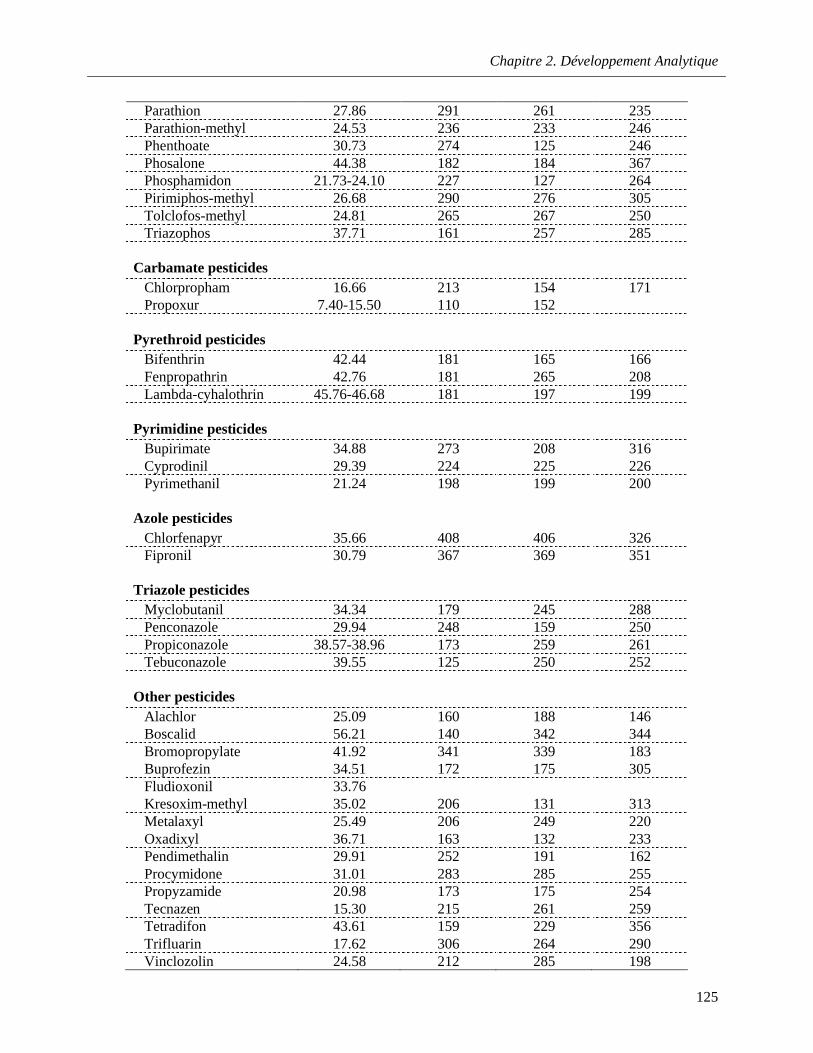
Chapitre 2. Développement Analytique
125
Parathion 27.86 291 261 235Parathion-methyl 24.53 236 233 246Phenthoate 30.73 274 125 246Phosalone 44.38 182 184 367Phosphamidon 21.73-24.10 227 127 264Pirimiphos-methyl 26.68 290 276 305Tolclofos-methyl 24.81 265 267 250Triazophos 37.71 161 257 285
Carbamate pesticides Chlorpropham 16.66 213 154 171Propoxur 7.40-15.50 110 152
Pyrethroid pesticides Bifenthrin 42.44 181 165 166Fenpropathrin 42.76 181 265 208Lambda-cyhalothrin 45.76-46.68 181 197 199
Pyrimidine pesticides Bupirimate 34.88 273 208 316Cyprodinil 29.39 224 225 226Pyrimethanil 21.24 198 199 200
Azole pesticides Chlorfenapyr 35.66 408 406 326Fipronil 30.79 367 369 351
Triazole pesticides Myclobutanil 34.34 179 245 288Penconazole 29.94 248 159 250Propiconazole 38.57-38.96 173 259 261Tebuconazole 39.55 125 250 252
Other pesticides Alachlor 25.09 160 188 146Boscalid 56.21 140 342 344Bromopropylate 41.92 341 339 183Buprofezin 34.51 172 175 305Fludioxonil 33.76Kresoxim-methyl 35.02 206 131 313Metalaxyl 25.49 206 249 220Oxadixyl 36.71 163 132 233Pendimethalin 29.91 252 191 162Procymidone 31.01 283 285 255Propyzamide 20.98 173 175 254Tecnazen 15.30 215 261 259Tetradifon 43.61 159 229 356Trifluarin 17.62 306 264 290Vinclozolin 24.58 212 285 198
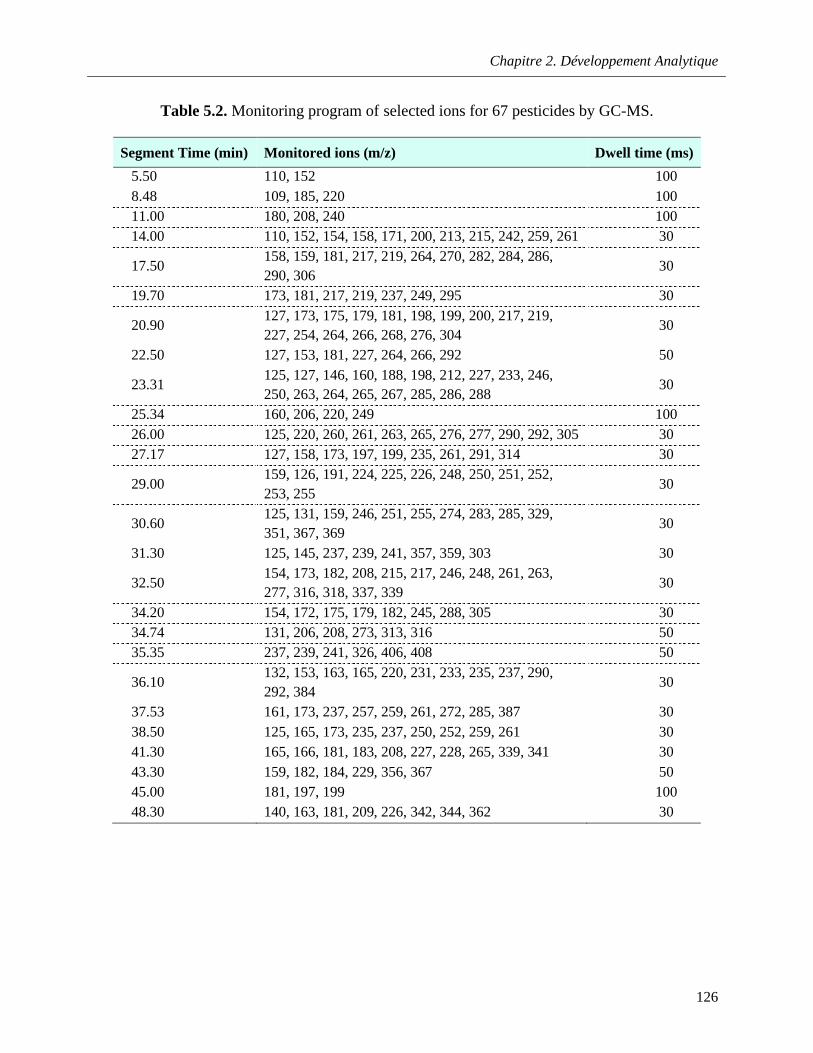
Chapitre 2. Développement Analytique
126
Table 5.2. Monitoring program of selected ions for 67 pesticides by GC-MS.
Segment Time (min) Monitored ions (m/z) Dwell time (ms)
5.50 110, 152 1008.48 109, 185, 220 10011.00 180, 208, 240 10014.00 110, 152, 154, 158, 171, 200, 213, 215, 242, 259, 261 30
17.50158, 159, 181, 217, 219, 264, 270, 282, 284, 286,290, 306
30
19.70 173, 181, 217, 219, 237, 249, 295 30
20.90127, 173, 175, 179, 181, 198, 199, 200, 217, 219, 227, 254, 264, 266, 268, 276, 304
30
22.50 127, 153, 181, 227, 264, 266, 292 50
23.31125, 127, 146, 160, 188, 198, 212, 227, 233, 246, 250, 263, 264, 265, 267, 285, 286, 288
30
25.34 160, 206, 220, 249 10026.00 125, 220, 260, 261, 263, 265, 276, 277, 290, 292, 305 3027.17 127, 158, 173, 197, 199, 235, 261, 291, 314 30
29.00159, 126, 191, 224, 225, 226, 248, 250, 251, 252, 253, 255
30
30.60125, 131, 159, 246, 251, 255, 274, 283, 285, 329, 351, 367, 369
30
31.30 125, 145, 237, 239, 241, 357, 359, 303 30
32.50154, 173, 182, 208, 215, 217, 246, 248, 261, 263, 277, 316, 318, 337, 339
30
34.20 154, 172, 175, 179, 182, 245, 288, 305 3034.74 131, 206, 208, 273, 313, 316 5035.35 237, 239, 241, 326, 406, 408 50
36.10132, 153, 163, 165, 220, 231, 233, 235, 237, 290, 292, 384
30
37.53 161, 173, 237, 257, 259, 261, 272, 285, 387 3038.50 125, 165, 173, 235, 237, 250, 252, 259, 261 3041.30 165, 166, 181, 183, 208, 227, 228, 265, 339, 341 3043.30 159, 182, 184, 229, 356, 367 5045.00 181, 197, 199 10048.30 140, 163, 181, 209, 226, 342, 344, 362 30
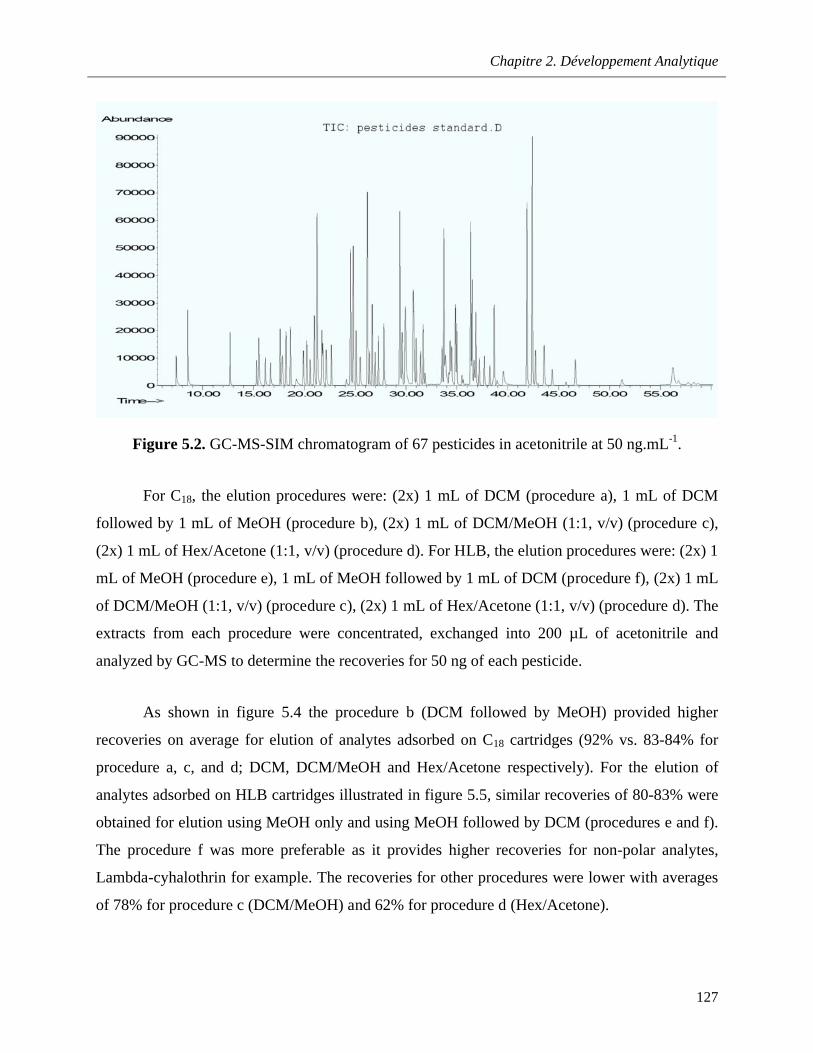
Chapitre 2. Développement Analytique
127
Figure 5.2. GC-MS-SIM chromatogram of 67 pesticides in acetonitrile at 50 ng.mL-1.
For C18, the elution procedures were: (2x) 1 mL of DCM (procedure a), 1 mL of DCM
followed by 1 mL of MeOH (procedure b), (2x) 1 mL of DCM/MeOH (1:1, v/v) (procedure c),
(2x) 1 mL of Hex/Acetone (1:1, v/v) (procedure d). For HLB, the elution procedures were: (2x) 1
mL of MeOH (procedure e), 1 mL of MeOH followed by 1 mL of DCM (procedure f), (2x) 1 mL
of DCM/MeOH (1:1, v/v) (procedure c), (2x) 1 mL of Hex/Acetone (1:1, v/v) (procedure d). The
extracts from each procedure were concentrated, exchanged into 200 µL of acetonitrile and
analyzed by GC-MS to determine the recoveries for 50 ng of each pesticide.
As shown in figure 5.4 the procedure b (DCM followed by MeOH) provided higher
recoveries on average for elution of analytes adsorbed on C18 cartridges (92% vs. 83-84% for
procedure a, c, and d; DCM, DCM/MeOH and Hex/Acetone respectively). For the elution of
analytes adsorbed on HLB cartridges illustrated in figure 5.5, similar recoveries of 80-83% were
obtained for elution using MeOH only and using MeOH followed by DCM (procedures e and f).
The procedure f was more preferable as it provides higher recoveries for non-polar analytes,
Lambda-cyhalothrin for example. The recoveries for other procedures were lower with averages
of 78% for procedure c (DCM/MeOH) and 62% for procedure d (Hex/Acetone).
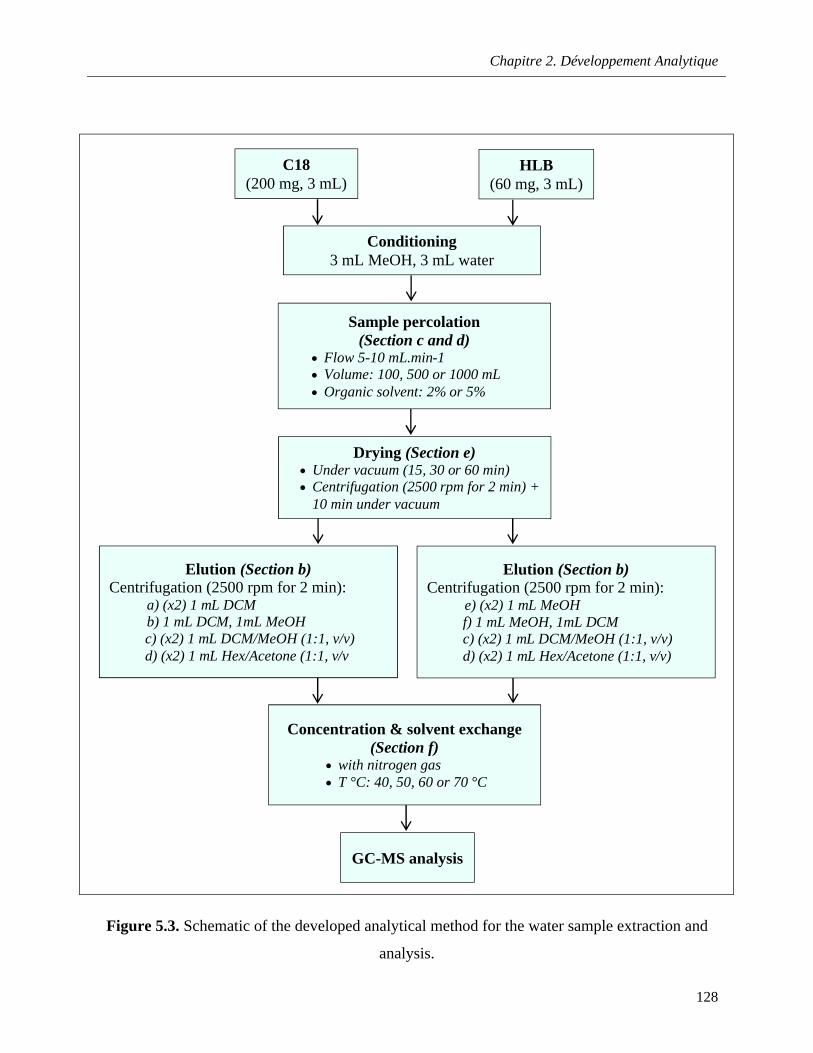
Chapitre 2. Développement Analytique
128
Figure 5.3. Schematic of the developed analytical method for the water sample extraction and
analysis.
Conditioning3 mL MeOH, 3 mL water
Sample percolation (Section c and d)
Flow 5-10 mL.min-1 Volume: 100, 500 or 1000 mL Organic solvent: 2% or 5%
Drying (Section e) Under vacuum (15, 30 or 60 min) Centrifugation (2500 rpm for 2 min) +
10 min under vacuum
Elution (Section b)Centrifugation (2500 rpm for 2 min):
a) (x2) 1 mL DCMb) 1 mL DCM, 1mL MeOH c) (x2) 1 mL DCM/MeOH (1:1, v/v)d) (x2) 1 mL Hex/Acetone (1:1, v/v
Concentration & solvent exchange(Section f)
with nitrogen gas T °C: 40, 50, 60 or 70 °C
C18(200 mg, 3 mL)
HLB(60 mg, 3 mL)
Elution (Section b)Centrifugation (2500 rpm for 2 min):
e) (x2) 1 mL MeOHf) 1 mL MeOH, 1mL DCM c) (x2) 1 mL DCM/MeOH (1:1, v/v)d) (x2) 1 mL Hex/Acetone (1:1, v/v)
GC-MS analysis
Chapitre 2. Développement Analytique
129
c. Sample loading volume
In addition to the selectivity, a higher preconcentration factor is usually expected in the
trace level sample analysis. Generally, two main approaches are tried to increase the
preconcentration factor: one is the adsorption ability of materials to the analytes which is the
intrinsic nature that can be exploited for better extraction of the analytes, and the other is
changing the volume of water sample to reach the analytical goal. However, large volume of
sample will not lead to the maximum extraction factor sometimes because of breakthrough
problems, when the analyte is no longer retained by the sorbent due to elution by sample loading
volume. Predicting the breakthrough volume based on the analogy between LC and SPE has
largely been described (Hennion et al., 1998; Hennion 1999; Pichon 2000). The breakthrough
volume can vary with the concentration of the target compounds, which is more likely to
breakthrough at higher concentration. So the breakthrough volume should be evaluated at the
conservatively highest predictive concentration of the target compound in the research area.
In our work, the influence of the sample loading volume was investigated for both
cartridges, Chromabond C18 and Oasis HLB, where loading volume was varied from 10 to 1000
mL of water fortified with 200 ng.L-1. The results, illustrated in Figure 5.6 (for C18 cartridges)
and Figure 5.7 (for HLB cartridges) indicated that no apparent differences were found among the
enrichment efficiencies for most of the pesticides analyzed over the range of sample volume
loaded on C18 and HLB cartridges, except for the two highly polar pesticides with high solubility
in water, dichlorovos and propoxur (log Kow between 1.54 and 1.9, solubility between 18000 and
1900 mg.L-1 respectively). The recovery of dichlorovos decreased significantly by 34-45%, and
the recovery of propoxur fell by 4-31% for sample volumes of 500 and 1000 mL loaded on C18
cartridges. This meant the breakthrough volumes of these two compounds were very low on this
type of cartridge. By contrast, the breakthrough volumes of these two compounds and other
pesticides in this study exceeded 1000 mL for HLB cartridges based on the change of recovery
with volume observed. Due to comprehensive consideration of enhancing the enrichment factor
and avoid excessive sample-handling times and applicability for routine analysis, 500 mL was
adopted as the water sample volume for C18 and HLB cartridges.
However, low recoveries (lower than 60%) were observed for some target compounds,
organochlorines and pyrethroids (p,p’-DDT, p,p'-DDE and p,p'-DDD; bifenthrin, fenpropathrin
and lambda-cyhalothrin) for water volumes exceeding 10 mL, which probably resulted from the
Chapitre 2. Développement Analytique
130
losses of these hydrophobic compounds induced by the adsorption on the inside wall of the glass
sample bottle. This problem is discussed in the next Section.
d. Addition of organic solvent
As explained in the last section (5.3.2.c), the addition of organic solvent to water sample
was considered in our study to enhance the extraction efficiencies of the high hydrophobic
pesticides. Generally, organic solvent addition can increase the solubility of analytes adsorbed on
glass bottles in the aqueous phase. MeOH was the organic solvent added to a volume of 500 mL
of spiked water sample in different percentages (5, 10 and 20%) and tests were performed on C18
and HLB cartridges.
When adding MeOH to water sample, recoveries for most of the analyzed pesticides on
C18 and HLB cartridges decreased significantly, especially with a percentage of 10 and 20% of
MeOH. This decrease in recoveries was less pronounced for HLB cartridges than for C18
cartridges. On the other hand, whatever the percentage of MeOH added, recoveries of the
hydrophobic organochlorines and pyrethroids were not strongly impacted. Therefore, we decided
not to add MeOH to the water samples to prevent losses of analytes due to breakthrough (Figure
5.8 & 5.9). Low recoveries of the most hydrophobic analytes could be improved by adding the
surrogate standard to water sample simultaneously with pesticide standards before SPE
extraction. The quantification of pesticides recoveries using the surrogate standard and not the
internal standard can improve the recoveries of these analytes, and therefore used for the method
validation.
e. Sorbent drying
Initial sorbent drying after the sample loading was performed on extraction sorbents that
had been dried under high vacuum. The influence of the drying time was investigated for
cartridges Chromabond C18 and Oasis HLB, after the percolation of 500 mL of blank water
fortified with the suite of pesticide compounds (50 ng each) and before solvent elution. Different
drying times ranging from 10 to 60 min were tested. In our previous paper (Kouzayha et al.,
2011), we have shown that the use of the centrifugation technique before vacuum drying ensures
the complete remove of residual water from SPE cartridge and reduce the necessary drying time.
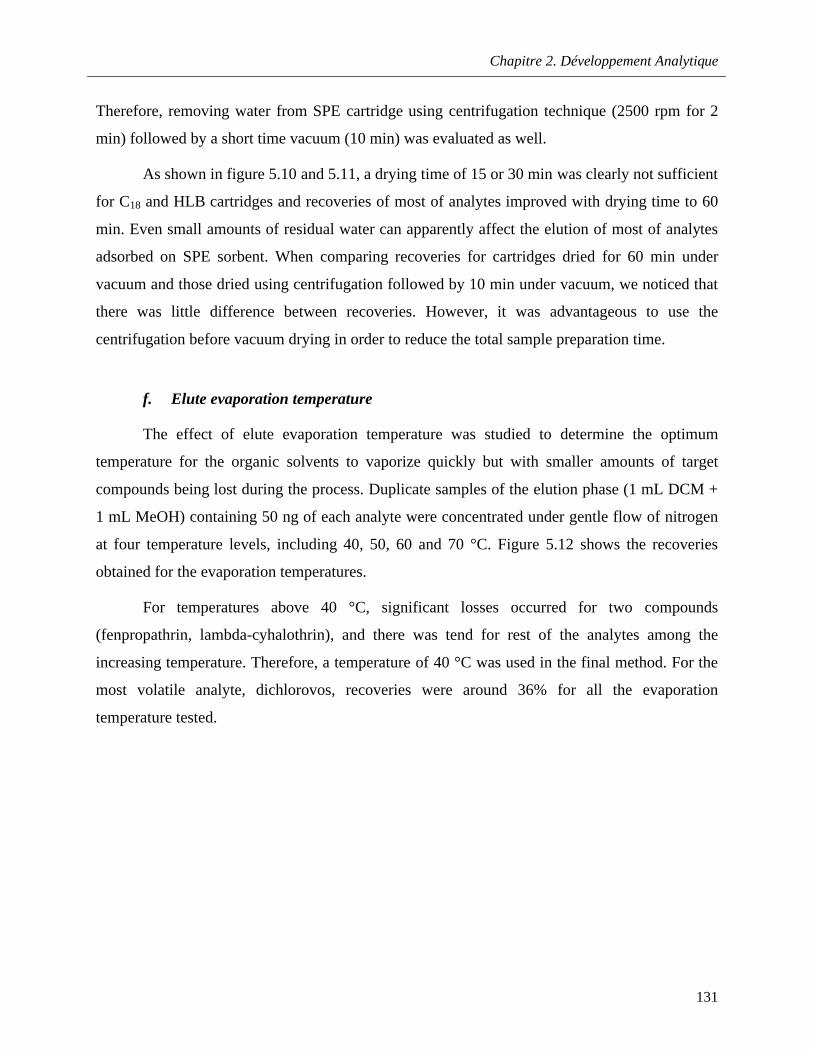
Chapitre 2. Développement Analytique
131
Therefore, removing water from SPE cartridge using centrifugation technique (2500 rpm for 2
min) followed by a short time vacuum (10 min) was evaluated as well.
As shown in figure 5.10 and 5.11, a drying time of 15 or 30 min was clearly not sufficient
for C18 and HLB cartridges and recoveries of most of analytes improved with drying time to 60
min. Even small amounts of residual water can apparently affect the elution of most of analytes
adsorbed on SPE sorbent. When comparing recoveries for cartridges dried for 60 min under
vacuum and those dried using centrifugation followed by 10 min under vacuum, we noticed that
there was little difference between recoveries. However, it was advantageous to use the
centrifugation before vacuum drying in order to reduce the total sample preparation time.
f. Elute evaporation temperature
The effect of elute evaporation temperature was studied to determine the optimum
temperature for the organic solvents to vaporize quickly but with smaller amounts of target
compounds being lost during the process. Duplicate samples of the elution phase (1 mL DCM +
1 mL MeOH) containing 50 ng of each analyte were concentrated under gentle flow of nitrogen
at four temperature levels, including 40, 50, 60 and 70 °C. Figure 5.12 shows the recoveries
obtained for the evaporation temperatures.
For temperatures above 40 °C, significant losses occurred for two compounds
(fenpropathrin, lambda-cyhalothrin), and there was tend for rest of the analytes among the
increasing temperature. Therefore, a temperature of 40 °C was used in the final method. For the
most volatile analyte, dichlorovos, recoveries were around 36% for all the evaporation
temperature tested.
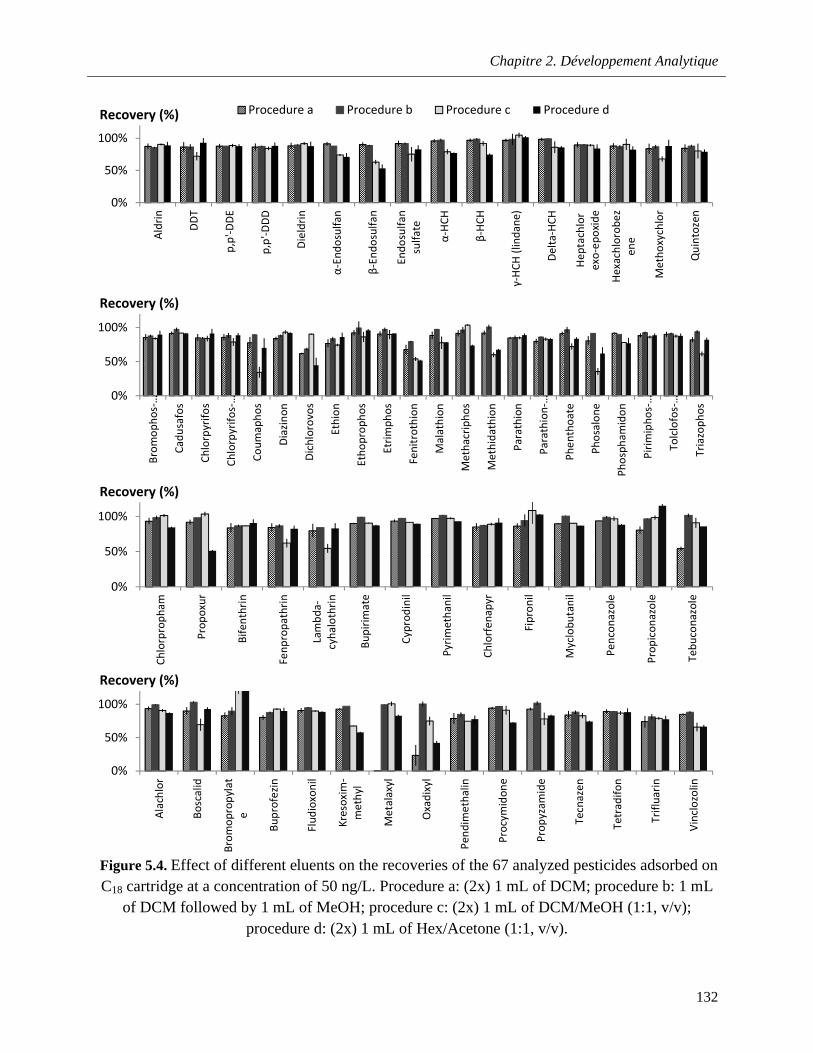
Chapitre 2. Développement Analytique
132
Figure 5.4. Effect of different eluents on the recoveries of the 67 analyzed pesticides adsorbed on C18 cartridge at a concentration of 50 ng/L. Procedure a: (2x) 1 mL of DCM; procedure b: 1 mL
of DCM followed by 1 mL of MeOH; procedure c: (2x) 1 mL of DCM/MeOH (1:1, v/v); procedure d: (2x) 1 mL of Hex/Acetone (1:1, v/v).
0%
50%
100%Al
drin
DD
T
p,p'
-DD
E
p,p'
-DD
D
Die
ldrin
α-En
dosu
lfan
β-En
dosu
lfan
Endo
sulfa
nsu
lfate
α-H
CH
β-H
CH
γ-H
CH (l
inda
ne)
Del
ta-H
CH
Hep
tach
lor
exo-
epox
ide
Hex
achl
orob
ezen
e
Met
hoxy
chlo
r
Qui
ntoz
en
Recovery (%) Procedure a Procedure b Procedure c Procedure d
0%
50%
100%
Brom
opho
s-…
Cadu
safo
s
Chlo
rpyr
ifos
Chlo
rpyr
ifos-
…
Coum
apho
s
Dia
zino
n
Dic
hlor
ovos
Ethi
on
Etho
prop
hos
Etrim
phos
Feni
trot
hion
Mal
athi
on
Met
hacr
ipho
s
Met
hida
thio
n
Para
thio
n
Para
thio
n-…
Phen
thoa
te
Phos
alon
e
Phos
pham
idon
Pirim
ipho
s-…
Tolc
lofo
s-…
Tria
zoph
os
Recovery (%)
0%
50%
100%
Chlo
rpro
pham
Prop
oxur
Bife
nthr
in
Fenp
ropa
thrin
Lam
bda-
cyha
loth
rin
Bupi
rimat
e
Cypr
odin
il
Pyrim
etha
nil
Chlo
rfen
apyr
Fipr
onil
Myc
lobu
tani
l
Penc
onaz
ole
Prop
icon
azol
e
Tebu
cona
zole
Recovery (%)
0%
50%
100%
Alac
hlor
Bosc
alid
Brom
opro
pyla
te
Bupr
ofez
in
Flud
ioxo
nil
Kres
oxim
-m
ethy
l
Met
alax
yl
Oxa
dixy
l
Pend
imet
halin
Proc
ymid
one
Prop
yzam
ide
Tecn
azen
Tetr
adifo
n
Trifl
uarin
Vinc
lozo
linRecovery (%)
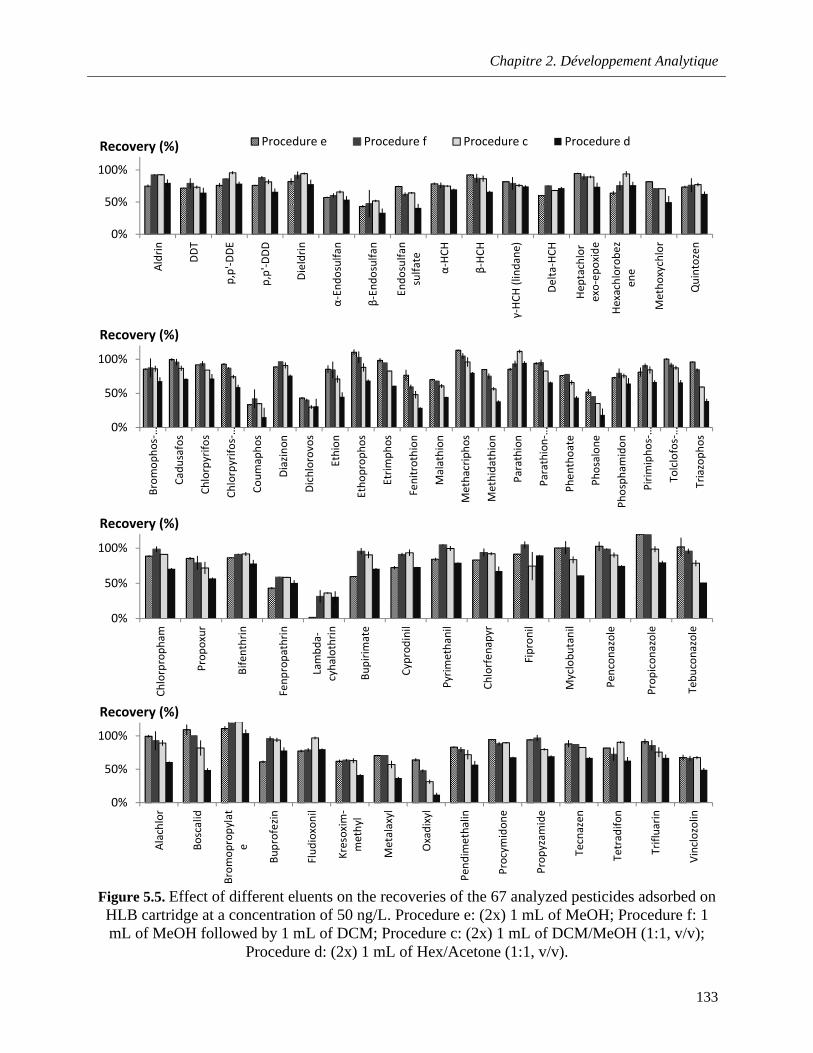
Chapitre 2. Développement Analytique
133
Figure 5.5. Effect of different eluents on the recoveries of the 67 analyzed pesticides adsorbed on HLB cartridge at a concentration of 50 ng/L. Procedure e: (2x) 1 mL of MeOH; Procedure f: 1 mL of MeOH followed by 1 mL of DCM; Procedure c: (2x) 1 mL of DCM/MeOH (1:1, v/v);
Procedure d: (2x) 1 mL of Hex/Acetone (1:1, v/v).
0%
50%
100%Al
drin
DD
T
p,p'
-DD
E
p,p'
-DD
D
Die
ldrin
α-En
dosu
lfan
β-En
dosu
lfan
Endo
sulfa
nsu
lfate
α-H
CH
β-H
CH
γ-H
CH (l
inda
ne)
Del
ta-H
CH
Hep
tach
lor
exo-
epox
ide
Hex
achl
orob
ezen
e
Met
hoxy
chlo
r
Qui
ntoz
en
Recovery (%) Procedure e Procedure f Procedure c Procedure d
0%
50%
100%
Brom
opho
s-…
Cadu
safo
s
Chlo
rpyr
ifos
Chlo
rpyr
ifos-
…
Coum
apho
s
Dia
zino
n
Dic
hlor
ovos
Ethi
on
Etho
prop
hos
Etrim
phos
Feni
trot
hion
Mal
athi
on
Met
hacr
ipho
s
Met
hida
thio
n
Para
thio
n
Para
thio
n-…
Phen
thoa
te
Phos
alon
e
Phos
pham
idon
Pirim
ipho
s-…
Tolc
lofo
s-…
Tria
zoph
os
Recovery (%)
0%
50%
100%
Chlo
rpro
pham
Prop
oxur
Bife
nthr
in
Fenp
ropa
thrin
Lam
bda-
cyha
loth
rin
Bupi
rimat
e
Cypr
odin
il
Pyrim
etha
nil
Chlo
rfen
apyr
Fipr
onil
Myc
lobu
tani
l
Penc
onaz
ole
Prop
icon
azol
e
Tebu
cona
zole
Recovery (%)
0%
50%
100%
Alac
hlor
Bosc
alid
Brom
opro
pyla
te
Bupr
ofez
in
Flud
ioxo
nil
Kres
oxim
-m
ethy
l
Met
alax
yl
Oxa
dixy
l
Pend
imet
halin
Proc
ymid
one
Prop
yzam
ide
Tecn
azen
Tetr
adifo
n
Trifl
uarin
Vinc
lozo
lin
Recovery (%)
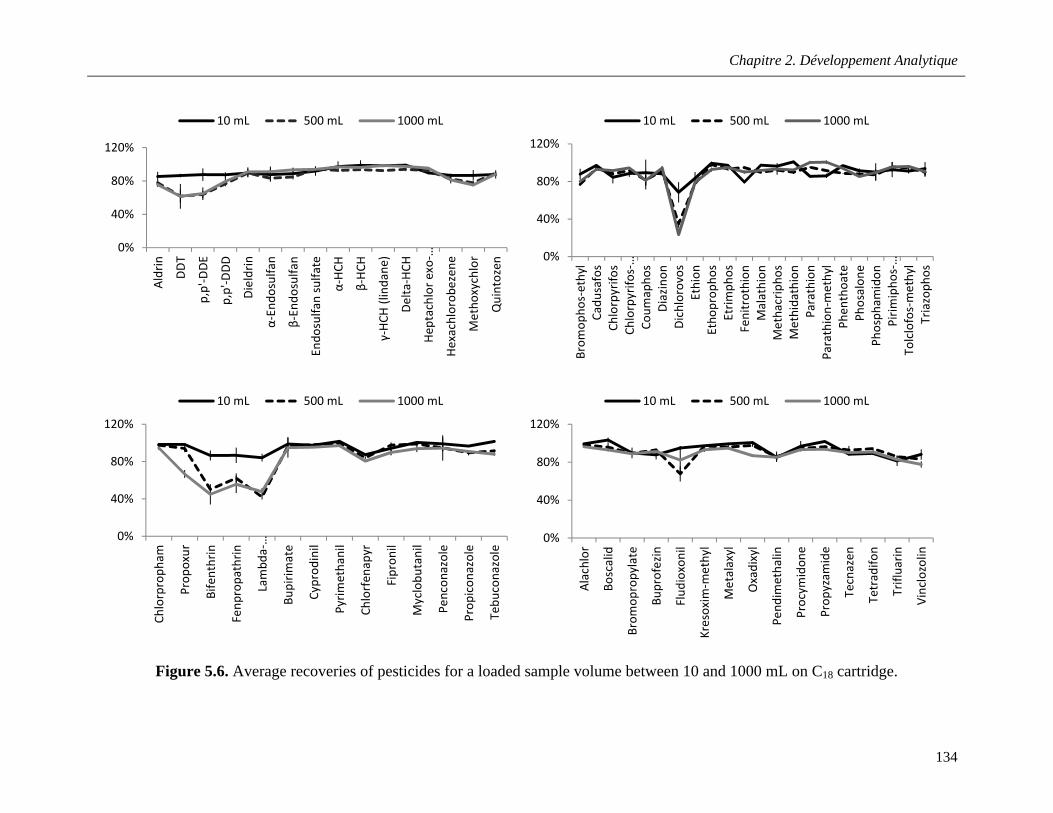
Chapitre 2. Développement Analytique
134
Figure 5.6. Average recoveries of pesticides for a loaded sample volume between 10 and 1000 mL on C18 cartridge.
0%
40%
80%
120%Al
drin
DD
T
p,p'
-DD
E
p,p'
-DD
D
Die
ldrin
α-En
dosu
lfan
β-En
dosu
lfan
Endo
sulfa
n su
lfate
α-H
CH
β-H
CH
γ-H
CH (l
inda
ne)
Del
ta-H
CH
Hep
tach
lor e
xo-…
Hex
achl
orob
ezen
e
Met
hoxy
chlo
r
Qui
ntoz
en
10 mL 500 mL 1000 mL
0%
40%
80%
120%
Brom
opho
s-et
hyl
Cadu
safo
sCh
lorp
yrifo
sCh
lorp
yrifo
s-…
Coum
apho
sD
iazi
non
Dic
hlor
ovos
Ethi
onEt
hopr
opho
sEt
rimph
osFe
nitr
othi
onM
alat
hion
Met
hacr
ipho
sM
ethi
dath
ion
Para
thio
nPa
rath
ion-
met
hyl
Phen
thoa
tePh
osal
one
Phos
pham
idon
Pirim
ipho
s-…
Tolc
lofo
s-m
ethy
lTr
iazo
phos
10 mL 500 mL 1000 mL
0%
40%
80%
120%
Chlo
rpro
pham
Prop
oxur
Bife
nthr
in
Fenp
ropa
thrin
Lam
bda-
…
Bupi
rimat
e
Cypr
odin
il
Pyrim
etha
nil
Chlo
rfen
apyr
Fipr
onil
Myc
lobu
tani
l
Penc
onaz
ole
Prop
icon
azol
e
Tebu
cona
zole
10 mL 500 mL 1000 mL
0%
40%
80%
120%
Alac
hlor
Bosc
alid
Brom
opro
pyla
te
Bupr
ofez
in
Flud
ioxo
nil
Kres
oxim
-met
hyl
Met
alax
yl
Oxa
dixy
l
Pend
imet
halin
Proc
ymid
one
Prop
yzam
ide
Tecn
azen
Tetr
adifo
n
Trifl
uarin
Vinc
lozo
lin
10 mL 500 mL 1000 mL
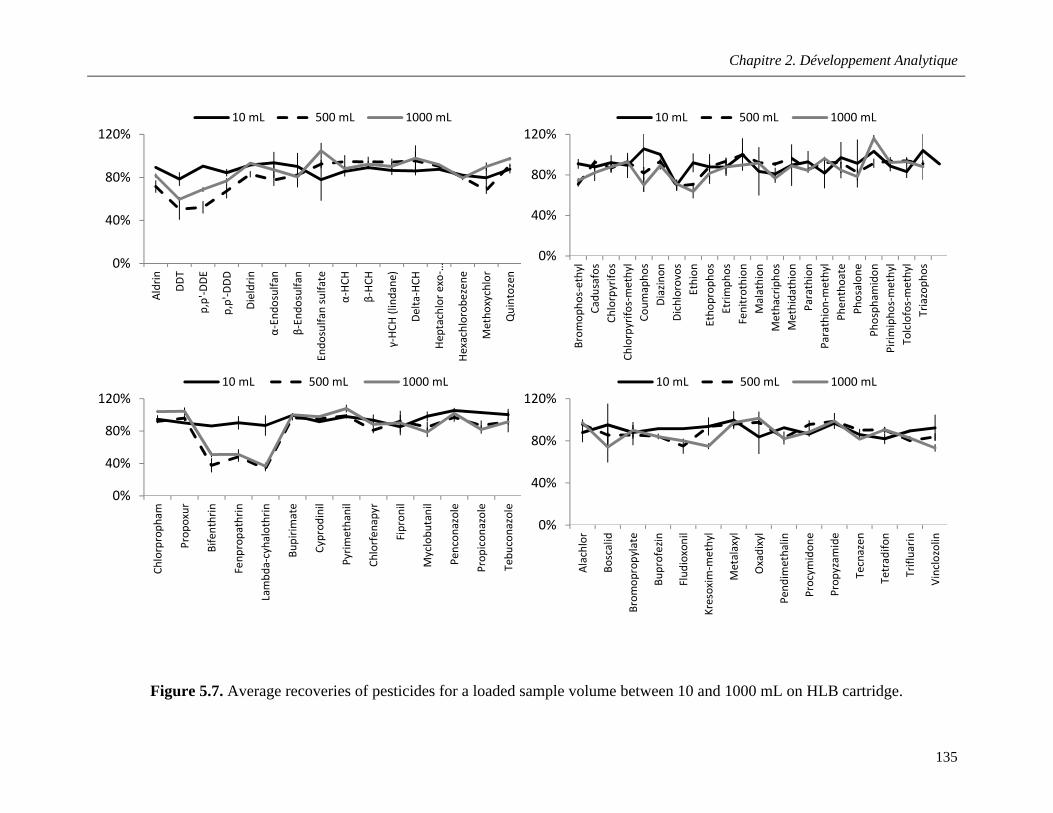
Chapitre 2. Développement Analytique
135
Figure 5.7. Average recoveries of pesticides for a loaded sample volume between 10 and 1000 mL on HLB cartridge.
0%
40%
80%
120%Al
drin
DD
T
p,p'
-DD
E
p,p'
-DD
D
Die
ldrin
α-En
dosu
lfan
β-En
dosu
lfan
Endo
sulfa
n su
lfate
α-H
CH
β-H
CH
γ-H
CH (l
inda
ne)
Del
ta-H
CH
Hep
tach
lor e
xo-…
Hex
achl
orob
ezen
e
Met
hoxy
chlo
r
Qui
ntoz
en
10 mL 500 mL 1000 mL
0%
40%
80%
120%
Brom
opho
s-et
hyl
Cadu
safo
sCh
lorp
yrifo
sCh
lorp
yrifo
s-m
ethy
lCo
umap
hos
Dia
zino
nD
ichl
orov
osEt
hion
Etho
prop
hos
Etrim
phos
Feni
trot
hion
Mal
athi
onM
etha
crip
hos
Met
hida
thio
nPa
rath
ion
Para
thio
n-m
ethy
lPh
enth
oate
Phos
alon
ePh
osph
amid
onPi
rimip
hos-
met
hyl
Tolc
lofo
s-m
ethy
lTr
iazo
phos
10 mL 500 mL 1000 mL
0%
40%
80%
120%
Chlo
rpro
pham
Prop
oxur
Bife
nthr
in
Fenp
ropa
thrin
Lam
bda-
cyha
loth
rin
Bupi
rimat
e
Cypr
odin
il
Pyrim
etha
nil
Chlo
rfen
apyr
Fipr
onil
Myc
lobu
tani
l
Penc
onaz
ole
Prop
icon
azol
e
Tebu
cona
zole
10 mL 500 mL 1000 mL
0%
40%
80%
120%
Alac
hlor
Bosc
alid
Brom
opro
pyla
te
Bupr
ofez
in
Flud
ioxo
nil
Kres
oxim
-met
hyl
Met
alax
yl
Oxa
dixy
l
Pend
imet
halin
Proc
ymid
one
Prop
yzam
ide
Tecn
azen
Tetr
adifo
n
Trifl
uarin
Vinc
lozo
lin
10 mL 500 mL 1000 mL
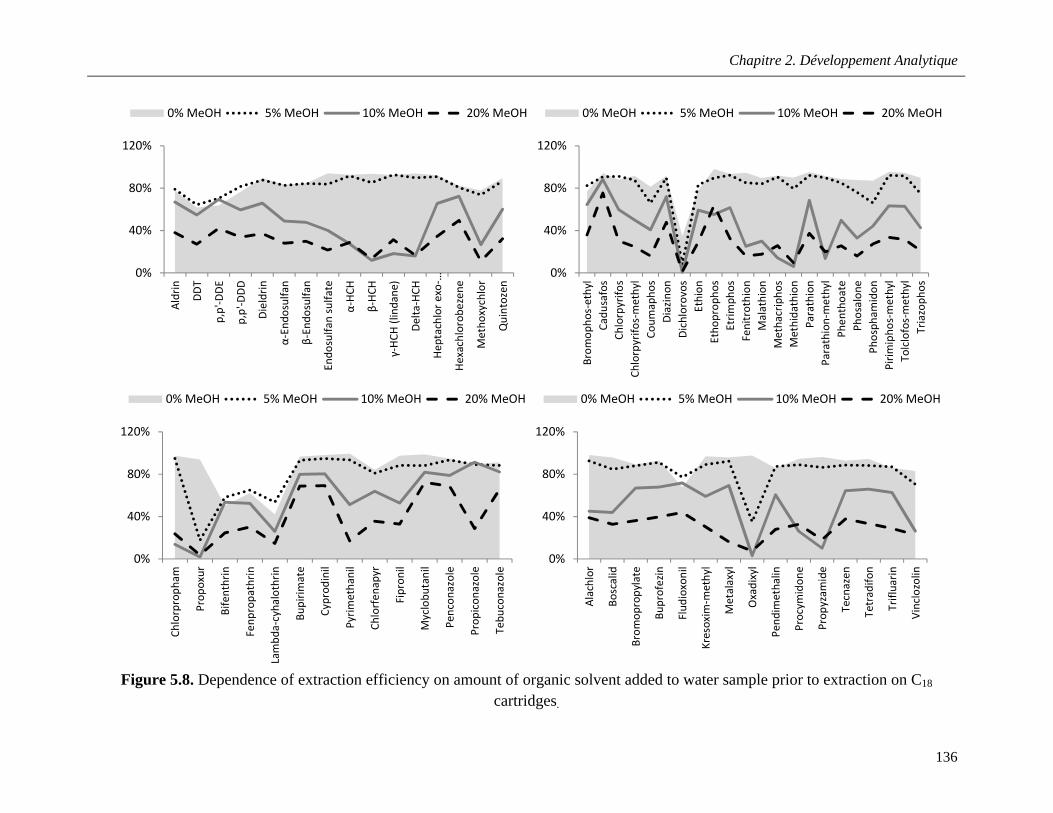
Chapitre 2. Développement Analytique
136
Figure 5.8. Dependence of extraction efficiency on amount of organic solvent added to water sample prior to extraction on C18
cartridges.
0%
40%
80%
120%
Aldr
in
DD
T
p,p'
-DD
E
p,p'
-DD
D
Die
ldrin
α-En
dosu
lfan
β-En
dosu
lfan
Endo
sulfa
n su
lfate
α-H
CH
β-H
CH
γ-H
CH (l
inda
ne)
Del
ta-H
CH
Hep
tach
lor e
xo-…
Hex
achl
orob
ezen
e
Met
hoxy
chlo
r
Qui
ntoz
en
0% MeOH 5% MeOH 10% MeOH 20% MeOH
0%
40%
80%
120%
Brom
opho
s-et
hyl
Cadu
safo
sCh
lorp
yrifo
sCh
lorp
yrifo
s-m
ethy
lCo
umap
hos
Dia
zino
nD
ichl
orov
osEt
hion
Etho
prop
hos
Etrim
phos
Feni
trot
hion
Mal
athi
onM
etha
crip
hos
Met
hida
thio
nPa
rath
ion
Para
thio
n-m
ethy
lPh
enth
oate
Phos
alon
ePh
osph
amid
onPi
rimip
hos-
met
hyl
Tolc
lofo
s-m
ethy
lTr
iazo
phos
0% MeOH 5% MeOH 10% MeOH 20% MeOH
0%
40%
80%
120%
Chlo
rpro
pham
Prop
oxur
Bife
nthr
in
Fenp
ropa
thrin
Lam
bda-
cyha
loth
rin
Bupi
rimat
e
Cypr
odin
il
Pyrim
etha
nil
Chlo
rfen
apyr
Fipr
onil
Myc
lobu
tani
l
Penc
onaz
ole
Prop
icon
azol
e
Tebu
cona
zole
0% MeOH 5% MeOH 10% MeOH 20% MeOH
0%
40%
80%
120%
Alac
hlor
Bosc
alid
Brom
opro
pyla
te
Bupr
ofez
in
Flud
ioxo
nil
Kres
oxim
-met
hyl
Met
alax
yl
Oxa
dixy
l
Pend
imet
halin
Proc
ymid
one
Prop
yzam
ide
Tecn
azen
Tetr
adifo
n
Trifl
uarin
Vinc
lozo
lin
0% MeOH 5% MeOH 10% MeOH 20% MeOH
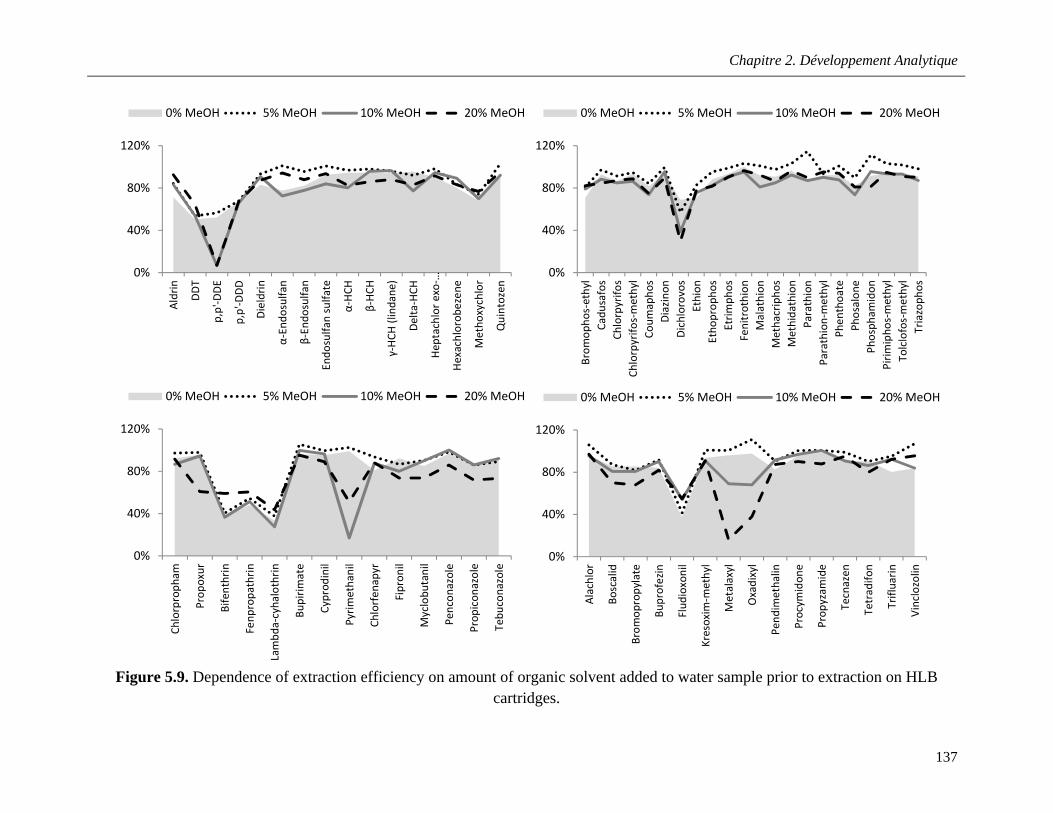
Chapitre 2. Développement Analytique
137
Figure 5.9. Dependence of extraction efficiency on amount of organic solvent added to water sample prior to extraction on HLBcartridges.
0%
40%
80%
120%
Aldr
in
DD
T
p,p'
-DD
E
p,p'
-DD
D
Die
ldrin
α-En
dosu
lfan
β-En
dosu
lfan
Endo
sulfa
n su
lfate
α-H
CH
β-H
CH
γ-H
CH (l
inda
ne)
Del
ta-H
CH
Hep
tach
lor e
xo-…
Hex
achl
orob
ezen
e
Met
hoxy
chlo
r
Qui
ntoz
en
0% MeOH 5% MeOH 10% MeOH 20% MeOH
0%
40%
80%
120%
Brom
opho
s-et
hyl
Cadu
safo
sCh
lorp
yrifo
sCh
lorp
yrifo
s-m
ethy
lCo
umap
hos
Dia
zino
nD
ichl
orov
osEt
hion
Etho
prop
hos
Etrim
phos
Feni
trot
hion
Mal
athi
onM
etha
crip
hos
Met
hida
thio
nPa
rath
ion
Para
thio
n-m
ethy
lPh
enth
oate
Phos
alon
ePh
osph
amid
onPi
rimip
hos-
met
hyl
Tolc
lofo
s-m
ethy
lTr
iazo
phos
0% MeOH 5% MeOH 10% MeOH 20% MeOH
0%
40%
80%
120%
Chlo
rpro
pham
Prop
oxur
Bife
nthr
in
Fenp
ropa
thrin
Lam
bda-
cyha
loth
rin
Bupi
rimat
e
Cypr
odin
il
Pyrim
etha
nil
Chlo
rfen
apyr
Fipr
onil
Myc
lobu
tani
l
Penc
onaz
ole
Prop
icon
azol
e
Tebu
cona
zole
0% MeOH 5% MeOH 10% MeOH 20% MeOH
0%
40%
80%
120%
Alac
hlor
Bosc
alid
Brom
opro
pyla
te
Bupr
ofez
in
Flud
ioxo
nil
Kres
oxim
-met
hyl
Met
alax
yl
Oxa
dixy
l
Pend
imet
halin
Proc
ymid
one
Prop
yzam
ide
Tecn
azen
Tetr
adifo
n
Trifl
uarin
Vinc
lozo
lin
0% MeOH 5% MeOH 10% MeOH 20% MeOH
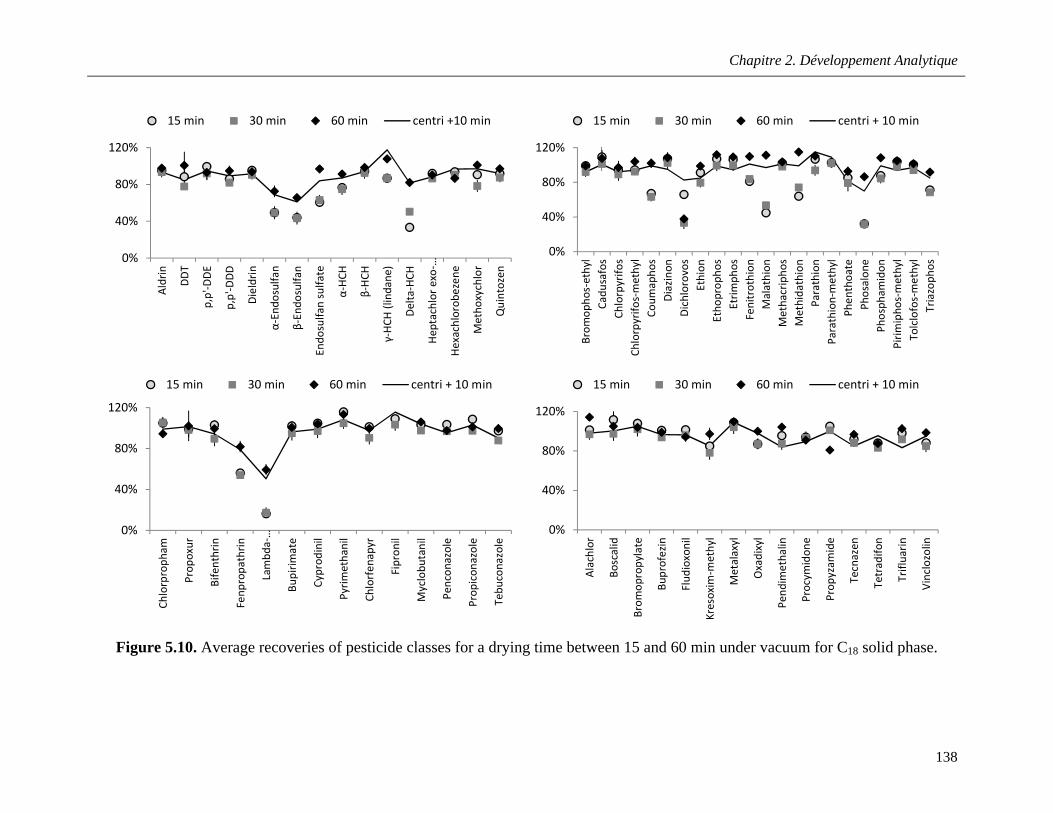
Chapitre 2. Développement Analytique
138
Figure 5.10. Average recoveries of pesticide classes for a drying time between 15 and 60 min under vacuum for C18 solid phase.
0%
40%
80%
120%Al
drin
DD
T
p,p'
-DD
E
p,p'
-DD
D
Die
ldrin
α-En
dosu
lfan
β-En
dosu
lfan
Endo
sulfa
n su
lfate
α-H
CH
β-H
CH
γ-H
CH (l
inda
ne)
Del
ta-H
CH
Hep
tach
lor e
xo-…
Hex
achl
orob
ezen
e
Met
hoxy
chlo
r
Qui
ntoz
en
15 min 30 min 60 min centri +10 min
0%
40%
80%
120%
Brom
opho
s-et
hyl
Cadu
safo
sCh
lorp
yrifo
sCh
lorp
yrifo
s-m
ethy
lCo
umap
hos
Dia
zino
nD
ichl
orov
osEt
hion
Etho
prop
hos
Etrim
phos
Feni
trot
hion
Mal
athi
onM
etha
crip
hos
Met
hida
thio
nPa
rath
ion
Para
thio
n-m
ethy
lPh
enth
oate
Phos
alon
ePh
osph
amid
onPi
rimip
hos-
met
hyl
Tolc
lofo
s-m
ethy
lTr
iazo
phos
15 min 30 min 60 min centri + 10 min
0%
40%
80%
120%
Chlo
rpro
pham
Prop
oxur
Bife
nthr
in
Fenp
ropa
thrin
Lam
bda-
…
Bupi
rimat
e
Cypr
odin
il
Pyrim
etha
nil
Chlo
rfen
apyr
Fipr
onil
Myc
lobu
tani
l
Penc
onaz
ole
Prop
icon
azol
e
Tebu
cona
zole
15 min 30 min 60 min centri + 10 min
0%
40%
80%
120%
Alac
hlor
Bosc
alid
Brom
opro
pyla
te
Bupr
ofez
in
Flud
ioxo
nil
Kres
oxim
-met
hyl
Met
alax
yl
Oxa
dixy
l
Pend
imet
halin
Proc
ymid
one
Prop
yzam
ide
Tecn
azen
Tetr
adifo
n
Trifl
uarin
Vinc
lozo
lin
15 min 30 min 60 min centri + 10 min
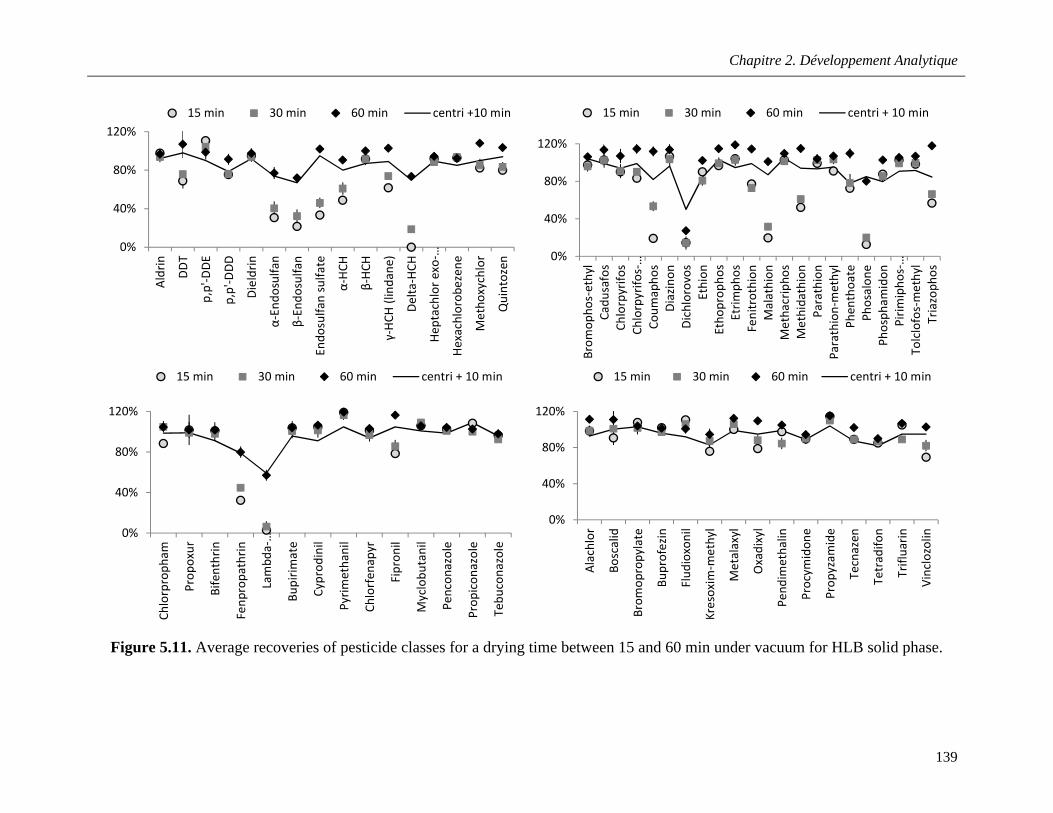
Chapitre 2. Développement Analytique
139
Figure 5.11. Average recoveries of pesticide classes for a drying time between 15 and 60 min under vacuum for HLB solid phase.
0%
40%
80%
120%
Aldr
in
DD
T
p,p'
-DD
E
p,p'
-DD
D
Die
ldrin
α-En
dosu
lfan
β-En
dosu
lfan
Endo
sulfa
n su
lfate
α-H
CH
β-H
CH
γ-H
CH (l
inda
ne)
Del
ta-H
CH
Hep
tach
lor e
xo-…
Hex
achl
orob
ezen
e
Met
hoxy
chlo
r
Qui
ntoz
en
15 min 30 min 60 min centri +10 min
0%
40%
80%
120%
Brom
opho
s-et
hyl
Cadu
safo
sCh
lorp
yrifo
sCh
lorp
yrifo
s-…
Coum
apho
sD
iazi
non
Dic
hlor
ovos
Ethi
onEt
hopr
opho
sEt
rimph
osFe
nitr
othi
onM
alat
hion
Met
hacr
ipho
sM
ethi
dath
ion
Para
thio
nPa
rath
ion-
met
hyl
Phen
thoa
tePh
osal
one
Phos
pham
idon
Pirim
ipho
s-…
Tolc
lofo
s-m
ethy
lTr
iazo
phos
15 min 30 min 60 min centri + 10 min
0%
40%
80%
120%
Chlo
rpro
pham
Prop
oxur
Bife
nthr
in
Fenp
ropa
thrin
Lam
bda-
…
Bupi
rimat
e
Cypr
odin
il
Pyrim
etha
nil
Chlo
rfen
apyr
Fipr
onil
Myc
lobu
tani
l
Penc
onaz
ole
Prop
icon
azol
e
Tebu
cona
zole
15 min 30 min 60 min centri + 10 min
0%
40%
80%
120%
Alac
hlor
Bosc
alid
Brom
opro
pyla
te
Bupr
ofez
in
Flud
ioxo
nil
Kres
oxim
-met
hyl
Met
alax
yl
Oxa
dixy
l
Pend
imet
halin
Proc
ymid
one
Prop
yzam
ide
Tecn
azen
Tetr
adifo
n
Trifl
uarin
Vinc
lozo
lin
15 min 30 min 60 min centri + 10 min
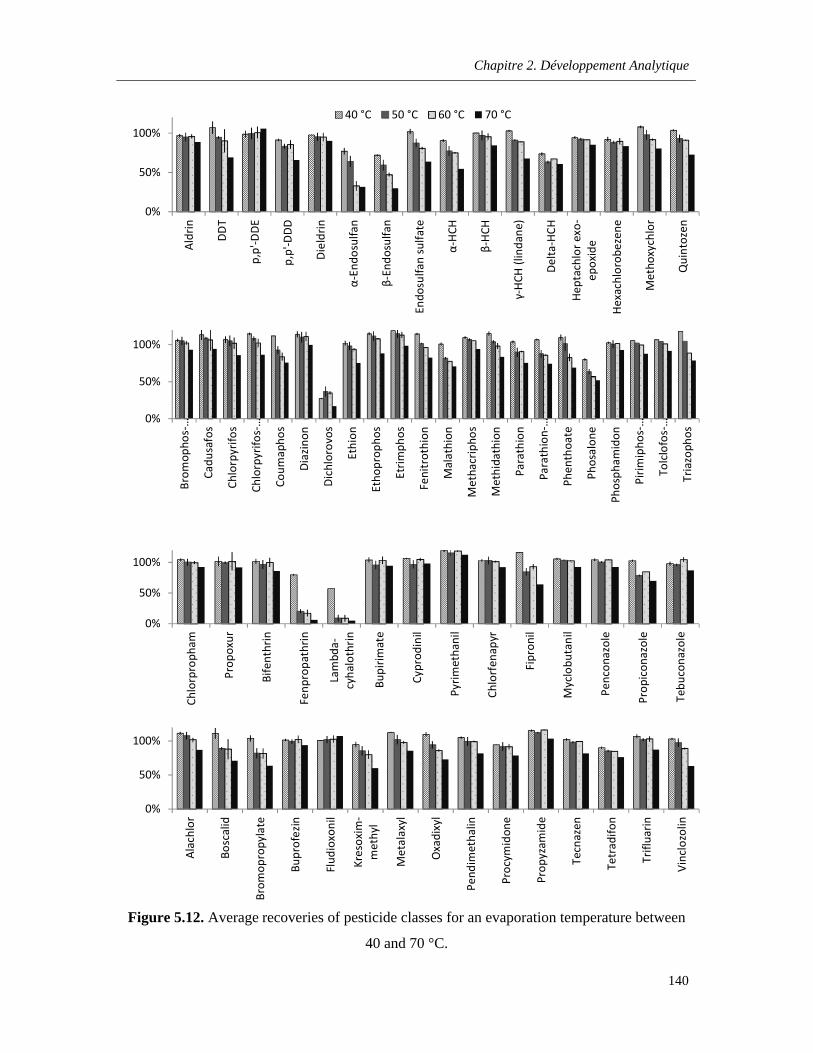
Chapitre 2. Développement Analytique
140
Figure 5.12. Average recoveries of pesticide classes for an evaporation temperature between
40 and 70 °C.
0%
50%
100%
Aldr
in
DD
T
p,p'
-DD
E
p,p'
-DD
D
Die
ldrin
α-En
dosu
lfan
β-En
dosu
lfan
Endo
sulfa
n su
lfate
α-H
CH
β-H
CH
γ-H
CH (l
inda
ne)
Del
ta-H
CH
Hep
tach
lor e
xo-
epox
ide
Hex
achl
orob
ezen
e
Met
hoxy
chlo
r
Qui
ntoz
en
40 °C 50 °C 60 °C 70 °C
0%
50%
100%
Brom
opho
s-…
Cadu
safo
s
Chlo
rpyr
ifos
Chlo
rpyr
ifos-
…
Coum
apho
s
Dia
zino
n
Dic
hlor
ovos
Ethi
on
Etho
prop
hos
Etrim
phos
Feni
trot
hion
Mal
athi
on
Met
hacr
ipho
s
Met
hida
thio
n
Para
thio
n
Para
thio
n-…
Phen
thoa
te
Phos
alon
e
Phos
pham
idon
Pirim
ipho
s-…
Tolc
lofo
s-…
Tria
zoph
os
0%
50%
100%
Chlo
rpro
pham
Prop
oxur
Bife
nthr
in
Fenp
ropa
thrin
Lam
bda-
cyha
loth
rin
Bupi
rimat
e
Cypr
odin
il
Pyrim
etha
nil
Chlo
rfen
apyr
Fipr
onil
Myc
lobu
tani
l
Penc
onaz
ole
Prop
icon
azol
e
Tebu
cona
zole
0%
50%
100%
Alac
hlor
Bosc
alid
Brom
opro
pyla
te
Bupr
ofez
in
Flud
ioxo
nil
Kres
oxim
-m
ethy
l
Met
alax
yl
Oxa
dixy
l
Pend
imet
halin
Proc
ymid
one
Prop
yzam
ide
Tecn
azen
Tetr
adifo
n
Trifl
uarin
Vinc
lozo
lin

Chapitre 2. Développement Analytique
141
5.3.3. Method validation
The performance of the optimized SPE-GC-MS analysis method was validated
evaluating the linearity, recoveries, precision and limits of quantification (LOQs). The results
are listed in Table 5.3.
a. Linearity
Linearity was determined for the instrumental response. The range of concentration
studied was 5-500 µg.L-1 analyzing reference standard solution at seven concentration levels
(5, 25, 50, 100, 250 and 500 µg.L-1) for the instrumental response. The calibration curves
were plotted using a least-square regression analysis. Linearity was evaluated and results are
detailed in table 5.3. Each compound showed good linearity for the GC-MS analysis in the
studied working range, with correlation coefficient (R2) greater than 0.993.
b. Recovery and Precision
The recovery and precision of the developed analytical method were evaluated for C18
and HLB cartridges. Recovery studies of all pesticide were performed at 100 ng.L-1, which is
the maximal admissible concentration set in the EU directive for individual pesticides in
drinking water (EU, 1998). Precision was described as the value of relative standard
deviation (RSDs) of the areas obtained for each analyte after the replicate (n = 6) analyses of
spiked water samples. Recovery data and RSDs values obtained are shown in Table 5.3.
Recoveries were calculated with the surrogate standard (PCB 52) and values were
above 65-68 % for all the analytes using the C18 and HLB cartridges (Table 5.3).The overall
method repeatability for all pesticides expressed as RSDs was satisfactory and in the range of
0.2–12.3% for C18 and 0.2-9.7 % for HLB (Table 5.3).
c. Limit of quantification
The LOQs were experimentally determined at a signal-to-noise ratio (S/N) of 6, by
the spiking of blank water sample at four levels (2, 4, 10 and 20 ng L-1, n = 6). As Table 5.3
shows, the LODs obtained were in the low ng.L-1 level for all analyzed pesticides (2-10 ng L-
1), except for few compounds where a value of 20 ng L-1 was necessary to achieve the LOQ.
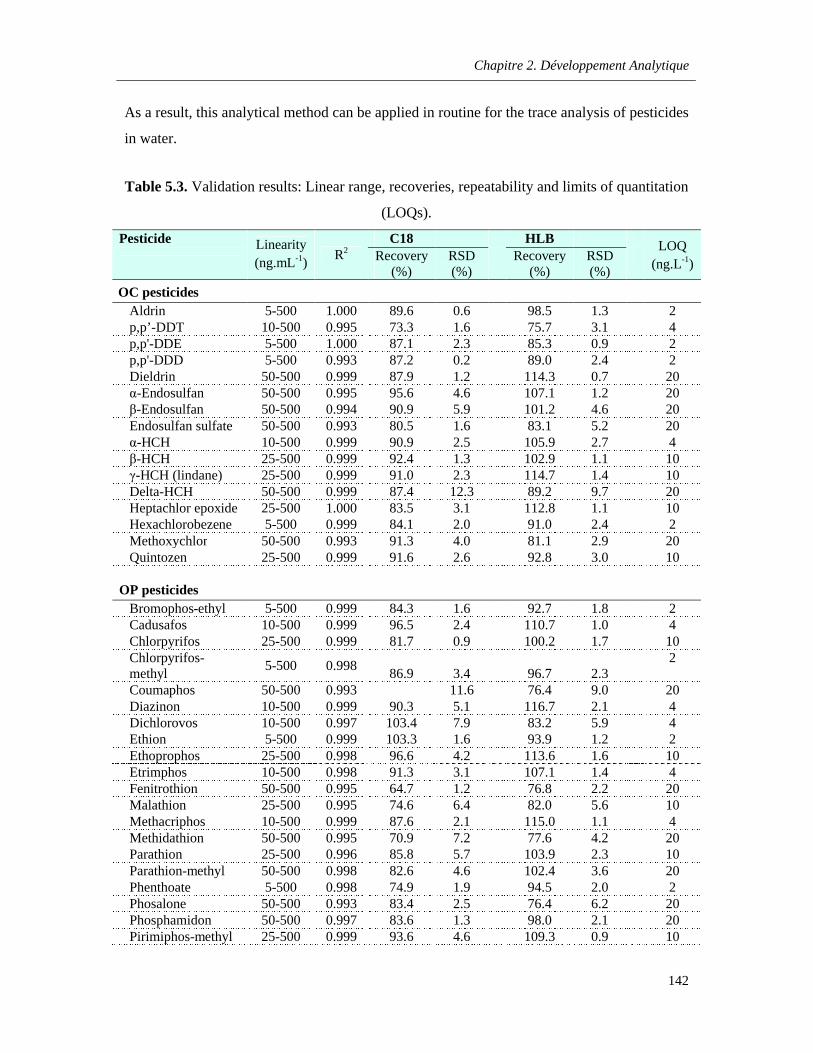
Chapitre 2. Développement Analytique
142
As a result, this analytical method can be applied in routine for the trace analysis of pesticides
in water.
Table 5.3. Validation results: Linear range, recoveries, repeatability and limits of quantitation
(LOQs).
Pesticide Linearity (ng.mL-1)
R2C18 HLB LOQ
(ng.L-1)Recovery
(%)RSD (%)
Recovery (%)
RSD (%)
OC pesticidesAldrin 5-500 1.000 89.6 0.6 98.5 1.3 2p,p’-DDT 10-500 0.995 73.3 1.6 75.7 3.1 4p,p'-DDE 5-500 1.000 87.1 2.3 85.3 0.9 2p,p'-DDD 5-500 0.993 87.2 0.2 89.0 2.4 2Dieldrin 50-500 0.999 87.9 1.2 114.3 0.7 20α-Endosulfan 50-500 0.995 95.6 4.6 107.1 1.2 20β-Endosulfan 50-500 0.994 90.9 5.9 101.2 4.6 20Endosulfan sulfate 50-500 0.993 80.5 1.6 83.1 5.2 20α-HCH 10-500 0.999 90.9 2.5 105.9 2.7 4β-HCH 25-500 0.999 92.4 1.3 102.9 1.1 10γ-HCH (lindane) 25-500 0.999 91.0 2.3 114.7 1.4 10Delta-HCH 50-500 0.999 87.4 12.3 89.2 9.7 20Heptachlor epoxide 25-500 1.000 83.5 3.1 112.8 1.1 10Hexachlorobezene 5-500 0.999 84.1 2.0 91.0 2.4 2Methoxychlor 50-500 0.993 91.3 4.0 81.1 2.9 20Quintozen 25-500 0.999 91.6 2.6 92.8 3.0 10
OP pesticidesBromophos-ethyl 5-500 0.999 84.3 1.6 92.7 1.8 2Cadusafos 10-500 0.999 96.5 2.4 110.7 1.0 4Chlorpyrifos 25-500 0.999 81.7 0.9 100.2 1.7 10Chlorpyrifos-methyl
5-500 0.99886.9 3.4 96.7 2.3
2
Coumaphos 50-500 0.993 11.6 76.4 9.0 20Diazinon 10-500 0.999 90.3 5.1 116.7 2.1 4Dichlorovos 10-500 0.997 103.4 7.9 83.2 5.9 4Ethion 5-500 0.999 103.3 1.6 93.9 1.2 2Ethoprophos 25-500 0.998 96.6 4.2 113.6 1.6 10Etrimphos 10-500 0.998 91.3 3.1 107.1 1.4 4Fenitrothion 50-500 0.995 64.7 1.2 76.8 2.2 20Malathion 25-500 0.995 74.6 6.4 82.0 5.6 10Methacriphos 10-500 0.999 87.6 2.1 115.0 1.1 4Methidathion 50-500 0.995 70.9 7.2 77.6 4.2 20Parathion 25-500 0.996 85.8 5.7 103.9 2.3 10Parathion-methyl 50-500 0.998 82.6 4.6 102.4 3.6 20Phenthoate 5-500 0.998 74.9 1.9 94.5 2.0 2Phosalone 50-500 0.993 83.4 2.5 76.4 6.2 20Phosphamidon 50-500 0.997 83.6 1.3 98.0 2.1 20Pirimiphos-methyl 25-500 0.999 93.6 4.6 109.3 0.9 10
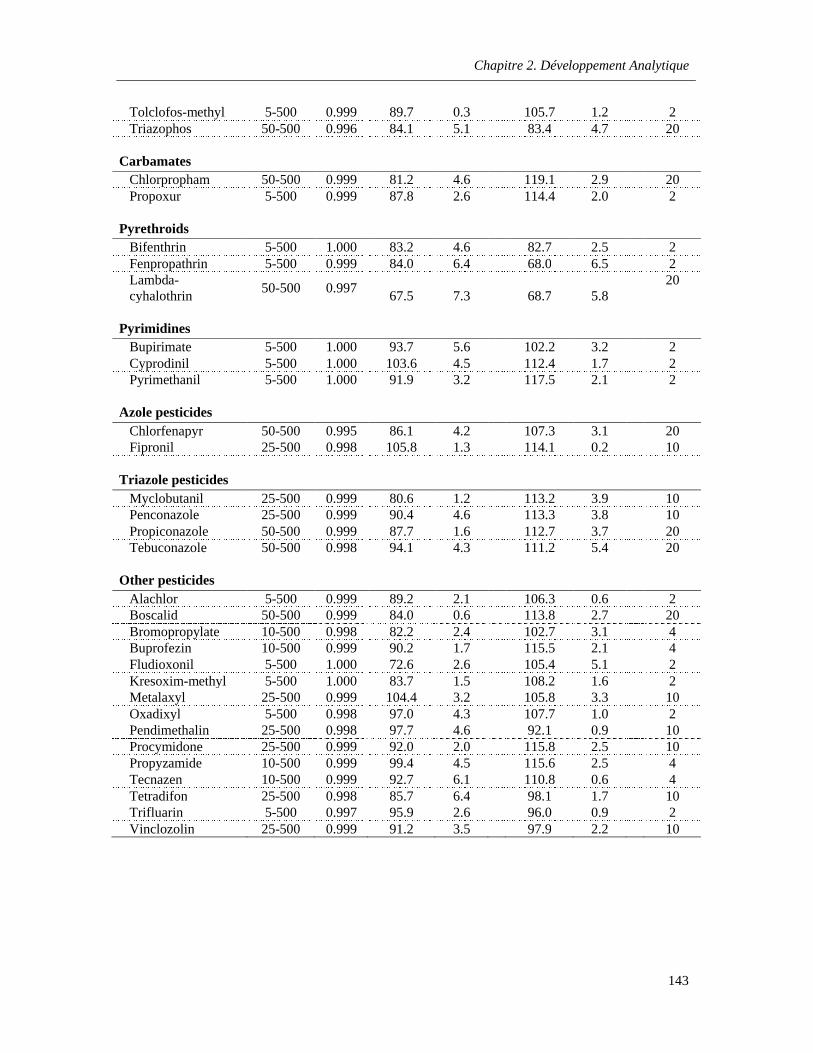
Chapitre 2. Développement Analytique
143
Tolclofos-methyl 5-500 0.999 89.7 0.3 105.7 1.2 2Triazophos 50-500 0.996 84.1 5.1 83.4 4.7 20
CarbamatesChlorpropham 50-500 0.999 81.2 4.6 119.1 2.9 20Propoxur 5-500 0.999 87.8 2.6 114.4 2.0 2
PyrethroidsBifenthrin 5-500 1.000 83.2 4.6 82.7 2.5 2Fenpropathrin 5-500 0.999 84.0 6.4 68.0 6.5 2Lambda-cyhalothrin
50-500 0.99767.5 7.3 68.7 5.8
20
PyrimidinesBupirimate 5-500 1.000 93.7 5.6 102.2 3.2 2Cyprodinil 5-500 1.000 103.6 4.5 112.4 1.7 2Pyrimethanil 5-500 1.000 91.9 3.2 117.5 2.1 2
Azole pesticidesChlorfenapyr 50-500 0.995 86.1 4.2 107.3 3.1 20Fipronil 25-500 0.998 105.8 1.3 114.1 0.2 10
Triazole pesticidesMyclobutanil 25-500 0.999 80.6 1.2 113.2 3.9 10Penconazole 25-500 0.999 90.4 4.6 113.3 3.8 10Propiconazole 50-500 0.999 87.7 1.6 112.7 3.7 20Tebuconazole 50-500 0.998 94.1 4.3 111.2 5.4 20
Other pesticidesAlachlor 5-500 0.999 89.2 2.1 106.3 0.6 2Boscalid 50-500 0.999 84.0 0.6 113.8 2.7 20Bromopropylate 10-500 0.998 82.2 2.4 102.7 3.1 4Buprofezin 10-500 0.999 90.2 1.7 115.5 2.1 4Fludioxonil 5-500 1.000 72.6 2.6 105.4 5.1 2Kresoxim-methyl 5-500 1.000 83.7 1.5 108.2 1.6 2Metalaxyl 25-500 0.999 104.4 3.2 105.8 3.3 10Oxadixyl 5-500 0.998 97.0 4.3 107.7 1.0 2Pendimethalin 25-500 0.998 97.7 4.6 92.1 0.9 10Procymidone 25-500 0.999 92.0 2.0 115.8 2.5 10Propyzamide 10-500 0.999 99.4 4.5 115.6 2.5 4Tecnazen 10-500 0.999 92.7 6.1 110.8 0.6 4Tetradifon 25-500 0.998 85.7 6.4 98.1 1.7 10Trifluarin 5-500 0.997 95.9 2.6 96.0 0.9 2Vinclozolin 25-500 0.999 91.2 3.5 97.9 2.2 10
Chapitre 2. Développement Analytique
144
5.4. Conclusions
This work presents a new SPE method using the centrifugation technique for the
extraction of 67 pesticides from water samples. The proposed method shows practical
environmental and economical advantages in terms of sample preparation time, simplicity,
reduction in solvent use, and cost and is particularly suitable for routine applications
requiring a high sample throughput. Optimized conditions include the percolation of a sample
volume of 500 on either C18 or HLB cartridges and a drying step using centrifugation
followed by 10 min under vacuum. The evaluation of the elution parameters demonstrated
that 1 mL of DCM with centrifugation followed by 1 mL of MeOH was successfully used for
the elution of analytes on both cartridges. The concentration was performed at a temperature
of 40 °C. Under the optimized conditions, this method showed good recoveries higher than
65-68 % for the 67 analyzed pesticides using the C18 and HLB cartridges with relative
standard deviations lower than 9.7-12.3%. Limits of quantification were between 2 and 20
ng.L-1.
References
Asi M., Hussain A., Muhmood S., 2008. Solid phase extraction of pesticide residues in water
samples: DDT and its metabolites. International Journal of Environmental Research
2:43-48.
Baez, M. E., Rodriguez, M., Lastra, O., and Contreras, P., 1997. Solid-phase extraction of
organophosphorus, triazine, and triazole-derived pesticides from water samples. A
critical study, Journal of High Resolution Chromatography 20:591-596.
Bailey H., Deanovic L., Reyes E., Kimball T., Larson K., Cortright K., Conner V., Hinton
D.E., 2000. Diazinon and chlorpyrifos in urban waterways in Northern California,
USA. Environmental Toxicology and Chemistry 19:82.
Barth J.A.C., Grathwohl P., Jones K.C., 2007. Introduction to special Issue “AquaTerra:
Pollutant Behavior in the soil, sediment, ground, and surface water system.
Environmental Pollution 148:693.
Concha-Grana E., Turnes-Carou M., Muniategui-Lorenzo S., Lopez-Mahia P., Prada-
Rodriguez D., Fernandez-Fernandez E., 2006. Evaluation of HCH isomers and
Chapitre 2. Développement Analytique
145
metabolites in soils, leachates, river water and sediments of a highly contaminated area.
Chemosphere 64 :588.
de la Colina C., Pena Heras A., Dios Cancela G., and Sanchez Rasero F., 1993.
Determination of organophosphorus and nitrogen-containing pesticides in water by
solid-phase extraction with gas chromatography with nitrogen – phosphorus detection.
Journal of Chromatography A 655:127-132.
EPA 525. Determination of Organic Compounds in Drinking-Water by Liquid – Solid
Extraction and GC-MS.
European Union (EU), 2000. Directive 2000/60/EC of the European Parliament and of the
Council establishing a framework for the Community action in the field of water
policy.
European Union (EU), 1998. Council Directive 98/83/EC of 3 November 1998 on the quality
of water intended for human consumption.
Forcada M., Beltran J., Lopez F. J., and Hernandez F., 2000. Multiresidue procedures for
determination of triazine and organophosphorus pesticides in water by use of large-
volume PTV injection in gas chromatography. Chromatographia 51:362- 368.
Hennion M. C., 1999. Solid-phase extraction: method development, sorbents, and coupling
with liquid chromatography. Journal of Chromatography A 856:3-54
Hennion M. C., Cau-Dit-Coumes C., Pichon V., 1998. Trace analysis of polar organic
pollutants in aqueous samples. Tools for the rapid prediction and optimization of the
solid-phase extraction parameters. Journal of Chromatography. A 823:147-161.
Kouzayha A., Al Iskandarani M., Mokh S., Rabaa A. R., Budzinski H., Jaber F., 2011.
Optimization of a Solid-Phase Extraction Method Using Centrifugation for the
Determination of 16 Polycyclic Aromatic Hydrocarbons in Water. Journal of
Agricultural and Food Chemistry 59:7592–7600.
Pichon V., 2000. Solid-phase extraction for multiresidue analysis of organic contaminants in
water. Journal of Chromatography A 885:195-215.
Reemtsma T., Jekel M., 2006. Organic Pollutants in the Water Cycle, Wiley-VCH Verlag
GmBH & Co. KGaA,Weinheim. Journal of Chromatography A 1150:267-278.
Chapitre 2. Développement Analytique
146
Rodrigues A.M., Ferreira V., Cardoso V.V., Ferreira E., Benoliel M.J., 2007. Determination
of several pesticides in water by solid-phase extraction, liquid chromatography and
electrospray tandem mass spectrometry
Sabik H., Jeannot R., Rondeau B., 2000. Multiresidue methods using solid-phase extraction
techniques for monitoring priority pesticides, including triazines and degradation
products, in ground and surface waters. Journal of Chromatography A 885:217-236.
Tahara M., Kubota R., Nakazawa H., Tokunaga H., Nishimura T., 2006. Analysis of active
oxon forms of nine organophosphorus pesticides in water samples using gas
chromatography with mass spectrometric detection. Journal of Health Science
52(3):313-319.
Vreuls J.J., Louter A.J.H., Brinkman U.A.Th., 1999. On-line combination of aqueous-sample
preparation and capillary gas chromatography. Journal of Chromatography A 856:279-
314.
Waters Corporation, 2002. Organophosphorus Pesticides in Drinking Water and Fruit.
Environmental and Agrochemical Applications Notebook, p. 9.
Wells M.J.M., Yu L.Z., 2000. Solid-phase extraction of acidic herbicides. Journal of
Chromatography A 885:237-250.
Chapitre 2. Développement Analytique
147
Conclusion
Les travaux présentés dans le chapitre 2 décrit la méthode SPE – centrifugation
élaborée et optimisée, pour la première fois, pour l’analyse de deux familles de contaminants
organiques, les HAP et les pesticides dans l’eau. La nouvelle méthode proposée montre des
avantages environnementaux et économiques en termes de la simplicité d’opération, de la
réduction du temps de préparation et du volume solvants organique et sur le coût total de
l’opération.
Les conditions optimales de la méthode élaborée pour l’analyse des HAP dans l’eau,
indiquent que le volume de percolation d'échantillon devrait être compris entre 500 et 1000
mL en opérant sur une cartouche de C18, de volume de 3 mL et renfermant 200 mg
d’adsorbant. La percolation est suivie par une étape de séchage par centrifugation de 10
minutes sous vide. D’autre part, l'évaluation des paramètres d'élution a montré qu’un volume
de 1 mL de DCM avec centrifugation est suffisant pour une élution efficace et convenable
des analytes. Enfin, la concentration ultérieure de l’extrait organique doit a été effectuée à
une température inférieure à 40 °C en présence de 200 µL d'isooctane. Ces conditions,
précédemment citées, ont abouti à des de bons rendements de récupération compris entre 70
et 85% pour les 16 HAP avec des écarts types relatifs situé entre 1 et 14%.
Les résultats présentés dans ce chapitre montrent, également, l’application de la
méthode SPE avec centrifugation pour l’extraction de 67 pesticides de l’eau. Les mêmes
conditions optimales appliquées lors de l’extraction de HAP sont convenables pour
l’extraction de pesticides. Deux types d’adsorbant le C18 (200 mg, 3 mL) ou le HLB (60 mg,
3 mL) peuvent être utilisés avec les mêmes conditions de percolation d'échantillon et de
séchage. L’étape d’élution a été réalisée par centrifugation avec 1 mL de DCM suivi par 1 ml
de MeOH. Cette méthode a montré, également, de bons rendements de récupération
supérieurs à 65 % pour les 67 pesticides analysés avec des écarts-types relatifs situés entre
Chapitre 2. Développement Analytique
148
9,7 et 12,3%. Les limites de quantification ont été évaluées et sont compris entre 2 et 20 ng.
L-1.
A côté de la méthode SPE avec centrifugation, une méthode d'injection en mode PTV
a été optimisée et validée pour l'analyse par GC-MS des 16 HAP. L’introduction de
l’injecteur PTV à la place de l’injecteur splitless a permis d’augmenter la sensibilité de la
méthode en éliminant l’étape de concentration par évaporation de solvant. Les paramètres
d'injection PTV ont été optimisées grâce deux modèles multivariés, Plackett-burman et Box-
Behnken. Pour l'injection d’un volume de 5 µL, les conditions optimales sont : Une
température initiale d’injecteur de 70 °C, un débit de 60 mL/min pour 0,55 min et sous une
pression de 50 psi pour l’évaporation du solvant et finalement un débit de 10 mL/min pendant
3 min à une température de 280 °C pour le transfert des analytes vers la colonne.
La fiabilité et les performances de la méthode d’injection PTV après l’extraction SPE
des HAP ont été évaluées en considérant les paramètres de linéarité, la précision, le
rendement de récupération et les limites de détection et de quantification. La nouvelle
méthode complète optimisée SPE-centrifugation-PTV-GC-MS a fourni une meilleur
sensibilité par rapport à l’injection traditionnelle en mode splitless avec une réduction
considérable du temps de préparation ; elle serait, sans doute, très bien adaptée pour des
applications de routine.
149
Chapitre 3. Etude de la qualité des eaux libanaise
Chapitre 3. Etude de la qualité des eaux libanaises
150
Introduction
Au Liban, comme ailleurs, le développement industriel, agricole et urbain est
accompagné inévitablement par des problèmes de pollution de l’environnement aquatique, où
plusieurs milliers de substances chimiques seraient déversées dans les eaux libanaises. Parmi
celles-ci, sont les contaminants organiques d’origine anthropique majeure, comme les HAP et
les pesticides. L’impact de ces substances sur l’environnement est complexe, tant leurs
actions toxiques peuvent être directes ou indirectes sur les individus, les populations ou les
écosystèmes. L’estimation du niveau de contamination peut être atteinte par la mesure des
concentrations de ces contaminants et l’évaluation de leurs variations dans divers systèmes
aquatiques.
Dans cet objectif, le chapitre 3 présente les diverses compagnes d’échantillonnage
permettant d’évaluer l’état de la qualité des eaux libanaises, du nord au sud, en passant par la
capitale du Liban la ville de Beyrouth. Les analyses effectuées ont permis d’évaluer les
niveaux de concentrations des deux familles de contaminants organiques, les HAP et les
pesticides. La détection et la quantification des ces contaminants ont été réalisées avec les
méthodes analytiques développées précédemment SPE-Centrifugation. Ce chapitre est
présenté sous la forme de deux articles ; le premier concerne l’analyse, la distribution, et
l’évaluation des sources possibles des HAP dans les eaux de pluie, alors que le deuxième
porte sur l’évaluation de la présence des pesticides dans les différents systèmes aquatiques au
Liban.
Chapitre 3. Etude de la qualité des eaux libanaises
151
6. Polycyclic aromatic hydrocarbons in rainwater collected in
Beirut, Lebanon
Abir Kouzayha1, Hélène Budzinski3 and Farouk Jaber1&2*
1 National Council for Scientific Research CNRS - Lebanese Atomic Energy Commission LAEC - Analysis of Pesticides and Organic Pollutants Laboratory LAPPO - Beirut, Lebanon.
2 Lebanese University - Faculty of Sciences I - Laboratory of Analysis of Organic Compounds (509) - Hadath, Beirut, Lebanon.
3 Université Bordeaux 1, CNRS, ISM–LPTC–UMR 5255 (Laboratory of Physico- and Toxico-Chemistry), 351 Cours de la Libération, 33405 Talence, France.
(Article prepared for submission)
Abstract
Polycyclic aromatic hydrocarbons (PAHs) were measured in rainwater from December
2010 to March 2011 in Beirut, capital of Lebanon. The total PAHs concentrations varied
from 180.7 to 644.5 ng/L, with higher abundance in colder months. Results obtained in Beirut
are of the same magnitude as those proposed in the literature. The 3- and 4-ring PAHs were
the most abundant compounds among other PAHs for all rainwater samples collected during
the monitoring period. For the heavy 5- and 6-ring PAHs, their concentration was higher in
first month of the rain season and decreased in the following months. Finally, the distribution
patterns of some isomeric PAHs ratios showed that the possible source of the PAHs
contamination in the city of Beirut was mainly pyrolytic input derived from fuels combustion.
Keywords: polycyclic aromatic hydrocarbons; rainwater; temporal variations; Beirut.
Chapitre 3. Etude de la qualité des eaux libanaises
152
6.1. Introduction
Polycyclic aromatic hydrocarbons (PAHs) are identified as one of the persistent
organic pollutants (POPs) in the environment, and some of them are classified as priority
pollutants by both the US Environmental Protection Agency (US-EPA) and the European
Community (EC). They are introduced into the environment mainly via incomplete
combustion of organic matter in nature and anthropogenic processes. In general, vehicle
exhaust emissions, wood, fossil fuel and coal combustion, coke production and some
stationary point source are regarded as the principal sources for PAHs (Simcik et al., 1999,
Wild and Jones 1995). Besides, an important natural source is the biomass burning that
occurs in forest fires (Masclet et al., 2000; Cecinato et al., 1997; Oros and Simoneit, 2001).
As for other pollutants, after they enter through the atmosphere, PAHs are redistributed
between gas and particle phases (Park et al., 2002; Ribes et al., 2003) and can be degraded by
direct and/or indirect photolysis (Behymer and Hites, 1985; Sasaki et al., 1997), and
deposited on land or in water via wet and dry deposition mechanisms (Manoli et al., 2000;
Ollivon et al., 2002). When deposited, PAHs may be re-volatilized and transported over long
distances and deposited again in soils and water surfaces far from their emission sources
(Masclet et al., 2000; Carrera et al., 2001). Due to their well-known carcinogenic and
mutagenic properties, the distribution and sources of PAHs were widely studied in different
media. Understanding the contributions of the various sources is critical to the appropriate
management of PAHs concentrations in the environment. For the aquatic environment, most
of the available data concern surface and groundwaters. However, data on PAH in rainwater
are scare and have not been gathered in a systematic manner.
In Lebanon, the urbanization and economy growth in the past decades resulted in the
rapid deterioration of air and water quality due to the lack of rigorous and effective
environmental regulations (Moussa et al., 2006; Saliba et al., 2007; Shaka et al., 2004). But
recently, increased public concern over potential health hazards associated with air pollution
has led to few recent studies. Available data indicated that the emissions of carbonyl
compounds (Moussa et al., 2006), nitrogen oxide, and aerosol particles (Shaka et al., 2004) in
the vicinity of some main roads during rush hour traffic are likely to approach and exceed
World Health Organization (WHO) guidelines for health. The average annual concentration
of nitrogen dioxide, for example, reached 58 µ/m3 in 2010, whereas the maximum allowable
concentration according to WHO is 40 µ/m3 (Shaka et al., 2004). The researchers warned that
Chapitre 3. Etude de la qualité des eaux libanaises
153
not only are air pollution levels higher than the acceptable WHO standards, but they are
increasing throughout the years. However, the measurement of PAHs and other organic
pollutants in the air and the report on their deposition are absent to date. The only research
regarding PAHs in Lebanon was mainly focused on the distribution and concentrations in the
marine environment, such as sediments, oysters and fish after the oil spill of July 2006
(Linden and Rust, 2008).
Beirut, the capital of Lebanon, is the largest city with a population of more than
2 million, about one-third of the total population, and an area of 67 Km2. It is located at the
midpoint of Lebanon's coastline with the Mediterranean, and serves as the country's largest
and main seaport. The city is subject to typical Mediterranean climate, characterized with
heavy rains in the winter season and dry and arid conditions in the remaining months of the
year. The average annual rainfall is 860 millimeters (34.1 inches) but the amount of rainfall
varies greatly from one year to another. Much of the rain falls after December and on a
limited number of days in heavy downpours. However, the influence of the Mediterranean
Sea, the topographic features, and the Syrian desert in the north creates a variety of
microclimates within the country with contrasting temperatures and rainfall distribution.
The aim of this study was to obtain information about the occurrence of 16 PAHs in
precipitation collected in Beirut to understand one of the most pressing public health issues
facing urban areas in Lebanon. Our objectives were: (1) obtain information about the
occurrence of PAHs in precipitation and assess their concentrations in the dissolved phase,
(2) examine monthly variation of PAH concentrations and (3) evaluate possible sources.
6.2. Materials and methods
6.2.1. Chemicals, materials and small apparatus
All solvents were purchased in chromatographic grade from Sigma-Aldrich (GmbH,
Taufkirchen, Germany). The 16 PAHs were purchased from Restek as mix Standard
Reference Solution of 1000 µg/mL in dichloromethane (Cat. 31458, Restek, Bellefonte, PA):
naphthalene (Nap), acenaphthylene (AcPy), acenaphthene (AcP), fluorene (Flu),
phenanthrene (Phe), anthracene (Ant), fluoranthene (FL), pyrene (Pyr), benzo[a]anthracene
(B[a]A), chrysene (Chr), benzo[b]fluoranthene (B[b]FL), benzo[k]fluoranthene (B[k]FL),
Chapitre 3. Etude de la qualité des eaux libanaises
154
benzo[a]pyrene (B[a]P), indeno[1,2,3-cd]pyrene (InP), dibenzo[a,h]anthracene (DBA), and
benzo-[ghi]perylene (B[ghi]P). Intermediary solutions (containing 25 µg/mL of each analyte)
were prepared by diluting the standard reference solution of PAHs with an appropriate
solvent.
The pure solid surrogate standards, naphthalene-d8 (Nap-d8), phenanthrene-d10 (Phe-
d10), anthracene-d10 (Ant-d10), fluoranthene-d10 (FL-d10), chrysene-d12 (Chr-d12), and
perylene-d12 (Per-d12), were purchased from Supelco (Bellefonte, PA) with an additional
deuterated PAH, pyrene-d10 (Pyr-d10), used as internal standard at the end of the protocol.
Separate 1000 µg/mL stock solutions of each deuterated standard were prepared
gravimetrically in dichloromethane. Intermediary 25 µg/mL deuterated mix solutions of
surrogate and internal standards were prepared in appropriate solvents. The different working
solutions were prepared in acetonitrile at different concentrations. All standard solutions were
stored in amber vials at -20 °C.
An analytical balance from Sartorius (0.01 mg; Goettingen, Germany) was used. A
Boeco centrifuge (model U-320R, Boeco, Germany) was employed in different steps of the
preparation method. A sample concentrator from Techne (Staffordshire, U.K.) was used for
sample concentration under nitrogen. Other small apparatus such as an ultrasonic bath and a
vortex shaker were used.
6.2.2. Sample collection
In order to survey the levels of PAHs in rainwater, rain samples were collected at one
monitoring site on the rooftop of the Lebanese Atomic Energy Commission Building in
South Beirut (Figure 6.1). The site is about 20 m above the ground, and there were no higher
buildings around the sampling site. Two glass beakers (5 liters) were used to collect the rain
sample and the amount of rainfall was provided by the meteorological station situated at
Beirut International Airport, close to the sampling site.
The rainwater was accumulated when the interval between the precipitation event and
the next one was less than three days, and the volume of rainwater sample from each
sampling event was not less than 500 mL. We collected 9 rainwater samples ranged from 500
to 3000 mL from December 2010 to March 2011.
Chapitre 3. Etude de la qualité des eaux libanaises
155
After sampling, the rainwater samples were filtered through a glass fiber filter (GF/F, 47 mm
diameter, 0.7 μm pore size; Waterman International Ltd., Maidstone, England) which was
pre-combusted at 450°C for 5 h before use, and the filtered samples were stored in darkness
at 4°C to be analyzed in 24 h maximum. The surrogate deuterated PAHs were added at this
stage to the rainwater sample at a fixed concentration of 50 ng/L. For quality control and
quality assurance (QC/QA), the deionized and contaminant-free water was sampled and
analyzed as a blank with every rainwater sample following the same method.
6.2.3. Solid-phase extraction
The similar procedure described in our previous paper (Kouzayha et al., 2011) was
used for extraction and concentration of PAHs in rainwater samples. In brief, water samples
(500-1000 mL) were concentrated on SPE Chromabond C18 cartridge (from Machery-Nagel,
Germany), then the cartridge was dried immediately using the centrifugation technique (2500
rpm for 2 min) followed by a vacuum drying for 10 min. The centrifugation was also used for
sample elution, where 1 mL of dichloromethane was added to the cartridge with the valve
closed, then the cartridge was centrifuged (2300 rpm for 1 min), and finally the elute was
recuperated. The extracts were concentrated using a gentle N2 flow at 40°C, and the solvent
was exchanged to isooctane and reduced to approximately 200 µL. The internal recovery
standards were added to the samples (concentration of 50 ng/L) directly before analysis.
6.2.4. GC-MS analysis and quantification
The analysis of PAHs was carried out on an Agilent 6890N gas chromatograph
coupled to an Agilent 5975 mass spectrometer system (GC-MS) with an Agilent 7683B
autosampler (Agilent Technologies, Santa Clara, CA). Chromatographic separation was
performed on a HP-5MS fused silica capillary column (30 m, 0.25 mm, 0.25 μm, Agilent
J&W GC columns). Helium (purity > 99.999%) was used as the carrier gas at a flow rate of
1.5 mL/min. The split/splitless injector temperature was set at 280 °C. The GC oven was
initially held at 40 °C for 2 min and then programmed to 200 °C at a rate of 15 °C/min. After
being kept at 200 °C for 2 min, the oven was programmed to 280 °C at a rate of 5 °C/min.
Finally, it was held for 5 min to achieve a running time of 35 min. The mass spectrometer
was operated in the electron ionization mode (EI, 70 eV). Transfer line, ion source, and
quadrupole analyzer temperatures were maintained at 280, 230, and 150 °C, respectively, and
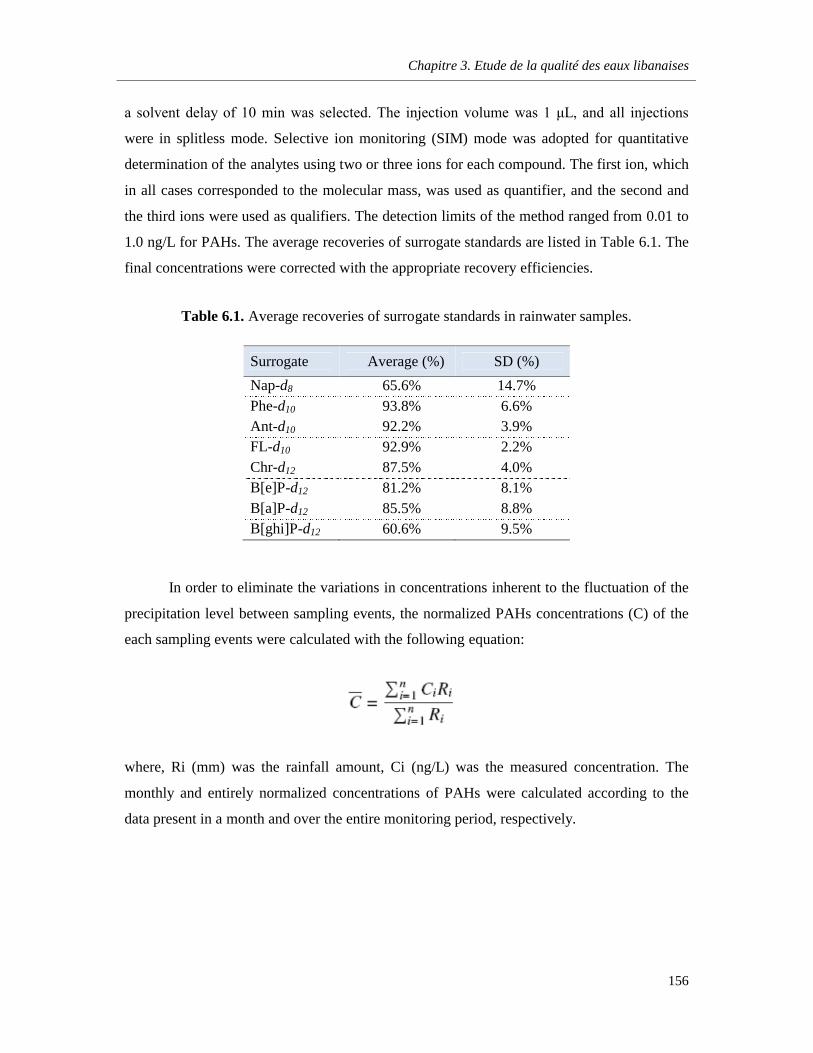
Chapitre 3. Etude de la qualité des eaux libanaises
156
a solvent delay of 10 min was selected. The injection volume was 1 μL, and all injections
were in splitless mode. Selective ion monitoring (SIM) mode was adopted for quantitative
determination of the analytes using two or three ions for each compound. The first ion, which
in all cases corresponded to the molecular mass, was used as quantifier, and the second and
the third ions were used as qualifiers. The detection limits of the method ranged from 0.01 to
1.0 ng/L for PAHs. The average recoveries of surrogate standards are listed in Table 6.1. The
final concentrations were corrected with the appropriate recovery efficiencies.
Table 6.1. Average recoveries of surrogate standards in rainwater samples.
Surrogate Average (%) SD (%)
Nap-d8 65.6% 14.7%Phe-d10 93.8% 6.6%Ant-d10 92.2% 3.9%FL-d10 92.9% 2.2%Chr-d12 87.5% 4.0%B[e]P-d12 81.2% 8.1%B[a]P-d12 85.5% 8.8%B[ghi]P-d12 60.6% 9.5%
In order to eliminate the variations in concentrations inherent to the fluctuation of the
precipitation level between sampling events, the normalized PAHs concentrations (C) of the
each sampling events were calculated with the following equation:
where, Ri (mm) was the rainfall amount, Ci (ng/L) was the measured concentration. The
monthly and entirely normalized concentrations of PAHs were calculated according to the
data present in a month and over the entire monitoring period, respectively.
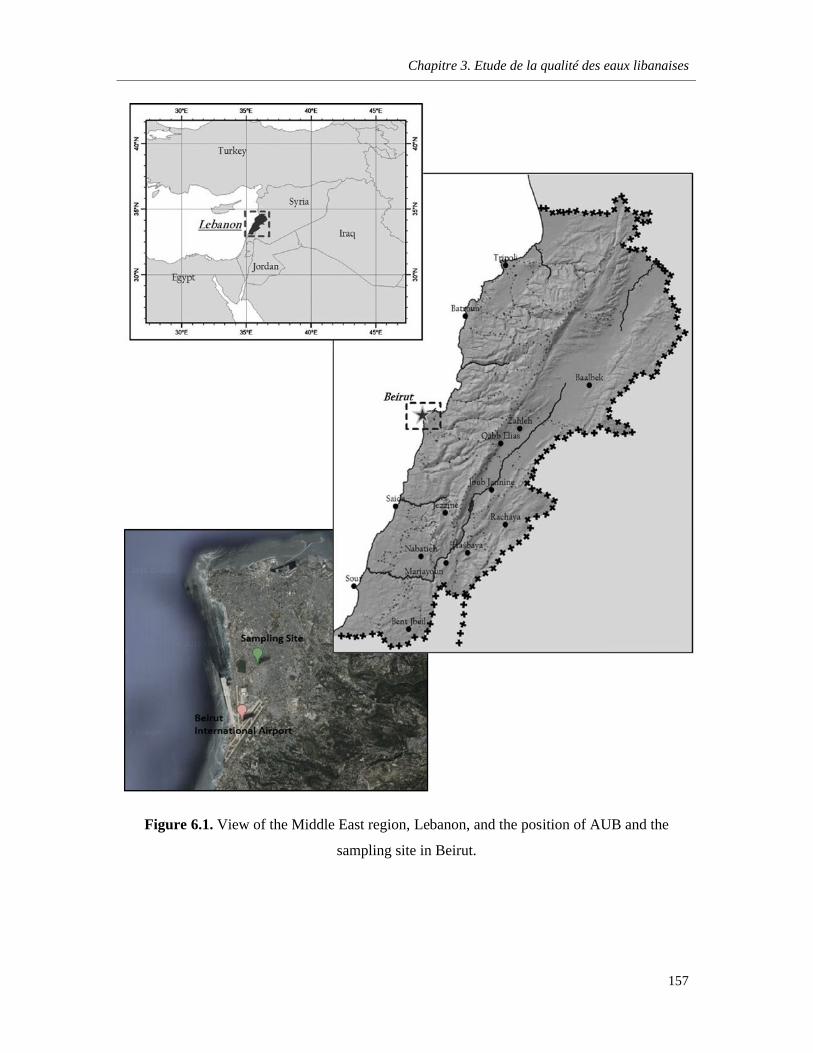
Chapitre 3. Etude de la qualité des eaux libanaises
157
Figure 6.1. View of the Middle East region, Lebanon, and the position of AUB and the
sampling site in Beirut.
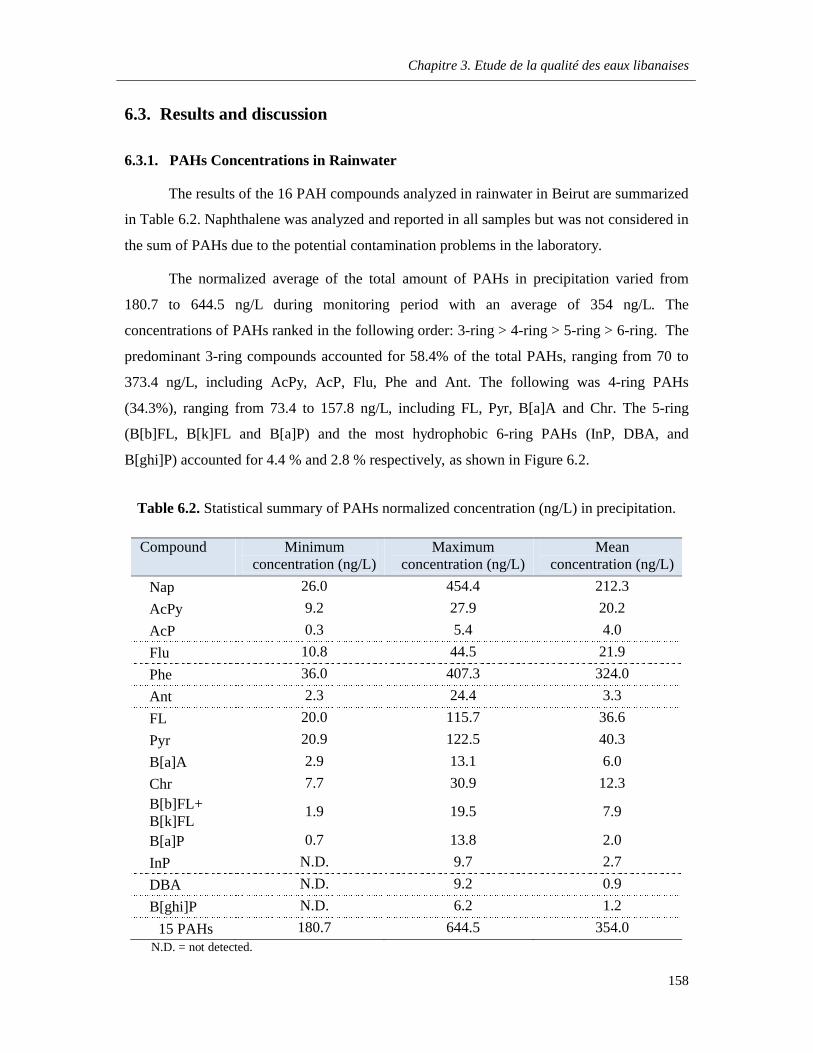
Chapitre 3. Etude de la qualité des eaux libanaises
158
6.3. Results and discussion
6.3.1. PAHs Concentrations in Rainwater
The results of the 16 PAH compounds analyzed in rainwater in Beirut are summarized
in Table 6.2. Naphthalene was analyzed and reported in all samples but was not considered in
the sum of PAHs due to the potential contamination problems in the laboratory.
The normalized average of the total amount of PAHs in precipitation varied from
180.7 to 644.5 ng/L during monitoring period with an average of 354 ng/L. The
concentrations of PAHs ranked in the following order: 3-ring > 4-ring > 5-ring > 6-ring. The
predominant 3-ring compounds accounted for 58.4% of the total PAHs, ranging from 70 to
373.4 ng/L, including AcPy, AcP, Flu, Phe and Ant. The following was 4-ring PAHs
(34.3%), ranging from 73.4 to 157.8 ng/L, including FL, Pyr, B[a]A and Chr. The 5-ring
(B[b]FL, B[k]FL and B[a]P) and the most hydrophobic 6-ring PAHs (InP, DBA, and
B[ghi]P) accounted for 4.4 % and 2.8 % respectively, as shown in Figure 6.2.
Table 6.2. Statistical summary of PAHs normalized concentration (ng/L) in precipitation.
Compound Minimumconcentration (ng/L)
Maximumconcentration (ng/L)
Meanconcentration (ng/L)
Nap 26.0 454.4 212.3
AcPy 9.2 27.9 20.2
AcP 0.3 5.4 4.0
Flu 10.8 44.5 21.9
Phe 36.0 407.3 324.0
Ant 2.3 24.4 3.3
FL 20.0 115.7 36.6
Pyr 20.9 122.5 40.3
B[a]A 2.9 13.1 6.0
Chr 7.7 30.9 12.3
B[b]FL+ B[k]FL
1.9 19.5 7.9
B[a]P 0.7 13.8 2.0
InP N.D. 9.7 2.7
DBA N.D. 9.2 0.9
B[ghi]P N.D. 6.2 1.2
15 PAHs 180.7 644.5 354.0N.D. = not detected.
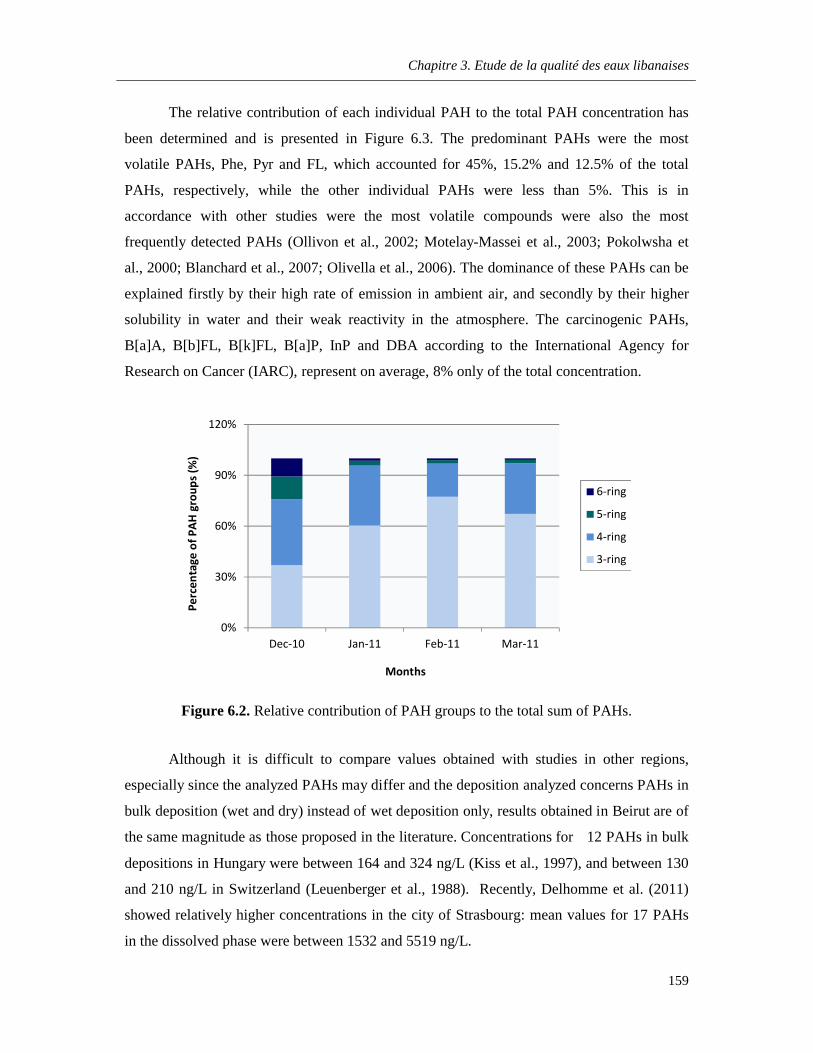
Chapitre 3. Etude de la qualité des eaux libanaises
159
The relative contribution of each individual PAH to the total PAH concentration has
been determined and is presented in Figure 6.3. The predominant PAHs were the most
volatile PAHs, Phe, Pyr and FL, which accounted for 45%, 15.2% and 12.5% of the total
PAHs, respectively, while the other individual PAHs were less than 5%. This is in
accordance with other studies were the most volatile compounds were also the most
frequently detected PAHs (Ollivon et al., 2002; Motelay-Massei et al., 2003; Pokolwsha et
al., 2000; Blanchard et al., 2007; Olivella et al., 2006). The dominance of these PAHs can be
explained firstly by their high rate of emission in ambient air, and secondly by their higher
solubility in water and their weak reactivity in the atmosphere. The carcinogenic PAHs,
B[a]A, B[b]FL, B[k]FL, B[a]P, InP and DBA according to the International Agency for
Research on Cancer (IARC), represent on average, 8% only of the total concentration.
Figure 6.2. Relative contribution of PAH groups to the total sum of PAHs.
Although it is difficult to compare values obtained with studies in other regions,
especially since the analyzed PAHs may differ and the deposition analyzed concerns PAHs in
bulk deposition (wet and dry) instead of wet deposition only, results obtained in Beirut are of
the same magnitude as those proposed in the literature. Concentrations for 12 PAHs in bulk
depositions in Hungary were between 164 and 324 ng/L (Kiss et al., 1997), and between 130
and 210 ng/L in Switzerland (Leuenberger et al., 1988). Recently, Delhomme et al. (2011)
showed relatively higher concentrations in the city of Strasbourg: mean values for 17 PAHs
in the dissolved phase were between 1532 and 5519 ng/L.
0%
30%
60%
90%
120%
Dec-10 Jan-11 Feb-11 Mar-11
Perc
enta
ge o
f PAH
gro
ups
(%)
Months
6-ring
5-ring
4-ring
3-ring
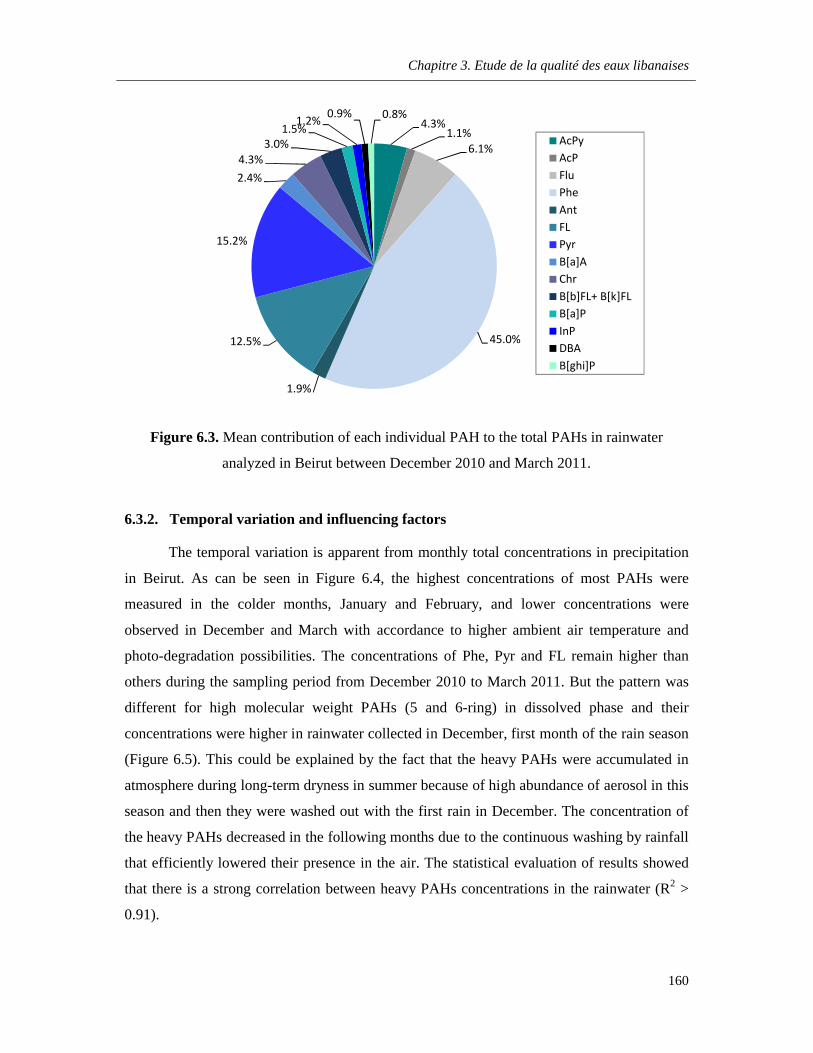
Chapitre 3. Etude de la qualité des eaux libanaises
160
Figure 6.3. Mean contribution of each individual PAH to the total PAHs in rainwater
analyzed in Beirut between December 2010 and March 2011.
6.3.2. Temporal variation and influencing factors
The temporal variation is apparent from monthly total concentrations in precipitation
in Beirut. As can be seen in Figure 6.4, the highest concentrations of most PAHs were
measured in the colder months, January and February, and lower concentrations were
observed in December and March with accordance to higher ambient air temperature and
photo-degradation possibilities. The concentrations of Phe, Pyr and FL remain higher than
others during the sampling period from December 2010 to March 2011. But the pattern was
different for high molecular weight PAHs (5 and 6-ring) in dissolved phase and their
concentrations were higher in rainwater collected in December, first month of the rain season
(Figure 6.5). This could be explained by the fact that the heavy PAHs were accumulated in
atmosphere during long-term dryness in summer because of high abundance of aerosol in this
season and then they were washed out with the first rain in December. The concentration of
the heavy PAHs decreased in the following months due to the continuous washing by rainfall
that efficiently lowered their presence in the air. The statistical evaluation of results showed
that there is a strong correlation between heavy PAHs concentrations in the rainwater (R2 >
0.91).
4.3%1.1%
6.1%
45.0%
1.9%
12.5%
15.2%
2.4%4.3%
3.0%1.5%
1.2% 0.9% 0.8%
AcPyAcPFluPheAntFLPyrB[a]AChrB[b]FL+ B[k]FLB[a]PInPDBAB[ghi]P
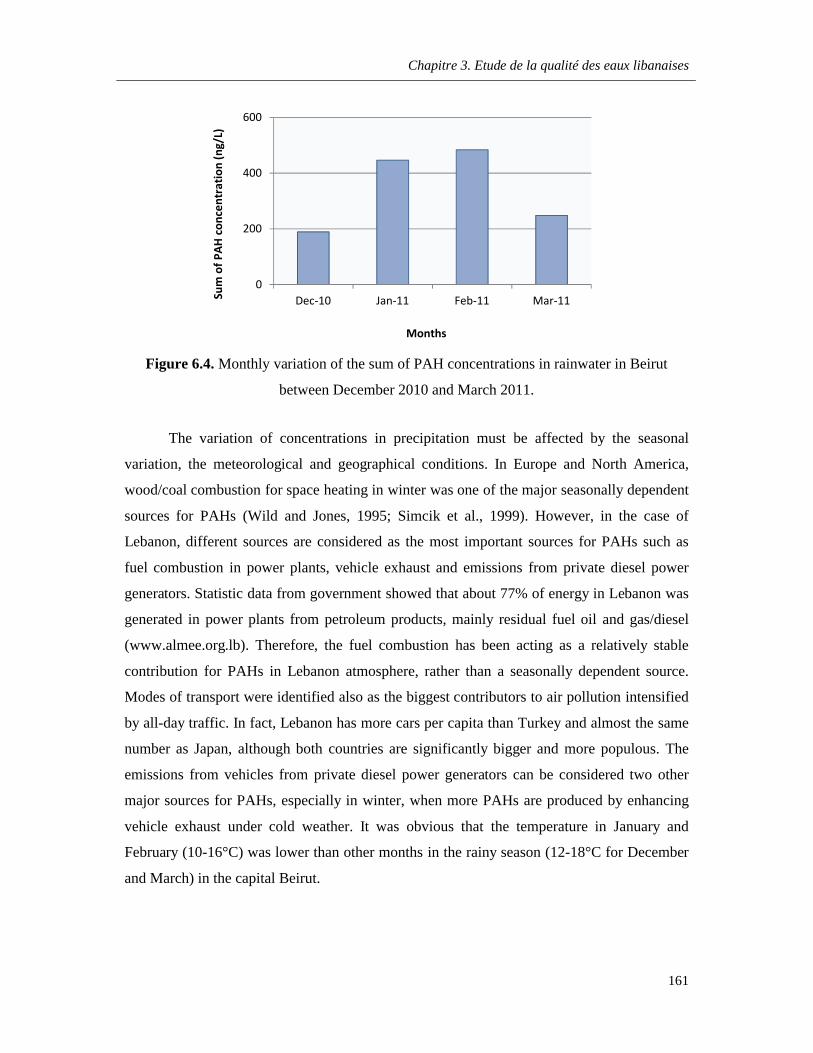
Chapitre 3. Etude de la qualité des eaux libanaises
161
Figure 6.4. Monthly variation of the sum of PAH concentrations in rainwater in Beirut
between December 2010 and March 2011.
The variation of concentrations in precipitation must be affected by the seasonal
variation, the meteorological and geographical conditions. In Europe and North America,
wood/coal combustion for space heating in winter was one of the major seasonally dependent
sources for PAHs (Wild and Jones, 1995; Simcik et al., 1999). However, in the case of
Lebanon, different sources are considered as the most important sources for PAHs such as
fuel combustion in power plants, vehicle exhaust and emissions from private diesel power
generators. Statistic data from government showed that about 77% of energy in Lebanon was
generated in power plants from petroleum products, mainly residual fuel oil and gas/diesel
(www.almee.org.lb). Therefore, the fuel combustion has been acting as a relatively stable
contribution for PAHs in Lebanon atmosphere, rather than a seasonally dependent source.
Modes of transport were identified also as the biggest contributors to air pollution intensified
by all-day traffic. In fact, Lebanon has more cars per capita than Turkey and almost the same
number as Japan, although both countries are significantly bigger and more populous. The
emissions from vehicles from private diesel power generators can be considered two other
major sources for PAHs, especially in winter, when more PAHs are produced by enhancing
vehicle exhaust under cold weather. It was obvious that the temperature in January and
February (10-16°C) was lower than other months in the rainy season (12-18°C for December
and March) in the capital Beirut.
0
200
400
600
Dec-10 Jan-11 Feb-11 Mar-11Sum
of P
AH c
once
ntra
tion
(ng/
L)
Months
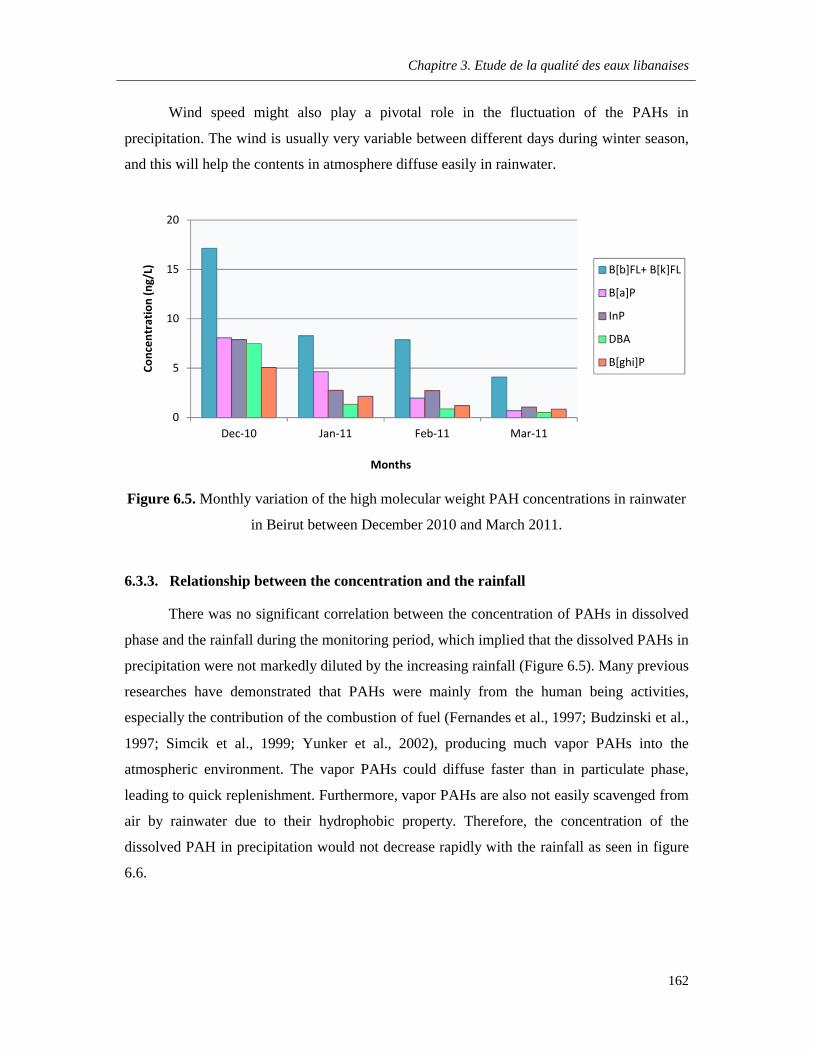
Chapitre 3. Etude de la qualité des eaux libanaises
162
Wind speed might also play a pivotal role in the fluctuation of the PAHs in
precipitation. The wind is usually very variable between different days during winter season,
and this will help the contents in atmosphere diffuse easily in rainwater.
Figure 6.5. Monthly variation of the high molecular weight PAH concentrations in rainwater
in Beirut between December 2010 and March 2011.
6.3.3. Relationship between the concentration and the rainfall
There was no significant correlation between the concentration of PAHs in dissolved
phase and the rainfall during the monitoring period, which implied that the dissolved PAHs in
precipitation were not markedly diluted by the increasing rainfall (Figure 6.5). Many previous
researches have demonstrated that PAHs were mainly from the human being activities,
especially the contribution of the combustion of fuel (Fernandes et al., 1997; Budzinski et al.,
1997; Simcik et al., 1999; Yunker et al., 2002), producing much vapor PAHs into the
atmospheric environment. The vapor PAHs could diffuse faster than in particulate phase,
leading to quick replenishment. Furthermore, vapor PAHs are also not easily scavenged from
air by rainwater due to their hydrophobic property. Therefore, the concentration of the
dissolved PAH in precipitation would not decrease rapidly with the rainfall as seen in figure
6.6.
0
5
10
15
20
Dec-10 Jan-11 Feb-11 Mar-11
Conc
entr
atio
n (n
g/L)
Months
B[b]FL+ B[k]FL
B[a]P
InP
DBA
B[ghi]P
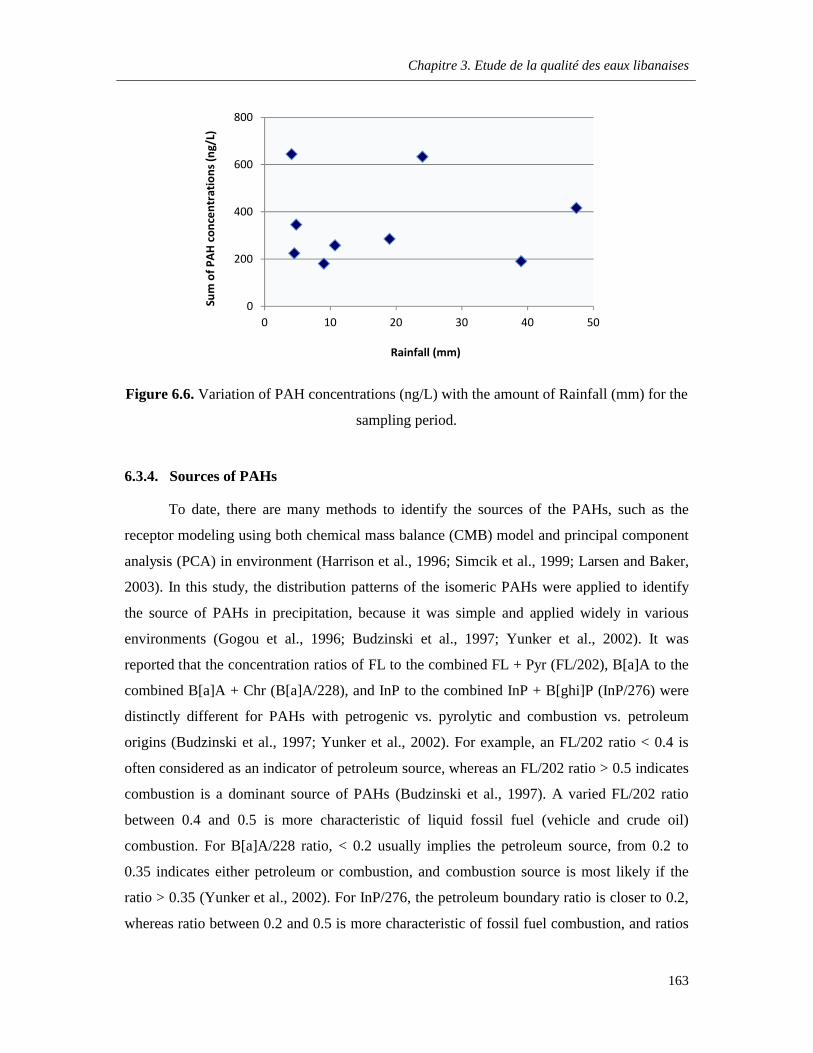
Chapitre 3. Etude de la qualité des eaux libanaises
163
Figure 6.6. Variation of PAH concentrations (ng/L) with the amount of Rainfall (mm) for the
sampling period.
6.3.4. Sources of PAHs
To date, there are many methods to identify the sources of the PAHs, such as the
receptor modeling using both chemical mass balance (CMB) model and principal component
analysis (PCA) in environment (Harrison et al., 1996; Simcik et al., 1999; Larsen and Baker,
2003). In this study, the distribution patterns of the isomeric PAHs were applied to identify
the source of PAHs in precipitation, because it was simple and applied widely in various
environments (Gogou et al., 1996; Budzinski et al., 1997; Yunker et al., 2002). It was
reported that the concentration ratios of FL to the combined FL + Pyr (FL/202), B[a]A to the
combined B[a]A + Chr (B[a]A/228), and InP to the combined InP + B[ghi]P (InP/276) were
distinctly different for PAHs with petrogenic vs. pyrolytic and combustion vs. petroleum
origins (Budzinski et al., 1997; Yunker et al., 2002). For example, an FL/202 ratio < 0.4 is
often considered as an indicator of petroleum source, whereas an FL/202 ratio > 0.5 indicates
combustion is a dominant source of PAHs (Budzinski et al., 1997). A varied FL/202 ratio
between 0.4 and 0.5 is more characteristic of liquid fossil fuel (vehicle and crude oil)
combustion. For B[a]A/228 ratio, < 0.2 usually implies the petroleum source, from 0.2 to
0.35 indicates either petroleum or combustion, and combustion source is most likely if the
ratio > 0.35 (Yunker et al., 2002). For InP/276, the petroleum boundary ratio is closer to 0.2,
whereas ratio between 0.2 and 0.5 is more characteristic of fossil fuel combustion, and ratios
0
200
400
600
800
0 10 20 30 40 50
Sum
of P
AH c
once
ntra
tions
(ng/
L)
Rainfall (mm)
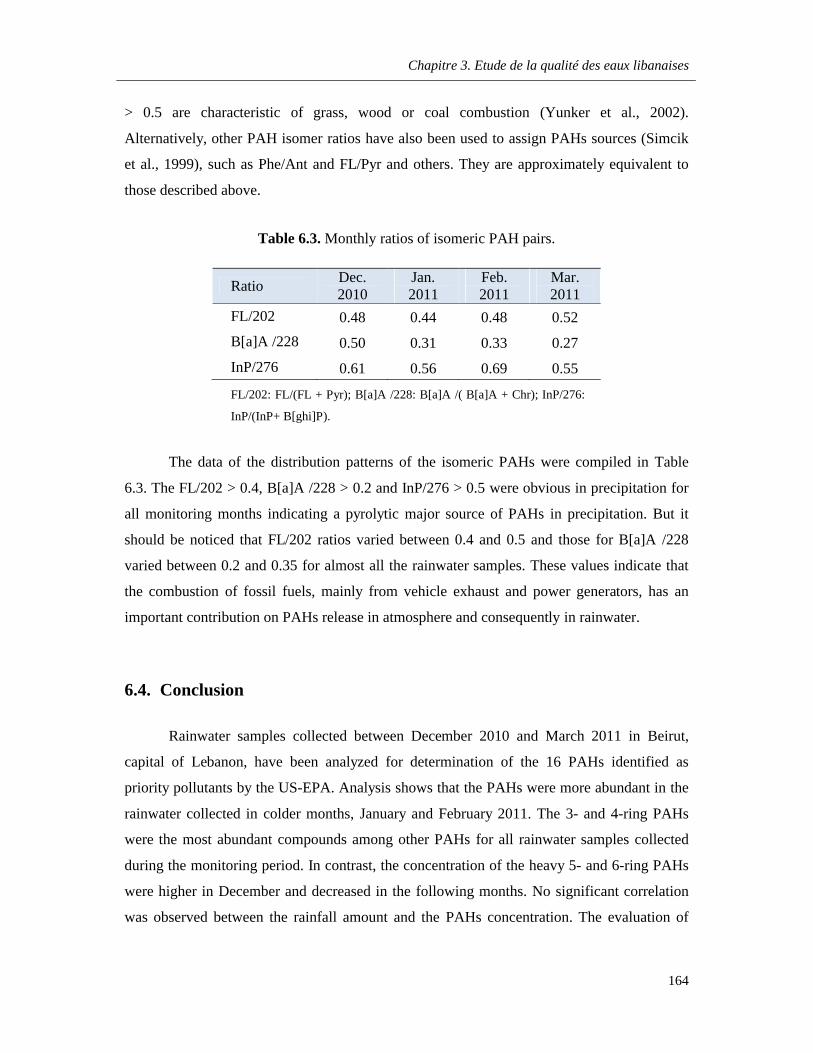
Chapitre 3. Etude de la qualité des eaux libanaises
164
> 0.5 are characteristic of grass, wood or coal combustion (Yunker et al., 2002).
Alternatively, other PAH isomer ratios have also been used to assign PAHs sources (Simcik
et al., 1999), such as Phe/Ant and FL/Pyr and others. They are approximately equivalent to
those described above.
Table 6.3. Monthly ratios of isomeric PAH pairs.
RatioDec. 2010
Jan. 2011
Feb. 2011
Mar. 2011
FL/202 0.48 0.44 0.48 0.52
B[a]A /228 0.50 0.31 0.33 0.27
InP/276 0.61 0.56 0.69 0.55
FL/202: FL/(FL + Pyr); B[a]A /228: B[a]A /( B[a]A + Chr); InP/276:
InP/(InP+ B[ghi]P).
The data of the distribution patterns of the isomeric PAHs were compiled in Table
6.3. The FL/202 > 0.4, B[a]A /228 > 0.2 and InP/276 > 0.5 were obvious in precipitation for
all monitoring months indicating a pyrolytic major source of PAHs in precipitation. But it
should be noticed that FL/202 ratios varied between 0.4 and 0.5 and those for B[a]A /228
varied between 0.2 and 0.35 for almost all the rainwater samples. These values indicate that
the combustion of fossil fuels, mainly from vehicle exhaust and power generators, has an
important contribution on PAHs release in atmosphere and consequently in rainwater.
6.4. Conclusion
Rainwater samples collected between December 2010 and March 2011 in Beirut,
capital of Lebanon, have been analyzed for determination of the 16 PAHs identified as
priority pollutants by the US-EPA. Analysis shows that the PAHs were more abundant in the
rainwater collected in colder months, January and February 2011. The 3- and 4-ring PAHs
were the most abundant compounds among other PAHs for all rainwater samples collected
during the monitoring period. In contrast, the concentration of the heavy 5- and 6-ring PAHs
were higher in December and decreased in the following months. No significant correlation
was observed between the rainfall amount and the PAHs concentration. The evaluation of
Chapitre 3. Etude de la qualité des eaux libanaises
165
some PAH ratios shows that the possible source of the PAHs contamination in the city of
Beirut was mainly pyrolytic input derived from the combustion of fossil fuels.
References
Behymer T. D., Hites R. A., 1985. Photolysis of polycyclic aromatic hydrocarbons adsorbed on simulated atmospheric particulates. Environmental Science & Technology 19:1004-1006.
Blanchard M., Teil M.-J., Guigon E., Larcher-Tiphagne K., Ollivon D., Garban B., ChevreuilM., 2007. Persistent toxic substance inputs to the river Seine basin (France) via atmospheric deposition and urban sludge application. Science of the Total Environment375:232-243.
Budzinski H., Jones I, Bellocq J, Pierard C, Garrigues P, 1997. Evaluation of sediment contamination by polycyclic aromatic hydrocarbons in the Gironde estuary. Marine Chemistry 58: 85–97.
Carrera G., Fernandez P., Vilanova R. M., Grimalt J. O., 2001. Persistent organic pollutants in snow from European high mountain areas. Atmospheric Environment 35:245–254.
Cecinato A., Ciccioli P., Brancaleoni E., Brachetti A., Vasconcellos P. C., 1997. PAH as candidate markers for biomass combustion in the Amazonian forest area. Annali di Chimica 87:555–569.
Dachs J., Bayona J.M., Raoux C., Albaihes J., 1997. Spatial, Vertical Distribution and Budget of Polycyclic Aromatic Hydrocarbons in the Western Mediterranean Seawater. Environmental Science and Technology 31:682-688.
Delhomme O., Rieb E., Millet M., 2011. Polycyclic aromatic hydrocarbons analyzed in rainwater collected on two sites in east of France (Strasbourg and Erstein). Polycyclic Aromatic Hydrocarbons 28(4):472-485.
Fernandes M. B., Sicre M. A., Boireau A., Tronszynski J., 1997. Polyaromatic hydrocarbon (PAH) distributions in the Seine River and its estuary. Marine Pollution Bulltin34:857– 867.
Gogou A., Stratigakis N., Kanakidou M., Stephanou E. G., 1996. Organic aerosols in Eastern Mediterranean: components source reconciliation by using molecular markers and atmospheric back trajectories. Organic Geochemistry 25:79–96.
Harrison R. M., Smith D. J. T., Luhana L., 1996. Source apportionment of atmospheric polycyclic aromatic hydrocarbons collected from an urban location in Birmingham, UK. Environmental Science and Technology 30:825-832
Chapitre 3. Etude de la qualité des eaux libanaises
166
Kiss G., Gelencser A., Krivacsy Z., Hlavay J., 1997. Occurrence and determination of organic pollutants in aerosol, precipitation, and sediment samples collected at Lake Balaton. Journal of Chromatography A 774 (1–2):349–361.
Kouzayha A., Al Iskandarani M., Mokh S., Rabaa A. R., Budzinski H., Jaber F., 2011. Optimization of a Solid-Phase Extraction Method Using Centrifugation for the Determination of 16 Polycyclic Aromatic Hydrocarbons in Water. J. Agric. Food Chem. 59:7592–7600.
Larsen R. K., Baker J. E., 2003. Source apportionment of polycyclic aromatic hydrocarbons in the urban atmosphere: a comparison of three methods. Environmental Science and Technology 37:1873-1881.
Leuenberger C., Czuczwa J., Heyerdahl E., Giger W., 1988. Aliphatic and polycyclic aromatic hydrocarbons in urban rain, snow and fog. Atmospheric Environment 22 (4):695-705.
Linden O. and Rust M., 2008. The Oil Spill in Lebanon 2006: a study of the distribution of petroleum hydrocarbons and PAHs in the coastal ecosystem, World Maritime University. International Oil Spill Conference.
Manoli E., Samara C., Konstantinou I., Albanis T., 2000. Polycyclic aromatic hydrocarbons in the bulk precipitation and surface waters of Northern Greece. Chemosphere41:1845–1855.
Masclet P., Hoyau V., Jaffrezo J. L., Cachier H., 2000. Polycyclic aromatic hydrocarbon deposition on the ice sheet of Greenland. Part I: superficial snow. AtmosphericEnvironment 34:3195-3207.
Motelay-Massei A., Ollivion D., Garban B., Chevreuil B., 2003. Polycyclic aromatic hydrocarbons in bulk deposition at a suburban site: Assessment by principal component analysis of the influence of meteorological parameters. Atmospheric Environment37:3135-3146.
Moussa A. G., El-Fadel M., Saliba N. A., 2006. Seasonal, diurnal and nocturnal behaviors of lower carbonyl compounds in the urban environment of Beirut, Lebanon. Atmospheric Environment 40:2459–2468.
Olivella M. A., 2006. Polycyclic aromatic hydrocarbons in rainwater and surface water of lake Maggiore, a subalpine lake in northern Italy. Chemosphere 63:116-131.
Ollivon D., Blanchoud H., Motelay-Massei A., Garban B., 2002. Atmospheric deposition of PAHs to an urban site, Paris, France. Atmospheric Environment 36:2891-2900.
Oros D. R. and Simoneit B. R. T., 2001. Identification and emission factors of molecular tracers in organic aerosols from biomass burning Part 2. Deciduous trees. AppliedGeochemistry 16:1545-1565.
Park J.-S., Wade T. L., Sweet S. T., 2002. Atmospheric deposition of PAHs, PCBs, and organochlorine pesticides to Corpus Christi Bay, Texas. Atmospheric Environment36:1707-1720.
Chapitre 3. Etude de la qualité des eaux libanaises
167
Pokolwsha Z., Kot A., Wiergowski M., Wolska L., Wolowska K., Namienik J., 2000. Organic pollutants in precipitation: determination of pesticides and polycyclic aromatic hydrocarbons in Gdansk. Poland. Atmospheric Environment 34:1233-1245.
Ribes S., Vand Drooge B., Dachs J., Gustafsson O., Grimalt J., 2003. Influence of soot carbon on the soil-air partitioning of polycyclic aromatic hydrocarbons. EnvironmentalScience & Technology 37:2675-2680.
Saliba N. A., Kouyoumdjiana H., Roumie M., 2007. Effect of local and long-range transport emissions on the elemental composition of PM10–2.5 and PM2.5 in Beirut. Atmospheric Environment 41:6497–6509.
Sasaki J., Aschmann S. M., Kwok E. S. C., Atkinson R., Arey J., 1997. Products of the gas-phase OH and NO3 radical-initiated reactions of naphthalene. Environmental Science & Technology 31:3173–3179.
Shaka H. and Saliba N. A., 2004. Concentration measurements and chemical composition of PM10-2.5 and PM2.5 at a coastal site in Beirut, Lebanon. Atmospheric Environment38:523–531.
Simcik M. F., Eisenreich S. J., Lioy P. J., 1999. Source apportionment and source/sink relationships of PAHs in the coastal atmosphere of Chicago and Lake Michigan. Atmospheric Environment 33:5071-5079.
Yunker M. B., Macdonald R.W., Vingarzan R., Mitchell R.H., Goyette D., Sylvestre S., 2002. PAHs in the Fraser River basin: a critical appraisal of PAH ratios as indicators of PAH source and composition. Organic Geochemistry 33:489– 515.
Wild S. R., Jones K. C., 1995. Polynuclear aromatic hydrocarbons in the United Kingdom environment: a preliminary source inventory and budget. Environmental Pollution88:91-108.
www.almee.org.lb
Chapitre 3. Etude de la qualité des eaux libanaises
168
7. Occurrence and determination of pesticide residues in the
Lebanese aquatic systems
Abir Kouzayha1, Hélène Budzinski3 and Farouk Jaber1&2*
1 National Council for Scientific Research CNRS - Lebanese Atomic Energy Commission LAEC - Analysis of Pesticides and Organic Pollutants Laboratory LAPPO - Beirut, Lebanon.2 Lebanese University - Faculty of Sciences I - Laboratory of Analysis of Organic Compounds (509) - Hadath, Beirut, Lebanon.3 Université Bordeaux 1, CNRS, ISM–LPTC–UMR 5255 (Laboratory of Physico- and Toxico-Chemistry), 351 Cours de la Libération, 33405 Talence, France.
(Article prepared for submission)
Abstract
In Lebanon, water pollution is one of the most critical environmental problems.
Pesticides occupy a unique position among organic pollutants in water, since they are
deliberately used to control pests in agriculture and public health. In this study, a total of 67
pesticides most commonly used in agriculture and indoors were determined in different water
systems: rainwater, drinking water, ground water and surface water. Chlorpropham and
fenpropathrin were detected in high concentrations (30-200 ng.L-1) in two of the biggest
surface water systems: the Qaraoun Lake and the Litani River. Beside, few pesticides like
DDE, DDD, dieldrin, hexachlorobenzene, and diazinon were detected at low levels in most of
the groundwater and drinking water samples indicating a possible chronic contamination of
our drinking water systems.
Keywords: pesticide residues; rainwater; drinking water; surface water; groundwater; Lebanon.
Chapitre 3. Etude de la qualité des eaux libanaises
169
7.1. Introduction
Water, the substance so vital to humans and their well-being, the source and basis of
life on earth, can become a serious hazard to our health, as well as to the life of the flora and
fauna. The intensive industrialization of the world results in an increased input of toxic
inorganic and organic compounds to waters, drastically reducing the quality of surface waters
and groundwaters which are a source of drinking water for a large part of the world
population. Approximately one-third of all organic compounds produced ends up in the
environment, including water, and over 700 chemical compounds, including more than 600
organic compounds, have been detected in some water samples (Biziuk et al., 1996).
Pesticides are particularly important pollutants among organic compounds as a result
of their common use, persistence in the environment and toxicity. They increase crop yields
by reducing the amount of a crop that is lost to pests and control diseases transmitted by
insects. Pesticides are necessarily toxic, as they are used in agriculture, industry and
households to kill weeds (herbicides), insects (insecticides), fungi (fungicides) and rodents
(rodenticides). They are also used as fumigants, attractants or repellents. Chemical structures
of pesticides are diversified, including for example organochlorines, organophosphates,
carbamates, triazines, phenol derivatives, etc. Pesticides are widely used through the world
and the present global annual production of pesticides is estimated at several hundred
thousand tons (www.uipp.org).
The majority of pesticides are sown directly to soil or sprayed over crop fields,
plantations or forests, and hence released directly to the environment. Pesticides enter water
either directly in applications such as mosquito and water plant control, or indirectly from
drainage of agricultural lands, permeation through soil, in wastewater from pesticide
production, municipal waste (fungicides and bactericides), wastewater from washing devices
spraying pesticides or wastewater from plants using pesticides (e.g., textile plants), etc. The
amount of pesticides in water depends largely on the intensity of agriculture production in a
given region which in turn determines the amount of pesticides applied, on the kind of crops,
precipitation, and water flow rate. Atmospheric precipitation is an important route of
transport of pesticides, resulting in contamination of water reservoirs remote from
agricultural areas. Consequently, a number of papers have been published confirming the
presence of pesticides not only in surface waters, but also in seawater, potable water,
particularly in water from wells existing in agricultural areas (Chapman et al., 1987),
Chapitre 3. Etude de la qualité des eaux libanaises
170
rainwater (Lode et al., 1995), as well as in water and ice from Polar Regions (Bidleman et al.,
1993).
In Lebanon, pesticide organization started in 1982, when the government issued a
decree regarding the creation of a scientific committee for the regulation of these products;
this committee was to define and study pesticide use in Lebanon and to set conditions for
authorization for their importation, sale, preparation, labeling, and use (Lebanese
Government, 1982). Despite the existence of a list promoted in 1992 by the Ministry of
Agriculture on officially forbidden pesticides, government control and law enforcement are
still weak. Even banned products are available by illegal means and used by the untrained
public, in addition to the misuse of several agents, regardless of any health and ecological
toxicity risks (Trabulsi, 1991; Abou Fakhr et al., 1995). Pesticides most commonly used in
Lebanon for agriculture, house and yard treatments include organophosphates, pyrethroids,
biperidyl derivatives and dithiocarbamates (Geahchan and Abi Zeid Daou, 1995).
The overuse of pesticides in Lebanon is increasing the risk of environmental
contamination, especially regarding water pollution. Within the context of assessing water
quality in Lebanon, some studies have addressed the microbiological water quality in spring
water (Jurdi, 1992) and others have addressed the Litani River water quality due to its
strategic importance (Jurdi et al., 200 and 2001). In addition, some studies have addressed the
heavy metals present in river sediments (Korfali and Davies, 2003). Most of these studies
have indicated varying levels of chemical and microbiological pollution leading to a gradual
deterioration of water quality. Some of the toxic materials found were related to chemical
fertilizers as well as pesticides. However, these studies didn’t provide any detailed
information about the presence and the quantification of different pesticides in surface
waters, or any other water system in Lebanon.
The main objective of the present work is to evaluate the impact of the use of
pesticides on the quality of different water systems in Lebanon. In this context, 67 pesticides
belonging to different chemical classes were determined in wide spectra of water samples
including rainwater, groundwater, drinking water and surface water collected from different
regions.
7.2. Materials and Methods
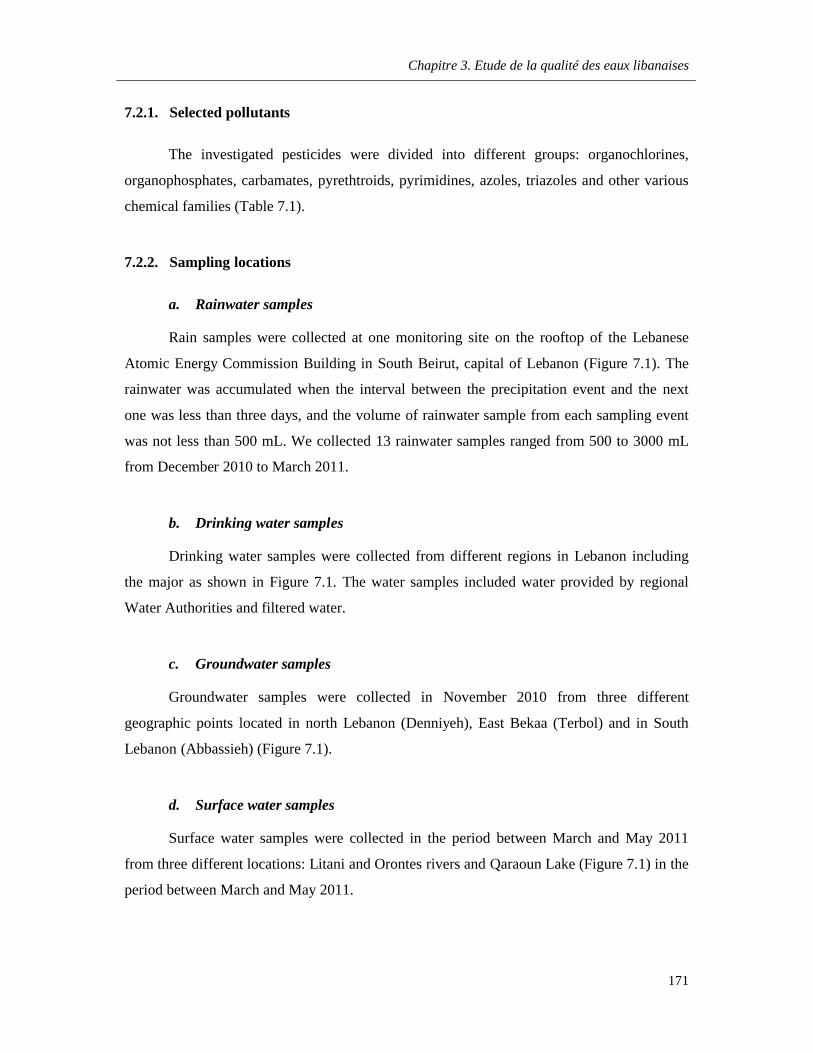
Chapitre 3. Etude de la qualité des eaux libanaises
171
7.2.1. Selected pollutants
The investigated pesticides were divided into different groups: organochlorines,
organophosphates, carbamates, pyrethtroids, pyrimidines, azoles, triazoles and other various
chemical families (Table 7.1).
7.2.2. Sampling locations
a. Rainwater samples
Rain samples were collected at one monitoring site on the rooftop of the Lebanese
Atomic Energy Commission Building in South Beirut, capital of Lebanon (Figure 7.1). The
rainwater was accumulated when the interval between the precipitation event and the next
one was less than three days, and the volume of rainwater sample from each sampling event
was not less than 500 mL. We collected 13 rainwater samples ranged from 500 to 3000 mL
from December 2010 to March 2011.
b. Drinking water samples
Drinking water samples were collected from different regions in Lebanon including
the major as shown in Figure 7.1. The water samples included water provided by regional
Water Authorities and filtered water.
c. Groundwater samples
Groundwater samples were collected in November 2010 from three different
geographic points located in north Lebanon (Denniyeh), East Bekaa (Terbol) and in South
Lebanon (Abbassieh) (Figure 7.1).
d. Surface water samples
Surface water samples were collected in the period between March and May 2011
from three different locations: Litani and Orontes rivers and Qaraoun Lake (Figure 7.1) in the
period between March and May 2011.
Chapitre 3. Etude de la qualité des eaux libanaises
172
The Litani is the largest river in Lebanon and it flows fully inside Lebanese territory.
The river rises in the northern Bekaa valley and runs southward to Beaufort Castle, where it
turns westward to empty in the Mediterranean Sea. The Litani River is characterized with an
average annual flow estimated at 920 million cubic meters, of which Lebanon utilizes
inefficiently 125 million cubic meters for irrigation purposes in the Kasmieh irrigation
project, and around 236 million cubic meters are diverted through the Markaba tunnel to fuel
hydroelectricity, supply Jebel Amel project with drinking water, and augment the wasteful
water supply network of Beirut. The upper water of Litani’s river is stored in Qaraoun lake,
which is used for irrigation in South Bekaa and south Lebanon. The Orontes, also one of the
largest rivers in Lebanon, is the only river which flows for about 400 kilometer in a generally
northern direction crossing over to Syria.
7.2.3. Sample preparation and solid-phase extraction
All water samples were collected in duplicates in 2.5 L dark glass bottles. Samples
were filtered immediately through a Whatman GF/F filter (0.7 μm porosity) previously
heated at 450 °C, and then stored at 4°C before analysis. The surrogate standard (PCB 52)
was added in water samples before extraction at a fixed concentration of 50 ng/L.
Pesticides were preconcentrated from all water samples using solid phase extraction
on Chromabond C18 cartridges (Machery Nagel, Germany) according to the procedure
presented in Figure 7.2. The recoveries of organic compounds studied were better than 60%
and analytical errors were within 30%.
7.2.4. Gas chromatography-mass spectrometry instrumentation
The analysis of pesticides after their preconcentration was done using gas
chromatography (GC) with mass spectrometry detector (MS). The system consisted of:
- An Agilent 6890N GC equipped with an Agilent 7683B autosampler and
split/splitless injector with electronic pressure control, capillary column HP-5MS (30 m, 0.25
mm i.d., 0.25 µm, Agilent J&W GC columns). The temperature program was the following:
initial temperature 70 °C, held for 1 min, 10 °C.min-1 ramp to 160 °C then held for 5 min,
finally by 3 °C.min-1 to 240 °C and held for 18.5 min. The total analysis time was 60.17 min
and the equilibration time 0.5 min. The temperature of the injection port was 250 °C and a 1
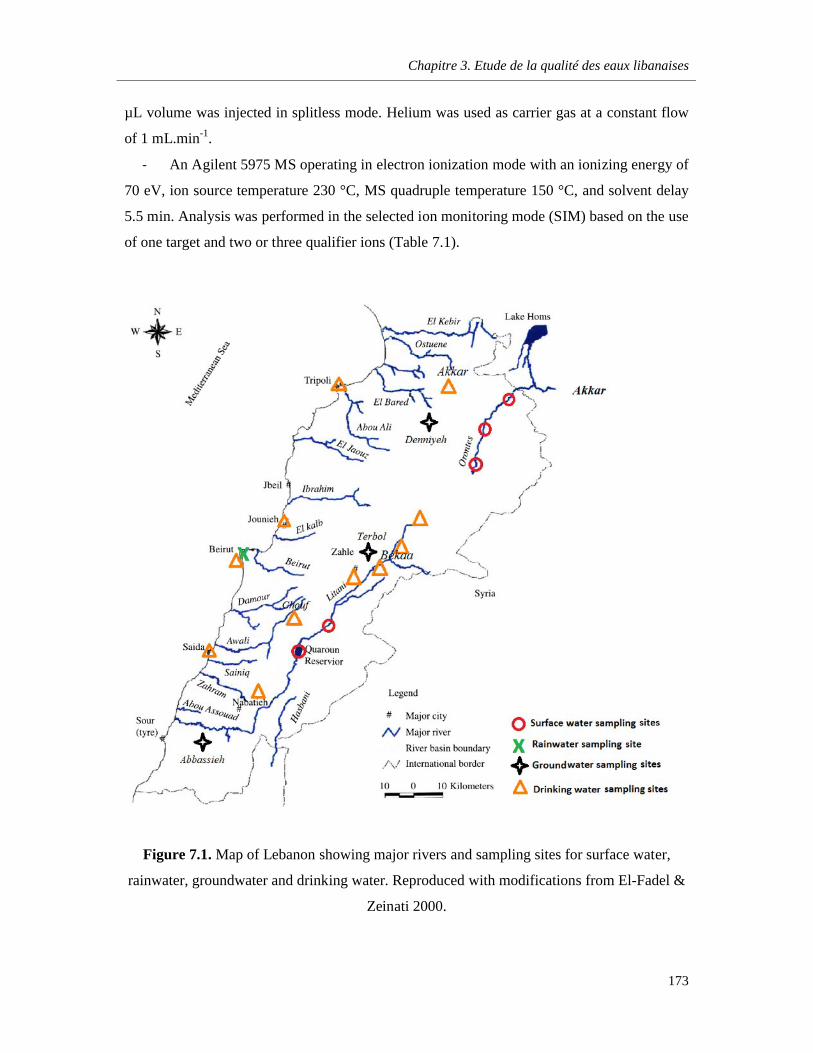
Chapitre 3. Etude de la qualité des eaux libanaises
173
µL volume was injected in splitless mode. Helium was used as carrier gas at a constant flow
of 1 mL.min-1.
- An Agilent 5975 MS operating in electron ionization mode with an ionizing energy of
70 eV, ion source temperature 230 °C, MS quadruple temperature 150 °C, and solvent delay
5.5 min. Analysis was performed in the selected ion monitoring mode (SIM) based on the use
of one target and two or three qualifier ions (Table 7.1).
Figure 7.1. Map of Lebanon showing major rivers and sampling sites for surface water,
rainwater, groundwater and drinking water. Reproduced with modifications from El-Fadel &
Zeinati 2000.
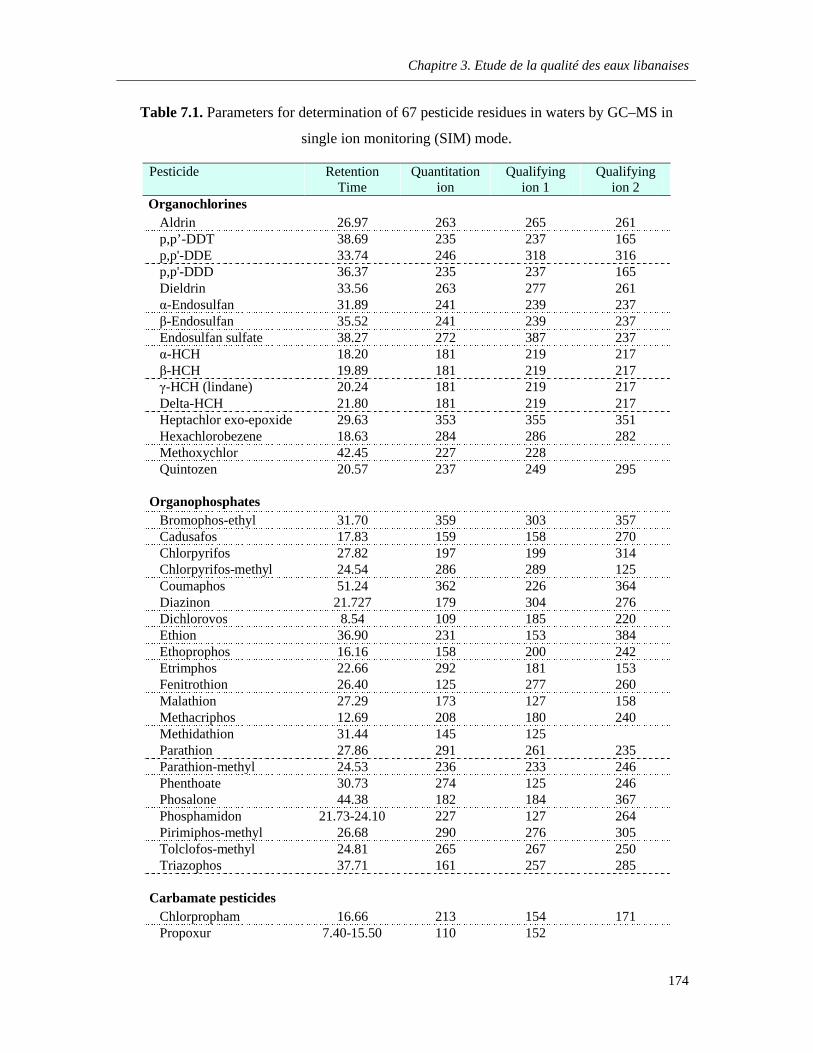
Chapitre 3. Etude de la qualité des eaux libanaises
174
Table 7.1. Parameters for determination of 67 pesticide residues in waters by GC–MS in
single ion monitoring (SIM) mode.
Pesticide Retention Time
Quantitation ion
Qualifying ion 1
Qualifying ion 2
Organochlorines Aldrin 26.97 263 265 261p,p’-DDT 38.69 235 237 165p,p'-DDE 33.74 246 318 316p,p'-DDD 36.37 235 237 165Dieldrin 33.56 263 277 261α-Endosulfan 31.89 241 239 237β-Endosulfan 35.52 241 239 237Endosulfan sulfate 38.27 272 387 237α-HCH 18.20 181 219 217β-HCH 19.89 181 219 217γ-HCH (lindane) 20.24 181 219 217Delta-HCH 21.80 181 219 217Heptachlor exo-epoxide 29.63 353 355 351Hexachlorobezene 18.63 284 286 282Methoxychlor 42.45 227 228Quintozen 20.57 237 249 295
OrganophosphatesBromophos-ethyl 31.70 359 303 357Cadusafos 17.83 159 158 270Chlorpyrifos 27.82 197 199 314Chlorpyrifos-methyl 24.54 286 289 125Coumaphos 51.24 362 226 364Diazinon 21.727 179 304 276Dichlorovos 8.54 109 185 220Ethion 36.90 231 153 384Ethoprophos 16.16 158 200 242Etrimphos 22.66 292 181 153Fenitrothion 26.40 125 277 260Malathion 27.29 173 127 158Methacriphos 12.69 208 180 240Methidathion 31.44 145 125Parathion 27.86 291 261 235Parathion-methyl 24.53 236 233 246Phenthoate 30.73 274 125 246Phosalone 44.38 182 184 367Phosphamidon 21.73-24.10 227 127 264Pirimiphos-methyl 26.68 290 276 305Tolclofos-methyl 24.81 265 267 250Triazophos 37.71 161 257 285
Carbamate pesticides Chlorpropham 16.66 213 154 171Propoxur 7.40-15.50 110 152
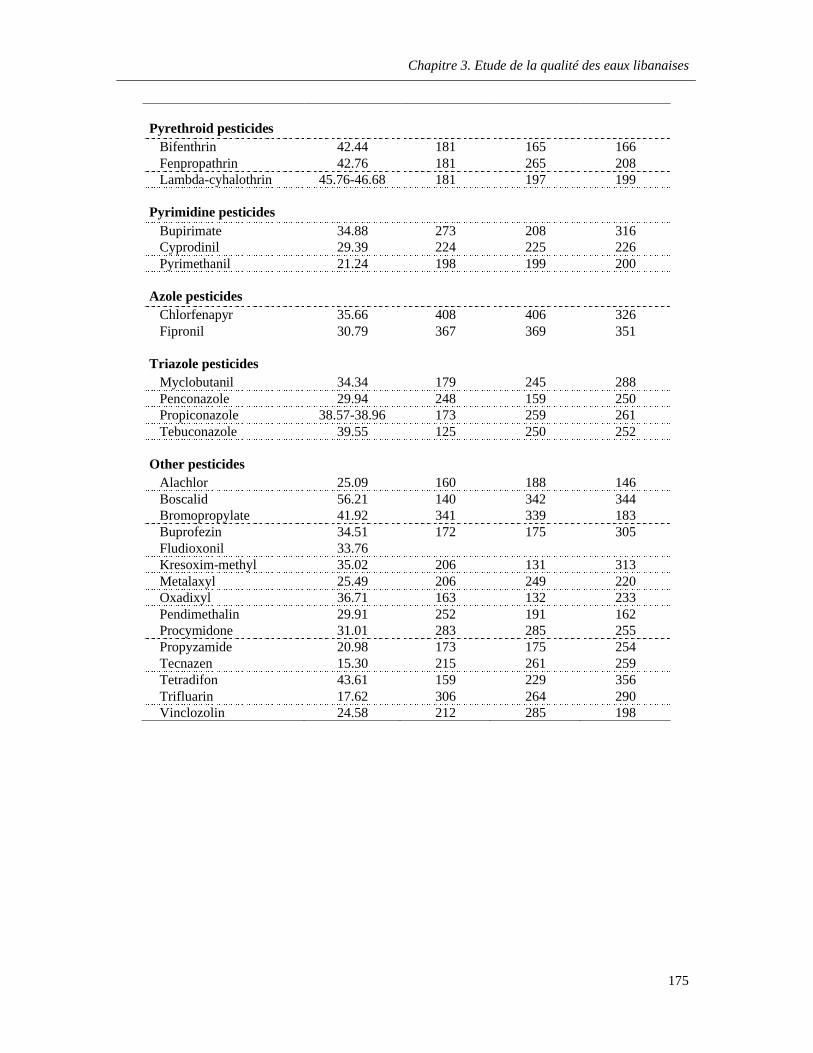
Chapitre 3. Etude de la qualité des eaux libanaises
175
Pyrethroid pesticides Bifenthrin 42.44 181 165 166Fenpropathrin 42.76 181 265 208Lambda-cyhalothrin 45.76-46.68 181 197 199
Pyrimidine pesticides Bupirimate 34.88 273 208 316Cyprodinil 29.39 224 225 226Pyrimethanil 21.24 198 199 200
Azole pesticides Chlorfenapyr 35.66 408 406 326Fipronil 30.79 367 369 351
Triazole pesticides Myclobutanil 34.34 179 245 288Penconazole 29.94 248 159 250Propiconazole 38.57-38.96 173 259 261Tebuconazole 39.55 125 250 252
Other pesticides Alachlor 25.09 160 188 146Boscalid 56.21 140 342 344Bromopropylate 41.92 341 339 183Buprofezin 34.51 172 175 305Fludioxonil 33.76Kresoxim-methyl 35.02 206 131 313Metalaxyl 25.49 206 249 220Oxadixyl 36.71 163 132 233Pendimethalin 29.91 252 191 162Procymidone 31.01 283 285 255Propyzamide 20.98 173 175 254Tecnazen 15.30 215 261 259Tetradifon 43.61 159 229 356Trifluarin 17.62 306 264 290Vinclozolin 24.58 212 285 198
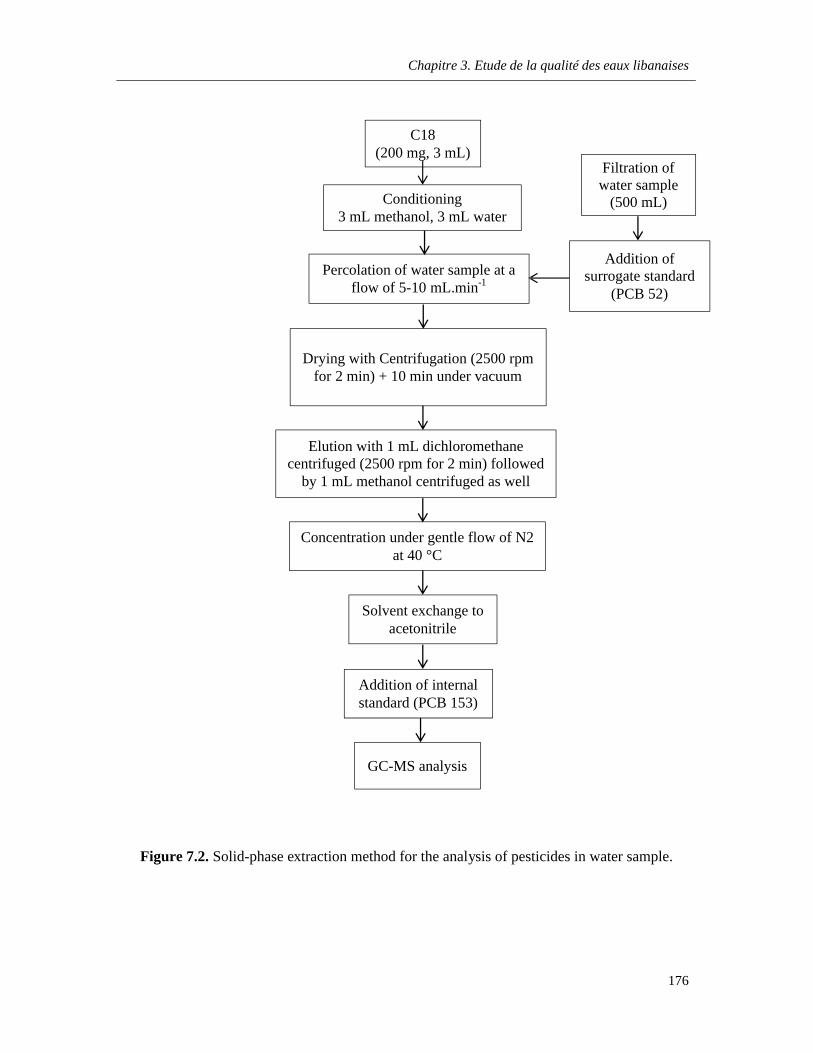
Chapitre 3. Etude de la qualité des eaux libanaises
176
Figure 7.2. Solid-phase extraction method for the analysis of pesticides in water sample.
Conditioning3 mL methanol, 3 mL water
Percolation of water sample at a flow of 5-10 mL.min-1
Drying with Centrifugation (2500 rpm for 2 min) + 10 min under vacuum
Elution with 1 mL dichloromethane centrifuged (2500 rpm for 2 min) followed
by 1 mL methanol centrifuged as well
Concentration under gentle flow of N2 at 40 °C
GC-MS analysis
C18(200 mg, 3 mL)
Solvent exchange to acetonitrile
Addition of internal standard (PCB 153)
Filtration of water sample
(500 mL)
Addition of surrogate standard
(PCB 52)
Chapitre 3. Etude de la qualité des eaux libanaises
177
7.3. Results and discussion
7.3.1. Rainwater
Results of the determination of pesticides in rainwater sampled in Beirut city between
December 2010 and March 2011 are shown in Figures 7.3, 7.4, 7.5 and 7.6. Generally,
pesticides occurred in the atmospheric precipitation very rarely and if so at low ppb level.
During our studies, the most frequently detected pesticide was the diazinon, which was
present in most of the analyzed samples and at the highest concentration, but never exceeded
the 50 ng.L-1 level. The second pesticide that was detected frequently in 75% of rainwater
samples was the hexachlorobezene, but in a very low level < 5 ng.L-1. Few other pesticides
were detected occasionally in rainwater samples, such as methoxychlor, chlorpyrifos,
dichlorovos, fenpropathrin, cyprodinil, pyrimethanil, bromopropylate, procymidone and
tetradifon, but were all at a low level < 10 ng.L-1.
In comparison with other countries, pesticide concentrations in rainwater of Norway,
Italy, Germany, France, Poland and Switzerland were higher and reached few µg.L-1
sometimes (Lode et al., 1995; Trevisan et al., 1993; Huskes et al., 1997; Bester et al., 1995;
Millet et al., 1997; Chevreuil et al., 1996; Buser, 1990).
Some eventual traces of pesticides which were found could be as a result of
atmospheric transport of pollutants over a long distance from their source to the place of the
destination. This is because some agricultural areas are situated along the coastline and not
far from the city. Long-range transport as a result of volatility and persistence of some
pesticides was already observed by several authors. Thus a variety of pesticides was found in
precipitation throughout the world, even in Antarctica (Bidleman et al., 1993) or the Arctic
environment (Chernyak et al., 1996). Another source of pesticide in the city of Beirut is
related to the intensity of insecticides used on a large scale by the municipality. The
occurrence of analyzed pesticides in rainfall is rather seasonal but our results are
unfortunately too few for further comments on the atmospheric deposition estimation.
7.3.2. Drinking water
The results of pesticide levels in the 18 drinking water samples analyzed in our study
are illustrated in Figures 7.7, 7.8, 7.9 and 7.10. The pesticides detected frequently in drinking
Chapitre 3. Etude de la qualité des eaux libanaises
178
water samples were: Diazinon, DDE, DDD, HCB, and tetradifon, with levels up to 15.3 ng.L-
1 for diazinon and not exceeding 5 ng.L-1 for each other individual compound. The sum of the
detected pesticides in half of the analyzed water samples was below 10 ng.L-1. The average
sum of pesticides for all the samples was 11.3 ng.L-1 with a maximum value of 31.8 ng.L-1. In
fact, the pesticide levels obtained are lower than the maximum admissible concentrations
stated by the European community in drinking water for each individual pesticide (100 ng.L-
1) and for the sum of pesticides (500 ng.L-1) (EU, 1998).
7.3.3. Groundwater
For the three ground water samples analyzed in November 2010 (Figures 7.11, 7.12,
7.13 and 7.14), no high pesticide concentration was found. Only few compounds were
detected in one or more groundwater samples, such as aldrin, DDD, DDE,
hexachlorobenzene and diazinon. This means that the presence of these persistent
compounds, mainly used in the past, is not critical nowadays and only few traces are still
detected in the groundwater system. On pesticide, metalaxyl was detected in the Terbol
groundwater sample at a level of 14.5 ng.L-1. This compound, mainly used as systemic
fungicide used to control plant diseases or water-mold fungi. It is used on many food and
feed crops, and on non-food, residential and greenhouse crops such as tobacco, ornamental
plants, trees, shrubs and vines, and lawns and turf. Metalaxyl, moderately stable under normal
environmental conditions (with a half-life of 400 days), is persistent and mobile at the same
time. Monitoring data demonstrated his tendency to leach in many soils with a potential to
reach groundwater. Metalaxyl has been detected in ground water in five states in the US at
levels typically reaching up to 3 µg.L-1. Concentrations as high as 236 µg.L-1 have been
found, but are not likely the result of normal field use (US-EPA, 1994).
7.3.4. Surface water
Results obtained for the analyzed surface water samples are illustrated in Figures
7.15, 7.16, 7.17 and 7.18 for comparison of pesticides concentrations in Qaraoun Lake
between March and May 2011, and in Figures 7.19, 7.20, 7.21 and 7.22 for the comparison of
pesticides levels between Litani river and Qaraoun lake in May 2011.
Chapitre 3. Etude de la qualité des eaux libanaises
179
In Orontes River samples, only diazinon was detected and quantified at a level up to
8.9 ng.L-1. Other pesticides like hexachlorobenzene, methoxychlor, DDE, fenpropathrin,
bifenthrin, bromopropylate, arocymidone and tetradifon were detected but a very low level.
In the Litani River and the lake of Qaraoun, pesticides with highest concentration
were fenpropathrin (220.1 ng.L-1), bifenthrin (33.7 ng.L-1) and chlorpropham (34.6 ng.L-1).
Lindane, endosulfanesulfate, chlorpyrifos, diazinon, alachlor, bromopropylate, procymidone,
pendimenthalin, and tetradifon were also detected during the period between March and May
2011 with an individual concentration up to 10 ng.L-1. Some of the detected pesticides are
included in the EPA and the European priority pollutant lists (EU, 2001; water.epa.gov), and
the levels found are not far from the acceptable limits for surface waters or the environmental
quality standards adopted by the European commission (EU, 2008).
The analysis of water samples from Qaraoun lake, Litani and Orontes rivers shows
that pollution of these water systems is episodic for some pesticides and strongly dependent
on agricultural activities (fenpropathrin detected in Qaraoun lake in May but not in March
2011). Besides, more analysis should be run before considering the pesticides frequently
detected at low level (DDE, DDD, lindane, methoxychlor, diazinon, and bromopropylate) as
a chronic pollutant of these surface waters.
7.4. Conclusion
This study reported new results for one of Lebanon’s most critical environmental
problems, the water pollution. A total of 67 pesticides most commonly used in agriculture
and indoors were determined in different water systems: rainwater, drinking water, ground
water and surface water. Some compounds like chlorpropham and fenpropathrin were
detected in high concentrations (30-200 ng.L-1) in two of the biggest surface water systems:
the Qaraoun Lake and the Litani River. Beside, few pesticides like DDE, DDD, dieldrin,
hexachlorobenzene, and diazinon were detected at low levels in most of the groundwater and
drinking water samples indicating a possible chronic contamination of our drinking water
systems with these stable and persistent pesticides. Finally, the pesticide occurrence in waters
is indeed related to seasonal and agricultural tends, therefore monitoring plans should be
conducted in order to better understand the presence and the evolution of the pesticides in our
aquatic systems.
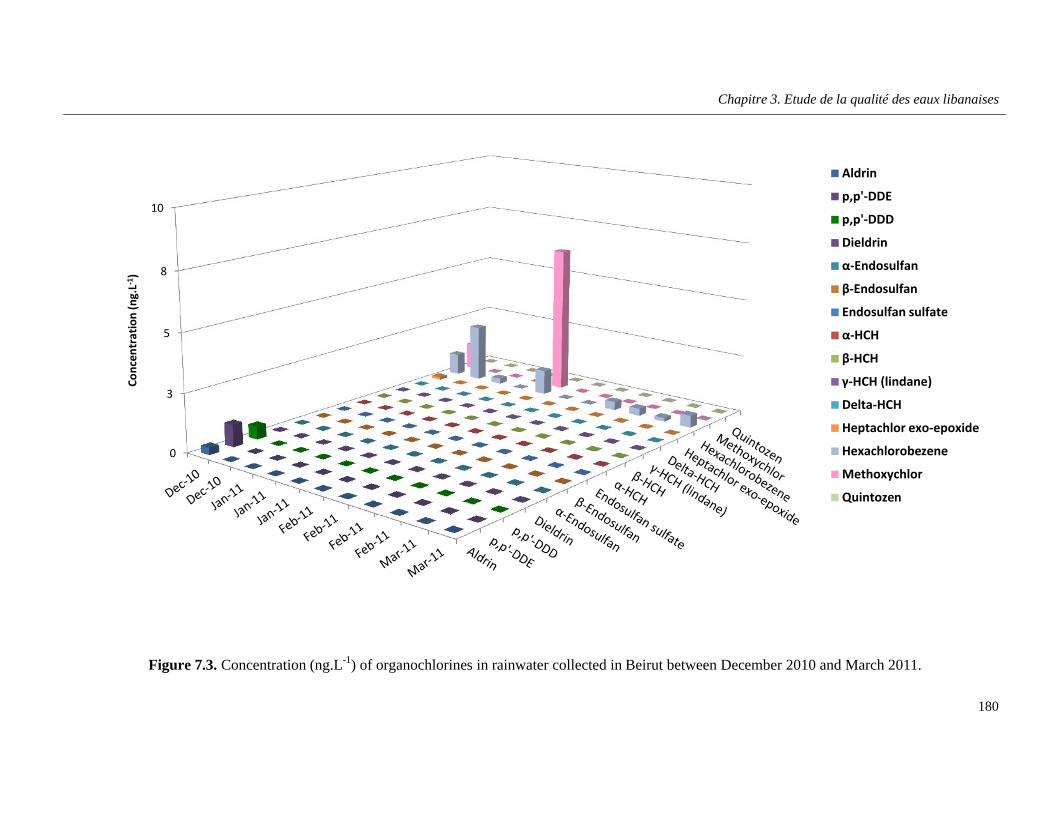
Chapitre 3. Etude de la qualité des eaux libanaises
180
Figure 7.3. Concentration (ng.L-1) of organochlorines in rainwater collected in Beirut between December 2010 and March 2011.
0
3
5
8
10
Conc
entr
atio
n (n
g.L-1
)
Aldrin
p,p'-DDE
p,p'-DDD
Dieldrin
α-Endosulfan
β-Endosulfan
Endosulfan sulfate
α-HCH
β-HCH
γ-HCH (lindane)
Delta-HCH
Heptachlor exo-epoxide
Hexachlorobezene
Methoxychlor
Quintozen
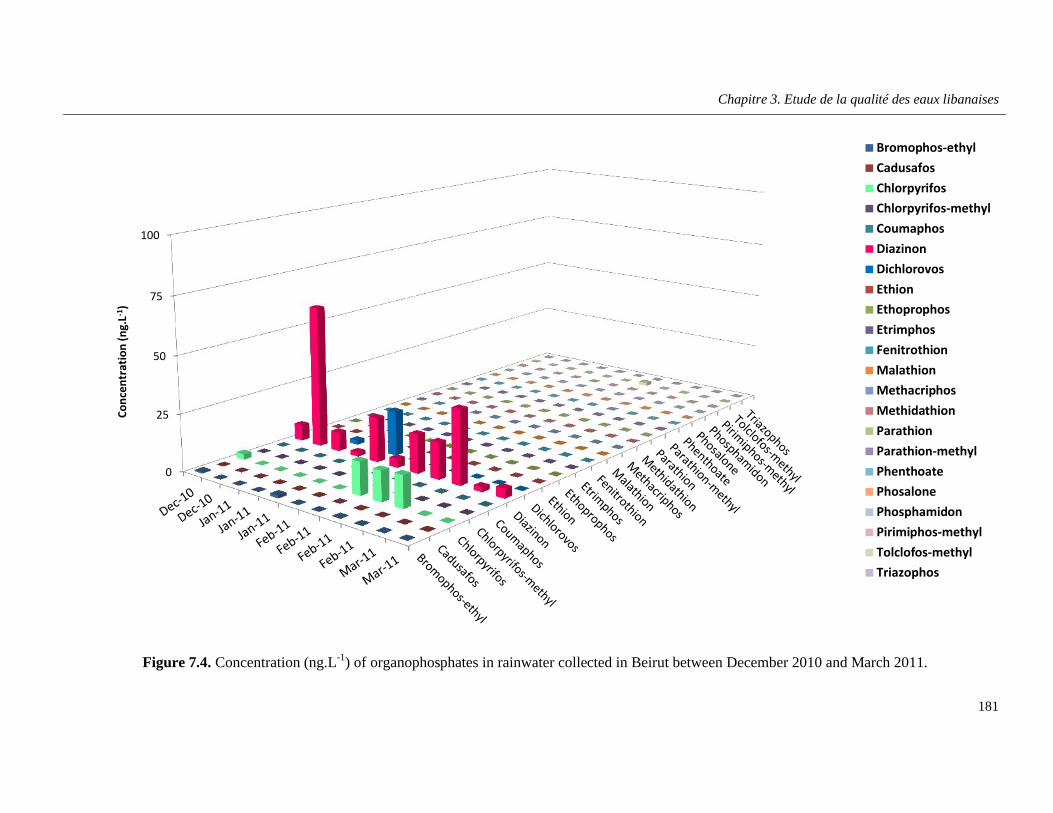
Chapitre 3. Etude de la qualité des eaux libanaises
181
Figure 7.4. Concentration (ng.L-1) of organophosphates in rainwater collected in Beirut between December 2010 and March 2011.
0
25
50
75
100
Conc
entr
atio
n (n
g.L-1
)
Bromophos-ethylCadusafosChlorpyrifosChlorpyrifos-methylCoumaphosDiazinonDichlorovosEthionEthoprophosEtrimphosFenitrothionMalathionMethacriphosMethidathionParathionParathion-methylPhenthoatePhosalonePhosphamidonPirimiphos-methylTolclofos-methylTriazophos
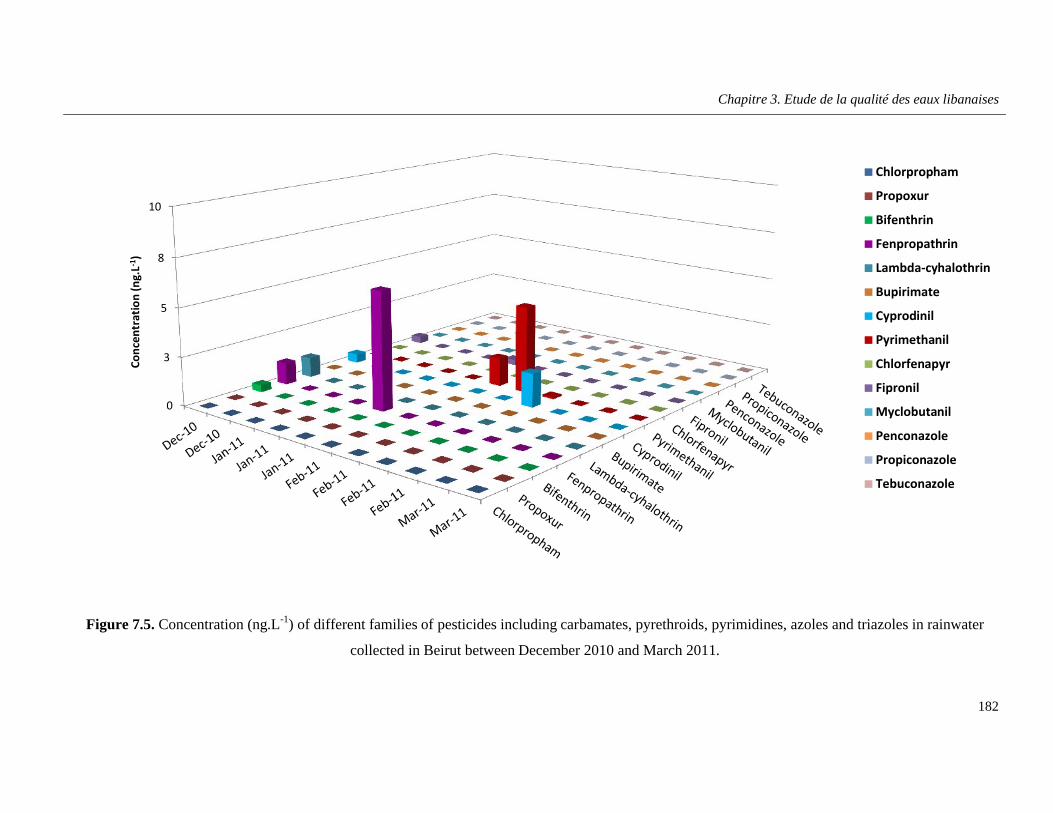
Chapitre 3. Etude de la qualité des eaux libanaises
182
Figure 7.5. Concentration (ng.L-1) of different families of pesticides including carbamates, pyrethroids, pyrimidines, azoles and triazoles in rainwater
collected in Beirut between December 2010 and March 2011.
0
3
5
8
10
Conc
entr
atio
n (n
g.L-1
)
Chlorpropham
Propoxur
Bifenthrin
Fenpropathrin
Lambda-cyhalothrin
Bupirimate
Cyprodinil
Pyrimethanil
Chlorfenapyr
Fipronil
Myclobutanil
Penconazole
Propiconazole
Tebuconazole
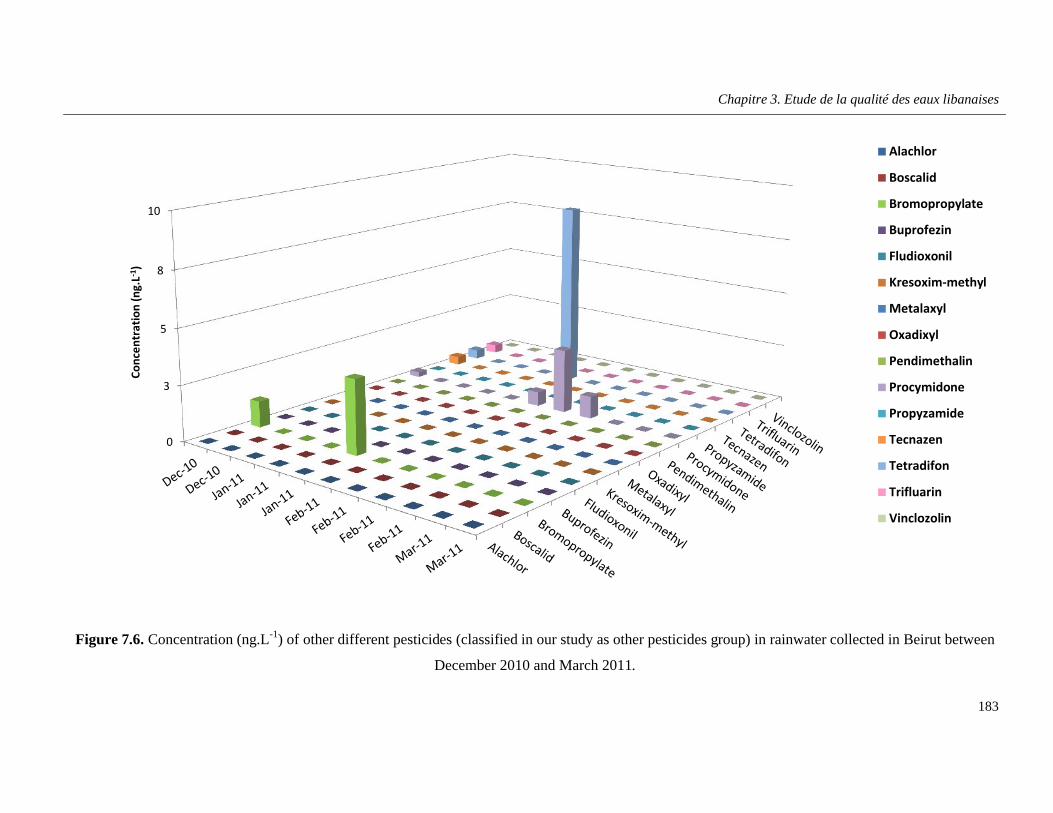
Chapitre 3. Etude de la qualité des eaux libanaises
183
Figure 7.6. Concentration (ng.L-1) of other different pesticides (classified in our study as other pesticides group) in rainwater collected in Beirut between
December 2010 and March 2011.
0
3
5
8
10
Conc
entr
atio
n (n
g.L-1
)Alachlor
Boscalid
Bromopropylate
Buprofezin
Fludioxonil
Kresoxim-methyl
Metalaxyl
Oxadixyl
Pendimethalin
Procymidone
Propyzamide
Tecnazen
Tetradifon
Trifluarin
Vinclozolin
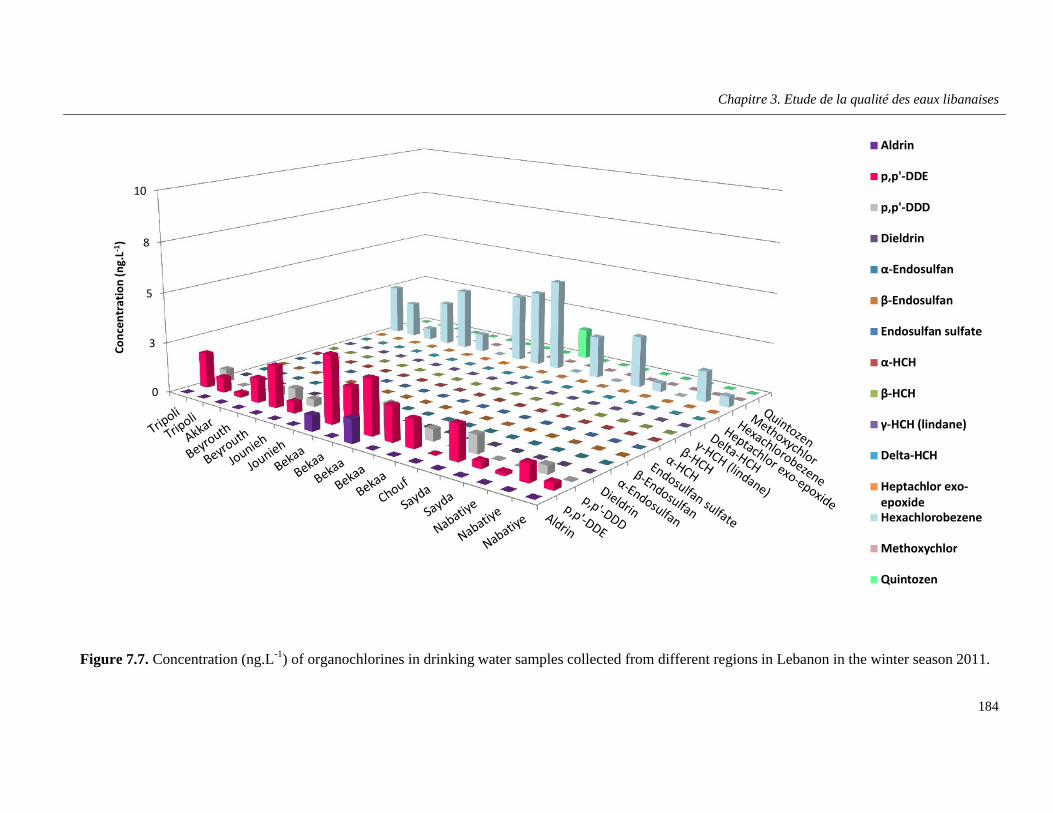
Chapitre 3. Etude de la qualité des eaux libanaises
184
Figure 7.7. Concentration (ng.L-1) of organochlorines in drinking water samples collected from different regions in Lebanon in the winter season 2011.
0
3
5
8
10
Conc
entr
atio
n (n
g.L-1
)
Aldrin
p,p'-DDE
p,p'-DDD
Dieldrin
α-Endosulfan
β-Endosulfan
Endosulfan sulfate
α-HCH
β-HCH
γ-HCH (lindane)
Delta-HCH
Heptachlor exo-epoxideHexachlorobezene
Methoxychlor
Quintozen
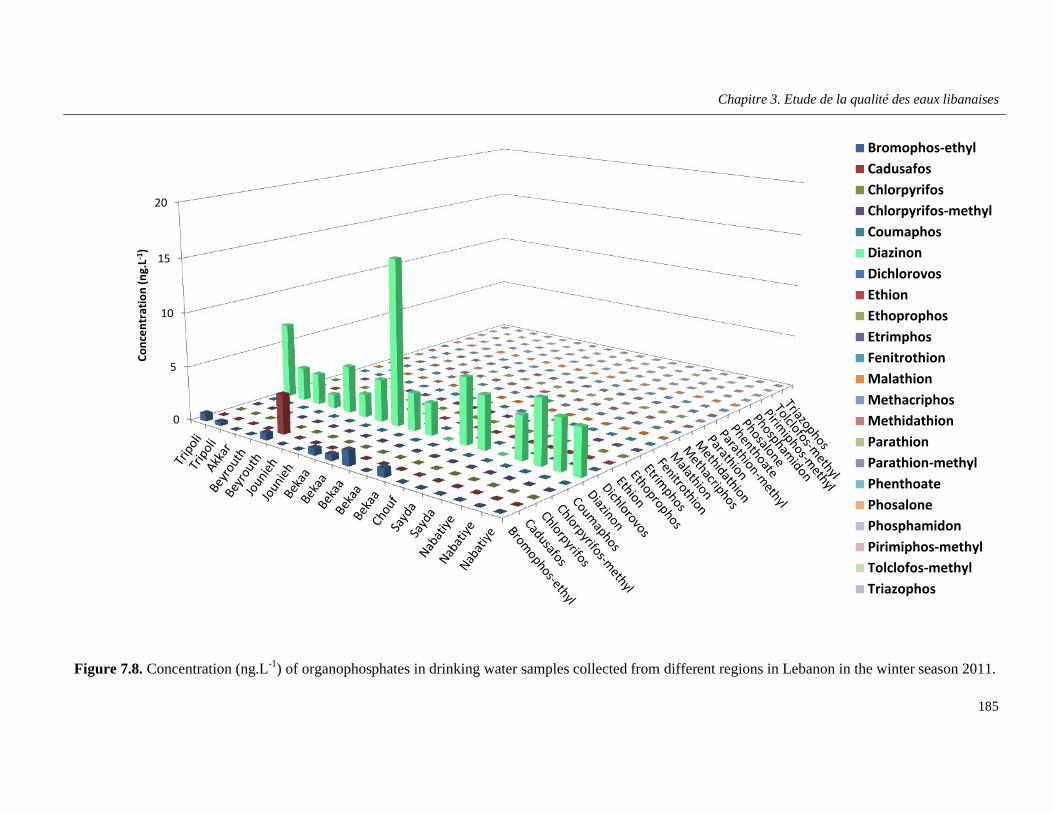
Chapitre 3. Etude de la qualité des eaux libanaises
185
Figure 7.8. Concentration (ng.L-1) of organophosphates in drinking water samples collected from different regions in Lebanon in the winter season 2011.
0
5
10
15
20
Conc
entr
atio
n (n
g.L-1
)Bromophos-ethylCadusafosChlorpyrifosChlorpyrifos-methylCoumaphosDiazinonDichlorovosEthionEthoprophosEtrimphosFenitrothionMalathionMethacriphosMethidathionParathionParathion-methylPhenthoatePhosalonePhosphamidonPirimiphos-methylTolclofos-methylTriazophos
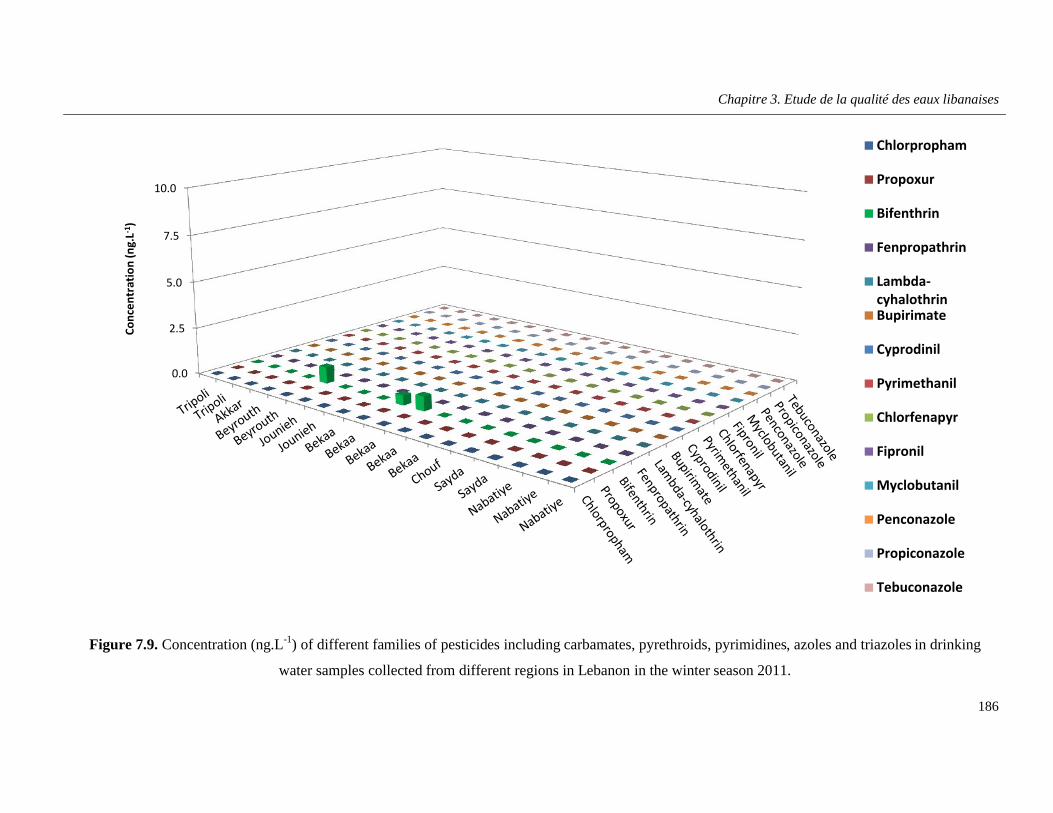
Chapitre 3. Etude de la qualité des eaux libanaises
186
Figure 7.9. Concentration (ng.L-1) of different families of pesticides including carbamates, pyrethroids, pyrimidines, azoles and triazoles in drinking
water samples collected from different regions in Lebanon in the winter season 2011.
0.0
2.5
5.0
7.5
10.0
Conc
entr
atio
n (n
g.L-1
)Chlorpropham
Propoxur
Bifenthrin
Fenpropathrin
Lambda-cyhalothrinBupirimate
Cyprodinil
Pyrimethanil
Chlorfenapyr
Fipronil
Myclobutanil
Penconazole
Propiconazole
Tebuconazole
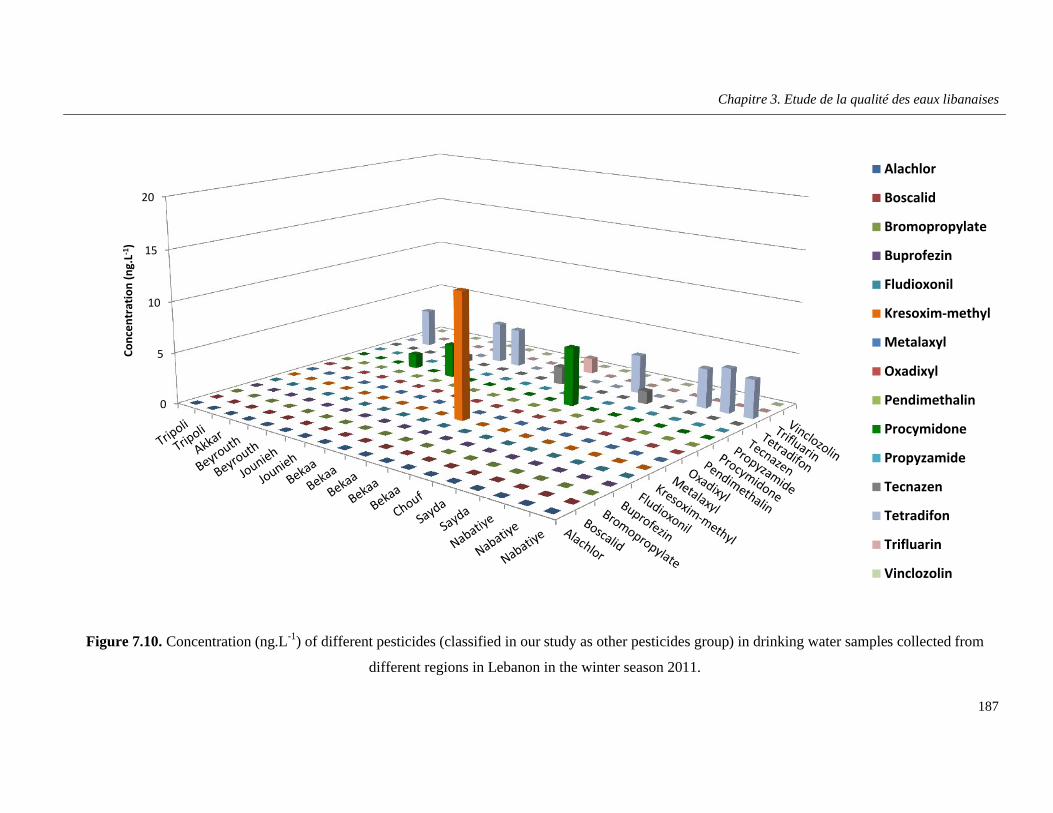
Chapitre 3. Etude de la qualité des eaux libanaises
187
Figure 7.10. Concentration (ng.L-1) of different pesticides (classified in our study as other pesticides group) in drinking water samples collected from
different regions in Lebanon in the winter season 2011.
0
5
10
15
20
Conc
entr
atio
n (n
g.L-1
)
Alachlor
Boscalid
Bromopropylate
Buprofezin
Fludioxonil
Kresoxim-methyl
Metalaxyl
Oxadixyl
Pendimethalin
Procymidone
Propyzamide
Tecnazen
Tetradifon
Trifluarin
Vinclozolin
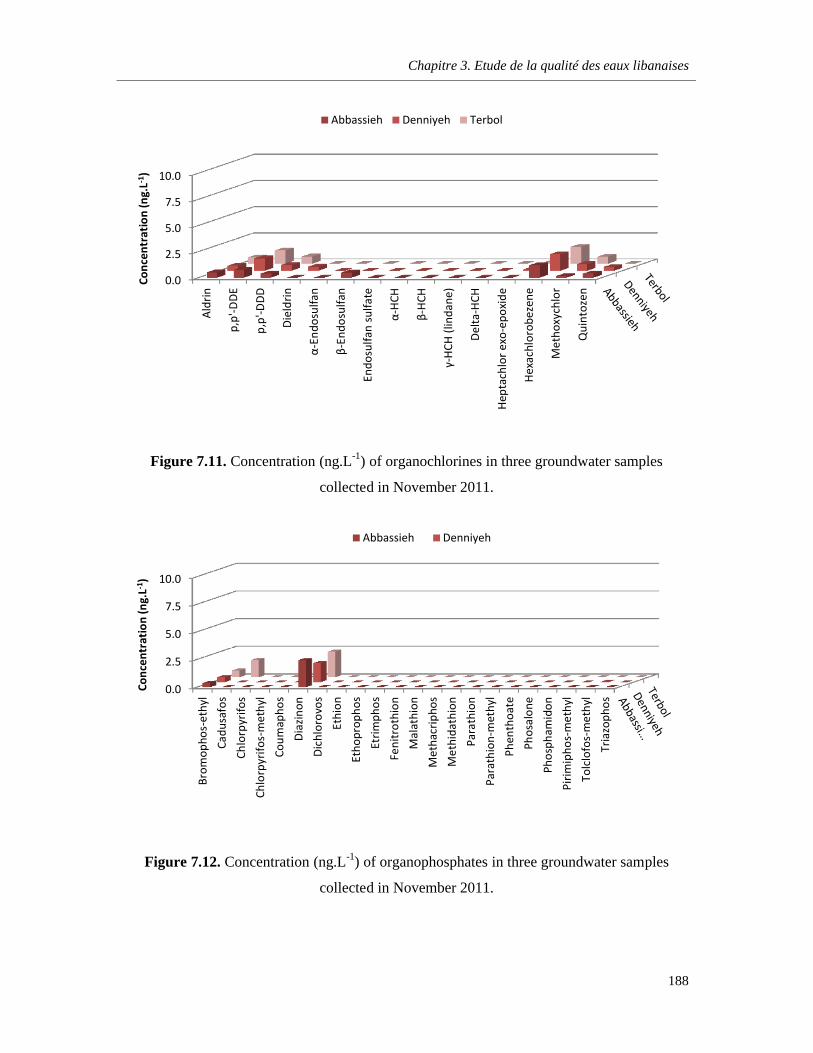
Chapitre 3. Etude de la qualité des eaux libanaises
188
Figure 7.11. Concentration (ng.L-1) of organochlorines in three groundwater samples
collected in November 2011.
Figure 7.12. Concentration (ng.L-1) of organophosphates in three groundwater samples
collected in November 2011.
0.0
2.5
5.0
7.5
10.0
Aldr
in
p,p'
-DD
E
p,p'
-DD
D
Die
ldrin
α-En
dosu
lfan
β-En
dosu
lfan
Endo
sulfa
n su
lfate
α-H
CH
β-H
CH
γ-H
CH (l
inda
ne)
Del
ta-H
CH
Hep
tach
lor e
xo-e
poxi
de
Hex
achl
orob
ezen
e
Met
hoxy
chlo
r
Qui
ntoz
en
Conc
entr
atio
n (n
g.L-1
)
Abbassieh Denniyeh Terbol
0.0
2.5
5.0
7.5
10.0
Brom
opho
s-et
hyl
Cadu
safo
s
Chlo
rpyr
ifos
Chlo
rpyr
ifos-
met
hyl
Coum
apho
s
Dia
zino
n
Dic
hlor
ovos
Ethi
on
Etho
prop
hos
Etrim
phos
Feni
trot
hion
Mal
athi
on
Met
hacr
ipho
s
Met
hida
thio
n
Para
thio
n
Para
thio
n-m
ethy
l
Phen
thoa
te
Phos
alon
e
Phos
pham
idon
Pirim
ipho
s-m
ethy
l
Tolc
lofo
s-m
ethy
l
Tria
zoph
os
Conc
entr
atio
n (n
g.L-1
)
Abbassieh Denniyeh

Chapitre 3. Etude de la qualité des eaux libanaises
189
Figure 7.13. Concentration (ng.L-1) of different families of pesticides including carbamates,
pyrethroids, pyrimidines, azoles and triazoles in three groundwater samples collected in
November 2011.
Figure 7.14. Concentration (ng.L-1) of different pesticides (classified in our study as other
pesticides group) in three groundwater samples collected in November 2011.
0.0
2.5
5.0
7.5
10.0
Conc
entr
atio
n (n
g.L-1
)Abbassieh Denniyeh
0
5
10
15
20
Conc
entr
atio
n (n
g.L-1
)
Abbassieh Denniyeh
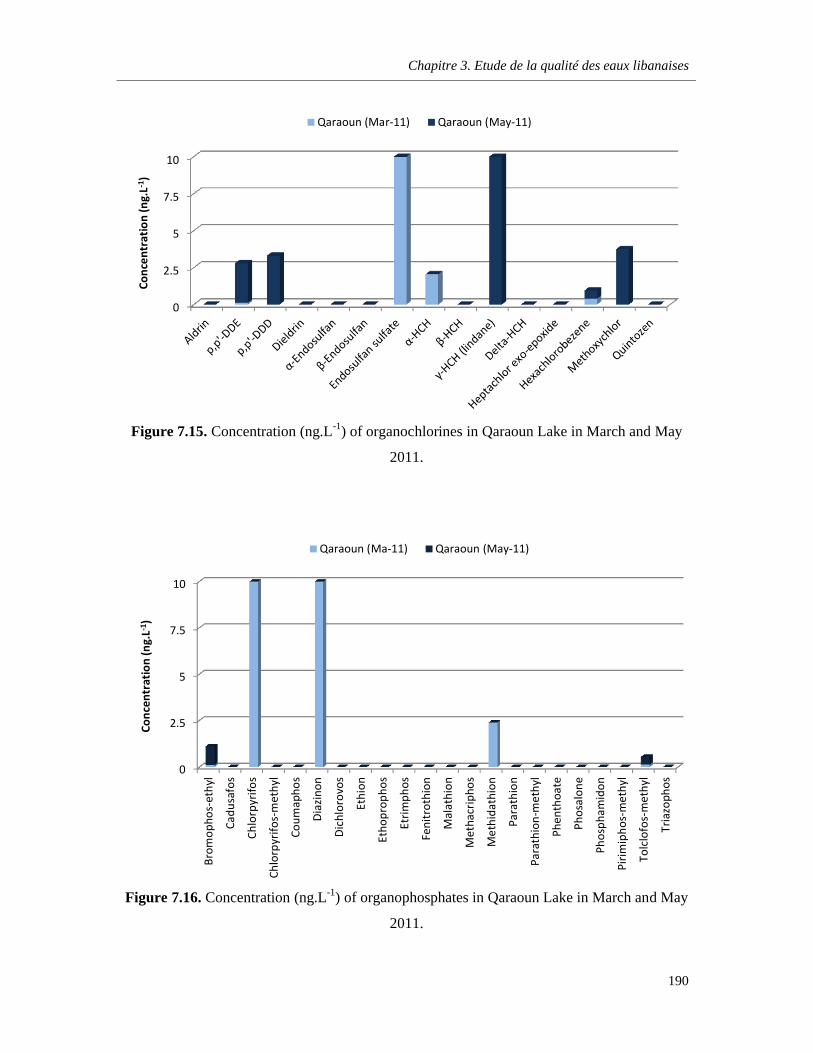
Chapitre 3. Etude de la qualité des eaux libanaises
190
Figure 7.15. Concentration (ng.L-1) of organochlorines in Qaraoun Lake in March and May
2011.
Figure 7.16. Concentration (ng.L-1) of organophosphates in Qaraoun Lake in March and May
2011.
0
2.5
5
7.5
10Co
ncen
trat
ion
(ng.
L-1)
Qaraoun (Mar-11) Qaraoun (May-11)
0
2.5
5
7.5
10
Brom
opho
s-et
hyl
Cadu
safo
s
Chlo
rpyr
ifos
Chlo
rpyr
ifos-
met
hyl
Coum
apho
s
Dia
zino
n
Dic
hlor
ovos
Ethi
on
Etho
prop
hos
Etrim
phos
Feni
trot
hion
Mal
athi
on
Met
hacr
ipho
s
Met
hida
thio
n
Para
thio
n
Para
thio
n-m
ethy
l
Phen
thoa
te
Phos
alon
e
Phos
pham
idon
Pirim
ipho
s-m
ethy
l
Tolc
lofo
s-m
ethy
l
Tria
zoph
os
Conc
entr
atio
n (n
g.L-1
)
Qaraoun (Ma-11) Qaraoun (May-11)
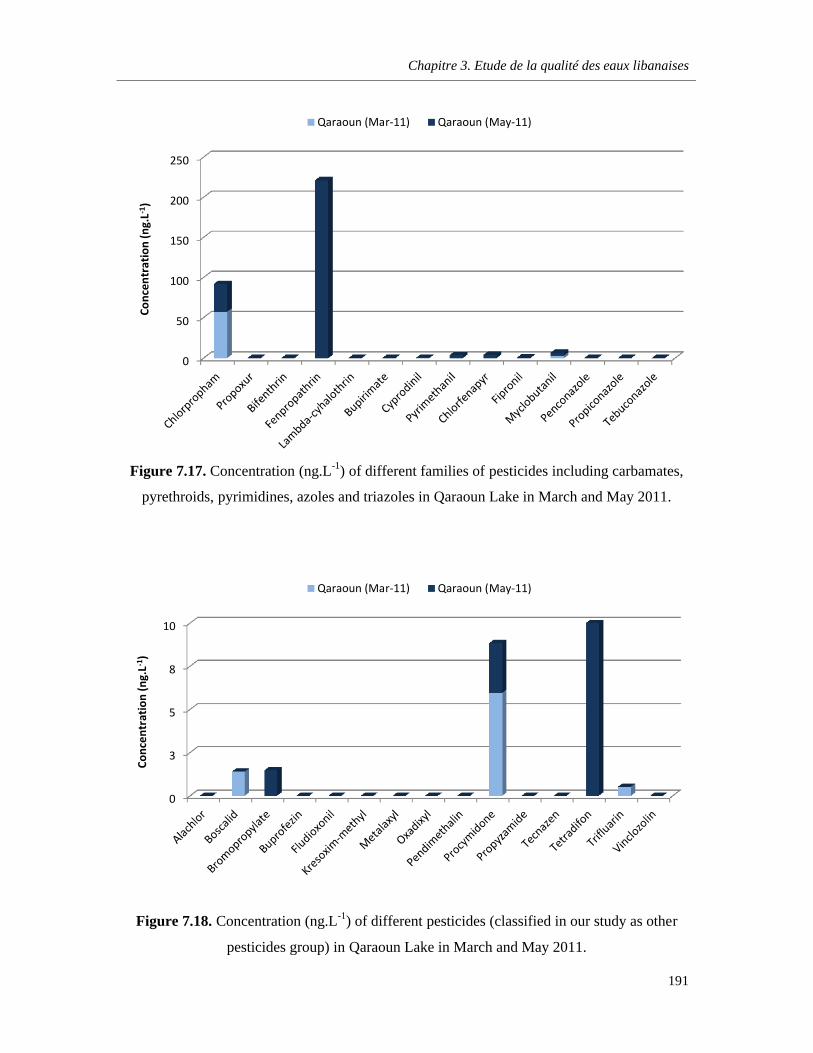
Chapitre 3. Etude de la qualité des eaux libanaises
191
Figure 7.17. Concentration (ng.L-1) of different families of pesticides including carbamates,
pyrethroids, pyrimidines, azoles and triazoles in Qaraoun Lake in March and May 2011.
Figure 7.18. Concentration (ng.L-1) of different pesticides (classified in our study as other
pesticides group) in Qaraoun Lake in March and May 2011.
0
50
100
150
200
250Co
ncen
trat
ion
(ng.
L-1)
Qaraoun (Mar-11) Qaraoun (May-11)
0
3
5
8
10
Conc
entr
atio
n (n
g.L-1
)
Qaraoun (Mar-11) Qaraoun (May-11)
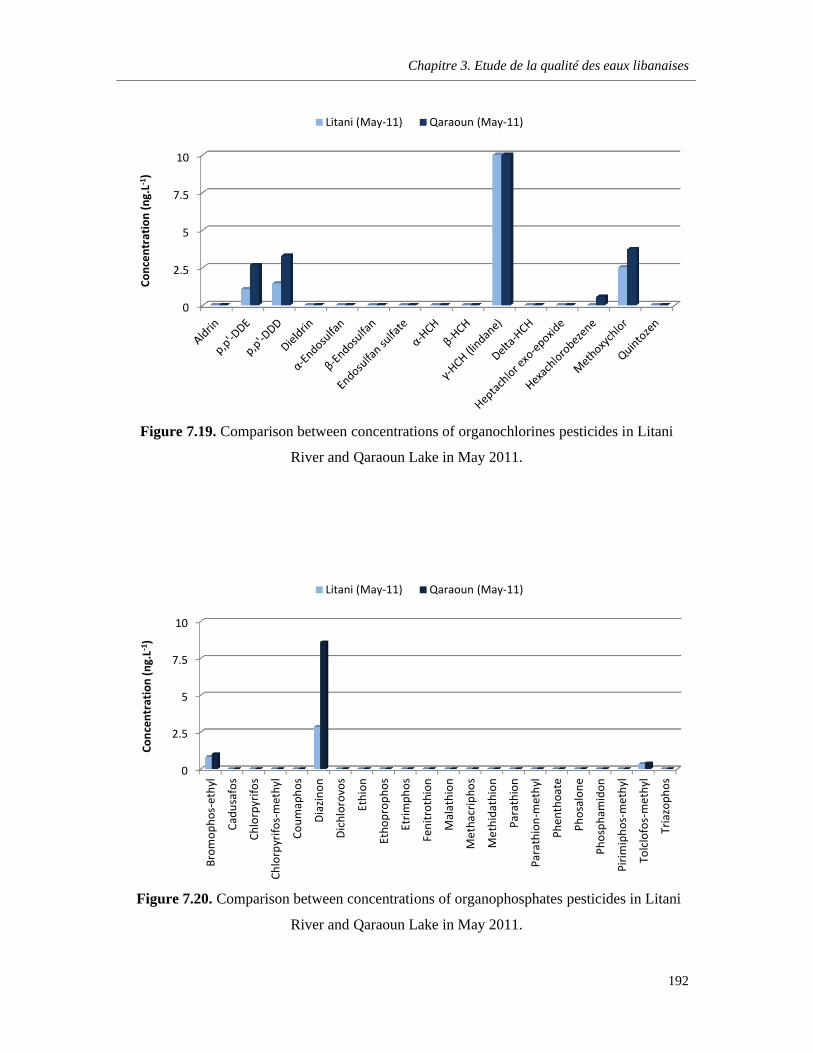
Chapitre 3. Etude de la qualité des eaux libanaises
192
Figure 7.19. Comparison between concentrations of organochlorines pesticides in Litani
River and Qaraoun Lake in May 2011.
Figure 7.20. Comparison between concentrations of organophosphates pesticides in Litani
River and Qaraoun Lake in May 2011.
0
2.5
5
7.5
10Co
ncen
trat
ion
(ng.
L-1)
Litani (May-11) Qaraoun (May-11)
0
2.5
5
7.5
10
Brom
opho
s-et
hyl
Cadu
safo
s
Chlo
rpyr
ifos
Chlo
rpyr
ifos-
met
hyl
Coum
apho
s
Dia
zino
n
Dic
hlor
ovos
Ethi
on
Etho
prop
hos
Etrim
phos
Feni
trot
hion
Mal
athi
on
Met
hacr
ipho
s
Met
hida
thio
n
Para
thio
n
Para
thio
n-m
ethy
l
Phen
thoa
te
Phos
alon
e
Phos
pham
idon
Pirim
ipho
s-m
ethy
l
Tolc
lofo
s-m
ethy
l
Tria
zoph
os
Conc
entr
atio
n (n
g.L-1
)
Litani (May-11) Qaraoun (May-11)
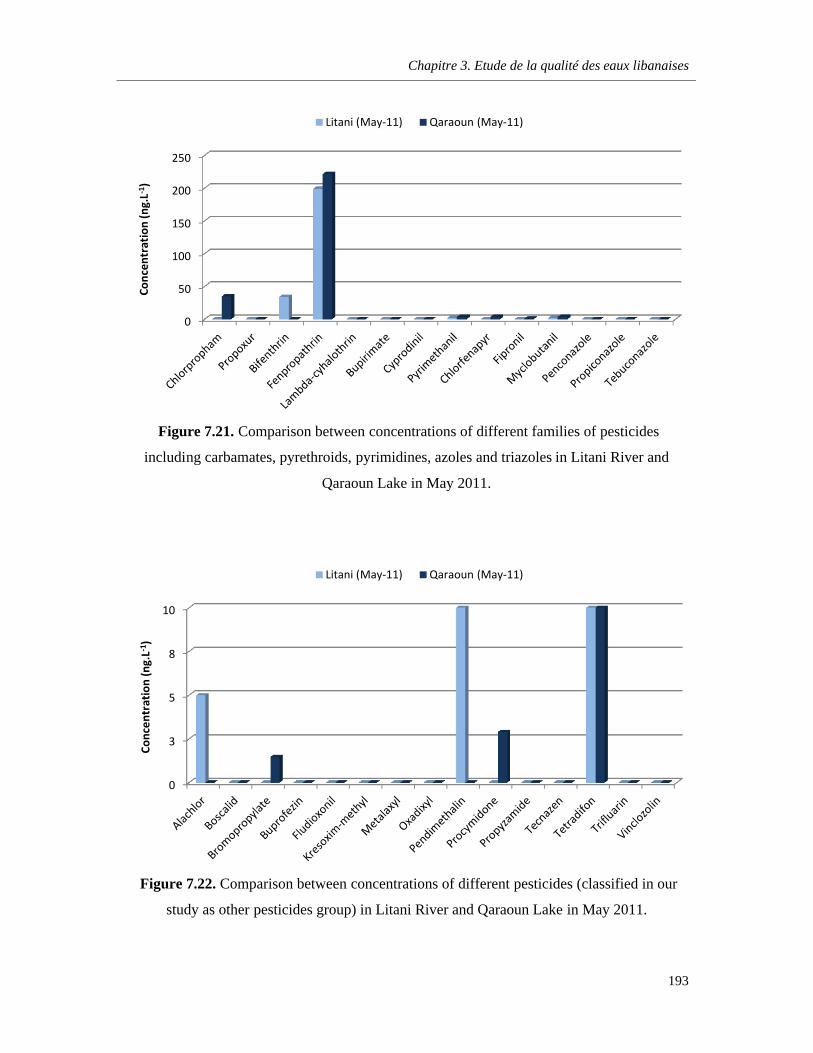
Chapitre 3. Etude de la qualité des eaux libanaises
193
Figure 7.21. Comparison between concentrations of different families of pesticides
including carbamates, pyrethroids, pyrimidines, azoles and triazoles in Litani River and
Qaraoun Lake in May 2011.
Figure 7.22. Comparison between concentrations of different pesticides (classified in our
study as other pesticides group) in Litani River and Qaraoun Lake in May 2011.
0
50
100
150
200
250Co
ncen
trat
ion
(ng.
L-1)
Litani (May-11) Qaraoun (May-11)
0
3
5
8
10
Conc
entr
atio
n (n
g.L-1
)
Litani (May-11) Qaraoun (May-11)
Chapitre 3. Etude de la qualité des eaux libanaises
194
References
Abou Fakhr I., Abou Jaoudeh Y., Asta J., 1995. Usage des pesticides au Liban. Ministery of
Agriculture Report, Beirut.
Bester K., Huhnerfuss H., Neudorf B., Thiemann W., 1995. Atmospheric deposition of
triazine herbicides in Northern Germany and The German Bight (North Sea).
Chemosphere 30: 1639-1653.
Bidleman T., Walla, M.D., Roura R., Carr E., Schmidt S., 1993. Organochlorine pesticides in
the atmosphere of the Southern Ocean and Antarctica. Marine Pollution Bulletin
26:258-262.
Biziuk M., Przyjazny A., Czerwmskl J., Wiergowski M., 1996. Occurrence and determination
of pesticides in natural and treated waters. Journal of Chromatography A 754:103-123.
Buser H.R., 1990. Atrazine and others trazine herbicides in lakes and in rain in Switzerland.
Environmental Science and Technology 24:1049-1058.
Chapman D.V., 1987. Pesticides in the Aquatic Environment. A global assessment of use and
effects, Monitoring and Assessment Research Center, Report No. 39, King's College
London, University of London, London.
Chernyak S.M., Rice C.P., McConnell L.L., 1996. Evidence of currently-used pesticides in
air, ice, fog, seawater and surface microlayer in the Bering and Chukchi Seas. Marine
Pollution Bulletin 32:410-419.
Chevreuil M., Garmouma M., Teil M.J., Chesteriko A., 1996. Occurrence of organochlorines
(PCBs, pesticides) and herbicides (triazines, phenylureas) in the atmosphhere and in the
fallout from urban}rural stations of the Paris area. Science of the Total Environment
182, 25-37.
El-Fadel M., Zeinati M., Jamali D., 2000. Water resources in Lebanon: characterization,
water balance, and constraints. Water Resources Development 16(4):619–642.
European Union (EU), 1998. Council Directive 98/83/EC of 3 November 1998 on the quality
of water intended for human consumption.
Chapitre 3. Etude de la qualité des eaux libanaises
195
European Union (EU), 2001. Decision 2455/2001/EC establishing a list of priority substances
in the field of water policy. Official Journal of the European Communities. L 331,
15.12.2001.
European Union (EU), 2008. Directive 2008/105/EC of European Parliament and Council on
environmental quality standards in the field of water policy, amending and
subsequently repealing Council Directives 82/176/EEC, 83/513/EEC, 84/156/EEC,
84/419/EEC, 86/280/EEC and amending Directive 2000/60/EC”, OJ L348, p.84-97,
24.12.2008.
Geahchan A., Abi Zeid Daou A.. Photosanitary Products Repertory. Beirut, APL, 1995.
Huskes R., Levsen K., 1997. Pesticides in rain. Chemosphere 35:3013-3024.
Jurdi M., 1992. A national study of the quality of potable water in Lebanon. In Proceedings
of the National Workshop of the Status of Water in Lebanon. United Nations
International Children’s Emergency Fund (UNICEF), Beirut, Lebanon, pp. 145–173 (in
Arabic).
Jurdi M., Korfali S. I., Karahagopian Y., Davies B., 2001. A prototype study for the
management of surface water resources. Water Policy 3:41–46.
Jurdi M., Korfali, S. Karahagopian, Y., Davies B., 2002. Evaluation of water quality of the
Qaraaoun Reservoir, Lebanon: suitability for multipurpose usage. Environmental
Monitoring and Assessment 77:11–30.
Korfali S. I. and Davies B. E., 2003. A Comparison of metals in sediments and water in the
River Nahr-Ibrahim, Lebanon:1996 and 1999. Environmental Geochemistry and Health
25(1):41-50.
Lebanese Government, 1982. Conditions for the authorization of pesticides’ importation,
selling, preparation, and use in Lebanon. Decree 5029, Beirut.
Lode O., Eklo O.M., Holen B., Svensen A., Johnsen A.M., 1995. Pesticides in precipitation
in Norway. Science of the Total Environment 160/161:421-431.
Millet M., Wortham H., Sanusi A., Mirabel P., 1997. Atmospheric contamination by
pesticides: Determination in the liquid, gaseous and particulate phases. Environmental
Science and Pollution Research 3:172-180.
Chapitre 3. Etude de la qualité des eaux libanaises
196
Trabulsi A., 1991. Pollution des aliments et cultures traitées par les pesticides. In: Conference
de L’homme et de l’Environnement, Beirut.
Trevisan M., Montepiani C., Ragozza L., Bartoletti C., Ioannili E., Del Re A.A.M., 1993.
Pesticides in rainfall and air in Italy. Environmental Pollution 80:31-39.
United States Environmental Protection Agency (US-EPA), 1994. Metalaxyl. Prevention,
Pesticides And Toxic Substances (7508W). EPA-738-F-94-013.
water.epa.gov/scitech/methods/cwa/pollutants.cfm
Chapitre 3. Etude de la qualité des eaux libanaises
197
Conclusion
Ce chapitre expose les résultats des analyses des HAP et des pesticides dans l’eau en
utilisant les diverses méthodes d’analyses appliquées ou élaborées au laboratoire. Ces deux
familles de polluants sont parmi les polluants organiques les plus surveillés dans l’eau et sont
responsables des divers problèmes de la pollution de l’environnement au Liban.
Les niveaux de présence des HAP et de pesticides ont été déterminés sur des
échantillons d’origines diverses au Liban, comme les eaux de pluie, les eaux de surface, les
eaux souterraines et les eaux potables. Ces résultats constituent un premier pas pour
l’établissement d’un programme de suivi de la contamination organique dans les eaux
libanaises.
Concernant les eaux de pluie, les résultats des analyses réalisés à Beyrouth ont montré
que les HAP légers, les plus volatils et les plus solubles sont abondants durant les mois les
plus froids de l’hiver, janvier et février. En revanche, les niveaux des HAP lourds
cancérigènes étaient plus faibles et diminuaient au cours des mois pluvieux. Une évaluation
de la distribution de certains composés isomères a permis de relever que la présence des HAP
dans l’atmosphère de la ville de Beyrouth est d’origine, essentiellement, pyrolytique
provenant de la combustion de combustibles fossiles.
Pour les analyses de pesticides, une grande partie des produits recherchés n’a pas été
détectée dans les eaux analysées du fait que ces produits sont très peu utilisés ou leur
utilisation est spatio-temporelle. Le chloropropham et le fenpropathrin ont été détectés avec
des concentrations importantes (30-200 ng.L-1) dans les deux plus grands systèmes d'eau de
surface libanais: Le lac Qaraoun et la rivière Litani. Une 2ème catégorie de pesticides a été
détectée à des niveaux faibles dans les échantillons d’eau (5 - 10 ng.L-1); ces sont les
composés rémanents qui peuvent être transportés sur de longues distances et ont tendance de
persister dans les différents compartiments de l’environnement, comme le DDD, le DDE, le
dieldrin, l’hexachlorobenzene et le diazinon. La présence de ces composés dans la plupart des
Chapitre 3. Etude de la qualité des eaux libanaises
198
échantillons analysés indiquent une possible contamination chronique de nos systèmes d'eau,
surtout les eaux potables.
199
Conclusion et Perspectives
Conclusion et Perspectives
200
Les milieux aquatiques naturels subissent une pression anthropique croissante et
reçoivent des quantités remarquables des micropolluants organiques issus de l’activité
humaine, industrielle et agricole. Des suivis environnementaux permanents se sont alors
avérés nécessaires afin de se progresser dans la compréhension des origines et des
conséquences de la présence de ces polluants.
Du fait de leurs faibles teneurs dans l’eau, leur analyse nécessite des méthodes de
préparation qui sont relativement longues et fastidieuses et des techniques analytiques à la
fois spécifiques et sensibles. Les méthodes de prétraitement et d’analyse appliquées pour
l’analyse des HAPs dans l’eau sont relativement longues et consommatrices des quantités
importantes des solvants organiques.
Ces travaux de thèse réalisés en collaboration étroite entre le LAPPO et le LPTC ont
permis d’abord le développement d’une nouvelle méthode rapide et environnementale de
prétraitement de l’échantillon aqueux. La nouvelle méthode élaborée qui est basée sur la
centrifugation couplée à la SPE pour l’analyse des 16 HAP identifiés comme polluants
prioritaires par l’US-EPA, a permis de réduire considérablement le temps de préparation par
rapport à la méthode classique et d’économiser l’utilisation et le rejet des solvants
organiques, en réduisant presque 10 fois les volumes nécessaires à l’obtention des
rendements de récupération variant entre 61 et 94% pour l’ensemble des 16 HAP analysés.
Après une validation complète de la méthode centrifugation-SPE et l’obtention des
valeurs optimales pour les divers paramètres affectant le transfert des HAP vers le solvant
organique à analyser, nous avons ciblé nos efforts sur le développement de la méthode
d’analyse souvent appliquée la GC-MS. Afin d’améliorer les seuils de détection et de limiter
les discriminations entre les HAP de masses moléculaires variées, nous avons remplacé
l’injection splitless utilisée dans la méthode classique par l’injection à température
programmable (PTV). L’optimisation des paramètres de l’injection a été faite par une
démarche basée sur l’utilisation des plans d’expériences; dans un premier temps, l’utilisation
du plan de type Plackett-Burman a permis de classer les paramètres par ordre d’importance;
dans un second temps, seuls les paramètres influents ont été investigués grâce au plan de type
Box-Behnken pour les surfaces de réponse qui a abouti à la modélisation des phénomènes
étudiés.
Conclusion et Perspectives
201
La validation du processus analytique global a mis en évidence les précisions
analytiques des mesures, les domaines de linéarité et les limites de détection et de
quantification suffisamment satisfaisants pour des mesures fiables de ces espèces dans l’eau.
Cette nouvelle méthode développée apparaît donc comme assez sensible pour analyser les
ultra-traces des HAP dans l’eau; une amélioration de 2 à plus de 100 fois dans les rapports
Signal/Bruit a été atteinte par rapport au système d’injection par splitless.
La réussite de la stratégie analytique mise en place pour l’analyse des HAP dans l’eau
a été transférée à une autre famille de polluants organiques qui présente un problème majeur
pour la pollution de l’eau: les pesticides. La méthodologie allant de l’extraction SPE
combinée avec la centrifugation en passant par l’analyse par GC-MS a été développée pour la
quantification de 67 produits phytosanitaires dans l’eau. Les principaux paramètres
susceptibles d’influer sur l’efficacité de la méthode SPE à extraire les différentes familles de
pesticides étudiées (organochlorés, organophosphorés, carbamates, pyréthrinoïdes,
pyrimidines, azoles, triazoles, etc..) à partir de l’eau ont été optimisés. En particulier,
l’influence de l’utilisation de la centrifugation dans les deux étapes de l’élution et du séchage
a été évaluée. Ainsi, les conditions analytiques définies ont été validées pour l’extraction des
pesticides recherchés avec des rendements satisfaisants (> 60%).
Le deuxième volet de ces travaux a été consacré à l’application des méthodes
développées aux laboratoires pour déterminer les niveaux de présence des HAP et de
pesticides dans des échantillons d’origines diverses au Liban, comme les eaux de pluie, les
eaux de surface, les eaux souterraines et les eaux potables.
Les résultats des analyses réalisés à Beyrouth ont montré que les HAP légers, les plus
volatils et les plus solubles sont abondants dans les eaux de pluie durant les mois les plus
froids de l’hiver, janvier et février. En revanche, les niveaux des HAP lourds cancérigènes
étaient plus faibles et diminuaient au cours des mois pluvieux. Une évaluation de la
distribution de certains composés isomères a permis de relever que la présence des HAP dans
l’atmosphère de la ville de Beyrouth est d’origine, essentiellement, pyrolytique provenant de
la combustion de combustibles fossiles.
Pour les analyses de pesticides, une grande partie des produits sélectionnés n’a pas été
détectée dans les eaux analysées du fait que ces produits sont très peu utilisés ou leur
utilisation est spatio-temporelle. Par exemple, le chloropropham et le fenpropathrin ont été
Conclusion et Perspectives
202
détectés avec des niveaux plus élevés que les autres (30-200 ng.L-1) pendant le mois de Mai
2011 dans deux des plus grands systèmes d'eau de surface libanais : Le lac Qaraoun et la
rivière Litani. Une 2ème catégorie de pesticides a été détectée à des niveaux faibles dans les
échantillons d’eau (5-10 ng.L-1); ces sont les composés rémanents qui peuvent être
transportés sur de longues distances et ont tendance de persister dans les différents
compartiments de l’environnement, comme le DDD, le DDE, le dieldrin,
l’hexachlorobenzene et le diazinon. La présence de ces composés dans la plupart des
échantillons analysés indiquent une possible contamination chronique de nos systèmes d'eau,
surtout les eaux potables.
Ces travaux de thèse réalisés pour la première fois au Liban ont permis la rédaction de
plusieurs articles scientifiques ; le 1er article est paru dans le Journal of Agricultural and Food
Chemistry, le 2ème est accepté dans le journal Talanta et les quatre restants sont rédigés pour
être envoyés vers des journaux spécialisés. Egalement, les travaux de cette thèse ont été
présentés dans plusieurs congrès scientifiques nationaux et internationaux sous forme de 2
communications orales et 3 communications par affiche.
Il est important de signaler que les méthodes optimisées sont utilisées actuellement en
analyse de routine dans notre laboratoire, bien entendu, l’application de la nouvelle démarche
centrifugation-SPE-PTV-GC-MS est promettante. D’autres familles de contaminants
organiques dans l’eau (produits pharmaceutiques, PCB, etc) peuvent être l’objet du
développement des nouvelles méthodes d’analyse dont les objectifs d’avoir des méthodes
multiresidus rapides, sensibles et environnementales.
Ces travaux offrent par ailleurs une première estimation de la qualité des eaux
libanaises quant au niveau de leur contamination pour les HAP et les pesticides. Le nombre
limité des échantillons analysés durant la période de la thèse donne une idée des
concentrations sur les sites étudiés et sur les sources de contamination. Des mesures
supplémentaires sur une longue période et sur l’ensemble du territoire libanais donneront des
informations complètes sur l’état de la qualité des eaux libanaises au niveau de la
contamination par les pesticides et par les HAP.
203
Annexes
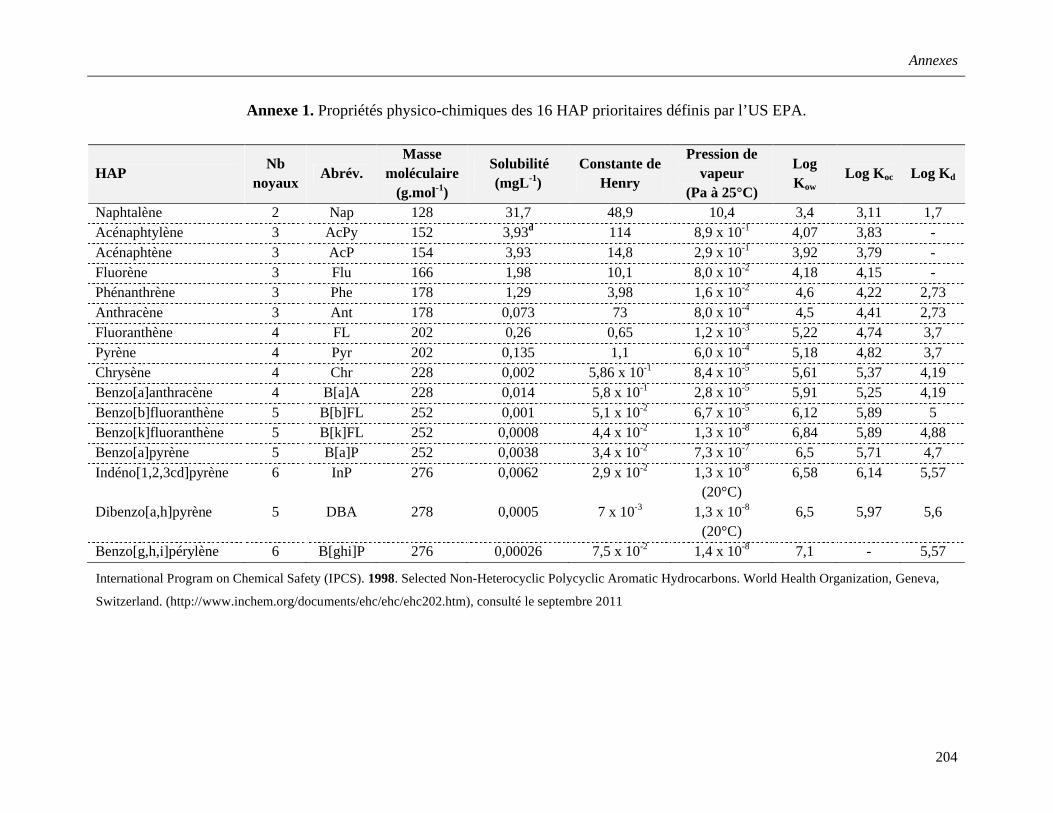
Annexes
204
Annexe 1. Propriétés physico-chimiques des 16 HAP prioritaires définis par l’US EPA.
International Program on Chemical Safety (IPCS). 1998. Selected Non-Heterocyclic Polycyclic Aromatic Hydrocarbons. World Health Organization, Geneva,
Switzerland. (http://www.inchem.org/documents/ehc/ehc/ehc202.htm), consulté le septembre 2011
HAPNb
noyauxAbrév.
Masse moléculaire
(g.mol-1)
Solubilité (mgL-1)
Constante de Henry
Pression de vapeur
(Pa à 25°C)
Log Kow
Log Koc Log Kd
Naphtalène 2 Nap 128 31,7 48,9 10,4 3,4 3,11 1,7Acénaphtylène 3 AcPy 152 3,93d 114 8,9 x 10⁻¹ 4,07 3,83 -Acénaphtène 3 AcP 154 3,93 14,8 2,9 x 10⁻¹ 3,92 3,79 -Fluorène 3 Flu 166 1,98 10,1 8,0 x 10⁻² 4,18 4,15 -Phénanthrène 3 Phe 178 1,29 3,98 1,6 x 10⁻² 4,6 4,22 2,73Anthracène 3 Ant 178 0,073 73 8,0 x 10⁻⁴ 4,5 4,41 2,73Fluoranthène 4 FL 202 0,26 0,65 1,2 x 10⁻³ 5,22 4,74 3,7Pyrène 4 Pyr 202 0,135 1,1 6,0 x 10⁻⁴ 5,18 4,82 3,7Chrysène 4 Chr 228 0,002 5,86 x 10⁻¹ 8,4 x 10⁻⁵ 5,61 5,37 4,19Benzo[a]anthracène 4 B[a]A 228 0,014 5,8 x 10⁻¹ 2,8 x 10⁻⁵ 5,91 5,25 4,19Benzo[b]fluoranthène 5 B[b]FL 252 0,001 5,1 x 10⁻² 6,7 x 10⁻⁵ 6,12 5,89 5Benzo[k]fluoranthène 5 B[k]FL 252 0,0008 4,4 x 10⁻² 1,3 x 10⁻⁸ 6,84 5,89 4,88Benzo[a]pyrène 5 B[a]P 252 0,0038 3,4 x 10⁻² 7,3 x 10⁻⁷ 6,5 5,71 4,7Indéno[1,2,3cd]pyrène 6 InP 276 0,0062 2,9 x 10⁻² 1,3 x 10⁻⁸
(20°C)6,58 6,14 5,57
Dibenzo[a,h]pyrène 5 DBA 278 0,0005 7 x 10⁻³ 1,3 x 10⁻⁸
(20°C)6,5 5,97 5,6
Benzo[g,h,i]pérylène 6 B[ghi]P 276 0,00026 7,5 x 10⁻² 1,4 x 10⁻⁸ 7,1 - 5,57
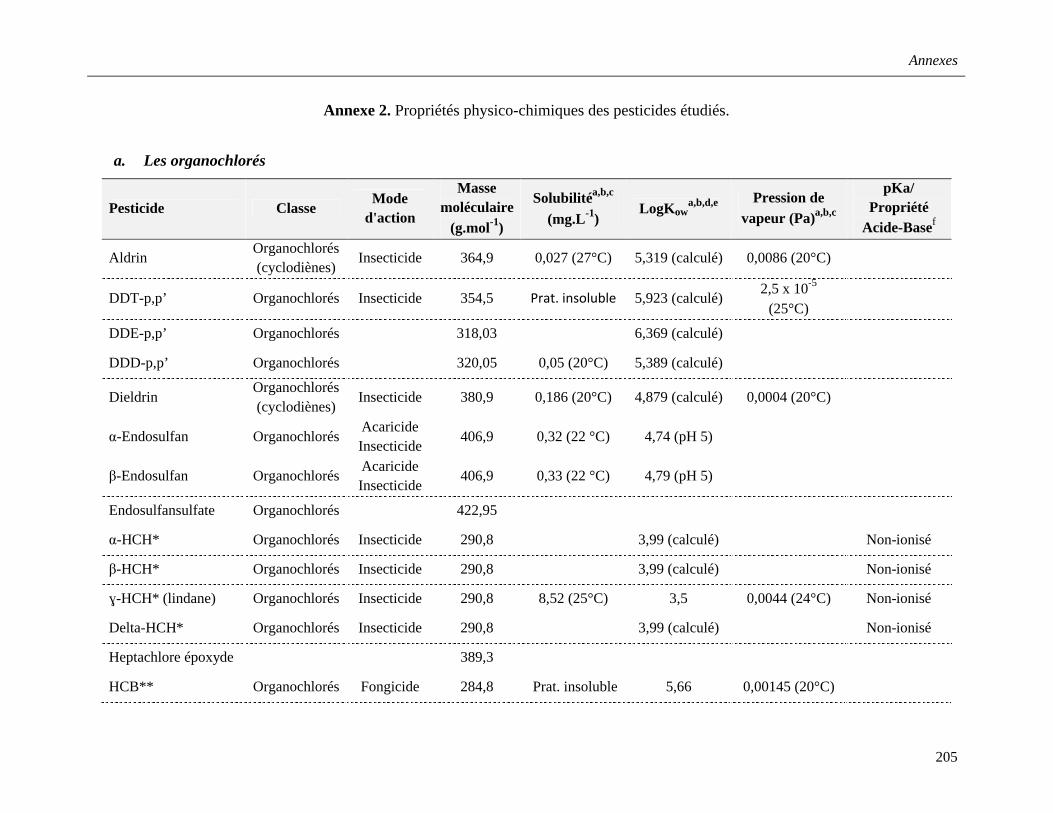
Annexes
205
Annexe 2. Propriétés physico-chimiques des pesticides étudiés.
a. Les organochlorés
Pesticide ClasseMode
d'action
Masse moléculaire
(g.mol-1)
Solubilitéa,b,c
(mg.L-1)LogKow
a,b,d,e Pression de
vapeur (Pa)a,b,c
pKa/ Propriété
Acide-Basef
AldrinOrganochlorés (cyclodiènes)
Insecticide 364,9 0,027 (27°C) 5,319 (calculé) 0,0086 (20°C)
DDT-p,p’ Organochlorés Insecticide 354,5 Prat. insoluble 5,923 (calculé)2,5 x 10⁻⁵
(25°C)
DDE-p,p’ Organochlorés 318,03 6,369 (calculé)
DDD-p,p’ Organochlorés 320,05 0,05 (20°C) 5,389 (calculé)
DieldrinOrganochlorés (cyclodiènes)
Insecticide 380,9 0,186 (20°C) 4,879 (calculé) 0,0004 (20°C)
α-Endosulfan OrganochlorésAcaricide Insecticide
406,9 0,32 (22 °C) 4,74 (pH 5)
β-Endosulfan OrganochlorésAcaricide Insecticide
406,9 0,33 (22 °C) 4,79 (pH 5)
Endosulfansulfate Organochlorés 422,95
α-HCH* Organochlorés Insecticide 290,8 3,99 (calculé) Non-ionisé
β-HCH* Organochlorés Insecticide 290,8 3,99 (calculé) Non-ionisé
ɣ-HCH* (lindane) Organochlorés Insecticide 290,8 8,52 (25°C) 3,5 0,0044 (24°C) Non-ionisé
Delta-HCH* Organochlorés Insecticide 290,8 3,99 (calculé) Non-ionisé
Heptachlore époxyde 389,3
HCB** Organochlorés Fongicide 284,8 Prat. insoluble 5,66 0,00145 (20°C)
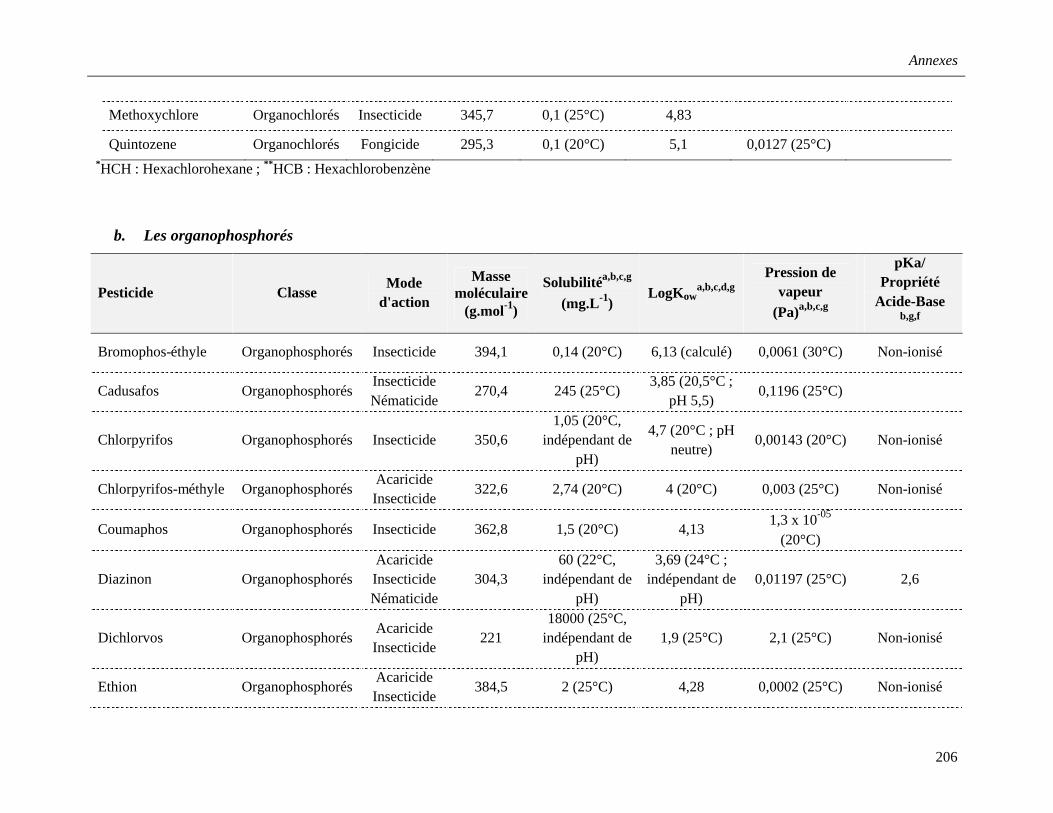
Annexes
206
Methoxychlore Organochlorés Insecticide 345,7 0,1 (25°C) 4,83
Quintozene Organochlorés Fongicide 295,3 0,1 (20°C) 5,1 0,0127 (25°C)*HCH : Hexachlorohexane ; **HCB : Hexachlorobenzène
b. Les organophosphorés
Pesticide ClasseMode
d'action
Masse moléculaire
(g.mol-1)
Solubilitéa,b,c,g
(mg.L-1)LogKow
a,b,c,d,gPression de
vapeur
(Pa)a,b,c,g
pKa/ Propriété
Acide-Base b,g,f
Bromophos-éthyle Organophosphorés Insecticide 394,1 0,14 (20°C) 6,13 (calculé) 0,0061 (30°C) Non-ionisé
Cadusafos OrganophosphorésInsecticideNématicide
270,4 245 (25°C)3,85 (20,5°C ;
pH 5,5)0,1196 (25°C)
Chlorpyrifos Organophosphorés Insecticide 350,61,05 (20°C,
indépendant de pH)
4,7 (20°C ; pH neutre)
0,00143 (20°C) Non-ionisé
Chlorpyrifos-méthyle OrganophosphorésAcaricideInsecticide
322,6 2,74 (20°C) 4 (20°C) 0,003 (25°C) Non-ionisé
Coumaphos Organophosphorés Insecticide 362,8 1,5 (20°C) 4,131,3 x 10-05
(20°C)
Diazinon OrganophosphorésAcaricideInsecticideNématicide
304,360 (22°C,
indépendant de pH)
3,69 (24°C ; indépendant de
pH)0,01197 (25°C) 2,6
Dichlorvos OrganophosphorésAcaricideInsecticide
22118000 (25°C,
indépendant de pH)
1,9 (25°C) 2,1 (25°C) Non-ionisé
Ethion OrganophosphorésAcaricideInsecticide
384,5 2 (25°C) 4,28 0,0002 (25°C) Non-ionisé
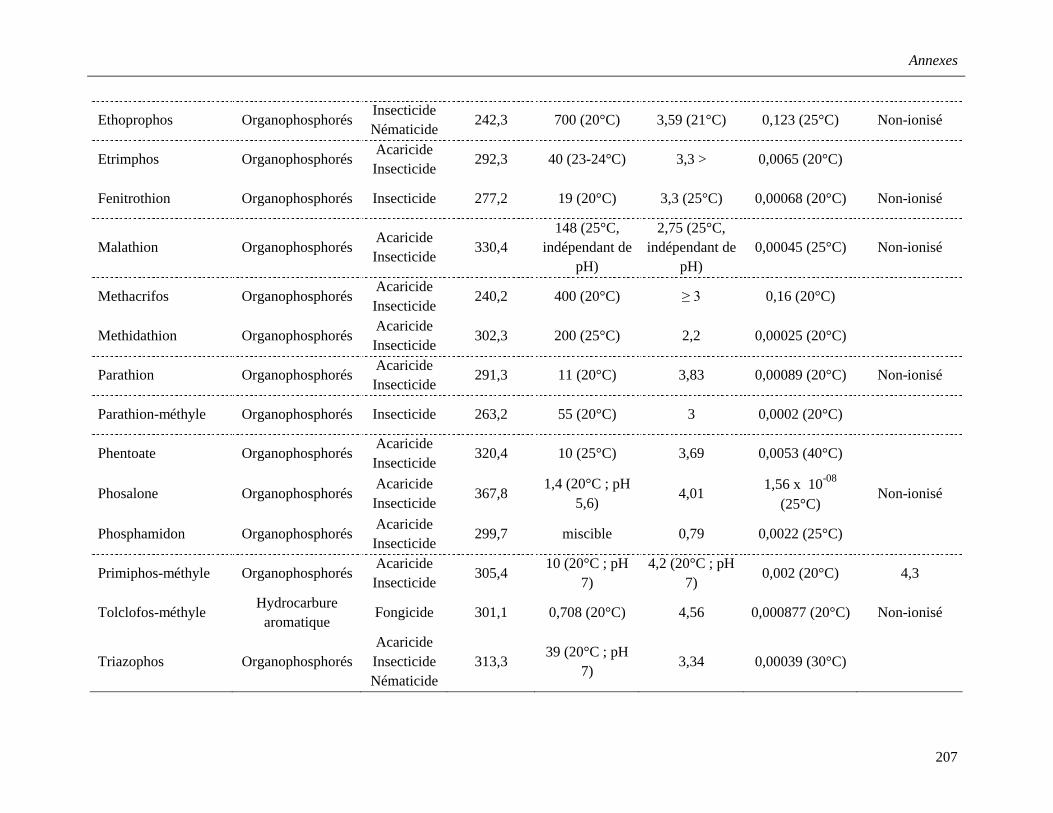
Annexes
207
Ethoprophos OrganophosphorésInsecticideNématicide
242,3 700 (20°C) 3,59 (21°C) 0,123 (25°C) Non-ionisé
Etrimphos OrganophosphorésAcaricideInsecticide
292,3 40 (23-24°C) 3,3 > 0,0065 (20°C)
Fenitrothion Organophosphorés Insecticide 277,2 19 (20°C) 3,3 (25°C) 0,00068 (20°C) Non-ionisé
Malathion OrganophosphorésAcaricideInsecticide
330,4148 (25°C,
indépendant de pH)
2,75 (25°C, indépendant de
pH)0,00045 (25°C) Non-ionisé
Methacrifos OrganophosphorésAcaricideInsecticide
240,2 400 (20°C) ≥ 3 0,16 (20°C)
Methidathion OrganophosphorésAcaricideInsecticide
302,3 200 (25°C) 2,2 0,00025 (20°C)
Parathion OrganophosphorésAcaricideInsecticide
291,3 11 (20°C) 3,83 0,00089 (20°C) Non-ionisé
Parathion-méthyle Organophosphorés Insecticide 263,2 55 (20°C) 3 0,0002 (20°C)
Phentoate OrganophosphorésAcaricideInsecticide
320,4 10 (25°C) 3,69 0,0053 (40°C)
Phosalone OrganophosphorésAcaricideInsecticide
367,81,4 (20°C ; pH
5,6)4,01
1,56 x 10-08
(25°C)Non-ionisé
Phosphamidon OrganophosphorésAcaricideInsecticide
299,7 miscible 0,79 0,0022 (25°C)
Primiphos-méthyle OrganophosphorésAcaricideInsecticide
305,410 (20°C ; pH
7)4,2 (20°C ; pH
7)0,002 (20°C) 4,3
Tolclofos-méthyleHydrocarbure
aromatiqueFongicide 301,1 0,708 (20°C) 4,56 0,000877 (20°C) Non-ionisé
Triazophos OrganophosphorésAcaricideInsecticideNématicide
313,339 (20°C ; pH
7)3,34 0,00039 (30°C)
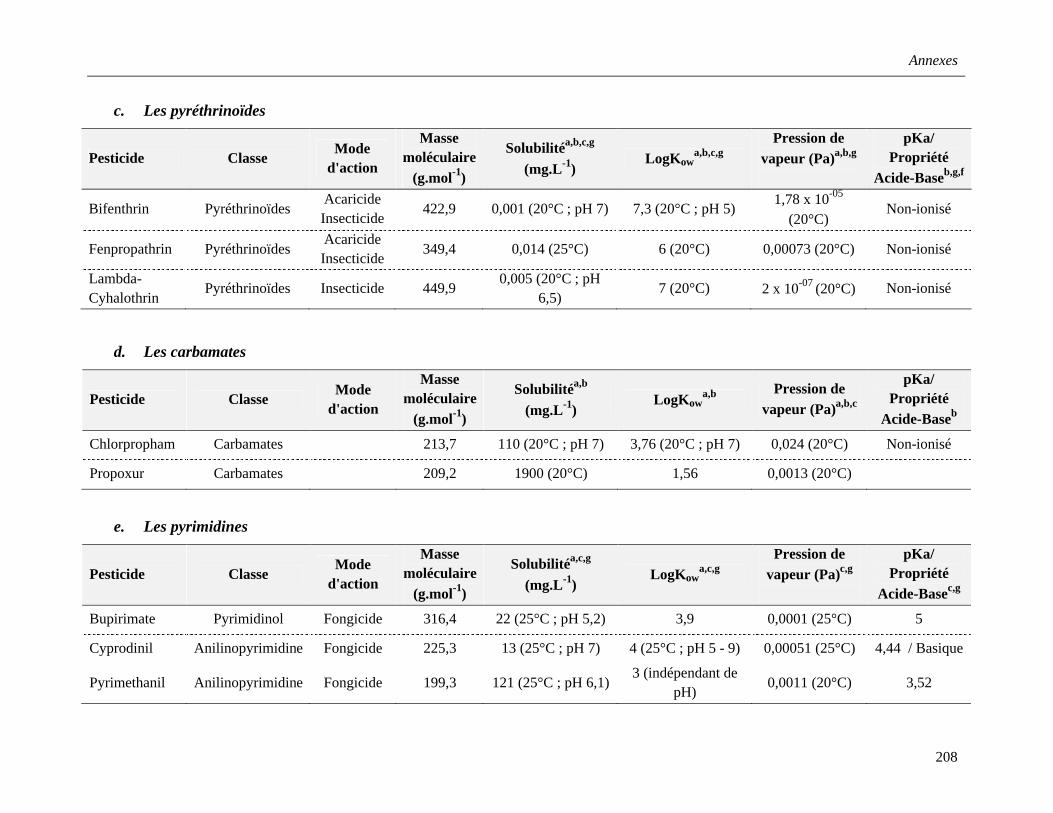
Annexes
208
c. Les pyréthrinoïdes
Pesticide ClasseMode
d'action
Masse moléculaire
(g.mol-1)
Solubilitéa,b,c,g
(mg.L-1)LogKow
a,b,c,gPression de
vapeur (Pa)a,b,gpKa/
Propriété
Acide-Baseb,g,f
Bifenthrin PyréthrinoïdesAcaricideInsecticide
422,9 0,001 (20°C ; pH 7) 7,3 (20°C ; pH 5)1,78 x 10-05
(20°C)Non-ionisé
Fenpropathrin PyréthrinoïdesAcaricideInsecticide
349,4 0,014 (25°C) 6 (20°C) 0,00073 (20°C) Non-ionisé
Lambda-Cyhalothrin
Pyréthrinoïdes Insecticide 449,90,005 (20°C ; pH
6,5)7 (20°C) 2 x 10-07 (20°C) Non-ionisé
d. Les carbamates
Pesticide ClasseMode
d'action
Masse moléculaire
(g.mol-1)
Solubilitéa,b
(mg.L-1)LogKow
a,b Pression de
vapeur (Pa)a,b,c
pKa/ Propriété
Acide-Baseb
Chlorpropham Carbamates 213,7 110 (20°C ; pH 7) 3,76 (20°C ; pH 7) 0,024 (20°C) Non-ionisé
Propoxur Carbamates 209,2 1900 (20°C) 1,56 0,0013 (20°C)
e. Les pyrimidines
Pesticide ClasseMode
d'action
Masse moléculaire
(g.mol-1)
Solubilitéa,c,g
(mg.L-1)LogKow
a,c,gPression de
vapeur (Pa)c,gpKa/
Propriété
Acide-Basec,g
Bupirimate Pyrimidinol Fongicide 316,4 22 (25°C ; pH 5,2) 3,9 0,0001 (25°C) 5
Cyprodinil Anilinopyrimidine Fongicide 225,3 13 (25°C ; pH 7) 4 (25°C ; pH 5 - 9) 0,00051 (25°C) 4,44 / Basique
Pyrimethanil Anilinopyrimidine Fongicide 199,3 121 (25°C ; pH 6,1)3 (indépendant de
pH)0,0011 (20°C) 3,52
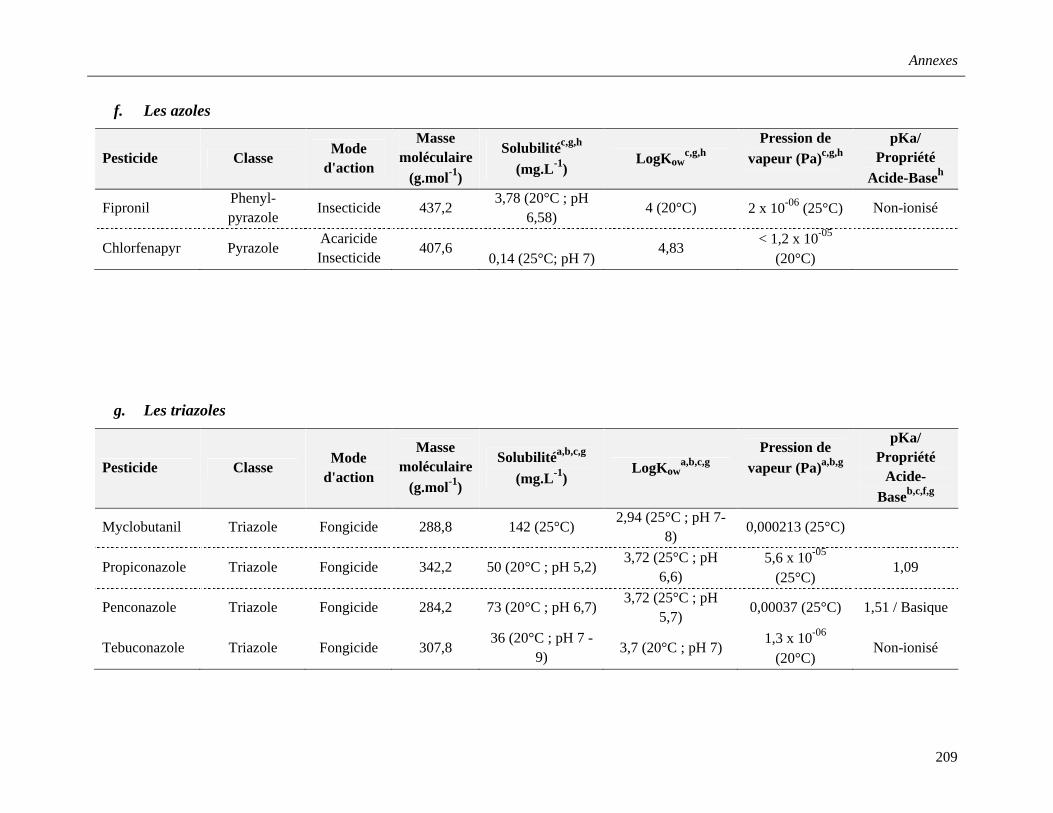
Annexes
209
f. Les azoles
Pesticide ClasseMode
d'action
Masse moléculaire
(g.mol-1)
Solubilitéc,g,h
(mg.L-1)LogKow
c,g,hPression de
vapeur (Pa)c,g,hpKa/
Propriété
Acide-Baseh
FipronilPhenyl-pyrazole
Insecticide 437,23,78 (20°C ; pH
6,58)4 (20°C) 2 x 10-06 (25°C) Non-ionisé
Chlorfenapyr PyrazoleAcaricide Insecticide
407,60,14 (25°C; pH 7)
4,83< 1,2 x 10-05
(20°C)
g. Les triazoles
Pesticide ClasseMode
d'action
Masse moléculaire
(g.mol-1)
Solubilitéa,b,c,g
(mg.L-1)LogKow
a,b,c,gPression de
vapeur (Pa)a,b,g
pKa/ Propriété
Acide-
Baseb,c,f,g
Myclobutanil Triazole Fongicide 288,8 142 (25°C)2,94 (25°C ; pH 7-
8)0,000213 (25°C)
Propiconazole Triazole Fongicide 342,2 50 (20°C ; pH 5,2)3,72 (25°C ; pH
6,6)5,6 x 10-05
(25°C)1,09
Penconazole Triazole Fongicide 284,2 73 (20°C ; pH 6,7)3,72 (25°C ; pH
5,7)0,00037 (25°C) 1,51 / Basique
Tebuconazole Triazole Fongicide 307,836 (20°C ; pH 7 -
9)3,7 (20°C ; pH 7)
1,3 x 10-06 (20°C)
Non-ionisé
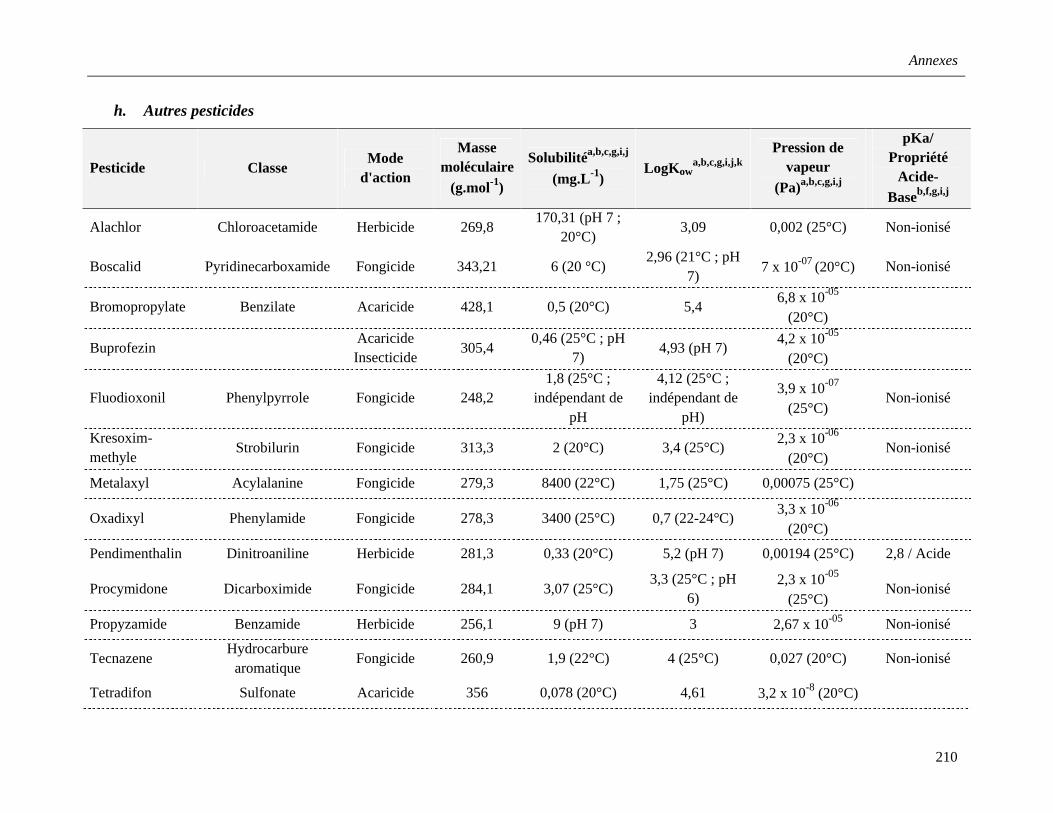
Annexes
210
h. Autres pesticides
Pesticide ClasseMode
d'action
Masse moléculaire
(g.mol-1)
Solubilitéa,b,c,g,i,j
(mg.L-1)LogKow
a,b,c,g,i,j,kPression de
vapeur
(Pa)a,b,c,g,i,j
pKa/ Propriété
Acide-
Baseb,f,g,i,j
Alachlor Chloroacetamide Herbicide 269,8170,31 (pH 7 ;
20°C)3,09 0,002 (25°C) Non-ionisé
Boscalid Pyridinecarboxamide Fongicide 343,21 6 (20 °C)2,96 (21°C ; pH
7)7 x 10-07 (20°C) Non-ionisé
Bromopropylate Benzilate Acaricide 428,1 0,5 (20°C) 5,46,8 x 10-05
(20°C)
BuprofezinAcaricideInsecticide
305,40,46 (25°C ; pH
7)4,93 (pH 7)
4,2 x 10-05 (20°C)
Fluodioxonil Phenylpyrrole Fongicide 248,21,8 (25°C ;
indépendant de pH
4,12 (25°C ; indépendant de
pH)
3,9 x 10-07
(25°C) Non-ionisé
Kresoxim-methyle
Strobilurin Fongicide 313,3 2 (20°C) 3,4 (25°C)2,3 x 10-06
(20°C) Non-ionisé
Metalaxyl Acylalanine Fongicide 279,3 8400 (22°C) 1,75 (25°C) 0,00075 (25°C)
Oxadixyl Phenylamide Fongicide 278,3 3400 (25°C) 0,7 (22-24°C) 3,3 x 10-06
(20°C)
Pendimenthalin Dinitroaniline Herbicide 281,3 0,33 (20°C) 5,2 (pH 7) 0,00194 (25°C) 2,8 / Acide
Procymidone Dicarboximide Fongicide 284,1 3,07 (25°C)3,3 (25°C ; pH
6)2,3 x 10-05
(25°C)Non-ionisé
Propyzamide Benzamide Herbicide 256,1 9 (pH 7) 3 2,67 x 10-05 Non-ionisé
TecnazeneHydrocarbure
aromatiqueFongicide 260,9 1,9 (22°C) 4 (25°C) 0,027 (20°C) Non-ionisé
Tetradifon Sulfonate Acaricide 356 0,078 (20°C) 4,61 3,2 x 10⁻⁸ (20°C)

Annexes
211
Trifluralin Dinitroaniline Herbicide 335,30,221 (20°C ;
pH 7)5,27 (20°C) 0,0095 (25°C) Non-ionisé
Vinclozolin Dicarboximide Fongicide 286,1 2,6 (20°C) 3 (pH 7) 0,00013 (20°C) Non-ionisé
a C. D. S. Tomlin, The e-Pesticide Manual, 2002, http://www.bcpc.org, 12th Edition, Version 2.2, The British Crop Protection Councilb European Commission - SANCO E3, EU Pesticides Database (17.03.2009), 2008, http://ec.europa.eu/sanco_pesticides/public/index.cfmc C. D. S. Tomlin, e-Pesticide Manual V5.0, 2009, 15th Edition, Version 5.0, The British Crop Protection Council, ISBN 978 1 901 396 19 5 d eMolecules, http://www.emolecules.com/e ChemSpider, ChemSpider - Building Community for Chemists, 2007, http://www.chemspider.com/, Royal Society of Chemistryf Terry R. Roberts, Metabolic Pathways of Agrochemicals - Part 2: Insecticides and Fungicides, 1999, The Royal Society of Chemistryg EFSA – PRAPeR, Conclusions of Pesticide Risk Assessment Peer Review Unit (PRAPeR) on active substances which have undergone the peer review process at EU level, http://www.efsa.europa.eu/EFSA/ScientificOpinionPublicationReport/efsa_locale1178620753812_Conclusions.htmh EFSA Provision of documents, Draft assessment reports, http://dar.efsa.europa.eu/dar-web/provisioni U. S. Environmental Protection Agency, Pesticides: Regulating Pesticides - Fact Sheets on New Active Ingredients, 2009, http://www.epa.gov/opprd001/factsheets/J JMPR / JMPS, List of Pesticides evaluated by JMPR and JMPS, 2008, Journal/Book/Website: http://www.fao.org/agriculture/crops/core-themes/theme/pests/pm/lpe/en/K Bundesamt für Verbraucherschutz und Lebensmittelsicherheit (BVL) – Pflanzenschutzmittel, Rückstandsanalytik für neue Wirkstoffe (ab 02/2002), 2005, http://www.bvl.bund.de/cln_027/nn_492020/DE/04__Pflanzenschutzmittel/06__RueckstaendeHoechstmengen/03__Rueckstandsanalytik/psm__rueckstAnalytik__node.html__nnn=true