Embed Size (px)
Citation preview
Injecting biomethane into the grid Dutch example – How to deal with capacity limits of the DSO grid?
Anna Butenko, Johan Holstein, Maroeska Boots Wednesday 14 November 2012
Outline Introducing DNV KEMA Energy & Sustainability
Renewable energy, biogas and biomethane in the Netherlands
Biomethane grid injection
Options for accommodating biomethane in the grid
Conclusion
Injecting biomethane into the grid 2 Wednesday 14 November 2012
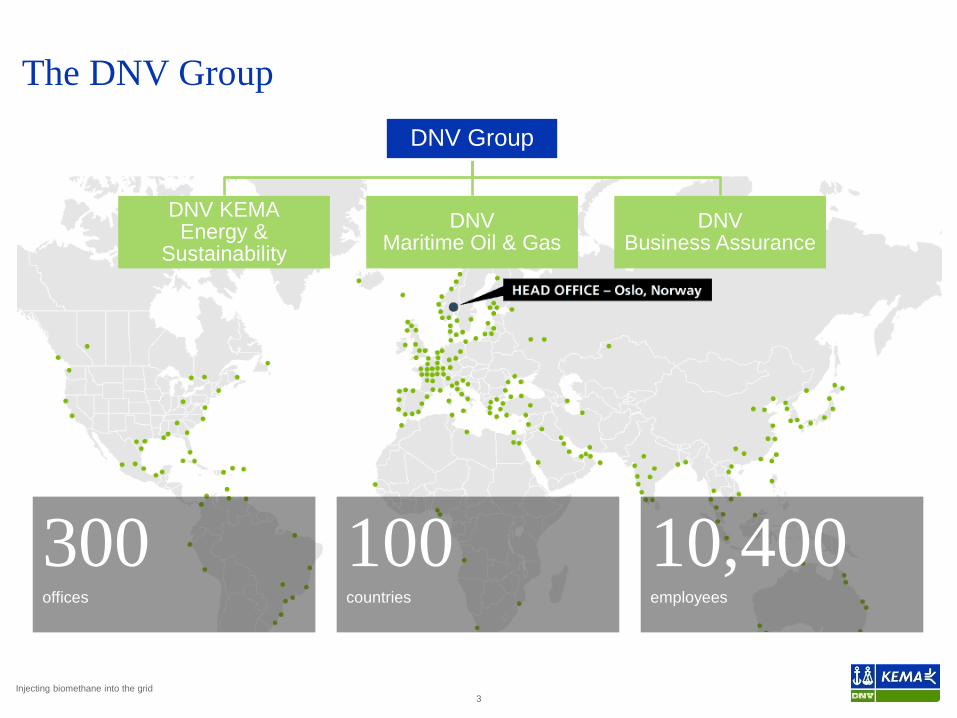
The DNV Group
3
10,400 employees
300 offices
100 countries
DNV Group
DNV KEMA Energy &
Sustainability DNV
Maritime Oil & Gas DNV
Business Assurance
Injecting biomethane into the grid
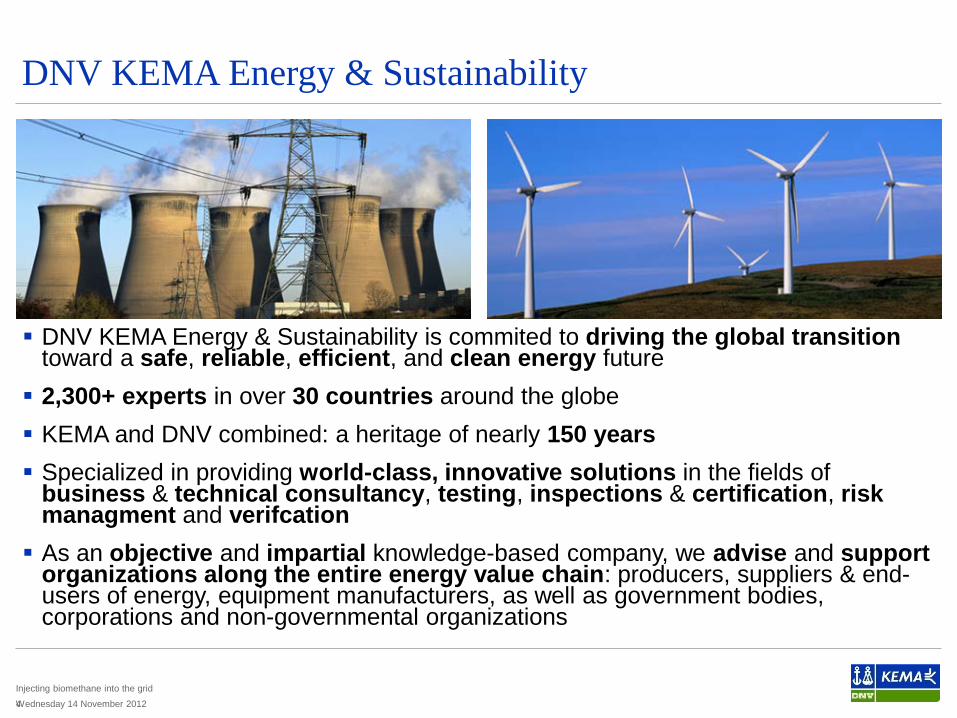
DNV KEMA Energy & Sustainability is commited to driving the global transition toward a safe, reliable, efficient, and clean energy future 2,300+ experts in over 30 countries around the globe KEMA and DNV combined: a heritage of nearly 150 years Specialized in providing world-class, innovative solutions in the fields of
business & technical consultancy, testing, inspections & certification, risk managment and verifcation As an objective and impartial knowledge-based company, we advise and support
organizations along the entire energy value chain: producers, suppliers & end-users of energy, equipment manufacturers, as well as government bodies, corporations and non-governmental organizations
DNV KEMA Energy & Sustainability
4 Wednesday 14 November 2012
Injecting biomethane into the grid
Renewable energy supply in the Netherlands
Injecting biomethane into the grid 5
Wind 12%
Municipal waste 27%
Other biomass
50%
Biogas 10%
Biomass 87%
127 PJ in 2010
05
10152025303540
TWh
Wednesday 14 November 2012
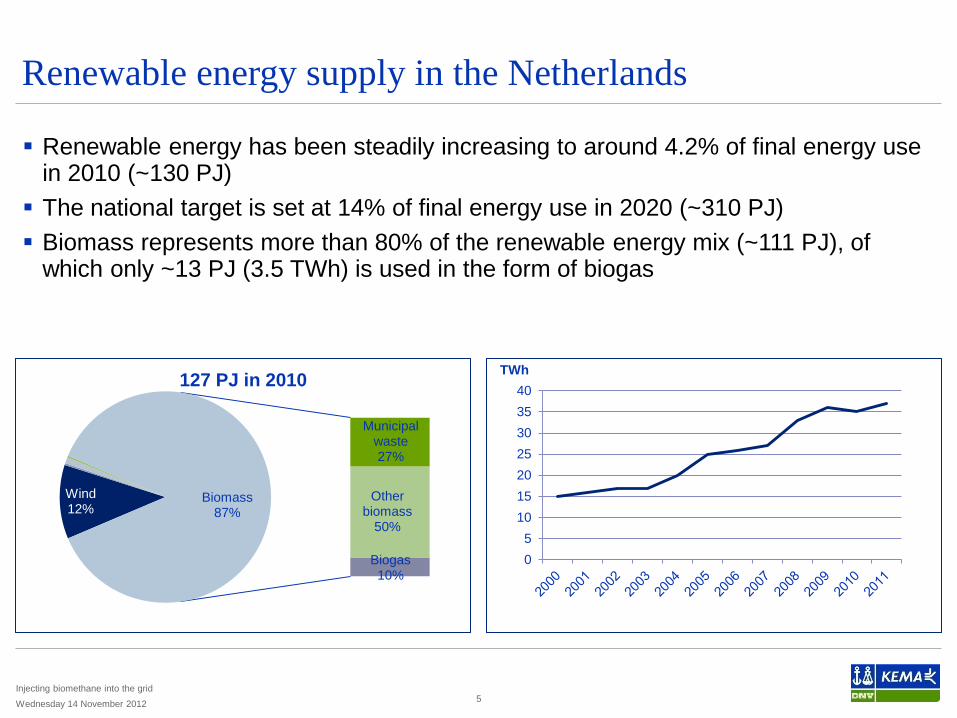
Renewable energy has been steadily increasing to around 4.2% of final energy use in 2010 (~130 PJ) The national target is set at 14% of final energy use in 2020 (~310 PJ) Biomass represents more than 80% of the renewable energy mix (~111 PJ), of
which only ~13 PJ (3.5 TWh) is used in the form of biogas
Raw biogas production and utilization
Injecting biomethane into the grid 6
Biogas production 2005 - 2010
1.63 1.85
2.23
2.84
3.31 3.52
0,0
0,5
1,0
1,5
2,0
2,5
3,0
3,5
2005 2006 2007 2008 2009 2010
TWh
68%
15%
12%
5%
Electricity
Heat
Biomethane
Transport
Biogas utilization 2010
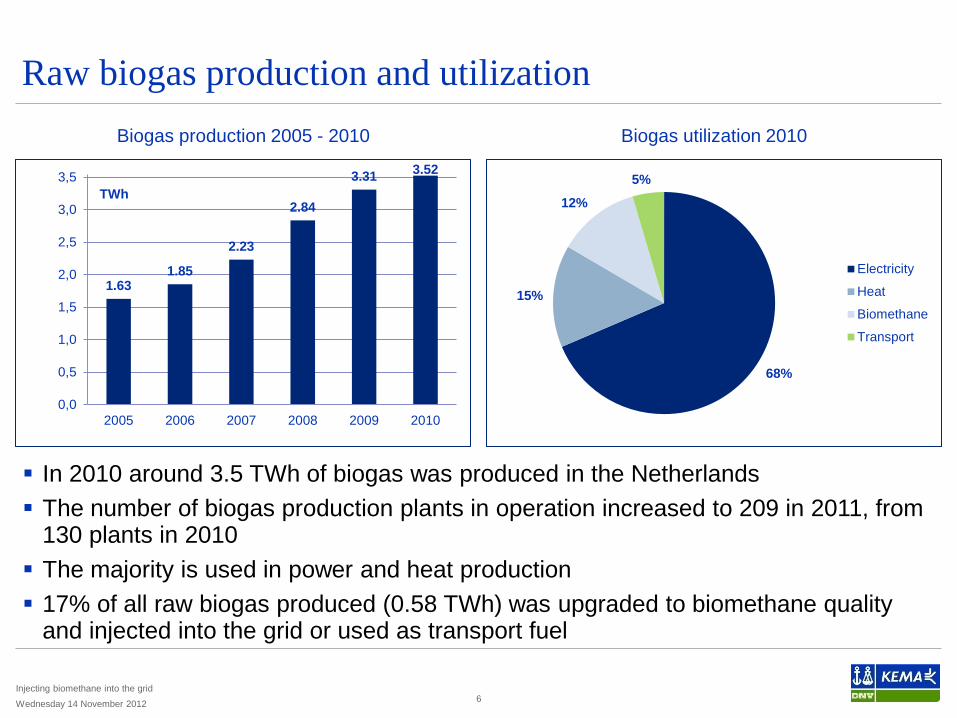
In 2010 around 3.5 TWh of biogas was produced in the Netherlands The number of biogas production plants in operation increased to 209 in 2011, from
130 plants in 2010 The majority is used in power and heat production 17% of all raw biogas produced (0.58 TWh) was upgraded to biomethane quality
and injected into the grid or used as transport fuel
Wednesday 14 November 2012
Biomethane production
Injecting biomethane into the grid 7
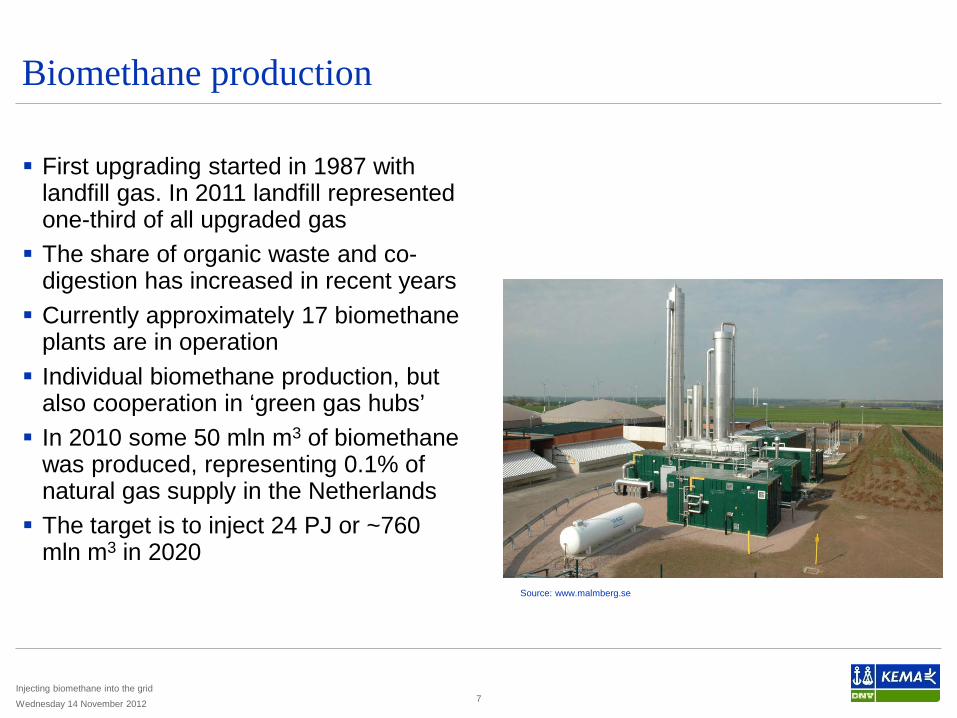
First upgrading started in 1987 with
landfill gas. In 2011 landfill represented one-third of all upgraded gas The share of organic waste and co-
digestion has increased in recent years Currently approximately 17 biomethane
plants are in operation Individual biomethane production, but
also cooperation in ‘green gas hubs’ In 2010 some 50 mln m3 of biomethane
was produced, representing 0.1% of natural gas supply in the Netherlands The target is to inject 24 PJ or ~760
mln m3 in 2020
Wednesday 14 November 2012
Source: www.malmberg.se
Biomethane grid injection - Overview
Injecting biomethane into the grid 8
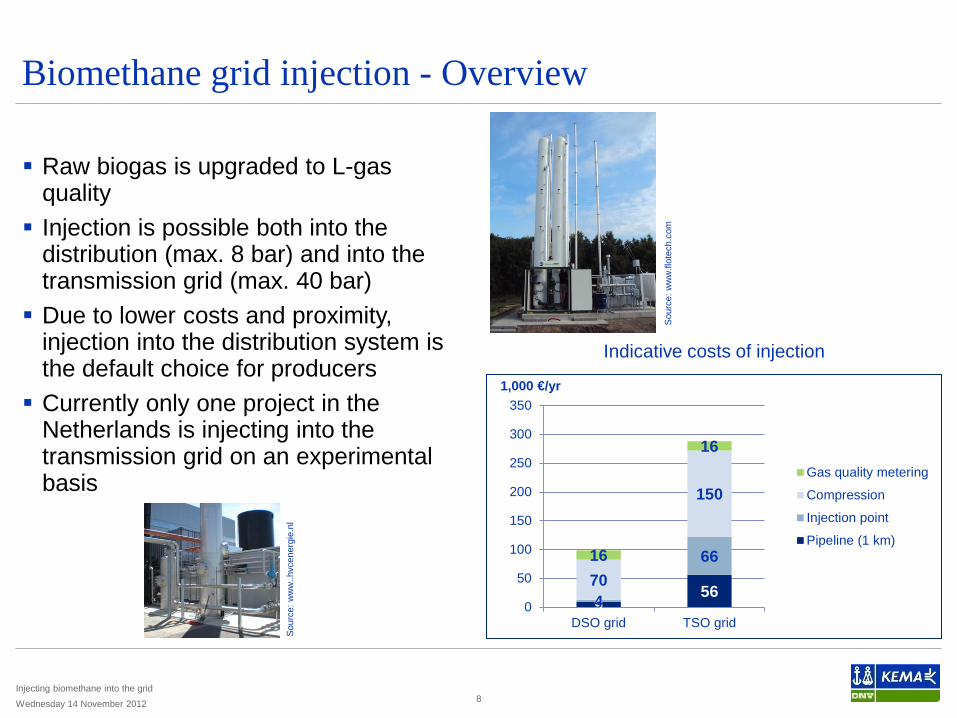
Raw biogas is upgraded to L-gas
quality Injection is possible both into the
distribution (max. 8 bar) and into the transmission grid (max. 40 bar) Due to lower costs and proximity,
injection into the distribution system is the default choice for producers Currently only one project in the
Netherlands is injecting into the transmission grid on an experimental basis
Indicative costs of injection
Wednesday 14 November 2012
9 56 4
66 70
150
16
16
0
50
100
150
200
250
300
350
DSO grid TSO grid
1,000 €/yr
Gas quality metering
Compression
Injection point
Pipeline (1 km)
Sou
rce:
ww
w.fl
otec
h.co
m
Sou
rce:
ww
w..h
vcen
ergi
e.nl
Biomethane grid injection – Available capacity
Injecting biomethane into the grid 9
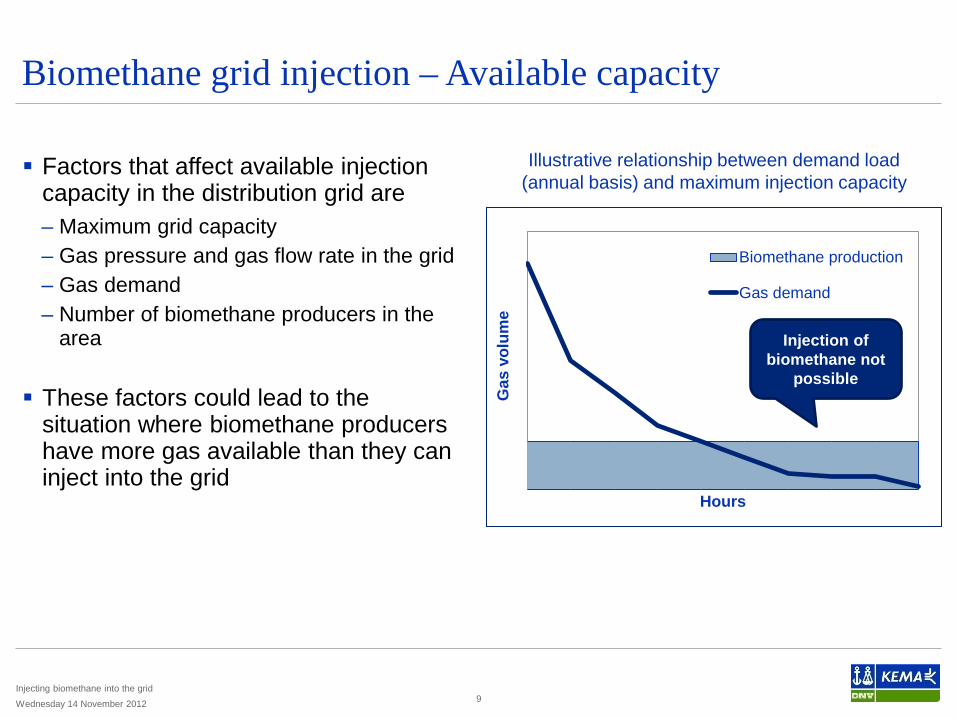
Factors that affect available injection
capacity in the distribution grid are – Maximum grid capacity – Gas pressure and gas flow rate in the grid – Gas demand – Number of biomethane producers in the
area These factors could lead to the
situation where biomethane producers have more gas available than they can inject into the grid
Illustrative relationship between demand load (annual basis) and maximum injection capacity
Wednesday 14 November 2012
Gas
vol
ume
Hours
Biomethane production
Gas demand
Injection of biomethane not
possible
Options for accommodating biomethane in the grid (1)
Injecting biomethane into the grid 10
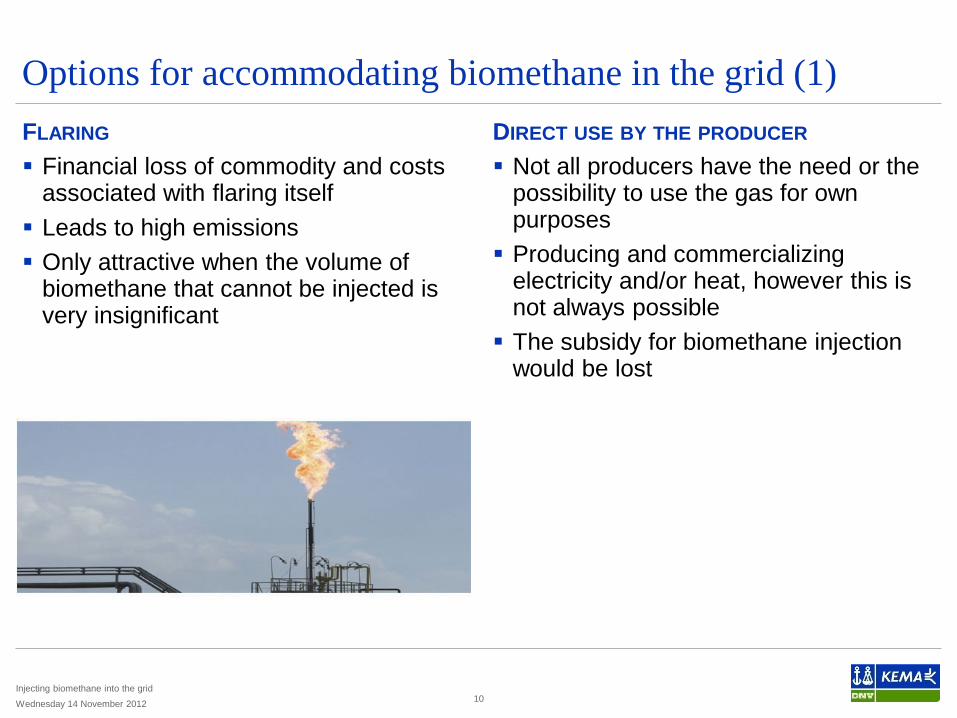
FLARING Financial loss of commodity and costs
associated with flaring itself Leads to high emissions Only attractive when the volume of
biomethane that cannot be injected is very insignificant
DIRECT USE BY THE PRODUCER Not all producers have the need or the
possibility to use the gas for own purposes Producing and commercializing
electricity and/or heat, however this is not always possible The subsidy for biomethane injection
would be lost
Wednesday 14 November 2012
Options for accommodating biomethane in the grid (2)
Injecting biomethane into the grid 11
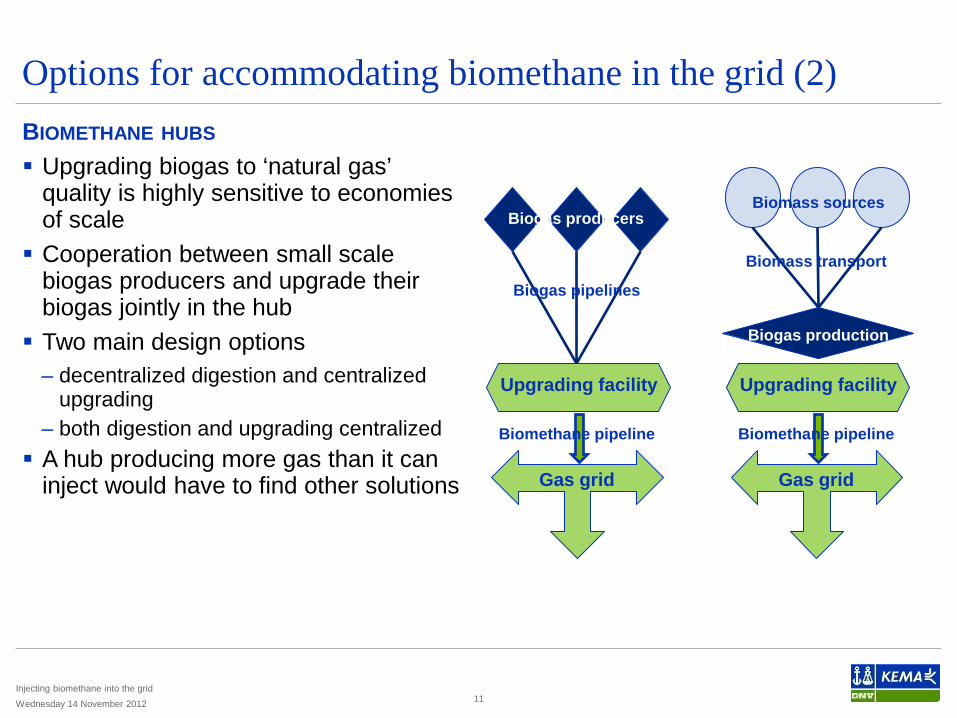
BIOMETHANE HUBS Upgrading biogas to ‘natural gas’
quality is highly sensitive to economies of scale Cooperation between small scale
biogas producers and upgrade their biogas jointly in the hub Two main design options
– decentralized digestion and centralized upgrading
– both digestion and upgrading centralized A hub producing more gas than it can
inject would have to find other solutions
Upgrading facility
Biogas producers
Biogas pipelines
Gas grid
Biomethane pipeline
Upgrading facility
Biomass transport
Gas grid
Biomethane pipeline
Biogas production
Biomass sources
Wednesday 14 November 2012
Options for accommodating biomethane in the grid (3)
Injecting biomethane into the grid 12
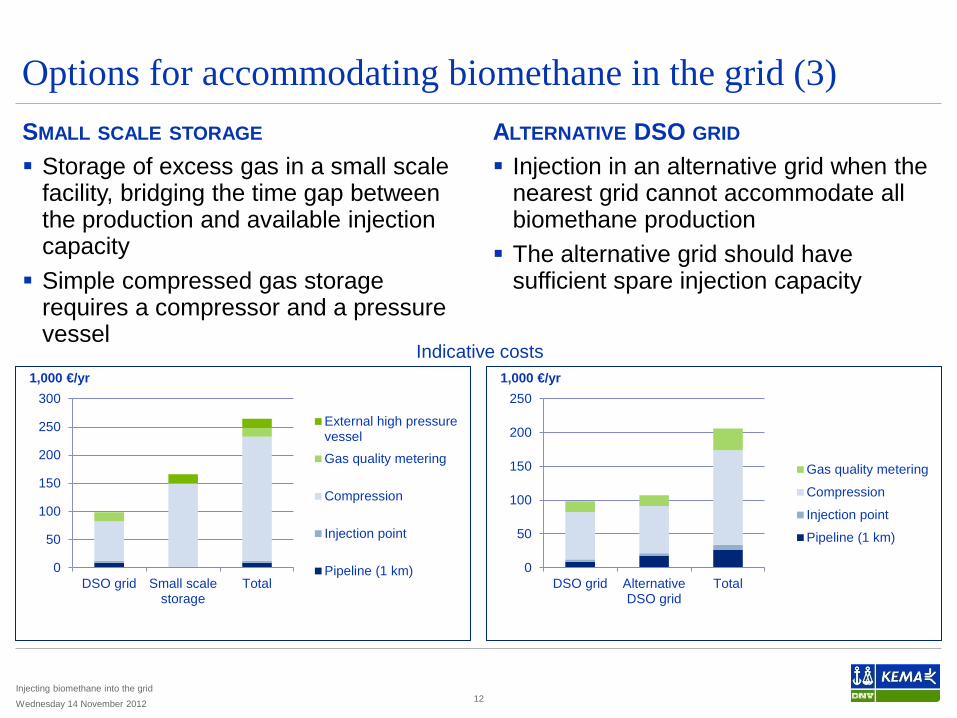
SMALL SCALE STORAGE Storage of excess gas in a small scale
facility, bridging the time gap between the production and available injection capacity Simple compressed gas storage
requires a compressor and a pressure vessel
ALTERNATIVE DSO GRID Injection in an alternative grid when the
nearest grid cannot accommodate all biomethane production The alternative grid should have
sufficient spare injection capacity
0
50
100
150
200
250
300
DSO grid Small scalestorage
Total
1,000 €/yr
External high pressurevessel
Gas quality metering
Compression
Injection point
Pipeline (1 km) 0
50
100
150
200
250
DSO grid AlternativeDSO grid
Total
1,000 €/yr
Gas quality metering
Compression
Injection point
Pipeline (1 km)
Indicative costs
Wednesday 14 November 2012
Options for accommodating biomethane in the grid (4)
Injecting biomethane into the grid 13
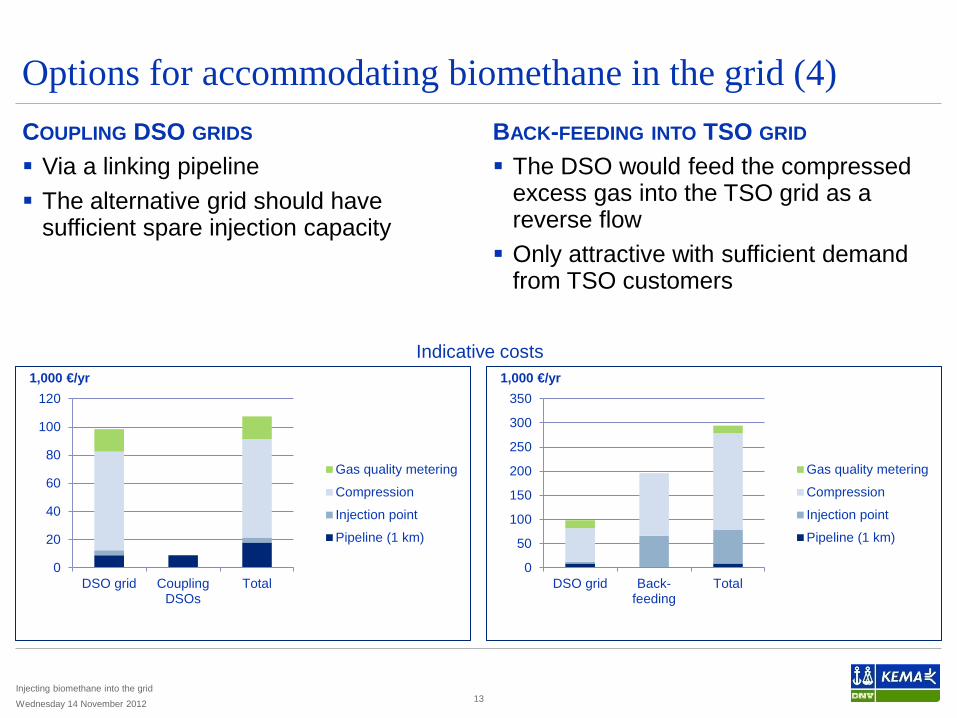
COUPLING DSO GRIDS Via a linking pipeline The alternative grid should have
sufficient spare injection capacity
BACK-FEEDING INTO TSO GRID The DSO would feed the compressed
excess gas into the TSO grid as a reverse flow Only attractive with sufficient demand
from TSO customers
0
20
40
60
80
100
120
DSO grid CouplingDSOs
Total
1,000 €/yr
Gas quality metering
Compression
Injection point
Pipeline (1 km)
0
50
100
150
200
250
300
350
DSO grid Back-feeding
Total
1,000 €/yr
Gas quality metering
Compression
Injection point
Pipeline (1 km)
Indicative costs
Wednesday 14 November 2012
Options for accommodating biomethane in the grid (5)
Injecting biomethane into the grid 14
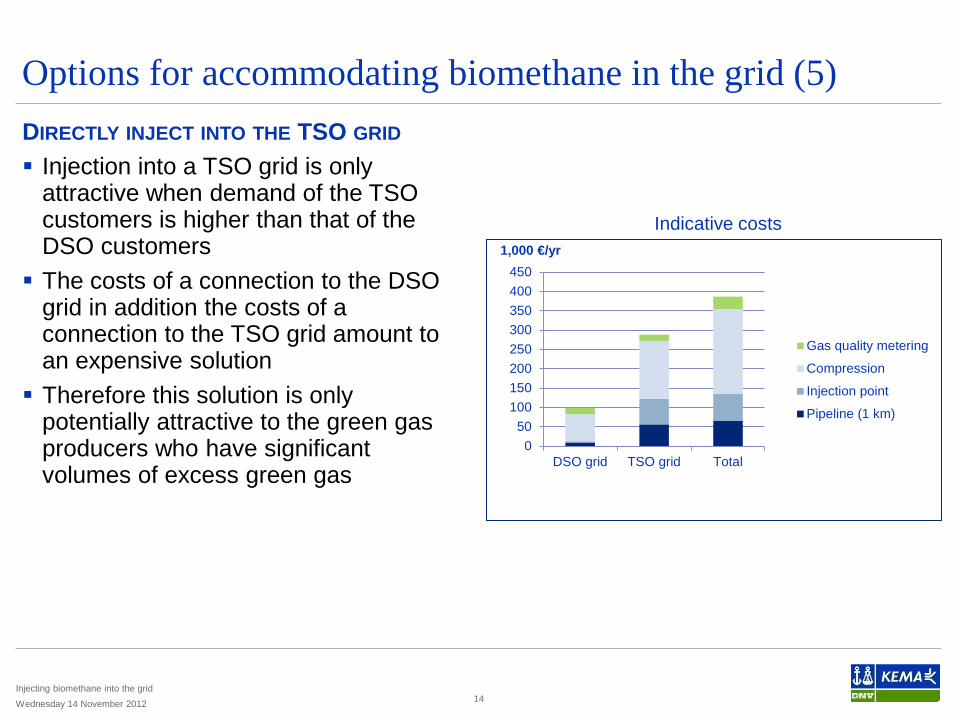
DIRECTLY INJECT INTO THE TSO GRID Injection into a TSO grid is only
attractive when demand of the TSO customers is higher than that of the DSO customers The costs of a connection to the DSO
grid in addition the costs of a connection to the TSO grid amount to an expensive solution Therefore this solution is only
potentially attractive to the green gas producers who have significant volumes of excess green gas
050
100150200250300350400450
DSO grid TSO grid Total
1,000 €/yr
Gas quality metering
Compression
Injection point
Pipeline (1 km)
Indicative costs
Wednesday 14 November 2012
Options for accommodating biomethane in the grid (6)
Injecting biomethane into the grid 15
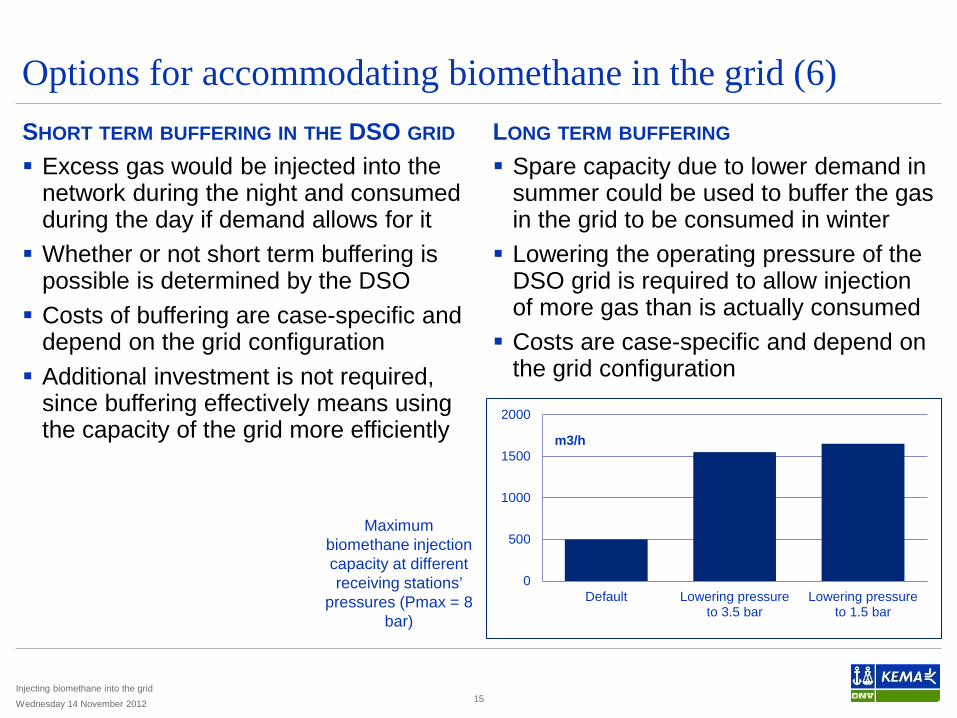
SHORT TERM BUFFERING IN THE DSO GRID Excess gas would be injected into the
network during the night and consumed during the day if demand allows for it Whether or not short term buffering is
possible is determined by the DSO Costs of buffering are case-specific and
depend on the grid configuration Additional investment is not required,
since buffering effectively means using the capacity of the grid more efficiently
LONG TERM BUFFERING Spare capacity due to lower demand in
summer could be used to buffer the gas in the grid to be consumed in winter Lowering the operating pressure of the
DSO grid is required to allow injection of more gas than is actually consumed Costs are case-specific and depend on
the grid configuration
0
500
1000
1500
2000
Default Lowering pressureto 3.5 bar
Lowering pressureto 1.5 bar
m3/h
Maximum biomethane injection capacity at different receiving stations’
pressures (Pmax = 8 bar)
Wednesday 14 November 2012
Biomethane grid injection – Cost allocation
Wednesday 14 November 2012
Injecting biomethane into the grid 16
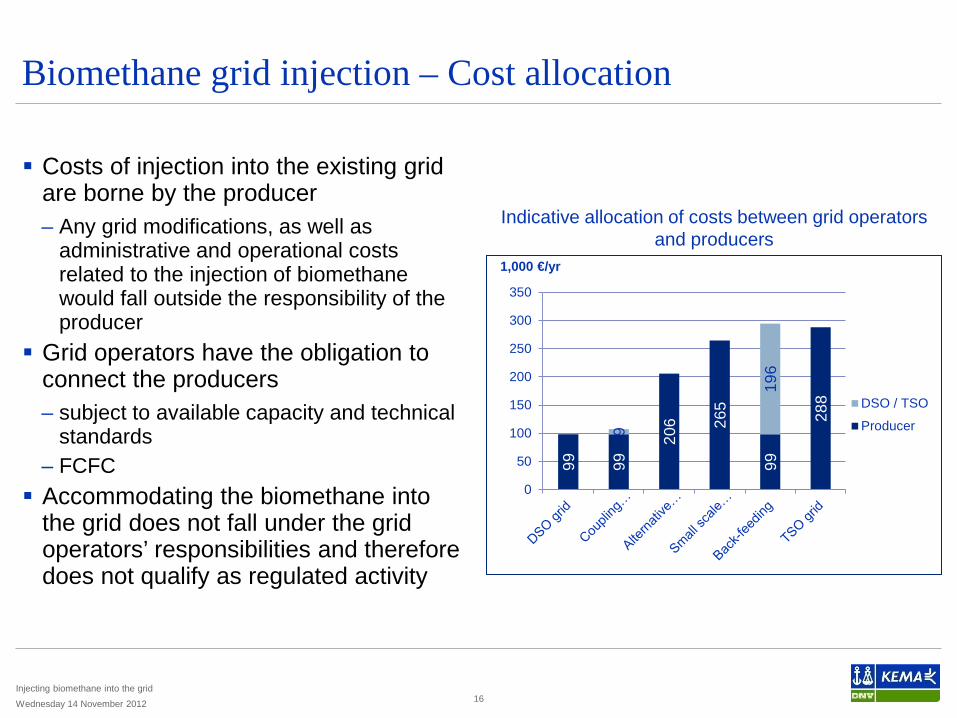
Costs of injection into the existing grid
are borne by the producer – Any grid modifications, as well as
administrative and operational costs related to the injection of biomethane would fall outside the responsibility of the producer
Grid operators have the obligation to connect the producers – subject to available capacity and technical
standards – FCFC Accommodating the biomethane into
the grid does not fall under the grid operators’ responsibilities and therefore does not qualify as regulated activity
99
99 20
6 265
99
288
9
196
0
50
100
150
200
250
300
350
1,000 €/yr
DSO / TSO
Producer
Indicative allocation of costs between grid operators and producers
Conclusion
Injecting biomethane into the grid 17
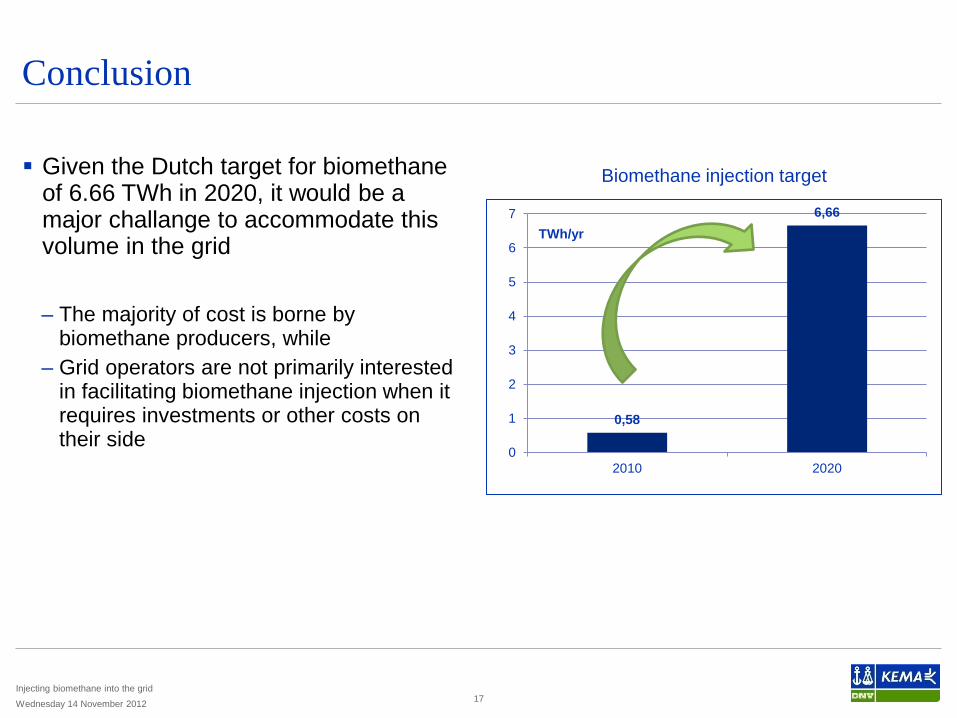
Given the Dutch target for biomethane
of 6.66 TWh in 2020, it would be a major challange to accommodate this volume in the grid – The majority of cost is borne by
biomethane producers, while – Grid operators are not primarily interested
in facilitating biomethane injection when it requires investments or other costs on their side
Wednesday 14 November 2012
Biomethane injection target
0,58
6,66
0
1
2
3
4
5
6
7
2010 2020
TWh/yr
Thank you for your attention Dr.ir. Maroeska Boots Consultant Gas Markets and Strategy DNV KEMA Energy & Sustainability T +31 (0)26 356 2611 [email protected] Please visit our website www.dnvkema.com
Biomethane grid injection – Germany
Wednesday 14 November 2012
Injecting biomethane into the grid 19
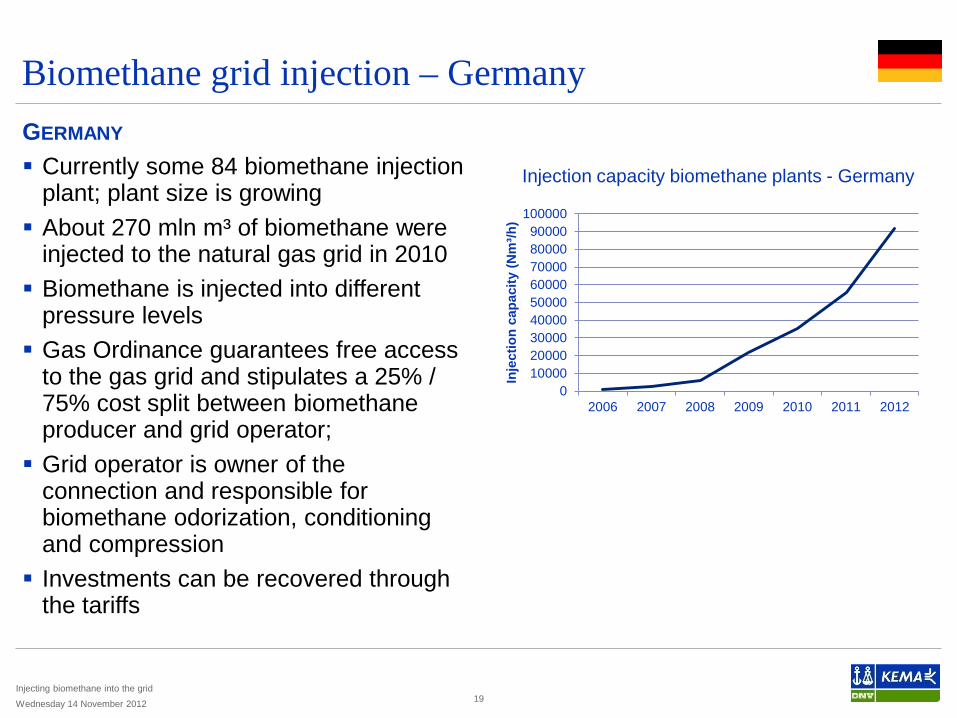
GERMANY Currently some 84 biomethane injection
plant; plant size is growing About 270 mln m³ of biomethane were
injected to the natural gas grid in 2010 Biomethane is injected into different
pressure levels Gas Ordinance guarantees free access
to the gas grid and stipulates a 25% / 75% cost split between biomethane producer and grid operator; Grid operator is owner of the
connection and responsible for biomethane odorization, conditioning and compression Investments can be recovered through
the tariffs
0100002000030000400005000060000700008000090000
100000
2006 2007 2008 2009 2010 2011 2012
Inje
ctio
n ca
paci
ty (N
m³/h
)
Injection capacity biomethane plants - Germany
Biomethane grid injection – France
Wednesday 14 November 2012
Injecting biomethane into the grid 20
FRANCE Biomethane injection only possible
since November 2011 as a package of Decrees was adopted At the moment only one upgrading
facility; grid injection is in the experimental phase Connection costs are producers’
responsibility and are to be recovered through feed in tariffs Priority access to the grid. DSOs and
TSOs are responsible for grid extension, and accommodating the green gas injection qualifies as such Additional costs incurred by the
respective operators to accommodate green gas can be socialized and recovered through tariffs