Embed Size (px)
Citation preview

Logistic Efficiencies and Naval architecture
for Wind Installations with Novel Developments
Project acronym: LEANWIND
Grant agreement no 614020
Collaborative project
Start date: 01st December 2013
Duration: 4 years
Work Package 5
D5.3: Ports suitability assessment for offshore wind development-Case studies report
Lead Beneficiary: University of Hull
Due date: 31 July 2015
Delivery date: 31 July 2015
Dissemination level: PU (public)
This project has received funding from the European Union’s
Seventh Programme for research, technological development
and demonstration under grant agreement No. 614020.

LEANWIND D5.3- project no. 614020
Disclaimer
The content of the publication herein is the sole responsibility of the authors and does
not necessarily represent the views of the European Commission or its services.
While the information contained in the documents is believed to be accurate, the
authors(s) or any other participant in the LEANWIND consortium make no warranty of
any kind with regard to this material including, but not limited to the implied warranties
of merchantability and fitness for a particular purpose.
Neither the LEANWIND Consortium nor any of its members, their officers, employees or
agents shall be responsible or liable in negligence or otherwise howsoever in respect of
any inaccuracy or omission herein.
Without derogating from the generality of the foregoing neither the LEANWIND
Consortium nor any of its members, their officers, employees or agents shall be liable for
any direct or indirect or consequential loss or damage caused by or arising from any
information advice or inaccuracy or omission herein.
Document Information
Version Date Description
Prepared by Reviewed by Approved by
V1 01.07.2015 University of
Hull
Negar Akbari Azadeh Attari
Lucy Cradden
Azadeh Attari
Lucy Cradden
V2 27.07.2015 University of
Hull
Negar Akbari Katie Lynch Katie Lynch
V3 31.01.2015 University of
Hull
Negar Akbari Final
submission
Author(s) information (alphabetical):
Name Organisation
Negar Akbari University of Hull
Acknowledgements/Contributions:
Name Organisation
Clarke, Steve University of Hull
Cradden, Lucy University of Edinburgh
Gebruers, Cormac Cork Institute of Technology
Irawan, Chandra University of Portsmouth
Jones, Dylan University of Portsmouth
Menachof, David University of Hull
Mogre, Riccardo University of Hull
Ramudhin, Amar University of Hull
Rasmussen, Tore Kongsberg Maritime AS

LEANWIND D5.3- project no. 614020
Definitions
AHP Analytical Hierarchy Process
ANP Analytic Network Process
ASL Above Sea Level
CAPEX Capital Expenditure
DEA Data Envelopment Analysis
DSS Decision Support System
EOHT Electric Over-Head Travelling
GBF Gravity Based Foundation
GIS Geographic Information System
HLCV Heavy Lift Cargo Vessels
LAT Lowest Astronomical Tide
LOA Length Over All
MCDA Multi-Criteria Decision Analysis
MLWS Mean Low Water Spring
O&M Operations and Maintenance
OEM Original Equipment manufacturer
OPEX Operating Expenses
OREI Offshore Renewable Energy Industry
OWI Offshore Wind Industry
POI Point of Interconnection
PPA Power Purchase agreement
SPMT Self-Propelled Modular Transport
WTG Wind Turbine Generator

LEANWIND D5.3- project no. 614020
Contents
Executive Summary ................................................................................................................. 7
1. Introduction ...................................................................................................................... 1
2. Assessment of ports in the offshore wind industry ...................................................... 2
2.1 Offshore wind turbines................................................................................................................. 2
2.1.1 Supporting structures .............................................................................................................. 5
2.1.2 Floating structures ................................................................................................................... 8
2.2 Port requirements for Offshore Wind Industry ...................................................................... 10
2.2.1 Component fabrication facility............................................................................................ 10
2.2.2 Port’s layout ........................................................................................................................... 13
2.2.3 Component handling capabilities ....................................................................................... 18
2.2.4 Vessel access ......................................................................................................................... 22
2.2.5 Port’s bearing pressure and surface area ......................................................................... 28
2.2.6 Port’s connectivity ................................................................................................................. 29
2.2.7 Security at the port ............................................................................................................... 31
3. Installation, operations and maintenance and decommissioning strategies from
ports ....................................................................................................................................... 32
3.1 Installation .................................................................................................................................. 32
3.1.1 Installation methods ............................................................................................................. 32
3.2 Operations and maintenance ........................................................................................... 33
3.2.1 Operations and maintenance strategies: .......................................................................... 34
3.2.2 Availability vs. Cost ............................................................................................................... 35
3.3 Decommissioning of the wind farm ....................................................................................... 36
3.3.1 Decommissioning strategies ............................................................................................... 37
3.4 Port Clusters for the offshore wind industry .......................................................................... 38
3.5 Ports’ investment decisions for offshore wind industry ...................................................... 39
3.5.1 The effect of Port’s ownership on offshore wind industry .............................................. 39
3.5.2 Port developments in the UK .............................................................................................. 40
3.5.3 Future trends ......................................................................................................................... 40
4. Port selection model ................................................................................................... 42
4.1 Related work .............................................................................................................................. 42
4.2 Methodology ............................................................................................................................... 43
4.2.1 Consistency ............................................................................................................................ 45
4.2.2 Hierarchy structures for the port selection model ........................................................... 45
4.3 Results of the pairwise comparisons of the port criteria .................................................... 49
4.3.1 Installation port ..................................................................................................................... 49
4.3.2 Operations and maintenance port ..................................................................................... 50
4.3.3 Decommissioning ports ....................................................................................................... 52
4.4 Case application ........................................................................................................................ 54
4.4.1 Problem description ............................................................................................................. 55
4.4.2 Data collection ....................................................................................................................... 56
4.4.3 Results .................................................................................................................................... 56
4.5 Conclusion and future research .............................................................................................. 58
5. Conclusions ................................................................................................................... 59

LEANWIND D5.3- project no. 614020
6. Reference ...................................................................................................................... 60
7. Appendix ........................................................................................................................... 1
7.1 Port Visits ....................................................................................................................................... 1
7.2 Port performance data ................................................................................................................ 7
List of figures and tables: Figure 1: Tripod foundation [13] ............................................................................................. 6
Figure 2: Gravity based foundation [13] ................................................................................ 6
Figure 3: Monopile foundation [13] ........................................................................................ 7
Figure 4: Jacket foundation [13] ............................................................................................. 7
Figure 5: Floating foundations [15] ........................................................................................ 9
Figure 6: Port of Cuxhaven- Onsite production facility Layout of the port [22] ................. 12
Figure 7: Onsite port storage for wind turbine components [23] ...................................... 14
Figure 8: Jacket structure stored on a pontoon [24] .......................................................... 14
Figure 9: suggested layout for an installation port [25] ..................................................... 15
Figure 10: Suggested layout for O&M port [25] .................................................................. 16
Figure 11: Suggested layout for Decommissioning port [25] ............................................ 17
Figure 12: Crawler crane in Cuxport assists in ‘Amrumbank West’ Monopile operations
[28]......................................................................................................................................... 19
Figure 13: Matador 3 floating crane is loading the jackets at Bremerhaven (RWE) [30] 19
Figure 14: 2×6 axle line SPMT assembled as one self-propelled modular transporter
(SPMT) [11] ........................................................................................................................... 20
Figure 15: Floating dry dock [34] ......................................................................................... 21
Figure 16: Two tripods are transported using BLG’s OFFSHORE BHV 1 pontoon [35] .... 22
Figure 17: Hub with blades in star configuration assembled at the port for the Borkum
West II Windfarm, Germany [80] ......................................................................................... 24
Figure 18: JB-117 installing the nacelle [37] ...................................................................... 24
Figure 19: Rambiz lifting GBF at port of Oostende [40] ..................................................... 26
Figure 20: Scaldis Salvage & Marine Contractor's heavy lift vessel Rambiz was used to
install the jacket foundations for the Ormonde project located on North West coast of
the UK. Image courtesy of Vattenfall [41] ........................................................................... 26
Figure 21: Innovation loaded with monopiles and transition pieces at Aalborg, Denmark
for Westermost Rough wind farm, UK [42] ......................................................................... 27
Figure 22: 5000 tonnes mono-hull DP crane vessel Oleg Strahnov, installing wind turbine
foundation tripods at Borkum West II Windfarm, Germany [43] ....................................... 27
Figure 23:Self-Elevating Platform towed from Borwin Alpha site [44] .............................. 28
Figure 24: 63.5 m blade transported to the Port of Oostende [24] .................................. 30
Figure 25: Use of helicopters for servicing turbines [48] ................................................... 31
Figure 26: Diagrammatic representation of installation methods [8] ............................... 33
Figure 27: Installation port hierarchy .................................................................................. 46
Figure 28: Operations and maintenance port hierarchy .................................................... 47
Figure 29: Decommissioning port hierarchy ....................................................................... 48
Figure 30: Graph showing the weight comparison of the level 1 criteria group for an
installation port ..................................................................................................................... 50
Figure 31: Graph showing the weight comparison of the level 1 criteria group for an O&M
port ......................................................................................................................................... 52

LEANWIND D5.3- project no. 614020
Figure 32: Graph showing the weight comparison of the level 1 criteria group for a
decommissioning port .......................................................................................................... 53
Figure 33: Estimated location of selected ports and the wind farm for the example case
................................................................................................................................................ 55
Figure 34: Installation port ranking ..................................................................................... 56
Figure 35: O&M port ranking................................................................................................ 57
Figure 36: Decommissioning port ranking .......................................................................... 58
Figure 37: Work in progress at Green port Hull [78] ............................................................. 3
Figure 38: Work in progress at Green port Hull [78] ............................................................. 4
Figure 39: Work in progress at Green port Hull [78] ............................................................. 5
Figure 40: Pontoon at Grimsby port [78] .............................................................................. 6
Table 1: Generic wind turbine specification [11] ................................................................... 4
Table 2: Key characteristics of Cuxhaven [22] ................................................................... 12
Table 3: Key characteristics of Cuxhaven terminal 2 [22] ................................................. 12
Table 4: Installation vessels [39] ......................................................................................... 25
Table 5: Service vessels for O&M [39] ................................................................................ 34
Table 6: Probable cost optimal O&M strategies [20] ......................................................... 36
Table 7: the fundamental scale of absolute numbers [71] ............................................... 44
Table 8: Example of a pairwise comparison matrix ............................................................ 45
Table 9: Installation port criteria weights [77] .................................................................... 49
Table 10: Consistency ratio of installation port matrices [77] .......................................... 50
Table 11: O&M port criteria weight [77] .............................................................................. 51
Table 12: Consistency ratio of O&M port matrices [77] ..................................................... 51
Table 13: Decommissioning port criteria weight [77] ........................................................ 53
Table 14: Consistency ratio of decommissioning port matrices [77] ................................ 53
Table 15: West Gabbard specifications [76] ...................................................................... 54
Table 16: Ports’ distance from the site [76] ....................................................................... 54
Table 17: Installation port data [77]....................................................................................... 7
Table 18: O&M port data [77] ................................................................................................. 8
Table 19: Decommissioning port data [77] ........................................................................... 9

LEANWIND D5.3- project no. 614020
Executive Summary
Over the last decade, Europe has led the world in supporting the wind industry to step
offshore into coastal waters and at scale, underpinning the potential creation of an
interconnected Europe-wide offshore electricity grid through which clean and affordable
energy can be harvested and transported to EU member states as required.
As a direct consequence, an increased number of larger & heavier power generation
systems need to be delivered from their place of manufacture onshore to installation
locations which are increasingly further offshore and in deeper waters. Based on
industry feedback, this port study, identifies the most critical technical requirements that
ports need to fulfil in order to efficiently support the installation, operation and
maintenance and decommissioning phases of the offshore wind farm lifecycle, including
(in no particular order):
a. Availability of component manufacturing/assembly facilities at the port in order to
reduce the time, cost and risks associated with the transportation of large wind
turbine components.
b. Suitable layout arrangement in the port to facilitate the accommodation of the
components within the port.
c. Ability to accommodate large installation vessels at the port.
d. Availability of component handling facilities at the port, including heavy cranes, Lo-Lo
and Ro-Ro facilities, SPMTs, Pontoons, etc. to help with the swift manoeuvring of the
components and efficient loading and unloading.
e. Location of the port and its distance from the wind farm, the component suppliers,
and road networks which can influence the component transportation’s time and
cost.
f. Security and health and safety measures in the ports.
Furthermore, this study proposes a decision making model which could aid developers
and designers in selecting the most suitable base for an offshore wind farm for a
particular phase of its lifecycle (installation, operation and maintenance or
decommissioning) based on the following port suitability criteria group.
a. Port’s connectivity including the port’s distance to the wind farm, distance to
component suppliers, distance to road networks, and distance to heliports (for O&M
phase).
b. Port’s physical characteristics including port’s length, port’s depth, seabed suitability,
quay load bearing capacity, availability of component handling equipment
c. Port’s Layout including Storage availability, component laydown area, component
fabrication facility, workshop area at the port, and recycling facilities (for the
decommissioning phase)

LEANWIND D5.3- project no. 614020
This decision making model has two applications. The first application is to reveal the
most important characteristics in the port for each phase of the offshore wind farm
development from a decision maker’s point of view. For the installation and
decommissioning phases, the port’s physical characteristics has been shown to be the
determining factor for decision makers and the ports’ connectivity and layout come
second and third in terms of importance. For the O&M phase, the model shows that for
decision makers, the ports’ connectivity is the major deciding factor in selecting a port
and the port’s physical characteristics and layout come second and third respectively.
The second application of the model is to compare the suitability of a number of ports
for a given wind farm using the criteria group mentioned above. Based on the criteria, a
number of ports are compared and a suitability score is given to each port. Finally the
port with the highest score could be suggested as the most suitable option for serving a
particular offshore wind farm.
Since ports are critical parts of the offshore wind supply chain and the connecting point
between on-land activities and offshore transportation of the components, the selection
of a suitable port becomes important. Therefore this model serves as a managerial tool,
enabling decision makers to tackle the strategic challenge of selecting the most suitable
port for an offshore wind farm which could facilitate the logistics activities related to the
entire life cycle of an offshore wind farm.

LEANWIND D5.3- project no. 614020
1
1. Introduction
This report presents deliverable 5.3 related to ‘Ports suitability assessment for offshore
wind development-case studies report’. In deliverable 5.3 a systematic assessment of
the most important port requirements for the installation, operations and maintenance
and decommissioning of offshore wind farms has been undertaken, and the role of ports
in the offshore wind industry is examined. Also in this deliverable, a decision making
model for port selection based on the identified capabilities has been proposed. The
purpose of this model is to help the decision makers in selecting the most suitable port
for an offshore wind farm.
Section 2, presents a detailed analysis of the ports’ most critical requirements for
handling offshore wind activities. In section 3, the ports’ involvement in installation,
operations and maintenance and decommissioning phases of the offshore wind farms is
further elaborated. In section 4, a decision making model for port selection along with a
case application is proposed, and in the final section, the conclusions are presented.
Task 5.3 led by University of Hull, has received valuable input from partners in University
of Portsmouth, University of Edinburgh, Kongsberg Maritime AS, Cork institute of
Technology, and European Wind Energy Association.

LEANWIND D5.3- project no. 614020
2
2. Assessment of ports in the offshore wind industry
By the end of 2014, 8.7 GW of offshore wind capacity was installed worldwide with 91%
of these activities in European waters, mainly in the North Sea (5,094.2 MW: 63.3%),
Atlantic Ocean (1,808.6 MW: 22.5%) and in the Baltic Sea (1,142.5 MW: 14.2%) [1].
In Europe, 2,488 turbines are installed and grid connected, making a cumulative total of
over 8 GW (8,045.3 MW) in 74 wind farms in 11 European countries [2]. Various
forecasts have predicted between 55 and 75 GW of cumulative offshore wind capacity
worldwide by 2020 [3].
The role of ports becomes more significant with regard to Europe’s 2020 target of
electricity generation and delivering 40 GW of electricity through offshore wind power
[4]. Ports are the major links in the offshore supply chain as the transportation,
assembly, staging, installation, operations and maintenance and decommissioning of
the turbines are carried out through them. The trend towards employing larger wind
turbines will require more ports with larger lay-down areas and facilities to build lift and
transport heavy equipment [5]. A large percent of stakeholders agree that further
development of port infrastructure and logistics will be a driver of installation cost
reduction in the coming years [6]. Hence, ports as important nodes in the offshore
wind’s logistics have to meet certain technical requirements for handling the
components for installation, servicing the offshore wind farms, and undertaking the
decommissioning of the components.
For gathering the information regarding the technical requirements of ports, we
identified and contacted several offshore wind stakeholders, including ports already
involved in the offshore wind industry and ports under development with manufacturing
facilities planned as part of the overall port capability. Our discussion with these
stakeholders helped us to explain the most important factors in offshore wind ports,
which we further used to develop a port selection model capable of selecting the most
suitable port for a given phase of the offshore wind life cycle. These discussions
provided us with a better appreciation of offshore wind farm logistics such as storing,
assembling, scheduling, and deploying wind turbines and foundations to the offshore
sites. We also used secondary sources and industry examples which helped us to better
explain each criterion and its implication in the port.
In section 2, after providing a brief explanation of offshore wind turbines and
substructures, we delve into assessing the critical technical requirements for ports in the
offshore wind industry.
2.1 Offshore wind turbines
According to the NREL report [7], no consensus exists yet on the maximum physical size
of offshore wind turbines in the future, although most wind engineers agree that there is
no hard physical limit preventing 10 MW turbines or greater. NREL [7] also argue that
with turbine costs representing only one third of the life cycle cost of the wind project,
turbine growth will continue until overall system costs are minimised.
From the point of view of substructure and foundation costs, larger turbines are usually
favoured, as mobilisation of the installation and service equipment is a major cost

LEANWIND D5.3- project no. 614020
3
driver, and fewer turbines mean lower geotechnical costs, fewer electrical terminations,
more generating capacity per ocean area, less inter turbine cable length and trenching,
and fewer service trips to and from the towers [7]. In this section a brief explanation of
offshore wind turbine components, export cables, substation and the supporting
structures is provided.
Tower:
Towers are tubular structures consisting of steel plates cut, rolled, and welded together
into large sections. The tower provides support to the turbine assembly and the balance
of plant components, including a transformer located in the base, a yaw motor located at
the top, and communication and power cables. The tower also provides a ladder and/or
an elevating mechanism to provide access to the nacelle. In installation, tower sections
are bolted to each other during assembly, or are preassembled at port. Tower height is
determined by the diametre of the rotor and the clearance above the water level. Typical
tower heights are 60–80 m giving a total hub height of 70–90 m when added to the
substructure height above the water line. Tower’s diametre and strength depend on the
weight of the nacelle and expected wind loads [8].
Blade:
Blades are aerofoils made of composite or reinforced plastics, and are bolted to the hub
either onshore or offshore. Due to the low weight and long length (50–60 m), blades are
sensitive to high winds during lifting operations. Moreover, the size and shape of
assembled configurations complicate onshore and offshore transport [8].
Nacelle:
The nacelle houses the generator and gearbox and monitors communications, control,
and environmental maintenance of the equipment. The nacelle is principally composed
of a main frame and cover. The main frame is the element to which the gearbox,
generator, and brake are attached, and must transmit all the loads from the rotor and
reaction loads from the generator and brake to the tower [8]. Nacelles are large units
and their installation usually imposes the heaviest and highest lift. Therefore, the nacelle
weight plays an important role in determining installation vessel suitability. A new
generation of ‘direct drive’ offshore wind turbines is evolving, capable of generating in
excess of 6 MW at very low rotor speeds and without an internal gearbox [9].
Export cables:
Export cables connect the wind farm to the onshore transmission system and are
typically installed in one continuous operation. Export cables are buried to prevent
exposure, and in some places, may require scour protection. Electricity collection and
transmission come onshore and may be spliced to a similar cable and/or connected to
an onshore substation. Water depths along the cable route, soil type, coastline type, and
many other factors determine the cable route, time, and cost. At the onshore substation
or switchyard, energy from the offshore wind farm is delivered to the power grid. If the
point of interconnection (POI) voltage is different from the submarine transmission,

LEANWIND D5.3- project no. 614020
4
transformers are used to match the POI voltage; otherwise, a switchyard is used to
directly interconnect the wind farm. At this point, power generated is metreed and
purchased via a PPA with a local utility or by entering the Independent System Operator’s
merchant market. Export cables are composed of three insulated conductors protected
by galvanized steel wire. Medium voltage cables are used when no offshore substation is
installed and usually range between 24 and 36 kV. High voltage cables are typically
110–150 kV and are used with offshore substations. High voltage cables have the
capacity to carry more power than a medium voltage cable but are heavier. These cables
may weigh 50–100 kg/m while medium voltage cables may weigh 20–40 kg/m [8]. In
distances more than 100 km offshore, HVDC connections are likely to be preferred over
HVAC, which requires further equipment to connect back to an onshore AC substation
[10].
Substation:
Whether an offshore wind farm has an offshore or onshore substation depends primarily
on the size of the wind farm, distance from shore and distance from the grid connection
point. Typically, wind farms farther than approximately 10 km from land have
substations offshore. The substation accommodates the transformers required to
increase the distribution voltage (33 kV or above) of the inter array cables to a higher
voltage of typically 110 – 245 kV. From the offshore substation, the export cables then
carry the power to the landfall location. As wind farm capacities increase and move
farther offshore, there is a requirement for increased electrical equipment ratings and
hence, for larger substations. When wind farms are located at substantial distances
from shore, the losses in the electrical system can become significant. To minimise
losses as much as possible, voltages are stepped up, for example from 33 kV to 115 kV
[11].
Parametre 4MW 5MW 6MW 7MW 8MW
Rotor diametre(m) 120 135 150 164 175
Blade length(m) 59 66 73 80 85
Blade weight(t) 19 23 28 34 40
Nacelle weight(t) 162 239 330 390 450
Tower length(m) 66 74 81 88 94
Tower weight(t) 185 215 250 280 310
Table 1: Generic wind turbine specification [11]

LEANWIND D5.3- project no. 614020
5
2.1.1 Supporting structures
Monopiles:
Monopiles are large diametre, thick walled, steel tubular that are driven (hammered) or
drilled (or both) into the seabed. Outer diametres usually range from 4 to 6 m and
typically 40–50% of the pile is inserted into the seabed. The wall thickness and depth of
penetration of the monopiles depend on the design turbine load, soil conditions, water
depth, environmental conditions, and the adopted design codes. Pile driving is more
efficient and less expensive than drilling; however its application may not be feasible in
certain seabed conditions. Monopiles are currently the most common foundation in
shallow water (<30 m) developments due to lower cost and the fact that monopiles are a
proven concept. In soft soil regions, monopiles with larger embedment lengths and wall
thicknesses are required. Suitability of monopiles in deeper water sites is a highly
debated topic at present, as deeper water sites increase the structural demand and lead
to larger diametre piles and increased wall thicknesses [8]. According to EWEA [2]
78.8% of substructures (by 2014) are monopiles.
Jackets:
Jacket foundations are an open lattice steel truss template consisting of a welded frame
of tubular members extending from the mould line to above the water surface. Piles are
driven through each leg of the jacket into the seabed or in the form of skirt piles, outside
the jacket legs, to secure the substructure against lateral forces. Jackets are robust and
heavy structures and require expensive equipment to transport and lift. To date, jacket
foundations have not been used extensively in the offshore wind industry, due to the
prevalence of shallow, near-shore wind farm sites. At around 50 m water depth, jacket
structures become the preferred concept. Jackets have been used for two of the
deepest developments, Beatrice (45 m) and Alpha Ventus (30 m), supporting large 5
MW turbines. Jackets are also commonly used to support offshore substations. They can
be used in deep water sites (100s of metres), although economic considerations are
likely to limit their deployment to water depths under 100 m [8]. According to EWEA [2],
4.7% of substructures (by 2014) are jackets.
Gravity Based Foundations (GBF):
A gravity base foundation is a very heavy structure usually made of concrete, which
resists the lateral loads and overturning moments by its self-weight. The base is usually
15 to 25 m in diametre and all of the forces and bending moments are transported
through the base of the foundation. Typically, a gravity base is used on semi-hard,
uniform seabed condition and at shallower water depths, compared to jacket structures.
The deepest gravity base foundations in operation are in Thornton bank (27m) [8]. The
size and weight of the foundation make the transportation and installation onerous and
it is worth noting that the seabed must be prepared by dredging and backfilling material
in order to install the foundation. Hence while GBFs fabrication cost is low, in some
cases high transportation and installation cost make them unattractive options [12].
According to EWEA [2], 10.4 % of substructures (by 2014) are GBFs.

LEANWIND D5.3- project no. 614020
6
Tripods:
Tripods consist of a central steel shaft connected to three cylindrical steel tubes through
which piles are driven into the seabed. Tripods are heavier and more expensive to
manufacture than monopiles, but are more useful in deep water. The only operating
wind farm that employs tripod foundations is the Alpha Ventus project located in
Germany [8]. According to EWEA [2], 4.1% of substructures (by 2014) are tripods.
Figure 1: Tripod foundation [13]
Figure 2: Gravity based foundation [13]

LEANWIND D5.3- project no. 614020
7
Figure 3: Monopile foundation [13]
Figure 4: Jacket foundation [13]

LEANWIND D5.3- project no. 614020
8
2.1.2 Floating structures
Semi-submersible:
A semi-submersible is a free-surface stabilised structure with relatively shallow draft. It is
a versatile structure due to its relatively low draft and flexibility to the seabed conditions.
In general, semi-submersible structures are heavy structures with a relatively high steel
mass and manufacturing complexity due to the large number of welded connections.
Wind Float, the most developed concept using the semi-submersible philosophy, has
had a full scale demo since 2011. A small array of semi-submersible structures is
estimated to be operational by late 2015 and a large commercial array is estimated to
be deployed in 2021/2022 [14].
Spar buoy:
The spar buoy is a weight-buoyancy stabilised structure with relatively large draft. The
concept uses simple (few active components), well-proven technology with inherently
stable design and few weaknesses. The spar will face challenges due to its large draft
for the actual site, but primarily in terms of assembly sites and transportation routes,
which could limit the deployment in parts of the world. Hywind is the spar concept which
has reached the highest technology readiness level so far. Hywind has had a full scale
prototype in operation since 2009. A small array of Hywind turbines is expected to be
deployed in 2015 and a large commercial array is estimated to be deployed in 2020
[14].
Tension Leg Platform (TLP):
The Tension Leg Platform is a tension restrained structure with relatively shallow draft.
The tension leg concept enables low structural weight of the substructure, and thus
lower material costs. TLPs could potentially have a higher operational risk, caused by the
risk of total loss of the structure in the event of a tendon failure, if not countered in the
design. TLP designs also add requirements with regard to soil conditions at site.
PelaStar is probably the TLP concept which is furthest in development and closest to
deploying a large scale demonstration unit. A full scale demo is planned in 2015
following by a small array in 2020 and a large commercial array is estimated to be
deployed in 2025 [14].

LEANWIND D5.3- project no. 614020
9
Figure 5: Floating foundations [15]

LEANWIND D5.3- project no. 614020
10
2.2 Port requirements for Offshore Wind Industry
For the development of an offshore wind farm, proper setup in the port area is needed.
The ports must be arranged in a manner that various tasks can be carried out in the
safest, quickest, the most cost-effective way. As the size and weight of the turbines is
increasing, the port must have large land area and suitable handling equipment to
address the offshore wind requirements. In this section, the most important
requirements of offshore wind ports are detailed.
2.2.1 Component fabrication facility
Given the increase in the size of wind turbines and wind farms, the logistic challenges
associated with transporting these components from the manufacturing facility to the
offshore site have become more complex. Due to these factors, wind turbine
manufacturers are increasingly looking towards European portside turbine assembly
facilities [16]. EWEA [17] defines the manufacturing ports as ports where the fabrication
facility is closely located at the port and the components are exported directly to the
offshore site. In order to reduce the transportation cost and handling of these
components, it is suggested to have turbine manufacturing facilities at the installation
ports where the components can be shipped to the site with less handling. Whereas this
option might not be feasible for all installation ports mainly due to the lack of space and
commercial restrictions, developing manufacturing facilities within certain port clusters
to feed several offshore wind developments seems reasonable.
In Port of Bremerhaven in Germany [19] a number of companies such as AREVA Wind
GmbH and Repower Systems AG are located. Both companies have established
production capacities of approximately 100 turbines a year and a range of activities
including handling, pre-assembly, storage and export of offshore wind turbines is taking
place in a single port which further enhances the efficiency of the supply chain in terms
of transporting the components, reduces the risk, and ultimately helps reducing the cost
through the supply chain refinement. Port of Bremerhaven has been used for production
and assembly of foundation, tower, nacelle and blades [19], and has also served as the
installation base for the Nordsee Ost project, around 35 km to the north-east of the
island of Helgoland in the German North Sea region.
Although UK has the biggest share in the offshore wind market, only recently
development of such facilities within the port has started and prior to that, majority of
turbine components for UK offshore projects were being imported from continental
Europe. Among the major investments that have taken place in the UK for development
of offshore wind supply chain is the Green Port Hull project. In 2014, Siemens along
with its British partner, Associated British Ports, invested in a blade manufacturing
facility for Siemens next generation blade technology, Siemens SWT-6.0-154 6 MW wind
turbine, at Green port Hull with the factory to be operational by 2017 [20].
For a port to accommodate manufacturing facilities, [21] suggests up to 500 ha of flat
area for factory and product storage, direct access to high load bearing and deep water
quayside, ease of logistics and access to skilled workforce, as requirements. According
to [11] a fabrication facility for Nacelles, towers and blades should have the following
characteristics:

LEANWIND D5.3- project no. 614020
11
Nacelles:
Wind turbine nacelles are manufactured under the cover of a fabrication facility which
has suitable gantry cranes to lift and transfer components that constitute the nacelle
(gearboxes, generators, etc.). Upon leaving the fabrication facility, nacelles are usually
transported around the port facility using self-propelled modular transport (SPMTs) [11].
Requires Electric Over-Head Travelling (EOHT)crane capacity of up to 75 tonnes
SPMTs are required to manoeuvre underneath the nacelle’s tower-top flange crane,
jack-up and transit out of the facility.
Blades:
Blades are manufactured under the cover of a fabrication facility which has suitable
gantry cranes to lift and transfer the blades to bespoke trolleys, which are themselves
used to ship the blades to a long/medium-term storage area [11].
A number of blades may be fabricated in parallel, requiring facilities that are wider
than the sum of the fabrication moulds used to pre-lay the carbon fibre-reinforced
plastic that constitutes the blade structure.
Light internal cranage for the transfer of the blades to their transport trolleys are
required, since turbine blades are made of lightweight composites.
Towers:
Wind turbine towers are manufactured under the cover of a fabrication facility with a
production line set-up where steel plates are rolled into tower cans, which are in turn
welded together into tower sections. Bespoke trolleys can be used to lift the tower
sections and transport these around the port facility [11].
Workshops with adequate headroom under the cranage will be necessary to ensure
the tower bases can be lifted from rolling equipment.
Towers require conical rolling, and their rolling is more onerous than for cylindrical
piles. Besides this, the tower walls are far thinner, therefore the equipment required
is much smaller.
Port of Cuxhaven in Germany is another example of a port with manufacturing facilities
in which companies such as Cuxhaven Steel Construction GmbH, as subsidiary of BARD
Group (producing foundation structures and components for offshore wind turbine
generators), and AMBAU GmbH, manufacturer of steel towers and foundation structures,
are located. Cuxhaven has a heavy load platform, a specialised hydraulic engineering
structure with an area of 1,500 m², which is suited for both standing transport of
completely assembled offshore wind turbine generators and for landing, as well as for
conventional shipping of individual components. The heavy load platform can withstand
loads up to 90 tonnes/m², and therefore, can support an upright, completely assembled
wind turbine generator. The financial investment in the heavy load platform totalled
€ 7.57 million (c. £5.4 million) [22].
Some of the projects in which Cuxhaven has been successfully involved are:
1. Production and handling of tower sections for Nordsee Ost, around 35 km to the
north-east of the island of Helgoland in the German North Sea region.
LEANWIND D5.3- project no. 614020
12
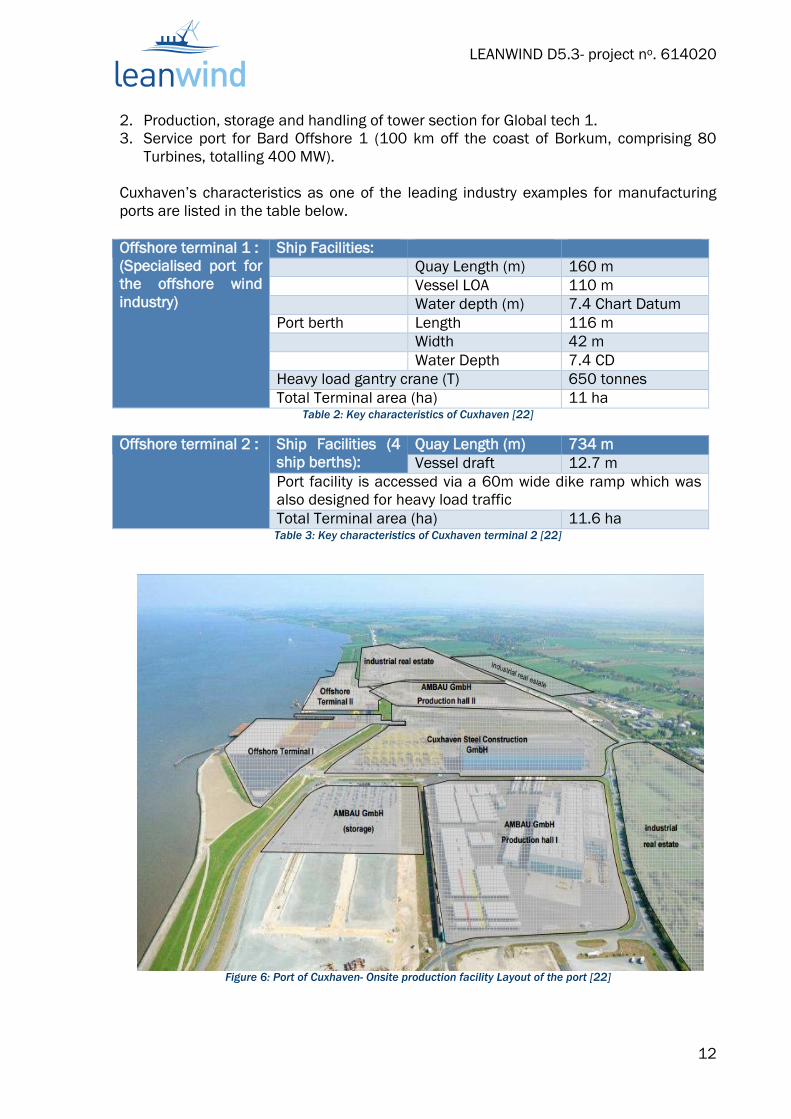
2. Production, storage and handling of tower section for Global tech 1.
3. Service port for Bard Offshore 1 (100 km off the coast of Borkum, comprising 80
Turbines, totalling 400 MW).
Cuxhaven’s characteristics as one of the leading industry examples for manufacturing
ports are listed in the table below.
Offshore terminal 1 :
(Specialised port for
the offshore wind
industry)
Ship Facilities:
Quay Length (m) 160 m
Vessel LOA 110 m
Water depth (m) 7.4 Chart Datum
Port berth Length 116 m
Width 42 m
Water Depth 7.4 CD
Heavy load gantry crane (T) 650 tonnes
Total Terminal area (ha) 11 ha Table 2: Key characteristics of Cuxhaven [22]
Offshore terminal 2 :
Ship Facilities (4
ship berths):
Quay Length (m) 734 m
Vessel draft 12.7 m
Port facility is accessed via a 60m wide dike ramp which was
also designed for heavy load traffic
Total Terminal area (ha) 11.6 ha Table 3: Key characteristics of Cuxhaven terminal 2 [22]
Figure 6: Port of Cuxhaven- Onsite production facility Layout of the port [22]

LEANWIND D5.3- project no. 614020
13
2.2.2 Port’s layout
The port’s layout configuration plays an important role in the efficiency of operations
related to installation of the components and the impact of a suitable or an unsuitable
port on a project is significant. The turnaround time -the time it takes for transporting
and installing one turbine for an installation cycle- could be shortened if the port’s layout
and access lanes are suitable [12]. However the opposite case, will constrain all parts of
the project as for example a small port with poor access could cause a slow down on the
supply of components. If due to poor layout and handling in the port, components are
stacked up at the quayside which is used for loading and offloading, the waiting time for
the vessels will be longer, which will impact the cost and timing of the project. Figure 6
shows the layout of an installation port where manufacturing facilities are located within
the port. This layout allows for the components to be taken directly from their point of
manufacturing to the quayside where they can be loaded onto the installation vessels.
Figures 9, 10, 11 illustrate suitable layouts suggested for installation, O&M and
decommissioning ports. A suitable port for offshore wind development must have
adequate space for delivery and assembly of turbine components. Based on [16]
developers do not necessarily have to stage foundations for offshore deployment out of
the same port that is staging the turbine construction. The value of the convenience of
utilising a common port or port facility generally would not outweigh the cost savings
associated with improved logistics, less assembly, and minimised storage space and
handling needs [16].
The storage space availability is needed to supply the manufacturing and assembly of
turbine components (figure 7). The port’s layout should be in a way that the storage area
is in direct connection with the pier front area in order not to transport the components
too far or for too long during storage, preassembly or loading. Area of 6.5 to 7.5 ha to
store enough components before the projects starts is suggested [12]. Hence 50-70% of
all components must be delivered to the storage area in the installation port prior to the
start of the project [12].
Furthermore, the new components delivered to the port need to be stored for later
assembly. For supporting the routine inventory at the port, a large storage area is
required. For instance, Vestas generally require 20 turbines to be assembled ahead of
time before transport to the installation site [16]. The storage space could also create a
hedge against inclement weather conditions, and accommodate the components until
the condition is ready for delivery to the site. Towers require storage in large numbers
and, if laid down, will require individual access to lifting and thus large areas. They are
not typically stacked when stored horizontally. If space is at a premium they can be
stored upright, at the cost of additional cranage [11]. Nacelles are stored in frames, with
the frame bolted to the nacelle at the tower/nacelle transition [11]. As the foundations
are major sized components, allocating storage space to these structures might not be
feasible in all ports. Alternatively in some cases barges or pontoons, i.e. floating storage,
may be used to store the foundations (Figure 8). Foundations can be delivered and/or
stored on barges fully assembled, then tugged to the installation site which results in
less handling and cranage cost.

LEANWIND D5.3- project no. 614020
14
Figure 7: Onsite port storage for wind turbine components [23]
Figure 8: Jacket structure stored on a pontoon [24]

LEANWIND D5.3- project no. 614020
15
Suggested layout for Installation port:
Inbound transport of components:
One vessel per component type or
one vessel with several
component types
Blades
Towers
Nacelle
Note: assuming transition piece
and foundation delivered directly
to offshore site
Outbound transport of wind turbine:
Loading to one installation vessel
Blades
Racks for 1-blade installation
Installed at hub for rotor star installation
Towers
Single pieces for multiple-lift offshore
installation
Fully installed at staging areas, one-lift
offshore installation
Nacelle
Single pieces for multiple-lift offshore
installation
Fully installed at staging areas, one-lift
offshore installation
Unloading LO-LO • Quay cranes
• Mobile cranes
• Crawler cranes
• Vessel cranes
Loading LO-LO • Quay cranes
• Mobile cranes
• Crawler cranes
• Vessel cranes
Unloadin
g RO-RO
Staging
area blades
Storage
Nacelle • Incl
spinner,
hub and
nacelle
Loading
RO-RO
Storage Towers
Unloading
road/rail-based
deliveries
Staging
area
nacelle
Staging
area
towers
Storage Blades
Figure 9: suggested layout for an installation port [25]

LEANWIND D5.3- project no. 614020
16
Suggested layout for O&M port:
Inbound transport
• Multiple types of components per
vessel
• Nacelles and towers very
infrequently transported to port
• Broken blades
• Lightweight components to repair
or replaced
Outbound transport
• Outbound transport of
equipment, spare parts and
repaired components
• Outbound transport of
personnel to troubleshoot,
reset, and repair WTGs
(corrective maintenance)
• Outbound transport of
personnel to perform planned
maintenance
Figure 10: Suggested layout for O&M port [25]
Unloading LO-LO • Quay cranes
• Mobile cranes
• Crawler cranes
• Vessel cranes
Loading LO-LO • Quay cranes
• Mobile cranes
• Crawler cranes
• Vessel cranes
Unloadin
g RO-RO Loading
RO-RO
Repair shop incl spare parts
Unloading/load
ing road/rail-
based
deliveries
Storage/staging area for outbound transport
Storage for
terminated
components
Roof covered
storage for
components to
be repaired (either sent to
OEM or repaired
at port)
Loading
terminate
d
componen
ts for
road/rail
transport

LEANWIND D5.3- project no. 614020
17
Suggested layout for Decommissioning port:
Unloading LO-LO • Quay cranes
• Mobile cranes
• Crawler cranes
• Vessel cranes
Loading LO-LO • Quay cranes
• Mobile cranes
• Crawler cranes
• Vessel cranes
Unloadi
ng RO-
RO
Scrapping
towers
Loadin
g RO-
RO
Storage of metal
for sea transport
Storage for
road/rail
transport
Storage of glass
fibre for sea
transport
Storage
chemical
s Storage for
road/rail
transport
Storage
electrical
compone
nts
Scrapping
nacelles
Scrapping
blades
Inbound transport:
Installation vessels with
Blades
Towers
Nacelle
Outbound transport:
Loading on bulk vessels for transporting the
parts to recycling
Figure 11: Suggested layout for Decommissioning port [25]

LEANWIND D5.3- project no. 614020
18
2.2.3 Component handling capabilities
While day-to-day personnel and light equipment transfers benefit greatly from short
transit times, wind turbine overhauls or planned major component replacement are less
distance sensitive but require more substantial load-out and crane capacity [26]. In
order to minimise the waiting time for the installation vessels, the ports should assure
that the components are ready for loading at the quayside by the time the installation
vessel arrives at the port. The agreed number of components will be placed in the
quayside in a setup that allows the crane on-board the installation vessel to lift them
without having to move around more than necessary or to relocate the vessel [12].
Hence an accurate scheduling and the availability of necessary component handling
equipment at the port would help avoiding the excess cost associated with the vessels
waiting for the components to be loaded. Furthermore, since bad weather conditions
may occur when the vessels arrive offshore, the waiting time at the port for loading and
preparing components should be as low as possible. This could prevent the contractor
asserting that the missed usable weather windows were due to the delay in loading the
vessel, restricting the claim that the client or wind farm owner has against the supplier
[12].
A. Cranes:
Availability of cranes in the port for offshore operation is of vital importance. Although
every offshore project requires different types of cranes, the industry suggests the
availability of large cranes (up to 1000 tonnes) in the ports [17, 18]. Wind turbine
components including the nacelle, blade and towers require carnage at the port. Nacelle
is one of the heaviest components of the wind turbine and for nacelles a mobile crane
capacity of up to 350 tonnes is desirable. Wind turbine blades weigh in the order of tens
of metric tonnes, but, these weights are likely to increase as technology trends push
towards larger offshore machines. It is likely that transport vessels will load-out
significant numbers of blades; however, blade weights are well within the capacity of
suitable mobile cranage. For towers, it is becoming increasingly common to install
complete towers offshore to reduce offshore operations, so a large crane capacity may
be required [11].
For the foundation structures, it is preferable that they are fabricated, either close to the
quay edge or by a manufacturer with unrestricted access and ability to move the
foundations to the edge of the quay or from the manufacturing facility directly to the
offshore site by using barge or crane vessel [12]. From the port facility, the foundations
are either lifted or rolled on board. Among the most cost effective solutions is rolling,
when using a barge. A crane vessel can also be used for that purpose; however the cost
would be higher [12].
Crawler cranes:
A crawler crane consists of an upper carriage mounted on a crawler type undercarriage
(Figure 12). The upper deck and attachments rotate 360º. A crawler crane features
either a box or a lattice type straight boom and it may be equipped with an optional jib

LEANWIND D5.3- project no. 614020
19
(boom extension). At the end of the boom and/or jib is a wire rope suspended implement
such as a grapple, clamshell, crane hook, or electric magnet. Crawler cranes are
implemented for many applications and are therefore exposed to a wide range of
external hazards during normal operation, not only to the operator but also to the
maintenance personnel and others nearby [27].
Figure 12: Crawler crane in Cuxport assists in ‘Amrumbank West’ Monopile operations [28]
Floating cranes:
Floating cranes are the cranes that execute the lifting of the components while operating
on water (Figure 13). Hence their positioning may change and it is not fixed. Floating
cranes areas of use include: general salvage work, installation and maintenance of wind
turbines, loading and unloading heavy goods or repair work. The platforms are located in
ports or out at sea. In either case, for floating cranes precise manoeuvring to their
destination is essential [29].
Figure 13: Matador 3 floating crane is loading the jackets at Bremerhaven (RWE) [30]

LEANWIND D5.3- project no. 614020
20
B. Self-Propelled Modular Transport (SPMT):
Some offshore projects have managed to avoid the need for heavy cranage at the port
facilities by loading turbines and foundation components onto SPMTs (Figure 14). The
components can then be loaded by using Roll-on Roll-off (explained in section C) ship-
type vessels or transport barges loaded from Ro-Ro link-spans or the SPMTs can deliver
the component to the quayside where it is then lifted onto the vessel using an onshore
or on-board crane [11]. SPMTs have been a common means of transporting large
offshore wind components between the quayside and the storage area [11]. Common
forms of SPMTs have individual two-axle units with a load carrying capability of up to 30
metric tonnes per axle (tonnes/axle) and can be arranged side-by-side or end-to-end in a
rolling transporter for extremely large loads. Nacelles and towers which mainly are
transported via SPMT in the port could exert a pressure of 10 tonnes/m2.
Figure 14: 2×6 axle line SPMT assembled as one self-propelled modular transporter (SPMT) [11]
C. Roll-on/Roll-off capability:
Roll-on Roll off capability refers to access ramps used for loading the components and
has been identified as an important requirement for offshore wind ports [17]. This
capacity is desirable since rolling load out is far cheaper than lifting in some
circumstances [11]. This capability is important since it reduces the use of heavy cranes
and provides a more convenient way to load the components. If the ports do not have
permanent Ro-Ro berths, it is possible to accommodate this facility by using a mobile
Ro-Ro ramp [11]. This is a highly specialised piece of equipment, as it enables extension
of a port’s capability beyond that of its fixed infrastructure. Ro-Ro ferries have been used
in the Gwynt y Mor project, where the components of the wind turbines were regularly
delivered to port of Mostyn by a Ro-Ro ferry from their manufacturing factory in Brande,
Denmark [31].
D. Lift on/ Lift off capability:
Lo-Lo vessels can transport a range of different products as a result of their flexible
cargo space, container capacity, and on-board cranes. Lo-Lo cargo is either
containerised cargo or other types of cargo that may be too large to ship in containers or
on Ro-Ro ships. A Lo-Lo operation is when cargo is loaded and discharged over the top of

LEANWIND D5.3- project no. 614020
21
the vessel using cranes or derricks. Lo-Lo vessel load and unload cargo at Ro-Ro ports,
Lo-Lo ports and at un-serviced jetties, using its own cranes. Self-geared Lo-Lo type
vessels are loaded and unloaded by a crane, which lifts cargo to a specific location in
the Lo-Lo ship [32].
E. Dry dock:
Availability of a dry dock at the port could be ideal for the construction and fabrication of
large scale components such as gravity based (concrete) foundations, allowing for a
variety of manufacture and load out concepts to be tested and implemented. The dry
dock can be used for prototype and serial manufacture of gravity based foundations
[33], as well as floating foundations including semi-submersible and tension leg
platforms [14].
Figure 15: Floating dry dock [34]
F. Pontoon:
For offshore wind, pontoons could be used as a temporary storage for foundations and
for the transport of heavy load components. BLG logistics [35], based in Bremen,
Germany, has developed a special pontoon which allows for
Swift loading and unloading
Different applications, in particular transport of further large components for offshore
wind farms
Quick retrofitting of the pontoon for different loading cases and operations at short
notice
Control of the inclination of the pontoon and the load on the quay via an efficient
ballast system
Pontoons are also being used for the transfer of crew and technicians. The multi-million
pontoon developed for the Gywnt Y Mor wind farm, was commissioned with power, water

LEANWIND D5.3- project no. 614020
22
and re-fuelling locations built in and has reduced the transfer time to the site. Also, since
the pontoon is less tidally restricted, the access to and from the port is greatly enhanced
[36].
Figure 16: Two tripods are transported using BLG’s OFFSHORE BHV 1 pontoon [35]
2.2.4 Vessel access
In the offshore wind industry, vessels are used for the execution of different phases of
the project and the ports must have suitable quayside and draft for accommodating
these deep draft vessels. For the construction phase, wind turbine components are
either directly transported from the manufacturing facility to the offshore wind farms, or
transported to an installation port where they are stored and assembled and then
shipped to the offshore site. For the operations and maintenance phase, smaller
components and crew are transferred by smaller vessels or boats, and for the
decommissioning phase, it is expected that the turbine components will be shipped back
to an onshore facility for recycling normally via the same vessels used for the installation
phase [54].
For all the phases mentioned above, suitable ports where the vessels can dock, load
and un-load the components are needed. The offshore wind industry is expected to use
both specialised vessels and vessels ‘diverted’ from the oil and gas sector as long as the
latter are available on time. Examples of vessels active in the oil and gas industry
include Seaway Heavy Lifting’s Stanislav Yudin performing monopile and substation
installation, and Seajack’s new build vessels Kraken, and Leviathan specified with both
wind farm and oil and gas work in mind, being chartered for wind turbine installation
[17].
The majority of dedicated vessels used by the offshore sector are in the site construction
vessel category [3]. Within this category, the installation of substructures and turbines
are the main operations and many technical specifications have to be met by the vessels

LEANWIND D5.3- project no. 614020
23
in order to carry out the work. Different options for site construction vessels are: jack–up
vessels, leg stabilised crane vessels, dynamic positioning (DP2) Heavy Lift Cargo Vessels
(HLCV), semi–submersible heavy lift vessels, shear-leg crane barges, and floating dumb
barges with crane [3].
Nacelles are normally carried on heavy lift cargo vessels and the suitable draft to
accommodate HLCVs is a minimum of 8 metres. Jack-up barges have also been used for
carrying and installing the nacelles. An example of a jack-up barge used in the industry is
JB 117 (Figure 18), suitable to be equipped with a portable dynamic positioning system
(DP 2) [37].
For blades, HLCVs are used, as they are increasingly fitted with container-twist-locked
frames and loaded in groups of three at a time, which requires significant cranage lift
weight and outreach, only found on larger heavy-lift crane vessel.
Tower transportation could be via barges, but may use HLCVs, so the draft of the latter
has been used as the limit [11].
The port serving these jack-up vessels must have a suitable sea bed, and jack-up
capacity assessment will be required for the quayside. Measurements of the soil
strength adjacent to the quayside will be needed to ensure that layering of sub strata
does not include thin hard layers of soils overlaying weaker soils which can lead to jack-
up leg punch-through failure [11]. For ports to accommodate installation vessels,
developers require the following characteristics [17, 18]:
Draft of up to 10 metres
Quayside of up to 300 metres
No locks, tidal restrictions, or overhead restrictions
Water way of up to 200 metres
Quay bearing capacity of up to 10 tonnes/m2

LEANWIND D5.3- project no. 614020
24
Figure 17: Hub with blades in star configuration assembled at the port for the Borkum West II Windfarm, Germany
[80]
Figure 18: JB-117 installing the nacelle [37]
For transporting foundations from the ports to the offshore site, different methods exist.
Monopiles can be transported via HLCVs or barges. Gravity base foundations and jackets
are normally transported on a barge and then lowered into position. For the Thornton
Bank project, Rambiz a crane barge able to lift unusual structures that would otherwise
require two separate vessels, was used to carry the gravity base foundations (Figure 19).
For the Oremond project, foundation jackets and a substation jacket on barges (4
jackets on each barge on a vertical position) were shipped from fabrication yard at the

LEANWIND D5.3- project no. 614020
25
north-east coast of UK to the mid-west coast of UK. Once on site, the HLV Rambiz lifted
jackets from the barge and mounted it on top of the pre-installed piles. Once the jacket
was placed, a separate DP2 grout vessel inserted grout into the annulus between jacket
and the piles [38].
Future wind turbine installation vessels are expected to focus on improving construction
efficiency by increasing their transit speeds, payload capacity, and ability to erect
turbines in higher wind speeds and harsher sea states. Some firms are developing
designs that accommodate the transport and installation of fully assembled turbines
[16].
In the table below, a list of some installation vessels currently being used in the industry
for foundations and turbine components has been compiled.
Installation
vessels:
LOA
(m)
Min
draft
(m)
Max
draft
(m)
Beam
(m)
Max
crane
(tonnes)
Purpose
Thialf 201.3 11.8 31.6 88.4 14200 Deep water construction vessel,
customised of installation of
foundation, moorings, Spars,
TLPs.
Svanen 102.75 3.5 4.5 71.8 8700 Designed specifically for
offshore installation projects
involving large and heavy
structures.
Saipem
7000
197.95 10.5 27.5 87 14000 Has the capacity to handle the
entire work scope of offshore
construction developments.
Rambiz 85 3.6 44 3300 Can operate in deep and
shallow water. Combination of
two cranes enables her to lift
unusual structures that would
otherwise require two separate
vessels.
Innovation 147.5 7.33 42 1500 Innovation enables safe loading
and installation of 6 MW wind
turbines with overall height of
more than 120 m as well as
heavy foundations in water
depths of up to 65 m. Table 4: Installation vessels [39]

LEANWIND D5.3- project no. 614020
26
Figure 19: Rambiz lifting GBF at port of Oostende [40]
Figure 20: Scaldis Salvage & Marine Contractor's heavy lift vessel Rambiz was used to install the jacket foundations
for the Ormonde project located at the North West coast of the UK. Image courtesy of Vattenfall [41]

LEANWIND D5.3- project no. 614020
27
Figure 21: Innovation loaded with monopiles and transition pieces at Aalborg, Denmark for Westermost Rough wind
farm, UK [42]
Figure 22: 5000 tonnes mono-hull DP crane vessel Oleg Strahnov, installing wind turbine foundation tripods at
Borkum West II Windfarm, Germany [43]

LEANWIND D5.3- project no. 614020
28
Tugs boats:
Tug assistance is usually not required for self-propelled wind turbine installation vessels,
since these vessels are able to move and position themselves using their own
propulsion and dynamic-positioning systems. Barges, however, require at least one tug
of approximately 4,000 to 5,000 horsepower (hp). In addition, a smaller tug of around
1,000 hp may be needed to help position the vessel for jacking operations. Additional
necessary vessels include high-speed crew boats during wind farm construction and
several auxiliary vessels to complete the marine fleet. Tug boats could be provided by
the port or third party companies offering services to the offshore wind industry.
2.2.5 Port’s bearing pressure and surface area
Ground bearing capacity has been identified as one of the most important parametres
for a suitable offshore wind port due to the heavy weight of the wind turbines
components and substructures. The bearing capacity is defined as the ability of the
ground surface to support the weight of a specific component. The soil bearing capacity
is the maximum bearing pressure that soil can support before failure occurs [11]. A
minimum ground bearing capacity of 10 tonnes/m2 has been identified suitable by the
industry [11, 17].
Once a port has been chosen, the port’s bearing capacity must be documented. If the
port is not suitable to handle the axle loads of the trucks and trailers moving the
components, the surface must be repaved, which could add a significant cost to the
contract [12]. For heavy components, regular asphalt is not enough and the surface
must be strengthened so that it does not crush under the weight of the components
[12]. A surface of concrete or asphalt will prevent dust and nicks from pebbles from
damaging the outer layer of the turbine components. This is important since all the
Figure 23:Self-Elevating Platform towed from Borwin Alpha site [44]

LEANWIND D5.3- project no. 614020
29
components are painted or fibreglass coated. The Marine Warranty surveyor and
installation contractor will be very wary about these types of damage because this could
also pass a scratch when loading or installing the component [12].
2.2.6 Port’s connectivity
a. To the wind farm:
Snyder and Kaiser (2008) [45] suggest that the distance to shore is positively related to
the capital costs. The distance from the port to the wind farm has an impact on the
construction and O&M costs. During the construction phase, vessels have to make few
trips between the site and the port for loading additional equipment. Given the cost of
these trips, the closer the site is to the port, the less expensive the installation will be.
The distance to the port, also dictates the amount of transmission cabling.
For the O&M phase, the crew have to make regular trips to the wind farm for monitoring
the turbines and the foundations. Locating the crew as close as possible to the wind
farms will decrease the environmental impact and costs of maintenance. The current
trend shows that, the future projects are moving further from shore and in deeper waters.
The average water depth of completed or partially completed wind farms in 2014 was
22.4 m and the average distance to shore was 32.9 km [2]. Hence, the port’s proximity
and accessibility to the wind farm could be a significant factor influencing the developers’
decision for selecting the suitable port for their operation.
b. To the component supplier sites:
Denmark and Germany have been and continue to be the host to a significant amount of
established infrastructure, particularly in terms of wind turbine manufacturing facilities
[17]. The Netherlands and Belgium have also enjoyed significant participation, especially
by the provision of installation services drawing on significant North Sea oil and gas and
coastal engineering experience. Electrical equipment and subsea cable supply has a
more distributed supply base with notable contributions from Norway, Sweden, Germany
and Italy.
The UK, which until recently had not played a significant role in the supply to the offshore
wind sector, has seen substantial recent investments, with new facilities being
established primarily along its east coast to serve domestic and export markets in the
North Sea [17]. For instance, JDR Cables based at the port of Hartlepool has secured
their third order for inter-array cables into German offshore wind farms, the most recent
one being the Vattenfall AB Sandbank project, announced in September 2014. The
company has now won more than £100 million of orders [46]. For The Gwynt y Mor
project, located 13 km off the North Wales coast, two offshore substations were
fabricated. Siemens had appointed Belfast shipyard Harland and Wolff (H&W) for
fabrication of these substations, and BiFab, based in Fife, for the design and
manufacture of both substation foundation jacket structures [47]. BiFab used a proven
design in delivering the contract and worked alongside H&W to design and manufacture
the substations [47].

LEANWIND D5.3- project no. 614020
30
c. To road, rail, air transport:
Proximity of a port to road networks will facilitate the transportation of components such
as blades. Also, during the decommissioning phase, the dismantled components can be
transported to the recycling centres via the road networks. Use of rail system, however,
is much less common for the transport of larger components and the manufacturers
tend to ship the components to or from the ports.
For the O&M phase, proximity of the port to heliports is particularly important. In some
recent offshore projects, e.g. Greater Gabbard, UK, Helicopters capable of carrying 2-3
technicians, are complementing work boats and are employed during inclement weather
and when quick access to the wind farm is required. Technicians could be transported
and placed directly on the nacelle and start the work with a short transition time from
the port to the site.
Figure 24: 63.5 m blade transported to the Port of Oostende [24]

LEANWIND D5.3- project no. 614020
31
Figure 25: Use of helicopters for servicing turbines [48]
2.2.7 Security at the port
Since 2001, the security level of the ports worldwide has drastically increased. Ports
used for the offshore wind are no different from ports used for other purposes and they
are subject to international regulations and security measures (i.e. International
Standard for Port Security, ISPS). With almost 500 personnel working in the port on a
project, managers have a difficult task fencing in the area and accounting for all the
people working on the project. Every person entering or leaving the port, or a vessel in
the port, must be accounted for with personal details, company references, and the type
of business to be carried out [12].
For addressing these security issues, authorities have created control measures through
a tagging system which is able to record the position of all personnel using chip identity
cards and monitoring points at every entry or exit possibility [12].
LEANWIND D5.3- project no. 614020
32
3. Installation, operations and maintenance and decommissioning strategies from
ports
3.1 Installation
In projects where the components cannot be directly shipped from the manufacturing
facility to the offshore site, they are first delivered to an installation port where the
components are pre-assembled and stored, before loading onto the vessel and
transferred to the offshore wind farm site [49]. Installation ports could also be used for
servicing the offshore wind farms, an example of which is Mostyn in North Wales. This
port is capable of supporting construction of up to 300 MW turbine capacity per year.
Large areas of land are required due to the space taken when turbines are stored lying
down on the ground. Two turbines take up nearly 2 ha of space. Port of Mostyn has
provided a base for offshore wind construction as well as offshore wind support. Port of
Mostyn has been the installation base for North Hoyle, Burbo Bank, Robin Rigg, Rhyl
Flats, Walney 1, Walney 2 and Gwynt-y-Mor projects and supports the servicing of the
North Hoyle, Rhyl Flats and Gwynt-y-Mor wind farms [50].
According to [51], completing as much of the operations onshore as possible, saves time
and money during the installation phase, and it is independent of offshore wind and
wave conditions. The components could be loaded on the installation vessels in different
configurations depending on the available deck space on the vessel, port facilities such
as lifting equipment, available space on the ports, distance from the offshore site and
weather windows (different installation methods are shown in Figure 26).
As the installation operations take place offshore with varying wave and weather
conditions, by choosing the best installation strategy, the weather windows can be used
optimally. For larger sites located further from shore, however, new concepts such as the
Dutch harbour at sea, consisting of multi-purpose platforms which could allow for better
usage of weather windows and reduction in sailing times are in the research phase [17].
Additionally, there is a general move away from installation (mobilisation) ports and
alternatively components are exported directly from manufacturing facilities to the
offshore wind site in order to save costs [17].
However, the trend of exporting directly from the manufacturing facility may reverse or
slow down due to alternative scenarios in the supply chain. Access to lower labour costs
has persuaded many of the manufacturers to relocate the production facilities to
Eastern Europe. Also, there is a drive in certain regions towards initiatives such as
cluster building for offshore wind manufacturing in closely located ports. This is being
pursued via co-operation between the public and private sectors [17].
3.1.1 Installation methods
As illustrated in Figure 26 in the installation method number 1, all parts are assembled
offshore and the port will be used minimally for assembling purposes. On the contrary, in
the installation method number 6, the port will be used for assembling the full turbine
before delivering it to the site. By assembling most of the components or the full turbine
onshore, the installation time will be decreased as the turbines could be lifted and
installed in fewer movements. However, this method is constrained by vessel availability.

LEANWIND D5.3- project no. 614020
33
As of today there are very few vessels capable of carrying a fully assembled turbine
offshore as there are limitations on the cranes’ capacity and the available deck space.
Based on an analysis done by [52], the most cost-effective method is the bunny ears
strategy with 1-part tower (installation method number 5), and the most expensive is the
fully pre-assembled strategy (installation method number 6).
This is due to the fact that although the single lift strategy requires the least offshore
operations time, the method is affected significantly by weather limits and the
availability of vessels and heavy lift cranes. All other methods have a wind and wave
limit of 8 m/s and 2 m, respectively, while the fully pre-assembled method has a wave
height limit of 0.75 m. Additionally, the heavy lift sheerleg crane used for fully assembled
turbine, is substantially more expensive than the jack-up vessels used for the other
installation strategies [52].
Figure 26: Diagrammatic representation of installation methods [8]
3.2 Operations and maintenance
Operations and maintenance of the wind farm is the longest of all phases as the wind
farm needs servicing during the entire almost 25 years of its lifecycle. Developers
normally look for ports which are willing to commit to this long period and provide regular
service for the wind farms. Pointed out by one of the interviewees, a harbour master at
an O&M port located in south of England, although the O&M ports must satisfy the
technical requirements, but O&M has a very strong commercial side for developers and
the negotiations with ports mostly concerns the commercial issues rather than the
technical issues at ports.
Operations and maintenance ports, smaller ports compared to installation ports, are
normally within close proximity to the wind farm, which can provide support services to
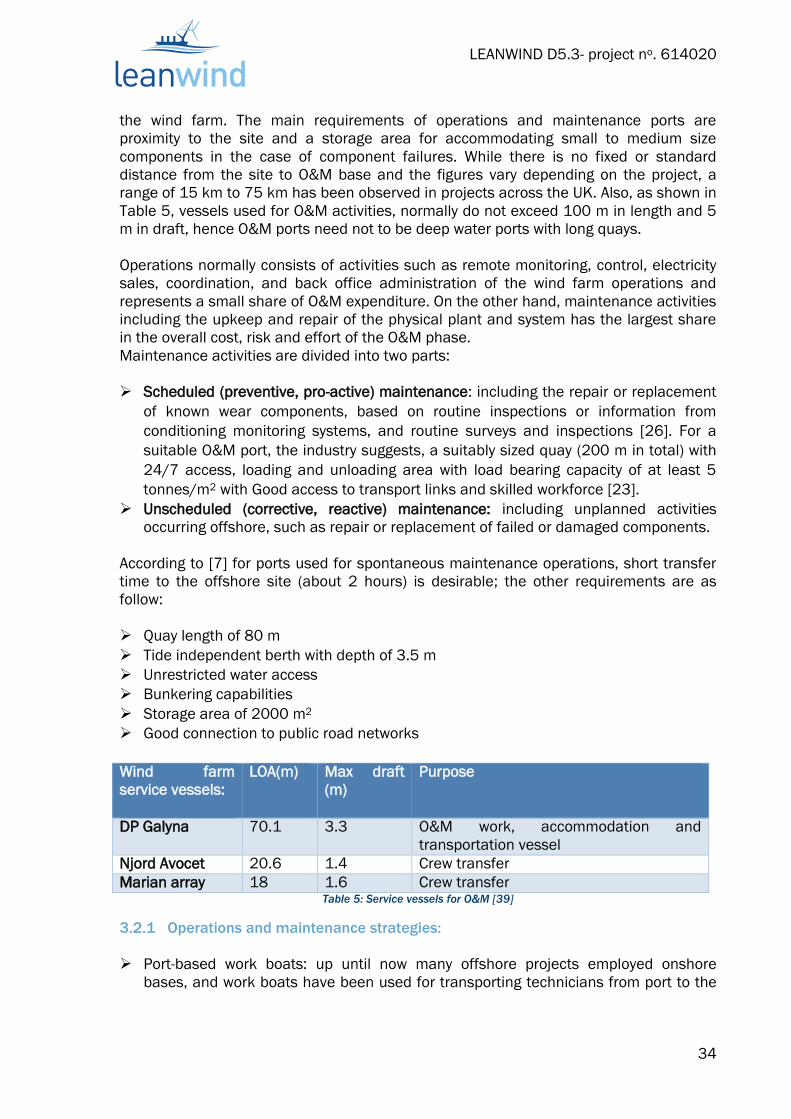
LEANWIND D5.3- project no. 614020
34
the wind farm. The main requirements of operations and maintenance ports are
proximity to the site and a storage area for accommodating small to medium size
components in the case of component failures. While there is no fixed or standard
distance from the site to O&M base and the figures vary depending on the project, a
range of 15 km to 75 km has been observed in projects across the UK. Also, as shown in
Table 5, vessels used for O&M activities, normally do not exceed 100 m in length and 5
m in draft, hence O&M ports need not to be deep water ports with long quays.
Operations normally consists of activities such as remote monitoring, control, electricity
sales, coordination, and back office administration of the wind farm operations and
represents a small share of O&M expenditure. On the other hand, maintenance activities
including the upkeep and repair of the physical plant and system has the largest share
in the overall cost, risk and effort of the O&M phase.
Maintenance activities are divided into two parts:
Scheduled (preventive, pro-active) maintenance: including the repair or replacement
of known wear components, based on routine inspections or information from
conditioning monitoring systems, and routine surveys and inspections [26]. For a
suitable O&M port, the industry suggests, a suitably sized quay (200 m in total) with
24/7 access, loading and unloading area with load bearing capacity of at least 5
tonnes/m2 with Good access to transport links and skilled workforce [23].
Unscheduled (corrective, reactive) maintenance: including unplanned activities
occurring offshore, such as repair or replacement of failed or damaged components.
According to [7] for ports used for spontaneous maintenance operations, short transfer
time to the offshore site (about 2 hours) is desirable; the other requirements are as
follow:
Quay length of 80 m
Tide independent berth with depth of 3.5 m
Unrestricted water access
Bunkering capabilities
Storage area of 2000 m2
Good connection to public road networks
Wind farm
service vessels:
LOA(m) Max draft
(m)
Purpose
DP Galyna 70.1 3.3 O&M work, accommodation and
transportation vessel
Njord Avocet 20.6 1.4 Crew transfer
Marian array 18 1.6 Crew transfer Table 5: Service vessels for O&M [39]
3.2.1 Operations and maintenance strategies:
Port-based work boats: up until now many offshore projects employed onshore
bases, and work boats have been used for transporting technicians from port to the
LEANWIND D5.3- project no. 614020
35
site. Here they transfer onto the offshore structures using a simple “step over”
approach. The ‘onshore based marine access’ method uses specialised work boats
based at a coastal port. Although this strategy has relatively low running costs, it is
limited by the sea states. However, developments in the work boat designs, and
methods of transfer from boat to the turbine offer some potential for increasing the
limiting wave height and speed of transit [26].
Helicopters: In situations where the wind farm is located further offshore, with a high
risk of inclement weather and sea conditions, the O&M strategy of using only
workboats may not be optimal, as the longer transit times can result in missing the
short favourable weather windows. In such situations, helicopters can provide fast
access to the site. It is often shown that the reductions in down time achieved by
using helicopters outweigh their operation costs [53]. The Greater Gabbard project
located in southern North Sea was the UK’s first helicopter support strategy. Greater
Gabbard is almost 74 km (40 NM) away from its O&M base in the port of Lowestoft.
Since September 2012 Helicopters are routinely deployed to hoist the technicians
onto specially designed turbines. Helicopter access is especially important in winter
time when the turbines cannot be accessed via sea transfer due to the inclement
weather.
Fixed or floating offshore base (e.g. ‘motherships’): As projects begin to be based
further offshore, work boats may also operate from fixed or floating offshore bases to
significantly reduce the time required for transit to and from site. Such offshore
based approaches require technicians to live for some or all of the year on offshore
accommodation near the vicinity of the wind farm, on one of the following:
1. Fixed base: A platform with accommodation, boat landings and helipad. Work
boats and/or helicopters provide access from the base to the turbines.
2. Hotel Ships: Accommodation vessels which cannot dock directly with the
turbines. Turbine access is achieved by “daughter craft” work boats or quick
access vessels [26].
3. Floatels and Offshore Support Vessels (OSVs): Accommodation vessels, 50–100
m long, with dynamic positioning (DP) capabilities and an access system or
gangway to enable direct access to the turbines [26].
4. Motherships: Accommodation vessels, 50–100 m long, with one or more
deployable “daughter crafts”, and specialist access system for direct access to
the turbines. The mothership would return to port every 2-4 weeks for crew
exchange. These strategies have higher capital and operating costs than a ‘work
boats only’ approach. However, the greater cost is offset by the improved access
to turbines, which will boost availability and hence reduce lost production [26].
3.2.2 Availability vs. Cost
Based on [26], whereas the number and reliability of the turbines commissioned in a
wind farm impact the cost of O&M, the most influential factor is the distance of the wind
farm from the onshore base. Distance from site is generally the key deciding factor,
particularly if an onshore-based approach to access is adopted.
The choice of operations and maintenance strategy is made by comparing the cost of
operations and maintenance against the potential revenue loss due to turbines being

LEANWIND D5.3- project no. 614020
36
out of operation. According to [26], theoretically, maintaining 100% availability of the
turbines may not the optimal solution to minimise the total cost, but turbine availability
of around 92% minimises the total O&M costs.
It should be noted that availability is a technical metric and not directly related to the
wind resources. It is important not to confuse this parameter with capacity factor, which
is a measure of the output of the project and is influenced by the average wind speed at
the site, and is also expressed in percentages. Table 6 lists the cost optimal O&M
strategy for a range of wind farm site distances from shore.
Distance from shore O&M strategy
Less than 22 km (12 NM) Workboat strategy
22km-75km (12-40 NM) Heli-support
More than 75km(40NM) Offshore based strategies (mother ships,
floatels) Table 6: Probable cost optimal O&M strategies [26]
It should also be noted that the development status of the projects significantly reduces
as the projects’ distance from port increases – no projects further than 40NM from port
have yet progressed past the planning consent milestone. As the UK offshore wind
sector matures, the workboat-based O&M strategies seen until now will be joined by
increasing numbers of turbines being serviced under heli-support and eventually
offshore-based strategies [53].
3.3 Decommissioning of the wind farm
Final decommissioning of the wind farm components or their replacements would take
place when they have reached the end of their design life which is estimated to be
around 25 years. Decommissioning could involve the entire wind farm or removal of
selected components [54]. Currently, the industry agrees that decommissioning
operations will be performed similarly to the installation activities, but in the reverse
order [55]. In an appropriate context this is a reasonable position to take. However, this
is based on the assumption that the wind farm components will still be in a reasonable
mechanical condition and hence amenable to the reverse-engineering required for
decommissioning at the end of their service life. It is probable that there will be wind
farms that will fall into this category, i.e. a mechanical and structural maintenance
schedule has been followed all the way to the end of the farm’s active generating life
[56].
However, in case the farm’s elements are not in reasonably good mechanical and
structural condition, then this critical assumption may not hold, imposing significant
consequences on the viability of a decommissioning plan based on reversing the
installation process [56]. For this study, however, our analysis is based on the
assumption that decommissioning will be executed in the reverse order of the
installation process.

LEANWIND D5.3- project no. 614020
37
3.3.1 Decommissioning strategies
Based on the assumption that decommissioning is the reverse of the installation
process, it is likely to involve the following sequence [54]:
Each turbine is disconnected from the electrical distribution and SCADA system.
Any hazardous or potentially polluting fluids or materials are removed from the
nacelle so far as the risk assessment identifies them as posing a potential hazard to
the environment during turbine dismantling.
A vessel similar to that used during installation is mobilised to the site.
The rotors are unbolted from the nacelle and lifted onto the decommissioning vessel.
The nacelle is unbolted from the tower and lifted onto the decommissioning vessel.
The tower sections are unbolted and lifted onto the decommissioning vessel.
All of the components are transported to the port, and dismantled.
The decommissioned turbines may be overhauled and sold for re-use.
Redundant material such as steel from the towers or other components would be
recycled where possible and other materials disposed of in an approved manner.
Decommissioning of monopiles and jacket structures is likely to proceed as follows:
Divers are deployed to inspect each pile footing and reinstate lifting attachments if
necessary.
A jack-up barge or heavy lift vessel is mobilised to the site.
Any scour protection that has been placed around the base of the support structures
is cleared where it is obstructing the cutting process.
Crane hooks are deployed from the decommissioning vessel and attached to the lift
points.
The pile(s) is cut below the natural level of the seabed, as appropriate.
Following the pile removal, the seabed is inspected for debris and any found is
subsequently removed.
The pile, transition piece and any debris are transported back to the shore either by
lifting on to a jack-up, barge or heavy lift vessel, or by buoyant tow.
The pile and transition piece, which do not contain any hazardous materials, would
then be cut up and the steel could be recycled.
Decommissioning of gravity base structures is likely to proceed as follows:
ROVs or divers are deployed to establish the base structural integrity and reinstate
lifting attachments if necessary.
A suction dredging vessel is mobilised to remove the gravity ballast.
The ballast material would be properly disposed of either on shore or in an offshore
spoil area.
Divers are then deployed to inspect the base, and ensure all the remaining ballast is
removed.
A heavy lift vessel is mobilised to lift the bases completely out of the seabed and
onto a transportation vessel which would take them to the shore.
The seabed is subsequently inspected and any debris is removed.

LEANWIND D5.3- project no. 614020
38
Steel bases do not contain any hazardous material and would be cut up and the
material could be recycled. Concrete bases would be disposed of in an approved
manner.
It is envisaged that a port looking to provide recycling facilities for offshore wind farms
would require (depending to an extent on whether the wind farm has been dismantled or
demolished), quayside heavy lift facilities, storage areas similar in size to those required
at the installation phase and covered warehousing where further component and
materials sorting, break-up, etc. could be undertaken [56].
Seaton port, located in the north east of England, owned by ABLE UK, is among the ports
with experience in offshore oil & gas structure decommissioning with expertise and
suitable facilities. ABLE has been awarded the contract for the disposal of four offshore
structures from the Shell operated Brent field. Three platform topsides, as well as a
138m tall steel platform jacket, will be transported from over 100 miles north east of
Scotland to ABLE Seaton Port where they will be dismantled and recycled using the
latest techniques and technologies. The offshore oil & gas decommissioning experience
of ports, such as that of ABLE’s Seaton port, could be employed for offshore wind
dismantling considering the many similarities of the substructures.
3.4 Port Clusters for the offshore wind industry
In the international sea regions such as the North Sea, where most of the offshore wind
projects are located, sea transport of wind turbine components can take place between
any of the bordering countries and the offshore wind project. As the ports in the North
Sea coast have different capabilities, multi-port strategies, in which certain activities
take place in different ports with the most suitable facilities being used by the offshore
wind developers, are possible. For example, the multi-port strategy was adopted in the
Amrumbank West project in Germany, owned and developed by E.ON Climate &
Renewable GmbH. The monopile foundations for this project were produced by Sif group
in Roermod in the Netherlands. However, the large installation vessels could not reach
the production facility because of the insufficient water depth, locks and bridges.
Therefore, the monopiles were shipped via pontoons to the Netherlands, Port of
Vlissingen, at Bow Terminal, where they were stored before being shipped to their final
terminal in Germany (Cuxport in Cuxhaven), and then to the offshore wind farm [57].
The high costs associated with the logistics of such projects where the operations are
dispersed between several countries, raises the issue of consolidating all the activities
related to the installation around one single port or ports close to one another and
create port clusters. With regards to the ports and infrastructure supporting offshore
wind, clustering concept and consolidating the supply chain have gained attention by the
industry in the recent years. Porter (1998) [58] defines clusters as “geographic
concentration of interconnected companies and institutions in a particular field”, and
maintains that being part of a cluster allows companies to operate more productively in
sourcing input, accessing information, technology, and needed institution, coordinating
with related companies, and measuring and motivating improvement. In Germany,
consolidation has taken place in several ports on the border of North Sea such as
Cuxhaven and Bremerhaven where manufacturing facilities are established around the
port and components can be shipped directly to the wind farms. In the UK, ABLE UK’s

LEANWIND D5.3- project no. 614020
39
Marine Energy Park [33] aims at building an integrated cluster which can support
manufacturing of components during the assembly phase, and provide a storage buffer
for the installation & construction phases. ABLE UK’s quays are scheduled to be
operational by 2017. An integrated port cluster brings cost reductions on delivery and
installation vessels, lowers transportation costs by reducing the components trips and
the overall carbon footprints, and results in better visibility and control over the supply
chain. Ensuring low risk and cost effective operations is very important, and ports that
can accommodate offshore wind projects, in a suitable facility with enough capacity,
safety, and infrastructure are needed.
3.5 Ports’ investment decisions for offshore wind industry
Engaging in the offshore wind industry can provide ports with various revenue generating
opportunities. Revenue can be generated by providing land and facilities for
manufacturing and storage, onshore services such as land for substations and offshore
marines services such as towage and pilotage services from the port to the wind farms.
However, factors such as ownership structure, economics of markets, and the level of
maturity of the industry can prevent ports from entering this market.
The offshore wind industry is still in its infancy and the volume of business might not be
sufficient for ports to convince them to engage in this industry, considering the
significant cost of infrastructure development. Port owners also see the offshore wind
stakeholders reluctant to commit to contracts or tenancies which would allow specific
infrastructure investment for the long term [59].
3.5.1 The effect of Port’s ownership on offshore wind industry
UK:
The UK market is the world’s largest offshore wind market, and has been continually
ranked as one of the most desirable locations to invest in the offshore wind industry. The
UK government has provided support for offshore wind through the Renewable
Obligation and in the future through contract for difference, a key pillar for UK’s
Electricity Market Reform programme [59]. The UK government has also provided
support through the Final Investment Decision (FID), enabling the Renewable scheme to
eight projects, out of which five were for offshore wind energy [59].
The majority of UK ports however, are privately operated and the investment decisions
are made based on commercial factors. The UK port industry is driven by market forces
rather than the government or regional policy [21]. Given the private ownership
structure, port owners are motivated to maximise the yield on their land and in the
presence of more revenue-generating options, they might not invest in the offshore wind
industry. The UK government however could participate in providing financial support for
upgrading the ports and turning them into hubs where the UK supply chain can be
supported. Investments are critical and given the limited fund and resource, it seems
logical to develop a number of ports, each serving a wider geographic region [59].

LEANWIND D5.3- project no. 614020
40
Continental Europe:
Many continental ports are in public ownership and their investment decisions can take
into account the broader local economic benefits of a project as well as the direct port
revenue [49]. For instance, in Germany, where importance is given to building port
clusters, with substantial support from the State of Lower Saxony and the EU, an
infrastructure was created in the port of Cuxhaven to build and ship all of the
components necessary for offshore wind turbine generators.
In the recent years, more than €80 million (c. £57 million) has been invested in the
infrastructure of the Offshore Base Cuxhaven. In addition to this, private investors in the
offshore industry have invested more than €100 million (c. £70 million) in Cuxhaven
during 2007 and 2008. Additional private and public investments are forthcoming in the
next few years [22]. Projects in the east coast of UK could face competition from
continental ports, especially in the Netherlands and Germany where speculative
investment from public funds has enabled the establishment of facilities suitable for
offshore wind [49].
3.5.2 Port developments in the UK
The growth of the offshore wind industry has created opportunities for many UK ports,
and ports are ready to exploit such opportunities. Offshore wind farms provide a
potential market for the UK ports worth over £150 million, totalling up to £800 million by
2020, which including O&M charges, could reach a total of £1 billion [59].
In November 2014 with the support of UK government Siemens announced its decision
to invest £170 million in wind turbine production and installation facilities in Yorkshire,
spread across two sites comprising the previously announced Green Port Hull project
construction, assembly and service facility and a new rotor blade manufacturing facility
in nearby Paull, in East Riding [20]. This investment which is accompanied by £130
million from Associated British Ports (ABP) is the UK’s first major offshore wind
manufacturing facility in the offshore wind sector [20].
ABLE Marine Energy Park, the largest enterprise zone in the UK made a £450m
investment to develop one of Europe’s largest Super- port on the Humber estuary (South
Bank). This investment will attract around 750 £ of inward investment and could create
about 4100 jobs [60].
Belfast harbour in Northern Ireland in the west coast of UK is another example of a port
which made an almost £53 million (c. €70 million) investment in developing a 20 ha
purpose-built offshore wind terminal for Dong Energy [61]. This investment will be
amortised over a decade, since Dong Energy has an interest in 6 wind farms in the Irish
Sea [49].
3.5.3 Future trends
According to [17], location of the port and a cost benefit analysis are among the
important parameters to be considered when choosing what operations to be carried out
LEANWIND D5.3- project no. 614020
41
in the port. Future trends in the use and operation of ports show that cluster-building of
offshore wind manufacturing can be realised in ports located close to each other.
Financial support could be significantly used to develop the necessary onshore
infrastructure for the offshore wind energy to become a mainstream technology in the
near future [62]. Port capacity could also have an impact on the wider energy
infrastructure expansion such as carbon capture and storage (CCS), energy storage and
nuclear programmes and is also vital in serving the infant wave and tidal renewable
sector [59]. Key infrastructure upgrade considerations must therefore be inclusive of all
low carbon technologies’ needs and future budget cuts must take into account the wider
benefits of the port redevelopment [6].
In practice, a significant amount of the port development costs may be borne by the
initial projects; however, once ports have been developed, future project costs may be
expected to decrease [3]. Investment in ports and waterways is one way that public
investment could greatly support offshore wind development, as well as other industries
that rely on water-based transportation. Therefore, investment in port and navigation
projects will have a compounding effect and the cost-benefit ratio will be very favourable
for the development of this sector.

LEANWIND D5.3- project no. 614020
42
4. Port selection model 1
In the process of development and operation of an offshore wind farm, myriad of
decision making problems exist, including but not limited to the selection of the most
suitable offshore site, turbine types, foundation types, vessel types, and the most
suitable port and onshore infrastructure which could support the three phases of
installation, operations and maintenance and decommissioning of an offshore wind
farm. Given the magnitude of the growth in the offshore wind industry, the demand for
suitable ports and onshore infrastructure comes into spotlight. To date, in most offshore
wind projects resources from other marine industries has been utilised, for instance,
vessels from the oil and gas industry or the container shipping ports as the onshore
base. However, in order to meet the future capacity targets of the industry, the need for
specialised infrastructure has been identified
In section 4 a decision support framework is presented with the goal of aiding the
decision maker in selecting the most suitable onshore base for a given wind farm based
on the criteria defined in section 2. After presenting a literature review regarding the use
of decision making methods in particular the Multi-Criteria Decision Analysis (MCDA)
method in the offshore wind industry and port selection in section 4.1; the methodology,
case application and the final results are presented in sections 4.2, 4.3, 4.4, and 4.5
respectively.
4.1 Related work
Decision makers usually have to make decisions in the presence of multiple, conflicting
criteria. In order to evaluate these choices and make the best decision, scholars in the
area of decision sciences, offer several methodologies, including Multi-criteria decision
analysis (MCDA) methods; MCDA includes methods such as Data Envelopment Analysis,
Analytical Hierarchy Process, Fuzzy set theory, Goal programming, ELECTRE (Elimination
and choice expressing reality), PROMOTHEE (Preference ranking organisation method for
enrichment evaluation), etc. [74] which could be applied for solving complex decision
making problems. MCDA has seen a significant amount of use over the last several
decades and its role in different application areas has increased significantly, especially
as new methods develop and old ones improve [74]. MCDA has also been used in the
offshore wind industry. Ederer (2014) has evaluated capital and operating cost
efficiency of offshore wind farms, using the Data Envelopment Analysis (DEA) model
[63]. For measuring capital cost efficiency, the input is defined as the capital cost and
the outputs are defined as installed capacity, distance to shore and water depth. For the
operating cost efficiency, the input is defined as operating cost and the outputs are
distance to operating port, energy performance, installed capacity, and availability.
Ederer (2014) [63] suggests that water depth and the distance from shore are two of
the main cost drivers of the offshore wind industry. Findings of this study also show that
smaller wind farms should be installed closer to shore and in shallower water sites.
Secondly, at least for the range under investigation, it is possible to build a smaller
offshore wind farm that is comparatively less expensive than a larger one at the same
distance to shore and water depth. Third, the size of the offshore wind farm has a
1 This section is part of the working paper ’An assessment of installation and O&M ports for the offshore wind industry: an AHP
approach’ by Negar Akbari, Chandra Irawan and Dylan Jones presented at Euro July 2015-Glasgow conference.

LEANWIND D5.3- project no. 614020
43
weaker impact on the costs the farther away from shore and the deeper the water at the
OWF site.
Jones and Wall (2015) [64] have used extended goal programming for site selection in
the offshore wind sector. The model developed serves to demonstrate the multi-criteria,
multi- stakeholder nature of decision making in the offshore wind farm sector. This study
[64] shows that economic, technical, sociological, and environmental considerations all
play a part in determining the optimal course of action.
Fetanat et al. (2015) [65] has used hybrid multi-criteria decision method based on fuzzy
Analytic Network Process, fuzzy decision making trail, evaluation laboratory and fuzzy
ELECTRE to assist the offshore wind farm site selection in the Persian Gulf.
In the container port selection literature as well, the use of MCDA is recognised. Lee lam
et al. (2012) [66] has used analytic hierarchy process (AHP) and proposed a decision
support system (DSS) for port selection in container shipping, enabling the port
managers to obtain a detailed understanding of the criteria and address the port
selection problem utilising multi criteria analysis. Lee lam et al. (2012) [66] also show
how technology advancement can bring positive effect of strategic planning to shipping
firms. Zavadskas Kazimieras et al. (2014) [67] have used the combination of AHP and
fuzzy ratio assessment to tackle the issue of finding a deep water sea port in the
Klaipeda region in Baltic sea to satisfy economic needs. Ugboma et al. (2006) [68] have
used AHP to determine the service characteristics that shippers consider important
when selecting a container port. Ugboma et al. (2006) [68] suggest that shippers place
high importance on efficiency, frequency of ship visits and adequate infrastructure, and
quick response to port users’ needs was insignificant to them. Port managers were
interested in the results since the study provided essential information on the key
factors that come into the decision process of port users.
Guy and Urli (2006) [69] has Assessed whether the accepted rationale of port selection
by shipping lines – based on the combined importance of quality of infrastructures, cost,
service and geographical location – is useful to account for the selection behaviour
observed in the Northeast of North America, particularly the recent arrival of new global
carriers in Montreal. They [69] have used a multi-criteria approach in combination with
scenarios where the relative importance given to selection criteria and the performance
of ports are both varied across a wide range. This allows the authors [69] to assess how
port preference is affected by changes in criteria weight (expressing selection rationale)
and by changes in evaluation (expressing relative port performance). With criteria
weights set to reflect the common selection rationale, their findings suggest that
shipping lines should call at New York and bypass Montreal.
After reviewing the literature, it comes apparent that much of the work related to the use
of MCDA methods in the offshore wind, is related to offshore wind site selection and
there is a gap in the literature related to the assessment of onshore infrastructure
suitability for the offshore wind industry. Therefore, we propose the use of a multi-criteria
decision making model for the assessment of port suitability for the offshore wind
industry. The aim of this port selection model is to provide a decision support framework,
enabling the decision makers-developers- to tackle a strategic challenge, which is
selecting the suitable onshore base for an offshore wind site.
4.2 Methodology
In order to identify the most suitable ports for each phase of the offshore wind farm, we
have used the Analytical Hierarchy process (AHP) method. AHP is a theory of

LEANWIND D5.3- project no. 614020
44
measurement through pairwise comparison and relies on the judgements of experts to
derive priority scales [70]. These comparisons may be taken from actual measurements
or from a fundamental scale, shown in table 7, which reflects the relative strength of
preferences and feelings [70]. The decision problem is structured in a hierarchy form
with the goal of the decision at the top level, followed by the factors affecting the
decision in gradual steps from the general, in the upper levels of the hierarchy, to the
particular in the lower levels [70]. When constructing hierarchies, enough details to
represent the problem as thoroughly as possible must be included. It is a trade-off
however, as it is important not to include so many details that the sensitivity of the
model to variation of the elements is negatively impacted [70].
Intensity of
Importance
Definition Explanation
1 Equal importance Two activities contribute equally to the objective
2 Weak or slight
3 Moderate importance Experience and judgement slightly favour one
activity over another
4 Moderate plus
5 Strong importance Experience and judgment strongly favour one
activity over another
6 Strong plus
7 Very strong or demonstrated importance An activity is favoured very strongly over another;
its dominance demonstrated in practice
8 Very very strong
9 Extreme importance The evidence favouring one activity over another is
of the highest possible order of affirmation
Reciprocals of
above
If activity i has one of the above non-zero
numbers assigned to it when compared
with activity j, then j has the reciprocal
value when compared with I
A reasonable assumption
1.1-1.9 If the activities are very close May be difficult to assign the best value but when
compare with other contrasting activities the size
of small numbers would not be too noticeable, yet
they can still indicate the relative importance of the
activities. Table 7: the fundamental scale of absolute numbers [71]
Saaty (2008) [71] defines the analytical hierarchy process as following:
1) Define the problem and determine the kind of knowledge sought.
2) Structure the decision hierarchy from the top with the goal of the decision, then the
objectives from a broad perspective, through the intermediate levels (criteria on
which subsequent level elements depend) to the lowest level which usually is a set
of alternatives.
3) Construct a set of pairwise comparison matrices. Each element in an upper level is
used to compare the elements in the level immediately below, with respect to it.
4) Use the priorities obtained from the comparisons to weight the priorities in the level
immediately below. Do this for every element. Then for each element in the level
below add its weighed values and obtain its overall or global priority. Continue this
process of weighing and adding until the final priorities of the alternatives in the
bottom most level are obtained.

LEANWIND D5.3- project no. 614020
45
The AHP has been shown to be effective in evaluation problems involving multiple and
diverse criteria, measurements of trade-off and with limited data [72]. The AHP exhibits
flexibility in dealing with both the qualitative and quantitative factors in a multi-criteria
evaluation problem [72].
4.2.1 Consistency
In decision making problems, it is important to understand how good the consistency of
the judgments is, since judgements with low consistency that appear to be random are
not desirable. A certain degree of consistency in setting priorities for elements or
activities with respect to some criterion is necessary to get valid results in the real world.
In the AHP model, the overall consistency of judgments is measured by means of a
Consistency Ratio (CR). The value of consistency ratio should be 10% or less [78].
4.2.2 Hierarchy structures for the port selection model
After identifying the most critical technical elements in offshore wind ports, for each
phase of the offshore wind farm life cycle, a hierarchy that includes these elements was
constructed. The hierarchies are comprised of 5 levels, with the first level stating the
objective (the most suitable port), the second level the criteria group, third and fourth
levels are the sub-criteria of the group, and the fifth level contains the alternatives, i.e.
the candidate ports.
For each phase of the offshore wind lifecycle a separate hierarchy was developed, as
each phase requires different criteria within the port and also because even the
common criteria could have different weights depending on the type of operations
carried out in that port. The models then were validated through industry experts and the
questionnaires containing the pairwise comparisons were sent to 5 experts. It should be
noted that pairwise comparison of criteria is used, since port requirements do not have
the same importance for decision makers. For instance, for an installation port the port’s
connectivity could be more important than the port’s physical characteristics, or vice
versa. Hence, for obtaining the relative weight (importance) of each criteria pairwise
comparison of criteria must be used. Table 8 shows an example of examination through
pairwise comparison of port criteria for installation port.
Based on the weights shown in table 8, for this expert, between the three port criteria,
Port’s physical characteristics has been much more important that the port’s
connectivity, while port’s layout had the least importance compared to the other two
criteria.
Port physical
characteristics
Port
Connectivity
port
layout
Weights(Eigen
Vector)
Consistency
Ratio %
Port physical
characteristics
1 6 3 0.654
3.63 % Port
Connectivity
1/6 1 6 0.2498
port layout 1/3 1/6 1 0.09533
Table 8: Example of a pairwise comparison matrix

LEANWIND D5.3- project no. 614020
46
Goal: Choosing the most suitable installation port
Level 1: Port’s physical characteristics, Port’s layout Port’s Connectivity
Level 2 A: Component handling, Port’s depth, Seabed suitability, Quay load bearing
capacity, Quay length
Level 2 B: Storage capacity, Fabrication facility, Potential for expansion, Component lay
down area
Level 2 C: Distance from the wind farm, Distance from road networks, Distance from
suppliers
Level 3 A: Lifting capability, Ro-Ro capability, Lo-Lo capability
Level 3 B: Covered storage, Open storage, storage load bearing capacity
Level 3 C: Access to quayside, component lay down area
Figure 27: Installation port hierarchy
Port 5
Port 4
Port 3
Port 2
Port 1
Port’s physical
characteristics
Installation port
Port’s
Connectivity
Port’s layout
Potenti
al for
expansi
on
Storag
e
Fabric
ation
facility
Compo
nent
lay
down
area
Covered
storage
Open
storage
Load
bearing
capacity
Access to
quayside
Component
lay down
area
Seabed
suitabil
ity
Compo
nent
handlin
g
Port’s
depth
Quay
load
bearing
capacity
Quay
length
Lifting
capability
Ro-Ro
capability
Lo-Lo
capability
Distanc
e from
supplie
rs
Distanc
e from
the
wind
farm
Distanc
e from
road
networ
ks

LEANWIND D5.3- project no. 614020
47
Goal: Choosing the most suitable O&M port
Level 1: Port’s physical characteristics, Port’s layout, Port’s Connectivity
Level 2 A: Distance from the wind farm, Distance from road networks, Distance from
suppliers, and Distance from heliport
Level 2 B: Component handling, Port’s depth, Seabed suitability, Quay load bearing
capacity, Quay length
Level 2 C: Storage capacity, Workshop area, Potential for expansion, Office facilities
Level 3 A: Lifting capability, Ro-Ro capability, Lo-Lo capability
Level 3 B: Covered storage, Open storage, storage load bearing capacity
Figure 28: Operations and maintenance port hierarchy
Operations and
maintenance port
Port 4
Port 3
Port 2
Port 1
Port’s
Connectivity
Distanc
e from
heliport
Distanc
e from
road
networ
ks
Distanc
e from
supplie
rs
Distanc
e from
the wind
farm
Seabed
suitabil
ity
Compo
nent
handlin
g
Port’s
depth
Quay
load
bearing
capacity
Port’s physical
characteristics Port’s layout
Quay
length
Potenti
al for
expansi
on
Storage Work
shop
area
Office
faciliti
es
Lifting
capability
Ro-Ro
capability
Open
storage
Covered
storage
Lo-Lo
capability
Load
bearing
capacity

LEANWIND D5.3- project no. 614020
48
Goal: Choosing the most suitable decommissioning port
Level 1: Port’s physical characteristics, Port’s layout, Port’s Connectivity
Level 2 A: Distance from the wind farm, Distance from road networks
Level 2 B: Component handling, Port’s depth, Seabed suitability, Quay load bearing
capacity, Quay length
Level 2 C: Storage capacity, Workshop area, Potential for expansion,
Level 3 A: Lifting capability, Ro-Ro capability, Lo-Lo capability
Level 3 B: Open storage, storage load bearing capacity
Figure 29: Decommissioning port hierarchy
Port’s
Connectivity
Decommissioning port
Distanc
e from
road
network
s
Distance
from the
wind
farm
Seabed
suitabili
ty
Compon
ent
handling
Port’s
depth
Quay
length
Port’s physical
characteristics Port’s layout
Quay
load
bearing
capacity
Potentia
l for
expansi
on
Storage Worksho
p area for
recycling
Lifting
capability
Ro-Ro
capability
Open
storage
Load
bearing
capacity
Lo-Lo
capability
Port 5
Port 4
Port 3
Port 2
Port 1

LEANWIND D5.3- project no. 614020
49
4.3 Results of the pairwise comparisons of the port criteria
In this section we present the result of the pairwise comparisons of the port criteria
which was completed by 5 industry experts (the results of pairwise comparison are
obtained using the AHP software [79]). Tables 9, 11 and 13 present the weights of these
criteria for installation, O&M and decommissioning ports. The results clarify the
importance of each criterion for different phases of the offshore wind farm’s lifecycle
and give a better understanding of the requirements in the ports which have the highest
relative significance for supporting the offshore wind industry.
4.3.1 Installation port
Table 9 shows the weight of the criteria for an installation port. These finding suggest
that for an installation port, where the major components are stored, pre-assembled and
loaded onto heavy vessels, the port’s physical characteristics are more important than
the port’s connectivity and port’s layout.
Among the physical characteristics, experts ranked the quay load bearing capacity as the
most important factor followed by the port’s depth, port’s seabed suitability to
accommodate heavy jack-up vessels, quay length and component handling capabilities.
In the port’s connectivity category, the port’s distance to offshore site had the highest
significance followed by the port’s distance to key component supplier and distance to
the road networks.
For the port’s layout which was ranked slightly lower than the port’s connectivity, the lay
down area for component assembly and its accessibility to quayside was ranked the
highest, followed by the storage area available at the port, port’s potential expansion
opportunity and the availability of component manufacturing facility at the port
Criteria Weight
Port’s physical characteristics 0.483495
Seabed suitability 0.201319 Component handling 0.130315
Lo-Lo capability 0.596114
Ro-Ro capability 0.10221
Heavy cranes 0.301676
Quay length 0.145369
Quay load bearing capacity 0.286906
Port's depth 0.23609
Port’s Connectivity 0.274774
Distance to offshore site 0.705605 Distance to key component supplier 0.185777
Distance to road 0.108617
Port’s layout 0.24173
Potential for expansion 0.256796
Component laydown area 0.333861
Component laydown area 0.653761
Laydown area access to quay side 0.346239
Storage 0.288527
Storage load bearing capacity 0.599171
Open storage area 0.299962
Covered storage area 0.100867
Component fabrication facility 0.120816 Table 9: Installation port criteria weights [77]

LEANWIND D5.3- project no. 614020
50
Figure 30: Graph showing the weight comparison of the level 1 criteria group for an installation port
4.3.2 Operations and maintenance port
O&M ports are defined as onshore bases that support the routine operations and
maintenance of the offshore wind farms. For these ports, the port’s connectivity was
ranked the highest in terms of significance, followed by the port’s physical
characteristics and port’s layout.
In the port’s connectivity category, port’s distance to wind farm was ranked significantly
higher than the port’s distance to heliport, distance to key component suppliers and
distance to road network, which are the second, third and fourth in terms of importance .
2 The CR is slightly above the recommended limit; however the average CR is within the limits suggested
by [78].
0
0.05
0.1
0.15
0.2
0.25
0.3
0.35
0.4
0.45
0.5
port's physical
characteristics
Port's connectivity Port's layout
Installation port
Level Consistency Ratio (%)
12 16.3
2A 1.7
2B 2.1
2C 0.2
3A 7.7
3B 6
3C 0
Average consistency
of the matrices
4.8
Table 10: Consistency ratio of installation port matrices [77]

LEANWIND D5.3- project no. 614020
51
In the port’s physical characteristics category, the port’s quay load bearing capacity was
ranked the most important, followed by the component handling capabilities, quay
length, port’s depth, and seabed suitability for jack-up vessels.
For the port’s layout category, the availability of office facilities was ranked the highest,
followed by the storage capacity, workshop area for component repair and potential
expansion opportunities at the port.
Criteria Weight
Port’s physical characteristics 0.328355
Seabed suitability 0.038918
Quay length 0.088263
Component handling 0.226789
Lo-Lo capability 0.502329
Ro-Ro capability 0.116736
Heavy cranes 0.380934
Quay load bearing capacity 0.560094
Port's depth 0.085937
Port’s Connectivity 0.50325
Distance to offshore site 0.645413
Distance to key component supplier 0.105183
Distance to road 0.086335
Distance to heliport 0.163069
Port’s layout 0.168394
Storage 0.269417
Storage load bearing capacity 0.175836
Open storage area 0.187874
Covered storage area 0.636289
Workshop area for component repair 0.246476
Potential for expansion 0.14529
Office facilities 0.338817
Table 11: O&M port criteria weight [77]
Level Consistency Ratio (%)
1 0.1
2A 1.1
2B 2.5
2C 2.9
3A 1.4
3B 0.1
Average consistency of
the matrices
1.85
Table 12: Consistency ratio of O&M port matrices [77]

LEANWIND D5.3- project no. 614020
52
Figure 31: Graph showing the weight comparison of the level 1 criteria group for an O&M port
4.3.3 Decommissioning ports
For decommissioning ports, the port’s physical characteristics were considered the most
significant factor for the port’s suitability, followed by port’s connectivity and port’s
layout.
In the port’s physical characteristics category, the port’s seabed suitability was
considered the most important factor, followed by port’s depth, quay load bearing
capacity, component handling equipment and the quay length.
In the port’s connectivity category, distance to offshore site was ranked the most
important factor, followed closely by distance to road, since the dismantled component
can be carried via trucks to recycling centres.
In the port’s layout category, the availability of workshop area for preparing the
components for recycling was considered the most important factor, followed by storage
availability and the potential for expansion at the port.
0
0.1
0.2
0.3
0.4
0.5
port's physical
characteristics
Port's connectivity Port's layout
O&M port

LEANWIND D5.3- project no. 614020
53
Figure 32: Graph showing the weight comparison of the level 1 criteria group for a decommissioning port
0
0.1
0.2
0.3
0.4
0.5
port's physical
characteristics
Port's
connectivity
Port's layout
Decommissioning port
Criteria Weight
Port’s physical characteristics 0.501797
Seabed suitability 0.257934
Component handling 0.147783
Lo-Lo capability 0.493958
Ro-Ro capability 0.132728
Heavy cranes 0.373314
Quay length 0.147345
Quay load bearing capacity 0.193281 Port's depth 0.253656
Port’s accessibility 0.318146
Distance to offshore site 0.583579
Distance to road 0.416421
Port’s layout 0.180055
Storage 0.368968
Storage load bearing capacity 0.549742
Open storage area 0.450258
Workshop area for preparing the components for recycling
0.492187
Potential for expansion 0.138844
Table 13: Decommissioning port criteria weight [77]
Level Consistency Ratio (%)
1 3.9
2A 0
2B 2.7
2C 2.7
3A 12.3
3B 0
Average consistency
of the matrices
3.6
Table 14: Consistency ratio of decommissioning port matrices [77]

LEANWIND D5.3- project no. 614020
54
4.4 Case application
The offshore wind farm, West Gabbard, selected by the Leanwind consortium, is
considered as an example site and the AHP model discussed in section 4.2 has been
applied to assess the suitability of a number of ports for three phases of installation,
O&M and decommissioning for this site. For this example the ports were selected based
on the:
1) Port’s proximity to the site:
All the ports selected for this example are within 300 km from the offshore wind farm
since:
a) Proximity to the offshore site will reduce the transfer time
b) Proximity offers the most cost effective option for vessels in terms of fuel and
consequently the carbon footprint
c) Proximity offers a wider weather window to maintain the site since the
transportation time will be reduced.
2) Port’s infrastructure and existing supply chain
3) Port’s offshore experience (oil & gas, wind, tidal and wave)
4) Port’s current involvement or willingness to invest in the offshore wind industry
5) Data availability for the ports
Site Name West Gabbard
Area (Country) North Sea (UK)
Depth (m) 33
Distance to shore (km) 30
Latitude (deg) 51.98
Longitude (deg) 2.08
Mean significant wave height (m) 1.1
Mean wave period (Tp, s) 5.44
Mean wind speed @ 10m a.s.l (m/s) 8.34
Mean tidal current velocity (m/s) 0.1943
Max tidal current velocity (m/s) 0.6997
Table 15: West Gabbard specifications [76]
Ports Distance from the wind farm (km)
Port of Oostende 101
Port of Harwich Navyard 56
Able UK-Humber port/ port of Hull 270
Port of Great Yarmouth 74
Port of Sheerness 110
Port of Lowestoft 61
Port of Ramsgate 86
Port of Grimsby 264
Table 16: Ports’ distance from the site [76]

LEANWIND D5.3- project no. 614020
55
4.4.1 Problem description
The problem is defined, as the decision maker’s choice of selecting the most suitable
port for a specific offshore wind farm which could satisfy the requirements needed for an
offshore wind port. For this example, we have chosen 8 different ports in the east coast
of UK and 1 port in Belgium. Figure 33, shows the approximate location of the wind farm
and the ports. The 5 ports pointed in red are selected as installation/decommissioning
port choices and the 4 ports in green are the O&M port choices. The assumptions for
this example are that installation ports are different from O&M ports since O&M ports
need not to be as large as installation ports but need to be closer to the site. The
choices for decommissioning ports, however, are the same as the installation ports.
This model strives to aid the decision maker to select the most suitable port from a
number of ports with similar attributes. The following map illustrates the location of the
example ports in relation to the offshore wind farm.
Figure 33: Estimated location of selected ports and the wind farm for the example case
West Gabbard wind
farm
Great
Yarmouth
Lowestoft
Oostende Sheerness
Ramsgate
Grimsby ABLE-
Humber
Port of Hull
Harwich
Navyard

LEANWIND D5.3- project no. 614020
56
4.4.2 Data collection
The data for the pairwise comparison of the criteria has been gathered by sending
questionnaires to 5 industry experts in the areas of port management, maritime
industry, and renewable energy consulting.
The data for the ports has been collected from publicly available data. The main
resources are 4C offshore (www.4coffshore.com), UK port directory (www.uk-ports.org)
and the ports’ main websites. Data for port’s connectivity has been collected by partners
in University of Edinburgh via the GIS tool.
4.4.3 Results
We analysed the suitability of ports for each phase of offshore wind farm lifecycle
through using the AHP model. Considering the final rank of the ports, it can be
speculated that there is not a significant difference between the port’s suitability scores,
however it must be noted that for each port, many criteria have been assessed and each
port can have different advantages over the other. Hence, expecting a significant
difference between the alternative port’s weights may not be realistic and slight
difference between the weights is meaningful enough to enable the decision makers to
choose the most suitable port between different alternatives [73].
Installation port:
The result of our analysis suggests that the most suitable installation base for the West
Gabbard wind farm is port of Oostende. Port of Hull is ranked second, followed by ABLE
UK, Humber port, Harwich Navyard port, and port of Great Yarmouth (For detailed
analysis please see Appendix table 17).
Figure 34: Installation port ranking
0
0.1
0.2
0.3
0.4
0.5
0.6
0.7
Port of
Oostende
Port of Hull Able UK-
Humber port
Harwich
Navyard
Port of Great
Yarmouth
0.630.59 0.57
0.490.4
Installation Port Suitability Ranking

LEANWIND D5.3- project no. 614020
57
Operations and maintenance port:
The result for our analysis suggests that port of Sheerness has the highest suitability
ranking for the O&M base for West Gabbard wind farm, followed by the port of Lowestoft,
port of Ramsgate and port of Grimsby. The results highlight the importance of the O&M
port’s proximity to the site, but also the need for O&M ports meeting the technical
requirements. Although Lowestoft is closer to the site (61 km), port of Sheerness (110
km from the site) has been ranked higher in terms of suitability, which could suggest
that port of Sheerness has more logistical capabilities (For detailed analysis please see
Appendix table 18). Port of Grimsby, however, despite good logistics capabilities, is
ranked last mainly due to its considerable distance from the West Gabbard wind farm.
Figure 35: O&M port ranking
Decommissioning port:
The result of our analysis suggests that the most suitable decommissioning base for the
West Gabbard wind farm is port of Oostend. ABLE UK-Humber port is ranked second,
followed by port of Hull, Harwich Navyard port, and port of Great Yarmouth (For detailed
analysis please see Appendix table 19).
0
0.1
0.2
0.3
0.4
0.5
0.6
0.7
Port of
Sheerness
Port of
Lowestoft
Port of
Ramsgate
Port of Grimsby
0.63 0.62 0.61
0.31
O&M Port Suitability Ranking

LEANWIND D5.3- project no. 614020
58
Figure 36: Decommissioning port ranking
4.5 Conclusion and future research
To the knowledge of the authors, the port selection model introduced in section 4 is
among the first studies that has systematically assessed the port requirements for the
offshore wind industry. By using the AHP methodology and the pairwise comparison of
the port requirements, we provided a ranking for the offshore wind port requirements for
each phase of the operations of a wind farm, and determined the most suitable port for
a given wind farm.
We believe that this decision making tool can provide valuable recommendations to the
decision maker for making the strategic decision of choosing a suitable onshore base for
installation, O&M and decommissioning phases of their wind farms.
The focus of this study however, has been on the port’s requirements and we have not
included the factor of cost in the decision making strategy reported in this study. The
future research could include the cost as a factor and assess the ports based on cost
and other requirements.
0
0.1
0.2
0.3
0.4
0.5
0.6
0.7
Port of
Oostende
Able UK-
Humber port
Port of Hull Harwich
Navyard
Port of Great
Yarmouth
0.680.56 0.55
0.490.45
Decommissioning Port Suitability Ranking

LEANWIND D5.3- project no. 614020
59
5. Conclusions
In this report, a systematic analysis of the ports and their requirements for the offshore
wind industry is presented. The port requirements are classified under three general
categories of:
1) Port’s physical characteristics: Including the seabed suitability, quay length, port’s
depth, quay load bearing capacity, and component handling capabilities,
2) Port’s conn bectivity: Including the port’s distance to the wind farm, to key
component suppliers, and to road networks, and heliports,
3) Port’s layout: Including the storage area, component fabrication facility, facilities for
repairing the components, and component recycling facilities.
Based on the result of the analysis described in section 4, for installation and
decommissioning ports, the port’s physical characteristics, and for the operations and
maintenance ports, the port’s connectivity is the determining factor of the port’s
suitability for a particular wind farm. Suitable ports and onshore bases which have the
necessary requirements will facilitate the logistics of the activities related to the offshore
wind installation, operations and maintenance and decommissioning phases.
Furthermore, a decision support framework which could assist the decision makers in
selecting the most suitable port for their offshore wind farm is proposed in section 4,
and the model is used for assessing a number of ports for the offshore site, West
Gabbard, proposed by the Leanwind consortium.
This analysis however, has only considered the technical requirements that should be
present at the ports, and did not consider the cost associated with each port, which can
be an important influential factor in making the final decision of selecting a port.
It is assumed however, that the presence of these capabilities (described in section 2 of
the report) in the ports will ultimately influence the overall cost, and efficient ports closer
to the wind farms could facilitate the logistics of the operations which could bring down
the costs, and make the process of installation, O&M and decommissioning lean and
efficient.

LEANWIND D5.3- project no. 614020
60
6. Reference
[1] GWEC, 2014. Global wind 2014 report. Available online at:
http://www.gwec.net/wpcontent/uploads/2015/03/GWEC_Global_Wind_2014_R
eport_LR.pdf (Accessed 12.05.2015)
[2] EWEA, 2015. The European offshore wind industry- key trends and statistics 2014.
Available online at:
http://www.ewea.org/fileadmin/files/library/publications/statistics/EWEA-
European-Offshore-Statistics-2014.pdf (Accessed 27.02.2015)
[3] U.S. Offshore wind market and economic analysis, 2013. Available online at :
http://www1.eere.energy.gov/wind/pdfs/offshore_wind_market_and_economic_a
nalysis.pdf (Accessed 04.11.2014)
[4] EWEA, 2011. Pure Power: Wind energy targets for 2020 and 2030- A report by the
European Wind Energy Association. Available at:
http://www.ewea.org/fileadmin/files/library/publications/reports/Pure_Power_III.
pdf (Accessed 10.03.2014)
[5] Infrastructure supply chains: barriers and opportunities.
https://www.gov.uk/government/uploads/system/uploads/attachment_data/file/
31984/11-1058-infrastructure-supply-chains-barriers-opportunities.pdf (Accessed
20.01.2015)
[6] Offshore wind project cost outlook, 2014. Available at:
http://www.cleanenergypipeline.com/Resources/CE/ResearchReports/Offshore%
20Wind%20Project%20Cost%20Outlook.pdf (Accessed 20.01.2015)
[7] NREL, 2006. Energy from offshore wind. U.S. National renewable energy
laboratory. Conference paper, presented at Offshore Technology Conference Texas.
Musial, W., Butterfield, S., Ram, B. Available online at:
http://www.offshorecenter.dk/log/bibliotek/Energy%20from%20offshore%20wind.
PDF (Accessed 10.11.2014)
[8] Kaiser, M.J., Snyder, B.F. ( 2012). Offshore wind energy cost modeling. London:
Springer-Verlag
[9] Fraunhaufer, State of the art and new technologies of direct drive wind turbines
(Accessed 19.06.2015)
[10] The Crown Estate. East coast transmission network technical feasibility study.
Available online at:
http://www.uea.ac.uk/~e680/energy/energy_links/transmission/east_coast_tran
smission_network_technical_feasibility_study.pdf (Accessed 26.07.2015)
[11] Garrad Hassan America, 2014. Assessment of ports for offshore wind development
in the United States. Available online at:
http://energy.gov/sites/prod/files/2014/03/f14/Assessment%20of%20Ports%20

LEANWIND D5.3- project no. 614020
61
for%20Offshore%20Wind%20Development%20in%20the%20United%20States_1.
pdf (Accessed 12.09.2014)
[12] Thomson, K.E. (2012). Offshore wind: A comprehensive guide to successful
offshore wind farm installation. Waltham, MA: Elsevier
[13] Figures for supporting structures. 4C offshore. Available at:
http://www.4coffshore.com/windfarms/support-structures-for-offshore-wind-
turbines-aid268.html (accessed 23.07.2015)
[14] The Crown Estate, 2012. UK market potential and technology assessment for
floating offshore wind power. Available online at:
http://www.thecrownestate.co.uk/media/5537/km-in-gt-tech-122012-uk-market-
potential-and-technology-assessment-for-floating-wind-power.pdf (Accessed:
10.06.2015)
[15] Figure for floating structures. Available at:
http://www.carbontrust.com/media/670664/floating-offshore-wind-market-
technology-review.pdf (accessed 23.07.2015)
[16] Tetra Tech, 2010. Port and infrastructure analysis for offshore wind energy
development. Available online at:
http://images.masscec.com/uploads/attachments/Port%20and%20Infrastructure
%20Analysis%20for%20Offshore%20Wind%20Energy%20Development/MA%20Po
rt%20Study%20Final%20Report_4-20-10.pdf (Accessed 04.11.2014)
[17] EWEA, 2011. Wind in our sales, Available at:
http://www.ewea.org/fileadmin/files/library/publications/reports/Offshore_Report
.pdf (Accessed 10.03.2015)
[18] RWE Innogy, 2012. Offshore wind, Port requirements offshore wind farm:
construction and operations. Available online at:
http://www.merific.eu/files/2012/12/Mike-Carter_Cornwalls-Ports-and-Harbours-
Event-26.7.12.pdf (Accessed 20.01.2015)
[19] Bremerhaven offshore wind port. Available online at: http://offshore-
windport.de/en/ports-and-land-areas/commercial-areas/ (Accessed 04.11.2014)
[20] Siemens, 2014. Available online at:
http://www.siemens.co.uk/en/news_press/index/news_archive/2014/major-uk-
offshore-wind-manufacturing-site-to-be-built-by-siemens.htm (Accessed
15.06.2015)
[21] BVG associates, 2009. UK ports for offshore wind industry. Available online at:
http://webarchive.nationalarchives.gov.uk/+/http://www.berr.gov.uk
/files/file49871.pdf (Accessed 03.04.2015)
[22] Offshore basis Cuxhaven. Available online at: http://en.offshore-basis.de/
(Accessed 04.11.2014)

LEANWIND D5.3- project no. 614020
62
[23] http://www.faehrhafen-sassnitz.de/en/geschaeftsbereiche/offshore/ (Accessed
20.05.2015)
[24] http://www.allenergy.co.uk/__novadocuments/52489?v=63534021133367000
0 (accessed 23.07.2015)
[25] WP 5 Partner, Kongsberg Maritime AS-Ports’ layout illustration, received on
24.06.2015
[26] GL Garrad Hassan, 2013 ‘A Guide to UK Offshore Wind Operations and
Maintenance’. Scottish Enterprise and the Crown Estate. Available online at:
http://www.hi-energy.org.uk/Downloads/General%20Documents/guide-to-uk-
offshore-wind-operations-and-maintenance.pdf (Accessed 26.01.2015)
[27] https://www.isri.org/docs/default-source/safety/crawler-cranes.pdf?sfvrsn=4
(Accessed 06.04.2015)
[28] http://subseaworldnews.com/2014/09/11/cuxport-assists-in-amrumbank-west-
monopile-ops/ (Accessed 26.07.2015)
[29] http://www.voith.com/en/products-services/power-
transmission/applications/floating-cranes-14216.html (Accessed 06.04.2015)
[30] http://www.rwe.com/web/cms/en/113648/rwe/press-news/press-
release/?pmid=4009481 (Accessed 26.07.2015)
[31] http://www.walesonline.co.uk/business/business-news/first-siemens-turbine-
installed-rwe-3867047 (Accessed 06.04.2015)
[32] http://www.tgal.us/lift-on-lift-off-lo-lo (Accessed 06.04.2015)
[33] http://www.ableuk.com (Accessed 17.06.2015)
[34] http://navy.memorieshop.com/Artisan/index.html (Accessed 26.07.2015)
[35] http://www.windpower-international.com/contractors/transportation/blg-
windenergy-logistics/blg-windenergy-logistics4.html (Accessed 20.05.2015)
[36] http://www.portofmostyn.co.uk/news.php?title=New_pontoon_commissioned_at_t
he_Port_of_Mostyn_for_Gwynt-y-Mor_ (Accessed 20.05.2015)
[37] http://www.jackupbarge.com/fleet/detail/dp2-portable-dynamic-positioning-
system/ (Accessed 20.05.2015)
[38] http://www.scaldis-smc.com/renewables.php (Accessed 20.05.2015)
[39] 4C offshore, vessel database. Availabe online at:
http://www.4coffshore.com/windfarms/vessels.aspx (Accessed 20.01.2015)
[40] http://www.ptmew.pl/media/pdf/transport_week_2013/07_DEME_offshore_port
_logistics.pdf (Accessed 26.07.2015)
[41] http://www.power-technology.com/projects/ormonde-offshore-wind-
farm/ormonde-offshore-wind-farm3.html (Accessed 26.07.2015)
LEANWIND D5.3- project no. 614020
63
[42] http://www.power-technology.com/projects/ormonde-offshore-wind-
farm/ormonde-offshore-wind-farm3.html (Accessed 26.07.2015)
[43] http://www.heavyliftspecialist.com/cranes/floating-cranes-world/ (Accessed
26.07.2015)
[44] http://www.offshorewind.biz/2014/01/20/self-elevating-platform-towed-from-
borwin-alpha-site/ (Accessed 26.07.2015)
[45] Snyder, B., Kaiser, M.J., 2008. Ecological and economic cost-benefit analysis of
offshore wind energy. Renewable Energy, 34, pp. 1576-1578
[46] Department of energy and climate change, 2015. Delivering UK energy investment:
Low carbon energy. Available online at:
https://www.gov.uk/government/uploads/system/uploads/attachment_data/file/
419024/DECC_LowCarbonEnergyReport.pdf (Accessed 16.06.2015)
[47] Gwynt y Mor project. Available online at:
http://www.rwe.com/web/cms/en/1252456/rwe-innogy/sites/wind-
offshore/under-construction/gwynt-y-mr/tech-and-spec/ (Accessed 20.05.2015)
[48] http://www.shephardmedia.com/news/rotorhub/bond-support-offshore-wind-farm-
operations/ (Accessed 20.05.2015)
[49] BVG associates, 2014. UK offshore wind supply chain: capabilities and
opportunities. Available online at:
https://www.gov.uk/government/uploads/system/uploads/attachment_data/file/
277798/bis-14-578-offshore-wind-supply-chain-capabilities-and-opportunities.pdf
(Accessed 30.04.2015)
[50] Port of Mostyn. Available online at:http://www.portofmostyn.co.uk/offshore-
wind.php?title=Offshore-Windfarm-Operations-and-Maintenance (Accessed
04.03.2015)
[51] EON offshore wind fact book, 2011. Available online at:
http://www.eon.com/content/dam/eon-
com/en/downloads/e/EON_Offshore_Wind_Factbook_en_December_2011.pdf
(Accessed 04.03.2015)
[52] NREL, 2013. Installation, operation, and maintenance strategies to reduce the
cost of offshore wind energy. Maples, B., Saur, G., Hand, M., Van de Piertermen, R.,
Obdam, T. Available online at: http://www.nrel.gov/docs/fy13osti/57403.pdf
(Accessed 04.03.2015)
[53] GL Garrad Hassan, 2013. Offshore Wind – Operations & Maintenance
opportunities in Scotland – An insight into opportunities for Scottish ports and the
O&M supply chain. Scottish Enterprise and GL Garrad Hassan. Available online at:
file:///C:/Users/486315/Downloads/Offshore%20wind%20operations%20and%2
0maintenance%20opps%20(2).pdf (Accessed 04.03.2015)

LEANWIND D5.3- project no. 614020
64
[54] Decommissioning strategy for Gywnt y Mor offshore wind farm LTD, 2011.
Available online at:
http://www.rwe.com/web/cms/mediablob/en/1268920/data/1202906/2/rwe-
innogy/sites/wind-offshore/in-operation/gwynt-y-mr/English.pdf (Accessed
20.05.2015)
[55] Kaiser, M.J., Snyder, B., 2010. Offshore wind energy installation and
decommissioning cost estimation in the U.S. outer continental shelf. Energy
research group, LLC, Louisiana.
[56] WP5 partners Cork Institute of Technology, National Maritime College of Ireland.
Internal report on decommissioning, received on 25.06.2015
[57] Bow terminal: a heavy lift port, 2014. Available online at:
http://www.offshorewind.biz/2014/02/11/bow-terminal-a-heavy-lift-port/
[58] Porter, M.E., 1998. Clusters and the new economic of competition. Harvard
Business review, pp.78-81.
[59] Deutsche bank, 2011. UK offshore wind: opportunity, costs & financing. Available
online at: https://www.db.com/cr/en/docs/UK_Offshore_Wind_Opportunity-
112111.pdf (Accessed 15.06.2015)
[60] North Lincolnshire council, February 2015. Available at:
http://www.northlincs.gov.uk/your-council/about-your-council/news/latest-
news/450m-able-marine-energy-park-can-get-underway/ (Accessed 15.06.2015)
[61] Belfast harbour Renewable. Available online at: https://www.belfast-
harbour.co.uk/port/renewables/ (Accessed 15.06.2015)
[62] Athanasia, A., Anne-Bénédicte, G., Jacopo, M., 2012. The offshore wind market
deployment: forecasts for 2020, 2030 and impacts on the European supply chain
development. Energy Procedia, 24, pp.2-10
[63] Ederer, N., 2014. Evaluating capital and operating cost efficiency of offshore wind
farms: A DEA approach. Renewable and sustainable energy reviews, 42, pp. 1034-
1046
[64] Jones, D.F., Wall, G., 2015. An extended goal programming model for site selection
in the offshore wind farm sector. Annals of operations research
[65] Fetanat, A., Khorasaninejad, E., 2015. A Novel hybrid MCDM approach for offshore
wind farm site selection: A case study of Iran. Ocean & Coastal Management, 109,
pp. 17-28
[66] Lee lam, J.S., Dai, J. , 2012. A decision support system for port selection.
Transportation planning and technology, 35 (4), pp. 509-524
[67] Zavadskas Kazimieras, E., Turskis, Z., Bagocius, V., 2014. Multi-criteria selection of
a deep water-port in the Eastern Baltic Sea. Applied soft computing, 26, pp. 180-
192

LEANWIND D5.3- project no. 614020
65
[68] Ugboma, C., Ugboma, O., Ogwude, I.C., 2006. An Analytical Hierarchy Process
(AHP) Approach to Port Selection Decisions-Empirical evidence from Nigerian ports.
Maritime Economics and Logistics, 8, pp. 251-266
[69] Guy, E., Urli, B., 2006. Port Selection and multi-criteria analysis: An application to
the Montreal-New York alternative. Maritime Economics and Logistics, 8, pp. 169-
186
[70] Saaty, T.L., Vargas, L.G. (2012). Models, Methods, Concepts & Applications of the
Analytic Hierarchy Process. New York, NY: Springer
[71] Saaty, T.L., 2008. Decision making with the analytical hierarchy process. Int.J.
Services Science, 1 (1) , pp. 83-95
[72] Banai-Kashani, R., 1989. A new method for site suitability analysis: The analytic
hierarchy process. Environmental Management. 13 (6), pp. 685-693
[73] Onut. S., Tuzkaya. U.R., Torun. E., 2010. Selecting container port via fuzzy ANP-
based approach: A case study in the Marmara Region, Turkey. Transport Policy, 18,
pp. 182-193
[74] Velasquez, M., Hester, P.T., 2013. An analysis of Multi-criteria decision making
methods. International Journal of Operations Research, 10 (2), pp. 56-66
[75] Saaty, T.L. (2012). Decision making for leaders: The analytic hierarchy process for
decisions in a complex world. Pittsburgh, PA: RWS Publications
[76] Work Package 5 partner, University of Edinburgh. Data for port’s connectivity,
received on 15.06.2015
[77] Work Package 5 partner, University of Portsmouth. Analysis of pairwise comparison
and ports performance, received on 24.06.2015
[78] Authors
[79] http://bpmsg.com
[80] http://www.power-technology.com/projects/borkum-farm/borkum-farm3.html
(accessed 23.07.2015)

LEANWIND D5.3- project no. 614020
66

LEANWIND D5.3- project no. 614020
1
7. Appendix
In this appendix we provide the report and pictures regarding the visits to Port of Grimsby and Green port Hull and the data for the
Performance of installation, O&M and decommissioning ports.
7.1 Port Visits
Visit to Siemens’ Green Port Hull project office and Green port Hull, Date: 07.07.2015
The purpose of this visit was to gain a better understanding of the role of Siemens in the Green port Hull project and offer Siemens a
reciprocal update on progress with the Leanwind programme.
Siemens has invested in a blade manufacturing facility which will provide blades for the offshore projects in the North Sea and also
for export to other countries. It should be noted that only blades are manufactured in this port, with nacelles currently imported from
Brande in Denmark and towers from suppliers throughout Europe and elsewhere. Green Port Hull will be used as an installation base
for the offshore wind farms.
Siemens’ representative explained that the best method for loading the components in terms of health and safety (Zero Harm), is
using Ro-Ro rather than cranes. SMPTs along with other equipment such as tractors and trucks are used in the port. All of these
available through hire, lease or purchase.
Siemens representative shared insight about the importance of the layout in the port, confirming that available space within the port
is the most important factor, also availability of storage is important. Siemens tries to keep the minimum of inventory at the port and
components are ordered almost 3 months prior to installation so they don’t have to sit in the port for long.
One of Siemens’ challenges is the imposed inclusion of flood defence measures by the Environment Agency striving to protect the
wider city of Hull from flooding. Specifically, the flood barrier placed at the quayside causes logistical challenges for cranes whilst
lifting the components. Also this barrier is not placed on the entire port and is only placed on half of it hence its inclusion may not
totally protect the port from flooding.

LEANWIND D5.3- project no. 614020
2
Visit to Port of Grimsby, Date: 07.07.2015
Port of Grimsby is an operations and maintenance port which has been involved in the offshore wind industry since 2006. Grimsby
was originally a fishing port and fishing is still a bigger business than offshore wind. Nevertheless stakeholders at port of Grimsby
believe that the fishing has limited growth capacity and this is why in 2006 they diversified their portfolio by entering into offshore
wind. Grimsby’s representative mentioned that offshore wind has actually helped the fishing industry to stay within the port and that
the industries are complimentary. Grimsby has undergone a major redevelopment in order to better serve the offshore wind industry.
Currently Grimsby is the base for E.ON Renewable Energy Systems, Centrica, Siemens, and Dong Energy. Work boats and pontoons
could be seen in the port. The only restriction in the port is the beam of 12m which is sufficient for work boats but not for bigger
vessels. Grimsby’s representative mentioned that there was a steady growth from 2006 to 2015; however 2015 and 2016 are quiet
until the next round of business gets underway in 2017.
Asking Grimsby’s representative about the possible adverse impact of the industry moving toward floating operation and
maintenance platforms and vessels adjacent to the offshore wind farms instead of O&M ports, due the increased distances from the
port, he answered that there are still older generation turbines, closer to shore which need maintenance and that could bring
business to the port for the next 20 years however they are aware of the possible changes in the industry and the move away from
an onshore base for O&M.

LEANWIND D5.3- project no. 614020
3
Figure 37: Work in progress at Green port Hull, photo taken on 07.07.2015 [78]
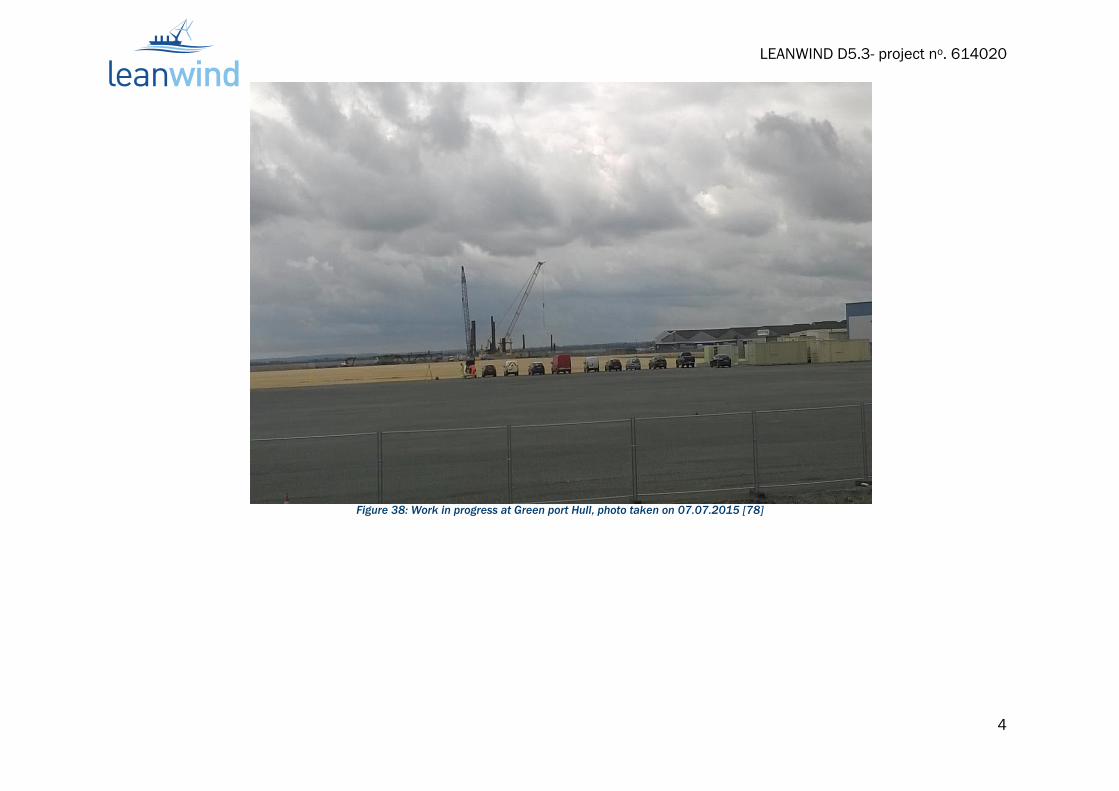
LEANWIND D5.3- project no. 614020
4
Figure 38: Work in progress at Green port Hull, photo taken on 07.07.2015 [78]
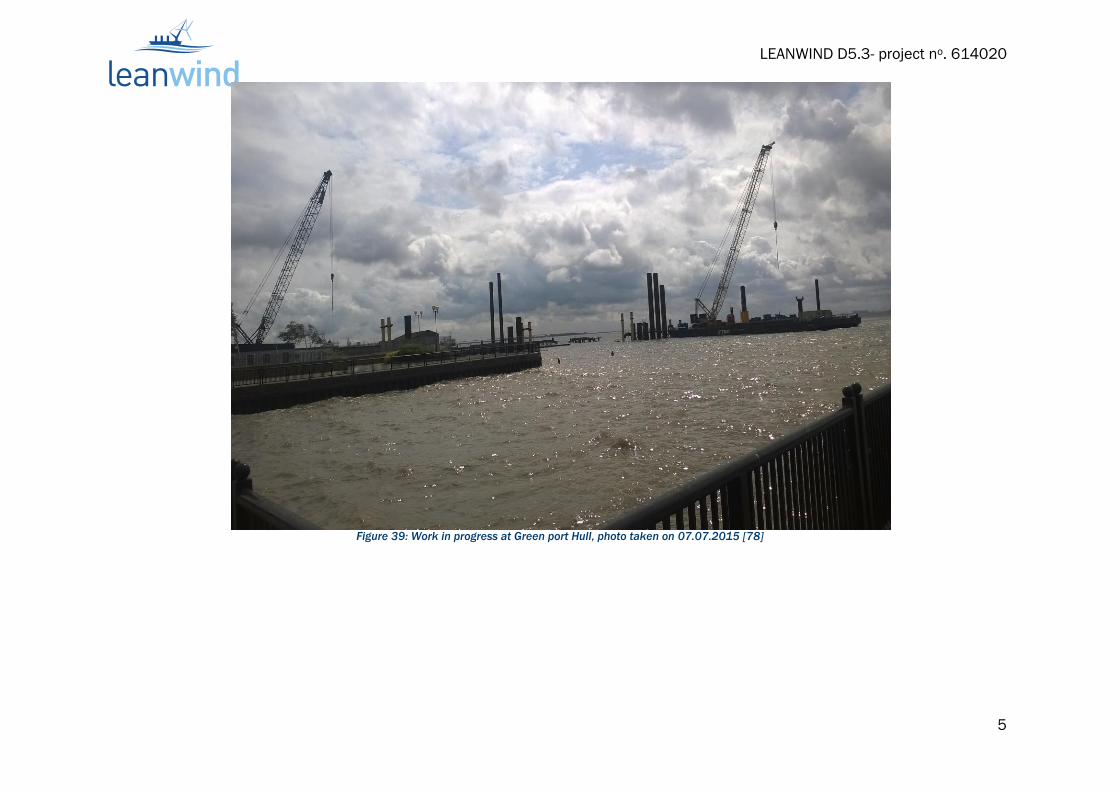
LEANWIND D5.3- project no. 614020
5
Figure 39: Work in progress at Green port Hull, photo taken on 07.07.2015 [78]

LEANWIND D5.3- project no. 614020
6
Figure 40: Pontoon at Grimsby port, photo taken on 07.07.2015 [78]

LEANWIND D5.3- project no. 614020
7
7.2 Port performance data
The performance of installation port
Criteria Priority
Weight
Alternatives weight
Priority weight * Alternatives weight
[1] [2] [3] [4] [5]
[1] [2] [3] [4] [5]
Seabed suitability 0.097336739
1 1 1 1 1
0.097337 0.097337 0.097337 0.097337 0.097337
Lo-Lo capability 0.037559292
0.767396 0.767396 0.767396 0.136661 0.136661
0.028823 0.028823 0.028823 0.005133 0.005133
Ro-Ro capability 0.006439933
0.67264 0.67264 0.67264 0.67264 0.036819
0.004332 0.004332 0.004332 0.004332 0.000237
heavy cranes 0.019007667
0.767396 0.136661 0.136661 0.767396 0.767396
0.014586 0.002598 0.002598 0.014586 0.014586
quay length 0.070285272
0.200098 0.405423 0.958809 0.358782 0.384107
0.014064 0.028495 0.06739 0.025217 0.026997
quay load bearing capacity 0.138717948
0.163998 0.766672 0.766672 0.766672 0.113979
0.02275 0.106351 0.106351 0.106351 0.015811
port's depth 0.114148506
0.12994 0.908982 0.657161 0.595087 0.196771
0.014832 0.103759 0.075014 0.067928 0.022461
distance to offshore site 0.19388221
0.905413 0.510653 0.164719 0.164719 0.729322
0.175543 0.099006 0.031936 0.031936 0.141403
distance to key comp. supplier 0.051046677
0.232504 0.232615 0.863339 0.863339 0.232695
0.011869 0.011874 0.044071 0.044071 0.011878
distance to road 0.029845285
0.312299 0.962962 0.347492 0.347492 0.304117
0.009321 0.02874 0.010371 0.010371 0.009076
potential for expansion 0.062075161
0.303398 0.322278 0.368081 0.962864 0.318463
0.018833 0.020005 0.022849 0.05977 0.019769
Component laydown area 0.052761147
0.960727 0.368781 0.368781 0.368781 0.225444
0.050689 0.019457 0.019457 0.019457 0.011895
laydown area access to quay
side 0.027942883
0.36286 0.36286 0.700637 0.919735 0.109746
0.010139 0.010139 0.019578 0.0257 0.003067
Storage loadbearing capacity 0.041789479
0.32736 0.963181 0.32736 0.32736 0.32736
0.01368 0.040251 0.01368 0.01368 0.01368
Open storage area 0.020921008
0.247497 0.22712 0.890827 0.828481 0.22712
0.005178 0.004752 0.018637 0.017333 0.004752
Covered storage area 0.007034996
0.480769 0.386158 0.820235 0.820235 0.067463
0.003382 0.002717 0.00577 0.00577 0.000475
Component fabrication facility 0.029204786
0.136661 0.767396 0.767396 0.767396 0.136661
0.003991 0.022412 0.022412 0.022412 0.003991
Total
0.49935 0.631048 0.590605 0.571384 0.402547
Rank
4 1 2 3 5
[1] : HARWICH navyard
[2] : OOSTENDE
[3] : port of Hull
[4] : Able UK
[5] : Great Yarmouth Table 17: Installation port data [77]

LEANWIND D5.3- project no. 614020
8
The performance of O&M port
Criteria Priority
Weight
Alternatives weight
Priority weight * Alternatives weight
[1] [2] [3] [4]
[1] [2] [3] [4]
Seabed suitability 0.012778818
1 1 1 1
0.012779 0.012779 0.012779 0.012779
quay length 0.028981505
0.410167 0.926964 0.34134 0.206787
0.011887 0.026865 0.009893 0.005993
Lo-Lo capability 0.037407015
0.308538 0.933193 0.308538 0.308538
0.011541 0.034908 0.011541 0.011541
Ro-Ro capability 0.008692965
1 1 1 1
0.008693 0.008693 0.008693 0.008693
heavy cranes 0.028367065
0 0 0 0
0 0 0 0
quay load bearing capacity 0.183909433
0.199635 0.869473 0.199635 0.712925
0.036715 0.159904 0.036715 0.131114
port's depth 0.02821776
0.25066 0.92861 0.273105 0.42479
0.007073 0.026203 0.007706 0.011987
distance to offshore site 0.324803959
0.109407 0.416613 0.879178 0.606177
0.035536 0.135317 0.28556 0.196889
distance to key component supplier 0.052933117
0.312767 0.24805 0.93098 0.376582
0.016556 0.01313 0.04928 0.019934
distance to road 0.043448349
0.729535 0.839997 0.111235 0.349797
0.031697 0.036496 0.004833 0.015198
Distance to heliport 0.082064742
0.196851 0.189692 0.806748 0.806748
0.016155 0.015567 0.066206 0.066206
Storage loadbearing capacity 0.007977375
1 1 1 1
0.007977 0.007977 0.007977 0.007977
Open storage area 0.008523493
0.155119 0.632409 0.286467 0.892552
0.001322 0.00539 0.002442 0.007608
Covered storage area 0.028867234
0.303888 0.932293 0.354473 0.272069
0.008772 0.026913 0.010233 0.007854
Workshop area for component repair 0.041505152
1 1 1 1
0.041505 0.041505 0.041505 0.041505
potential for expansion 0.024465917
0.278988 0.932826 0.324317 0.324317
0.006826 0.022822 0.007935 0.007935
office facilities 0.057054778
1 1 1 1
0.057055 0.057055 0.057055 0.057055
Total
0.312089 0.631526 0.620352 0.610266
Rank
4 1 2 3
[1] Grimsby
[2] Sheerness
[3] Lowestoft
[4] Ramsgate
Table 18: O&M port data [77]

LEANWIND D5.3- project no. 614020
9
The performance of decommissioning port
Criteria Priority
Weight
Alternatives weight
Priority weight * Alternatives weight
[1] [2] [3] [4] [5]
[1] [2] [3] [4] [5]
Seabed suitability 0.129430849
1 1 1 1 1
0.129431 0.129431 0.129431 0.129431 0.129431
Lo-Lo capability 0.036630443
0.767396 0.767396 0.767396 0.136661 0.136661
0.02811 0.02811 0.02811 0.005006 0.005006
Ro-Ro capability 0.009842692
0.67264 0.67264 0.67264 0.67264 0.036819
0.006621 0.006621 0.006621 0.006621 0.000362
heavy cranes 0.027683827
0.767396 0.136661 0.136661 0.767396 0.767396
0.021244 0.003783 0.003783 0.021244 0.021244
quay length 0.07393739
0.200098 0.405423 0.958809 0.358782 0.384107
0.014795 0.029976 0.070892 0.026527 0.0284
quay load bearing capacity 0.096988074
0.163998 0.766672 0.766672 0.766672 0.113979
0.015906 0.074358 0.074358 0.074358 0.011055
port's depth 0.127284057
0.12994 0.908982 0.657161 0.595087 0.196771
0.016539 0.115699 0.083646 0.075745 0.025046
distance to offshore site 0.185663569
0.905413 0.510653 0.164719 0.164719 0.729322
0.168102 0.09481 0.030582 0.030582 0.135409
distance to road 0.13248285
0.312299 0.962962 0.347492 0.347492 0.304117
0.041374 0.127576 0.046037 0.046037 0.04029
Storage loadbearing
capacity 0.036521903
0.32736 0.963181 0.32736 0.32736 0.32736
0.011956 0.035177 0.011956 0.011956 0.011956
Open storage area 0.029912721
0.247497 0.22712 0.890827 0.828481 0.22712
0.007403 0.006794 0.026647 0.024782 0.006794
Workshop area for
recycling 0.088620719
0.32736 0.32736 0.32736 0.963181 0.32736
0.029011 0.029011 0.029011 0.085358 0.029011
potential for expansion 0.024999629
0.303398 0.322278 0.368081 0.962864 0.318463
0.007585 0.008057 0.009202 0.024071 0.007961
Total
0.498077 0.689402 0.550275 0.561718 0.451965
Rank
4 1 3 2 5
[1] : HARWICH navyard
[2] : OOSTENDE
[3] : port of Hull
[4] : Able UK
[5] : Great Yarmouth
Table 19: Decommissioning port data [77]