Embed Size (px)
Citation preview

Original Article
Dual directional structured productsReceived (in revised form): 7th May 2014
Geng Deng
is the Director of Research at Securities Litigation & Consulting Group, Inc. He specializes in the fields ofderivatives, credit modeling, structured finance, mutual fund and hedge fund investment analysis. He holds a PhDin Operations Research, an MA in Mathematics and an MS in Statistics, all from the University of Wisconsin –
Madison. He also holds a BS in Applied Mathematics from Tsinghua University in China. He was the recipient ofseveral best paper awards when he was in graduate school. He holds a Financial Risk Manager (FRM) designationand is a CFA charterholder.
Tim Dulaney
is a Senior Financial Economist at Securities Litigation & Consulting Group. He has coauthored several papersinvolving the modeling and valuation of complex securities, bank deposits and insurance products. He earned aPhD in Theoretical Physics from the California Institute of Technology and graduated Summa Cum Laude fromthe University of Maryland with a BS in Physics and BS in Mathematics.
Tim Husson
is a Senior Financial Economist at Securities Litigation & Consulting Group. He has experience analyzing andvaluing complex financial products including annuities, trusts, swaps, synthetic and funded CDOs, structuredproducts, REITs, volatility derivatives, hedge funds, and complex exchange-traded products. He holds a BA (withHonors) and PhD in Computational Neuroscience from the University of Chicago. His doctoral work focused onthe development and applications of a novel neural imaging system.
Craig McCann
is experienced in securities class action litigation, financial analysis, investment management and valuation disputes.He has taught graduate investment management at Georgetown University and at the University of Maryland, CollegePark. Prior to founding Securities Litigation and Consulting Group, hewas the Director at LECG andManaging Director,Securities Litigation at KPMG. Hewas a senior financial economist at the Securities and Exchange Commission wherehe focused on investment management issues and contributed financial analysis to numerous investigations involvingalleged insider trading, securities fraud, personal trading abuses and broker–dealer misconduct.
Correspondence: Craig McCann, 3998 Fair Ridge Drive Suite 250, Fairfax, VA 22033, USAE-mail: [email protected]
ABSTRACT We analyze and value dual directional structured products – or simply dualdirectionals (DDs) – which have been issued in large amounts since the beginning of 2012.DDs evolved out of another type of structured product called absolute return barrier notes;however, DDs lack principal protection and have different embedded options positions,which are yet to be described in the literature. We find that DDs can be broadly organizedinto two categories: single observation dual directionals and knock-out dual directionals.We determine the appropriate option decomposition for these categories and provideanalytical formulas for their valuation. We confirm our analytic results using Monte Carlosimulation and use both techniques to value a large sample of DDs registered with the
© 2014 Macmillan Publishers Ltd. 1753-9641 Journal of Derivatives & Hedge Funds Vol. 20, 2, 99–112www.palgrave-journals.com/jdhf/

Securities and Exchange Commission up to December 2012. Our results indicate that likemany types of structured products, DDs tend to be priced at a significant premium topresent value across issuers and underlying securities and that the present value of thedecomposition is smaller than the face value net of commissions. We find that DDs withembedded leverage or a single observation feature tend to be worth less than products eitherwithout leverage or with a knock-out option.
Journal of Derivatives & Hedge Funds (2014) 20, 99–112. doi:10.1057/jdhf.2014.12;published online 5 June 2014
Keywords: structured products; structured notes; dual directional; valuation; Monte Carlo
INTRODUCTIONStructured products are complex debt securitieswhose payoffs are linked to the value of referencestocks, indices, commodity prices, interest ratesor exchange rates. While structured productissuances have grown over the past decade, theyhave also become more complex (McCann andLuo, 2006; Henderson and Pearson, 2010),especially by exposing investors to all, some ornone of the underlying security’s downside risk.Structured products often have discontinuouspayoffs that would typically only be available toderivatives traders and other sophisticatedinvestors trading complex options.Dual directional structured products – or
simply dual directionals (DDs) – can yieldpositive payoffs if the underlying security’s returnover the life of the note is positive or if it isnegative within a certain range. However, if thegains or losses are outside of that range, theinvestor’s gains are capped on the upside and theinvestor can lose much or all of his/herinvestment on the downside.DDs embed what is known to options traders
as a ‘straddle’ position on the underlying security.Straddle positions are taken by buying both an at-the-money (ATM) call and an ATM put. Anoptions trader with a straddle position thenachieves a payout that is a function of the
absolute value of the return – essentially profitingfrom a deviation from current levels, whetherpositive or negative. Straddles do not reflect adirectional bet on future price movements, butinstead are a bet on future volatility. DDs differfrom pure straddle positions in that gains in thevalue of the underlying security above the range ofthe straddle payoff are generally capped, and lossesin the value of the underlying security beyond thatrange lead to losses for the DD investor, includingperhaps a total loss of principal.DDs are similar to another type of structured
product, absolute return barrier notes (ARBNs),and occasionally still carry this brand name. Thestructure of ARBNs before 2010 featuredprincipal protection and returned the theabsolute value of the underlying asset returnwithin a certain range. While widely issued from2007 to 2009, ARBNs disappeared from themarket for 18 months in 2010–2011. When theyreturned in late 2011, they had a new payoutstructure that combined some aspects of theconventional structure with features of bufferedleveraged products – for example, bufferedPLUSes. The new structure dropped theprincipal protection and capped the upsidereturns while keeping the exposure to theabsolute value of the underlying return, makingARBNs of today identical in structure to DDs.
Deng et al
100 © 2014 Macmillan Publishers Ltd. 1753-9641 Journal of Derivatives & Hedge Funds Vol. 20, 2, 99–112

The literature has shown that structuredproducts are generally overpriced even beyondthe high commissions disclosed in the filings.Deng et al (2010) report that the average fairvalue of reverse convertibles was just 93 per centof the offering price. These findings areconsistent with those of Hernández et al (2007),Szymanowska et al (2009) and Henderson andPearson (2010). Similarly, our analysis of ARBNsin Deng et al (2011) finds that the average fairvalue of ARBNs in our sample wasapproximately 95 per cent of the offering price.DDs were first issued in May 2008 and
continued to be released sporadically over thenext few years. In early 2012, new issues of DDsincreased significantly and it is this renewedinterest that motivates this study. In this article,we analyze and value more than 100 DDs issuedup to December 2012. We find that, like manyvarieties of structured products, the present valueof DDs tends to be significantly below par, and iscritically dependent on a variety of risk factorsthat may not be transparent or easily understoodby retail investors.
FEATURES OF DDs
General features of structured
products
Structured products are debt securities issuedprimarily by banks and sold through brokers toretail or institutional investors.1 Structuredproducts have complex payouts that are linked tothe return of a particular security, index or basketof securities. There are now a wide variety ofstructured product types, but most can bethought of as combinations of option positions.Structured products can be customized in size,maturity, underlying security and a variety of
other features. These products often paysubstantial commissions, which has helped makethem a US$100 billion global industry.2
As debt securities, structured products aresubject to the credit risk of the issuer. Also, moststructured products are linked to priceappreciation in their underlying assets, but nottotal returns, essentially forgoing dividendpayments. For most structured products there isno public secondary market, and liquidity can below over very long terms to maturity. Structuredproducts’ complexity makes valuation difficult,but closed-form solutions exist for manystructured product types and many others can bevalued with other approaches, such as MonteCarlo simulation (Deng et al, 2012).
Dual directional structured products
DDs are structured products that do not issuecoupons and whose value derives from the payoutat maturity dependent on an underlying security orindex. Investors in DDs participate in the returns ofthe underlying asset at some level if the assetincreases in value. DDs typically have a return thatcorresponds to leveraged or unleveraged exposureto the positive return of an underlying asset, subjectto a cap. Investors also realize a positive return ifthe underlying asset decreases in value within aprespecified range – up to the barrier level – andlose principal if the asset decreases in value outsideof that range. The payout diagram for a typicalunleveraged DD is shown in Figure 1a and for atypical leveraged DD in Figure 1b .DDs can be generally categorized as single
observation (SODDs) or knock-out (KODDs).SODDs have a payout that depends only on theunderlying asset’s value at the final valuationdate – usually less than 2 weeks before thematurity of the notes. Figure 1c offers a graphical
Dual directional structured products
101© 2014 Macmillan Publishers Ltd. 1753-9641 Journal of Derivatives & Hedge Funds Vol. 20, 2, 99–112

depiction of such a final payout. SODDssometimes offer a buffered exposure to downsidereturns such that returns beyond the lower barrierare not applied to the principal investment on aone-to-one basis.KODDs, on the other hand, have a trigger
feature such that depreciation of the underlyingasset beyond the barrier level removes thepossibility of positive returns on the note if theasset has depreciated in value as of the finalobservation date.3 Within our sample, noKODDs offer buffered exposure to negativereturns of the underlying asset. KODDs will beless valuable than SODDs with otherwiseidentical product features.Importantly, the V-shaped region in DD
payoff diagrams represents exposure to theabsolute value of returns within that narrow range –essentially, the investor receives a payment that isdependent on the deviation of the underlyingprice from its initial value, also known as its‘realized volatility’ over the term of the note. Thisvolatility dependence could be advantageous forinvestors who are neither particularly bearish norbullish on the underlying asset.
The market for DDs
We have collected all of the DD issuances beforeDecember 2012 from their 424B2 filings withthe Securities and Exchange Commission. Weperformed a full-text search of all 424B2s usingthe third-party service EDGAR Pro (pro.edgar-online.com/). We searched for filings thatcontained the strings ‘Dual Directional’ or‘Absolute Value’, which were not autocallableand did not protect principal. This search resultedin more than 500 filings that met the full-textsearch criteria. After removing preliminary filingsand false positives from this set, we were left with
125 DDs issued between May 2008 andDecember 2012.4
Figure 1: Payout diagrams for an
unleveraged DD, a 1.5 leveraged DD and a
buffered DD; the DDs have a cap of 125 per
cent and a trigger of 75 per cent.
(a) Unleveraged DD payout diagram;
(b) leveraged DD payout diagram; (c) single
observation with barrier.
Deng et al
102 © 2014 Macmillan Publishers Ltd. 1753-9641 Journal of Derivatives & Hedge Funds Vol. 20, 2, 99–112

JP Morgan Chase sold the first DD in May2008 and followed this offering with nearly adozen more amounting to nearly $74 million inDDs in the summer of 2008. Soon after severalother issuers began offering DDs. In oursample, the major issuers of DDs wereGoldman Sachs, JP Morgan Chase, MorganStanley and Credit Suisse. Together theseissuers account for more the 80 per cent of theaggregate issue size for all DDs. Figure 2includes a more detailed summary of themarket segmented by issuer.The assets underlying the DDs have varied
over time, but the primary underlying assets
have been the S&P 500 index and Apple stock(AAPL). Figure 3 includes a more detailedsummary of the market segmented by underlyingasset.We can further break down the issuance
of DDs into the types of DDs offered bythese issuers. Table 1 categorizes the numberof Single Observation DDs by issuer andgives the average issue size for singleobservation DDs.Fewer knock-out DDs have been issued
than single observation DDs – 47 knock-outDDs were issued compared with 78 singleobservation DDs. Table 2 summarizes theissuance of these structured products beforeDecember 2012.
Goldman Sachs29%
JPMorgan24%
Morgan Stanley 14%
Credit Suisse 13%
Citigroup 8%
Other12%
Figure 2: DD market summary by issuer
based on issue size.
Table 1: Number and average issue size of
single observation DDs within our sample
Issuer DDswith
leverage
DDswithoutleverage
Average issuesize (in million
dollars)
JP Morgan Chase 15 9 7.1Morgan Stanley 14 5 8.2
Credit Suisse 7 4 11.8Citigroup 10 0 9.6Other issuers 8 6 6.8
S&P 500 Index72%
Apple Inc.11%
iShares MSCIEmerging
Markets IndexFund4%
Brent CrudeFutures Contracts
3%
Other10%
Figure 3: DD market summary by underlying
index based on issue size.
Table 2: Number and average issue size of
knock-out DDs within our sample
Issuer DDswith
leverage
DDswithoutleverage
Average issuesize (in million
dollars)
Goldman Sachs 3 8 29.5JP Morgan Chase 0 16 6.5Credit Suisse 3 5 2.3Other issuers 1 11 3.9
Dual directional structured products
103© 2014 Macmillan Publishers Ltd. 1753-9641 Journal of Derivatives & Hedge Funds Vol. 20, 2, 99–112

Finally, Table 3 summarizes the averageparameter values for each category of DDs issuedbefore December 2012. The leveraged version ofDDs generally have a higher commission and alonger term in years when compared with theirunleveraged counterparts. Unleveraged DDstend to be issued in larger sizes.
OPTION DECOMPOSITION OF DDs
Like most structured products, DDs can bedecomposed into zero-coupon bonds, barrieroptions, binary options and European options.The precise options required depend on theparticular product features, but broadly speakingthe decomposition falls into one of twocategories: KODDs and SODDs.
Knock-out dual directionals
KODDs combine a zero-coupon bond with thesame maturity as the structured product with atleast four option positions. Although the choiceof decomposition is not unique, one choice is a(i) long an ATM put, (ii) short two knock-inputs, (iii) long an ATM call and (iv) short an out-of-the-money (OTM) call. Figure 4 graphicallydepicts this decomposition. The knock-in levelof the puts sets the lower barrier and the strikeprice of the OTM call sets the upper trigger. If
the DD leverages the positive returns of theunderlying below the maximum return, then thenumber of call options should be increasedproportionally.
Single observation dual directionals
SODDs combine a zero-coupon bond with atleast five option positions. One choice is (i) longan ATM put, (ii) short asset-or-nothing (AON)puts, (iii) short OTM puts, (iv) long an ATM calland (v) short an OTM call. Figure 5 graphicallydepicts this decomposition. The AON binary putsgive the discontinuity around the lower barrierand the strike price of the OTM call sets the uppertrigger. By changing the number of put options,a buffer can be included on the negative returnsbeyond the trigger level. In an identical fashion tothe KODDs, leverage on positive returns can beincluded by increasing the number of call optionsproportionally. Leveraging the upside in thestraddle effectively makes the product look morelike a strap than a straddle.
VALUATION OF DDs
Model
Our valuation of DDs follows theBlack–Scholes model with risk-neutral
Table 3: Average parameter values within our sample of DDs
Parameter SODDs KODDs
Leveraged Unleveraged Leveraged Unleveraged
Commission 1.6% 1.4% 1.5% 1.3%Maximum Return 24% 21% 50% 24%Lower barrier −16% −21% −31% −28%Issue size (millions) $7.2 $10.7 $3.3 $11.8Term (years) 1.5 1.4 2.0 1.3
Deng et al
104 © 2014 Macmillan Publishers Ltd. 1753-9641 Journal of Derivatives & Hedge Funds Vol. 20, 2, 99–112

assumptions (Black and Scholes, 1973; Merton,1973). The reference asset’s price is a generalizedBrownian motion
dSt ¼ r - qð ÞStdt + σStdWt (1)
where r is the risk-free rate, q is the dividend yieldand σ is the volatility of the price process.5 If weassume the price of the structured product V(S, t)is a function of time t∈[0, T] and the referenceasset’s price S∈[0,∞), the Black–Scholes
KT
P(ST)
S0
ST
P(ST)
S0
ST
T
P(ST)
S0
ST
P(ST)
ST
K
P(ST)
S0
ST
Long ATM Put Short Barrier Put Long ATM Call Short OTM Call
S0
Figure 4: Option decomposition of a KODD.
K
P(ST)
S0
ST
H
P(ST)
S0
ST
P(ST)
S0
ST
H
P(ST)
S0
ST
P(ST)
S0
ST
P(ST)
S0
ST
KH
Long ATM Put Short OTM Put Short AON Put Long ATM Call Short OTM Call
Figure 5: Option decomposition of a SODD.
Dual directional structured products
105© 2014 Macmillan Publishers Ltd. 1753-9641 Journal of Derivatives & Hedge Funds Vol. 20, 2, 99–112
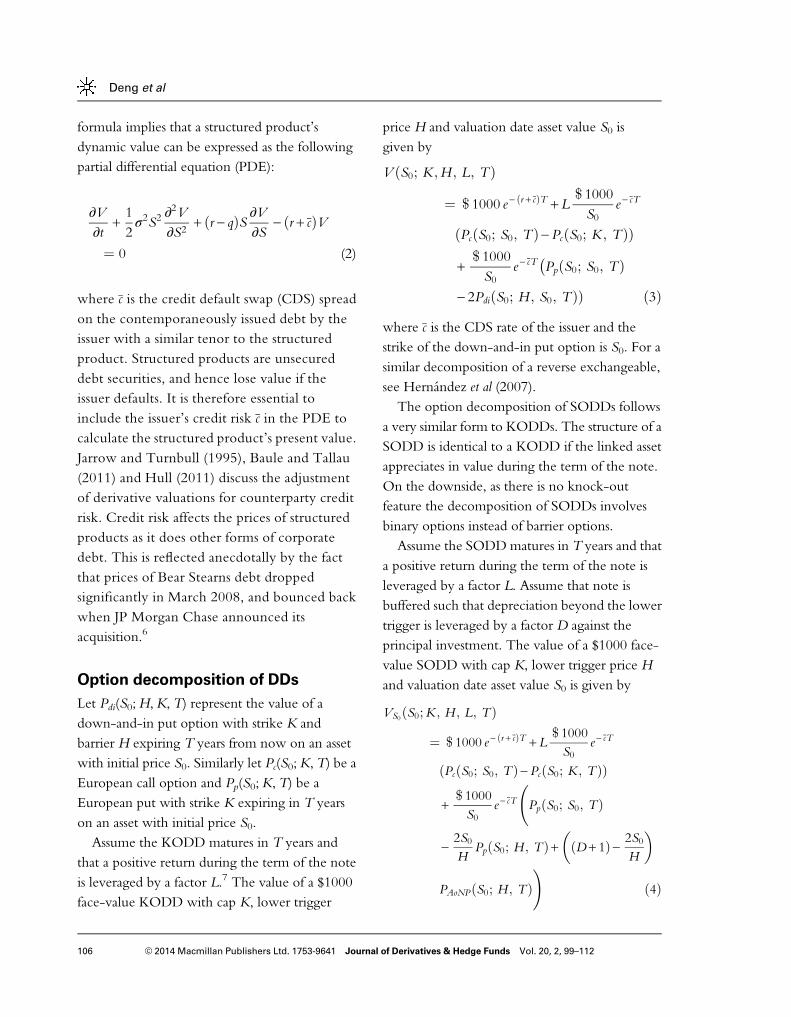
formula implies that a structured product’sdynamic value can be expressed as the followingpartial differential equation (PDE):
∂V∂t
+12σ2S2
∂2V∂S2
+ r - qð ÞS ∂V∂S
- r + cð ÞV¼ 0 (2)
where c is the credit default swap (CDS) spreadon the contemporaneously issued debt by theissuer with a similar tenor to the structuredproduct. Structured products are unsecureddebt securities, and hence lose value if theissuer defaults. It is therefore essential toinclude the issuer’s credit risk c in the PDE tocalculate the structured product’s present value.Jarrow and Turnbull (1995), Baule and Tallau(2011) and Hull (2011) discuss the adjustmentof derivative valuations for counterparty creditrisk. Credit risk affects the prices of structuredproducts as it does other forms of corporatedebt. This is reflected anecdotally by the factthat prices of Bear Stearns debt droppedsignificantly in March 2008, and bounced backwhen JP Morgan Chase announced itsacquisition.6
Option decomposition of DDs
Let Pdi(S0;H,K, T) represent the value of adown-and-in put option with strike K andbarrier H expiring T years from now on an assetwith initial price S0. Similarly let Pc(S0;K, T) be aEuropean call option and Pp(S0;K, T) be aEuropean put with strike K expiring in T yearson an asset with initial price S0.Assume the KODD matures in T years and
that a positive return during the term of the noteis leveraged by a factor L.7 The value of a $1000face-value KODD with cap K, lower trigger
price H and valuation date asset value S0 isgiven by
V S0; K ;ð H ; L; TÞ
¼ $ 1000 e - r + cð ÞT +L$ 1000S0
e - cT
Pc S0; S0; Tð Þ -Pc S0; K ; Tð Þð Þ
+$ 1000S0
e- cT Pp S0; S0; Tð Þ�- 2Pdi S0; H ; S0; Tð ÞÞ ð3Þ
where c is the CDS rate of the issuer and thestrike of the down-and-in put option is S0. For asimilar decomposition of a reverse exchangeable,see Hernández et al (2007).The option decomposition of SODDs follows
a very similar form to KODDs. The structure of aSODD is identical to a KODD if the linked assetappreciates in value during the term of the note.On the downside, as there is no knock-outfeature the decomposition of SODDs involvesbinary options instead of barrier options.Assume the SODDmatures in T years and that
a positive return during the term of the note isleveraged by a factor L. Assume that note isbuffered such that depreciation beyond the lowertrigger is leveraged by a factor D against theprincipal investment. The value of a $1000 face-value SODD with cap K, lower trigger price Hand valuation date asset value S0 is given by
VS0 S0;ð K ; H ; L; T Þ
¼ $ 1000 e - r + cð ÞT +L$ 1000S0
e - cT
Pc S0; S0; Tð Þ - Pc S0; K ; Tð Þð Þ
+$ 1000S0
e - cT Pp S0; S0; Tð Þ
-2S0H
PpðS0; H ; T Þ + D + 1ð Þ - 2S0H
� �
PAoNPðS0; H ; TÞ!
ð4Þ
Deng et al
106 © 2014 Macmillan Publishers Ltd. 1753-9641 Journal of Derivatives & Hedge Funds Vol. 20, 2, 99–112

where PAoNP is an AON (binary) put option thatdelivers one unit of the underlying asset if theasset’s spot is below the strike at maturity.
Option valuation
DDs contain either a barrier option or a binaryoption. Barrier options can can be valued usingthe reflection lemma in Carr and Chou (1997a).In fact, Carr and Chou (1997b) give a formula fordown-and-out contingent claims in terms of anequivalent payoff involving European options.8
We have written the value of KODDs in termsof a single barrier option – a down-and-in putoption. Let Pdi(S0;H,K, T) represent the value ofa down-and-in put option with strike K, barrierH expiring T years from now on an asset withcurrent price S0. Assume that the underlying assethas a log-normal return distribution with meanμ= r−q−σ2/2 and variance σ2. We assume thatthe risk-free rate and dividend yield are constantand continuously compounded and that thevariance is constant as well. The option pays offlike a vanilla put option if the barrier H has beenhit before the option’s expiration.Following Hull (2011), the present value of a
down-and-in put option is given by
Pdi S0;ð H ; K ; T Þ
¼ Ke - rTΦlog H
S0
� �- μT
σffiffiffiffiT
p0@
1A
- S0e - qTΦlog H
S0
� �- μ + σ2ð ÞTσffiffiffiffiT
p0@
1A
+ S0e - qTHS0
� �2μ + σ2
σ2
Φlog H2
S0K
� �+ μ + σ2ð ÞT
σffiffiffiffiT
p0@
1A
24
-Φlog H
S0
� �+ μ + σ2ð ÞTσffiffiffiffiT
p0@
1A35
-Ke - rTHS0
� �2 μ
σ2
Φlog H2
S0K
� �+ μT
σffiffiffiffiT
p0@
1A
24
-Φlog H
S0
� �+ μT
σffiffiffiffiT
p0@
1A35 ð5Þ
where Φ is the standard normal cumulativedistribution function assuming that the knock-inlevel is lower than the strike price. For the down-and-in put options embedded in DDs, the strikeis always equal to the initial asset price and theknock-in level is less than the strike (H<K= S0).For completeness, the present value of a
European call option is given by theconventional formula
Pc S0; K ; Tð Þ ¼S0e- qTΦ
log S0K
� �+ μ + σ2ð ÞTσffiffiffiffiT
p� �
-Ke - rTΦlog S0
K
� �+ μT
σffiffiffiffiT
p� �
ð6Þ
while the present value of a European put optionhas the following conventional formula
Pp S0; K ; Tð Þ ¼Ke - rTΦlog K
S0
� �- μT
σffiffiffiffiT
p0@
1A
- S0e- qTΦlog K
S0
� �- μ + σ2ð ÞTσffiffiffiffiT
p0@
1A
ð7Þ
The present value of a European AON putoption is given by
PAoNP S0;ð K ; TÞ
¼ S0e- qTΦ
log KS0
� �- μ + σ2ð ÞTσffiffiffiffiT
p0@
1Að8Þ
With Equations (5)–(8) and the decompositionin Equation (3) for KODDs and in Equation (4)for SODDs, we have an analytic formula to value
Dual directional structured products
107© 2014 Macmillan Publishers Ltd. 1753-9641 Journal of Derivatives & Hedge Funds Vol. 20, 2, 99–112

DDs. In the next section, we will compute thevalue of a few example DDs using parametersfrom 424B2s filed with the Securities andExchange Commission (SEC). Extending thisframework to include stochastic volatility – suchas in the variance gamma model – is trivial givenour previous work on the subject Deng et al(2013), and would not change the qualitativeresults.
EXAMPLE VALUATIONS OF DDs
KODD without leverage
On 21 November 2012, JP Morgan Chaseissued an unleveraged $8.4 million DD linked toiShares MSCI Emerging Markets Index Fund(CUSIP: 48125VCS7) (www.sec.gov/Archives/edgar/data/19617/000119312511317247/d258311d424b2.htm). The lower barrier becomeseffective when the underlying asset (ticker: EEM)experiences a 35 per cent decrease in value and thecap on the upside return becomes effective at29 per cent. The underwriting fee on this notewas 3 per cent. The final observation date forthe note is 16 May 2013. The payout diagramfor this example product is shown in Figure 6.As of the pricing date, EEM’s dividend yield
was 2.15 per cent, its price was $39.39, and the1-year put implied volatility of the fund was35 per cent. The 1-year swap rate (USSW1) was0.72 per cent and the 2-year swap rate (USSW2)was 0.76 per cent. We linearly interpolated theserates to produce a risk-free rate of 0.74 per cent.JP Morgan Chase’s 1-year CDS rate as of thepricing date was 0.95 per cent.We find that these EEM-linked DD notes
were worth $943.85 per $1000 when issued by JPMorgan Chase. The net proceeds to the issuerwas $970.00, and therefore the premium JP
Morgan Chase charged for the product was$26.15 ($970.00−$943.85). As a result of thisissuance, JP Morgan Chase priced in a gross profitof $219 625.07.9
KODD with leverage
On 21 August 2012, Credit Suisse issued aleveraged knock-out $1 million DD (CUSIP:22546TXB2) linked to the S&P 500 Index(www.sec.gov/Archives/edgar/data/1053092/000095010312004245/dp32342_424b2-u696.htm). The lower barrier becomes effective whenthe S&P 500 Index experiences a 30 per centdecrease in value and the cap on the upsidereturns becomes effective at 17.5 per cent. Theleverage factor is 1.5 (resulting in a 26.25 per centmaximum upside return) and the underwritingfee on this note was 3 per cent. The finalobservation date for the note is 18 February2015. The payout diagram for this exampleproduct is shown in Figure 7.As of the issue date, the S&P 500’s dividend
yield was 2.1 per cent, its level was 1415.51 andthe 2-year put implied volatility of the S&P 500
Figure 6: Unleveraged KODD issued by JP
Morgan Chase on 21 November 2012 linked
to iShares MSCI emerging markets index
fund.
Deng et al
108 © 2014 Macmillan Publishers Ltd. 1753-9641 Journal of Derivatives & Hedge Funds Vol. 20, 2, 99–112
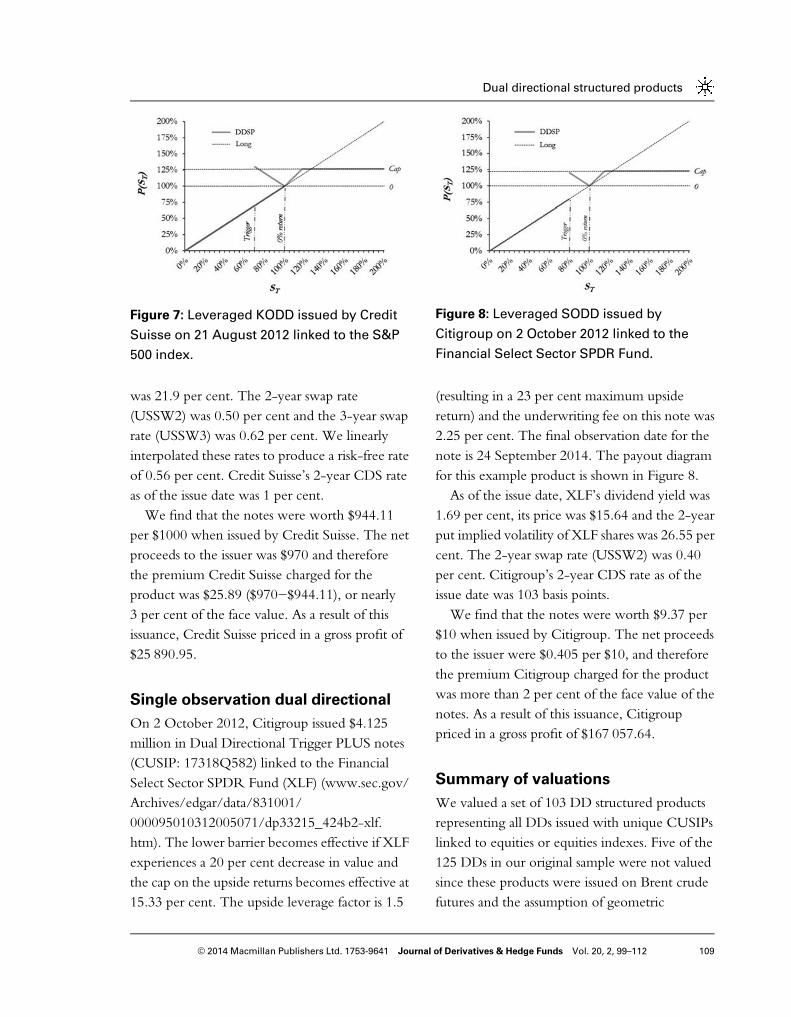
was 21.9 per cent. The 2-year swap rate(USSW2) was 0.50 per cent and the 3-year swaprate (USSW3) was 0.62 per cent. We linearlyinterpolated these rates to produce a risk-free rateof 0.56 per cent. Credit Suisse’s 2-year CDS rateas of the issue date was 1 per cent.We find that the notes were worth $944.11
per $1000 when issued by Credit Suisse. The netproceeds to the issuer was $970 and thereforethe premium Credit Suisse charged for theproduct was $25.89 ($970−$944.11), or nearly3 per cent of the face value. As a result of thisissuance, Credit Suisse priced in a gross profit of$25 890.95.
Single observation dual directional
On 2 October 2012, Citigroup issued $4.125million in Dual Directional Trigger PLUS notes(CUSIP: 17318Q582) linked to the FinancialSelect Sector SPDR Fund (XLF) (www.sec.gov/Archives/edgar/data/831001/000095010312005071/dp33215_424b2-xlf.htm). The lower barrier becomes effective if XLFexperiences a 20 per cent decrease in value andthe cap on the upside returns becomes effective at15.33 per cent. The upside leverage factor is 1.5
(resulting in a 23 per cent maximum upsidereturn) and the underwriting fee on this note was2.25 per cent. The final observation date for thenote is 24 September 2014. The payout diagramfor this example product is shown in Figure 8.As of the issue date, XLF’s dividend yield was
1.69 per cent, its price was $15.64 and the 2-yearput implied volatility of XLF shares was 26.55 percent. The 2-year swap rate (USSW2) was 0.40per cent. Citigroup’s 2-year CDS rate as of theissue date was 103 basis points.We find that the notes were worth $9.37 per
$10 when issued by Citigroup. The net proceedsto the issuer were $0.405 per $10, and thereforethe premium Citigroup charged for the productwas more than 2 per cent of the face value of thenotes. As a result of this issuance, Citigrouppriced in a gross profit of $167 057.64.
Summary of valuations
We valued a set of 103 DD structured productsrepresenting all DDs issued with unique CUSIPslinked to equities or equities indexes. Five of the125 DDs in our original sample were not valuedsince these products were issued on Brent crudefutures and the assumption of geometric
Figure 7: Leveraged KODD issued by Credit
Suisse on 21 August 2012 linked to the S&P
500 index.
Figure 8: Leveraged SODD issued by
Citigroup on 2 October 2012 linked to the
Financial Select Sector SPDR Fund.
Dual directional structured products
109© 2014 Macmillan Publishers Ltd. 1753-9641 Journal of Derivatives & Hedge Funds Vol. 20, 2, 99–112
Brownian motion for these contracts may notbe as well-motivated. In addition, 17 of the DDswere not valued because of data limitations – forexample, no CDS rate data. As a result, we valued103 DD structured products.The valuation results produced according to
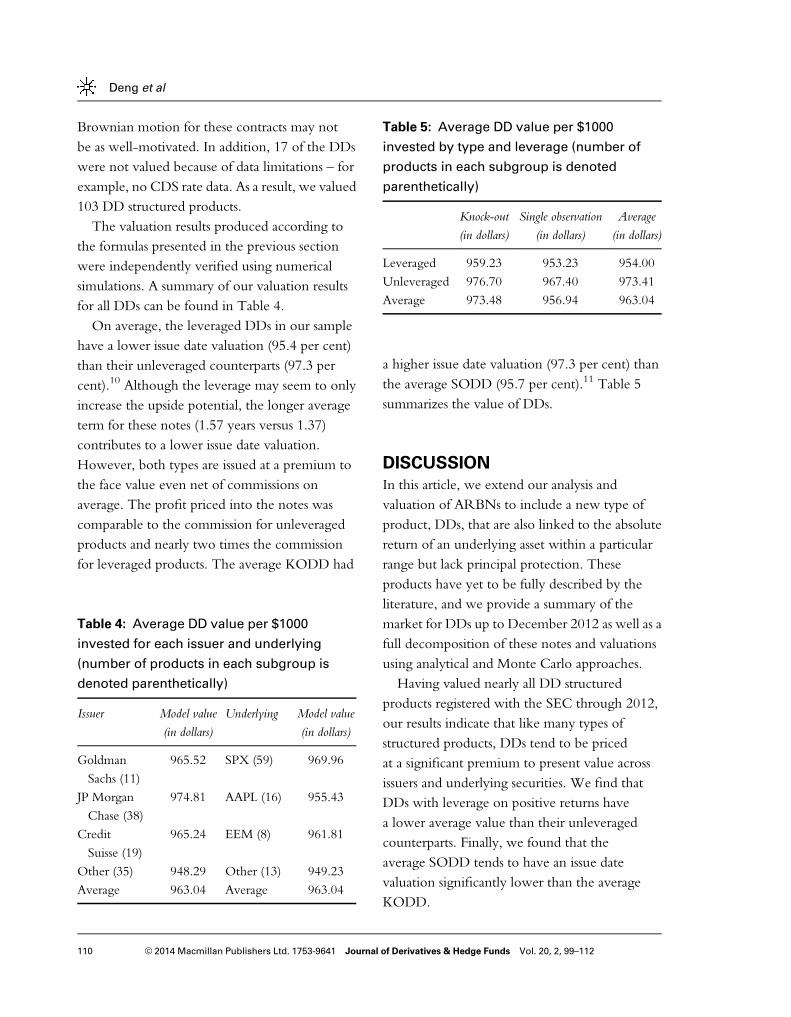
the formulas presented in the previous sectionwere independently verified using numericalsimulations. A summary of our valuation resultsfor all DDs can be found in Table 4.On average, the leveraged DDs in our sample
have a lower issue date valuation (95.4 per cent)than their unleveraged counterparts (97.3 percent).10 Although the leverage may seem to onlyincrease the upside potential, the longer averageterm for these notes (1.57 years versus 1.37)contributes to a lower issue date valuation.However, both types are issued at a premium tothe face value even net of commissions onaverage. The profit priced into the notes wascomparable to the commission for unleveragedproducts and nearly two times the commissionfor leveraged products. The average KODD had
a higher issue date valuation (97.3 per cent) thanthe average SODD (95.7 per cent).11 Table 5summarizes the value of DDs.
DISCUSSION
In this article, we extend our analysis andvaluation of ARBNs to include a new type ofproduct, DDs, that are also linked to the absolutereturn of an underlying asset within a particularrange but lack principal protection. Theseproducts have yet to be fully described by theliterature, and we provide a summary of themarket for DDs up to December 2012 as well as afull decomposition of these notes and valuationsusing analytical and Monte Carlo approaches.Having valued nearly all DD structured
products registered with the SEC through 2012,our results indicate that like many types ofstructured products, DDs tend to be pricedat a significant premium to present value acrossissuers and underlying securities. We find thatDDs with leverage on positive returns havea lower average value than their unleveragedcounterparts. Finally, we found that theaverage SODD tends to have an issue datevaluation significantly lower than the averageKODD.
Table 4: Average DD value per $1000
invested for each issuer and underlying
(number of products in each subgroup is
denoted parenthetically)
Issuer Model value(in dollars)
Underlying Model value(in dollars)
GoldmanSachs (11)
965.52 SPX (59) 969.96
JP MorganChase (38)
974.81 AAPL (16) 955.43
CreditSuisse (19)
965.24 EEM (8) 961.81
Other (35) 948.29 Other (13) 949.23Average 963.04 Average 963.04
Table 5: Average DD value per $1000
invested by type and leverage (number of
products in each subgroup is denoted
parenthetically)
Knock-out(in dollars)
Single observation(in dollars)
Average(in dollars)
Leveraged 959.23 953.23 954.00Unleveraged 976.70 967.40 973.41Average 973.48 956.94 963.04
Deng et al
110 © 2014 Macmillan Publishers Ltd. 1753-9641 Journal of Derivatives & Hedge Funds Vol. 20, 2, 99–112

The issuance of DDs has increased significantlyin 2012, and several reports have described DDsas non-directional exposure to the underlyingasset (see, for example, Hampson, 2012;Robinson, 2012). However, the actual exposurethese notes embed is highly complex anddependent on several factors, including theimplied volatility of the underlying but also thecreditworthiness of the issuer, dividend rates,trigger levels and the term of the note. Wedemonstrated that banks charge an averagepremium of approximately 2.2 per cent abovetheir stated commission levels, suggesting DDsmay not be suitable for unsophisticated investors.
NOTES
1 For an extensive introduction to structuredproducts, see Henderson and Pearson (2010).
2 According to Bloomberg Structured NotesBrief dated 5 January 2012, $101.7 billion instructured notes were sold in 2011 on 4406offerings amongst the top 20 global issuers.According to their 2012 Review dated3 January 2012, $104.1 billion in structurednotes were sold in 2012.
3 The barrier feature in DDs is typicallytriggered if the closing value of the referenceasset on any trading day within its term is lessthan the barrier level. Intraday fluctuationstherefore do not trigger the barrier feature.
4 DD products are also issued in the Europeanstructured product market, where the brandnames may differ. For example, we have seenEuropean products labeled ‘Twin-Win’securities that are examples of what we callDDs.
5 Throughout this paper, we assume r, q and σ
are constant and continuously compoundedover the product’s term [0, T]. For simplicity,we omit the subscript t from St.
6 For additional information, see, for example,Hull (2011) and Deng et al (2012).
7 L= 1 for unleveraged KODDs, while L>1for leveraged KODDs. Although none of thenotes in our sample offer a coupon payment,such payments could easily be incorporatedinto this framework.
8 We write the path-dependent payofffunction above in terms of an equivalentstatic payoff because there is evidencethat the static hedge of a portfolio withpath-dependent options is preferred overa dynamic hedging because of lowertransaction costs (Tompkins, 2002 ).
9 For our Monte Carlo simulations, wefollowed procedures substantially similar toGlasserman (2003), using 100 000 simulationsand increasing the frequency of observationsto confirm convergence to the analytic result.
10 A difference of means test reveals that thisdifference is statistically significant (P<0.001).
11 A difference of means test shows that thisdifference is statistically significant (P<0.005).This is perhaps a reason that singleobservation DDs are more frequently issued.
ReferencesBaule, R. and Tallau, C. (2011) The pricing of path-
dependent structured financial retail products: The caseof bonus certificates. Journal of Derivatives 18(4): 54–71.
Black, F. and Scholes, M. (1973) The pricing of optionsand corporate liabilities. Journal of Political Economy 81(3):637–654.
Carr, P. and Chou, A. (1997a) Breaking barriers. RISK10(9): 139–145.
Carr, P. and Chou, A. (1997b) Hedging Complex BarrierOptions. Working paper, http://www.math.nyu.edu/research/carrp/papers/pdf/multipl3.pdf.
Deng, G., Dulaney, T. and McCann, C. (2013) Valuation ofreverse convertibles in variance gamma economy. Journalof Derivatives and Hedge Funds 19(November): 244–258.
Deng, G., Guedj, I., Mallett, J. and McCann, C. (2011)The anatomy of absolute return barrier notes. The Journalof Derivatives 19(2): 61–70.
Dual directional structured products
111© 2014 Macmillan Publishers Ltd. 1753-9641 Journal of Derivatives & Hedge Funds Vol. 20, 2, 99–112

Deng, G., Husson, T. and McCann, C. (2012) Valuationof Structured Products. The Journal of AlternativeInvestments 16(4): 71–87.
Deng, G., McCann, C. and O’Neal, E. (2010) What TiVoand JP Morgan Teach us about Reverse Convertibles.SLCG working paper, http://www.slcg.com/.
Glasserman, P. (2003) Monte Carlo Methods in FinancialEngineering. New York, NY: Springer.
Hampson, S. (2012) HSBC straddle product offers each-way beton S&P 500, http://www.risk.net/structured-products/,accessed 28 February 2013.
Henderson, B. and Pearson, N. (2010) The dark side offinancial innovation: A case study of the pricing of a retailfinancial product. The Journal of Financial Economics100(2): 227–247.
Hernández, R., Lee, W.Y. and Liu, P. (2007) An EconomicAnalysis of Reverse Exchange-Able Securities: AnOption-Pricing Approach. Working paper, University ofArkansas, Arkansas.
Hull, J. (2011) Options, Futures and Other Derivatives, 8thedn. Upper Saddle River, NJ: Prentice-Hall.
Jarrow, R.A. and Turnbull, S.M. (1995) Pricing derivativeson financial securities subject to credit risk. The Journal ofFinance L(1): 53–85.
McCann, C. and Luo, D. (2006) Are Structured ProductsSuitable for Retail Investors? SLCG working paper,http://www.slcg.com/.
Merton, R. (1973) Theory of rational option pricing. BellJournal of Economics and Management Science 4(1): 141–183.
Robinson, M. (2012) ‘Dual Directional’ notes rise tothree year high, http://www.bloombergbriefs.com/,accessed 28 February 2013.
Szymanowska, M., Horst, J.T. and Veld, C. (2009)Reverse convertible bonds analyzed. Journal of FuturesMarkets 29(10): 895–919.
Tompkins, R.G. (2002) Static versus dynamic hedging ofexotic options: An evaluation of hedge performance viasimulation. Journal of Risk Finance 3(4): 6–34.
Deng et al
112 © 2014 Macmillan Publishers Ltd. 1753-9641 Journal of Derivatives & Hedge Funds Vol. 20, 2, 99–112