Embed Size (px)
Citation preview
27 ISSN 0378-651X © OECD 2007
Structured Products: Implications for Financial Markets
Adrian Blundell-Wignall
The paper looks at financial market innovation and how it has led to the rapid growth of structured products. It explores the mechanisms that come into play as assets inside these products (mortgages, credit card receivables, etc.) suffer losses. The potential size of such losses is currently concerning financial markets, and the paper looks at various ways to quantify the issues and where, going forward, pressures are most likely to arise. The problem is seen mainly as a stock adjustment issue (related to inventories of assets etc.) that is going to require time to set right. Time could well be more important than the cost of capital. The idea of a super fund to buy up unwanted assets should be seen in this context. The paper goes on to look at financial market implications, including the credit supply process, spreads, and the dollar.

29 ISSN 0378-651X © OECD 2007
Structured Products: Implications for Financial Markets
Adrian Blundell-Wignall ∗
I. Introduction and summary
Given the turmoil in financial markets that came into play over the summer, this paper takes another look at structured products, following up on an earlier paper published in May. Its particular focus is on collateralised debt obligations (CDOs) and structured investment vehicles (SIVs): how they function, and the mechanisms by which developments in credit markets, in particular the US mortgage markets, have an impact on them. It also explores how patterns of ownership of these products – by banks and other investors such as hedge funds – may influence financial market outcomes.
An important conclusion of this analysis is that stock adjustment issues are at the very centre of the turmoil. This means that ‘time’ is very important, and may indeed be more important than the cost of capital. Work-out vehicles that help provide time for orderly balance sheet
∗ Adrian Blundell-Wignall is Deputy Director in the OECD Directorate for
Financial and Enterprise Affairs. The opinions expressed and arguments employed herein do not necessarily reflect the official views of the Organisation or of the governments of its member countries. The paper benefitted from comments by Paul Atkinson and from numerous discussions with private financial market participants. Se-Hoon Lee, Financial Markets Analyst of the Financial Affairs Division in the author’s Directorate, provided helpful assistance in digging through multiple banks’ financial reports.
Financial Market Trends, N°93, Vol. 2007/2
30 ISSN 0378-651X © OECD 2007
restructuring could be helpful, depending on how they are configured. The main financial market implications are: the potential for instability in the credit supply process as balance sheet factors come into play; the impact on spreads between high and low quality securities; the impact on the dollar, since a good proportion of structured products have been sold to non-US investors helping fund the current account; and economic impacts that may lead to knock-on effects in other markets such as corporate bonds, credit card receivables and equities.
II. Financial market innovation
Financial innovation and low interest rates
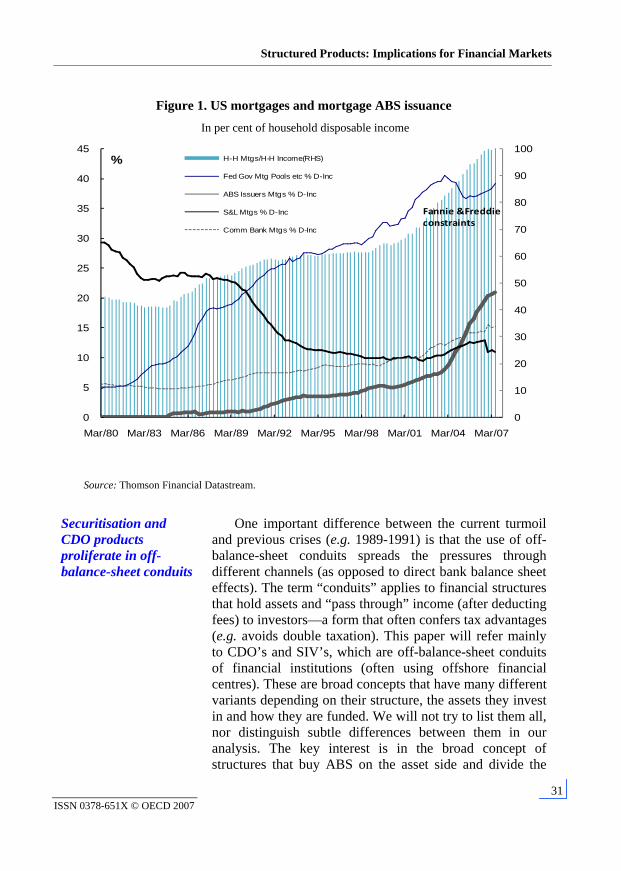
Financial innovation spurred by factors such as changes in tax rules, together with a low interest rate environment, have contributed to rising leverage during the 2000s in a number of countries. The role of off-balance sheet “conduits” in this process is a key focus of this paper. Figure 1 shows the boom in US mortgages and residential mortgage-backed securities (RMBS) issuance involving a lot of subprime in the period when Fannie Mae and Freddie Mac were constrained by authorities due to accounting problems. These RMBS have been a key ingredient of the CDO boom. Other asset-backed securities (ABS) such as credit card receivables and corporate bonds are also used in CDOs.
There are benefits but also new risks
Financial innovation and increased leverage had many benefits. For example, home ownership has spread to lower income households. Corporate restructuring has facilitated productivity growth. The growth of structured products, as a part of this process, also promoted risk transfer and dispersion. However, structured products have also played a significant role in the current turmoil, as delinquencies and defaults have begun to rise in the underlying mortgages (particularly subprime and Alt-A).
A contributing factor is that securitisation has altered important aspects of risk management in lending: loan originators have less incentive to undertake due diligence on borrower quality and appropriateness of credit instruments as the repayment risk is transferred to someone else.
Structured Products: Implications for Financial Markets
31 ISSN 0378-651X © OECD 2007
Figure 1. US mortgages and mortgage ABS issuance In per cent of household disposable income
0
10
20
30
40
50
60
70
80
90
100
0
5
10
15
20
25
30
35
40
45
Mar/80 Mar/83 Mar/86 Mar/89 Mar/92 Mar/95 Mar/98 Mar/01 Mar/04 Mar/07
H-H Mtgs/H-H Income(RHS)
Fed Gov Mtg Pools etc % D-Inc
ABS Issuers Mtgs % D-Inc
S&L Mtgs % D-Inc
Comm Bank Mtgs % D-Inc
%
Fannie &Freddieconstraints
Source: Thomson Financial Datastream.
Securitisation and CDO products proliferate in off-balance-sheet conduits
One important difference between the current turmoil and previous crises (e.g. 1989-1991) is that the use of off-balance-sheet conduits spreads the pressures through different channels (as opposed to direct bank balance sheet effects). The term “conduits” applies to financial structures that hold assets and “pass through” income (after deducting fees) to investors—a form that often confers tax advantages (e.g. avoids double taxation). This paper will refer mainly to CDO’s and SIV’s, which are off-balance-sheet conduits of financial institutions (often using offshore financial centres). These are broad concepts that have many different variants depending on their structure, the assets they invest in and how they are funded. We will not try to list them all, nor distinguish subtle differences between them in our analysis. The key interest is in the broad concept of structures that buy ABS on the asset side and divide the
Financial Market Trends, N°93, Vol. 2007/2
32 ISSN 0378-651X © OECD 2007
credit risk by selling senior (AAA), mezzanine (AA to BB) and equity (unrated) on the liabilities side to earn an excess spread and fees for the sponsor. The liabilities may include commercial paper and medium-term notes. A SIV is a variant of a CDO that is permanently capitalised and managed by the bank originator (a CDO terminates or needs refinancing at term). We will occasionally refer to collateralised synthetic obligations (CSO’s) which get their exposure via swaps, asset-backed commercial paper (ABCP) conduits, and collateralised loan obligations (CLO’s), which invest in leveraged bank loans. Nevertheless; they may all be thought of as ‘special cases’ of the broad CDO concept.
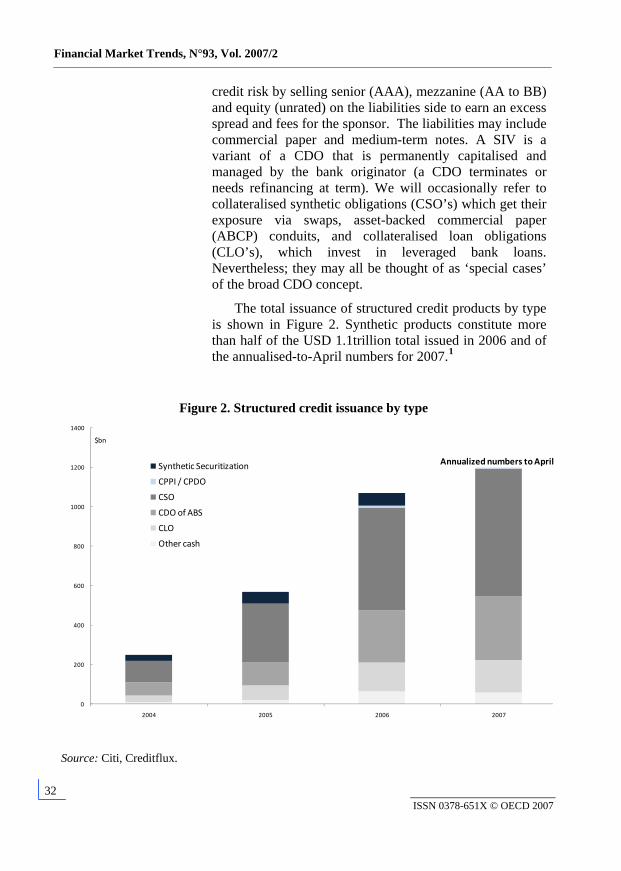
The total issuance of structured credit products by type is shown in Figure 2. Synthetic products constitute more than half of the USD 1.1trillion total issued in 2006 and of the annualised-to-April numbers for 2007.1
Figure 2. Structured credit issuance by type
0
200
400
600
800
1000
1200
1400
2004 2005 2006 2007
Annualized numbers to AprilSynthetic Securitization
CPPI / CPDO
CSO
CDO of ABS
CLO
Other cash
$bn
Source: Citi, Creditflux.
Structured Products: Implications for Financial Markets
33 ISSN 0378-651X © OECD 2007
There was around USD 3 trillion in cash and synthetic CDOs
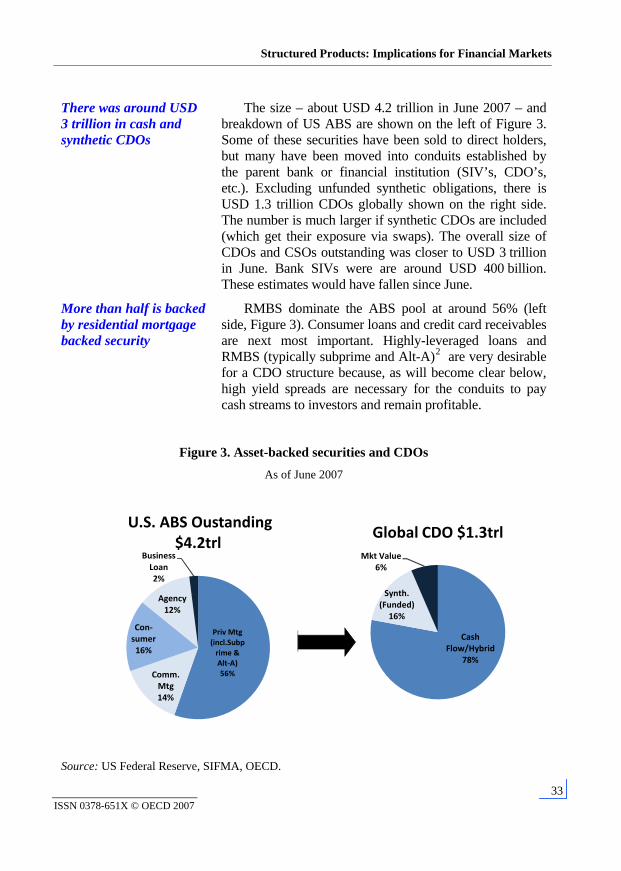
The size – about USD 4.2 trillion in June 2007 – and breakdown of US ABS are shown on the left of Figure 3. Some of these securities have been sold to direct holders, but many have been moved into conduits established by the parent bank or financial institution (SIV’s, CDO’s, etc.). Excluding unfunded synthetic obligations, there is USD 1.3 trillion CDOs globally shown on the right side. The number is much larger if synthetic CDOs are included (which get their exposure via swaps). The overall size of CDOs and CSOs outstanding was closer to USD 3 trillion in June. Bank SIVs were are around USD 400 billion. These estimates would have fallen since June.
More than half is backed by residential mortgage backed security
RMBS dominate the ABS pool at around 56% (left side, Figure 3). Consumer loans and credit card receivables are next most important. Highly-leveraged loans and RMBS (typically subprime and Alt-A)2 are very desirable for a CDO structure because, as will become clear below, high yield spreads are necessary for the conduits to pay cash streams to investors and remain profitable.
Figure 3. Asset-backed securities and CDOs As of June 2007
Priv Mtg (incl.Subprime & Alt‐A)56%Comm.
Mtg14%
Con‐sumer16%
Agency12%
Business Loan2%
U.S. ABS Oustanding $4.2trl
Cash Flow/Hybrid
78%
Synth. (Funded)16%
Mkt Value6%
Global CDO $1.3trl
Source: US Federal Reserve, SIFMA, OECD.
Financial Market Trends, N°93, Vol. 2007/2
34 ISSN 0378-651X © OECD 2007
III. Conduits make money by excess spreads – the heart of the matter
Asset-backed commercial paper has maturity mismatch
A simple form of a conduit is the ABCP market. The conduit issues low yield short-term paper, no more than 270 days, and uses the proceeds to buy various assets with longer maturities and higher yields: trade receivables, credit card receivables, auto and equipment loans and leases, RMBS, junk bonds, government bonds, and CDOs.3 The maturity (or duration) mismatch is the source of the profit spread.
CDOs have quality mismatch and equity tranche buffers
CDOs and SIVs similarly buy RMBS, credit-card receivable securities, etc. at the higher yield end (BBB average), then structure them into tranches of mostly more highly-rated labels with lower yields (including a lot of AAA) that they sell to investors. To make a profitable spread it is necessary to have a higher weight to low-grade securities on the assets side and a higher weight to high-grade securities on the liabilities side.
Understanding the complex structure of the conduit business model
Complex structures require many players…
…originators…
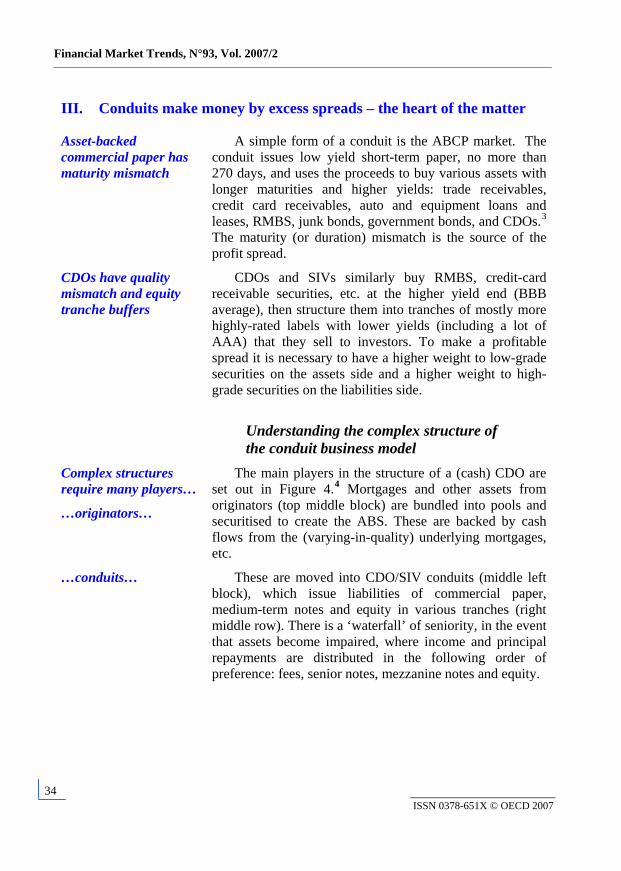
The main players in the structure of a (cash) CDO are set out in Figure 4.4 Mortgages and other assets from originators (top middle block) are bundled into pools and securitised to create the ABS. These are backed by cash flows from the (varying-in-quality) underlying mortgages, etc.
…conduits… These are moved into CDO/SIV conduits (middle left block), which issue liabilities of commercial paper, medium-term notes and equity in various tranches (right middle row). There is a ‘waterfall’ of seniority, in the event that assets become impaired, where income and principal repayments are distributed in the following order of preference: fees, senior notes, mezzanine notes and equity.
Structured Products: Implications for Financial Markets
35 ISSN 0378-651X © OECD 2007
Figure 4. CDO structure and main players
Mortgage Insurers ASSET ORIGINATORSe.g . FHA,MGIC,AIG Banks, IB's
Bond Insurers Mtg brokers, etc. Admin Servicinge.g. MBIA, AMBAC, Insurance Co's
Radian etc.
ASSETS CDO/SIV/CSO LIABILITIESRMBS, Corp Bonds, CONDUIT Tranches: Seniorleveraged loans, credit (often off-shore fin.cen.) Mezzaninecards, swaps, etc. Assets Manager Equity
(can include ABCP)
CREDIT RATING INVESTMENT INVESTORSAGENCIES BANK FI Fund Mgrs.
e.g. S&P, Moody's, Design Insurance Co's Fitch Prospectus Pension Funds
Underwriting Hedge FundsSales
Source: OECD.
…investment banks…
…rating agencies…
…and insurers
The excess spread (profit generator) is the difference between the yield on the assets and the fees and interest payments to the tranches (liabilities of the conduit). The servicing arms of banks etc. also gain fees by administering the structure (dealing with household payments, etc.) shown on the upper right. Obviously Moody’s, Fitch and S&P do the ratings on the tranches, which range typically from Aaa/AAA to unrated (lower left block). They work with the investment banks (bottom middle) which are involved in underwriting, designing and selling the tranches to investors (like banks, insurance companies, fund managers, hedge funds and private clients) shown on the bottom right. The rated securities are sold with credit enhancement through insurance guarantees – e.g. companies like AMBAC, MBIA, Radian, PMI Group, MGIC, etc. shown top left. Fees are involved everywhere.
Financial Market Trends, N°93, Vol. 2007/2
36 ISSN 0378-651X © OECD 2007
The CDO waterfall mechanism as losses rise
A paradox Ratings and insurance notwithstanding, it is a paradox in the CDO transformation that AAA security tranches are backed by (on average) BBB securities. The AAA ratings are achieved by: the unrated equity tranche which acts as a ‘cushion’; over-capitalisation tests (if the assets-to-senior debt ratio falls, cash is diverted to pay principle on the senior tranche); credit enhancement via bond payment insurers; and the benefits of ‘pooling’ more generally.5
The core of the problem
If losses in the underlying mortgages begin to rise, the flow-through to the CDO tranches (on the liabilities side) naturally threatens equity and mezzanine tranches first. But senior-end tranches can also be affected, the greater is their proportion in the structure, and the bigger are the write-downs on the asset side. This sits at the core of the problem that markets are grappling with: how big are the losses going to be?
There is a seniority waterfall for CDO tranches
As losses in the underlying mortgages mount, the RMBS based on them can go down in value. When this happens, the ‘waterfall’ for interest and principle payments on the tranches of the CDOs goes into effect, according to the abovementioned seniority.
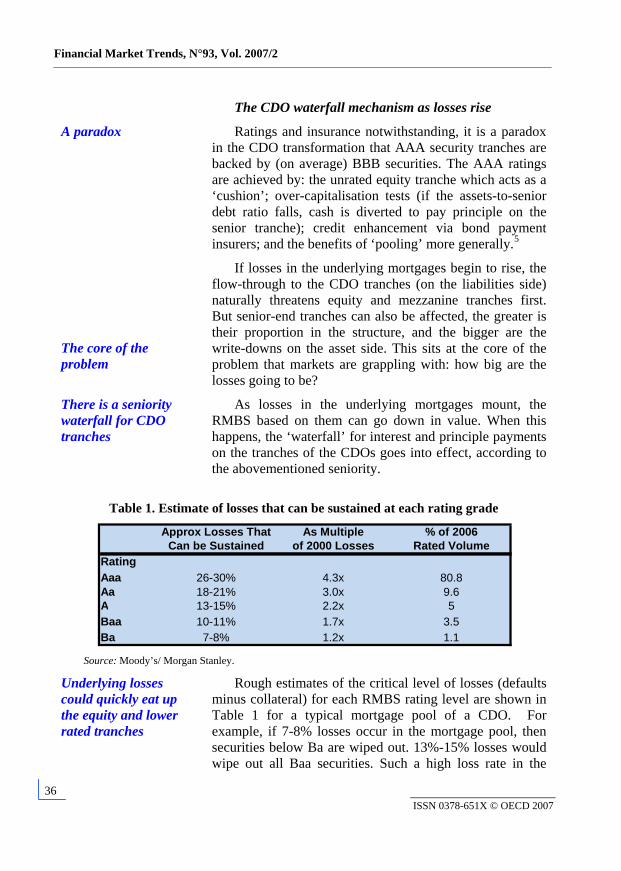
Table 1. Estimate of losses that can be sustained at each rating grade
Approx Losses That As Multiple % of 2006Can be Sustained of 2000 Losses Rated Volume
RatingAaa 26-30% 4.3x 80.8Aa 18-21% 3.0x 9.6A 13-15% 2.2x 5Baa 10-11% 1.7x 3.5Ba 7-8% 1.2x 1.1
Source: Moody’s/ Morgan Stanley.
Underlying losses could quickly eat up the equity and lower rated tranches
Rough estimates of the critical level of losses (defaults minus collateral) for each RMBS rating level are shown in Table 1 for a typical mortgage pool of a CDO. For example, if 7-8% losses occur in the mortgage pool, then securities below Ba are wiped out. 13%-15% losses would wipe out all Baa securities. Such a high loss rate in the
Structured Products: Implications for Financial Markets
37 ISSN 0378-651X © OECD 2007
mortgage pool is very unlikely, but S&P believes that 11-14% losses on sub-prime mortgages for those issued in 2006 are quite feasible.6
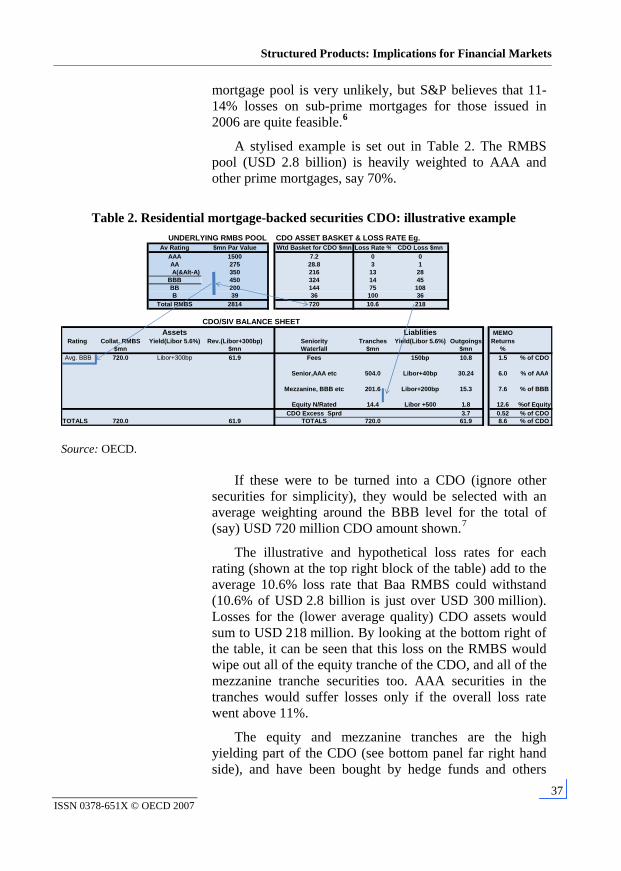
A stylised example is set out in Table 2. The RMBS pool (USD 2.8 billion) is heavily weighted to AAA and other prime mortgages, say 70%.
Table 2. Residential mortgage-backed securities CDO: illustrative example UNDERLYING RMBS POOL CDO ASSET BASKET & LOSS RATE Eg.
Av Rating $mn Par Value Wtd Basket for CDO $mn Loss Rate % CDO Loss $mnAAA 1500 7.2 0 0AA 275 28.8 3 1A(&Alt-A) 350 216 13 28
BBB 450 324 14 45BB 200 144 75 108B 39 36 100 36
Total RMBS 2814 720 10.6 218
CDO/SIV BALANCE SHEETAssets Liablities MEMO
Rating Collat. RMBS Yield(Libor 5.6%) Rev.(Libor+300bp) Seniority Tranches Yield(Libor 5.6%) Outgoings Returns$mn $mn Waterfall $mn $mn %
Avg. BBB 720.0 Libor+300bp 61.9 Fees 150bp 10.8 1.5 % of CDO
Senior,AAA etc 504.0 Libor+40bp 30.24 6.0 % of AAA
Mezzanine, BBB etc 201.6 Libor+200bp 15.3 7.6 % of BBB
Equity N/Rated 14.4 Libor +500 1.8 12.6 %of EquityCDO Excess Sprd 3.7 0.52 % of CDO
TOTALS 720.0 61.9 TOTALS 720.0 61.9 8.6 % of CDO
Source: OECD.
If these were to be turned into a CDO (ignore other securities for simplicity), they would be selected with an average weighting around the BBB level for the total of (say) USD 720 million CDO amount shown.7
The illustrative and hypothetical loss rates for each rating (shown at the top right block of the table) add to the average 10.6% loss rate that Baa RMBS could withstand (10.6% of USD 2.8 billion is just over USD 300 million). Losses for the (lower average quality) CDO assets would sum to USD 218 million. By looking at the bottom right of the table, it can be seen that this loss on the RMBS would wipe out all of the equity tranche of the CDO, and all of the mezzanine tranche securities too. AAA securities in the tranches would suffer losses only if the overall loss rate went above 11%.
The equity and mezzanine tranches are the high yielding part of the CDO (see bottom panel far right hand side), and have been bought by hedge funds and others
Financial Market Trends, N°93, Vol. 2007/2
38 ISSN 0378-651X © OECD 2007
searching for yield in a low-yield world. As leverage and derivatives are involved, prime brokers would also be exposed via counterparty mechanisms.
The key issue the market is grappling with
The market is grappling with these very issues: how big are the losses and who is most exposed to them? The re-pricing of risk reflects the markets’ best judgement about this issue.
IV. The arbitrage gap rally and subsequent re-pricing of risk
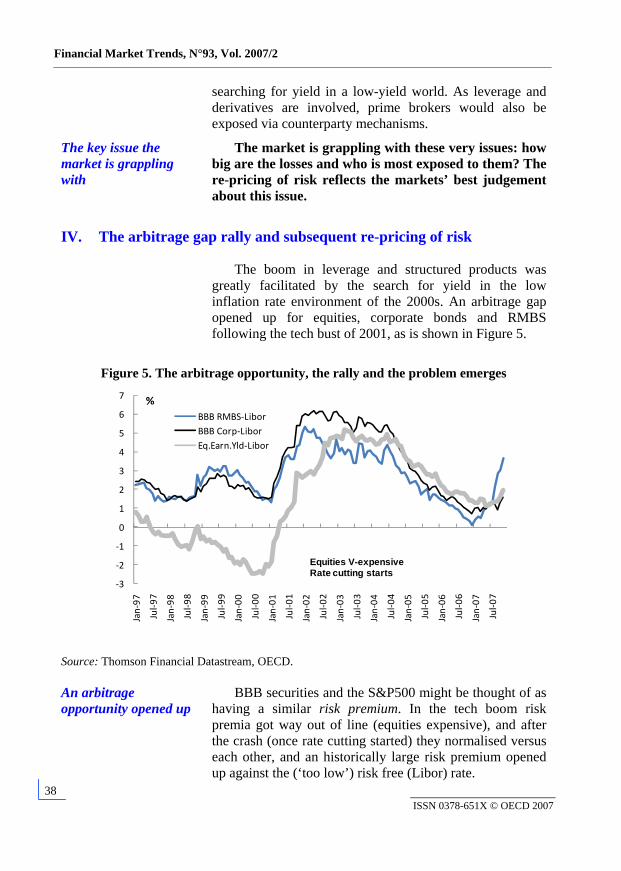
The boom in leverage and structured products was greatly facilitated by the search for yield in the low inflation rate environment of the 2000s. An arbitrage gap opened up for equities, corporate bonds and RMBS following the tech bust of 2001, as is shown in Figure 5.
Figure 5. The arbitrage opportunity, the rally and the problem emerges
‐3
‐2
‐1
0
1
2
3
4
5
6
7
Jan‐97
Jul‐9
7
Jan‐98
Jul‐9
8
Jan‐99
Jul‐9
9
Jan‐00
Jul‐0
0
Jan‐01
Jul‐0
1
Jan‐02
Jul‐0
2
Jan‐03
Jul‐0
3
Jan‐04
Jul‐0
4
Jan‐05
Jul‐0
5
Jan‐06
Jul‐0
6
Jan‐07
Jul‐0
7
BBB RMBS‐LiborBBB Corp‐LiborEq.Earn.Yld‐Libor
%
Equities V-expensiveRate cutting starts
Source: Thomson Financial Datastream, OECD.
An arbitrage opportunity opened up
BBB securities and the S&P500 might be thought of as having a similar risk premium. In the tech boom risk premia got way out of line (equities expensive), and after the crash (once rate cutting started) they normalised versus each other, and an historically large risk premium opened up against the (‘too low’) risk free (Libor) rate.
Structured Products: Implications for Financial Markets
39 ISSN 0378-651X © OECD 2007
Prior to the August 2007 crisis, there was a ‘virtuous circle’ rally, stemming from arbitrage opportunities on ‘too low’ risk-free rates
A virtuous circle boom for those who moved quickly up the risk curve followed:
Low inflation helped by the global supply shock coming out of Asia + low cost of capital + buying assets higher up the risk curve + securities rally yielding quick profits + more investors enter the carry trades; etc. = prolonged spread narrowing.
Just prior to the ‘crisis’ emerging over the summer, all securities became expensive, particularly the RMBS that rallied to (unprecedented) equality with Libor.
Mispriced assets It is interesting to note that after the crisis broke BBB corporate securities were considered ‘safer’ due to sound company profits and balance sheets. They are now way out of line with the quickly re-pricing BBB RMBS, which are experiencing and anticipating rising defaults. Hence a lot of re-rating is under way and more will follow.
Whether corporate securities will remain relatively free of the crisis will depend critically on what happens to the economy.
Bank share prices take a big hit…
Banks and prime brokers are in the front line for bearing a lot of the losses. The Citi share price for example has fallen 26.4% from its June average to the start of November, Merrill Lynch by 31.5%, Morgan Stanley by 29.8%, JP Morgan by 10.9%, Bank of America by 7.7% and mortgage lenders typically by much larger amounts. The market is concerned that banks are exposed directly – for example because they warehouse assets to be subsequently restructured into CDOs and SIVs, and may have to take (impaired) assets back onto their balance sheets (into inventory) as funding dries up for their SIVs. There is also some concern that banks have lent to other groups such as hedge funds to invest in structured products in a levered way.
…as do bond insurers Amongst the other players shown in Figure 4, bond insurers such as MBIA, Radian, AMBAC, PMI group, and MGIC have seen their share prices fall from their peaks of the past year by 50%, 69%, 84%, 72%, and 75%, respectively. A lot of the growth in these companies was due to structured products, and now the market appears to be expecting this to dry up and potential payouts to be
Financial Market Trends, N°93, Vol. 2007/2
40 ISSN 0378-651X © OECD 2007
made. Some of these companies focus almost exclusively on insuring CDO portfolios of AA or better and in one case 95% AAA. Such share price declines must reflect at least some market concern that losses could eat through the unrated buffer of CDOs into these high quality tranches.
The rest of this paper focuses on how reasonable these concerns might be, and what financial market implications we are likely to see as mortgage resets rise and actual losses cumulate. Is it possible to give a dimension to the problem and identify its key characteristics?
V. What is happening now: delinquency, resets and house prices
Delinquencies on the underlying mortgages are rising
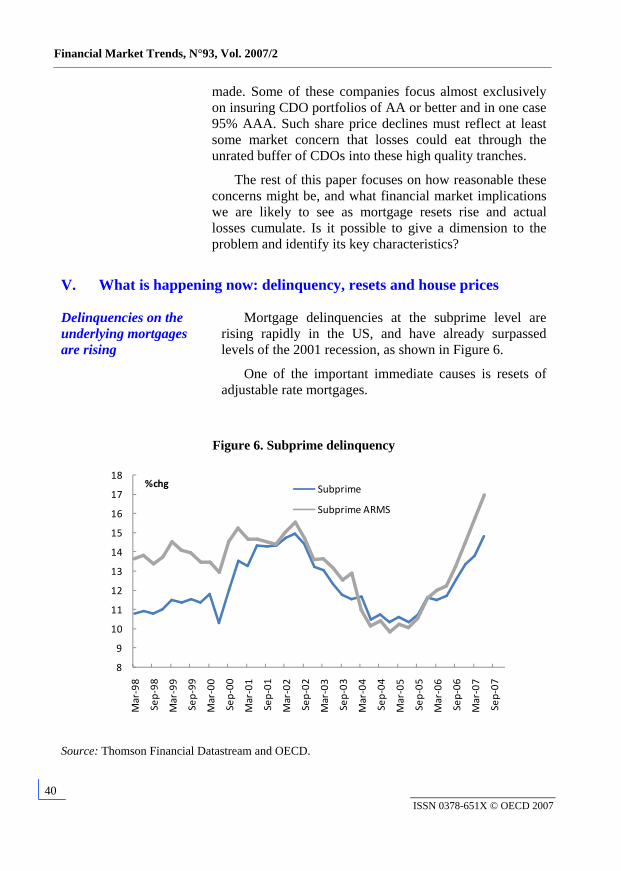
Mortgage delinquencies at the subprime level are rising rapidly in the US, and have already surpassed levels of the 2001 recession, as shown in Figure 6.
One of the important immediate causes is resets of adjustable rate mortgages.
Figure 6. Subprime delinquency
8
9
10
11
12
13
14
15
16
17
18
Mar‐98
Sep‐98
Mar‐99
Sep‐99
Mar‐00
Sep‐00
Mar‐01
Sep‐01
Mar‐02
Sep‐02
Mar‐03
Sep‐03
Mar‐04
Sep‐04
Mar‐05
Sep‐05
Mar‐06
Sep‐06
Mar‐07
Sep‐07
%chg Subprime
Subprime ARMS
Source: Thomson Financial Datastream and OECD.
Structured Products: Implications for Financial Markets
41 ISSN 0378-651X © OECD 2007
Resets on mortgages have not yet peaked…
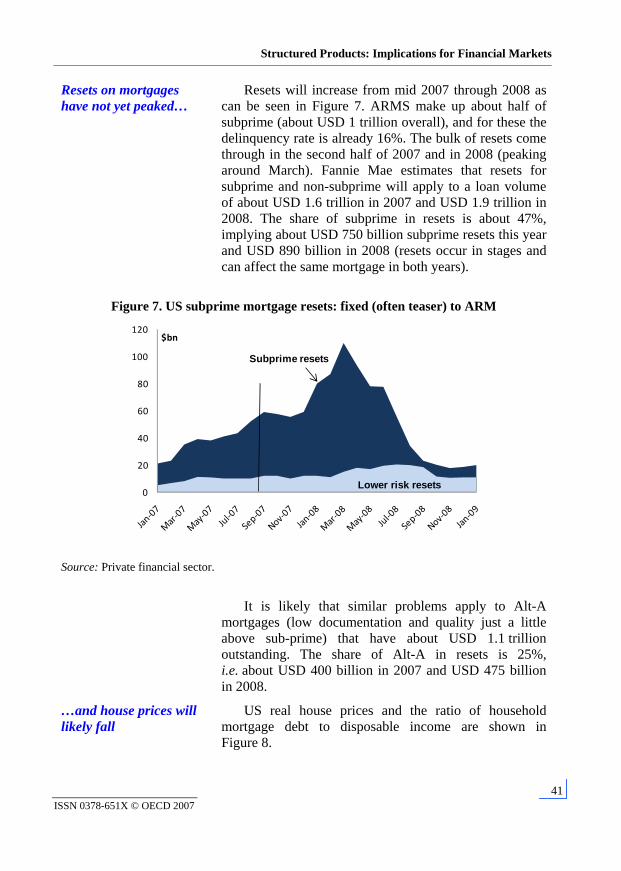
Resets will increase from mid 2007 through 2008 as can be seen in Figure 7. ARMS make up about half of subprime (about USD 1 trillion overall), and for these the delinquency rate is already 16%. The bulk of resets come through in the second half of 2007 and in 2008 (peaking around March). Fannie Mae estimates that resets for subprime and non-subprime will apply to a loan volume of about USD 1.6 trillion in 2007 and USD 1.9 trillion in 2008. The share of subprime in resets is about 47%, implying about USD 750 billion subprime resets this year and USD 890 billion in 2008 (resets occur in stages and can affect the same mortgage in both years).
Figure 7. US subprime mortgage resets: fixed (often teaser) to ARM
0
20
40
60
80
100
120$bn
Lower risk resets
Subprime resets
Source: Private financial sector.
It is likely that similar problems apply to Alt-A mortgages (low documentation and quality just a little above sub-prime) that have about USD 1.1 trillion outstanding. The share of Alt-A in resets is 25%, i.e. about USD 400 billion in 2007 and USD 475 billion in 2008.
…and house prices will likely fall
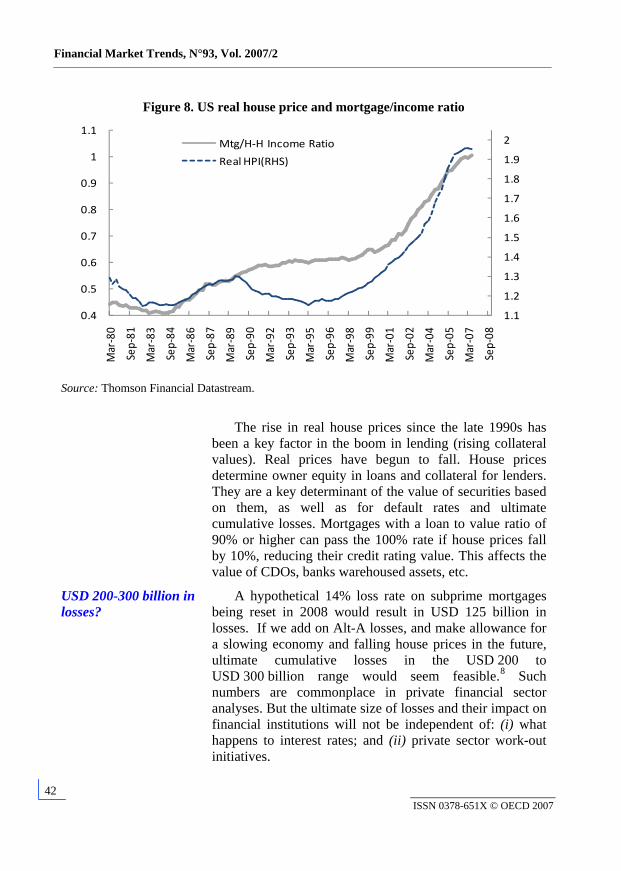
US real house prices and the ratio of household mortgage debt to disposable income are shown in Figure 8.
Financial Market Trends, N°93, Vol. 2007/2
42 ISSN 0378-651X © OECD 2007
Figure 8. US real house price and mortgage/income ratio
1.1
1.2
1.3
1.4
1.5
1.6
1.7
1.8
1.9
2
0.4
0.5
0.6
0.7
0.8
0.9
1
1.1
Mar‐80
Sep‐81
Mar‐83
Sep‐84
Mar‐86
Sep‐87
Mar‐89
Sep‐90
Mar‐92
Sep‐93
Mar‐95
Sep‐96
Mar‐98
Sep‐99
Mar‐01
Sep‐02
Mar‐04
Sep‐05
Mar‐07
Sep‐08
Mtg/H‐H Income Ratio
Real HPI(RHS)
Source: Thomson Financial Datastream.
The rise in real house prices since the late 1990s has been a key factor in the boom in lending (rising collateral values). Real prices have begun to fall. House prices determine owner equity in loans and collateral for lenders. They are a key determinant of the value of securities based on them, as well as for default rates and ultimate cumulative losses. Mortgages with a loan to value ratio of 90% or higher can pass the 100% rate if house prices fall by 10%, reducing their credit rating value. This affects the value of CDOs, banks warehoused assets, etc.
USD 200-300 billion in losses?
A hypothetical 14% loss rate on subprime mortgages being reset in 2008 would result in USD 125 billion in losses. If we add on Alt-A losses, and make allowance for a slowing economy and falling house prices in the future, ultimate cumulative losses in the USD 200 to USD 300 billion range would seem feasible.8 Such numbers are commonplace in private financial sector analyses. But the ultimate size of losses and their impact on financial institutions will not be independent of: (i) what happens to interest rates; and (ii) private sector work-out initiatives.
Structured Products: Implications for Financial Markets
43 ISSN 0378-651X © OECD 2007
So losses will put more pressure on CDOs
As the mortgages at the subprime and Alt-A end suffer increased losses, and as house prices fall, so does the value of securities underpinning structured products. This puts many of the structured products at risk of capital loss, and particularly holdings at the equity and mezzanine end.
There are two quite different problems that the market has to deal with in coping with resets, losses and re-ratings: (i) the initial liquidity pressures due to uncertainty and lack of transparency about the risks; and (ii) the stock adjustment issues associated with assets going bad and balance sheet write offs having to take place. Each is discussed in turn.
VI. Transparency and liquidity
Losses and security valuations are not transparent
Most CDOs do not trade on exchanges and are often held on banks and investors’ books at par or mark-to-model values (see below for some discussion of Level 3 assets under new accounting rule SFAS157). There is a lack of transparency as to who owns what and what losses in a mark-to-market sense might look like. The value of CDO/SIV securities is falling, some via forced selling (fire sales) in order to cover obligations. Lack of disclosure of losses is a problem causing uncertainty for existing and would-be investors and lenders.
The commercial paper and inter-bank markets froze up
This has certainly meant that investors in bank SIVs at the commercial paper end as well as in ABCP conduits have become unwilling to roll their investments or invest in new products, creating inventory pressures and forcing banks to take assets back onto their balance sheets.
Conduits also have credit lines from various banks set up for such contingencies. As these are called on, banks are drawn into loan exposure.
Hence in the early phase of the turmoil, problems began to develop in the interbank market, creating funding pressure for some banks.
So policy makers had to ease liquidity
LIBOR rose sharply in the bidding for liquidity in August. Central banks around the world stepped in: the Fed, ECB, Bank of Japan, Swiss National Bank, Bank of Canada, Norges Bank, Reserve Bank of Australia and the Reserve Bank of New Zealand all injected money into the
Financial Market Trends, N°93, Vol. 2007/2
44 ISSN 0378-651X © OECD 2007
interbank market via repos, etc. or introduced other liquidity enhancing operations. Subsequently the Fed cut the Fed Funds rate by 50 basis points in September and a further 25 points in late October.
This phase appears to have been handled very well. But the broader problem to be worked through over time is the stock adjustment issue of balance sheet restructuring.
VII. Stock adjustment and balance sheet issues
Poorly capitalised institutions with concentrated exposures are always most at risk of failing
In the S&L crisis of the late 1980s the heart of the problem was a group of poorly-capitalised institutions with concentrated risks, i.e. exposed to a non-diversified set of assets that were going ‘bad’ – commercial property for banks and junk bonds and mortgages for S&Ls – with deposit insurance slowing incentives by investors to adjust. Balance sheet adjustment problems emerged that in the end required the Resolution Trust Corporation to play a key part in the work out. It took time.
It is a stock adjustment problem
The essence of the current crisis is similar in an underlying sense. Lags have not had the chance to work through yet, which is why it is so hard to have a sense of the dimension of the problem. Household wealth hit a high in the second quarter, and house prices have neither finished falling nor had their full impact on consumers via the inevitable wealth effects. The new and existing home inventory cycle likewise needs time to work through its indigestion. This stock and price adjustment problem on the real side of the economy will also have its counterpart on the financial side. As noted earlier, we still have not hit the worst point in resets, delinquencies and ultimate losses on mortgages.
Banks both sponsor SIVs and warehouse inventories of assets on their balance sheet. The assets are not actively traded and are valued by bank judgements and with the use of models. Investors’ assets will similarly be dependent on valuations that may or may not be close to market values. Hence asset revaluations, write-offs and restructuring within banks, conduits and their investors, as well as the rebuilding of their capital, is a potentially big task that is going to need time to complete.
Structured Products: Implications for Financial Markets
45 ISSN 0378-651X © OECD 2007
Banks and hedge funds are a key focus
CDO exposure is only a concern where the size is large relative to the institution involved…
Exposure to falling asset values in CDO/SIVs is a problem only where the size of the portfolio is large in the bank, conduit or the CDO/SIV investor. Leverage is important here. Banks and hedge funds are both highly-levered institutions and should therefore be the focus of attention:
…banks and hedge funds are most exposed
• Banks because they play such a key role as intermediaries in the economy, and
• Hedge funds because they borrow from prime brokers, possibly leading to second round influences on banks (other than through banks’ direct holdings).
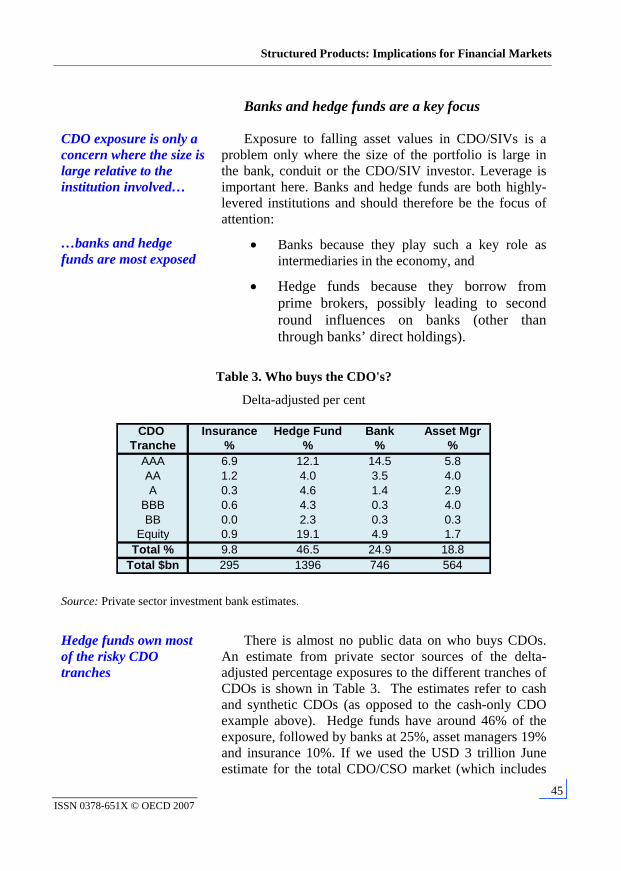
Table 3. Who buys the CDO's?
Delta-adjusted per cent
CDO Insurance Hedge Fund Bank Asset MgrTranche % % % %
AAA 6.9 12.1 14.5 5.8AA 1.2 4.0 3.5 4.0A 0.3 4.6 1.4 2.9
BBB 0.6 4.3 0.3 4.0BB 0.0 2.3 0.3 0.3
Equity 0.9 19.1 4.9 1.7Total % 9.8 46.5 24.9 18.8
Total $bn 295 1396 746 564
Source: Private sector investment bank estimates.
Hedge funds own most of the risky CDO tranches
There is almost no public data on who buys CDOs. An estimate from private sector sources of the delta-adjusted percentage exposures to the different tranches of CDOs is shown in Table 3. The estimates refer to cash and synthetic CDOs (as opposed to the cash-only CDO example above). Hedge funds have around 46% of the exposure, followed by banks at 25%, asset managers 19% and insurance 10%. If we used the USD 3 trillion June estimate for the total CDO/CSO market (which includes
Financial Market Trends, N°93, Vol. 2007/2
46 ISSN 0378-651X © OECD 2007
mortgages, consumer credit, corporate debt etc.), and making the heroic assumption of applying these percent estimates to the whole market, suggests hedge funds would have had USD 1.4 trillion total exposure, followed by banks at USD 750 billion, asset managers at USD 565 billion and insurance at USD 300 billion.
Hedge fund exposure at the high risk tranche end could be in the USD 300-400 billion region
All of the tranches (including AAA) could be affected negatively by revaluations due to underlying mortgage issues if they were traded in open markets. However, if we make the leap of assuming that equity and mezzanine tranches were set at the ‘right’ proportions for a worst case scenario, what might those potential losses be? The BB and equity tranches in holdings of CDOs by hedge funds are about 21% of the total, or USD 630 billion, compared to holdings by banks at about 5% or USD 150 billion. Since mortgage-related assets constitute about 56% of the backing of CDOs, we might scale down these amounts further to 12% (USD 360 billion) for hedge funds and 3% (USD 90 billion) for banks, as a better quantification of the potential size of losses. Allowing for our USD 3 trillion being too high, (lower prices and restructuring of the assets in the past 6 months) the earlier estimate of USD 200-300 billion does not seem unreasonable. As before, however, policy action and other initiatives will affect outcomes.
Prime broker balance sheet pressures: potential instability in the credit supply process
Prime broker exposures
The main exposure channels for prime brokers/banks have already been noted above: conduit ownership and commitments; underwriting risks of getting stuck with warehoused inventory; and credit extended to levered buyers of CDOs. As values of assets are written off, this hurts banks earnings and results in some of the share price losses noted earlier.
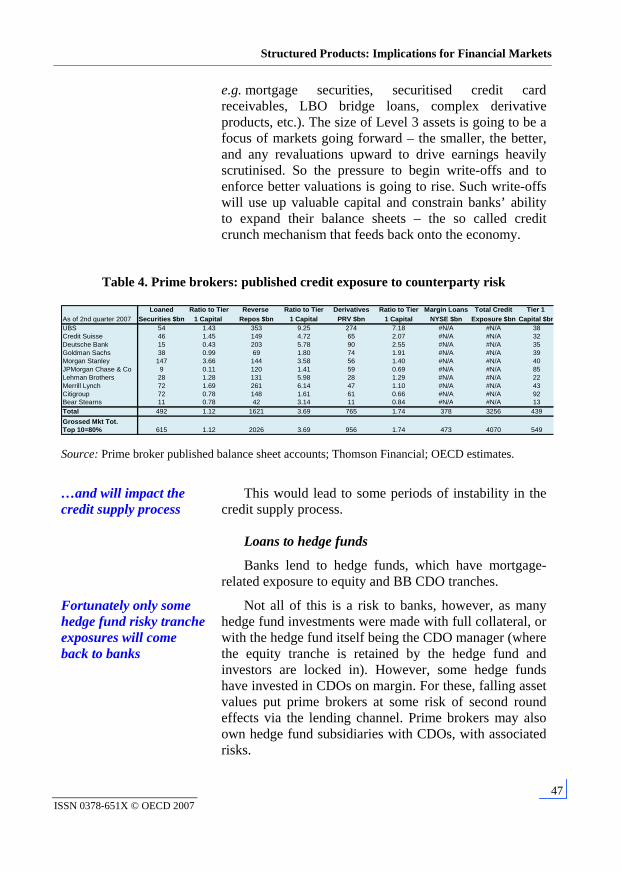
Prime broker Tier 1 capital is around USD 550 billion. But SFAS157 is coming and write downs will follow…
Table 4 shows that Tier 1 capital of major prime brokers is around USD 550 billion. As of the first quarter of next year the new accounting rule SFAS157 is going to require banks to divide assets into 3 levels, according to how they are priced: traded frequently and marked to market (Level 1), partly traded and mark-to-model (Level 2), and mainly judgement by the bank (Level 3,
Structured Products: Implications for Financial Markets
47 ISSN 0378-651X © OECD 2007
e.g. mortgage securities, securitised credit card receivables, LBO bridge loans, complex derivative products, etc.). The size of Level 3 assets is going to be a focus of markets going forward – the smaller, the better, and any revaluations upward to drive earnings heavily scrutinised. So the pressure to begin write-offs and to enforce better valuations is going to rise. Such write-offs will use up valuable capital and constrain banks’ ability to expand their balance sheets – the so called credit crunch mechanism that feeds back onto the economy.
Table 4. Prime brokers: published credit exposure to counterparty risk
Loaned Ratio to Tier Reverse Ratio to Tier Derivatives Ratio to Tier Margin Loans Total Credit Tier 1 As of 2nd quarter 2007 Securities $bn 1 Capital Repos $bn 1 Capital PRV $bn 1 Capital NYSE $bn Exposure $bn Capital $bnUBS 54 1.43 353 9.25 274 7.18 #N/A #N/A 38Credit Suisse 46 1.45 149 4.72 65 2.07 #N/A #N/A 32Deutsche Bank 15 0.43 203 5.78 90 2.55 #N/A #N/A 35Goldman Sachs 38 0.99 69 1.80 74 1.91 #N/A #N/A 39Morgan Stanley 147 3.66 144 3.58 56 1.40 #N/A #N/A 40JPMorgan Chase & Co 9 0.11 120 1.41 59 0.69 #N/A #N/A 85Lehman Brothers 28 1.28 131 5.98 28 1.29 #N/A #N/A 22Merrill Lynch 72 1.69 261 6.14 47 1.10 #N/A #N/A 43Citigroup 72 0.78 148 1.61 61 0.66 #N/A #N/A 92Bear Stearns 11 0.78 42 3.14 11 0.84 #N/A #N/A 13Total 492 1.12 1621 3.69 765 1.74 378 3256 439Grossed Mkt Tot. Top 10=80% 615 1.12 2026 3.69 956 1.74 473 4070 549
Source: Prime broker published balance sheet accounts; Thomson Financial; OECD estimates.
…and will impact the credit supply process
This would lead to some periods of instability in the credit supply process.
Loans to hedge funds
Banks lend to hedge funds, which have mortgage-related exposure to equity and BB CDO tranches.
Fortunately only some hedge fund risky tranche exposures will come back to banks
Not all of this is a risk to banks, however, as many hedge fund investments were made with full collateral, or with the hedge fund itself being the CDO manager (where the equity tranche is retained by the hedge fund and investors are locked in). However, some hedge funds have invested in CDOs on margin. For these, falling asset values put prime brokers at some risk of second round effects via the lending channel. Prime brokers may also own hedge fund subsidiaries with CDOs, with associated risks.
Financial Market Trends, N°93, Vol. 2007/2
48 ISSN 0378-651X © OECD 2007
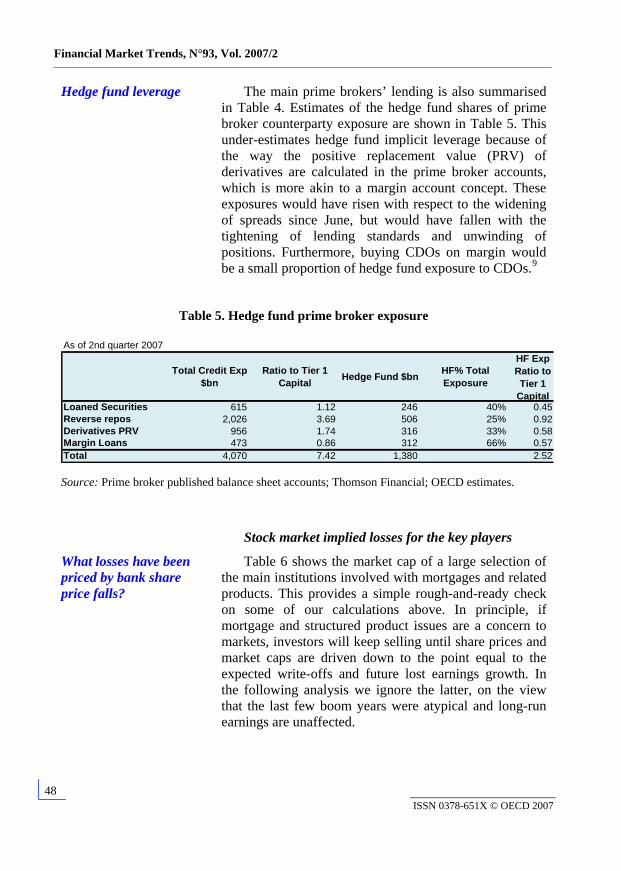
Hedge fund leverage The main prime brokers’ lending is also summarised in Table 4. Estimates of the hedge fund shares of prime broker counterparty exposure are shown in Table 5. This under-estimates hedge fund implicit leverage because of the way the positive replacement value (PRV) of derivatives are calculated in the prime broker accounts, which is more akin to a margin account concept. These exposures would have risen with respect to the widening of spreads since June, but would have fallen with the tightening of lending standards and unwinding of positions. Furthermore, buying CDOs on margin would be a small proportion of hedge fund exposure to CDOs.9
Table 5. Hedge fund prime broker exposure
As of 2nd quarter 2007
Total Credit Exp $bn
Ratio to Tier 1 Capital Hedge Fund $bn HF% Total
Exposure
HF Exp Ratio to Tier 1
CapitalLoaned Securities 615 1.12 246 40% 0.45 Reverse repos 2,026 3.69 506 25% 0.92 Derivatives PRV 956 1.74 316 33% 0.58 Margin Loans 473 0.86 312 66% 0.57 Total 4,070 7.42 1,380 2.52
Source: Prime broker published balance sheet accounts; Thomson Financial; OECD estimates.
Stock market implied losses for the key players
What losses have been priced by bank share price falls?
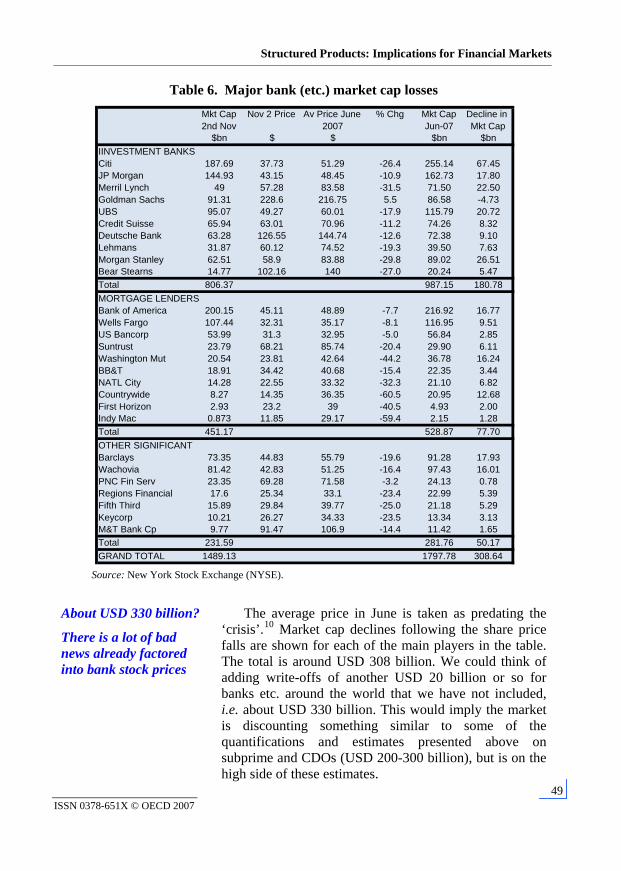
Table 6 shows the market cap of a large selection of the main institutions involved with mortgages and related products. This provides a simple rough-and-ready check on some of our calculations above. In principle, if mortgage and structured product issues are a concern to markets, investors will keep selling until share prices and market caps are driven down to the point equal to the expected write-offs and future lost earnings growth. In the following analysis we ignore the latter, on the view that the last few boom years were atypical and long-run earnings are unaffected.
Structured Products: Implications for Financial Markets
49 ISSN 0378-651X © OECD 2007
Table 6. Major bank (etc.) market cap losses
Source: New York Stock Exchange (NYSE).
About USD 330 billion?
There is a lot of bad news already factored into bank stock prices
The average price in June is taken as predating the ‘crisis’.10 Market cap declines following the share price falls are shown for each of the main players in the table. The total is around USD 308 billion. We could think of adding write-offs of another USD 20 billion or so for banks etc. around the world that we have not included, i.e. about USD 330 billion. This would imply the market is discounting something similar to some of the quantifications and estimates presented above on subprime and CDOs (USD 200-300 billion), but is on the high side of these estimates.
Mkt Cap Nov 2 Price Av Price June % Chg Mkt Cap Decline in 2nd Nov 2007 Jun-07 Mkt Cap
$bn $ $ $bn $bnIINVESTMENT BANKS Citi 187.69 37.73 51.29 -26.4 255.14 67.45JP Morgan 144.93 43.15 48.45 -10.9 162.73 17.80Merril Lynch 49 57.28 83.58 -31.5 71.50 22.50Goldman Sachs 91.31 228.6 216.75 5.5 86.58 -4.73 UBS 95.07 49.27 60.01 -17.9 115.79 20.72Credit Suisse 65.94 63.01 70.96 -11.2 74.26 8.32 Deutsche Bank 63.28 126.55 144.74 -12.6 72.38 9.10 Lehmans 31.87 60.12 74.52 -19.3 39.50 7.63 Morgan Stanley 62.51 58.9 83.88 -29.8 89.02 26.51Bear Stearns 14.77 102.16 140 -27.0 20.24 5.47 Total 806.37 987.15 180.78MORTGAGE LENDERSBank of America 200.15 45.11 48.89 -7.7 216.92 16.77Wells Fargo 107.44 32.31 35.17 -8.1 116.95 9.51 US Bancorp 53.99 31.3 32.95 -5.0 56.84 2.85 Suntrust 23.79 68.21 85.74 -20.4 29.90 6.11 Washington Mut 20.54 23.81 42.64 -44.2 36.78 16.24BB&T 18.91 34.42 40.68 -15.4 22.35 3.44 NATL City 14.28 22.55 33.32 -32.3 21.10 6.82 Countrywide 8.27 14.35 36.35 -60.5 20.95 12.68First Horizon 2.93 23.2 39 -40.5 4.93 2.00 Indy Mac 0.873 11.85 29.17 -59.4 2.15 1.28 Total 451.17 528.87 77.70OTHER SIGNIFICANT Barclays 73.35 44.83 55.79 -19.6 91.28 17.93Wachovia 81.42 42.83 51.25 -16.4 97.43 16.01PNC Fin Serv 23.35 69.28 71.58 -3.2 24.13 0.78 Regions Financial 17.6 25.34 33.1 -23.4 22.99 5.39 Fifth Third 15.89 29.84 39.77 -25.0 21.18 5.29 Keycorp 10.21 26.27 34.33 -23.5 13.34 3.13 M&T Bank Cp 9.77 91.47 106.9 -14.4 11.42 1.65 Total 231.59 281.76 50.17GRAND TOTAL 1489.13 1797.78 308.64
Financial Market Trends, N°93, Vol. 2007/2
50 ISSN 0378-651X © OECD 2007
It would also seem to imply that an implausibly big part of the hedge fund exposure to the risky part of CDO tranches would come back to banks in the form of loan losses, etc. In this latter context it is worth recalling hedge fund exposure to these assets bought on margin is much less than the total.
This means either that the equity market now risks overshooting on the downside, and should begin to stabilise and bounce; or that the quantification of losses etc. referred to above is less than what is likely to happen – either because of subprime and Alt-A losses being larger, or because other assets like credit card receivables and corporate debt will deteriorate somewhat more as the economic slowdown unfolds.
At this stage, however, it is safe to say that equity markets are factoring in a lot of bad news as it concerns mortgage turmoil, and that this is certainly on the high side of that implied by the other information presented in the paper. Provided the feedback effects of credit supply on the economy do not cause it to slow too much, credit card issues (which depend on interest rates and holding your job) and corporate bonds (which depend on rates and earnings) should be manageable.
Credit supply constrained by write-offs and the need for time
The key issue is potential instability in the credit supply process
The main message is that write offs of these magnitudes (factored into equity prices) will constrain the ability of prime brokers and banks to expand their balance sheets, with potential impacts on the economy. It is this process that needs to be managed by policy makers and the private sector. It is the potential instability in the credit supply process that is the key issue.
The working out of these sorts of problems requires time. In this respect the so called MLEC (Master Liquidity Enhancement Conduit) proposed by Citi, JP Morgan and Bank of America is an interesting idea for providing adjustment time. The following box examines the general idea of such a scheme, without knowing any of the details of the MLEC proposal itself.
Structured Products: Implications for Financial Markets
51 ISSN 0378-651X © OECD 2007
Box 1. The general idea of a super SIV can help to provide time
There has been some discussion by a consortium of a few banks to create a super SIV to deal with the CDO/SIV problems. No details are available at the time of writing. It is quite an interesting idea, however, in the context of our discussion on the importance of time. Let us consider this as a general idea where a large sum of money is put together from bank capital and/or by offering investments to the market (other institutions) more generally (which would provide some discipline on pricing) to buy residential mortgage-backed securities from SIVs, assuming no new production of them. Let’s also assume that the SIVs from which assets will be purchased include those of the consortium and of other banks.
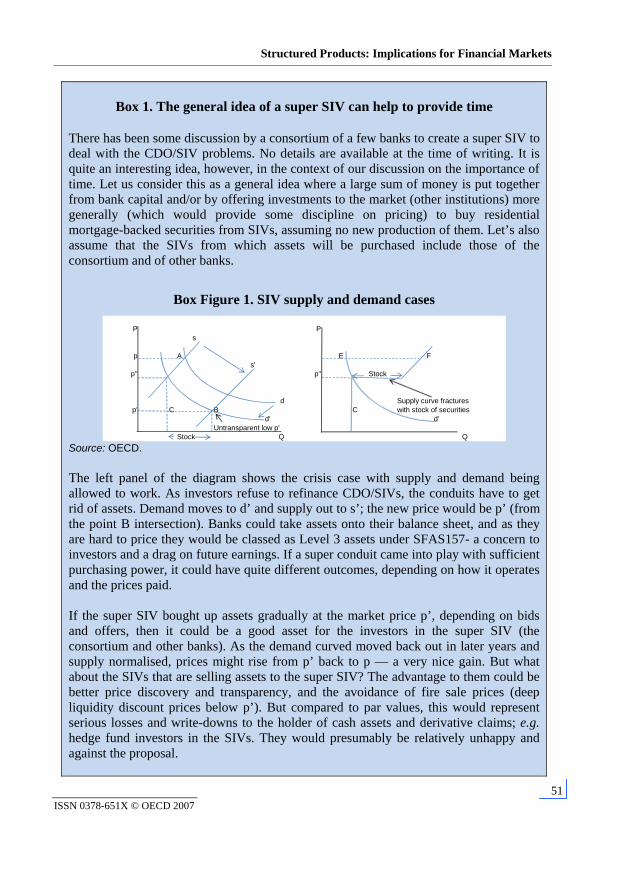
Box Figure 1. SIV supply and demand cases
P Ps
p A E Fs'
p'' p" Stock
d Supply curve fractures p' C B C with stock of securities
d' d'Untransparent low p'
Stock Q Q Source: OECD.
The left panel of the diagram shows the crisis case with supply and demand being allowed to work. As investors refuse to refinance CDO/SIVs, the conduits have to get rid of assets. Demand moves to d’ and supply out to s’; the new price would be p’ (from the point B intersection). Banks could take assets onto their balance sheet, and as they are hard to price they would be classed as Level 3 assets under SFAS157- a concern to investors and a drag on future earnings. If a super conduit came into play with sufficient purchasing power, it could have quite different outcomes, depending on how it operates and the prices paid. If the super SIV bought up assets gradually at the market price p’, depending on bids and offers, then it could be a good asset for the investors in the super SIV (the consortium and other banks). As the demand curved moved back out in later years and supply normalised, prices might rise from p’ back to p — a very nice gain. But what about the SIVs that are selling assets to the super SIV? The advantage to them could be better price discovery and transparency, and the avoidance of fire sale prices (deep liquidity discount prices below p’). But compared to par values, this would represent serious losses and write-downs to the holder of cash assets and derivative claims; e.g. hedge fund investors in the SIVs. They would presumably be relatively unhappy and against the proposal.
Financial Market Trends, N°93, Vol. 2007/2
52 ISSN 0378-651X © OECD 2007
Now suppose the super SIV had sufficient capital and bought all assets on offer at a fixed (inflated) price at say p”. The super SIV would have to buy BC in the diagram in all SIV-type assets to stabilise the price at p’’. Buffering the price in this way would fracture the supply curve at p”, as shown in the right hand panel of the diagram. The stock of assets bought in the buffering process would result in a horizontal part of the supply curve at p”. At any price above p” the gap (EF) between supply and demand would be very large. There would be no secondary market in this situation, and liquidity would not be improved. The super SIV would have to hold the assets for a long time to make a profit. The universe of SIVs selling to the super SIV would presumably be happier if terms and conditions were the same for everyone. But setting the super SIV up in this way would entail difficult negotiation problems in implementation. For example, it would be advantageous to the originators to focus on buying up lower quality SIV assets that they themselves were committed to (their own SIV conduits), and thereby helping out their own hedge fund and other clients, while avoiding taking these assets onto their own bank balance sheet. For smaller banks selling to the super conduit, since there is no proper market price mechanism, they would risk having to accept terms and conditions given to them that could entail selling relatively better quality assets for the same price. This hazard might arise, for example, if the originators wanted to maximise the future profitability of the super SIV subject to improving the position of their own SIVs relative to those of other banks in the market place. This is clearly a question of detail and negotiation, and the role of an independent arbiter in the process could help here. But the super SIV idea clearly does provide a mechanism that gives ‘time’ for all the stock adjustment prices to work through. Time, as this paper has stressed, is the key to solving the turmoil.
Source : OECD.
VII. Structured products turmoil is not just a US problem
Other countries are involved by exposure to US assets and mismatches in their own institutions…
While underlying sub-prime mortgages are mainly a US problem, the assets based on them is not. RMBS and other ABS have been sold to overseas structured product conduits, particularly in Europe and Asia — US authorities believe that about 30% or so has flowed overseas. The products issued by these institutions have been sold domestically and in international markets, with funds swapped back into domestic currency. Cross-border flows are huge, creating ‘knock-on’ effects between different national markets.
…retail structured products…
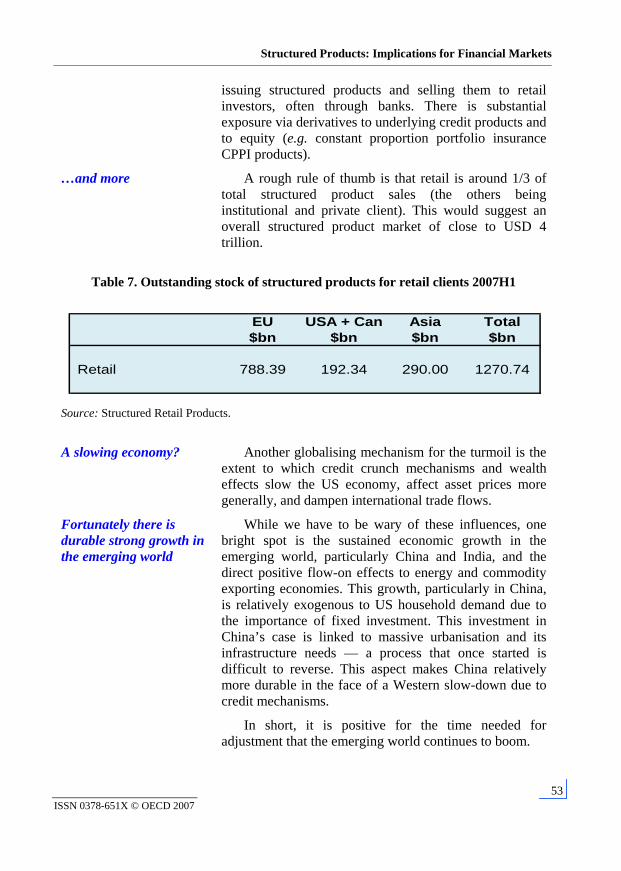
Table 7 shows data on all structured products sold at the retail level. These include both CDOs and equity-based products. Europe has been at the forefront of
Structured Products: Implications for Financial Markets
53 ISSN 0378-651X © OECD 2007
issuing structured products and selling them to retail investors, often through banks. There is substantial exposure via derivatives to underlying credit products and to equity (e.g. constant proportion portfolio insurance CPPI products).
…and more A rough rule of thumb is that retail is around 1/3 of total structured product sales (the others being institutional and private client). This would suggest an overall structured product market of close to USD 4 trillion.
Table 7. Outstanding stock of structured products for retail clients 2007H1
EU USA + Can Asia Total$bn $bn $bn $bn
Retail 788.39 192.34 290.00 1270.74
Source: Structured Retail Products.
A slowing economy?
Another globalising mechanism for the turmoil is the extent to which credit crunch mechanisms and wealth effects slow the US economy, affect asset prices more generally, and dampen international trade flows.
Fortunately there is durable strong growth in the emerging world
While we have to be wary of these influences, one bright spot is the sustained economic growth in the emerging world, particularly China and India, and the direct positive flow-on effects to energy and commodity exporting economies. This growth, particularly in China, is relatively exogenous to US household demand due to the importance of fixed investment. This investment in China’s case is linked to massive urbanisation and its infrastructure needs — a process that once started is difficult to reverse. This aspect makes China relatively more durable in the face of a Western slow-down due to credit mechanisms.
In short, it is positive for the time needed for adjustment that the emerging world continues to boom.
Financial Market Trends, N°93, Vol. 2007/2
54 ISSN 0378-651X © OECD 2007
IX. “Time” is the key to achieving a successful work-out of current problems
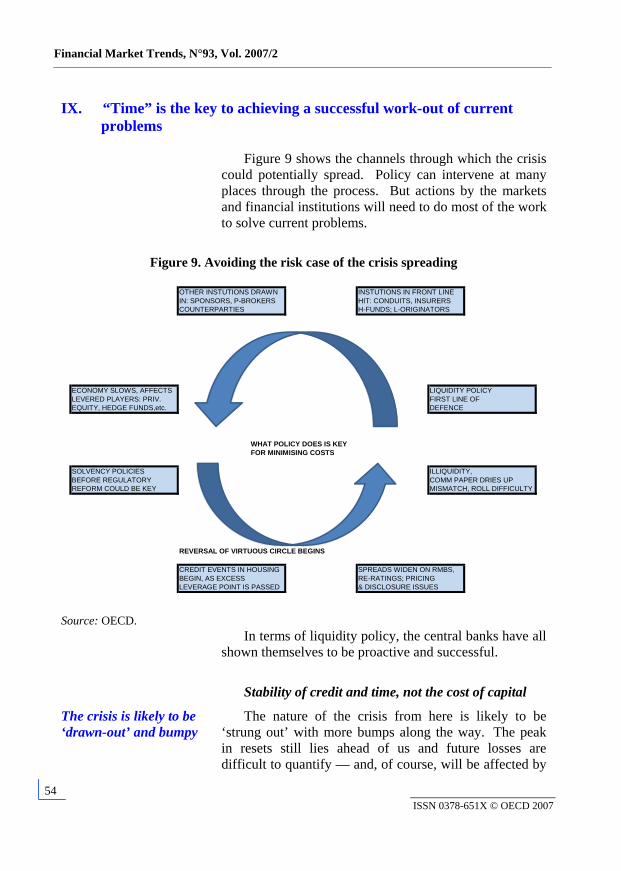
Figure 9 shows the channels through which the crisis could potentially spread. Policy can intervene at many places through the process. But actions by the markets and financial institutions will need to do most of the work to solve current problems.
Figure 9. Avoiding the risk case of the crisis spreading
OTHER INSTUTIONS DRAWN INSTUTIONS IN FRONT LINEIN: SPONSORS, P-BROKERS HIT: CONDUITS, INSURERSCOUNTERPARTIES H-FUNDS; L-ORIGINATORS
ECONOMY SLOWS, AFFECTS LIQUIDITY POLICYLEVERED PLAYERS: PRIV. FIRST LINE OFEQUITY, HEDGE FUNDS,etc. DEFENCE
WHAT POLICY DOES IS KEYFOR MINIMISING COSTS
SOLVENCY POLICIES ILLIQUIDITY, BEFORE REGULATORY COMM PAPER DRIES UPREFORM COULD BE KEY MISMATCH, ROLL DIFFICULTY
REVERSAL OF VIRTUOUS CIRCLE BEGINS
CREDIT EVENTS IN HOUSING SPREADS WIDEN ON RMBS,BEGIN, AS EXCESS RE-RATINGS; PRICINGLEVERAGE POINT IS PASSED & DISCLOSURE ISSUES
Source: OECD. In terms of liquidity policy, the central banks have all
shown themselves to be proactive and successful.
Stability of credit and time, not the cost of capital
The crisis is likely to be ‘drawn-out’ and bumpy
The nature of the crisis from here is likely to be ‘strung out’ with more bumps along the way. The peak in resets still lies ahead of us and future losses are difficult to quantify — and, of course, will be affected by
Structured Products: Implications for Financial Markets
55 ISSN 0378-651X © OECD 2007
other policy measures. Financial sector risks flowing from uncertain future losses, therefore, are also difficult to assess.
Time is more important than the cost of capital
The financial sector work-out needs time, so does the new/existing home inventory cycle. Time is more important than cost of capital. The cost of capital is not high. It is the potential instability of the supply of credit (as bumps occur) that poses the greater risk looking forward, and this will stabilise with time, albeit at a somewhat higher price.
Restructuring and re-absorption of assets into large institutions could play a role in the workout
The restructuring of balance sheets is primarily a private sector issue. Problems will be resolved as sound financial institutions buy up weaker ones or parcels of their assets, at a discount, and restructure them for future profit. The main benefit of super SIV type mechanisms is that they could, if handled properly, provide valuable time for adjustment to occur in a more orderly way.
The optimum balance of funding and lending is critical
Credit rating agencies will downgrade banks whose funding strategy is not sufficiently based on deposits. This will raise their cost of funding and make them less sustainable. All financial institutions need to discover the optimum balance of short-term, long-term and deposit funding for their balance sheet of loans, securities and structured products.
This restructuring process will strengthen the financial system and also encourage better lending practices. While some regulatory forbearance may be required along the way, policy changes already under way in some countries can help further to improve the working of the financial system (transparency, predatory lending rules, credit rating processes, clarifying ‘arms-length’ relationships, etc.).
X. Financial market implications of recent developments
Balance sheet adjustment
The main focus thus far has been the potential for instability in the credit supply process and the re-pricing of assets and market caps of institutions exposed to the risks in subprime and CDO mechanisms. This involves the share prices of institutions like banks and bond insurers. The paper argued that this would be a drawn out
Financial Market Trends, N°93, Vol. 2007/2
56 ISSN 0378-651X © OECD 2007
process, and that write-offs will constrain balance sheets periodically, particularly with the coming of the new accounting rule SFAS157. This rule will require banks to be clearer about their exposure to Level 3 assets and their role in bank earnings reports going forward.
The US dollar
Another potential financial market development concerns the US dollar. The Fed has cut rates, and US growth is likely to slow. This would, in normal circumstances, see some downward pressure on the USD. But these pressures could be exacerbated by the subprime fallout itself. A large amount of the structured products based on subprime have been bought by ‘keen’ foreign investors - often from Europe. These private flows have helped fund the US current account deficit. As these flows dry up, because investors are unwilling to buy the higher yielding debt, the USD could continue to have a downward bias (or be more reliant on official financing).
The rising cost of capital
Another fall-out from the subprime and structured products crisis is that risks will continue to be re-priced, and the cost of capital should ultimately rise for riskier borrowers. The supply of high grade debt has shrunk, so it should perform well, while the supply of high yield debt has soared, so it should continue to perform poorly. Spreads will need to widen further. This will feed back onto the economy along with balance sheets factors discussed above.
Corporate debt
Corporate debt has been less affected so far. But LBO volumes slowed over the summer, and there is a backlog to clear. Once this happens, volumes should pick up again, but spreads will be firmer than before. The main risk here is that the economy slows more than expected, and completed LBO deals have more difficulty in servicing higher debt levels.
Equities Finally, slower growth could lead to periodic volatility in equity markets, and structured products based upon them.
Structured Products: Implications for Financial Markets
57 ISSN 0378-651X © OECD 2007
Notes
1. The April annualised estimate will differ from the full 2007 outcome; this is because issuance of structured credit has slowed.
2. Leveraged loans are typically BB or worse – highly leveraged loans are considered less creditworthy than these, e.g. 500bp over Libor.
3. In the US they are drawn into this as ABCP is exempt from registration of the Securities Act of 1933.
4. The example here is a cash CDO (about 31% of total), but others include synthetic CDOs (an SPV without the assets, gaining exposure with swaps – about 45% of total), CLOs (collateralised loan obligations) and others (about 23%).
5. Theory of pooling and credit enhancement insurance plays a role in rating CDOs.
6. StandardPoors.com, specifically for sub-prime mortgages originated in 2005Q4 to 2006Q4. As resets are expected to get worse, we assume a 14% rate in the example below.
7. All of the other assets in a typical CDO are ignored for simplicity—the focus thus far being on mortgage turmoil. The ratings shown are averages of a number of rating levels.
8. S&P are estimating an 11-14% cumulative loss for 2005Q4-2006Q4 on subprime, as referred to above. Ultimate losses take a long time to come through. There is delinquency recognition, discussion, default, foreclosure, and it all takes time.
9. See A. Blundell-Wignall, “An Overview of Hedge Funds and Structured Products: Issues in Leverage and Risk”, Financial Market Trends, Vol. 2007/1 (no.92).
10. In its April 2007 Global Financial Stability Report the IMF wrote with respect to mortgage related securities that “major dislocation still appears to be a low-probability event” (p.10), consistent with us taking June as the start point. The start point is important. Using December 2006 would make the numbers bigger. The Citi share price in December, for example, was USD 55.7, not our USD 51.29.