Embed Size (px)
Citation preview
DDDDDDDDrrrrrrrruuuuuuuugggggggg UUUUUUUUsssssssseeeeeeee aaaaaaaannnnnnnnddddddddRRRRRRRReeeeeeeellllllllaaaaaaaatttttttteeeeeeeedddddddd MMMMMMMMaaaaaaaatttttttttttttttteeeeeeeerrrrrrrrssssssssAAAAAAAAmmmmmmmmoooooooonnnnnnnngggggggg AAAAAAAAdddddddduuuuuuuullllllllttttttttAAAAAAAArrrrrrrrrrrrrrrreeeeeeeesssssssstttttttteeeeeeeeeeeeeeeessssssss,,,,,,,, 22222222000000000000000011111111
OOvveerrvviieeww
The Arrestee Drug Abuse Monitoring program (ADAM) measures the extent of drug usein the high-risk population of people who have been arrested and booked. The data arecollected in participating counties through probability-based sampling of adult malearrestees and purposive sampling of adult female arrestees. Information comes frominterviews and urinalyses obtained voluntarily and recorded confidentially in bookingfacilities, usually on the day of arrest and always within 48 hours of arrest.
As part of this process, research teams in the participating counties interview arrestees ineach facility during one- to three-week periods in each quarter of the year. Interviewerscollect demographic data and ask arrestees about what drugs they use, how often they usethem, and how and where they purchase illicit drugs. Other questions ask about housingsituation during the past year, method of support, and health insurance. After theinterview, each respondent is asked to provide a urine sample, which is analyzed to detectdrug use.
This tabular booklet presents findings from 33 ADAM sites that collected data in 2001.Each table is organized by site location and indicates the percentage of adult arresteeswho qualified for the variable. The same series of 16 tables is presented for men in allsites, and for women in sites in which at least 25 interviews were completed with adultfemale arrestees. These tables were prepared by NORC at the University of Chicago—the ADAM national contractor. An overview of the tables is presented below:
• Table 1 arrays the ADAM sites by their geographic location, number of bookingfacilities, and number of interviews completed in each quarter.
• Table 2 provides demographic data about ADAM interviewees.
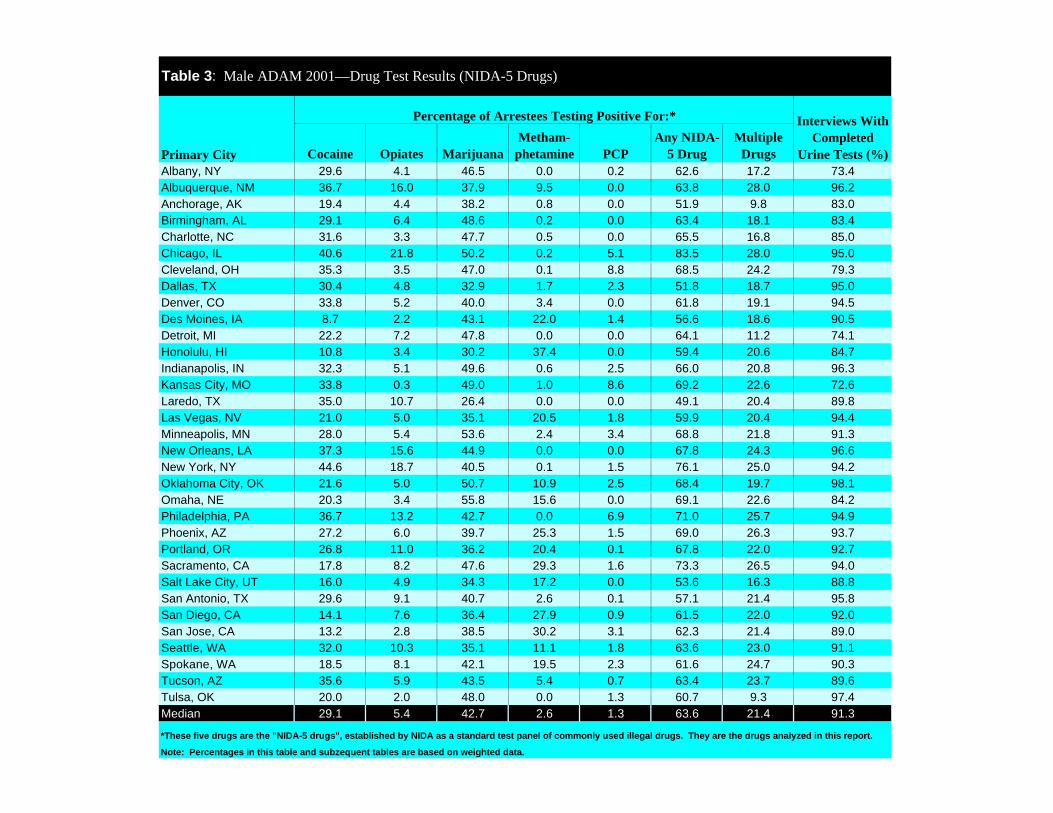
• In Table 3, we display the percentage of arrestees who tested positive for the mostcommonly reported drugs.
• Tables 4 through 8 indicate the frequency that arrestees reported using selecteddrugs over the prior year.
• In Tables 9 and 10, we show rates of arrestee heavy drinking and drug use andtheir risk for dependence, as determined by a clinically based dependency screen.
• Tables 11 through 14 detail arrestees’ drug market participation, including failedattempts to purchase drugs.
• Finally, Tables 15 and 16 display the proportion of arrestees who reportedreceiving drug treatment and having health insurance in the prior year.

MMaallee AArrrreesstteeee TTaabblleess
Description of SampleDescription of SampleDescription of SampleDescription of Sample
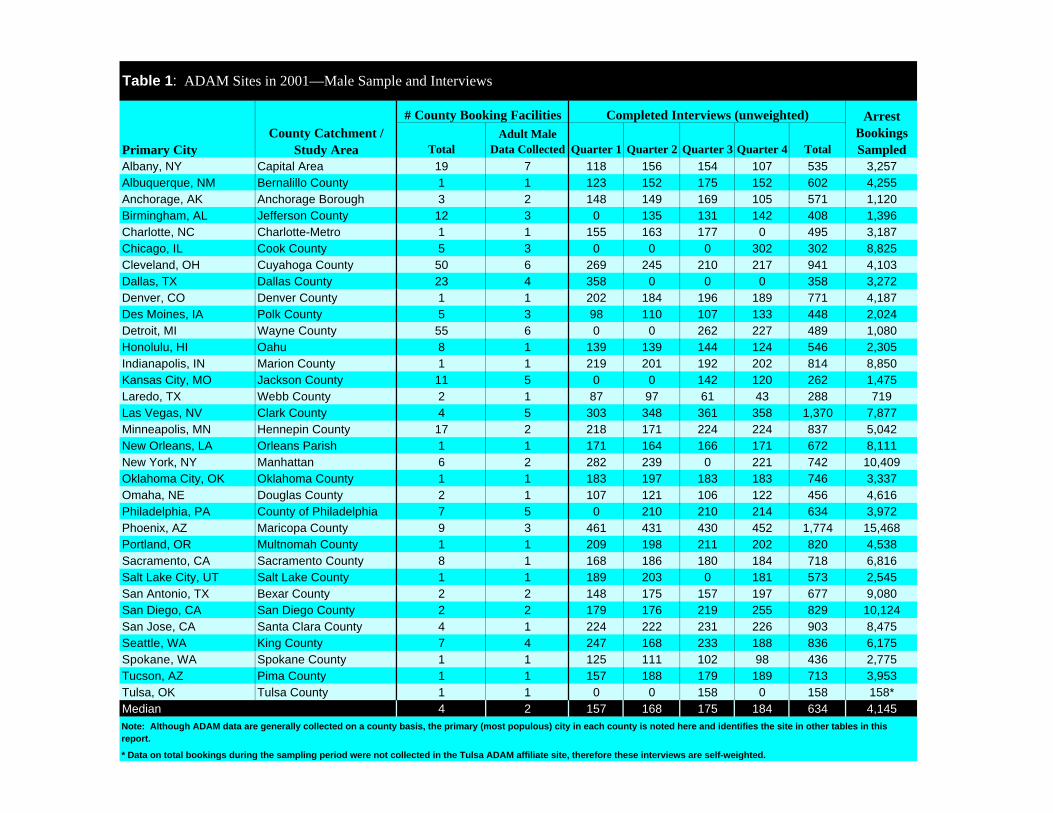
Table 1. ADAM Sites in 2001—Male Sample and Interviews
Table 2. Demographic Characteristics of Male ADAM 2001 Respondents
Drug Test ResultsDrug Test ResultsDrug Test ResultsDrug Test Results
Table 3. Male ADAM 2001—Drug Test Results (NIDA-5 Drugs)
Drug Use Self-ReportsDrug Use Self-ReportsDrug Use Self-ReportsDrug Use Self-Reports
Table 4. Male ADAM 2001—Crack Cocaine Use
Table 5. Male ADAM 2001—Powder Cocaine Use
Table 6. Male ADAM 2001—Marijuana Use
Table 7. Male ADAM 2001—Methamphetamine Use
Table 8. Male ADAM 2001—Opiate Use
Table 9. Male ADAM 2001—Heavy Drug Use and Risk for Dependence
Table 10. Male ADAM 2001—Heavy Alcohol Use and Risk for Dependence
Drug Market BehaviorDrug Market BehaviorDrug Market BehaviorDrug Market Behavior
Table 11. Male ADAM 2001—Drug Acquisition in the Past 30 Days
Table 12. Male ADAM 2001—Last Drug Buy Was Outdoors
Table 13. Male ADAM 2001—Any Failed Drug Purchase in the Past 30 Days
Table 14. Male ADAM 2001—Failed Drug Purchases Due to Police Activity
Treatment & InsuranceTreatment & InsuranceTreatment & InsuranceTreatment & Insurance
Table 15. Male ADAM 2001—Drug Treatment Status
Table 16. Male ADAM 2001—Health Insurance Status
TotalAdult Male
Data Collected Quarter 1 Quarter 2 Quarter 3 Quarter 4 TotalAlbany, NY Capital Area 19 7 118 156 154 107 535 3,257Albuquerque, NM Bernalillo County 1 1 123 152 175 152 602 4,255Anchorage, AK Anchorage Borough 3 2 148 149 169 105 571 1,120Birmingham, AL Jefferson County 12 3 0 135 131 142 408 1,396Charlotte, NC Charlotte-Metro 1 1 155 163 177 0 495 3,187Chicago, IL Cook County 5 3 0 0 0 302 302 8,825Cleveland, OH Cuyahoga County 50 6 269 245 210 217 941 4,103Dallas, TX Dallas County 23 4 358 0 0 0 358 3,272Denver, CO Denver County 1 1 202 184 196 189 771 4,187Des Moines, IA Polk County 5 3 98 110 107 133 448 2,024Detroit, MI Wayne County 55 6 0 0 262 227 489 1,080Honolulu, HI Oahu 8 1 139 139 144 124 546 2,305Indianapolis, IN Marion County 1 1 219 201 192 202 814 8,850Kansas City, MO Jackson County 11 5 0 0 142 120 262 1,475Laredo, TX Webb County 2 1 87 97 61 43 288 719Las Vegas, NV Clark County 4 5 303 348 361 358 1,370 7,877Minneapolis, MN Hennepin County 17 2 218 171 224 224 837 5,042New Orleans, LA Orleans Parish 1 1 171 164 166 171 672 8,111New York, NY Manhattan 6 2 282 239 0 221 742 10,409Oklahoma City, OK Oklahoma County 1 1 183 197 183 183 746 3,337Omaha, NE Douglas County 2 1 107 121 106 122 456 4,616Philadelphia, PA County of Philadelphia 7 5 0 210 210 214 634 3,972Phoenix, AZ Maricopa County 9 3 461 431 430 452 1,774 15,468Portland, OR Multnomah County 1 1 209 198 211 202 820 4,538Sacramento, CA Sacramento County 8 1 168 186 180 184 718 6,816Salt Lake City, UT Salt Lake County 1 1 189 203 0 181 573 2,545San Antonio, TX Bexar County 2 2 148 175 157 197 677 9,080San Diego, CA San Diego County 2 2 179 176 219 255 829 10,124San Jose, CA Santa Clara County 4 1 224 222 231 226 903 8,475Seattle, WA King County 7 4 247 168 233 188 836 6,175Spokane, WA Spokane County 1 1 125 111 102 98 436 2,775Tucson, AZ Pima County 1 1 157 188 179 189 713 3,953Tulsa, OK Tulsa County 1 1 0 0 158 0 158 158*Median 4 2 157 168 175 184 634 4,145Note: Although ADAM data are generally collected on a county basis, the primary (most populous) city in each county is noted here and identifies the site in other tables in this report.
* Data on total bookings during the sampling period were not collected in the Tulsa ADAM affiliate site, therefore these interviews are self-weighted.
Table 1: ADAM Sites in 2001—Male Sample and Interviews
# County Booking Facilities Arrest Bookings SampledPrimary City
County Catchment / Study Area
Completed Interviews (unweighted)

15–20 21–25 26–30 31–35 36+ White Black Hispanic OtherAlbany, NY 16.6 20.6 13.0 16.5 33.4 31.3 50.5 43.2 3.9 2.4 64.1 71.5 90.7Albuquerque, NM 10.5 20.8 14.5 17.9 36.3 32.9 23.6 8.7 55.6 12.1 66.1 76.2 81.7Anchorage, AK 12.2 19.6 14.7 12.1 41.4 32.9 50.8 13.9 4.1 31.2 52.2 82.3 77.2Birmingham, AL 17.6 21.7 14.9 9.2 36.7 32.1 19.4 79.5 0.4 0.8 65.4 70.9 92.0Charlotte, NC 21.5 22.5 17.0 12.3 26.6 29.3 26.0 64.9 8.7 0.4 68.8 64.6 85.2Chicago, IL 26.3 19.8 13.8 13.3 26.7 29.4 6.5 85.7 0.8 7.0 55.4 49.8 97.6Cleveland, OH 16.2 23.3 15.4 10.8 34.3 31.1 18.8 78.5 2.3 0.4 58.8 66.4 89.8Dallas, TX 17.7 23.3 17.8 16.1 25.2 30.2 32.5 51.5 15.6 0.4 69.3 76.5 90.6Denver, CO 13.6 20.6 11.8 15.8 38.2 32.4 28.0 24.6 43.3 4.1 61.4 63.4 75.0Des Moines, IA 17.7 22.3 13.6 15.8 30.5 30.4 74.5 17.2 6.6 1.6 56.2 74.2 88.7Detroit, MI 22.0 21.1 13.2 16.1 27.6 30.1 26.8 69.8 0.9 2.5 58.8 68.7 92.2Honolulu, HI 11.9 19.6 15.5 14.4 38.8 32.9 22.5 7.8 2.7 67.0 49.4 81.1 75.4Indianapolis, IN 15.3 21.3 16.8 14.5 32.1 31.1 43.2 55.7 1.0 0.1 70.6 65.7 93.6Kansas City, MO 24.5 17.0 14.4 15.6 28.5 29.8 38.2 59.1 2.5 0.3 60.9 60.1 87.6Laredo, TX 25.5 20.7 19.1 15.1 19.6 28.7 19.5 0.4 80.1 0.0 66.6 50.7 96.8Las Vegas, NV 11.3 20.3 12.8 14.7 40.9 33.1 55.5 27.3 13.9 3.3 64.6 76.5 84.5Minneapolis, MN 17.6 22.3 13.8 14.7 31.7 30.6 34.4 59.7 0.3 5.6 57.8 77.8 86.7New Orleans, LA 20.0 22.2 17.4 8.5 31.9 30.5 14.7 85.0 0.0 0.3 60.7 54.5 90.0New York, NY 13.3 16.7 10.4 16.2 43.4 33.1 9.5 60.9 28.1 1.4 45.7 59.2 82.7Oklahoma City, OK 16.1 17.9 16.1 12.4 37.6 32.4 50.0 39.0 5.5 5.5 69.6 72.8 89.6Omaha, NE 13.8 19.4 17.1 14.7 35.0 31.9 51.7 44.6 2.6 1.0 69.8 80.1 90.6Philadelphia, PA 16.8 20.1 14.7 12.7 35.7 31.6 26.5 72.3 0.1 1.0 49.5 69.9 92.0Phoenix, AZ 16.6 20.7 16.2 16.4 30.0 30.7 51.8 12.7 28.4 7.0 66.0 66.8 86.6Portland, OR 9.2 19.1 15.6 17.6 38.5 33.1 63.9 25.0 8.4 2.7 41.6 77.3 75.9Sacramento, CA 16.9 20.8 14.5 11.6 36.2 31.7 44.7 36.2 14.5 4.5 55.1 73.9 82.1Salt Lake City, UT 13.9 23.6 11.4 17.1 34.0 32.1 62.7 4.7 20.7 12.0 69.9 66.3 84.8San Antonio, TX 23.3 24.1 16.0 11.3 25.2 29.4 31.1 16.2 52.4 0.3 66.7 62.4 94.5San Diego, CA 12.7 19.7 14.2 15.8 37.6 32.7 37.7 23.8 33.0 5.4 61.5 73.4 76.1San Jose, CA 12.7 21.6 16.3 14.2 35.1 31.9 33.8 12.8 45.8 7.5 68.7 77.8 85.7Seattle, WA 15.1 18.2 14.4 15.1 37.2 32.3 61.2 30.2 1.6 7.0 56.1 78.5 76.8Spokane, WA 16.2 22.2 14.0 13.0 34.6 31.2 81.2 10.2 2.4 6.2 45.8 76.8 86.3Tucson, AZ 15.2 20.6 17.2 12.2 34.8 32.0 44.3 11.1 38.7 6.0 66.2 71.4 83.1Tulsa, OK 15.2 18.4 12.0 12.7 41.8 33.4 58.0 28.7 5.1 8.3 71.8 73.7 88.4Median 16.2 20.7 14.7 14.7 34.8 31.7 37.7 30.2 5.5 3.3 61.5 71.5 86.7
Table 2: Demographic Characteristics of Male ADAM 2001 Respondents (Weighted to Represent Booked Arrestees)
Age (%)Mean AgePrimary City
Employed (%)
High School Diploma (%)
Stable Housing Situation, Past 30 Days (%)
Race/Ethnicity (%)
Cocaine Opiates MarijuanaMetham-
phetamine PCPAny NIDA-
5 DrugMultiple
DrugsAlbany, NY 29.6 4.1 46.5 0.0 0.2 62.6 17.2 73.4Albuquerque, NM 36.7 16.0 37.9 9.5 0.0 63.8 28.0 96.2Anchorage, AK 19.4 4.4 38.2 0.8 0.0 51.9 9.8 83.0Birmingham, AL 29.1 6.4 48.6 0.2 0.0 63.4 18.1 83.4Charlotte, NC 31.6 3.3 47.7 0.5 0.0 65.5 16.8 85.0Chicago, IL 40.6 21.8 50.2 0.2 5.1 83.5 28.0 95.0Cleveland, OH 35.3 3.5 47.0 0.1 8.8 68.5 24.2 79.3Dallas, TX 30.4 4.8 32.9 1.7 2.3 51.8 18.7 95.0Denver, CO 33.8 5.2 40.0 3.4 0.0 61.8 19.1 94.5Des Moines, IA 8.7 2.2 43.1 22.0 1.4 56.6 18.6 90.5Detroit, MI 22.2 7.2 47.8 0.0 0.0 64.1 11.2 74.1Honolulu, HI 10.8 3.4 30.2 37.4 0.0 59.4 20.6 84.7Indianapolis, IN 32.3 5.1 49.6 0.6 2.5 66.0 20.8 96.3Kansas City, MO 33.8 0.3 49.0 1.0 8.6 69.2 22.6 72.6Laredo, TX 35.0 10.7 26.4 0.0 0.0 49.1 20.4 89.8Las Vegas, NV 21.0 5.0 35.1 20.5 1.8 59.9 20.4 94.4Minneapolis, MN 28.0 5.4 53.6 2.4 3.4 68.8 21.8 91.3New Orleans, LA 37.3 15.6 44.9 0.0 0.0 67.8 24.3 96.6New York, NY 44.6 18.7 40.5 0.1 1.5 76.1 25.0 94.2Oklahoma City, OK 21.6 5.0 50.7 10.9 2.5 68.4 19.7 98.1Omaha, NE 20.3 3.4 55.8 15.6 0.0 69.1 22.6 84.2Philadelphia, PA 36.7 13.2 42.7 0.0 6.9 71.0 25.7 94.9Phoenix, AZ 27.2 6.0 39.7 25.3 1.5 69.0 26.3 93.7Portland, OR 26.8 11.0 36.2 20.4 0.1 67.8 22.0 92.7Sacramento, CA 17.8 8.2 47.6 29.3 1.6 73.3 26.5 94.0Salt Lake City, UT 16.0 4.9 34.3 17.2 0.0 53.6 16.3 88.8San Antonio, TX 29.6 9.1 40.7 2.6 0.1 57.1 21.4 95.8San Diego, CA 14.1 7.6 36.4 27.9 0.9 61.5 22.0 92.0San Jose, CA 13.2 2.8 38.5 30.2 3.1 62.3 21.4 89.0Seattle, WA 32.0 10.3 35.1 11.1 1.8 63.6 23.0 91.1Spokane, WA 18.5 8.1 42.1 19.5 2.3 61.6 24.7 90.3Tucson, AZ 35.6 5.9 43.5 5.4 0.7 63.4 23.7 89.6Tulsa, OK 20.0 2.0 48.0 0.0 1.3 60.7 9.3 97.4Median 29.1 5.4 42.7 2.6 1.3 63.6 21.4 91.3
*These five drugs are the "NIDA-5 drugs", established by NIDA as a standard test panel of commonly used illegal drugs. They are the drugs analyzed in this report.
Note: Percentages in this table and subzequent tables are based on weighted data.
Table 3: Male ADAM 2001—Drug Test Results (NIDA-5 Drugs)
Interviews With Completed
Urine Tests (%)Primary City
Percentage of Arrestees Testing Positive For:*
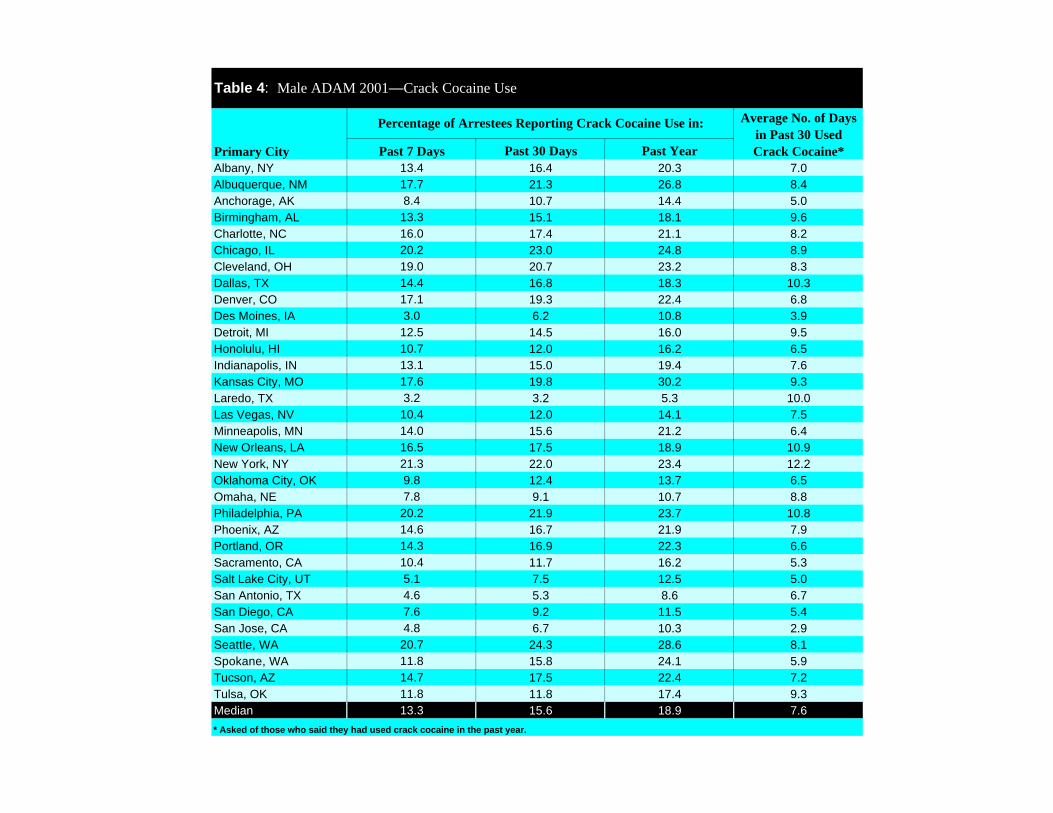
Past 7 Days Past 30 Days Past YearAlbany, NY 13.4 16.4 20.3 7.0Albuquerque, NM 17.7 21.3 26.8 8.4Anchorage, AK 8.4 10.7 14.4 5.0Birmingham, AL 13.3 15.1 18.1 9.6Charlotte, NC 16.0 17.4 21.1 8.2Chicago, IL 20.2 23.0 24.8 8.9Cleveland, OH 19.0 20.7 23.2 8.3Dallas, TX 14.4 16.8 18.3 10.3Denver, CO 17.1 19.3 22.4 6.8Des Moines, IA 3.0 6.2 10.8 3.9Detroit, MI 12.5 14.5 16.0 9.5Honolulu, HI 10.7 12.0 16.2 6.5Indianapolis, IN 13.1 15.0 19.4 7.6Kansas City, MO 17.6 19.8 30.2 9.3Laredo, TX 3.2 3.2 5.3 10.0Las Vegas, NV 10.4 12.0 14.1 7.5Minneapolis, MN 14.0 15.6 21.2 6.4New Orleans, LA 16.5 17.5 18.9 10.9New York, NY 21.3 22.0 23.4 12.2Oklahoma City, OK 9.8 12.4 13.7 6.5Omaha, NE 7.8 9.1 10.7 8.8Philadelphia, PA 20.2 21.9 23.7 10.8Phoenix, AZ 14.6 16.7 21.9 7.9Portland, OR 14.3 16.9 22.3 6.6Sacramento, CA 10.4 11.7 16.2 5.3Salt Lake City, UT 5.1 7.5 12.5 5.0San Antonio, TX 4.6 5.3 8.6 6.7San Diego, CA 7.6 9.2 11.5 5.4San Jose, CA 4.8 6.7 10.3 2.9Seattle, WA 20.7 24.3 28.6 8.1Spokane, WA 11.8 15.8 24.1 5.9Tucson, AZ 14.7 17.5 22.4 7.2Tulsa, OK 11.8 11.8 17.4 9.3Median 13.3 15.6 18.9 7.6* Asked of those who said they had used crack cocaine in the past year.
Percentage of Arrestees Reporting Crack Cocaine Use in:
Table 4: Male ADAM 2001—Crack Cocaine Use
Average No. of Days in Past 30 Used Crack Cocaine*Primary City
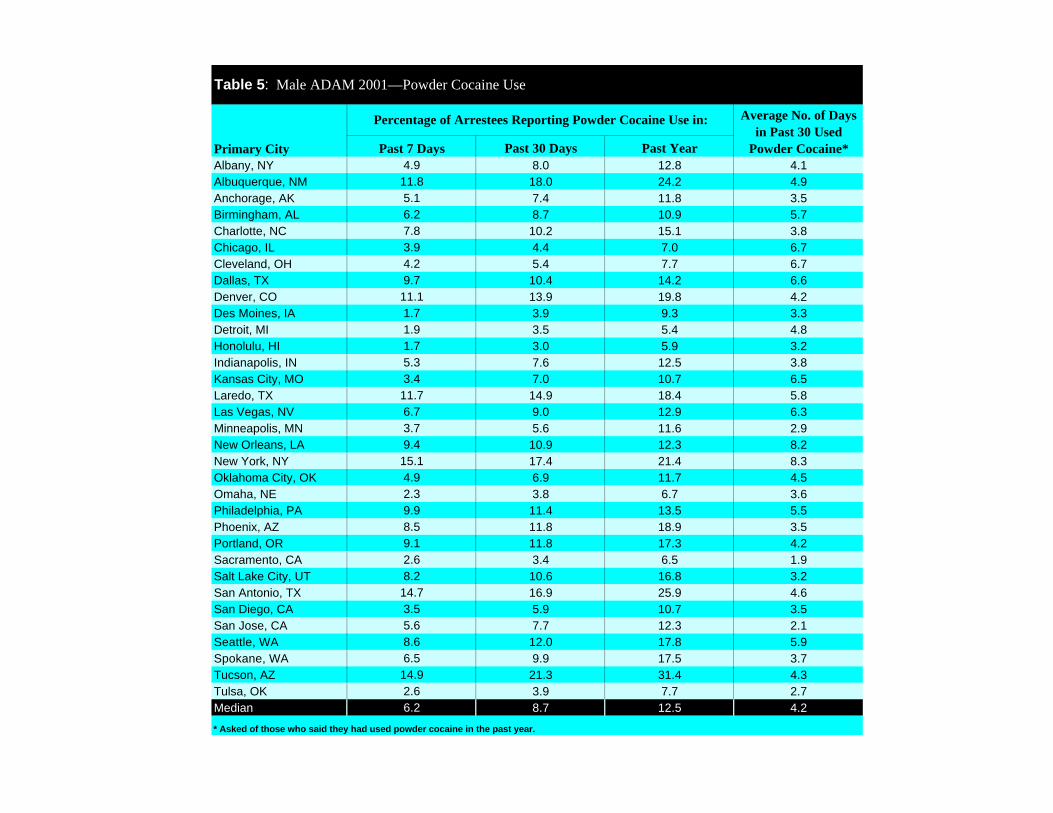
Past 7 Days Past 30 Days Past YearAlbany, NY 4.9 8.0 12.8 4.1Albuquerque, NM 11.8 18.0 24.2 4.9Anchorage, AK 5.1 7.4 11.8 3.5Birmingham, AL 6.2 8.7 10.9 5.7Charlotte, NC 7.8 10.2 15.1 3.8Chicago, IL 3.9 4.4 7.0 6.7Cleveland, OH 4.2 5.4 7.7 6.7Dallas, TX 9.7 10.4 14.2 6.6Denver, CO 11.1 13.9 19.8 4.2Des Moines, IA 1.7 3.9 9.3 3.3Detroit, MI 1.9 3.5 5.4 4.8Honolulu, HI 1.7 3.0 5.9 3.2Indianapolis, IN 5.3 7.6 12.5 3.8Kansas City, MO 3.4 7.0 10.7 6.5Laredo, TX 11.7 14.9 18.4 5.8Las Vegas, NV 6.7 9.0 12.9 6.3Minneapolis, MN 3.7 5.6 11.6 2.9New Orleans, LA 9.4 10.9 12.3 8.2New York, NY 15.1 17.4 21.4 8.3Oklahoma City, OK 4.9 6.9 11.7 4.5Omaha, NE 2.3 3.8 6.7 3.6Philadelphia, PA 9.9 11.4 13.5 5.5Phoenix, AZ 8.5 11.8 18.9 3.5Portland, OR 9.1 11.8 17.3 4.2Sacramento, CA 2.6 3.4 6.5 1.9Salt Lake City, UT 8.2 10.6 16.8 3.2San Antonio, TX 14.7 16.9 25.9 4.6San Diego, CA 3.5 5.9 10.7 3.5San Jose, CA 5.6 7.7 12.3 2.1Seattle, WA 8.6 12.0 17.8 5.9Spokane, WA 6.5 9.9 17.5 3.7Tucson, AZ 14.9 21.3 31.4 4.3Tulsa, OK 2.6 3.9 7.7 2.7Median 6.2 8.7 12.5 4.2* Asked of those who said they had used powder cocaine in the past year.
Percentage of Arrestees Reporting Powder Cocaine Use in:
Table 5: Male ADAM 2001—Powder Cocaine Use
Average No. of Days in Past 30 Used
Powder Cocaine*Primary City
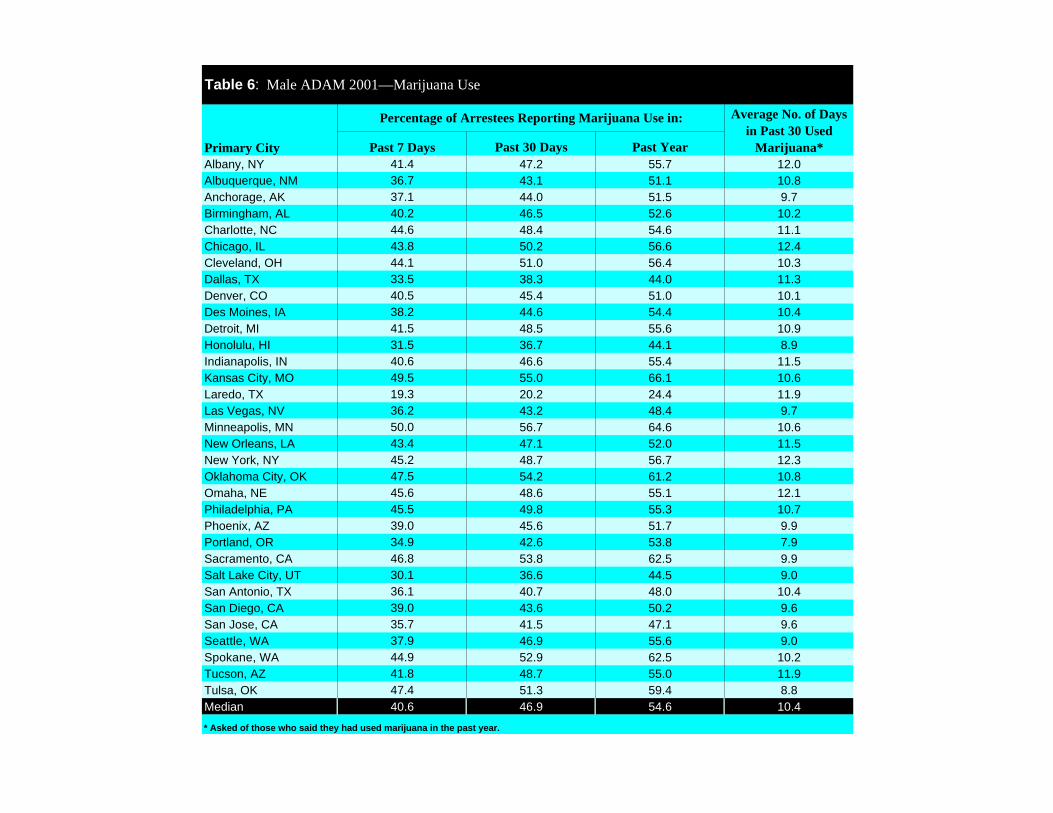
Past 7 Days Past 30 Days Past YearAlbany, NY 41.4 47.2 55.7 12.0Albuquerque, NM 36.7 43.1 51.1 10.8Anchorage, AK 37.1 44.0 51.5 9.7Birmingham, AL 40.2 46.5 52.6 10.2Charlotte, NC 44.6 48.4 54.6 11.1Chicago, IL 43.8 50.2 56.6 12.4Cleveland, OH 44.1 51.0 56.4 10.3Dallas, TX 33.5 38.3 44.0 11.3Denver, CO 40.5 45.4 51.0 10.1Des Moines, IA 38.2 44.6 54.4 10.4Detroit, MI 41.5 48.5 55.6 10.9Honolulu, HI 31.5 36.7 44.1 8.9Indianapolis, IN 40.6 46.6 55.4 11.5Kansas City, MO 49.5 55.0 66.1 10.6Laredo, TX 19.3 20.2 24.4 11.9Las Vegas, NV 36.2 43.2 48.4 9.7Minneapolis, MN 50.0 56.7 64.6 10.6New Orleans, LA 43.4 47.1 52.0 11.5New York, NY 45.2 48.7 56.7 12.3Oklahoma City, OK 47.5 54.2 61.2 10.8Omaha, NE 45.6 48.6 55.1 12.1Philadelphia, PA 45.5 49.8 55.3 10.7Phoenix, AZ 39.0 45.6 51.7 9.9Portland, OR 34.9 42.6 53.8 7.9Sacramento, CA 46.8 53.8 62.5 9.9Salt Lake City, UT 30.1 36.6 44.5 9.0San Antonio, TX 36.1 40.7 48.0 10.4San Diego, CA 39.0 43.6 50.2 9.6San Jose, CA 35.7 41.5 47.1 9.6Seattle, WA 37.9 46.9 55.6 9.0Spokane, WA 44.9 52.9 62.5 10.2Tucson, AZ 41.8 48.7 55.0 11.9Tulsa, OK 47.4 51.3 59.4 8.8Median 40.6 46.9 54.6 10.4* Asked of those who said they had used marijuana in the past year.
Percentage of Arrestees Reporting Marijuana Use in:
Table 6: Male ADAM 2001—Marijuana Use
Average No. of Days in Past 30 Used
Marijuana*Primary City
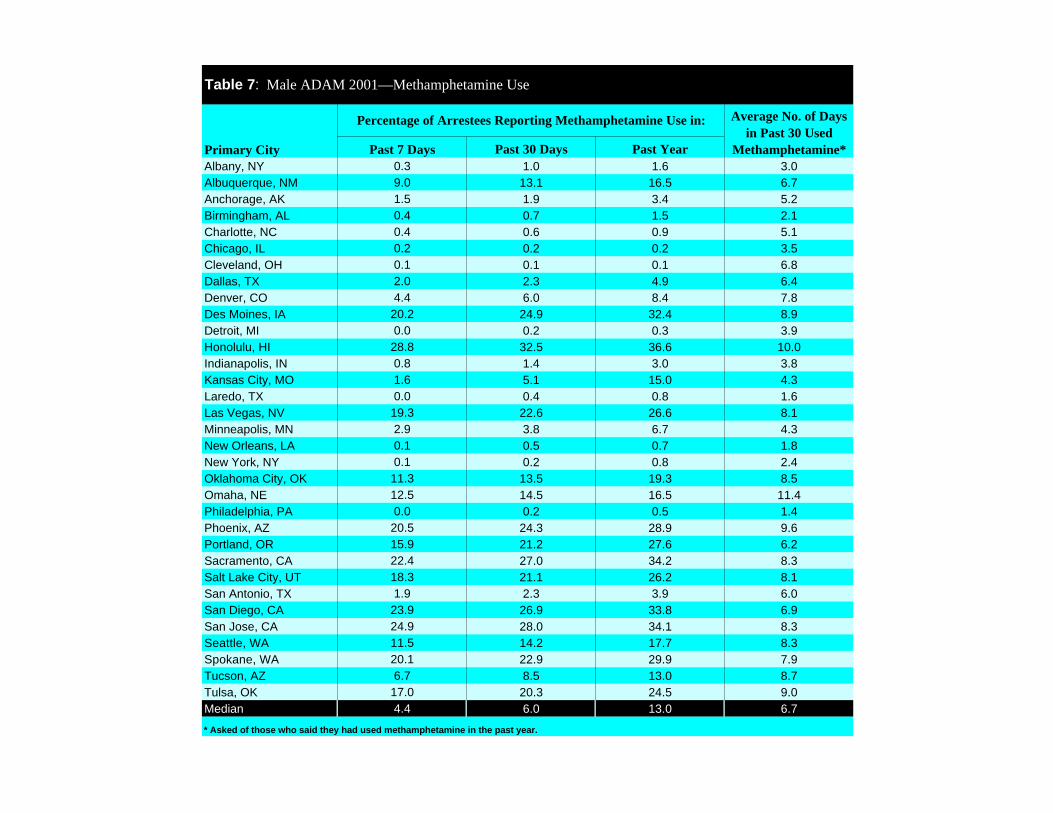
Past 7 Days Past 30 Days Past YearAlbany, NY 0.3 1.0 1.6 3.0Albuquerque, NM 9.0 13.1 16.5 6.7Anchorage, AK 1.5 1.9 3.4 5.2Birmingham, AL 0.4 0.7 1.5 2.1Charlotte, NC 0.4 0.6 0.9 5.1Chicago, IL 0.2 0.2 0.2 3.5Cleveland, OH 0.1 0.1 0.1 6.8Dallas, TX 2.0 2.3 4.9 6.4Denver, CO 4.4 6.0 8.4 7.8Des Moines, IA 20.2 24.9 32.4 8.9Detroit, MI 0.0 0.2 0.3 3.9Honolulu, HI 28.8 32.5 36.6 10.0Indianapolis, IN 0.8 1.4 3.0 3.8Kansas City, MO 1.6 5.1 15.0 4.3Laredo, TX 0.0 0.4 0.8 1.6Las Vegas, NV 19.3 22.6 26.6 8.1Minneapolis, MN 2.9 3.8 6.7 4.3New Orleans, LA 0.1 0.5 0.7 1.8New York, NY 0.1 0.2 0.8 2.4Oklahoma City, OK 11.3 13.5 19.3 8.5Omaha, NE 12.5 14.5 16.5 11.4Philadelphia, PA 0.0 0.2 0.5 1.4Phoenix, AZ 20.5 24.3 28.9 9.6Portland, OR 15.9 21.2 27.6 6.2Sacramento, CA 22.4 27.0 34.2 8.3Salt Lake City, UT 18.3 21.1 26.2 8.1San Antonio, TX 1.9 2.3 3.9 6.0San Diego, CA 23.9 26.9 33.8 6.9San Jose, CA 24.9 28.0 34.1 8.3Seattle, WA 11.5 14.2 17.7 8.3Spokane, WA 20.1 22.9 29.9 7.9Tucson, AZ 6.7 8.5 13.0 8.7Tulsa, OK 17.0 20.3 24.5 9.0Median 4.4 6.0 13.0 6.7* Asked of those who said they had used methamphetamine in the past year.
Percentage of Arrestees Reporting Methamphetamine Use in:
Table 7: Male ADAM 2001—Methamphetamine Use
Average No. of Days in Past 30 Used
Methamphetamine*Primary City

Past 7 Days Past 30 Days Past YearAlbany, NY 3.2 3.4 4.2 13.6Albuquerque, NM 12.5 14.2 16.7 12.5Anchorage, AK 1.0 1.2 1.7 11.0Birmingham, AL 0.2 0.3 0.8 5.1Charlotte, NC 1.7 2.4 3.2 9.5Chicago, IL 18.1 20.5 21.3 12.1Cleveland, OH 2.7 2.9 3.1 12.8Dallas, TX 3.9 4.2 7.0 8.9Denver, CO 2.8 3.5 5.4 9.1Des Moines, IA 0.3 0.4 1.2 3.7Detroit, MI 3.5 4.2 5.0 11.8Honolulu, HI 2.4 2.6 2.7 13.8Indianapolis, IN 1.5 1.7 1.8 15.9Kansas City, MO 0.5 1.5 4.5 2.8Laredo, TX 3.8 4.7 6.1 10.5Las Vegas, NV 2.5 3.3 4.3 12.0Minneapolis, MN 2.7 2.8 3.6 10.4New Orleans, LA 12.7 13.3 14.2 12.0New York, NY 16.1 17.5 18.9 14.5Oklahoma City, OK 1.2 1.4 2.1 10.8Omaha, NE 0.3 0.3 0.9 17.3Philadelphia, PA 10.8 12.0 12.7 13.2Phoenix, AZ 4.5 5.5 6.8 10.3Portland, OR 8.0 10.2 12.3 8.7Sacramento, CA 5.8 7.0 8.7 9.7Salt Lake City, UT 5.3 6.4 8.8 9.2San Antonio, TX 5.6 6.2 8.8 8.5San Diego, CA 4.7 5.2 7.7 8.8San Jose, CA 2.2 2.3 4.2 4.2Seattle, WA 8.8 11.0 13.3 10.6Spokane, WA 5.6 6.8 9.8 10.1Tucson, AZ 3.1 3.7 6.0 12.1Tulsa, OK 0.7 0.7 1.3 5.7Median 3.2 3.7 5.4 10.5* Asked of those who said they had used an opiate in the past year.
Table 8: Male ADAM 2001—Opiate Use
Percentage of Arrestees Reporting Opiate Use in: Average No. of Days in Past 30 Used
Opiates*Primary City
Albany, NY 40.1 3.6 37.1Albuquerque, NM 41.7 21.2 44.4Anchorage, AK 29.2 2.6 26.3Birmingham, AL 27.9 2.5 32.5Charlotte, NC 35.7 3.2 35.2Chicago, IL 53.9 2.2 48.1Cleveland, OH 35.5 2.4 37.4Dallas, TX 33.8 7.0 36.7Denver, CO 32.8 8.6 34.9Des Moines, IA 41.0 9.3 42.0Detroit, MI 37.7 3.3 38.0Honolulu, HI 34.2 2.8 38.3Indianapolis, IN 35.6 1.7 35.0Kansas City, MO 47.5 7.6 49.2Laredo, TX 15.9 4.3 19.7Las Vegas, NV 35.7 10.5 38.3Minneapolis, MN 39.6 4.2 38.6New Orleans, LA 40.5 10.2 41.7New York, NY 50.0 6.9 50.9Oklahoma City, OK 39.8 11.2 38.6Omaha, NE 40.7 6.4 33.1Philadelphia, PA 45.1 7.9 45.7Phoenix, AZ 42.9 12.2 45.1Portland, OR 40.6 18.3 41.4Sacramento, CA 45.1 15.3 45.7Salt Lake City, UT 33.2 14.2 37.9San Antonio, TX 32.4 7.6 34.3San Diego, CA 38.9 12.5 39.5San Jose, CA 34.3 6.8 36.7Seattle, WA 42.9 15.7 45.7Spokane, WA 47.2 16.9 42.5Tucson, AZ 42.0 8.7 41.1Tulsa, OK 36.1 13.6 44.8Median 39.6 7.6 38.6
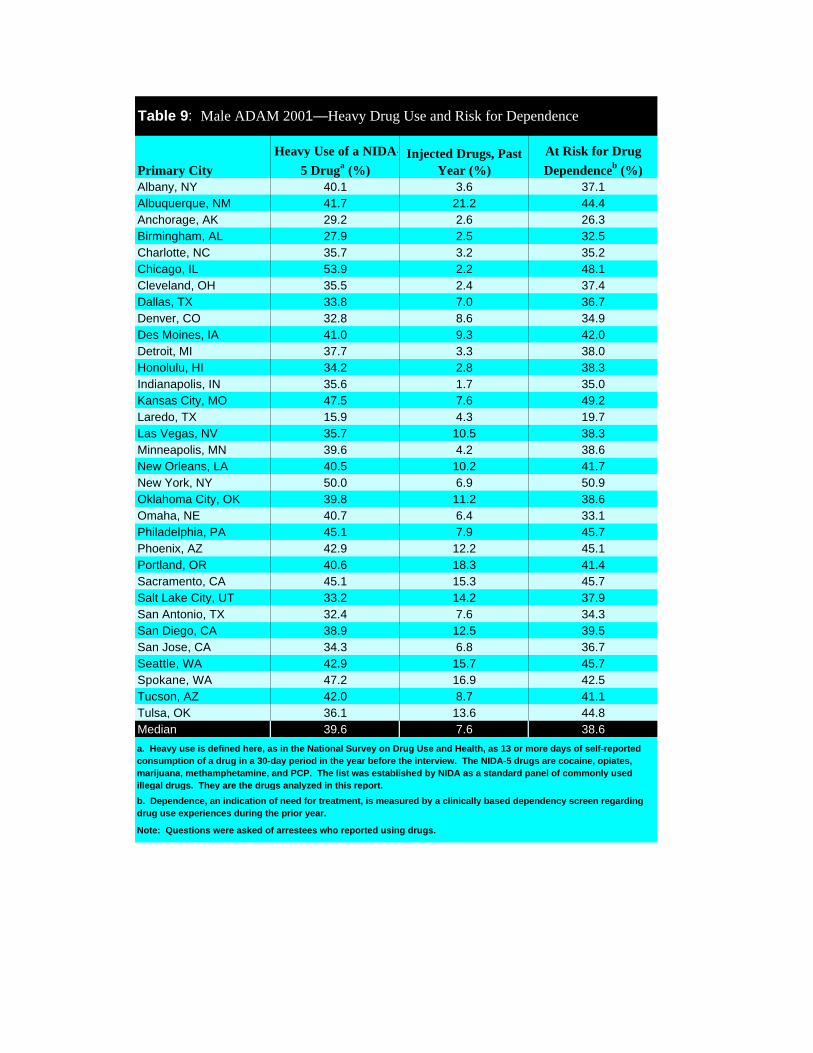
Table 9: Male ADAM 2001—Heavy Drug Use and Risk for Dependence
a. Heavy use is defined here, as in the National Survey on Drug Use and Health, as 13 or more days of self-reported consumption of a drug in a 30-day period in the year before the interview. The NIDA-5 drugs are cocaine, opiates, marijuana, methamphetamine, and PCP. The list was established by NIDA as a standard panel of commonly used illegal drugs. They are the drugs analyzed in this report.
b. Dependence, an indication of need for treatment, is measured by a clinically based dependency screen regarding drug use experiences during the prior year.
Note: Questions were asked of arrestees who reported using drugs.
Heavy Use of a NIDA-5 Druga (%)
Injected Drugs, Past Year (%)
At Risk for Drug Dependenceb (%)Primary City
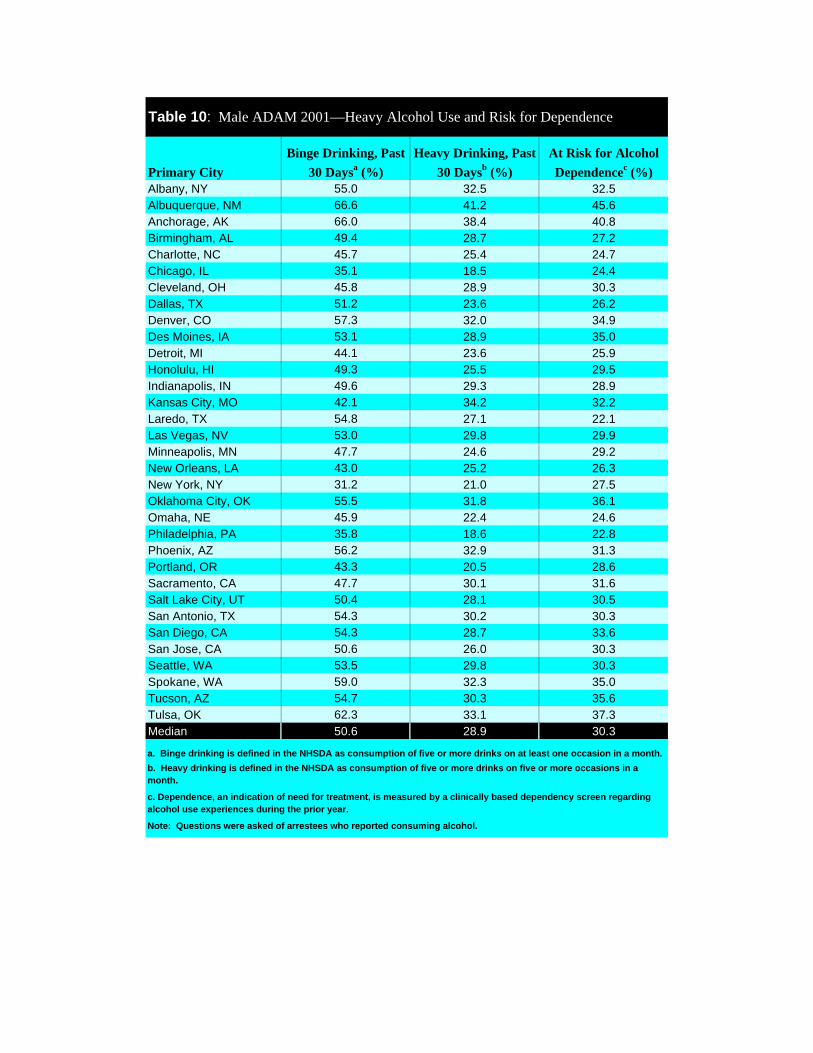
Albany, NY 55.0 32.5 32.5Albuquerque, NM 66.6 41.2 45.6Anchorage, AK 66.0 38.4 40.8Birmingham, AL 49.4 28.7 27.2Charlotte, NC 45.7 25.4 24.7Chicago, IL 35.1 18.5 24.4Cleveland, OH 45.8 28.9 30.3Dallas, TX 51.2 23.6 26.2Denver, CO 57.3 32.0 34.9Des Moines, IA 53.1 28.9 35.0Detroit, MI 44.1 23.6 25.9Honolulu, HI 49.3 25.5 29.5Indianapolis, IN 49.6 29.3 28.9Kansas City, MO 42.1 34.2 32.2Laredo, TX 54.8 27.1 22.1Las Vegas, NV 53.0 29.8 29.9Minneapolis, MN 47.7 24.6 29.2New Orleans, LA 43.0 25.2 26.3New York, NY 31.2 21.0 27.5Oklahoma City, OK 55.5 31.8 36.1Omaha, NE 45.9 22.4 24.6Philadelphia, PA 35.8 18.6 22.8Phoenix, AZ 56.2 32.9 31.3Portland, OR 43.3 20.5 28.6Sacramento, CA 47.7 30.1 31.6Salt Lake City, UT 50.4 28.1 30.5San Antonio, TX 54.3 30.2 30.3San Diego, CA 54.3 28.7 33.6San Jose, CA 50.6 26.0 30.3Seattle, WA 53.5 29.8 30.3Spokane, WA 59.0 32.3 35.0Tucson, AZ 54.7 30.3 35.6Tulsa, OK 62.3 33.1 37.3Median 50.6 28.9 30.3
Note: Questions were asked of arrestees who reported consuming alcohol.
a. Binge drinking is defined in the NHSDA as consumption of five or more drinks on at least one occasion in a month.
b. Heavy drinking is defined in the NHSDA as consumption of five or more drinks on five or more occasions in a month.
c. Dependence, an indication of need for treatment, is measured by a clinically based dependency screen regarding alcohol use experiences during the prior year.
Table 10: Male ADAM 2001—Heavy Alcohol Use and Risk for Dependence
Binge Drinking, Past 30 Daysa (%)
Heavy Drinking, Past 30 Daysb (%)
At Risk for Alcohol Dependencec (%)Primary City
Cash Purchase
Non-cash Purchase
Cash Purchase
Non-cash Purchase
Cash Purchase
Non-cash Purchase
Cash Purchase
Non-cash Purchase
Cash Purchase
Non-cash Purchase
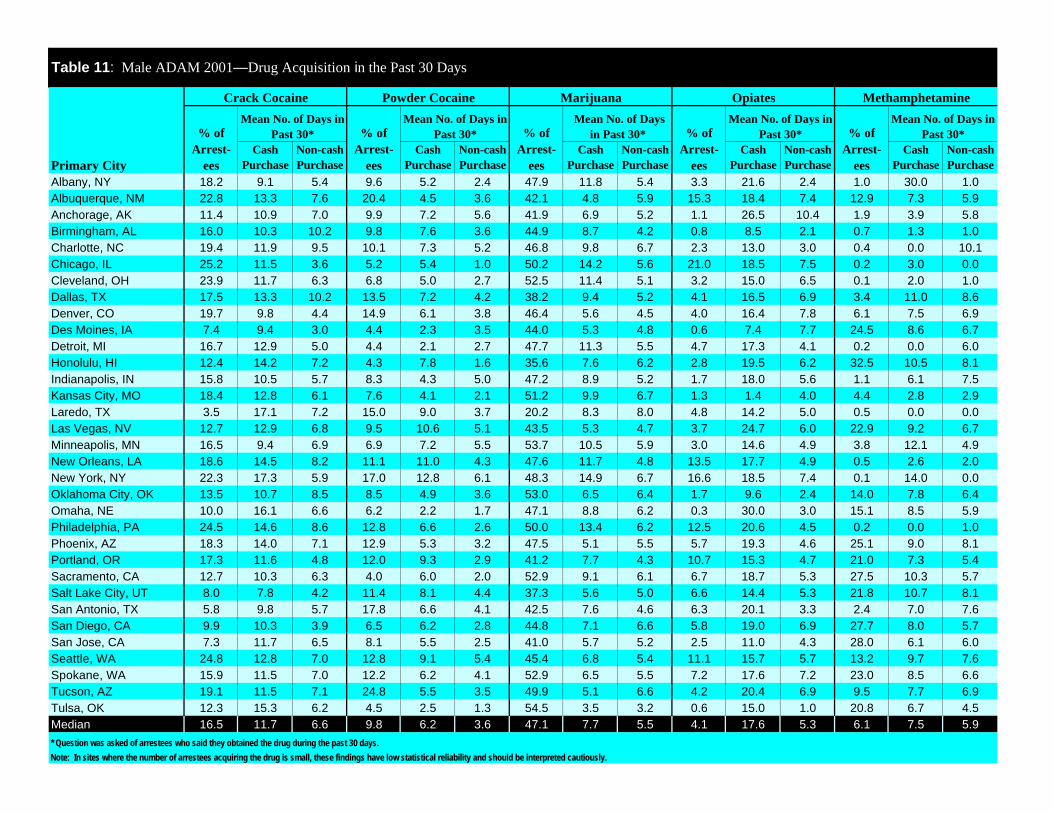
Albany, NY 18.2 9.1 5.4 9.6 5.2 2.4 47.9 11.8 5.4 3.3 21.6 2.4 1.0 30.0 1.0Albuquerque, NM 22.8 13.3 7.6 20.4 4.5 3.6 42.1 4.8 5.9 15.3 18.4 7.4 12.9 7.3 5.9Anchorage, AK 11.4 10.9 7.0 9.9 7.2 5.6 41.9 6.9 5.2 1.1 26.5 10.4 1.9 3.9 5.8Birmingham, AL 16.0 10.3 10.2 9.8 7.6 3.6 44.9 8.7 4.2 0.8 8.5 2.1 0.7 1.3 1.0Charlotte, NC 19.4 11.9 9.5 10.1 7.3 5.2 46.8 9.8 6.7 2.3 13.0 3.0 0.4 0.0 10.1Chicago, IL 25.2 11.5 3.6 5.2 5.4 1.0 50.2 14.2 5.6 21.0 18.5 7.5 0.2 3.0 0.0Cleveland, OH 23.9 11.7 6.3 6.8 5.0 2.7 52.5 11.4 5.1 3.2 15.0 6.5 0.1 2.0 1.0Dallas, TX 17.5 13.3 10.2 13.5 7.2 4.2 38.2 9.4 5.2 4.1 16.5 6.9 3.4 11.0 8.6Denver, CO 19.7 9.8 4.4 14.9 6.1 3.8 46.4 5.6 4.5 4.0 16.4 7.8 6.1 7.5 6.9Des Moines, IA 7.4 9.4 3.0 4.4 2.3 3.5 44.0 5.3 4.8 0.6 7.4 7.7 24.5 8.6 6.7Detroit, MI 16.7 12.9 5.0 4.4 2.1 2.7 47.7 11.3 5.5 4.7 17.3 4.1 0.2 0.0 6.0Honolulu, HI 12.4 14.2 7.2 4.3 7.8 1.6 35.6 7.6 6.2 2.8 19.5 6.2 32.5 10.5 8.1Indianapolis, IN 15.8 10.5 5.7 8.3 4.3 5.0 47.2 8.9 5.2 1.7 18.0 5.6 1.1 6.1 7.5Kansas City, MO 18.4 12.8 6.1 7.6 4.1 2.1 51.2 9.9 6.7 1.3 1.4 4.0 4.4 2.8 2.9Laredo, TX 3.5 17.1 7.2 15.0 9.0 3.7 20.2 8.3 8.0 4.8 14.2 5.0 0.5 0.0 0.0Las Vegas, NV 12.7 12.9 6.8 9.5 10.6 5.1 43.5 5.3 4.7 3.7 24.7 6.0 22.9 9.2 6.7Minneapolis, MN 16.5 9.4 6.9 6.9 7.2 5.5 53.7 10.5 5.9 3.0 14.6 4.9 3.8 12.1 4.9New Orleans, LA 18.6 14.5 8.2 11.1 11.0 4.3 47.6 11.7 4.8 13.5 17.7 4.9 0.5 2.6 2.0New York, NY 22.3 17.3 5.9 17.0 12.8 6.1 48.3 14.9 6.7 16.6 18.5 7.4 0.1 14.0 0.0Oklahoma City, OK 13.5 10.7 8.5 8.5 4.9 3.6 53.0 6.5 6.4 1.7 9.6 2.4 14.0 7.8 6.4Omaha, NE 10.0 16.1 6.6 6.2 2.2 1.7 47.1 8.8 6.2 0.3 30.0 3.0 15.1 8.5 5.9Philadelphia, PA 24.5 14.6 8.6 12.8 6.6 2.6 50.0 13.4 6.2 12.5 20.6 4.5 0.2 0.0 1.0Phoenix, AZ 18.3 14.0 7.1 12.9 5.3 3.2 47.5 5.1 5.5 5.7 19.3 4.6 25.1 9.0 8.1Portland, OR 17.3 11.6 4.8 12.0 9.3 2.9 41.2 7.7 4.3 10.7 15.3 4.7 21.0 7.3 5.4Sacramento, CA 12.7 10.3 6.3 4.0 6.0 2.0 52.9 9.1 6.1 6.7 18.7 5.3 27.5 10.3 5.7Salt Lake City, UT 8.0 7.8 4.2 11.4 8.1 4.4 37.3 5.6 5.0 6.6 14.4 5.3 21.8 10.7 8.1San Antonio, TX 5.8 9.8 5.7 17.8 6.6 4.1 42.5 7.6 4.6 6.3 20.1 3.3 2.4 7.0 7.6San Diego, CA 9.9 10.3 3.9 6.5 6.2 2.8 44.8 7.1 6.6 5.8 19.0 6.9 27.7 8.0 5.7San Jose, CA 7.3 11.7 6.5 8.1 5.5 2.5 41.0 5.7 5.2 2.5 11.0 4.3 28.0 6.1 6.0Seattle, WA 24.8 12.8 7.0 12.8 9.1 5.4 45.4 6.8 5.4 11.1 15.7 5.7 13.2 9.7 7.6Spokane, WA 15.9 11.5 7.0 12.2 6.2 4.1 52.9 6.5 5.5 7.2 17.6 7.2 23.0 8.5 6.6Tucson, AZ 19.1 11.5 7.1 24.8 5.5 3.5 49.9 5.1 6.6 4.2 20.4 6.9 9.5 7.7 6.9Tulsa, OK 12.3 15.3 6.2 4.5 2.5 1.3 54.5 3.5 3.2 0.6 15.0 1.0 20.8 6.7 4.5Median 16.5 11.7 6.6 9.8 6.2 3.6 47.1 7.7 5.5 4.1 17.6 5.3 6.1 7.5 5.9* Question was asked of arrestees who said they obtained the drug during the past 30 days.
Mean No. of Days in Past 30* % of
Arrest-ees
Note: In sites where the number of arrestees acquiring the drug is small, these findings have low statistical reliability and should be interpreted cautiously.
Mean No. of Days in Past 30* % of
Arrest-ees
Mean No. of Days in Past 30* % of
Arrest-ees
% of Arrest-
ees
Mean No. of Days in Past 30*
Table 11: Male ADAM 2001—Drug Acquisition in the Past 30 Days
MethamphetamineOpiatesMarijuanaPowder CocaineCrack Cocaine
Primary City
% of Arrest-
ees
Mean No. of Days in Past 30*
Marijuana Crack Cocaine Powder Cocaine OpiatesMethamphet-
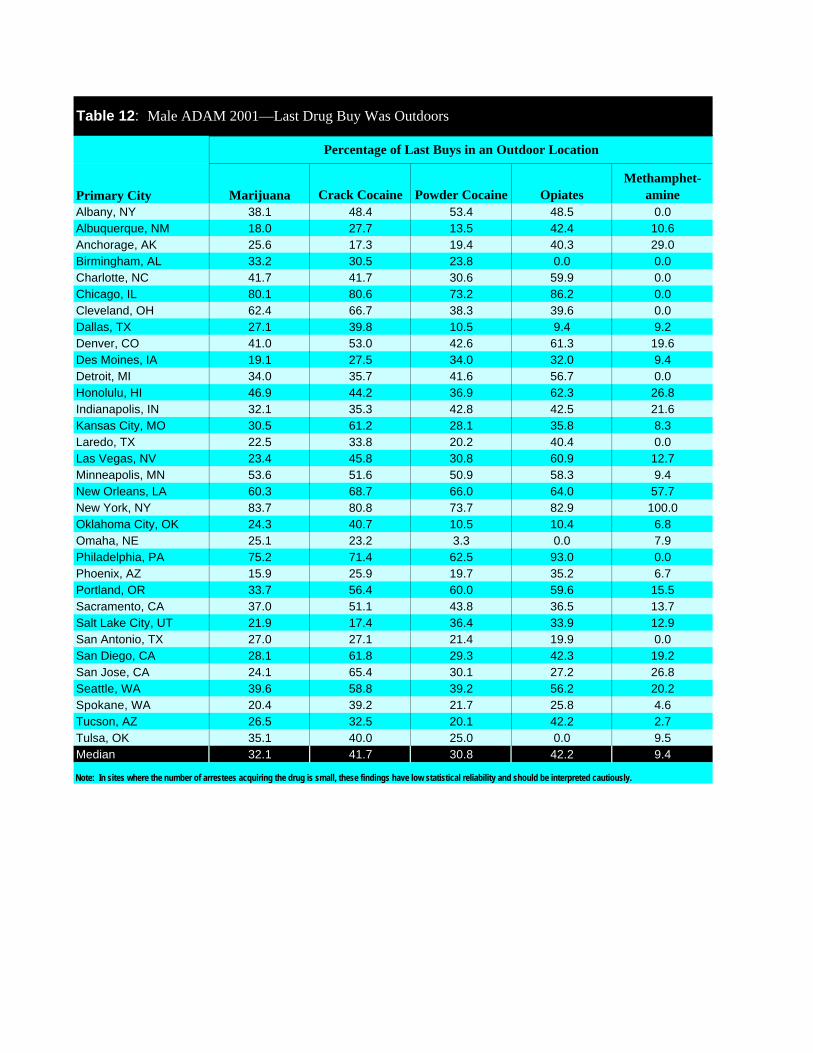
amineAlbany, NY 38.1 48.4 53.4 48.5 0.0Albuquerque, NM 18.0 27.7 13.5 42.4 10.6Anchorage, AK 25.6 17.3 19.4 40.3 29.0Birmingham, AL 33.2 30.5 23.8 0.0 0.0Charlotte, NC 41.7 41.7 30.6 59.9 0.0Chicago, IL 80.1 80.6 73.2 86.2 0.0Cleveland, OH 62.4 66.7 38.3 39.6 0.0Dallas, TX 27.1 39.8 10.5 9.4 9.2Denver, CO 41.0 53.0 42.6 61.3 19.6Des Moines, IA 19.1 27.5 34.0 32.0 9.4Detroit, MI 34.0 35.7 41.6 56.7 0.0Honolulu, HI 46.9 44.2 36.9 62.3 26.8Indianapolis, IN 32.1 35.3 42.8 42.5 21.6Kansas City, MO 30.5 61.2 28.1 35.8 8.3Laredo, TX 22.5 33.8 20.2 40.4 0.0Las Vegas, NV 23.4 45.8 30.8 60.9 12.7Minneapolis, MN 53.6 51.6 50.9 58.3 9.4New Orleans, LA 60.3 68.7 66.0 64.0 57.7New York, NY 83.7 80.8 73.7 82.9 100.0Oklahoma City, OK 24.3 40.7 10.5 10.4 6.8Omaha, NE 25.1 23.2 3.3 0.0 7.9Philadelphia, PA 75.2 71.4 62.5 93.0 0.0Phoenix, AZ 15.9 25.9 19.7 35.2 6.7Portland, OR 33.7 56.4 60.0 59.6 15.5Sacramento, CA 37.0 51.1 43.8 36.5 13.7Salt Lake City, UT 21.9 17.4 36.4 33.9 12.9San Antonio, TX 27.0 27.1 21.4 19.9 0.0San Diego, CA 28.1 61.8 29.3 42.3 19.2San Jose, CA 24.1 65.4 30.1 27.2 26.8Seattle, WA 39.6 58.8 39.2 56.2 20.2Spokane, WA 20.4 39.2 21.7 25.8 4.6Tucson, AZ 26.5 32.5 20.1 42.2 2.7Tulsa, OK 35.1 40.0 25.0 0.0 9.5Median 32.1 41.7 30.8 42.2 9.4
Note: In sites where the number of arrestees acquiring the drug is small, these findings have low statistical reliability and should be interpreted cautiously.
Table 12: Male ADAM 2001—Last Drug Buy Was Outdoors
Percentage of Last Buys in an Outdoor Location
Primary City

Marijuana Crack Cocaine Powder Cocaine OpiatesMethamphet-
amineAlbany, NY 34.6 36.2 22.2 24.4 100.0Albuquerque, NM 35.6 32.0 35.7 23.1 38.5Anchorage, AK 52.1 41.1 38.1 14.5 13.9Birmingham, AL 32.6 41.4 24.5 0.0 0.0Charlotte, NC 51.5 41.8 53.1 35.3 0.0Chicago, IL 26.5 29.0 17.1 34.6 0.0Cleveland, OH 35.0 32.6 32.7 25.4 100.0Dallas, TX 44.4 36.3 22.9 27.4 34.3Denver, CO 42.4 49.9 23.8 21.5 31.2Des Moines, IA 35.0 16.5 14.9 0.0 49.3Detroit, MI 65.4 55.8 41.6 39.6 0.0Honolulu, HI 47.0 38.1 27.7 35.7 41.2Indianapolis, IN 57.3 54.0 46.4 30.1 26.9Kansas City, MO 52.9 30.0 16.5 87.6 58.9Laredo, TX 22.8 8.5 32.6 30.2 0.0Las Vegas, NV 38.8 37.7 23.3 15.1 45.3Minneapolis, MN 36.8 29.7 17.0 21.8 32.3New Orleans, LA 44.9 47.2 38.8 31.4 0.0New York, NY 22.2 22.8 15.9 27.2 0.0Oklahoma City, OK 32.0 36.3 34.5 49.5 31.1Omaha, NE 29.4 54.6 21.8 100.0 17.2Philadelphia, PA 45.6 32.0 38.0 13.3 0.0Phoenix, AZ 25.9 19.4 22.5 18.8 22.0Portland, OR 28.5 31.0 23.0 22.0 31.0Sacramento, CA 46.3 43.4 22.2 28.5 37.0Salt Lake City, UT 48.1 26.5 34.3 11.7 48.9San Antonio, TX 29.1 29.0 26.4 17.2 18.7San Diego, CA 40.5 35.3 21.2 21.1 32.5San Jose, CA 22.8 23.3 23.9 31.1 28.9Seattle, WA 32.0 34.3 23.7 24.6 32.7Spokane, WA 22.1 33.0 17.9 23.8 24.1Tucson, AZ 31.4 33.6 18.2 2.5 35.3Tulsa, OK 23.8 40.0 25.0 0.0 36.4Median 35.0 34.3 23.8 24.4 31.1
Note: In sites where the number of arrestees acquiring the drug is small, these findings have low statistical reliability and should be interpreted cautiously.
Note: Question was asked of arrestees who said they had purchased drugs in the past 30 days.
Table 13: Male ADAM 2001—Any Failed Drug Purchase in the Past 30 Days
Percentage Reporting Failed Drug Buy in Last 30 Days
Primary City
Marijuana Crack Cocaine Powder Cocaine OpiatesMethamphet-
amineAlbany, NY 11.6 22.4 33.1 0.0 0.0Albuquerque, NM 5.2 20.6 3.3 3.9 0.0Anchorage, AK 9.0 6.9 0.0 0.0 0.0Birmingham, AL 20.7 24.6 22.5 N.A. N.A.Charlotte, NC 5.0 25.0 4.2 33.8 N.A.Chicago, IL 19.1 21.2 0.0 23.5 N.A.Cleveland, OH 11.5 11.5 9.3 0.0 100.0Dallas, TX 2.1 1.2 0.0 0.0 0.0Denver, CO 7.1 16.5 19.2 30.3 18.5Des Moines, IA 0.0 18.6 0.0 N.A. 1.7Detroit, MI 5.9 1.7 0.0 16.4 N.A.Honolulu, HI 6.6 4.7 0.0 0.0 6.7Indianapolis, IN 2.6 1.3 4.0 0.0 0.0Kansas City, MO 13.2 28.5 0.0 0.0 0.0Laredo, TX 16.7 0.0 14.3 0.0 N.A.Las Vegas, NV 5.0 9.2 0.0 0.0 5.1Minneapolis, MN 6.6 6.6 0.0 10.1 0.0New Orleans, LA 10.6 14.9 31.5 22.9 N.A.New York, NY 26.3 25.0 21.3 27.3 N.A.Oklahoma City, OK 1.1 5.1 5.8 0.0 14.9Omaha, NE 1.3 6.1 0.0 0.0 0.0Philadelphia, PA 9.6 18.0 19.7 34.5 N.A.Phoenix, AZ 9.2 9.3 3.0 4.9 14.8Portland, OR 7.5 33.3 18.0 7.8 2.9Sacramento, CA 2.7 7.9 0.0 0.0 4.9Salt Lake City, UT 0.0 0.0 0.0 0.0 4.8San Antonio, TX 14.1 51.4 19.9 14.6 0.0San Diego, CA 1.2 0.0 0.0 0.0 2.0San Jose, CA 7.7 6.7 14.5 0.0 5.2Seattle, WA 3.1 9.0 0.0 13.1 0.0Spokane, WA 4.5 28.3 12.0 32.3 4.3Tucson, AZ 2.3 5.2 0.0 0.0 0.0Tulsa, OK 0.0 16.7 0.0 N.A. 0.0Median 6.6 9.3 3.0 0.0 1.7
Note: In sites where the number of arrestees acquiring the drug is small, these findings have low statistical reliability and should be interpreted cautiously.
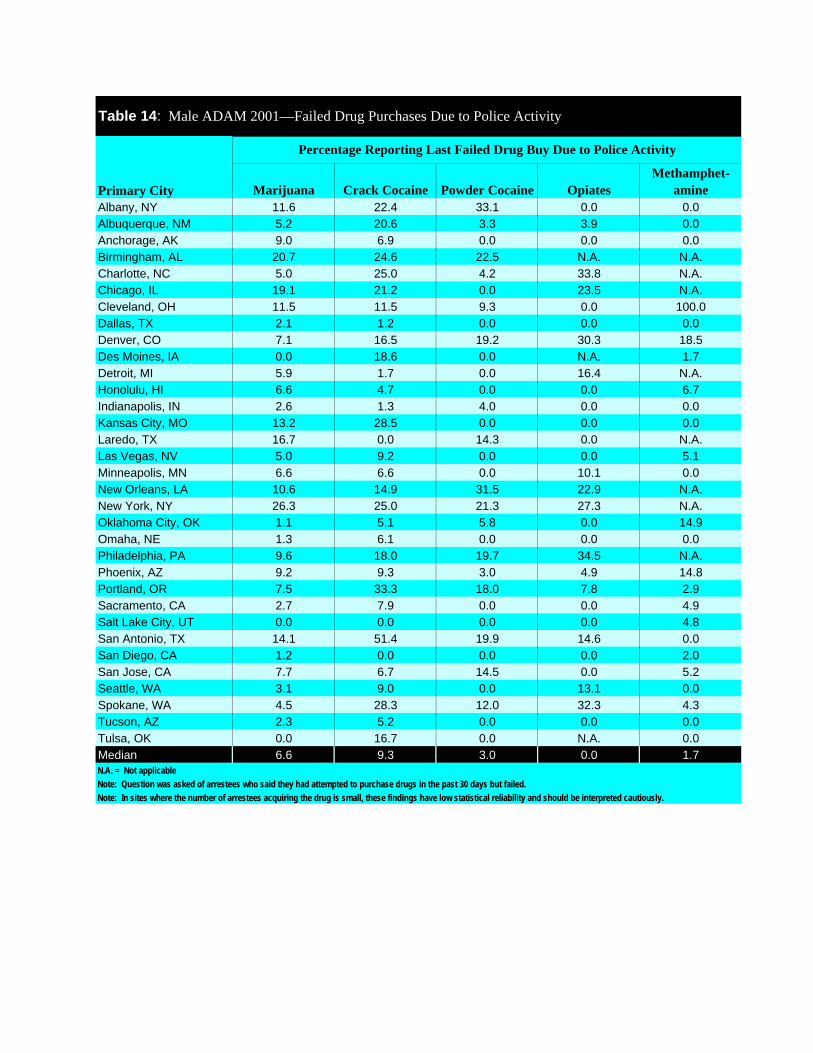
Table 14: Male ADAM 2001—Failed Drug Purchases Due to Police Activity
Note: Question was asked of arrestees who said they had attempted to purchase drugs in the past 30 days but failed.
Percentage Reporting Last Failed Drug Buy Due to Police Activity
Primary City
N.A. = Not applicable

Primary CityTreated* in Past Year
(%)Albany, NY 12.6Albuquerque, NM 15.0Anchorage, AK 8.3Birmingham, AL 5.1Charlotte, NC 10.3Chicago, IL 9.2Cleveland, OH 8.3Dallas, TX 5.4Denver, CO 11.5Des Moines, IA 12.6Detroit, MI 8.2Honolulu, HI 7.4Indianapolis, IN 7.2Kansas City, MO 15.9Laredo, TX 2.5Las Vegas, NV 6.6Minneapolis, MN 15.8New Orleans, LA 5.6New York, NY 18.0Oklahoma City, OK 7.0Omaha, NE 4.8Philadelphia, PA 10.9Phoenix, AZ 9.1Portland, OR 17.7Sacramento, CA 6.9Salt Lake City, UT 12.0San Antonio, TX 4.4San Diego, CA 11.8San Jose, CA 12.0Seattle, WA 13.3Spokane, WA 14.0Tucson, AZ 10.8Tulsa, OK 6.5Median 9.2*Treatment could be inpatient or outpatient.
Table 15: Male ADAM 2001 Drug Treatment Status
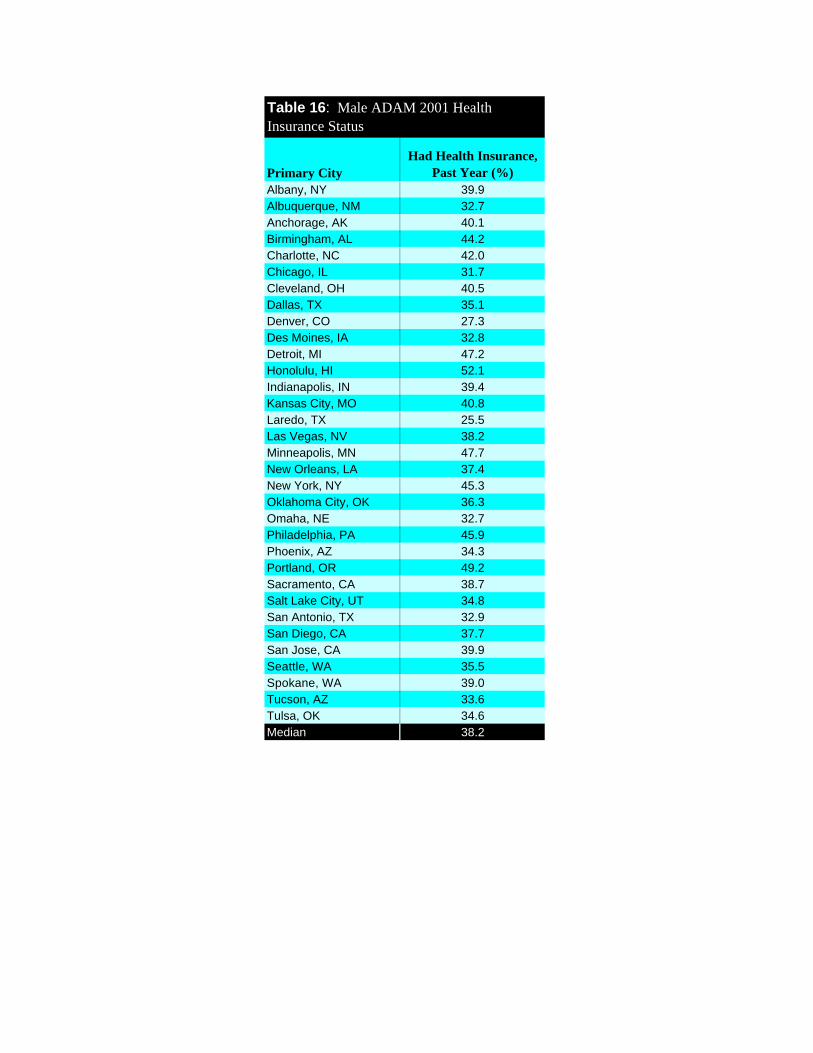
Primary CityHad Health Insurance,
Past Year (%)Albany, NY 39.9Albuquerque, NM 32.7Anchorage, AK 40.1Birmingham, AL 44.2Charlotte, NC 42.0Chicago, IL 31.7Cleveland, OH 40.5Dallas, TX 35.1Denver, CO 27.3Des Moines, IA 32.8Detroit, MI 47.2Honolulu, HI 52.1Indianapolis, IN 39.4Kansas City, MO 40.8Laredo, TX 25.5Las Vegas, NV 38.2Minneapolis, MN 47.7New Orleans, LA 37.4New York, NY 45.3Oklahoma City, OK 36.3Omaha, NE 32.7Philadelphia, PA 45.9Phoenix, AZ 34.3Portland, OR 49.2Sacramento, CA 38.7Salt Lake City, UT 34.8San Antonio, TX 32.9San Diego, CA 37.7San Jose, CA 39.9Seattle, WA 35.5Spokane, WA 39.0Tucson, AZ 33.6Tulsa, OK 34.6Median 38.2
Table 16: Male ADAM 2001 Health Insurance Status
FFeemmaallee AArrrreesstteeee TTaabblleess
Description of SampleDescription of SampleDescription of SampleDescription of Sample
Table 1. ADAM Sites in 2001—Female Sample and Interviews
Table 2. Demographic Characteristics of Female ADAM 2001 Respondents
Drug Test ResultsDrug Test ResultsDrug Test ResultsDrug Test Results
Table 3. Female ADAM 2001—Drug Test Results (NIDA-5 Drugs)
Drug Use Self-ReportsDrug Use Self-ReportsDrug Use Self-ReportsDrug Use Self-Reports
Table 4. Female ADAM 2001—Crack Cocaine Use
Table 5. Female ADAM 2001—Powder Cocaine Use
Table 6. Female ADAM 2001—Marijuana Use
Table 7. Female ADAM 2001—Methamphetamine Use
Table 8. Female ADAM 2001—Opiate Use
Table 9. Female ADAM 2001—Heavy Drug Use and Risk for Dependence
Table 10. Female ADAM 2001—Heavy Alcohol Use and Risk for Dependence
Drug Market BehaviorDrug Market BehaviorDrug Market BehaviorDrug Market Behavior
Table 11. Female ADAM 2001—Drug Acquisition in the Past 30 Days
Table 12. Female ADAM 2001—Last Drug Buy Was Outdoors
Table 13. Female ADAM 2001—Any Failed Drug Purchase in the Past 30 Days
Table 14. Female ADAM 2001—Failed Drug Purchases Due to Police Activity
Treatment & InsuranceTreatment & InsuranceTreatment & InsuranceTreatment & Insurance
Table 15. Female ADAM 2001— Drug Treatment Status
Table 16. Female ADAM 2001—Health Insurance Status
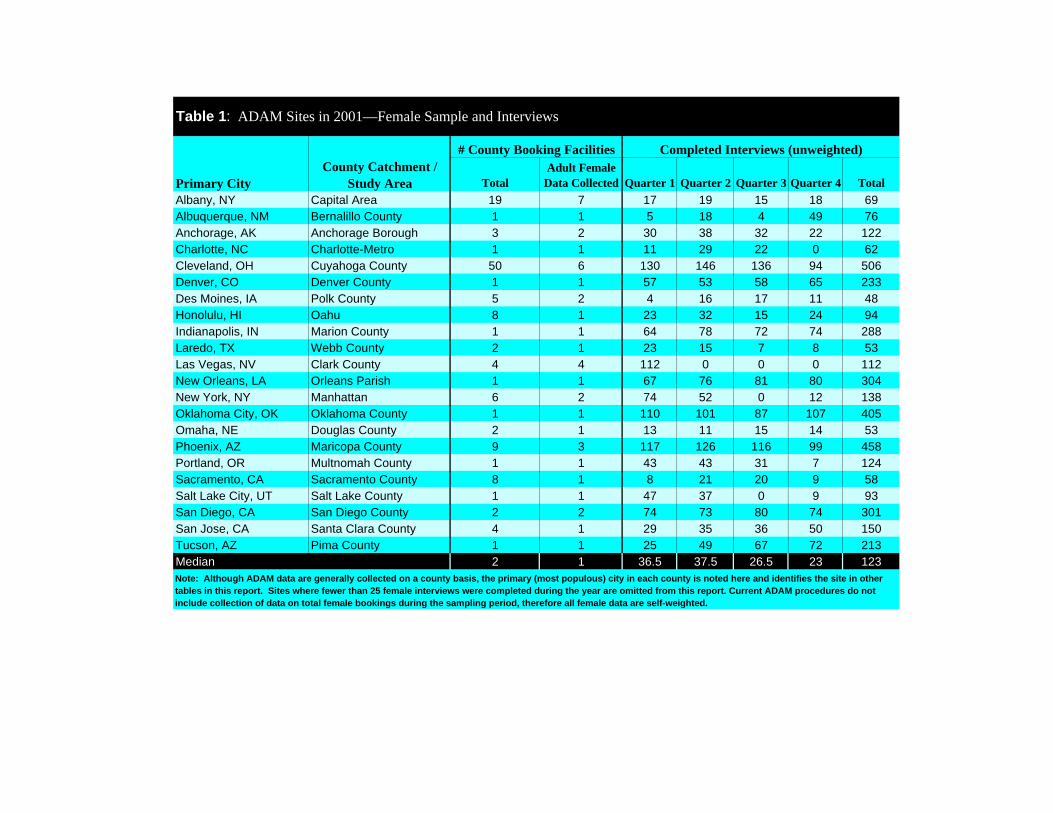
TotalAdult Female
Data Collected Quarter 1 Quarter 2 Quarter 3 Quarter 4 TotalAlbany, NY Capital Area 19 7 17 19 15 18 69Albuquerque, NM Bernalillo County 1 1 5 18 4 49 76Anchorage, AK Anchorage Borough 3 2 30 38 32 22 122Charlotte, NC Charlotte-Metro 1 1 11 29 22 0 62Cleveland, OH Cuyahoga County 50 6 130 146 136 94 506Denver, CO Denver County 1 1 57 53 58 65 233Des Moines, IA Polk County 5 2 4 16 17 11 48Honolulu, HI Oahu 8 1 23 32 15 24 94Indianapolis, IN Marion County 1 1 64 78 72 74 288Laredo, TX Webb County 2 1 23 15 7 8 53Las Vegas, NV Clark County 4 4 112 0 0 0 112New Orleans, LA Orleans Parish 1 1 67 76 81 80 304New York, NY Manhattan 6 2 74 52 0 12 138Oklahoma City, OK Oklahoma County 1 1 110 101 87 107 405Omaha, NE Douglas County 2 1 13 11 15 14 53Phoenix, AZ Maricopa County 9 3 117 126 116 99 458Portland, OR Multnomah County 1 1 43 43 31 7 124Sacramento, CA Sacramento County 8 1 8 21 20 9 58Salt Lake City, UT Salt Lake County 1 1 47 37 0 9 93San Diego, CA San Diego County 2 2 74 73 80 74 301San Jose, CA Santa Clara County 4 1 29 35 36 50 150Tucson, AZ Pima County 1 1 25 49 67 72 213Median 2 1 36.5 37.5 26.5 23 123
Table 1: ADAM Sites in 2001—Female Sample and Interviews
Note: Although ADAM data are generally collected on a county basis, the primary (most populous) city in each county is noted here and identifies the site in other tables in this report. Sites where fewer than 25 female interviews were completed during the year are omitted from this report. Current ADAM procedures do not include collection of data on total female bookings during the sampling period, therefore all female data are self-weighted.
# County Booking Facilities
Primary CityCounty Catchment /
Study Area
Completed Interviews (unweighted)
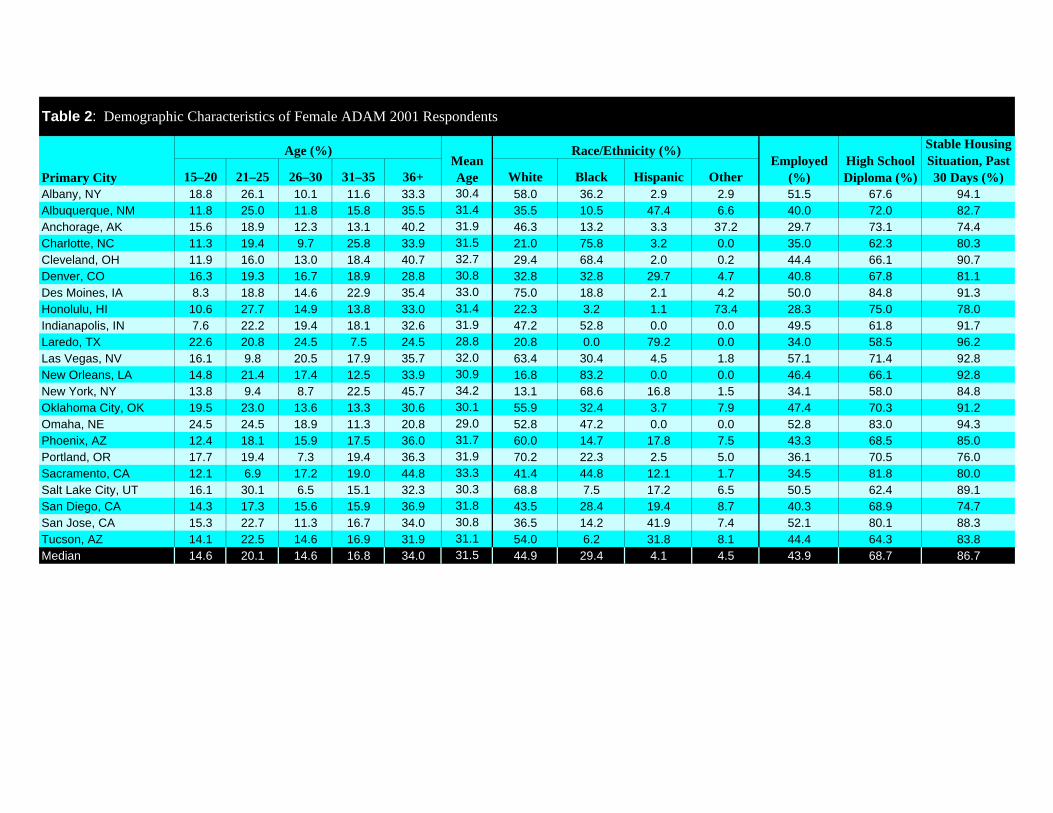
15–20 21–25 26–30 31–35 36+ White Black Hispanic OtherAlbany, NY 18.8 26.1 10.1 11.6 33.3 30.4 58.0 36.2 2.9 2.9 51.5 67.6 94.1Albuquerque, NM 11.8 25.0 11.8 15.8 35.5 31.4 35.5 10.5 47.4 6.6 40.0 72.0 82.7Anchorage, AK 15.6 18.9 12.3 13.1 40.2 31.9 46.3 13.2 3.3 37.2 29.7 73.1 74.4Charlotte, NC 11.3 19.4 9.7 25.8 33.9 31.5 21.0 75.8 3.2 0.0 35.0 62.3 80.3Cleveland, OH 11.9 16.0 13.0 18.4 40.7 32.7 29.4 68.4 2.0 0.2 44.4 66.1 90.7Denver, CO 16.3 19.3 16.7 18.9 28.8 30.8 32.8 32.8 29.7 4.7 40.8 67.8 81.1Des Moines, IA 8.3 18.8 14.6 22.9 35.4 33.0 75.0 18.8 2.1 4.2 50.0 84.8 91.3Honolulu, HI 10.6 27.7 14.9 13.8 33.0 31.4 22.3 3.2 1.1 73.4 28.3 75.0 78.0Indianapolis, IN 7.6 22.2 19.4 18.1 32.6 31.9 47.2 52.8 0.0 0.0 49.5 61.8 91.7Laredo, TX 22.6 20.8 24.5 7.5 24.5 28.8 20.8 0.0 79.2 0.0 34.0 58.5 96.2Las Vegas, NV 16.1 9.8 20.5 17.9 35.7 32.0 63.4 30.4 4.5 1.8 57.1 71.4 92.8New Orleans, LA 14.8 21.4 17.4 12.5 33.9 30.9 16.8 83.2 0.0 0.0 46.4 66.1 92.8New York, NY 13.8 9.4 8.7 22.5 45.7 34.2 13.1 68.6 16.8 1.5 34.1 58.0 84.8Oklahoma City, OK 19.5 23.0 13.6 13.3 30.6 30.1 55.9 32.4 3.7 7.9 47.4 70.3 91.2Omaha, NE 24.5 24.5 18.9 11.3 20.8 29.0 52.8 47.2 0.0 0.0 52.8 83.0 94.3Phoenix, AZ 12.4 18.1 15.9 17.5 36.0 31.7 60.0 14.7 17.8 7.5 43.3 68.5 85.0Portland, OR 17.7 19.4 7.3 19.4 36.3 31.9 70.2 22.3 2.5 5.0 36.1 70.5 76.0Sacramento, CA 12.1 6.9 17.2 19.0 44.8 33.3 41.4 44.8 12.1 1.7 34.5 81.8 80.0Salt Lake City, UT 16.1 30.1 6.5 15.1 32.3 30.3 68.8 7.5 17.2 6.5 50.5 62.4 89.1San Diego, CA 14.3 17.3 15.6 15.9 36.9 31.8 43.5 28.4 19.4 8.7 40.3 68.9 74.7San Jose, CA 15.3 22.7 11.3 16.7 34.0 30.8 36.5 14.2 41.9 7.4 52.1 80.1 88.3Tucson, AZ 14.1 22.5 14.6 16.9 31.9 31.1 54.0 6.2 31.8 8.1 44.4 64.3 83.8Median 14.6 20.1 14.6 16.8 34.0 31.5 44.9 29.4 4.1 4.5 43.9 68.7 86.7
Table 2: Demographic Characteristics of Female ADAM 2001 Respondents
Age (%)Mean AgePrimary City
Employed (%)
High School Diploma (%)
Stable Housing Situation, Past 30 Days (%)
Race/Ethnicity (%)

Cocaine Opiates MarijuanaMetham-
phetamine PCPAny NIDA-
5 DrugMultiple
DrugsAlbany, NY 43.8 12.5 39.6 0.0 2.1 62.5 29.2 71.6Albuquerque, NM 46.2 18.5 24.6 4.6 0.0 66.2 26.2 93.0Anchorage, AK 22.8 8.9 30.7 1.0 0.0 55.4 6.9 87.8Charlotte, NC 63.0 3.7 18.5 0.0 0.0 68.5 16.7 87.1Cleveland, OH 50.0 5.4 27.7 0.2 5.4 70.7 17.1 86.7Denver, CO 45.0 2.4 33.0 4.3 0.0 63.6 19.6 94.7Des Moines, IA 12.5 7.5 40.0 27.5 0.0 60.0 27.5 88.9Honolulu, HI 9.7 4.2 13.9 36.1 0.0 50.0 11.1 80.9Indianapolis, IN 41.2 7.2 37.6 0.7 0.7 67.0 19.4 98.9Laredo, TX 26.5 10.2 14.3 0.0 0.0 34.7 14.3 92.5Las Vegas, NV 26.5 6.1 23.5 15.5 2.0 53.1 18.4 88.3New Orleans, LA 38.1 7.6 25.1 0.0 0.3 56.4 13.7 95.7New York, NY 56.9 13.9 32.1 0.7 1.5 77.4 23.4 99.3Oklahoma City, OK 26.8 3.6 41.0 15.8 2.3 63.6 23.1 97.7Omaha, NE 28.2 7.7 35.9 10.3 0.0 64.1 15.4 73.6Phoenix, AZ 31.6 6.3 26.5 32.3 1.7 72.3 22.9 92.7Portland, OR 37.2 21.2 23.9 20.4 0.9 72.6 24.8 91.9Sacramento, CA 29.8 10.6 27.7 42.6 0.0 80.9 27.7 85.5Salt Lake City, UT 21.7 15.9 18.8 18.8 0.0 49.3 23.2 76.1San Diego, CA 16.5 8.6 27.7 37.4 1.1 66.9 21.9 93.0San Jose, CA 14.6 6.5 34.1 38.2 4.1 70.7 23.6 87.0Tucson, AZ 35.4 10.3 28.7 12.4 0.0 57.9 24.1 92.9Median 30.7 7.7 27.7 11.4 0.2 63.9 22.4 90.4*These five drugs are the "NIDA-5 drugs", established by NIDA as a standard test panel of commonly used illegal drugs. They are the drugs analyzed in this report.
Table 3: Female ADAM 2001—Drug Test Results (NIDA-5 Drugs)
Interviews With Completed
Urine Tests (%)Primary City
Percentage of Arrestees Testing Positive For:*
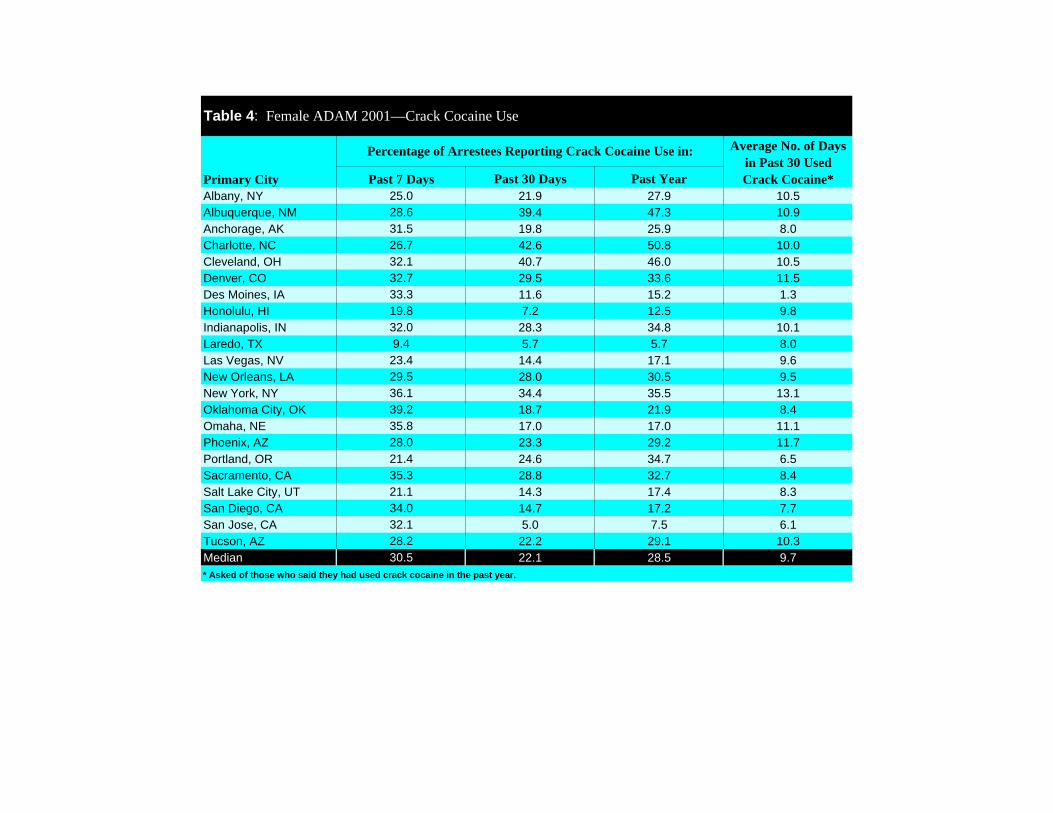
Past 7 Days Past 30 Days Past YearAlbany, NY 25.0 21.9 27.9 10.5Albuquerque, NM 28.6 39.4 47.3 10.9Anchorage, AK 31.5 19.8 25.9 8.0Charlotte, NC 26.7 42.6 50.8 10.0Cleveland, OH 32.1 40.7 46.0 10.5Denver, CO 32.7 29.5 33.6 11.5Des Moines, IA 33.3 11.6 15.2 1.3Honolulu, HI 19.8 7.2 12.5 9.8Indianapolis, IN 32.0 28.3 34.8 10.1Laredo, TX 9.4 5.7 5.7 8.0Las Vegas, NV 23.4 14.4 17.1 9.6New Orleans, LA 29.5 28.0 30.5 9.5New York, NY 36.1 34.4 35.5 13.1Oklahoma City, OK 39.2 18.7 21.9 8.4Omaha, NE 35.8 17.0 17.0 11.1Phoenix, AZ 28.0 23.3 29.2 11.7Portland, OR 21.4 24.6 34.7 6.5Sacramento, CA 35.3 28.8 32.7 8.4Salt Lake City, UT 21.1 14.3 17.4 8.3San Diego, CA 34.0 14.7 17.2 7.7San Jose, CA 32.1 5.0 7.5 6.1Tucson, AZ 28.2 22.2 29.1 10.3Median 30.5 22.1 28.5 9.7* Asked of those who said they had used crack cocaine in the past year.
Percentage of Arrestees Reporting Crack Cocaine Use in:
Table 4: Female ADAM 2001—Crack Cocaine Use
Average No. of Days in Past 30 Used Crack Cocaine*Primary City

Past 7 Days Past 30 Days Past YearAlbany, NY 9.5 12.5 14.7 1.9Albuquerque, NM 5.8 15.9 23.3 3.7Anchorage, AK 4.5 11.6 25.2 3.1Charlotte, NC 10.2 11.7 16.4 6.3Cleveland, OH 4.9 8.8 14.3 4.2Denver, CO 8.4 11.9 17.7 5.5Des Moines, IA 0.0 2.3 2.2 0.4Honolulu, HI 2.4 2.4 2.2 0.4Indianapolis, IN 3.6 6.7 14.2 6.1Laredo, TX 17.0 17.0 17.0 8.3Las Vegas, NV 5.5 5.5 8.2 4.9New Orleans, LA 4.7 5.7 8.3 9.8New York, NY 13.0 16.8 18.8 7.7Oklahoma City, OK 5.9 8.0 11.2 4.7Omaha, NE 1.9 1.9 7.5 12.0Phoenix, AZ 6.9 9.6 15.7 3.6Portland, OR 11.9 14.4 20.7 5.5Sacramento, CA 1.9 1.9 7.3 3.2Salt Lake City, UT 12.1 12.1 19.8 4.5San Diego, CA 2.4 3.4 8.1 3.6San Jose, CA 5.0 6.4 9.6 2.7Tucson, AZ 11.6 17.5 27.3 5.2Median 5.7 9.2 14.5 4.6* Asked of those who said they had used powder cocaine in the past year.
Percentage of Arrestees Reporting Powder Cocaine Use in:
Table 5: Female ADAM 2001—Powder Cocaine Use
Average No. of Days in Past 30 Used
Powder Cocaine*Primary City

Past 7 Days Past 30 Days Past YearAlbany, NY 5.7 26.6 38.2 9.7Albuquerque, NM 12.3 38.6 44.6 9.4Anchorage, AK 12.6 32.4 46.1 8.2Charlotte, NC 13.7 31.1 45.0 8.2Cleveland, OH 14.5 41.4 48.2 7.7Denver, CO 16.0 40.4 48.3 8.3Des Moines, IA 17.6 39.5 45.7 6.2Honolulu, HI 8.5 28.9 32.6 8.7Indianapolis, IN 14.0 38.5 46.9 9.6Laredo, TX 2.0 9.4 11.3 7.4Las Vegas, NV 6.6 30.6 35.8 10.2New Orleans, LA 10.5 34.8 42.6 9.4New York, NY 10.5 40.0 44.2 12.2Oklahoma City, OK 15.4 46.2 51.9 9.3Omaha, NE 10.5 39.6 43.4 11.0Phoenix, AZ 12.7 37.2 46.2 6.6Portland, OR 8.9 30.5 38.8 6.8Sacramento, CA 17.5 42.3 52.7 7.4Salt Lake City, UT 10.1 26.4 37.0 5.8San Diego, CA 13.5 40.8 45.5 8.6San Jose, CA 11.2 36.9 45.5 9.0Tucson, AZ 10.0 34.7 41.3 10.2Median 11.8 37.1 44.8 8.7* Asked of those who said they had used marijuana in the past year.
Percentage of Arrestees Reporting Marijuana Use in:
Table 6: Female ADAM 2001—Marijuana Use
Average No. of Days in Past 30 Used
Marijuana*Primary City

Past 7 Days Past 30 Days Past YearAlbany, NY 0.0 1.6 1.5 0.0Albuquerque, NM 2.9 8.8 17.6 6.3Anchorage, AK 0.9 1.8 3.4 7.1Charlotte, NC 0.0 0.0 1.6 21.5Cleveland, OH 0.2 0.6 1.0 3.0Denver, CO 4.8 7.0 10.8 7.5Des Moines, IA 16.7 20.9 26.7 7.0Honolulu, HI 29.3 32.5 44.3 8.9Indianapolis, IN 1.4 1.8 3.1 7.6Laredo, TX 0.0 0.0 0.0 0.0Las Vegas, NV 8.2 10.0 17.0 9.7New Orleans, LA 0.0 1.0 1.0 1.1New York, NY 0.0 0.0 0.0 0.0Oklahoma City, OK 12.6 14.7 19.9 8.6Omaha, NE 7.5 9.4 11.3 3.4Phoenix, AZ 24.5 28.9 34.2 9.6Portland, OR 20.5 28.8 36.4 8.6Sacramento, CA 37.0 42.6 45.5 9.4Salt Lake City, UT 16.7 19.8 29.3 11.2San Diego, CA 30.4 33.1 38.4 9.2San Jose, CA 35.0 38.2 45.5 8.5Tucson, AZ 9.6 11.2 19.9 9.0Median 7.9 9.7 17.3 8.1* Asked of those who said they had used methamphetamine in the past year.
Percentage of Arrestees Reporting Methamphetamine Use in:
Table 7: Female ADAM 2001—Methamphetamine Use
Average No. of Days in Past 30 Used
Methamphetamine*Primary City
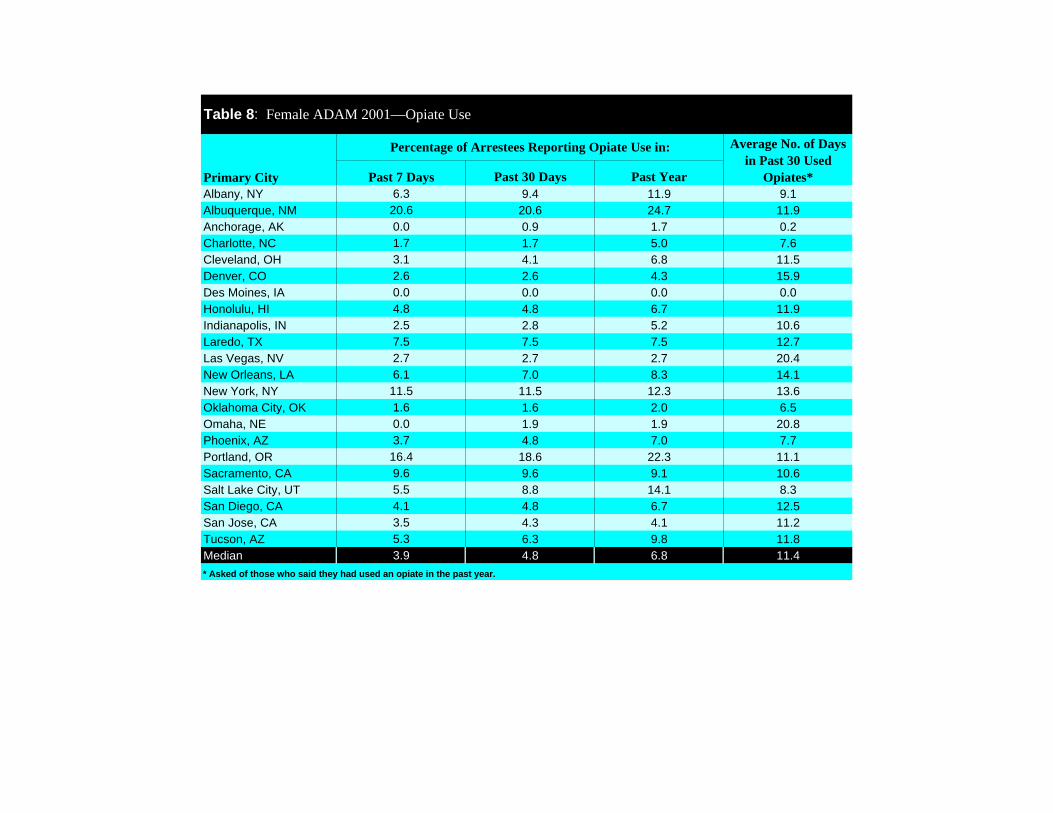
Past 7 Days Past 30 Days Past YearAlbany, NY 6.3 9.4 11.9 9.1Albuquerque, NM 20.6 20.6 24.7 11.9Anchorage, AK 0.0 0.9 1.7 0.2Charlotte, NC 1.7 1.7 5.0 7.6Cleveland, OH 3.1 4.1 6.8 11.5Denver, CO 2.6 2.6 4.3 15.9Des Moines, IA 0.0 0.0 0.0 0.0Honolulu, HI 4.8 4.8 6.7 11.9Indianapolis, IN 2.5 2.8 5.2 10.6Laredo, TX 7.5 7.5 7.5 12.7Las Vegas, NV 2.7 2.7 2.7 20.4New Orleans, LA 6.1 7.0 8.3 14.1New York, NY 11.5 11.5 12.3 13.6Oklahoma City, OK 1.6 1.6 2.0 6.5Omaha, NE 0.0 1.9 1.9 20.8Phoenix, AZ 3.7 4.8 7.0 7.7Portland, OR 16.4 18.6 22.3 11.1Sacramento, CA 9.6 9.6 9.1 10.6Salt Lake City, UT 5.5 8.8 14.1 8.3San Diego, CA 4.1 4.8 6.7 12.5San Jose, CA 3.5 4.3 4.1 11.2Tucson, AZ 5.3 6.3 9.8 11.8Median 3.9 4.8 6.8 11.4* Asked of those who said they had used an opiate in the past year.
Table 8: Female ADAM 2001—Opiate Use
Percentage of Arrestees Reporting Opiate Use in: Average No. of Days in Past 30 Used
Opiates*Primary City
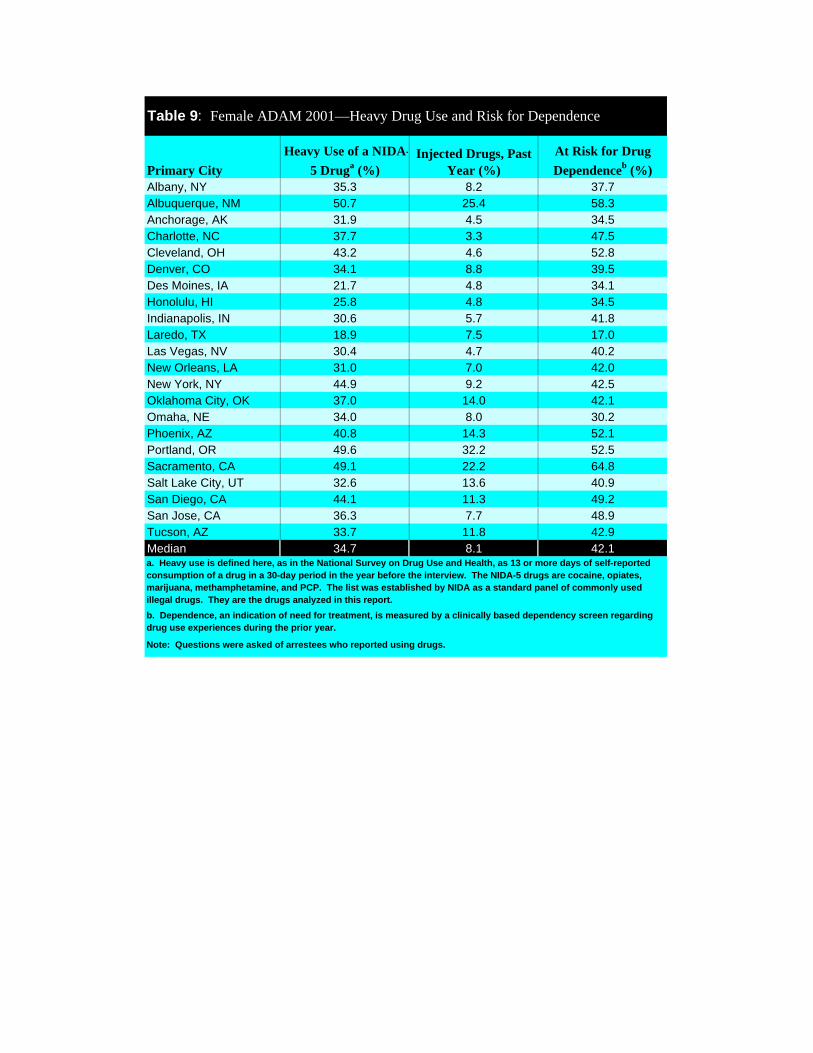
Albany, NY 35.3 8.2 37.7Albuquerque, NM 50.7 25.4 58.3Anchorage, AK 31.9 4.5 34.5Charlotte, NC 37.7 3.3 47.5Cleveland, OH 43.2 4.6 52.8Denver, CO 34.1 8.8 39.5Des Moines, IA 21.7 4.8 34.1Honolulu, HI 25.8 4.8 34.5Indianapolis, IN 30.6 5.7 41.8Laredo, TX 18.9 7.5 17.0Las Vegas, NV 30.4 4.7 40.2New Orleans, LA 31.0 7.0 42.0New York, NY 44.9 9.2 42.5Oklahoma City, OK 37.0 14.0 42.1Omaha, NE 34.0 8.0 30.2Phoenix, AZ 40.8 14.3 52.1Portland, OR 49.6 32.2 52.5Sacramento, CA 49.1 22.2 64.8Salt Lake City, UT 32.6 13.6 40.9San Diego, CA 44.1 11.3 49.2San Jose, CA 36.3 7.7 48.9Tucson, AZ 33.7 11.8 42.9Median 34.7 8.1 42.1
Table 9: Female ADAM 2001—Heavy Drug Use and Risk for Dependence
a. Heavy use is defined here, as in the National Survey on Drug Use and Health, as 13 or more days of self-reported consumption of a drug in a 30-day period in the year before the interview. The NIDA-5 drugs are cocaine, opiates, marijuana, methamphetamine, and PCP. The list was established by NIDA as a standard panel of commonly used illegal drugs. They are the drugs analyzed in this report.
b. Dependence, an indication of need for treatment, is measured by a clinically based dependency screen regarding drug use experiences during the prior year.
Note: Questions were asked of arrestees who reported using drugs.
Heavy Use of a NIDA-5 Druga (%)
Injected Drugs, Past Year (%)
At Risk for Drug Dependenceb (%)Primary City
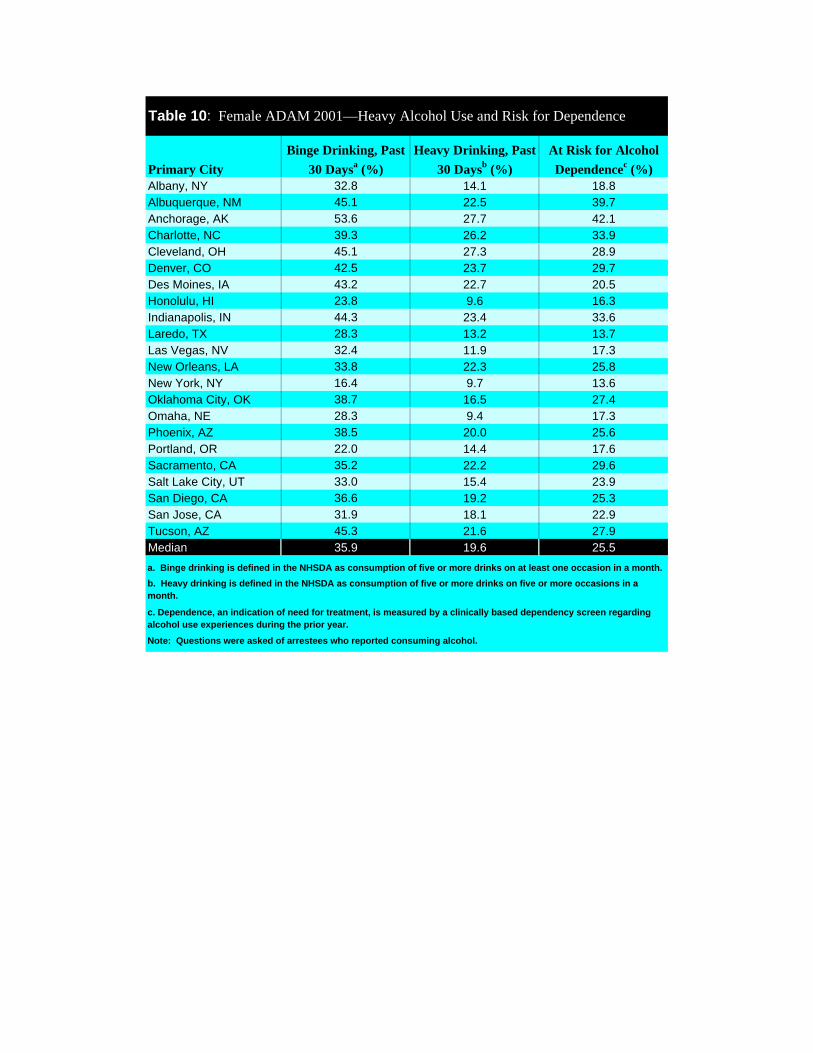
Albany, NY 32.8 14.1 18.8Albuquerque, NM 45.1 22.5 39.7Anchorage, AK 53.6 27.7 42.1Charlotte, NC 39.3 26.2 33.9Cleveland, OH 45.1 27.3 28.9Denver, CO 42.5 23.7 29.7Des Moines, IA 43.2 22.7 20.5Honolulu, HI 23.8 9.6 16.3Indianapolis, IN 44.3 23.4 33.6Laredo, TX 28.3 13.2 13.7Las Vegas, NV 32.4 11.9 17.3New Orleans, LA 33.8 22.3 25.8New York, NY 16.4 9.7 13.6Oklahoma City, OK 38.7 16.5 27.4Omaha, NE 28.3 9.4 17.3Phoenix, AZ 38.5 20.0 25.6Portland, OR 22.0 14.4 17.6Sacramento, CA 35.2 22.2 29.6Salt Lake City, UT 33.0 15.4 23.9San Diego, CA 36.6 19.2 25.3San Jose, CA 31.9 18.1 22.9Tucson, AZ 45.3 21.6 27.9Median 35.9 19.6 25.5
Table 10: Female ADAM 2001—Heavy Alcohol Use and Risk for Dependence
Binge Drinking, Past 30 Daysa (%)
Heavy Drinking, Past 30 Daysb (%)
At Risk for Alcohol Dependencec (%)Primary City
Note: Questions were asked of arrestees who reported consuming alcohol.
a. Binge drinking is defined in the NHSDA as consumption of five or more drinks on at least one occasion in a month.
b. Heavy drinking is defined in the NHSDA as consumption of five or more drinks on five or more occasions in a month.
c. Dependence, an indication of need for treatment, is measured by a clinically based dependency screen regarding alcohol use experiences during the prior year.
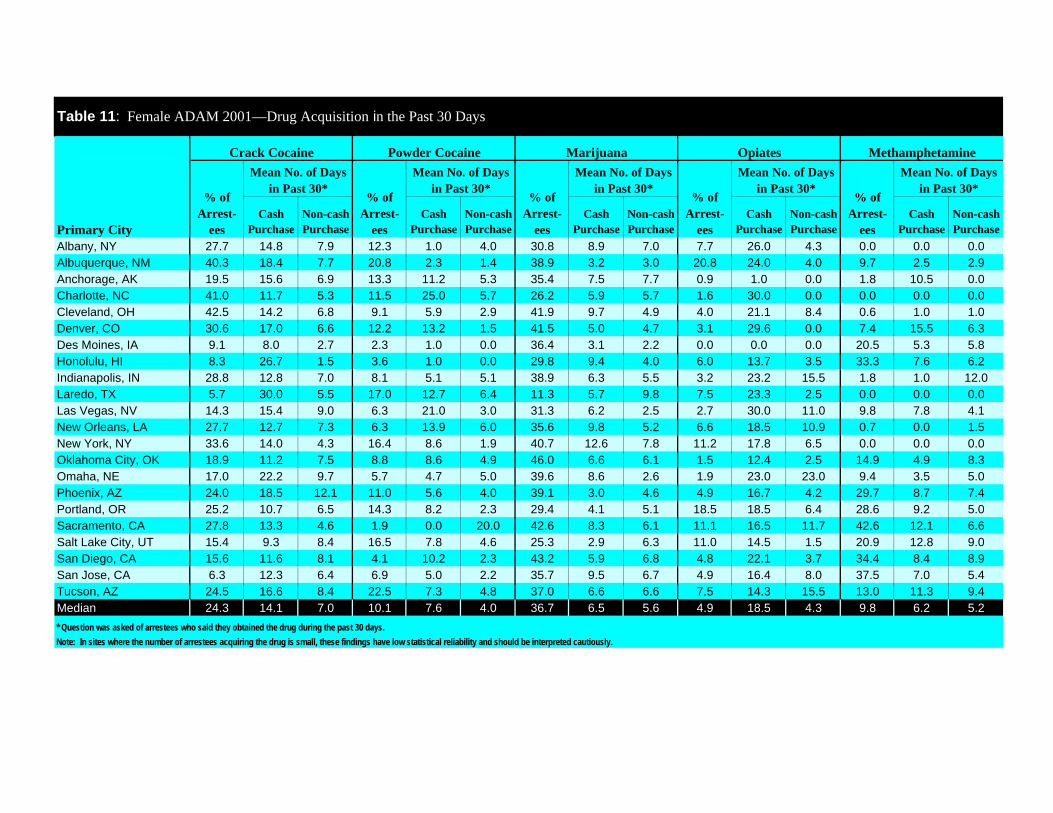
Cash Purchase
Non-cash Purchase
Cash Purchase
Non-cash Purchase
Cash Purchase
Non-cash Purchase
Cash Purchase
Non-cash Purchase
Cash Purchase
Non-cash Purchase
Albany, NY 27.7 14.8 7.9 12.3 1.0 4.0 30.8 8.9 7.0 7.7 26.0 4.3 0.0 0.0 0.0Albuquerque, NM 40.3 18.4 7.7 20.8 2.3 1.4 38.9 3.2 3.0 20.8 24.0 4.0 9.7 2.5 2.9Anchorage, AK 19.5 15.6 6.9 13.3 11.2 5.3 35.4 7.5 7.7 0.9 1.0 0.0 1.8 10.5 0.0Charlotte, NC 41.0 11.7 5.3 11.5 25.0 5.7 26.2 5.9 5.7 1.6 30.0 0.0 0.0 0.0 0.0Cleveland, OH 42.5 14.2 6.8 9.1 5.9 2.9 41.9 9.7 4.9 4.0 21.1 8.4 0.6 1.0 1.0Denver, CO 30.6 17.0 6.6 12.2 13.2 1.5 41.5 5.0 4.7 3.1 29.6 0.0 7.4 15.5 6.3Des Moines, IA 9.1 8.0 2.7 2.3 1.0 0.0 36.4 3.1 2.2 0.0 0.0 0.0 20.5 5.3 5.8Honolulu, HI 8.3 26.7 1.5 3.6 1.0 0.0 29.8 9.4 4.0 6.0 13.7 3.5 33.3 7.6 6.2Indianapolis, IN 28.8 12.8 7.0 8.1 5.1 5.1 38.9 6.3 5.5 3.2 23.2 15.5 1.8 1.0 12.0Laredo, TX 5.7 30.0 5.5 17.0 12.7 6.4 11.3 5.7 9.8 7.5 23.3 2.5 0.0 0.0 0.0Las Vegas, NV 14.3 15.4 9.0 6.3 21.0 3.0 31.3 6.2 2.5 2.7 30.0 11.0 9.8 7.8 4.1New Orleans, LA 27.7 12.7 7.3 6.3 13.9 6.0 35.6 9.8 5.2 6.6 18.5 10.9 0.7 0.0 1.5New York, NY 33.6 14.0 4.3 16.4 8.6 1.9 40.7 12.6 7.8 11.2 17.8 6.5 0.0 0.0 0.0Oklahoma City, OK 18.9 11.2 7.5 8.8 8.6 4.9 46.0 6.6 6.1 1.5 12.4 2.5 14.9 4.9 8.3Omaha, NE 17.0 22.2 9.7 5.7 4.7 5.0 39.6 8.6 2.6 1.9 23.0 23.0 9.4 3.5 5.0Phoenix, AZ 24.0 18.5 12.1 11.0 5.6 4.0 39.1 3.0 4.6 4.9 16.7 4.2 29.7 8.7 7.4Portland, OR 25.2 10.7 6.5 14.3 8.2 2.3 29.4 4.1 5.1 18.5 18.5 6.4 28.6 9.2 5.0Sacramento, CA 27.8 13.3 4.6 1.9 0.0 20.0 42.6 8.3 6.1 11.1 16.5 11.7 42.6 12.1 6.6Salt Lake City, UT 15.4 9.3 8.4 16.5 7.8 4.6 25.3 2.9 6.3 11.0 14.5 1.5 20.9 12.8 9.0San Diego, CA 15.6 11.6 8.1 4.1 10.2 2.3 43.2 5.9 6.8 4.8 22.1 3.7 34.4 8.4 8.9San Jose, CA 6.3 12.3 6.4 6.9 5.0 2.2 35.7 9.5 6.7 4.9 16.4 8.0 37.5 7.0 5.4Tucson, AZ 24.5 16.6 8.4 22.5 7.3 4.8 37.0 6.6 6.6 7.5 14.3 15.5 13.0 11.3 9.4Median 24.3 14.1 7.0 10.1 7.6 4.0 36.7 6.5 5.6 4.9 18.5 4.3 9.8 6.2 5.2
Table 11: Female ADAM 2001—Drug Acquisition in the Past 30 Days
MethamphetamineOpiatesMarijuanaPowder CocaineCrack Cocaine
Primary City
% of Arrest-
ees
Mean No. of Days in Past 30*
* Question was asked of arrestees who said they obtained the drug during the past 30 days.
Mean No. of Days in Past 30*
% of Arrest-
ees
Note: In sites where the number of arrestees acquiring the drug is small, these findings have low statistical reliability and should be interpreted cautiously.
Mean No. of Days in Past 30*
% of Arrest-
ees
Mean No. of Days in Past 30*
% of Arrest-
ees
% of Arrest-
ees
Mean No. of Days in Past 30*
Marijuana Crack Cocaine Powder Cocaine OpiatesMethamphet-
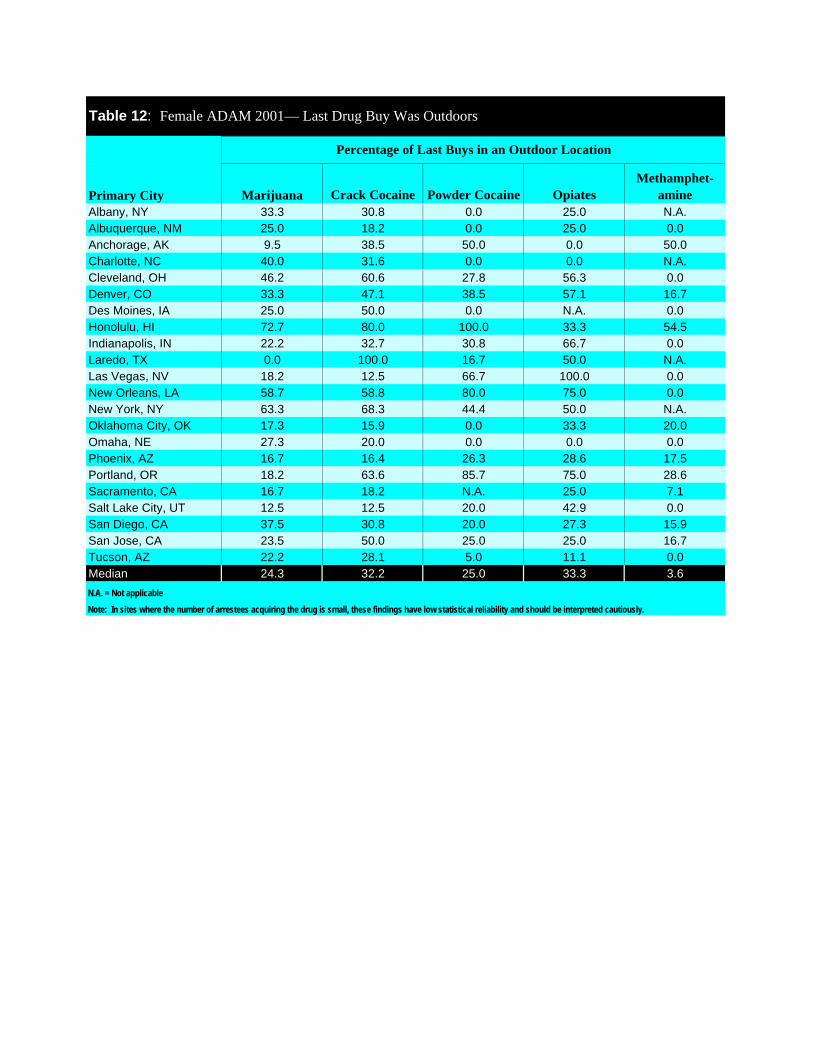
amineAlbany, NY 33.3 30.8 0.0 25.0 N.A.Albuquerque, NM 25.0 18.2 0.0 25.0 0.0Anchorage, AK 9.5 38.5 50.0 0.0 50.0Charlotte, NC 40.0 31.6 0.0 0.0 N.A.Cleveland, OH 46.2 60.6 27.8 56.3 0.0Denver, CO 33.3 47.1 38.5 57.1 16.7Des Moines, IA 25.0 50.0 0.0 N.A. 0.0Honolulu, HI 72.7 80.0 100.0 33.3 54.5Indianapolis, IN 22.2 32.7 30.8 66.7 0.0Laredo, TX 0.0 100.0 16.7 50.0 N.A.Las Vegas, NV 18.2 12.5 66.7 100.0 0.0New Orleans, LA 58.7 58.8 80.0 75.0 0.0New York, NY 63.3 68.3 44.4 50.0 N.A.Oklahoma City, OK 17.3 15.9 0.0 33.3 20.0Omaha, NE 27.3 20.0 0.0 0.0 0.0Phoenix, AZ 16.7 16.4 26.3 28.6 17.5Portland, OR 18.2 63.6 85.7 75.0 28.6Sacramento, CA 16.7 18.2 N.A. 25.0 7.1Salt Lake City, UT 12.5 12.5 20.0 42.9 0.0San Diego, CA 37.5 30.8 20.0 27.3 15.9San Jose, CA 23.5 50.0 25.0 25.0 16.7Tucson, AZ 22.2 28.1 5.0 11.1 0.0Median 24.3 32.2 25.0 33.3 3.6
Note: In sites where the number of arrestees acquiring the drug is small, these findings have low statistical reliability and should be interpreted cautiously.
N.A. = Not applicable
Table 12: Female ADAM 2001— Last Drug Buy Was Outdoors
Percentage of Last Buys in an Outdoor Location
Primary City
Marijuana Crack Cocaine Powder Cocaine OpiatesMethamphet-
amineAlbany, NY 21.4 46.2 0.0 0.0 N.A.Albuquerque, NM 11.1 34.8 16.7 41.7 0.0Anchorage, AK 71.4 64.3 66.7 0.0 0.0Charlotte, NC 75.0 55.0 0.0 0.0 N.A.Cleveland, OH 42.6 39.5 36.8 50.0 0.0Denver, CO 55.0 46.4 12.5 0.0 50.0Des Moines, IA 71.4 50.0 0.0 N.A. 16.7Honolulu, HI 41.7 40.0 0.0 33.3 47.4Indianapolis, IN 42.0 50.8 35.7 16.7 100.0Laredo, TX 33.3 0.0 33.3 0.0 N.A.Las Vegas, NV 40.0 45.5 33.3 33.3 83.3New Orleans, LA 40.3 36.5 44.4 36.8 0.0New York, NY 15.8 30.2 15.0 8.3 N.A.Oklahoma City, OK 52.9 44.4 25.0 80.0 58.8Omaha, NE 28.6 16.7 0.0 0.0 33.3Phoenix, AZ 28.3 19.3 8.3 25.0 24.2Portland, OR 20.0 21.7 21.4 26.3 41.2Sacramento, CA 25.0 66.7 N.A. 50.0 64.3Salt Lake City, UT 0.0 37.5 33.3 16.7 30.0San Diego, CA 21.6 40.6 40.0 25.0 41.5San Jose, CA 50.0 33.3 40.0 60.0 32.3Tucson, AZ 22.2 32.4 25.0 18.2 25.0Median 36.7 39.8 25.0 25.0 32.8
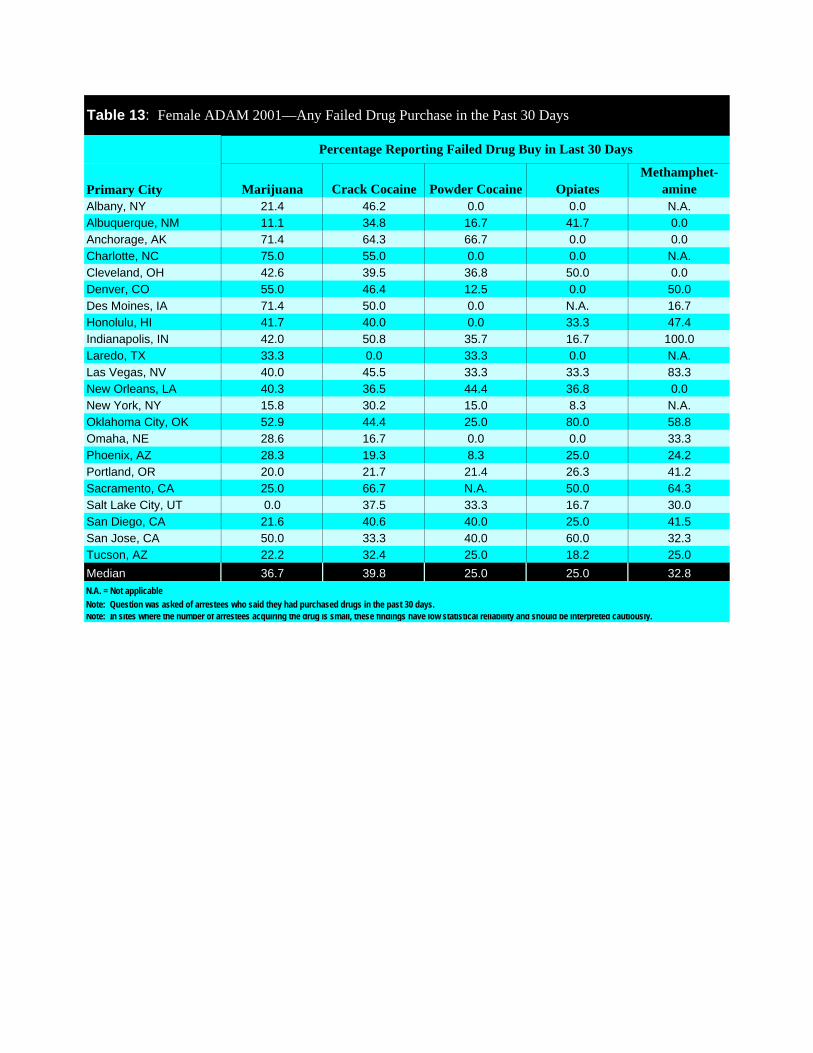
Note: In sites where the number of arrestees acquiring the drug is small, these findings have low statistical reliability and should be interpreted cautiously.Note: Question was asked of arrestees who said they had purchased drugs in the past 30 days.
Table 13: Female ADAM 2001—Any Failed Drug Purchase in the Past 30 Days
N.A. = Not applicable
Percentage Reporting Failed Drug Buy in Last 30 Days
Primary City
Marijuana Crack Cocaine Powder Cocaine OpiatesMethamphet-
amineAlbany, NY 33.3 0.0 N.A. N.A. N.A.Albuquerque, NM 0.0 0.0 0.0 0.0 N.A.Anchorage, AK 0.0 0.0 0.0 N.A. N.A.Charlotte, NC 16.7 10.0 N.A. N.A. N.A.Cleveland, OH 2.3 7.1 14.3 12.5 N.A.Denver, CO 0.0 7.7 0.0 N.A. 0.0Des Moines, IA 0.0 0.0 N.A. N.A. 0.0Honolulu, HI 0.0 0.0 N.A. 0.0 0.0Indianapolis, IN 0.0 6.3 20.0 0.0 0.0Laredo, TX 0.0 N.A. 0.0 N.A. N.A.Las Vegas, NV 0.0 0.0 0.0 0.0 0.0New Orleans, LA 4.0 11.1 25.0 14.3 N.A.New York, NY 33.3 38.5 0.0 100.0 N.A.Oklahoma City, OK 2.8 0.0 25.0 0.0 10.0Omaha, NE 0.0 0.0 N.A. N.A. 0.0Phoenix, AZ 16.7 25.0 0.0 66.7 12.5Portland, OR 50.0 20.0 0.0 0.0 0.0Sacramento, CA 0.0 0.0 N.A. 0.0 0.0Salt Lake City, UT N.A. 0.0 0.0 0.0 0.0San Diego, CA 0.0 7.7 0.0 33.3 4.5San Jose, CA 0.0 50.0 0.0 0.0 0.0Tucson, AZ 0.0 9.1 0.0 0.0 0.0Median 0.0 6.3 0.0 0.0 0.0
Note: In sites where the number of arrestees acquiring the drug is small, these findings have low statistical reliability and should be interpreted cautiously.
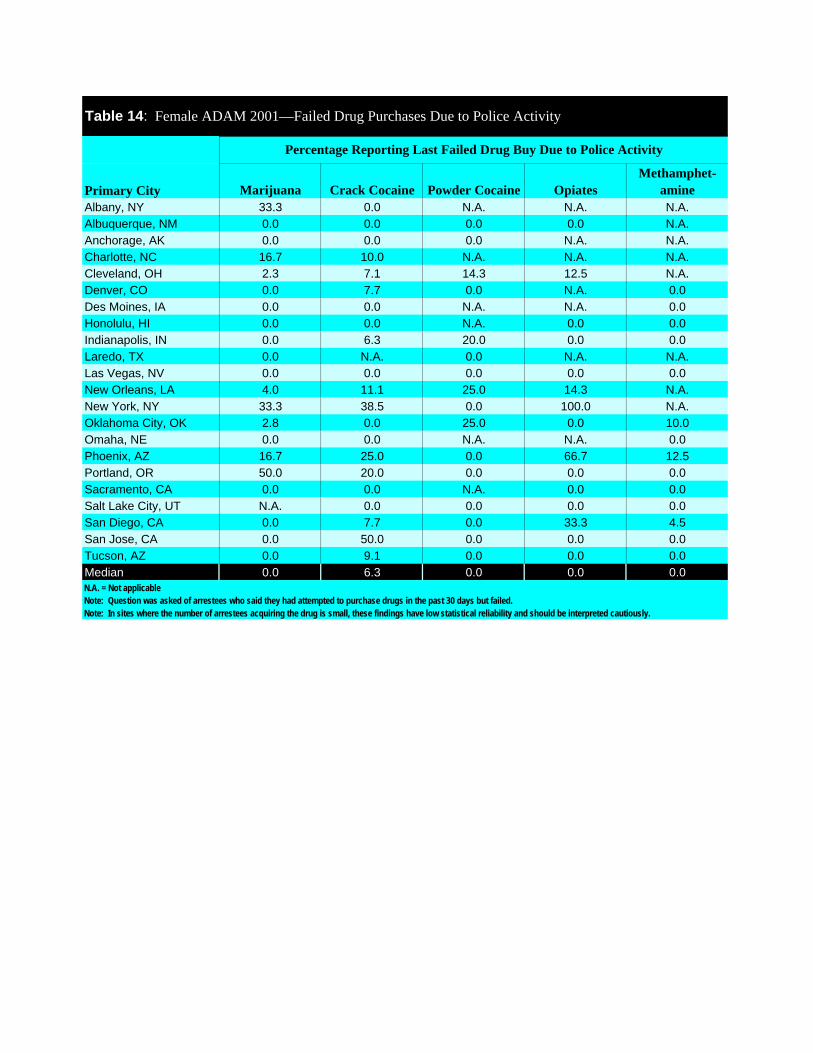
Table 14: Female ADAM 2001—Failed Drug Purchases Due to Police Activity
Note: Question was asked of arrestees who said they had attempted to purchase drugs in the past 30 days but failed.N.A. = Not applicable
Percentage Reporting Last Failed Drug Buy Due to Police Activity
Primary City

Primary CityTreated* in Past Year
(%)Albany, NY 19.7Albuquerque, NM 16.0Anchorage, AK 12.1Charlotte, NC 27.9Cleveland, OH 14.9Denver, CO 15.9Des Moines, IA 15.2Honolulu, HI 8.9Indianapolis, IN 10.4Laredo, TX 5.7Las Vegas, NV 7.2New Orleans, LA 6.9New York, NY 11.9Oklahoma City, OK 9.3Omaha, NE 7.5Phoenix, AZ 10.2Portland, OR 23.3Sacramento, CA 23.6Salt Lake City, UT 13.2San Diego, CA 14.7San Jose, CA 9.0Tucson, AZ 13.8Median 12.7*Treatment could be inpatient or outpatient.
Table 15: Female ADAM 2001—Drug Treatment Status

Primary CityHad Health Insurance,
Past Year (%)Albany, NY 52.9Albuquerque, NM 41.3Anchorage, AK 38.5Charlotte, NC 42.6Cleveland, OH 48.9Denver, CO 40.9Des Moines, IA 58.7Honolulu, HI 56.5Indianapolis, IN 47.2Laredo, TX 30.2Las Vegas, NV 40.2New Orleans, LA 39.6New York, NY 56.5Oklahoma City, OK 37.3Omaha, NE 55.8Phoenix, AZ 49.6Portland, OR 60.3Sacramento, CA 53.7Salt Lake City, UT 33.3San Diego, CA 44.0San Jose, CA 50.7Tucson, AZ 51.0Median 48.1
Table 16: Female ADAM 2001—Health Insurance Status