Embed Size (px)
Citation preview
Drug Consumption Rooms in EuropeClient experience surveyin Amsterdam and RotterdamJennifer Peacey

1
2
Colophon This report is a product of the European Harm Reduction Network Responsible partner: Regenboog Groep, Amsterdam In partnership with: Lancaster University, UK You can access the manual also at www.eurohrn.eu Author: Jennifer Peacey The European Harm Reduction Network is co-funded by the European Commission, DG Justice, Drug Prevention and Information Programme (DPIP), 2013 – 2014. Neither the European Commission nor any person acting on its behalf is liable for any use made of the information in this publication. Copyrights © 2014 Copyrights remains with the authors and the publisher Regenboog Groep PO Box 10887 1001 EW Amsterdam The Netherlands Phone.: +31 20 5317600 Fax.: +31 20 4203528 [email protected]
3
Contents
Acknowledgements ............................................................................................................................ 4
Abstract ................................................................................................................................................... 5
Introduction ........................................................................................................................................... 6
1 Background ........................................................................................................................................ 7
1.1 The Dutch approach to drug use .................................................................................................................................. 7 1.2 Drug users and society ...................................................................................................................................................... 7 1.3 Key areas for evaluation .................................................................................................................................................. 8 1.4 The Sydney MSIC survey ................................................................................................................................................... 9
2 Methodology ................................................................................................................................... 10
2.1 Mode: personal interview survey .............................................................................................................................. 10 2.2 Analyses ................................................................................................................................................................................ 11 2.3 Limitations .......................................................................................................................................................................... 11
3 Domain 1: demographics .......................................................................................................... 13
3.1 Client characteristics ...................................................................................................................................................... 13 3.2 Drug use account ............................................................................................................................................................. 19 3.3 Opiate substitution therapy ........................................................................................................................................ 23 3.4 DCR attendance ................................................................................................................................................................ 24
4 Domain 2: health support & improvement ....................................................................... 29
4.1 Harm reduction .................................................................................................................................................................. 29 4.2 Overdose ................................................................................................................................................................................ 32
5 Domain 3: DCR client support services ............................................................................... 35
5.1 Facility services and external services ..................................................................................................................... 35 5.2 DCR social workers ............................................................................................................................................................ 36
6 Domain 4: client attitudes and involvement .................................................................... 39
6.1 Rules and sanctions ........................................................................................................................................................... 39 6.2 Public versus private use .................................................................................................................................................. 41
7 Conclusion ....................................................................................................................................... 46
Bibliography ....................................................................................................................................... 48
Appendix – DCR Client Experiences Survey ......................................................................... 52
4
Acknowledgements
Kindest thanks to the following people for their assistance, advice, and support:
Sara Woods, Mandy Geise, Eberhard Schatz, Gillian Lancaster, Fiona Measham, and also to KPMG Australia for their kind permission to adapt the Sydney MSIC audit/evaluation tool.
To my partner and children for their patience, support, and conviction:
Mickey, Jill, and Hannah xx
And to the staff and clients of the drug consumption rooms who participated in this study: without your enthusiasm and willingness to take part, this project would not exist…duizend maal dank!
5
Abstract A summary report on the results of a 101-question survey designed for clients of drug consumption rooms (DCRs). The survey focusses on client health and wellbeing attributes, along with experiences at four integrated DCRs in the Netherlands.
The aim of this study is to establish a standardised data collection tool, which will allow for improved reporting and data analysis in future. It is the aim of this project to eventually introduce the client survey into DCRs across Europe.
The survey is an adaptation of the KPMG service audit of the Sydney MSIC (2010), and provides an interesting contrast to client experiences at the Medically Supervised Injecting Centre in Australia.
This mixed methods study focusses on the following domains: Client demographics, Health support & improvement, DCR client support services, and Client attitudes and involvement. Particular emphasis is placed on harm reduction and public nuisance issues such as overdose awareness, polydrug use, and public drug consumption.
Results indicate that overall, clients at the participating DCRs are an aging population with extensive histories of homelessness who have long standing registration contracts with their local DCR. All clients have a Primary drug history with either heroin or cocaine – several combine the two on a regular basis. Most smoke or inhale their drugs; however there are several (mostly) non-Dutch nationals who inject as their primary route of administration.
There was a significant amount of polydrug use reported; clients possess somewhat low levels of overdose management skills - although the majority can clearly identify overdose hazards and early warning signs, very few reported changes in their own behaviour which would help better control for those risks. High numbers of respondents take opiate substitution therapy (OST) methadone; however the average maintenance doses are lower than expected for successful management of cravings.
Most clients access the DCR at a high rate of frequency, which puts DCR staff in a strong position to engage with a historically challenging population who are often disconnected from services. DCRs provide all clients with access to an in-house social worker – 65% of participants access this service, and most find it helpful in matters including housing or justice issues, and alcohol/drug treatment referrals.
Clients generally report low levels of public drug use, particularly during the hours when DCR facilities are open. Respondents indicated that the main reasons for attending DCR facilities included safety, social interaction, and police avoidance. Clients rely heavily on the social functions of the DCR – many clients who have their own home or other private place to use their drugs still choose to regularly access DCR services and to maintain contact with peers.
This informative report provides a baseline of client characteristics which adds to the limited evidence base on DCR services across Europe.
6
Introduction This report summarises the results of a 2013 survey-based study focussing on the wellbeing and experiences of visitors to drug consumption rooms (DCRs) located in the Netherlands (N.B., the terms “visitor” and “client” are used interchangeably throughout this report). A 101-question survey on quality of life and DCR experience was administered to visitors attending three Amsterdam and one Rotterdam consumption room facilities. The purpose of this study is to develop and introduce a standardised data collection tool. As European data are limited, this report aims to establish a baseline for European consumption rooms.
Survey questions were used to gather data for two purposes: (1) PhD research examining the role low threshold harm reduction services play in the quality of life and wellbeing of people who use drugs, and (2) the development of a robust evaluation and guidance tool to be utilised across European DCRs. The questions discussed and results analysed in this report focus on the latter objective, and were developed in part by using the KPMG audit tool described in ‘NSW Health; Further evaluation of the Medically Supervised Injecting Centre during its extended Trial period (2007-2011) Final Report’ (2010). Although occasional comparisons are drawn between Dutch and Australian DCR populations or facilities for the sake of perspective, the primary emphasis of the study and final report is instructive.
The Sydney Medically Supervised Injecting Centre (MSIC) was established in 2001, at a time when English-language publications on DCRs were virtually non-existent in public health literature (Dolan & Wodak, 1996). However, due in part to the controversial nature of the Sydney MSIC proposal, pre- and post- facility opening research has been extensive. Of course notable exceptions exist (e.g., Nougier & Schatz, 2012; van Laar et al, 2013; Hedrich, Kerr & Dubois-Arber, 2010; Hunt, 2008) which lend themselves to the development of quantitative tools measuring defined DCR outcomes. Despite the ever-increasing number of published empirical studies, overall there is a limited availability of reliable information upon which to base evaluations. This is partly due to low levels of data collection by many consumption rooms on their visitors, which presents a challenge for researchers wishing to develop much-needed quantifiable studies in this area. In this instance, the explicit evaluation protocols established by the Sydney MSIC have provided a useful blueprint for the client study administered in the Netherlands, with adaptations reflecting Dutch service provision and cultural variances.
Funding for this venture has been provided by the European Commission, DG Justice ‘Drug Prevention and Information Programme (DPIP)’, as part of The European Harm Reduction Network (EuroHRN)’s project entitled ‘Drug Consumption Rooms in Europe: evidence and practice’, and is in conjunction with the Rainbow Group (NL), and Lancaster University (UK).
7
1 Background
1.1 The Dutch approach to drug use As this survey was initially designed with Dutch participants in mind, it is necessary to briefly highlight the general characteristics of the Dutch approach to drug use (particularly those drugs considered ‘problematic’ such as heroin or crack cocaine). Historically, the Dutch are firm believers in individual freedom. According to the Netherlands Opium Act (1928, 1976), drugs are divided into Schedules: Schedule I ‘hard’ drugs such as heroin, cocaine, GHB, and ecstasy are those which present unacceptable risk, and Schedule II ‘soft’ drugs such as cannabis products, sleeping pills, and sedatives, which are viewed as less dangerous. These classifications depend upon their potential impact on health and wellbeing. Consequently, drug use is viewed as a health matter much in the same way that tobacco and alcohol use are, and public health is the starting point of drug policy in the Netherlands (Boekhout van Solinge, 1999; EMCDDA, 2012).
According to the drug policy letter published in May 2011, under Prime Minister Mark Rutte’s administration, the two pillars of the Dutch drug policy are the protection of public health, and combating public nuisance and organised crime (Ysa et al, 2014). Drug use itself is not viewed as a crime; there is a strong focus on tolerance and support for problematic drug users, which includes behavioural interventions and treatment provision. Recent political trends suggest an increasingly authoritarian approach towards drugs than witnessed in the past; broadly speaking, however, the government generally abstains from too much involvement in issues relating to personal choice or autonomy (Garretsen, 2010).
1.2 Drug users and society In Dutch society, drug use is treated according to a normalisation model of social control – this is in contrast to most other countries which employ a deterrence-based model (Boekhout van Solinge, 1999). The Dutch approach recognises that hiding negative social developments such as drug use can result in situations where influencing change or controlling outcomes can be far more difficult.
Research shows that DCRs are a pragmatic approach aimed at reducing harm to users, minimising the spread of infectious diseases such as HIV and hepatitis C, and lessening public nuisance (Hedrich, 2004; Joseph Rowntree Foundation, 2006; KPMG, 2010; Nougier & Schatz, 2012). The first official DCR opened in the Netherlands in 1994; in 2010, there were 37 facilities across 25 cities (Havinga & Van der Poel, 2012, as quoted in Van Laar, et al 2013: 87-88). During the last decade, social and political changes have led to an alteration in the locations of and population accessing DCRs, and the number of DCRs have decreased. One reason for this decline may be the falling rates of new injecting drug initiates coinciding with an aging injecting drug population in the Netherlands. Another factor in the reduction of DCR attendance has been the allocation of social housing facilities to homeless drug users, which has reduced street level drug use and the associated nuisance (ibid). Whilst these reductions are beneficial to society as a whole, it is important to underscore the fact that several hundred long-term, hard-to-reach ‘problematic’ drug users continue to access DCRs on a regular basis, without which they would lose their established social and professional support networks.
8
Colloquial knowledge suggests that DCRs provide a vital role in reinforcing the view that drug use is a “normal social problem”, and in doing so, helps improve health and wellbeing by lessening the isolation and stigma often felt by people who use drugs. The development of a standardised tool for measuring these views is imperative, as the continued support and funding of established DCRs, and the opening of new consumption rooms in other localities, relies on a robust evidence base.
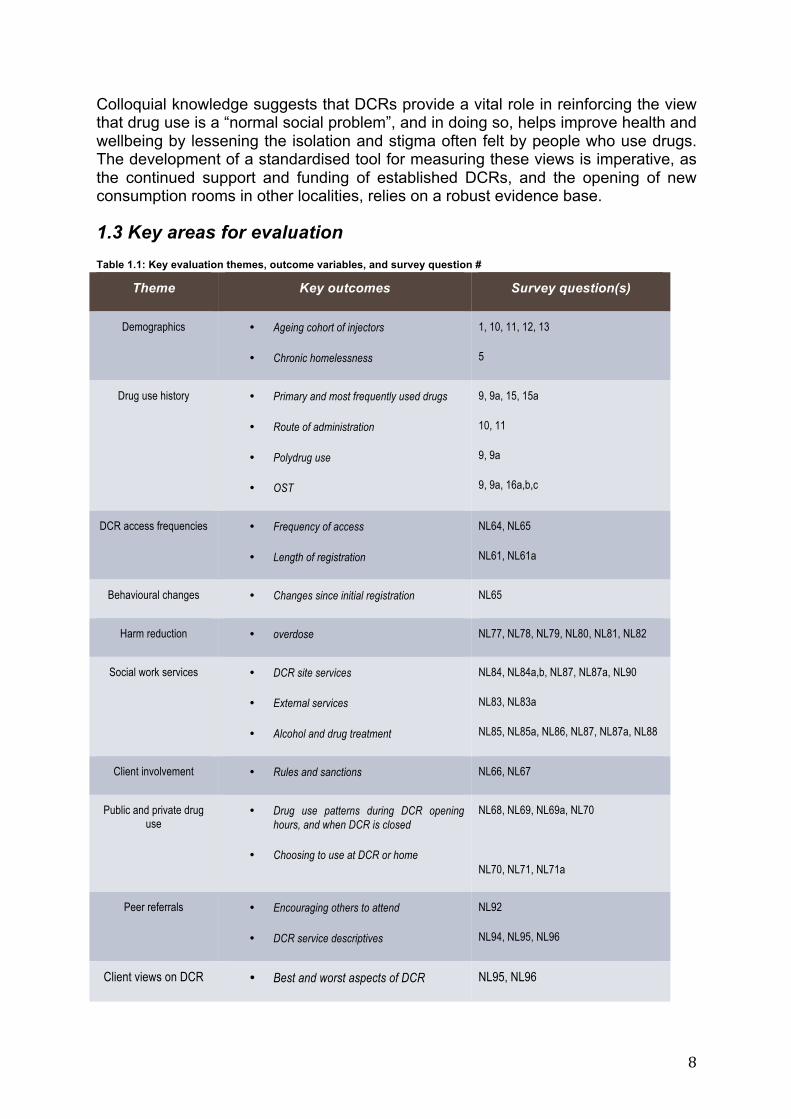
1.3 Key areas for evaluation Table 1.1: Key evaluation themes, outcome variables, and survey question #
Theme Key outcomes Survey question(s)
Demographics • Ageing cohort of injectors
• Chronic homelessness
1, 10, 11, 12, 13
5
Drug use history • Primary and most frequently used drugs
• Route of administration
• Polydrug use
• OST
9, 9a, 15, 15a
10, 11
9, 9a
9, 9a, 16a,b,c
DCR access frequencies • Frequency of access
• Length of registration
NL64, NL65
NL61, NL61a
Behavioural changes • Changes since initial registration NL65
Harm reduction • overdose NL77, NL78, NL79, NL80, NL81, NL82
Social work services • DCR site services
• External services
• Alcohol and drug treatment
NL84, NL84a,b, NL87, NL87a, NL90
NL83, NL83a
NL85, NL85a, NL86, NL87, NL87a, NL88
Client involvement • Rules and sanctions NL66, NL67
Public and private drug use
• Drug use patterns during DCR opening hours, and when DCR is closed
• Choosing to use at DCR or home
NL68, NL69, NL69a, NL70
NL70, NL71, NL71a
Peer referrals • Encouraging others to attend
• DCR service descriptives
NL92
NL94, NL95, NL96
Client views on DCR • Best and worst aspects of DCR NL95, NL96
9
1.4 The Sydney MSIC survey This segment report of the Drug Consumption Rooms in Europe study is modelled upon prior research conducted on behalf of NSW Health (Australia). In 2001, after extensive research into European DCR models, Australia commenced a time-limited Trial of the MSIC in Kings Cross, Sydney (Dolan et al, 2000). The final report on the MSIC, ‘Further evaluation of the Medically Supervised Injecting Centre during its extended Trial period (2007-2011)’ was published in 2010. The primary aims of the final report were to evaluate the effectiveness and efficiency of the MSIC from 2007, when the Trial was extended, and to build on the findings of previous evaluations examining the four primary objectives of the Trial:
• Decrease drug overdose deaths • Provide a gateway to drug treatment and counselling • Reduce problems with public injecting and discarded needles and/or syringes • Reduce the spread of diseases such as HIV and hepatitis C
As firstly noted in the accompanying Correlation Network ‘Organisational Overview’ report (Woods, 2014), the majority of European DCR data is published in grey literature rather than academic fora or public-domain guidance. As many of the overall aims of the MSIC evaluation correspond with European project aims, it was reasonable to use the MSIC report as a model for the survey instrument created for this ‘Drug Consumption Rooms in Europe: client experiences’ report. This venture will work towards establishing a strong foundation of monitoring tools and data for future European studies.
10
2 Methodology
2.1 Mode: personal interview survey The study used a mixed methods approach for collecting data: both qualitative and quantitative methodologies were implemented to both fit the requirements for building a robust and informative data collection tool, and to provide a baseline of responses to the extensive range of questions for future comparison.
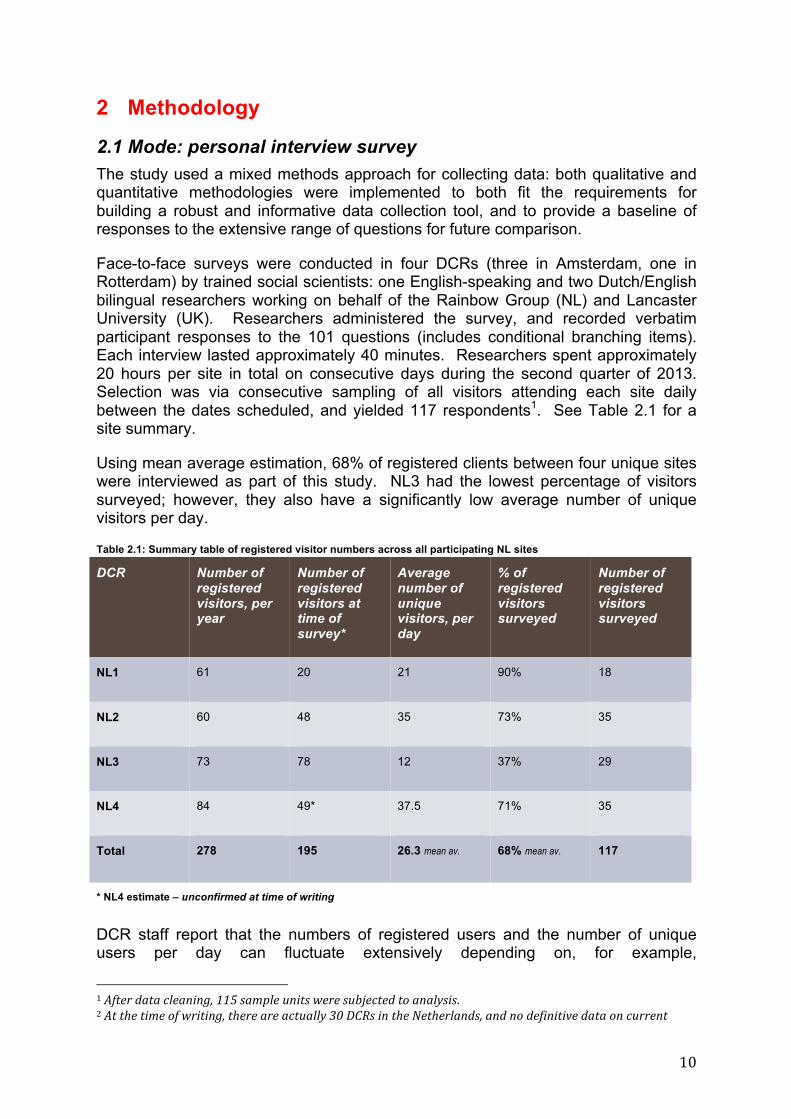
Face-to-face surveys were conducted in four DCRs (three in Amsterdam, one in Rotterdam) by trained social scientists: one English-speaking and two Dutch/English bilingual researchers working on behalf of the Rainbow Group (NL) and Lancaster University (UK). Researchers administered the survey, and recorded verbatim participant responses to the 101 questions (includes conditional branching items). Each interview lasted approximately 40 minutes. Researchers spent approximately 20 hours per site in total on consecutive days during the second quarter of 2013. Selection was via consecutive sampling of all visitors attending each site daily between the dates scheduled, and yielded 117 respondents1. See Table 2.1 for a site summary.
Using mean average estimation, 68% of registered clients between four unique sites were interviewed as part of this study. NL3 had the lowest percentage of visitors surveyed; however, they also have a significantly low average number of unique visitors per day.
Table 2.1: Summary table of registered visitor numbers across all participating NL sites
DCR Number of registered visitors, per year
Number of registered visitors at time of survey*
Average number of unique visitors, per day
% of registered visitors surveyed
Number of registered visitors surveyed
NL1 61 20 21 90% 18
NL2 60 48 35 73% 35
NL3 73 78 12 37% 29
NL4 84 49* 37.5 71% 35
Total 278 195 26.3 mean av. 68% mean av. 117
* NL4 estimate – unconfirmed at time of writing
DCR staff report that the numbers of registered users and the number of unique users per day can fluctuate extensively depending on, for example,
1 After data cleaning, 115 sample units were subjected to analysis. 2 At the time of writing, there are actually 30 DCRs in the Netherlands, and no definitive data on current

11
incarceration/detention and relocation rates of visitors.
Research suggests when studying illicit or stigmatised behaviours, face-to-face interviewing leads to higher admission and more detailed discussion, and helps to ease respondents’ confidentiality concerns (Aquilino, 1994). As both the quality of the data and the comfort of participants were highly important to the researchers, this method was selected as being most appropriate for survey administration.
Participants were seen individually and were offered the choice of English (N=42) or Dutch-language (N=75) questionnaire and interviewer, as shown in Table 2.2.
Table 2.2: Summary table of survey totals and survey languages, NL cohort
DCR Total surveys Valid surveys Contribution %
Survey language – English
Survey language - Dutch
NL1 18 18 16 13 5
NL2 35 34 30 17 18
NL3 29 29 25 0 29
NL4 35 34 29 12 23
Total 117 115 100 42 75
All data collection took place on-site, with surveys lasting approximately 40 minutes. Upon completion of the survey a €10 cash incentive was paid to participants.
2.2 Analyses Key foci of questions were identified via thematic analysis, and cross tabulation with Pearson’s Chi-Square or Fischer’s Exact Tests generated results using IBM SPSS Statistics, Version 22.
2.3 Limitations As with any research, the results must be considered within the context of limitations. This section of the report highlights the limitations having the greatest potential impact on the findings of our study.
Survey length: Interviewers were aware that consent and attentiveness are fluid; therefore care was taken to monitor indicators of response bias or participant research fatigue. Consideration of this is reflected in many areas, including the measurement method of the survey tool – a five-point Likert Scale was rejected as validity testing of the questionnaire suggested that the partitioning of responses (e.g. “slightly agree”, “agree”, “strongly agree”) could be time consuming and frustrating for respondents.
It is noteworthy that there was a clear disjuncture between expectations and
12
experience; researchers were prepared for high levels of refusal or attrition despite financial incentive. Remarkably, of the 117 respondents, only one survey was halted due to participant fatigue during the entire data collection period. Respondents remained engaged and focussed almost without exception.
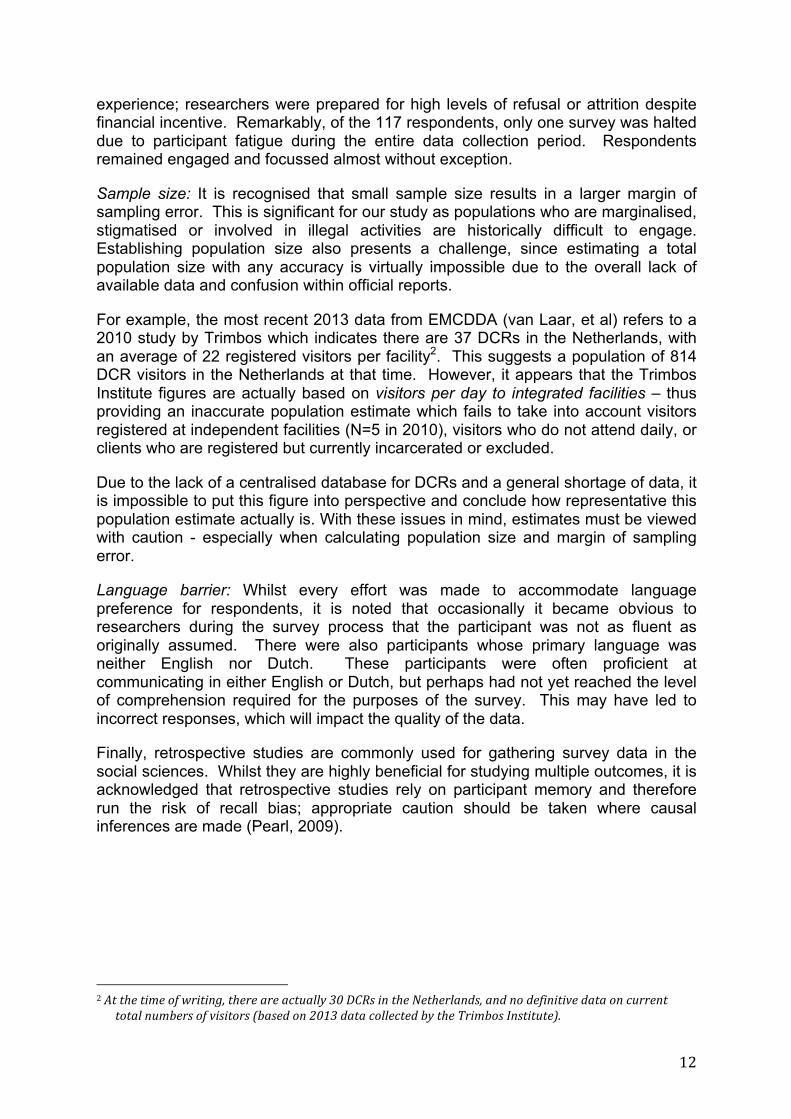
Sample size: It is recognised that small sample size results in a larger margin of sampling error. This is significant for our study as populations who are marginalised, stigmatised or involved in illegal activities are historically difficult to engage. Establishing population size also presents a challenge, since estimating a total population size with any accuracy is virtually impossible due to the overall lack of available data and confusion within official reports.
For example, the most recent 2013 data from EMCDDA (van Laar, et al) refers to a 2010 study by Trimbos which indicates there are 37 DCRs in the Netherlands, with an average of 22 registered visitors per facility2. This suggests a population of 814 DCR visitors in the Netherlands at that time. However, it appears that the Trimbos Institute figures are actually based on visitors per day to integrated facilities – thus providing an inaccurate population estimate which fails to take into account visitors registered at independent facilities (N=5 in 2010), visitors who do not attend daily, or clients who are registered but currently incarcerated or excluded.
Due to the lack of a centralised database for DCRs and a general shortage of data, it is impossible to put this figure into perspective and conclude how representative this population estimate actually is. With these issues in mind, estimates must be viewed with caution - especially when calculating population size and margin of sampling error.
Language barrier: Whilst every effort was made to accommodate language preference for respondents, it is noted that occasionally it became obvious to researchers during the survey process that the participant was not as fluent as originally assumed. There were also participants whose primary language was neither English nor Dutch. These participants were often proficient at communicating in either English or Dutch, but perhaps had not yet reached the level of comprehension required for the purposes of the survey. This may have led to incorrect responses, which will impact the quality of the data.
Finally, retrospective studies are commonly used for gathering survey data in the social sciences. Whilst they are highly beneficial for studying multiple outcomes, it is acknowledged that retrospective studies rely on participant memory and therefore run the risk of recall bias; appropriate caution should be taken where causal inferences are made (Pearl, 2009).
2 At the time of writing, there are actually 30 DCRs in the Netherlands, and no definitive data on current
total numbers of visitors (based on 2013 data collected by the Trimbos Institute).
13
3 Domain 1: demographics
3.1 Client characteristics The following section discusses Dutch DCR client characteristics either in isolation or as compared to some of those outlined in the MSIC Sydney survey (“Sydney cohort”). It also highlights trends in the Dutch consumption room client groups (“NL cohort”).
Demographics
• Age & Gender • Country of birth & Primary language • History of homelessness & Current accommodation arrangements • Marital status • Employment status • Prison history
Age and Gender:
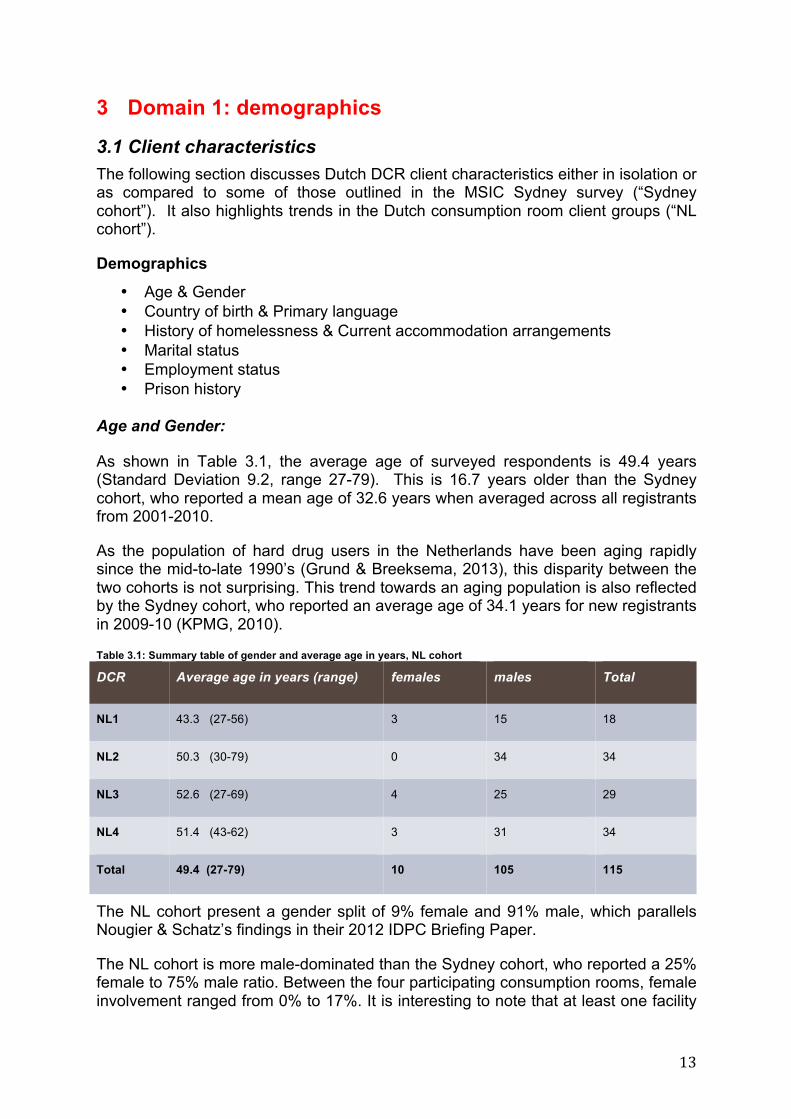
As shown in Table 3.1, the average age of surveyed respondents is 49.4 years (Standard Deviation 9.2, range 27-79). This is 16.7 years older than the Sydney cohort, who reported a mean age of 32.6 years when averaged across all registrants from 2001-2010.
As the population of hard drug users in the Netherlands have been aging rapidly since the mid-to-late 1990’s (Grund & Breeksema, 2013), this disparity between the two cohorts is not surprising. This trend towards an aging population is also reflected by the Sydney cohort, who reported an average age of 34.1 years for new registrants in 2009-10 (KPMG, 2010).
Table 3.1: Summary table of gender and average age in years, NL cohort
DCR Average age in years (range) females males Total
NL1 43.3 (27-56) 3 15 18
NL2 50.3 (30-79) 0 34 34
NL3 52.6 (27-69) 4 25 29
NL4 51.4 (43-62) 3 31 34
Total 49.4 (27-79) 10 105 115
The NL cohort present a gender split of 9% female and 91% male, which parallels Nougier & Schatz’s findings in their 2012 IDPC Briefing Paper.
The NL cohort is more male-dominated than the Sydney cohort, who reported a 25% female to 75% male ratio. Between the four participating consumption rooms, female involvement ranged from 0% to 17%. It is interesting to note that at least one facility

14
participating in the Dutch study offer “women only” sessions, which were not included in the survey schedule. As it is reasonable to assume some women prefer accessing the single-sex sessions over the mixed sessions, this may have impacted the overall gender distribution of the participating cohort.
Country of Birth and Primary Language:
Overall, the NL cohort showed a considerably large South American-born population. Suriname was the most common country of birth, with 32% of all respondents originating there. The Netherlands have seen two waves of Surinamese immigration; one in 1975, one in 1980 (Focus Migration, 2014). As a result, 10% of the current NL population are of Surinamese origin.
However, when comparing the four Dutch study locations there is a notable incongruence in country of birth, as the charts below illustrate in further detail.
Figure 3.1: NL1 population demographics (N=18)
Figure 3.1: At NL1 there was a clear 76% - 24% split between Western and Eastern European clients (N=18, with 1 refusal), however it is important to highlight that Dutch citizens do not access services here and therefore the Netherlands are not included in the ‘Western European’ category for this facility.
0
2
4
6
8
10
12
14
Western Europe Eastern Europe
resp
onde
nts
world region
Czech Republic
Romania
Italy
Ireland
Germany
Russia
Bulgaria
Belgium
Austria
UK
country of birth:

15
Figure 3.2: NL2 population demographics (N=34)
Figure 3.2: NL2 shows a significant South American population of 53% primarily from Suriname, and also a large North African population of 21%. Other areas denoted include Western Europe with 11%, and the Middle East with 6%. East Africa, Eastern Europe, and West Africa with 3% each, illustrate the smallest NL2 participant populations.
Figure 3.3: NL3 population demographics (N=29)
0
2
4
6
8
10
12
14
16
18
20
Western Europe
South America
Middle East
North Africa
East Africa
Eastern Europe
West Africa
resp
onde
nts
world region
Ghana
Somalia
Bosnia
France
Iraq
Algeria
Turkey
Morocco
Curacao
Suriname
Holland
country of birth:
0
2
4
6
8
10
12
14
16
18
Western Europe
South America
North Africa Middle East North America
East Africa
resp
onde
nts
world region
Eritrea
USA
Aruba
Turkey
Morocco
Suriname
Holland
country of birth:
16
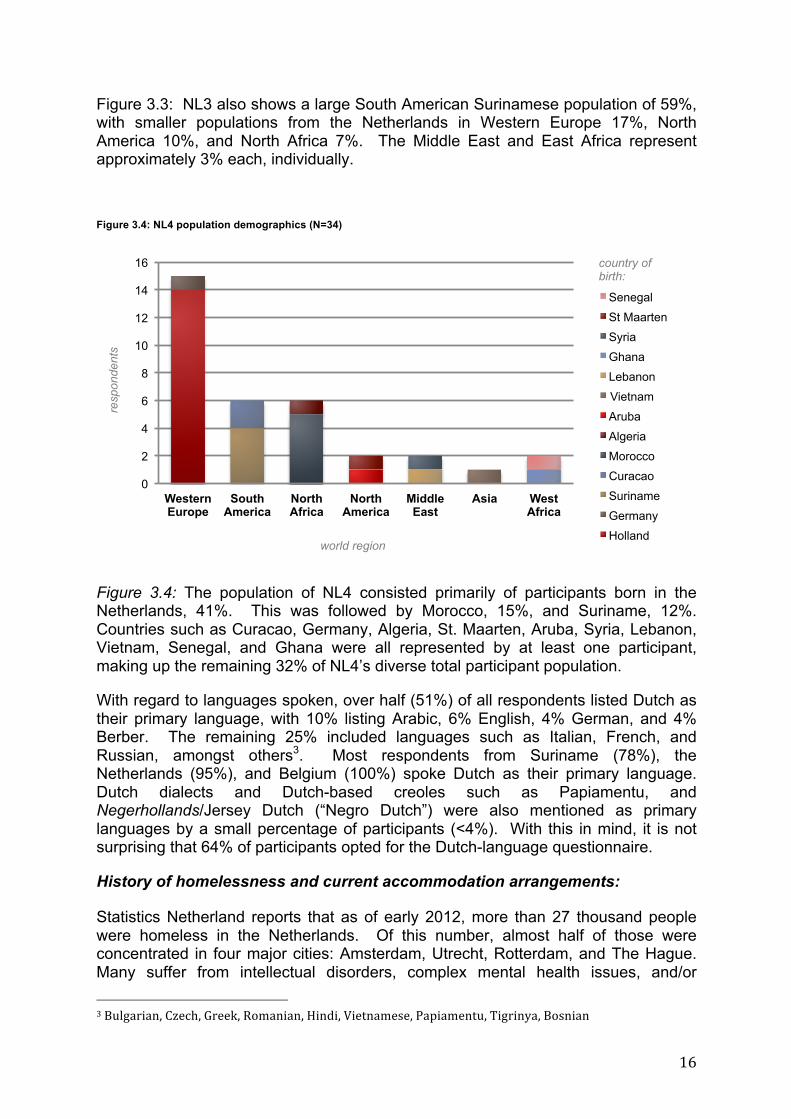
Figure 3.3: NL3 also shows a large South American Surinamese population of 59%, with smaller populations from the Netherlands in Western Europe 17%, North America 10%, and North Africa 7%. The Middle East and East Africa represent approximately 3% each, individually.
Figure 3.4: NL4 population demographics (N=34)
Figure 3.4: The population of NL4 consisted primarily of participants born in the Netherlands, 41%. This was followed by Morocco, 15%, and Suriname, 12%. Countries such as Curacao, Germany, Algeria, St. Maarten, Aruba, Syria, Lebanon, Vietnam, Senegal, and Ghana were all represented by at least one participant, making up the remaining 32% of NL4’s diverse total participant population.
With regard to languages spoken, over half (51%) of all respondents listed Dutch as their primary language, with 10% listing Arabic, 6% English, 4% German, and 4% Berber. The remaining 25% included languages such as Italian, French, and Russian, amongst others3. Most respondents from Suriname (78%), the Netherlands (95%), and Belgium (100%) spoke Dutch as their primary language. Dutch dialects and Dutch-based creoles such as Papiamentu, and Negerhollands/Jersey Dutch (“Negro Dutch”) were also mentioned as primary languages by a small percentage of participants (<4%). With this in mind, it is not surprising that 64% of participants opted for the Dutch-language questionnaire.
History of homelessness and current accommodation arrangements:
Statistics Netherland reports that as of early 2012, more than 27 thousand people were homeless in the Netherlands. Of this number, almost half of those were concentrated in four major cities: Amsterdam, Utrecht, Rotterdam, and The Hague. Many suffer from intellectual disorders, complex mental health issues, and/or 3 Bulgarian, Czech, Greek, Romanian, Hindi, Vietnamese, Papiamentu, Tigrinya, Bosnian
0
2
4
6
8
10
12
14
16
Western Europe
South America
North Africa
North America
Middle East
Asia West Africa
resp
onde
nts
world region
Senegal St Maarten Syria Ghana Lebanon Vietnam Aruba Algeria Morocco Curacao Suriname Germany Holland
country of birth:
17
0
5
10
15
20
25
30
NL1 NL2 NL3 NL4
resp
onde
nts
facility
currently homeless
homeless in the past
never homeless
status:
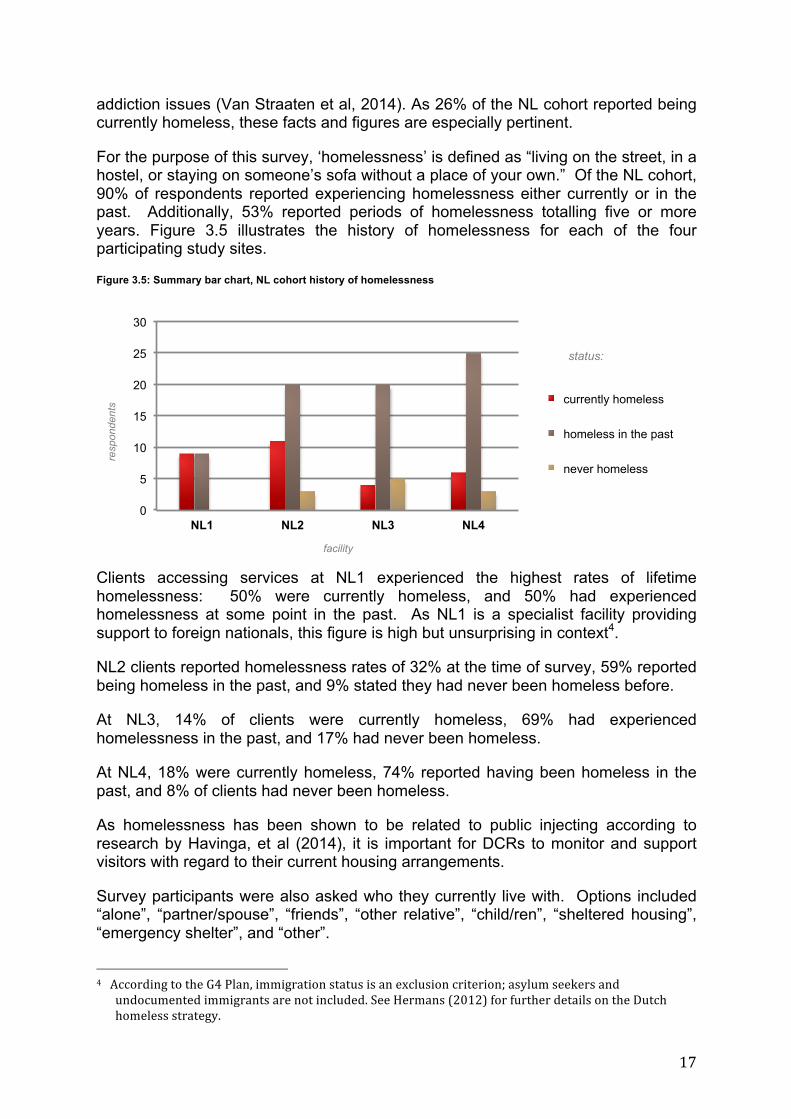
addiction issues (Van Straaten et al, 2014). As 26% of the NL cohort reported being currently homeless, these facts and figures are especially pertinent.
For the purpose of this survey, ‘homelessness’ is defined as “living on the street, in a hostel, or staying on someone’s sofa without a place of your own.” Of the NL cohort, 90% of respondents reported experiencing homelessness either currently or in the past. Additionally, 53% reported periods of homelessness totalling five or more years. Figure 3.5 illustrates the history of homelessness for each of the four participating study sites.
Figure 3.5: Summary bar chart, NL cohort history of homelessness
Clients accessing services at NL1 experienced the highest rates of lifetime homelessness: 50% were currently homeless, and 50% had experienced homelessness at some point in the past. As NL1 is a specialist facility providing support to foreign nationals, this figure is high but unsurprising in context4.
NL2 clients reported homelessness rates of 32% at the time of survey, 59% reported being homeless in the past, and 9% stated they had never been homeless before.
At NL3, 14% of clients were currently homeless, 69% had experienced homelessness in the past, and 17% had never been homeless.
At NL4, 18% were currently homeless, 74% reported having been homeless in the past, and 8% of clients had never been homeless.
As homelessness has been shown to be related to public injecting according to research by Havinga, et al (2014), it is important for DCRs to monitor and support visitors with regard to their current housing arrangements.
Survey participants were also asked who they currently live with. Options included “alone”, “partner/spouse”, “friends”, “other relative”, “child/ren”, “sheltered housing”, “emergency shelter”, and “other”.
4 According to the G4 Plan, immigration status is an exclusion criterion; asylum seekers and
undocumented immigrants are not included. See Hermans (2012) for further details on the Dutch homeless strategy.
18
Most respondents (67%) reported living alone, followed by “sheltered housing” (13%). Smaller percentages made up the rest of the population: 8% with a partner or spouse, 3% with friends, 3% with other relatives, and 2% with their child/ren. Slightly less than 1% of respondents reported living with their parents or living in emergency shelters. Finally, 3% of all respondents described other arrangements, such as sex workers living with a client.
Marital status:
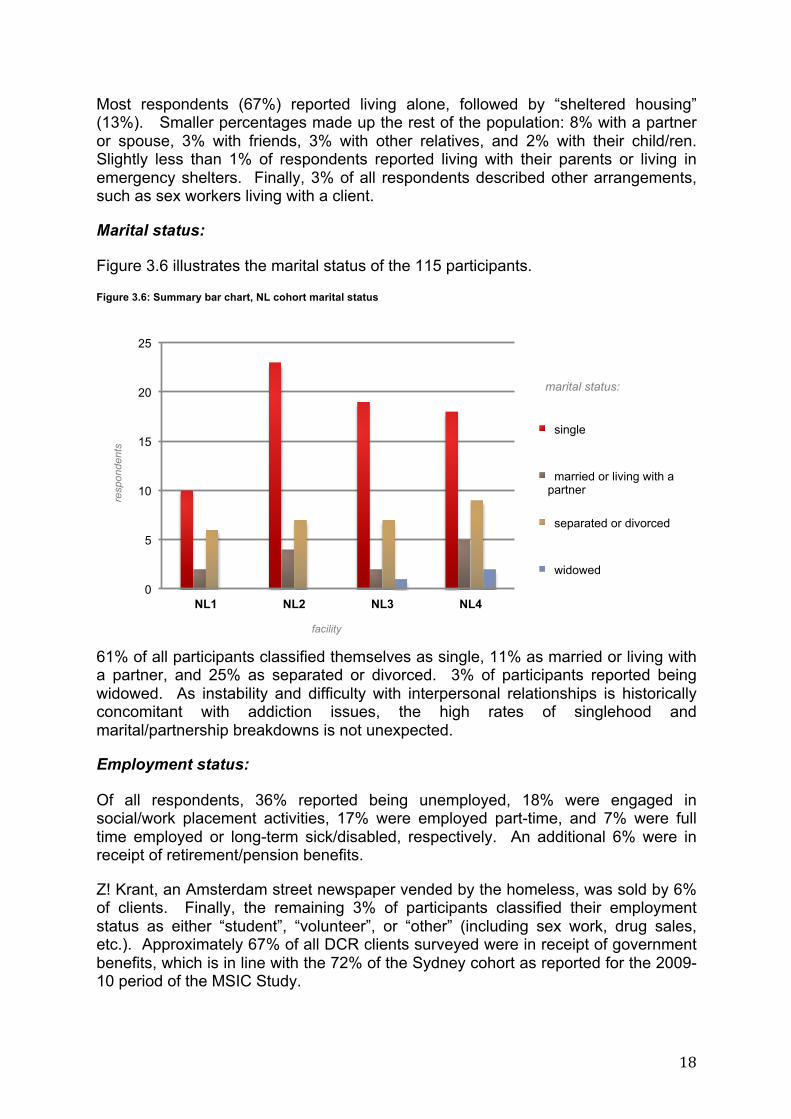
Figure 3.6 illustrates the marital status of the 115 participants.
Figure 3.6: Summary bar chart, NL cohort marital status
61% of all participants classified themselves as single, 11% as married or living with a partner, and 25% as separated or divorced. 3% of participants reported being widowed. As instability and difficulty with interpersonal relationships is historically concomitant with addiction issues, the high rates of singlehood and marital/partnership breakdowns is not unexpected.
Employment status:
Of all respondents, 36% reported being unemployed, 18% were engaged in social/work placement activities, 17% were employed part-time, and 7% were full time employed or long-term sick/disabled, respectively. An additional 6% were in receipt of retirement/pension benefits.
Z! Krant, an Amsterdam street newspaper vended by the homeless, was sold by 6% of clients. Finally, the remaining 3% of participants classified their employment status as either “student”, “volunteer”, or “other” (including sex work, drug sales, etc.). Approximately 67% of all DCR clients surveyed were in receipt of government benefits, which is in line with the 72% of the Sydney cohort as reported for the 2009-10 period of the MSIC Study.
0
5
10
15
20
25
NL1 NL2 NL3 NL4
resp
onde
nts
facility
single
married or living with a partner
separated or divorced
widowed
marital status:
19
0
5
10
15
20
25
30
35
NL1 NL2 NL3 NL4
resp
onde
nts
facility
Unsure
20+
13 to 19
8 to 12
4 to 7
1 to 3
'incarceration episodes'
categories:
Prison history:
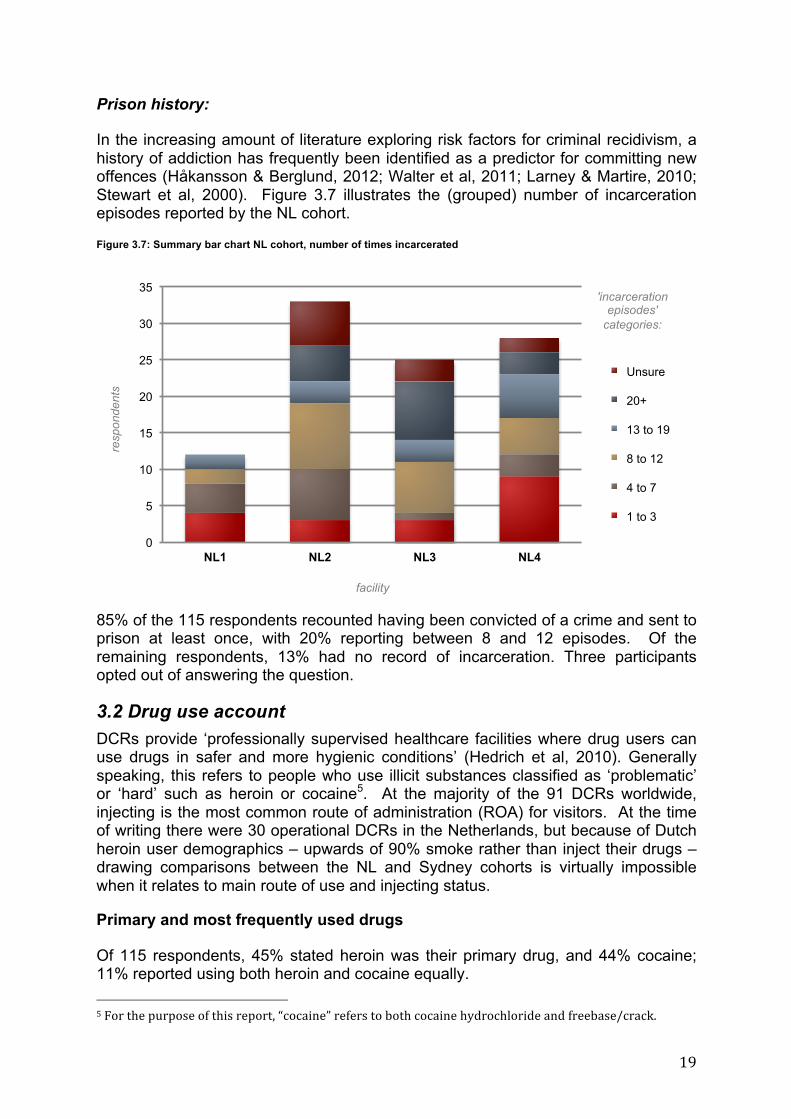
In the increasing amount of literature exploring risk factors for criminal recidivism, a history of addiction has frequently been identified as a predictor for committing new offences (Håkansson & Berglund, 2012; Walter et al, 2011; Larney & Martire, 2010; Stewart et al, 2000). Figure 3.7 illustrates the (grouped) number of incarceration episodes reported by the NL cohort.
Figure 3.7: Summary bar chart NL cohort, number of times incarcerated
85% of the 115 respondents recounted having been convicted of a crime and sent to prison at least once, with 20% reporting between 8 and 12 episodes. Of the remaining respondents, 13% had no record of incarceration. Three participants opted out of answering the question.
3.2 Drug use account DCRs provide ‘professionally supervised healthcare facilities where drug users can use drugs in safer and more hygienic conditions’ (Hedrich et al, 2010). Generally speaking, this refers to people who use illicit substances classified as ‘problematic’ or ‘hard’ such as heroin or cocaine5. At the majority of the 91 DCRs worldwide, injecting is the most common route of administration (ROA) for visitors. At the time of writing there were 30 operational DCRs in the Netherlands, but because of Dutch heroin user demographics – upwards of 90% smoke rather than inject their drugs – drawing comparisons between the NL and Sydney cohorts is virtually impossible when it relates to main route of use and injecting status.
Primary and most frequently used drugs
Of 115 respondents, 45% stated heroin was their primary drug, and 44% cocaine; 11% reported using both heroin and cocaine equally. 5 For the purpose of this report, “cocaine” refers to both cocaine hydrochloride and freebase/crack.
20
With regard to the Sydney cohort, 2009-2010 figures indicate that 41-56% of new registrants (N=672) listed heroin as their most recently injected drug, whilst 9-11% indicated it was cocaine (KPMG, 2010). Although these figures are imprecise and not directly comparable, they do suggest levels of heroin use similar to the NL cohort - regardless of ROA6.
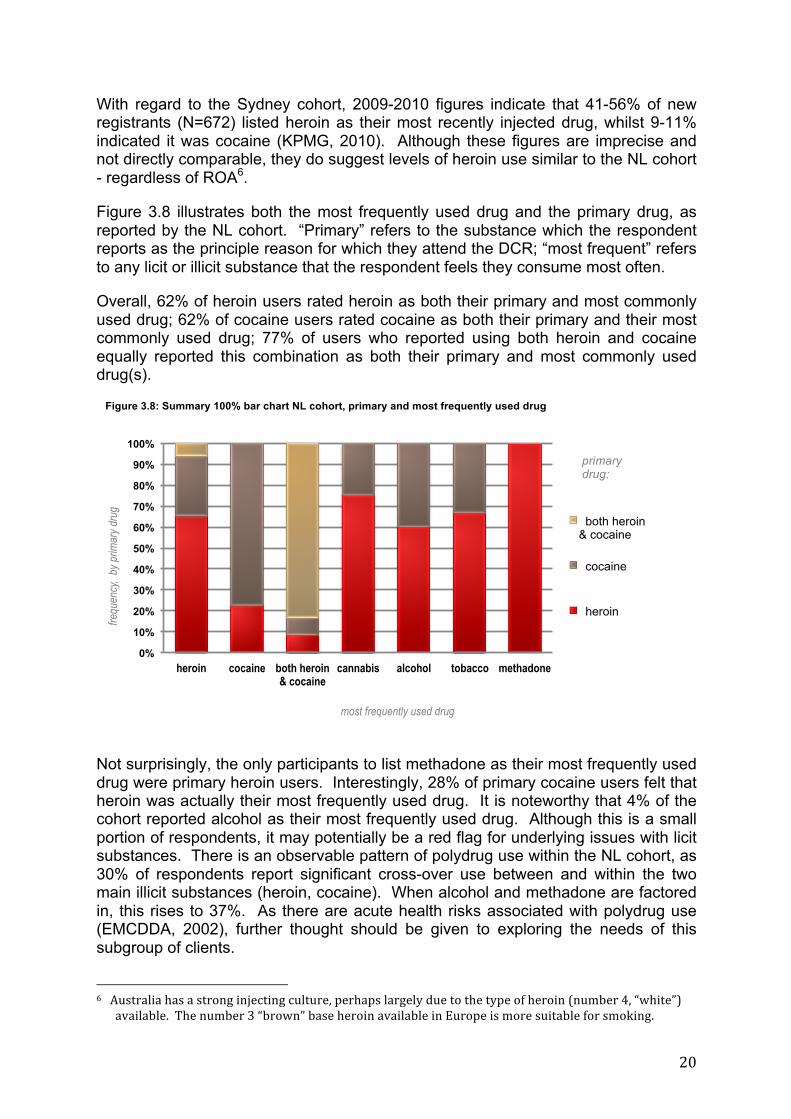
Figure 3.8 illustrates both the most frequently used drug and the primary drug, as reported by the NL cohort. “Primary” refers to the substance which the respondent reports as the principle reason for which they attend the DCR; “most frequent” refers to any licit or illicit substance that the respondent feels they consume most often.
Overall, 62% of heroin users rated heroin as both their primary and most commonly used drug; 62% of cocaine users rated cocaine as both their primary and their most commonly used drug; 77% of users who reported using both heroin and cocaine equally reported this combination as both their primary and most commonly used drug(s).
Figure 3.8: Summary 100% bar chart NL cohort, primary and most frequently used drug
Not surprisingly, the only participants to list methadone as their most frequently used drug were primary heroin users. Interestingly, 28% of primary cocaine users felt that heroin was actually their most frequently used drug. It is noteworthy that 4% of the cohort reported alcohol as their most frequently used drug. Although this is a small portion of respondents, it may potentially be a red flag for underlying issues with licit substances. There is an observable pattern of polydrug use within the NL cohort, as 30% of respondents report significant cross-over use between and within the two main illicit substances (heroin, cocaine). When alcohol and methadone are factored in, this rises to 37%. As there are acute health risks associated with polydrug use (EMCDDA, 2002), further thought should be given to exploring the needs of this subgroup of clients.
6 Australia has a strong injecting culture, perhaps largely due to the type of heroin (number 4, “white”)
available. The number 3 “brown” base heroin available in Europe is more suitable for smoking.
0%
10%
20%
30%
40%
50%
60%
70%
80%
90%
100%
heroin cocaine both heroin & cocaine
cannabis alcohol tobacco methadone
frequ
ency
, by
prim
ary d
rug
most frequently used drug
both heroin & cocaine
cocaine
heroin
primary drug:
21
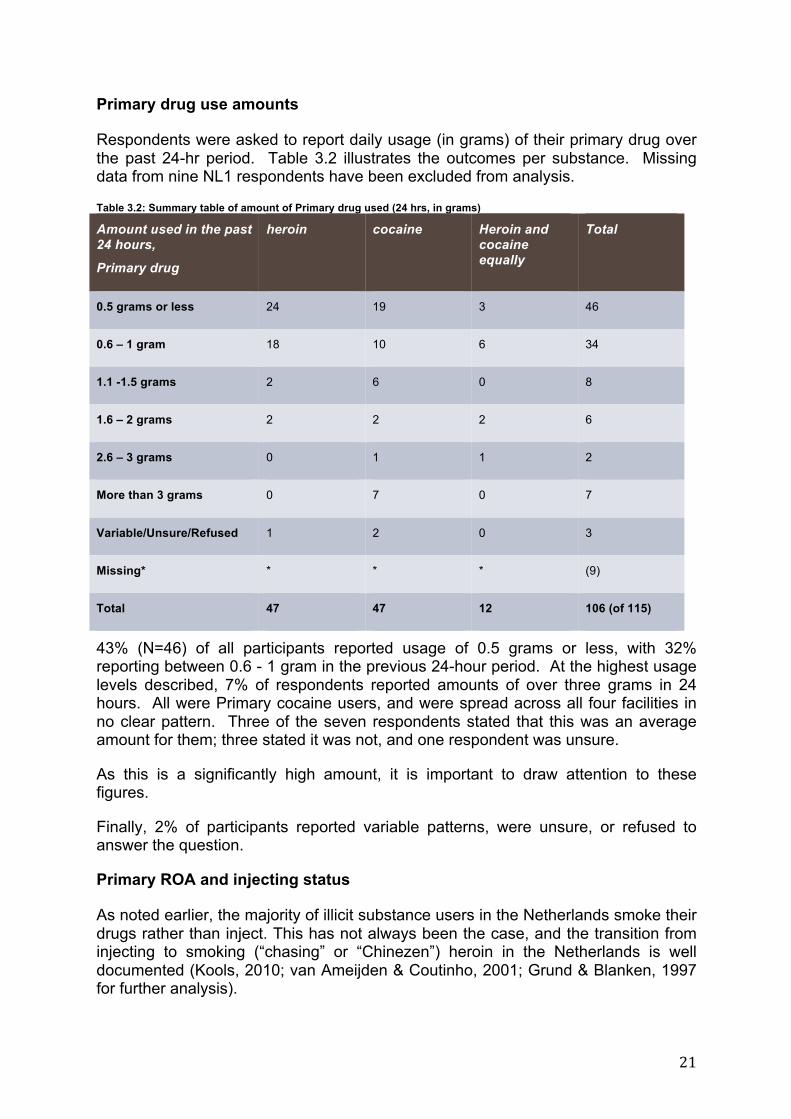
Primary drug use amounts
Respondents were asked to report daily usage (in grams) of their primary drug over the past 24-hr period. Table 3.2 illustrates the outcomes per substance. Missing data from nine NL1 respondents have been excluded from analysis.
Table 3.2: Summary table of amount of Primary drug used (24 hrs, in grams)
Amount used in the past 24 hours,
Primary drug
heroin cocaine Heroin and cocaine equally
Total
0.5 grams or less 24 19 3 46
0.6 – 1 gram 18 10 6 34
1.1 -1.5 grams 2 6 0 8
1.6 – 2 grams 2 2 2 6
2.6 – 3 grams 0 1 1 2
More than 3 grams 0 7 0 7
Variable/Unsure/Refused 1 2 0 3
Missing* * * * (9)
Total 47 47 12 106 (of 115)
43% (N=46) of all participants reported usage of 0.5 grams or less, with 32% reporting between 0.6 - 1 gram in the previous 24-hour period. At the highest usage levels described, 7% of respondents reported amounts of over three grams in 24 hours. All were Primary cocaine users, and were spread across all four facilities in no clear pattern. Three of the seven respondents stated that this was an average amount for them; three stated it was not, and one respondent was unsure.
As this is a significantly high amount, it is important to draw attention to these figures.
Finally, 2% of participants reported variable patterns, were unsure, or refused to answer the question.
Primary ROA and injecting status
As noted earlier, the majority of illicit substance users in the Netherlands smoke their drugs rather than inject. This has not always been the case, and the transition from injecting to smoking (“chasing” or “Chinezen”) heroin in the Netherlands is well documented (Kools, 2010; van Ameijden & Coutinho, 2001; Grund & Blanken, 1997 for further analysis).
22
0 10 20 30 40 50 60
sniff
smoke, foil
smoke, pipe
smoke, cigarette
inject
smoke/inject equally
respondents
Primary ROA
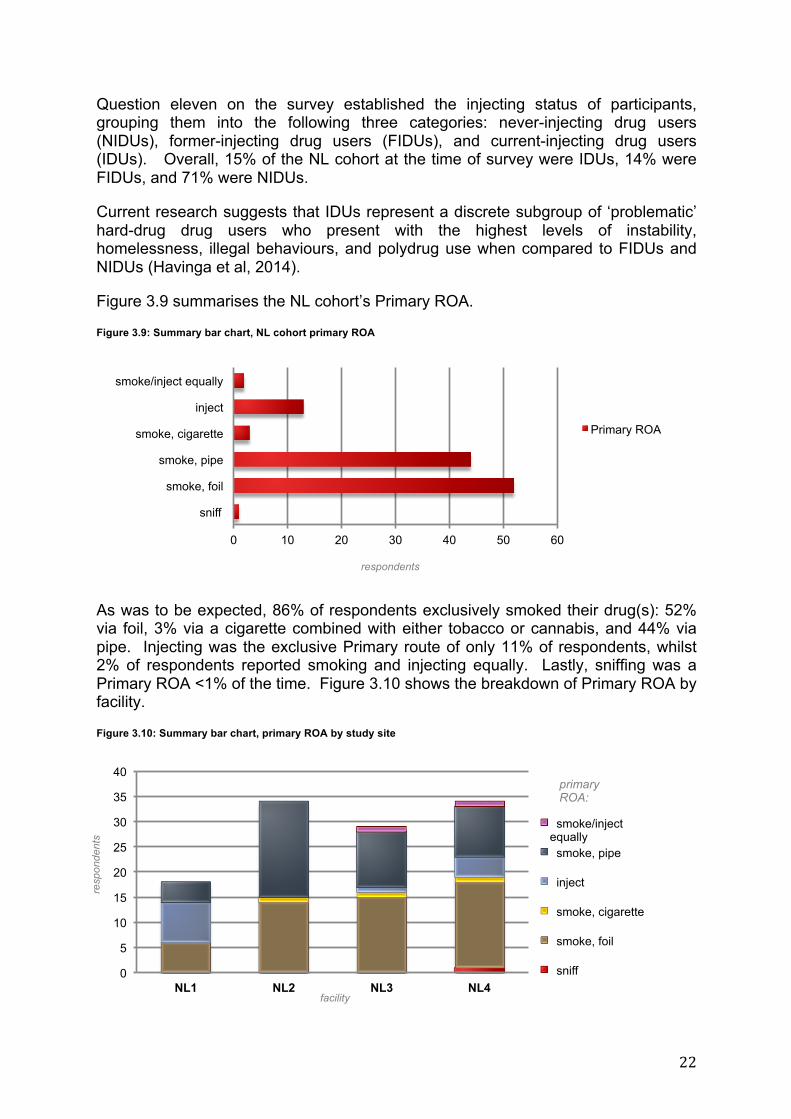
Question eleven on the survey established the injecting status of participants, grouping them into the following three categories: never-injecting drug users (NIDUs), former-injecting drug users (FIDUs), and current-injecting drug users (IDUs). Overall, 15% of the NL cohort at the time of survey were IDUs, 14% were FIDUs, and 71% were NIDUs.
Current research suggests that IDUs represent a discrete subgroup of ‘problematic’ hard-drug drug users who present with the highest levels of instability, homelessness, illegal behaviours, and polydrug use when compared to FIDUs and NIDUs (Havinga et al, 2014).
Figure 3.9 summarises the NL cohort’s Primary ROA.
Figure 3.9: Summary bar chart, NL cohort primary ROA
As was to be expected, 86% of respondents exclusively smoked their drug(s): 52% via foil, 3% via a cigarette combined with either tobacco or cannabis, and 44% via pipe. Injecting was the exclusive Primary route of only 11% of respondents, whilst 2% of respondents reported smoking and injecting equally. Lastly, sniffing was a Primary ROA <1% of the time. Figure 3.10 shows the breakdown of Primary ROA by facility.
Figure 3.10: Summary bar chart, primary ROA by study site
0
5
10
15
20
25
30
35
40
NL1 NL2 NL3 NL4
resp
onde
nts
facility
smoke/inject equally smoke, pipe
inject
smoke, cigarette
smoke, foil
sniff
primary ROA:
23
Of the four study sites, NL1 contained the highest proportion of injectors – 45%, or eight out of eighteen respondents. This is unsurprising, as the majority of clients accessing services there predominantly come from countries where there is a stronger injecting culture than in the Netherlands.
NL2 had no visitors who inject registered at the time of survey, with 100% of all respondents smoking drugs; NL3 reported 4% of clients were primary injectors, and 4% injected and smoked their drugs equally.
Age at first primary use and first route used (primary drug):
Respondents were asked to recall the age at which they first used their primary drug, and what ROA they used initially. 40% of respondents fell into the 18-25 year old category. Similar cohorts such as the Sydney MSIC report that the average age of first injection is 19.4 years. The NL cohort data encompasses a variety of ROAs; however, we can see that the overall results are broadly similar.
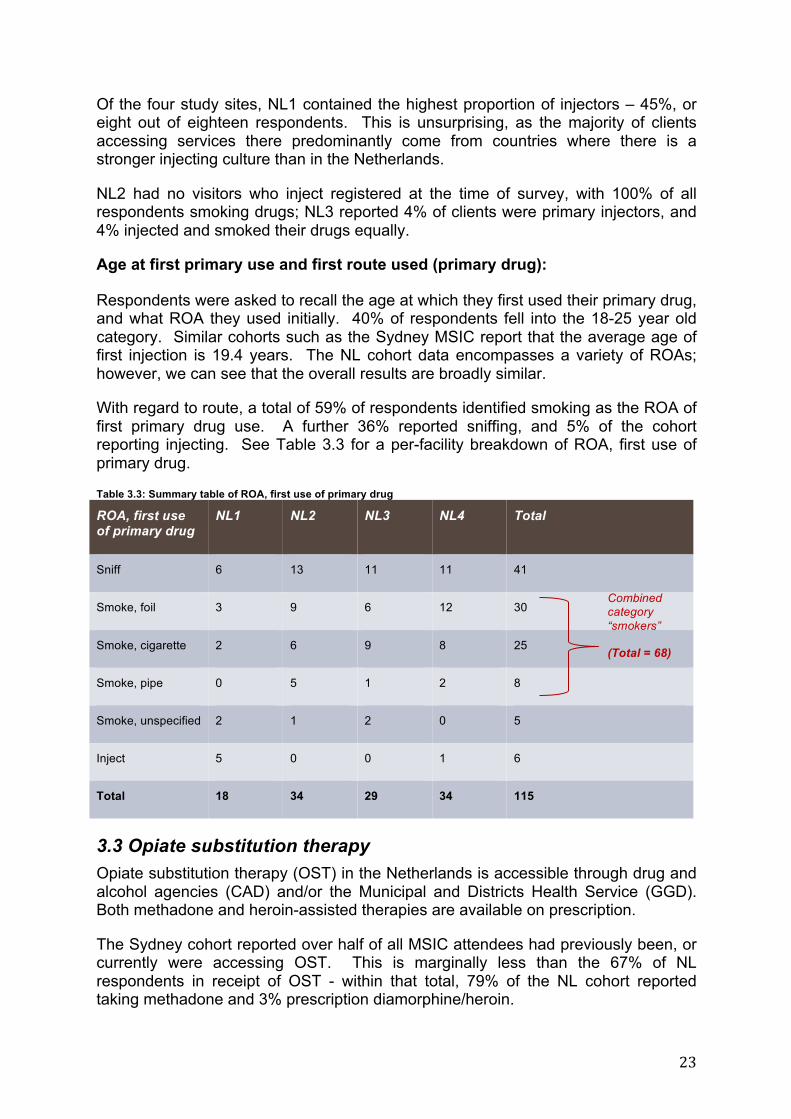
With regard to route, a total of 59% of respondents identified smoking as the ROA of first primary drug use. A further 36% reported sniffing, and 5% of the cohort reporting injecting. See Table 3.3 for a per-facility breakdown of ROA, first use of primary drug.
Table 3.3: Summary table of ROA, first use of primary drug
ROA, first use of primary drug
NL1 NL2 NL3 NL4 Total
Sniff 6 13 11 11 41
Smoke, foil 3 9 6 12 30
Smoke, cigarette 2 6 9 8 25
Smoke, pipe 0 5 1 2 8
Smoke, unspecified 2 1 2 0 5
Inject 5 0 0 1 6
Total 18 34 29 34 115
3.3 Opiate substitution therapy Opiate substitution therapy (OST) in the Netherlands is accessible through drug and alcohol agencies (CAD) and/or the Municipal and Districts Health Service (GGD). Both methadone and heroin-assisted therapies are available on prescription.
The Sydney cohort reported over half of all MSIC attendees had previously been, or currently were accessing OST. This is marginally less than the 67% of NL respondents in receipt of OST - within that total, 79% of the NL cohort reported taking methadone and 3% prescription diamorphine/heroin.
Combined category “smokers” (Total = 68)
24
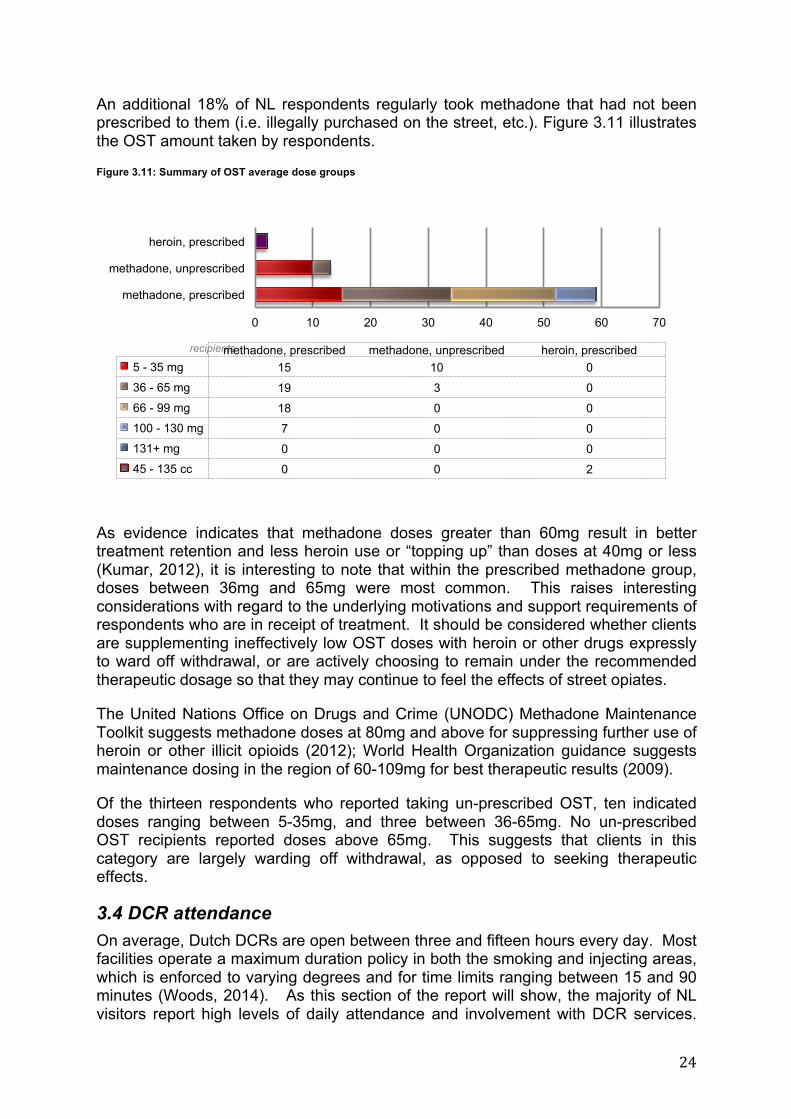
An additional 18% of NL respondents regularly took methadone that had not been prescribed to them (i.e. illegally purchased on the street, etc.). Figure 3.11 illustrates the OST amount taken by respondents.
Figure 3.11: Summary of OST average dose groups
As evidence indicates that methadone doses greater than 60mg result in better treatment retention and less heroin use or “topping up” than doses at 40mg or less (Kumar, 2012), it is interesting to note that within the prescribed methadone group, doses between 36mg and 65mg were most common. This raises interesting considerations with regard to the underlying motivations and support requirements of respondents who are in receipt of treatment. It should be considered whether clients are supplementing ineffectively low OST doses with heroin or other drugs expressly to ward off withdrawal, or are actively choosing to remain under the recommended therapeutic dosage so that they may continue to feel the effects of street opiates.
The United Nations Office on Drugs and Crime (UNODC) Methadone Maintenance Toolkit suggests methadone doses at 80mg and above for suppressing further use of heroin or other illicit opioids (2012); World Health Organization guidance suggests maintenance dosing in the region of 60-109mg for best therapeutic results (2009).
Of the thirteen respondents who reported taking un-prescribed OST, ten indicated doses ranging between 5-35mg, and three between 36-65mg. No un-prescribed OST recipients reported doses above 65mg. This suggests that clients in this category are largely warding off withdrawal, as opposed to seeking therapeutic effects.
3.4 DCR attendance On average, Dutch DCRs are open between three and fifteen hours every day. Most facilities operate a maximum duration policy in both the smoking and injecting areas, which is enforced to varying degrees and for time limits ranging between 15 and 90 minutes (Woods, 2014). As this section of the report will show, the majority of NL visitors report high levels of daily attendance and involvement with DCR services.
0 10 20 30 40 50 60 70
methadone, prescribed
methadone, unprescribed
heroin, prescribed
recipients methadone, prescribed methadone, unprescribed heroin, prescribed 5 - 35 mg 15 10 0
36 - 65 mg 19 3 0
66 - 99 mg 18 0 0
100 - 130 mg 7 0 0
131+ mg 0 0 0
45 - 135 cc 0 0 2

25
This presents an immensely valuable opportunity for DCRs to engage and further reduce barriers between clients and other services, etc.
Figure 3.12: bar chart, average length of time registered
Figure 3.12 illustrates the average length of time that participants have been attending the DCR at which they are registered. No clear data exists on the average length of registration for DCR clients; however results of this study indicate that the majority of clients across the four facilities have been accessing services for more than seven years. Within the group of long-term clients, 49% began accessing the DCR over a decade ago. As the DCR service model is designed to ease access and limit barriers to service for people who use drugs, and to offer them ongoing support, these figures suggest successful engagement with and retention of a population historically viewed as challenging and marginalised.
Most DCR clients initially heard about consumption room services through word of mouth: that is, a drug-using friend or drug dealer, or via staff members at other social or drug-related services. This is in line with the Sydney cohort, where the majority of clients report first hearing about the MSIC through social networks (e.g. peers). Other referral sources mentioned by the NL cohort included the police, by walking past, or from already making use of existing provisions (such as drop-in facilities, etc.) at the site where the DCR was housed. Table 3.4 summarizes responses given to the following unstructured question, “Why do you come to the DCR?” Up to three responses per participant were recorded, analysed and categorized based on over-arching themes.
0
5
10
15
20
25
NL1 NL2 NL3 NL4
resp
onde
nts
facility
3 years or less
4 to 6 years
7 to 10 years
more than 10 years
Average length of attendance
26
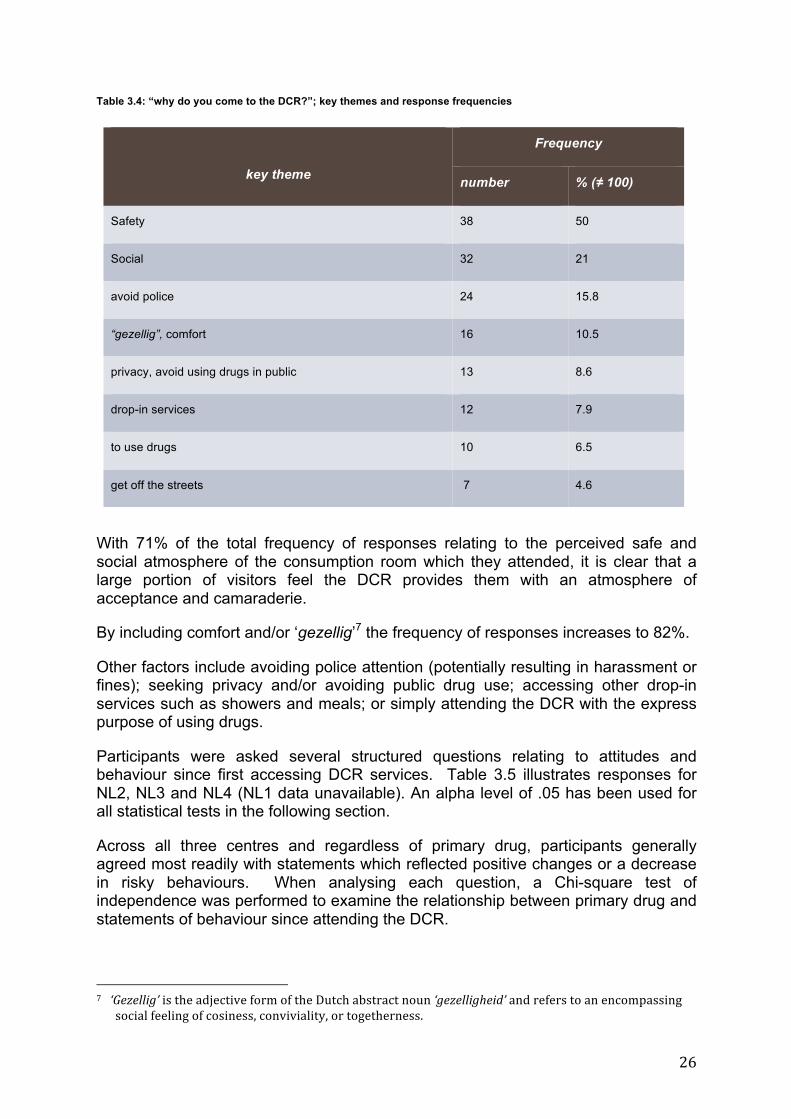
Table 3.4: “why do you come to the DCR?”; key themes and response frequencies
With 71% of the total frequency of responses relating to the perceived safe and social atmosphere of the consumption room which they attended, it is clear that a large portion of visitors feel the DCR provides them with an atmosphere of acceptance and camaraderie.
By including comfort and/or ‘gezellig’7 the frequency of responses increases to 82%.
Other factors include avoiding police attention (potentially resulting in harassment or fines); seeking privacy and/or avoiding public drug use; accessing other drop-in services such as showers and meals; or simply attending the DCR with the express purpose of using drugs.
Participants were asked several structured questions relating to attitudes and behaviour since first accessing DCR services. Table 3.5 illustrates responses for NL2, NL3 and NL4 (NL1 data unavailable). An alpha level of .05 has been used for all statistical tests in the following section.
Across all three centres and regardless of primary drug, participants generally agreed most readily with statements which reflected positive changes or a decrease in risky behaviours. When analysing each question, a Chi-square test of independence was performed to examine the relationship between primary drug and statements of behaviour since attending the DCR.
7 ‘Gezellig’ is the adjective form of the Dutch abstract noun ‘gezelligheid’ and refers to an encompassing
social feeling of cosiness, conviviality, or togetherness.
key theme
Frequency
number % (≠ 100)
Safety 38 50
Social 32 21
avoid police 24 15.8
“gezellig”, comfort 16 10.5
privacy, avoid using drugs in public 13 8.6
drop-in services 12 7.9
to use drugs 10 6.5
get off the streets 7 4.6
27
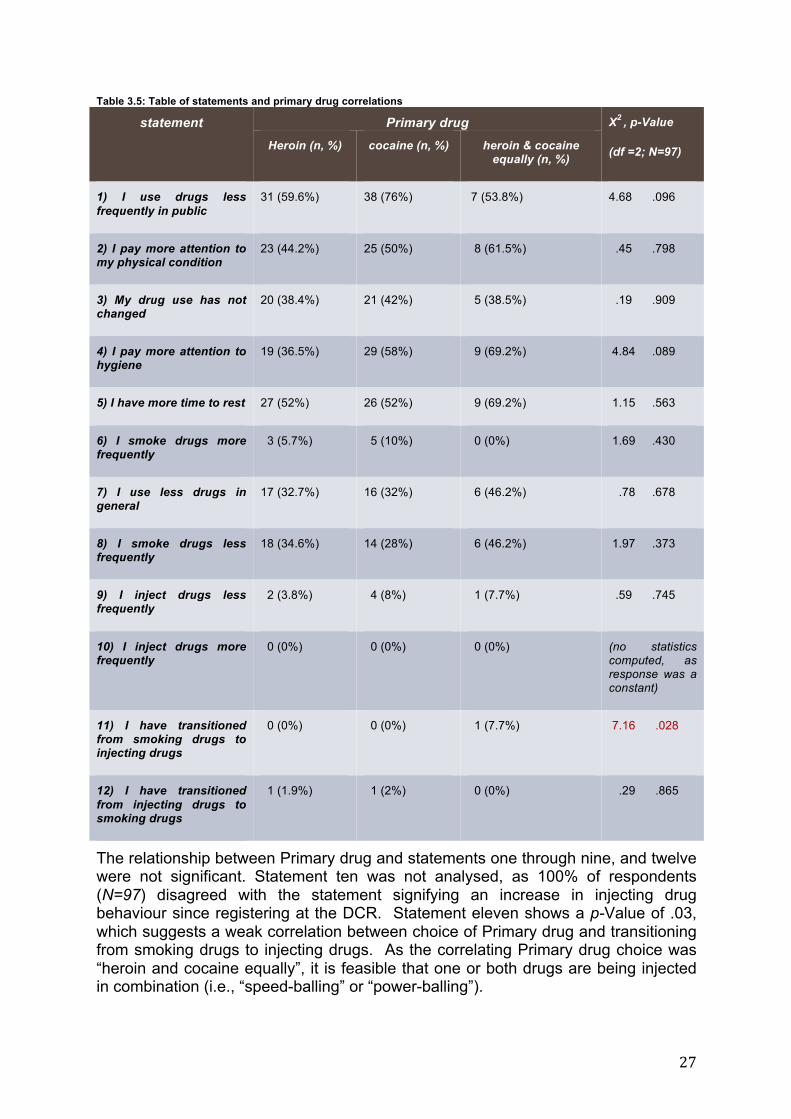
Table 3.5: Table of statements and primary drug correlations
statement Primary drug X2 , p-Value
(df =2; N=97) Heroin (n, %) cocaine (n, %) heroin & cocaine equally (n, %)
1) I use drugs less frequently in public
31 (59.6%) 38 (76%) 7 (53.8%) 4.68 .096
2) I pay more attention to my physical condition
23 (44.2%) 25 (50%) 8 (61.5%) .45 .798
3) My drug use has not changed
20 (38.4%) 21 (42%) 5 (38.5%) .19 .909
4) I pay more attention to hygiene
19 (36.5%) 29 (58%) 9 (69.2%) 4.84 .089
5) I have more time to rest 27 (52%) 26 (52%) 9 (69.2%) 1.15 .563
6) I smoke drugs more frequently
3 (5.7%) 5 (10%) 0 (0%) 1.69 .430
7) I use less drugs in general
17 (32.7%) 16 (32%) 6 (46.2%) .78 .678
8) I smoke drugs less frequently
18 (34.6%) 14 (28%) 6 (46.2%) 1.97 .373
9) I inject drugs less frequently
2 (3.8%) 4 (8%) 1 (7.7%) .59 .745
10) I inject drugs more frequently
0 (0%) 0 (0%) 0 (0%) (no statistics computed, as response was a constant)
11) I have transitioned from smoking drugs to injecting drugs
0 (0%) 0 (0%) 1 (7.7%) 7.16 .028
12) I have transitioned from injecting drugs to smoking drugs
1 (1.9%) 1 (2%) 0 (0%) .29 .865
The relationship between Primary drug and statements one through nine, and twelve were not significant. Statement ten was not analysed, as 100% of respondents (N=97) disagreed with the statement signifying an increase in injecting drug behaviour since registering at the DCR. Statement eleven shows a p-Value of .03, which suggests a weak correlation between choice of Primary drug and transitioning from smoking drugs to injecting drugs. As the correlating Primary drug choice was “heroin and cocaine equally”, it is feasible that one or both drugs are being injected in combination (i.e., “speed-balling” or “power-balling”).
28
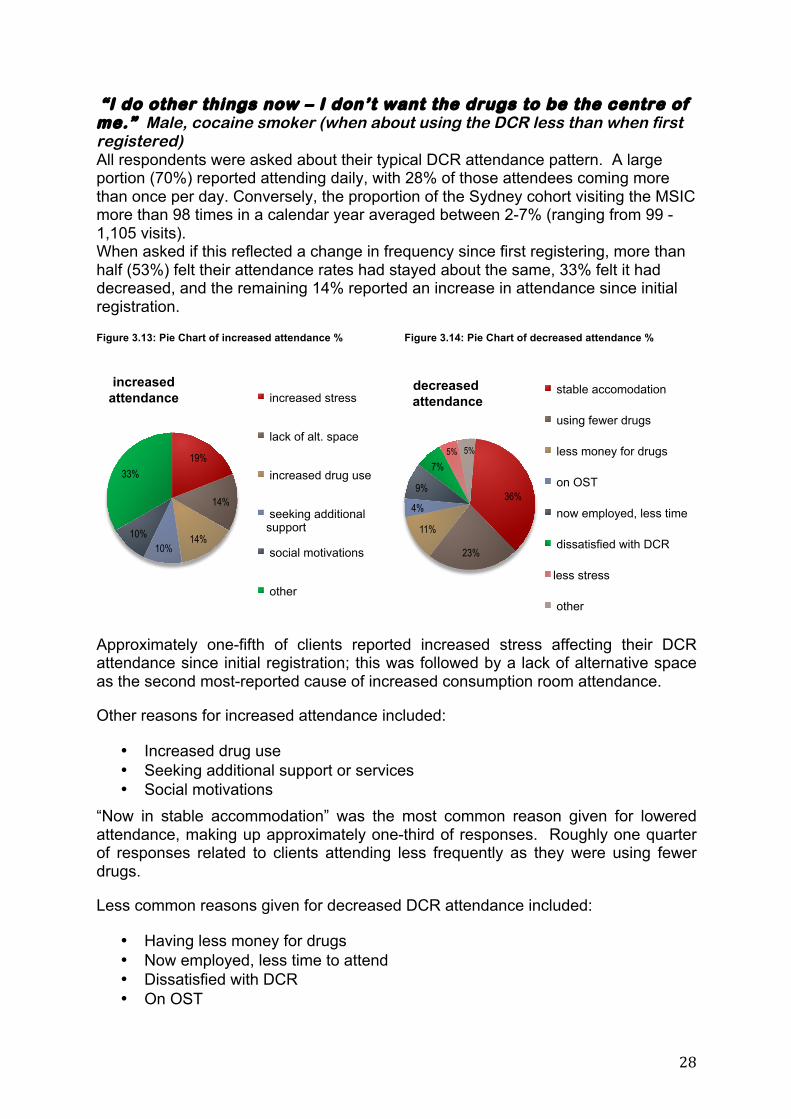
“I do other things now – I don’t want the drugs to be the centre of me.” Male, cocaine smoker (when about using the DCR less than when first registered) All respondents were asked about their typical DCR attendance pattern. A large portion (70%) reported attending daily, with 28% of those attendees coming more than once per day. Conversely, the proportion of the Sydney cohort visiting the MSIC more than 98 times in a calendar year averaged between 2-7% (ranging from 99 - 1,105 visits). When asked if this reflected a change in frequency since first registering, more than half (53%) felt their attendance rates had stayed about the same, 33% felt it had decreased, and the remaining 14% reported an increase in attendance since initial registration.
Figure 3.13: Pie Chart of increased attendance % Figure 3.14: Pie Chart of decreased attendance %
Approximately one-fifth of clients reported increased stress affecting their DCR attendance since initial registration; this was followed by a lack of alternative space as the second most-reported cause of increased consumption room attendance.
Other reasons for increased attendance included:
• Increased drug use • Seeking additional support or services • Social motivations
“Now in stable accommodation” was the most common reason given for lowered attendance, making up approximately one-third of responses. Roughly one quarter of responses related to clients attending less frequently as they were using fewer drugs.
Less common reasons given for decreased DCR attendance included:
• Having less money for drugs • Now employed, less time to attend • Dissatisfied with DCR • On OST
19%
14%
14% 10%
10%
33%
increased attendance increased stress
lack of alt. space
increased drug use
seeking additional support
social motivations
other
36%
23%
11%
4%
9%
7% 5% 5%
decreased attendance
stable accomodation
using fewer drugs
less money for drugs
on OST
now employed, less time
dissatisfied with DCR
less stress
other
29
4 Domain 2: health support & improvement Hedrich et al succinctly outline the aims and objectives of DCRs in their harm reduction monograph of 2010. Aim Two is to ‘improve the health status of target group’; indicators such as risk awareness, smoking/injection hygiene, harm reduction inquiries, and overdose outcomes provide an outcome objective framework for DCRs. This portion of the report is subdivided into two sections, “harm reduction” and “overdose”, and summarises results gathered from the NL cohort on the following topics:
• Drug use hygiene & behaviours • Seeking staff advice • Early signs of overdose • Safe use signposts: preventing overdose • Naloxone (Narcan) • Witnessing an overdose & overdose response
4.1 Harm reduction Harm reduction is one of the four pillars of Dutch drug policy, and is an essential part of public health policies regarding information and prevention (Boekhout van Solange, 1999). Harm reduction is also recognised by Australia’s National Centre for Education and Training on Addiction (NCETA), as a central pillar of the Australian Governments national framework for addressing issues involving alcohol and other drugs. In general, harm reduction is a non-judgemental approach to drug use services which aims to educate and inform people on safer ways of using both licit and illicit substances. Whilst reduction or cessation of drug use may be part of a continuum for some people who use drugs, abstinence is not the focus of harm reduction: the primary focus of harm reduction is to minimise the risks involved with substance use.
“It’s okay. You aren’t going to affect anyone with your drugs here.” male, heroin/cocaine smoker
Consumption rooms provide vital low threshold access to harm reduction by offering space in which visitors can use drugs in a safer environment. A safer environment applies to such basics as sterile paraphernalia, facilities for washing hands, etc., and access to straightforward information and advice on a variety of topics relating to drug use and health (such as blood borne illnesses) (Hunt, 2008).
As an initial introduction to the survey section on harm reduction, respondents were asked if the way they smoke or inject drugs had changed since they had first started visiting the DCR: within the three Primary drug categories, 33% of heroin users, 36% of cocaine users, and 61.5% of those who use heroin/cocaine equally felt that it had.
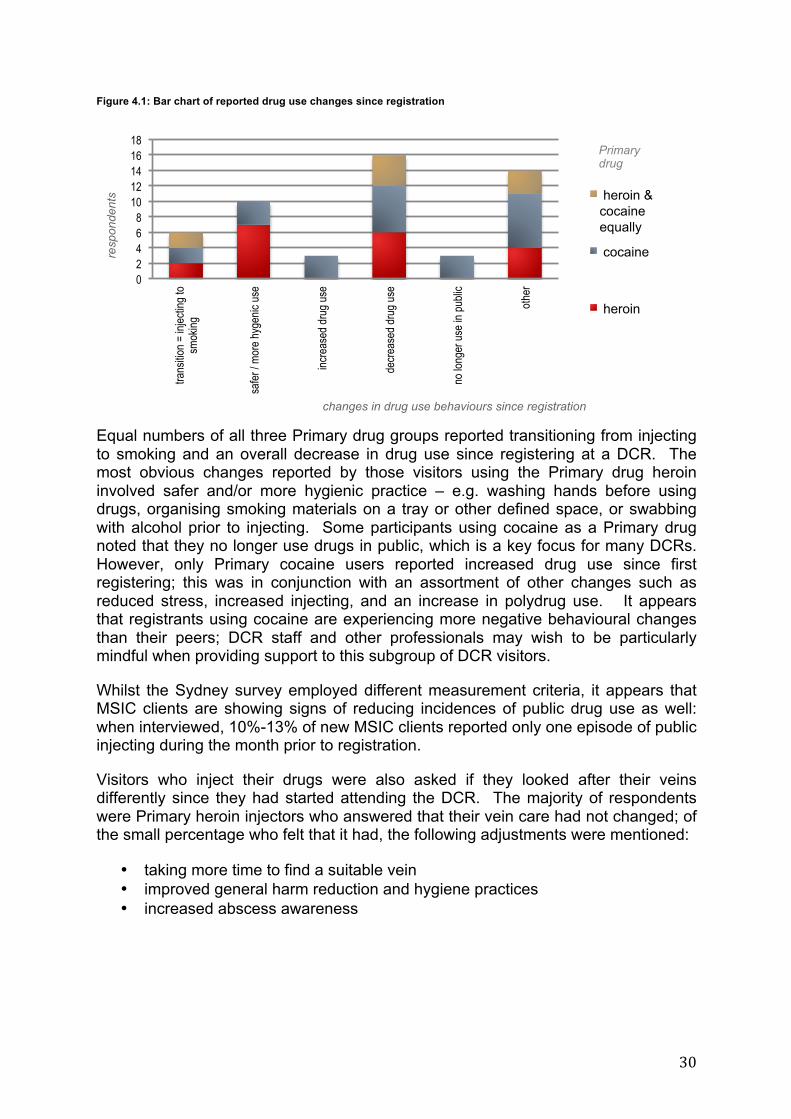
Figure 4.1 illustrates reported changes, based upon Primary drug choice.
30
Figure 4.1: Bar chart of reported drug use changes since registration
Equal numbers of all three Primary drug groups reported transitioning from injecting to smoking and an overall decrease in drug use since registering at a DCR. The most obvious changes reported by those visitors using the Primary drug heroin involved safer and/or more hygienic practice – e.g. washing hands before using drugs, organising smoking materials on a tray or other defined space, or swabbing with alcohol prior to injecting. Some participants using cocaine as a Primary drug noted that they no longer use drugs in public, which is a key focus for many DCRs. However, only Primary cocaine users reported increased drug use since first registering; this was in conjunction with an assortment of other changes such as reduced stress, increased injecting, and an increase in polydrug use. It appears that registrants using cocaine are experiencing more negative behavioural changes than their peers; DCR staff and other professionals may wish to be particularly mindful when providing support to this subgroup of DCR visitors.
Whilst the Sydney survey employed different measurement criteria, it appears that MSIC clients are showing signs of reducing incidences of public drug use as well: when interviewed, 10%-13% of new MSIC clients reported only one episode of public injecting during the month prior to registration.
Visitors who inject their drugs were also asked if they looked after their veins differently since they had started attending the DCR. The majority of respondents were Primary heroin injectors who answered that their vein care had not changed; of the small percentage who felt that it had, the following adjustments were mentioned:
• taking more time to find a suitable vein • improved general harm reduction and hygiene practices • increased abscess awareness
0 2 4 6 8
10 12 14 16 18
trans
ition =
injec
ting t
o sm
oking
safer
/ mor
e hyg
enic
use
incre
ased
drug
use
decre
ased
drug
use
no lo
nger
use i
n pub
lic
other
resp
onde
nts
changes in drug use behaviours since registration
heroin & cocaine equally
cocaine
heroin
Primary drug
31
Visitors who smoked their Primary drugs were asked if they had altered their methods or changed anything about smoking since registering at the DCR. The majority of respondents answering “yes” were Primary cocaine smokers. The most common responses describing what had changed are listed here:
• stopped sharing pipes • stopped smoking ash • smoked less often • no longer freebasing • general pipe care (clean more, use brass screens & replace more frequently,
etc.)
Staff advice
“If you have something to say, they listen. Good staff”, Male, heroin smoker
Surveyed clients were equally divided when asked if they had ever received advice about safer drug use from staff at the DCR - 50% replied they had not, and 50% stated they had. Of the 50% who received advice, 31% found it helpful, and 19% did not. These figures contrast with the Sydney cohort, who reported high levels of overall satisfaction with the quality of advice and information provided by MSIC staff.
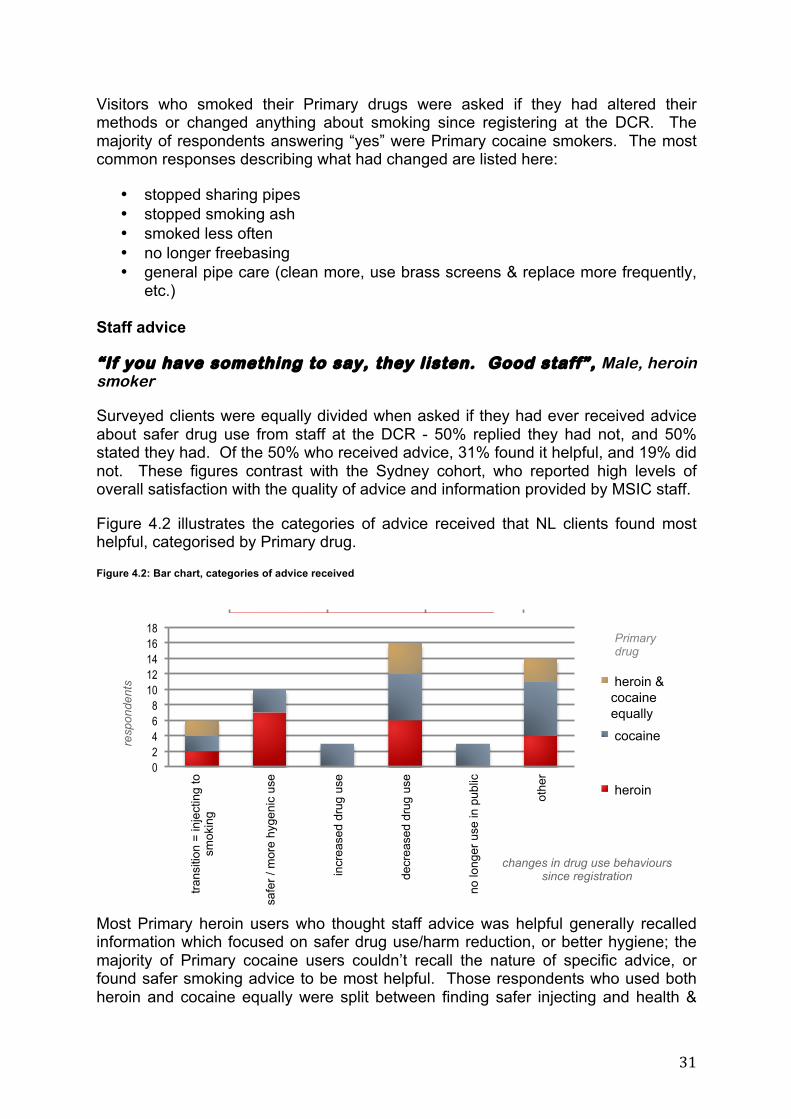
Figure 4.2 illustrates the categories of advice received that NL clients found most helpful, categorised by Primary drug.
Figure 4.2: Bar chart, categories of advice received
Most Primary heroin users who thought staff advice was helpful generally recalled information which focused on safer drug use/harm reduction, or better hygiene; the majority of Primary cocaine users couldn’t recall the nature of specific advice, or found safer smoking advice to be most helpful. Those respondents who used both heroin and cocaine equally were split between finding safer injecting and health &
0 5 10 15
safer injecting
safer smoking
health & hygiene
route transition
never share
use reduction
can't recall
respondents, per Primary drug
Primary, heroin
Primary, cocaine
Primary, heroin & cocaine equally
0 2 4 6 8
10 12 14 16 18
trans
ition
= in
ject
ing
to
smok
ing
safe
r / m
ore
hyge
nic
use
incr
ease
d dr
ug u
se
decr
ease
d dr
ug u
se
no lo
nger
use
in p
ublic
othe
r
resp
onde
nts
changes in drug use behaviours since registration
heroin & cocaine equally
cocaine
heroin
Primary drug
32
hygiene advice most helpful, and being unable to recall the nature of specific advice.
The Sydney cohort reported that in 2009-2010, 32% of information, assessments, or referrals provided involved safer injecting advice (includes overdose risk advice), 19% related to vein care, and 19% were treatment referrals; the remaining 30% of services pertained to medical issues, mental healthcare/counselling, blood-borne viruses, social security or employment, nutrition, sexual health, or legal issues.
4.2 Overdose The use of illicit substances carries risks that are inherent when the purity, potency and diluents of street drugs are unknown to the user. DCRs provide clean, safe environments which are supervised by staff trained to recognise the signs of an overdose crisis, and who can quickly provide assistance. These interventions can ‘prevent overdose symptoms worsening, and potentially reduce injury and/or death due to overdose’ (KPMG, 2010: 10). Whilst the majority of NL DCR visitors smoke their drugs, and smokers present a much lower risk profile, overdose is not strictly limited to people who inject: a 2001 study by Brugal et al reported that within a group of 994 daily smokers of heroin, 3.8% had experienced non-fatal overdose in the preceding 12 months. A second group of 223 non-daily heroin smokers experienced non-fatal overdose rates of 4.5% during the same period.
Non-fatal overdose episodes may result in serious consequences including indirect sequelea such as injury from falls and burns, or direct sequelea such as peripheral neuropathy, paralysis, cognitive impairment, pneumonia, pulmonary oedema, seizure, and cardiac arrhythmia (Warner-Smith, Darke, & Day, 2001).
These non-fatal occurrences may result in ‘life-long compromise of health and wellbeing, a need for support and regular health-care attention, and significant loss of independence’ (Strang, 2002: 97).
Previous studies (Darke et al 1996; White & Irvine, 1999; Darke & Ross, 2000) have established a link between heroin overdose and the concurrent use of either cocaine, or CNS depressants such as alcohol or tranquillisers. There are also numerous studies outlining the inherent dangers of combining cocaine with alcohol, which syntheses to form cocaethylene in the liver; high levels of cocaethylene have been found in the blood of fatal cocaine overdose victims (McCance-Katz et al, 1993; Cornish & O’Brien, 1996; Kaye & Darke, 2004).
As polydrug use presents a greater risk of overdose than single-substance use, overdose information is especially pertinent to the 37% of NL respondents who indicated a crossover between heroin, cocaine, alcohol, and methadone when identifying their Primary and most frequently used drug(s).
More than half of all Primary heroin and Primary cocaine users were familiar with the early signs of overdose (58% and 54%, respectively). Of the visitors who used both heroin and cocaine equally, 69% were familiar with early overdose signs. The four most commonly identified signs of early overdose across all Primary drug categories were unconscious or non-responsive behaviour, blue lips or extremities, unfocussed eyes, and shaking or twitching. Other indicators such as pale skin, sweating, vomiting, and changes to breathing/snoring were all mentioned to a lesser extent.

33
Very few respondents identified changes to their drug-use behaviour which would reduce chances of overdose. To further explore the overdose knowledge and practices of the NL cohort, respondent cases were split according to route of administration for additional analysis.
The main reason most drug smokers seemed to feel changes were unnecessary appeared to be rooted in the idea that as smokers they are not at risk of overdose - when smokers (N=99) were asked to list what they did to reduce their own risk of overdose, 40% responded that they did not inject.
Interestingly, 70% of smokers had witnessed an overdose either at or away from DCR facilities. So while overdose may indeed be less frequent within the smoking cohort, the likelihood exists that smokers may be present when an overdose episode occurs.
Figure 4.3 illustrates the responses of the IDU subgroup with regard to overdose questions.
Figure 4.3: Bar chart, overdose management (IDU subgroup)
not smoking
or injecting
when affected by other drugs or alcohol
tasting for 'purity'
use less if
tolerance is reduced
smoking or
injecting in portions
heard of Naloxone
or Narcan?*
witnessed an OD at the DCR
witnessed an OD not
at the DCR
learned anything about OD from DCR
no 12 8 8 8 2 7 2 10
yes 1 5 5 5 3 6 11 3
0
2
4
6
8
10
12
14
IDUs
7* Question NL78 - data from NL1 incomplete
34
With regard to behaviours that may help lower overdose risk, within the IDU subgroup, 38% tasted their drugs for ‘purity’, injected their drugs in portions, or used less if their tolerance was lowered. Only 7% did not inject drugs while under the influence of alcohol or other drugs. When asked about experiences with overdose episodes, almost half of the IDU subgroup had witnessed an overdose at DCR facilities, and 85% had witnessed an overdose away from DCR facilities.
Finally, respondents were asked if they had learned anything from visiting the DCR that might help them to respond better to an overdose; 23% felt that they had learned to keep the person experiencing overdose awake, conscious and moving, and to call for an ambulance. The few respondents who had learned overdose management from attending the DCR felt they had gained this knowledge from either speaking to other users, or from posters, signs, or leaflets hanging in the facility.
35
5 Domain 3: DCR client support services
5.1 Facility services and external services The availability of auxiliary services in addition to the designated drug consumption area(s) differs between locations, however all participating centres are ‘integrated’ DCRs, and therefore offer a variety of facilities.
Respondents from three of the four participating centres (NL1 data unavailable) were asked if they made use of several services. Figure 5.1 illustrates the responses, per participating site.
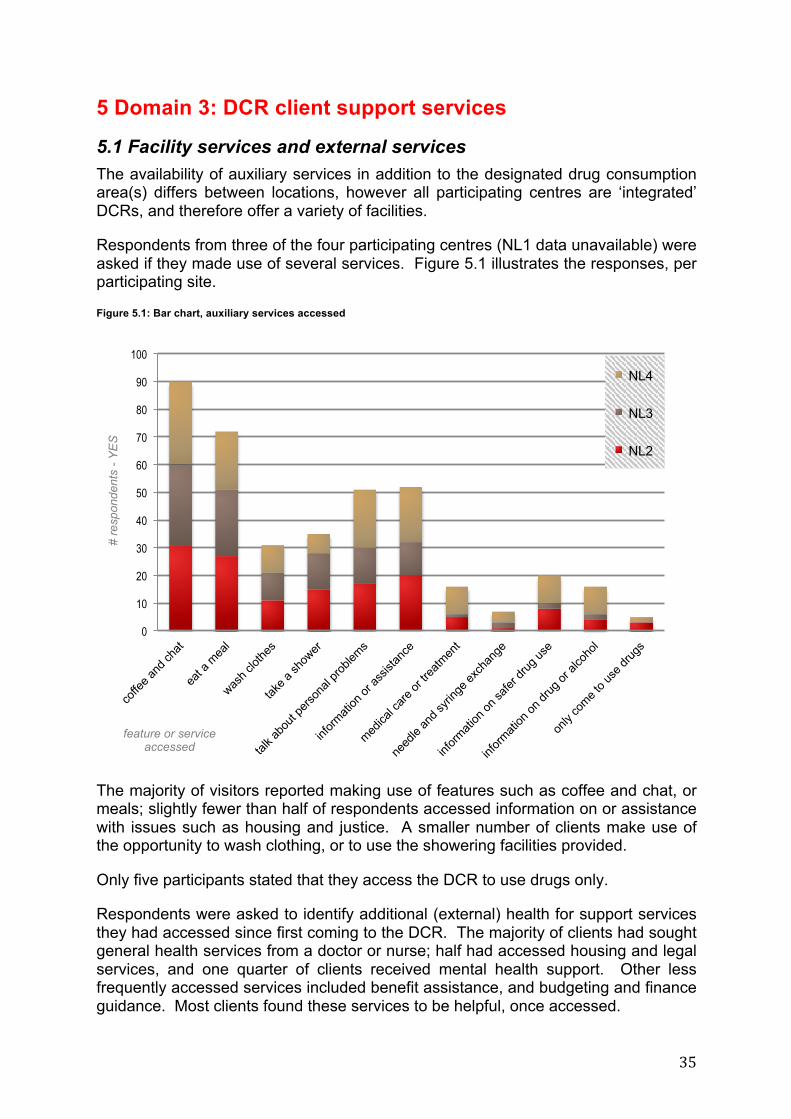
Figure 5.1: Bar chart, auxiliary services accessed
The majority of visitors reported making use of features such as coffee and chat, or meals; slightly fewer than half of respondents accessed information on or assistance with issues such as housing and justice. A smaller number of clients make use of the opportunity to wash clothing, or to use the showering facilities provided.
Only five participants stated that they access the DCR to use drugs only.
Respondents were asked to identify additional (external) health for support services they had accessed since first coming to the DCR. The majority of clients had sought general health services from a doctor or nurse; half had accessed housing and legal services, and one quarter of clients received mental health support. Other less frequently accessed services included benefit assistance, and budgeting and finance guidance. Most clients found these services to be helpful, once accessed.
0
10
20
30
40
50
60
70
80
90
100
# re
spon
dent
s - Y
ES
feature or service accessed
NL4
NL3
NL2
36
When clients from NL2, NL3, and NL4 were asked if they would like any additional information from DCR staff, only a very small proportion felt that they would (N=13). Additional information most requested:
• safer drug use & overdose prevention • service provision • sexual health • education • information on novel drugs or current drug trends
5.2 DCR social workers Social workers are available for all clients registered at each DCR – when participants were asked if they were aware of this, 65% responded yes and that they made use of the service; a further 31% responded yes, but indicated they did not make use of the service. As some clients engage with other agencies that may also provide access to social workers, it is understandable that not all visitors make use of the DCR provision.
When respondents were asked if they found the social worker services provided by the DCR to be helpful, slightly more than half of all clients felt it was.
The most frequent services accessed with the assistance of the DCR social worker are listed below:
• Accommodation (temporary or permanent) • Benefits • Budgeting and finance • Legal support, including passport or residency assistance • General support including emails, phone calls or other administrative tasks
Other services such as education and training, mental health support, or drug treatment were also mentioned to a lesser degree.
Consumption rooms in the Netherlands do not offer integrated alcohol or drug treatment as part of their services; however, DCR social workers are available to assist clients with aspects of referral to a variety of agencies including those who specialise in substance misuse treatment and support services. Participants were asked if they had accessed any of the following alcohol and/or drug services since registering at the DCR: services and their corresponding responses are illustrated in Table 5.2:
37
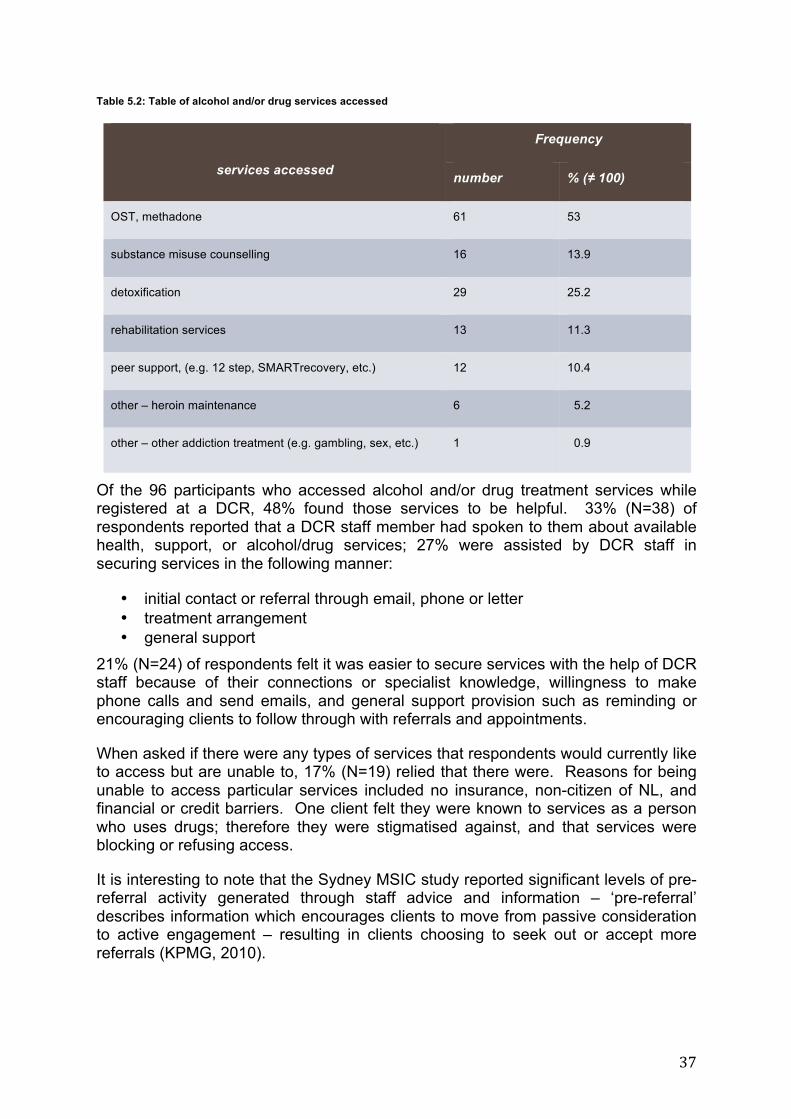
Table 5.2: Table of alcohol and/or drug services accessed
Of the 96 participants who accessed alcohol and/or drug treatment services while registered at a DCR, 48% found those services to be helpful. 33% (N=38) of respondents reported that a DCR staff member had spoken to them about available health, support, or alcohol/drug services; 27% were assisted by DCR staff in securing services in the following manner:
• initial contact or referral through email, phone or letter • treatment arrangement • general support
21% (N=24) of respondents felt it was easier to secure services with the help of DCR staff because of their connections or specialist knowledge, willingness to make phone calls and send emails, and general support provision such as reminding or encouraging clients to follow through with referrals and appointments.
When asked if there were any types of services that respondents would currently like to access but are unable to, 17% (N=19) relied that there were. Reasons for being unable to access particular services included no insurance, non-citizen of NL, and financial or credit barriers. One client felt they were known to services as a person who uses drugs; therefore they were stigmatised against, and that services were blocking or refusing access.
It is interesting to note that the Sydney MSIC study reported significant levels of pre-referral activity generated through staff advice and information – ‘pre-referral’ describes information which encourages clients to move from passive consideration to active engagement – resulting in clients choosing to seek out or accept more referrals (KPMG, 2010).
services accessed
Frequency
number % (≠ 100)
OST, methadone 61 53
substance misuse counselling 16 13.9
detoxification 29 25.2
rehabilitation services 13 11.3
peer support, (e.g. 12 step, SMARTrecovery, etc.) 12 10.4
other – heroin maintenance 6 5.2
other – other addiction treatment (e.g. gambling, sex, etc.) 1 0.9
38
Generally, the more frequently clients visited the MSIC, the more likely they were to have accepted a service referral. For example, 68% of the Sydney cohort who attended the MSIC more than 98 times per year accepted a referral, whereas only 2% of the cohort who attended the MSIC 1-2 times per year accepted a referral.
As outlined in Section 3.4, NL cohort clients attend DCRs significantly more on average than their Sydney counterparts. With that in mind, it would appear that consumption room staff are ideally placed to engage in substantial pre-referral activity with clients.
39
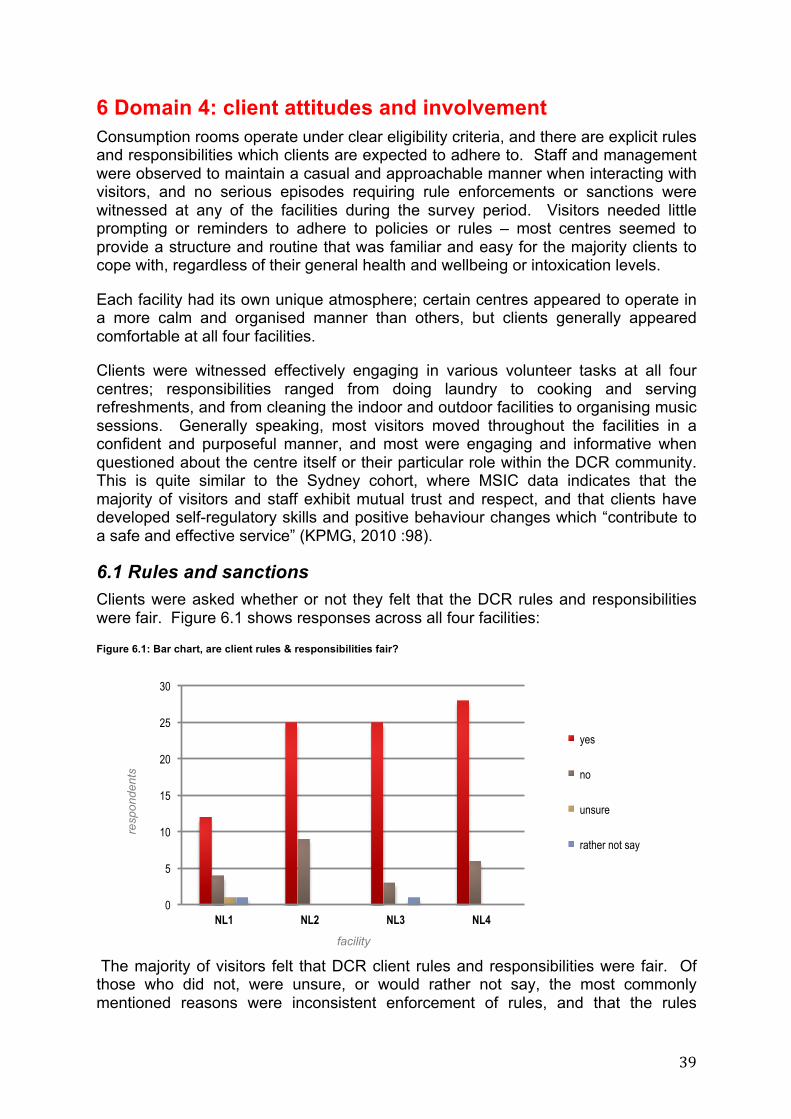
6 Domain 4: client attitudes and involvement Consumption rooms operate under clear eligibility criteria, and there are explicit rules and responsibilities which clients are expected to adhere to. Staff and management were observed to maintain a casual and approachable manner when interacting with visitors, and no serious episodes requiring rule enforcements or sanctions were witnessed at any of the facilities during the survey period. Visitors needed little prompting or reminders to adhere to policies or rules – most centres seemed to provide a structure and routine that was familiar and easy for the majority clients to cope with, regardless of their general health and wellbeing or intoxication levels.
Each facility had its own unique atmosphere; certain centres appeared to operate in a more calm and organised manner than others, but clients generally appeared comfortable at all four facilities.
Clients were witnessed effectively engaging in various volunteer tasks at all four centres; responsibilities ranged from doing laundry to cooking and serving refreshments, and from cleaning the indoor and outdoor facilities to organising music sessions. Generally speaking, most visitors moved throughout the facilities in a confident and purposeful manner, and most were engaging and informative when questioned about the centre itself or their particular role within the DCR community. This is quite similar to the Sydney cohort, where MSIC data indicates that the majority of visitors and staff exhibit mutual trust and respect, and that clients have developed self-regulatory skills and positive behaviour changes which “contribute to a safe and effective service” (KPMG, 2010 :98).
6.1 Rules and sanctions Clients were asked whether or not they felt that the DCR rules and responsibilities were fair. Figure 6.1 shows responses across all four facilities:
Figure 6.1: Bar chart, are client rules & responsibilities fair?
The majority of visitors felt that DCR client rules and responsibilities were fair. Of those who did not, were unsure, or would rather not say, the most commonly mentioned reasons were inconsistent enforcement of rules, and that the rules
Are client rules and responsibilities fair?
0
5
10
15
20
25
30
NL1 NL2 NL3 NL4
resp
onde
nts
facility
yes
no
unsure
rather not say
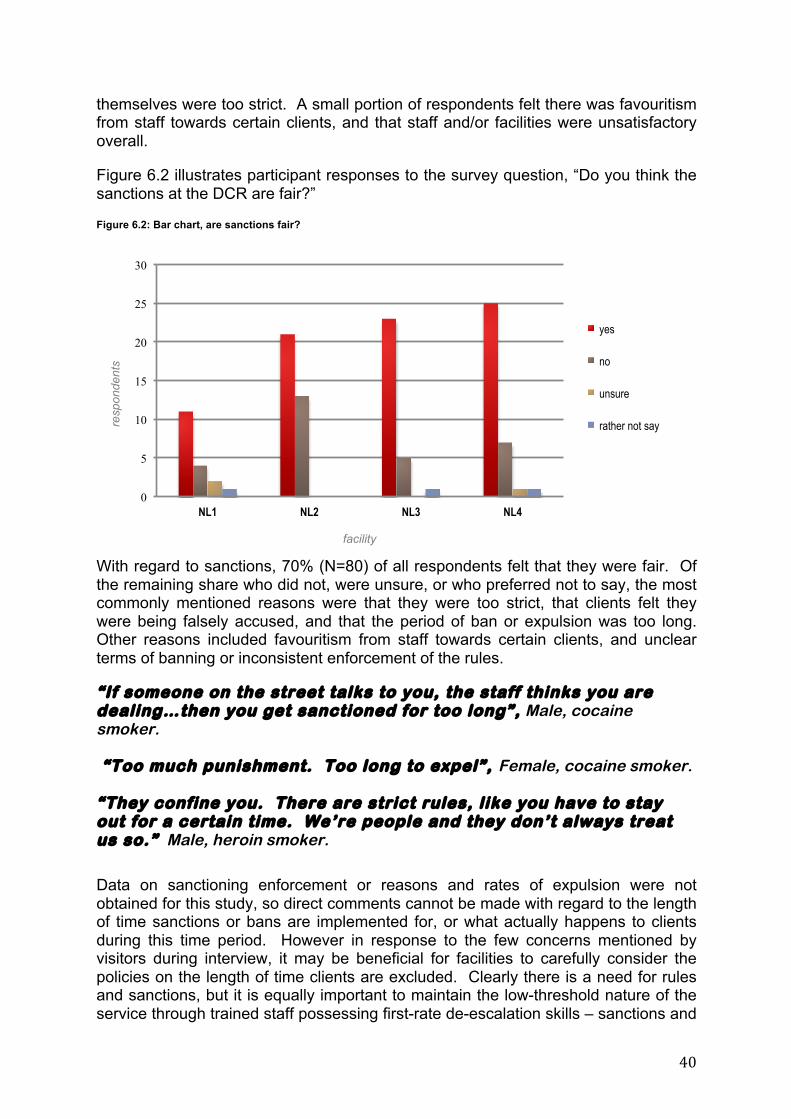
40
themselves were too strict. A small portion of respondents felt there was favouritism from staff towards certain clients, and that staff and/or facilities were unsatisfactory overall.
Figure 6.2 illustrates participant responses to the survey question, “Do you think the sanctions at the DCR are fair?”
Figure 6.2: Bar chart, are sanctions fair?
With regard to sanctions, 70% (N=80) of all respondents felt that they were fair. Of the remaining share who did not, were unsure, or who preferred not to say, the most commonly mentioned reasons were that they were too strict, that clients felt they were being falsely accused, and that the period of ban or expulsion was too long. Other reasons included favouritism from staff towards certain clients, and unclear terms of banning or inconsistent enforcement of the rules.
“If someone on the street talks to you, the staff thinks you are dealing…then you get sanctioned for too long”, Male, cocaine smoker. “Too much punishment. Too long to expel”, Female, cocaine smoker. “They confine you. There are strict rules, like you have to stay out for a certain time. We’re people and they don’t always treat us so.” Male, heroin smoker. Data on sanctioning enforcement or reasons and rates of expulsion were not obtained for this study, so direct comments cannot be made with regard to the length of time sanctions or bans are implemented for, or what actually happens to clients during this time period. However in response to the few concerns mentioned by visitors during interview, it may be beneficial for facilities to carefully consider the policies on the length of time clients are excluded. Clearly there is a need for rules and sanctions, but it is equally important to maintain the low-threshold nature of the service through trained staff possessing first-rate de-escalation skills – sanctions and
0
5
10
15
20
25
30
NL1 NL2 NL3 NL4
resp
onde
nts
facility
yes
no
unsure
rather not say
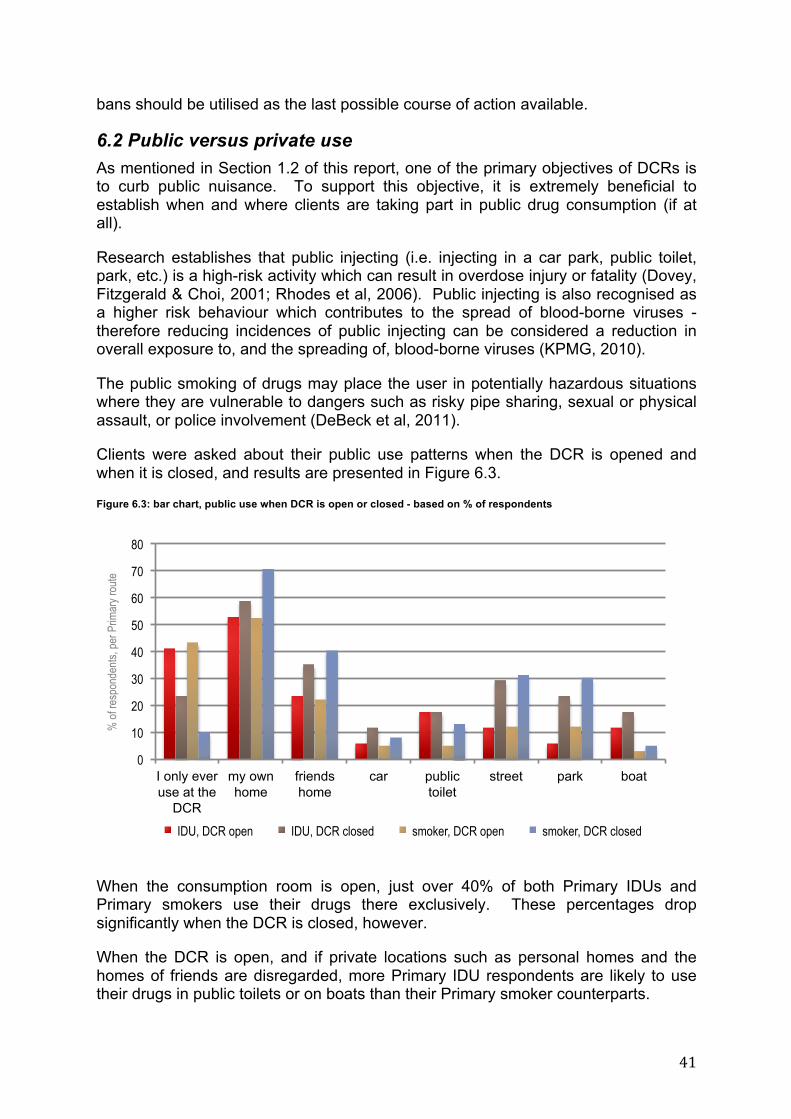
41
bans should be utilised as the last possible course of action available.
6.2 Public versus private use As mentioned in Section 1.2 of this report, one of the primary objectives of DCRs is to curb public nuisance. To support this objective, it is extremely beneficial to establish when and where clients are taking part in public drug consumption (if at all).
Research establishes that public injecting (i.e. injecting in a car park, public toilet, park, etc.) is a high-risk activity which can result in overdose injury or fatality (Dovey, Fitzgerald & Choi, 2001; Rhodes et al, 2006). Public injecting is also recognised as a higher risk behaviour which contributes to the spread of blood-borne viruses - therefore reducing incidences of public injecting can be considered a reduction in overall exposure to, and the spreading of, blood-borne viruses (KPMG, 2010).
The public smoking of drugs may place the user in potentially hazardous situations where they are vulnerable to dangers such as risky pipe sharing, sexual or physical assault, or police involvement (DeBeck et al, 2011).
Clients were asked about their public use patterns when the DCR is opened and when it is closed, and results are presented in Figure 6.3.
Figure 6.3: bar chart, public use when DCR is open or closed - based on % of respondents
When the consumption room is open, just over 40% of both Primary IDUs and Primary smokers use their drugs there exclusively. These percentages drop significantly when the DCR is closed, however.
When the DCR is open, and if private locations such as personal homes and the homes of friends are disregarded, more Primary IDU respondents are likely to use their drugs in public toilets or on boats than their Primary smoker counterparts.
0
10
20
30
40
50
60
70
80
I only ever use at the
DCR
my own home
friends home
car public toilet
street park boat
% of
resp
onde
nts, p
er P
rimar
y rou
te
IDU, DCR open IDU, DCR closed smoker, DCR open smoker, DCR closed
42
Approximately the same numbers of Primary IDUs and Primary smokers reported using their drugs in cars or on the street, and a higher percentage of Primary smokers than Primary IDUs reported using drugs in public parks. When the consumption room is closed, it appears once again that clients are predominantly using their drugs in the privacy of their own or their friends’ homes. With regard to public use, higher percentages of Primary IDUs and Primary smokers use their drugs on the street or in parks when the DCR is closed versus when it is open. Significantly higher percentages of Primary smokers use their drugs in public toilets when the DCR is closed versus when it is open; conversely, significantly higher percentages of Primary IDUs use their drugs in public parks when the DCR is closed versus when it is open.
When respondents were asked “why might you use elsewhere?” the most frequently stated reasons included the following:
• at home • the DCR is closed • withdrawing, “dopesick” • too far away to get to the DCR • using with non-DCR friends
KPMG reported that 96% of current MSIC clients reported a reduction in public injecting since they had begun attending the MSIC, and that during opening hours the majority of clients reported only injecting at the MSIC. While no direct comparison can be made between the Sydney cohort and the IDU subpopulation of the NL cohort, it is clear that clients of both the Sydney and NL cohorts report their public injecting episodes decrease when safe alternatives are available.
Clients were asked “would you prefer to use drugs at the DCR if you had a choice 24 hours a day, 7 days a week?” Responses were almost equally split with 53 clients saying yes, 58 clients saying no, and 4 respondents unsure.
When clients who expressed a preference for 24/7 access to the DCR were asked why, the most commonly offered reasons were as follows:
• safety • to come in off the streets • social opportunities • privacy • to avoid police
Alternatively, when clients who were not interested in 24/7 access to the DCR were asked why not, the most commonly offered reasons were as follows:
• already have their own home • it would be too much, drug use would increase • already adjusted use to the current DCR opening times • too noisy or too busy at the DCR
43
Respondents were also asked why they might continue to access DCR services when they have their own home, and the following answers were noted:
• social opportunities • access to services • unable to use drugs where living • keeping drug use and home life separate • avoid boredom • for safety
Generally, clients identified a wide variety of reasons for accessing the DCR, even when they did not expressly need to to use their drugs. The DCR provides an important social outlet for many clients, and enabled a portion of visitors to keep their home life and drug use separate for reasons ranging from a preference for restricting drug use to consumption rooms, to choosing not to use drugs in front of their children or other family members, to engaging in social activities and avoiding boredom.
“It’s important to feel like a human being, and to keep our values.” Female, cocaine smoker
Interestingly, many drug consumption clients who do not rely on DCR access to use drugs still choose to engage with DCR services. This option seems to provide some clients in particular a healthy opportunity to actively choose how, when, and where they use their drugs, and to decide whether or not they wish to keep various aspects of their family and home-life separate. Several clients also expressed that the DCR was an important social outlet; friendship bonds clearly exist within the boundaries of the DCR environment that allow users to feel accepted by and connected to other people.
The majority of clients know other drug users who do not attend the DCR. Potential reasons for non-attendance included the following:
• have own home, accommodation, or other non-DCR place to use • no contract • anonymity issues, don’t like being watched when using drugs • don’t like DCRs • don’t like the rules
When respondents were asked if they encouraged other drug users to come to the DCR, 62 of 115 respondents stated they would not. When asked why, it became clear that respondents possessed strong opinions about autonomy and choice - the most frequently offered explanation was that clients did not want the responsibility of making that choice for others, and many expressed the opinion that it wasn’t their “job to do so”, or that other drug users must take the responsibility themselves.
More reasons for not telling others about the DCR included some clients felt they had nobody to tell – that they only know other DCR clients; that strict criteria meant other users may not be allowed; or that some clients did not discuss their drug use with others.
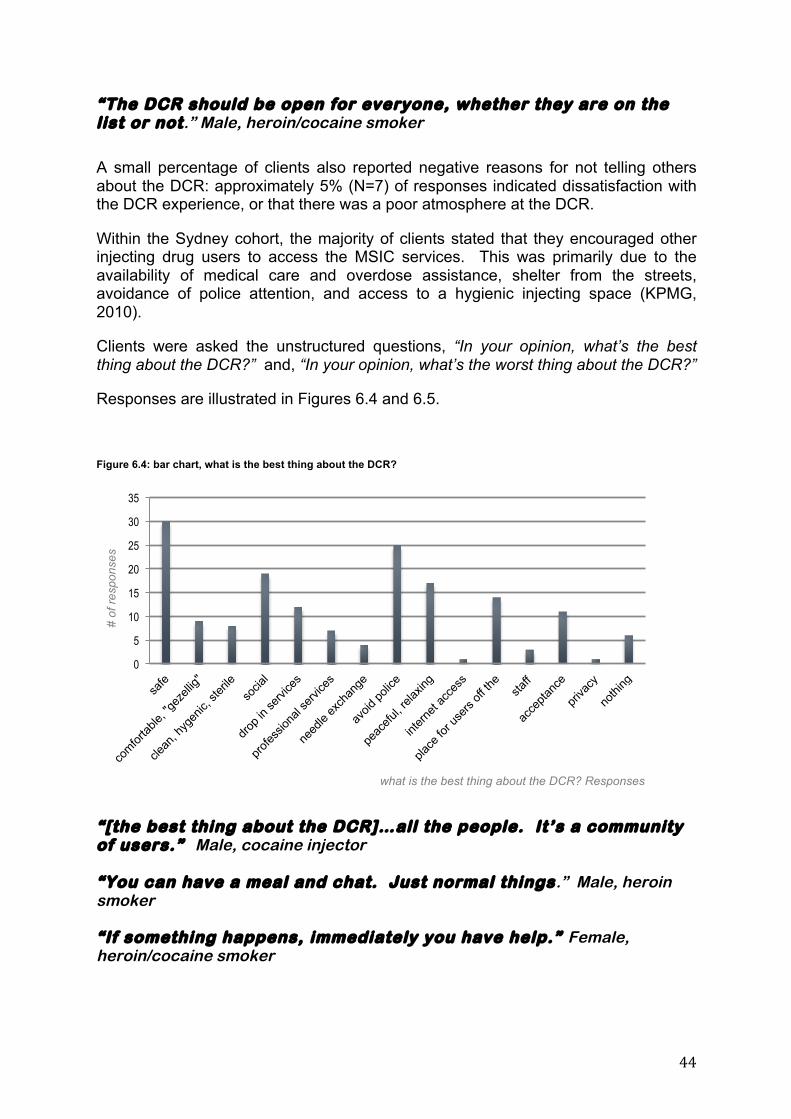
44
“The DCR should be open for everyone, whether they are on the list or not.” Male, heroin/cocaine smoker A small percentage of clients also reported negative reasons for not telling others about the DCR: approximately 5% (N=7) of responses indicated dissatisfaction with the DCR experience, or that there was a poor atmosphere at the DCR.
Within the Sydney cohort, the majority of clients stated that they encouraged other injecting drug users to access the MSIC services. This was primarily due to the availability of medical care and overdose assistance, shelter from the streets, avoidance of police attention, and access to a hygienic injecting space (KPMG, 2010).
Clients were asked the unstructured questions, “In your opinion, what’s the best thing about the DCR?” and, “In your opinion, what’s the worst thing about the DCR?”
Responses are illustrated in Figures 6.4 and 6.5.
Figure 6.4: bar chart, what is the best thing about the DCR?
“[the best thing about the DCR]…all the people. It’s a community of users.” Male, cocaine injector “You can have a meal and chat. Just normal things.” Male, heroin smoker “If something happens, immediately you have help.” Female, heroin/cocaine smoker
0
5
10
15
20
25
30
35
# of
resp
onse
s
what is the best thing about the DCR? Responses
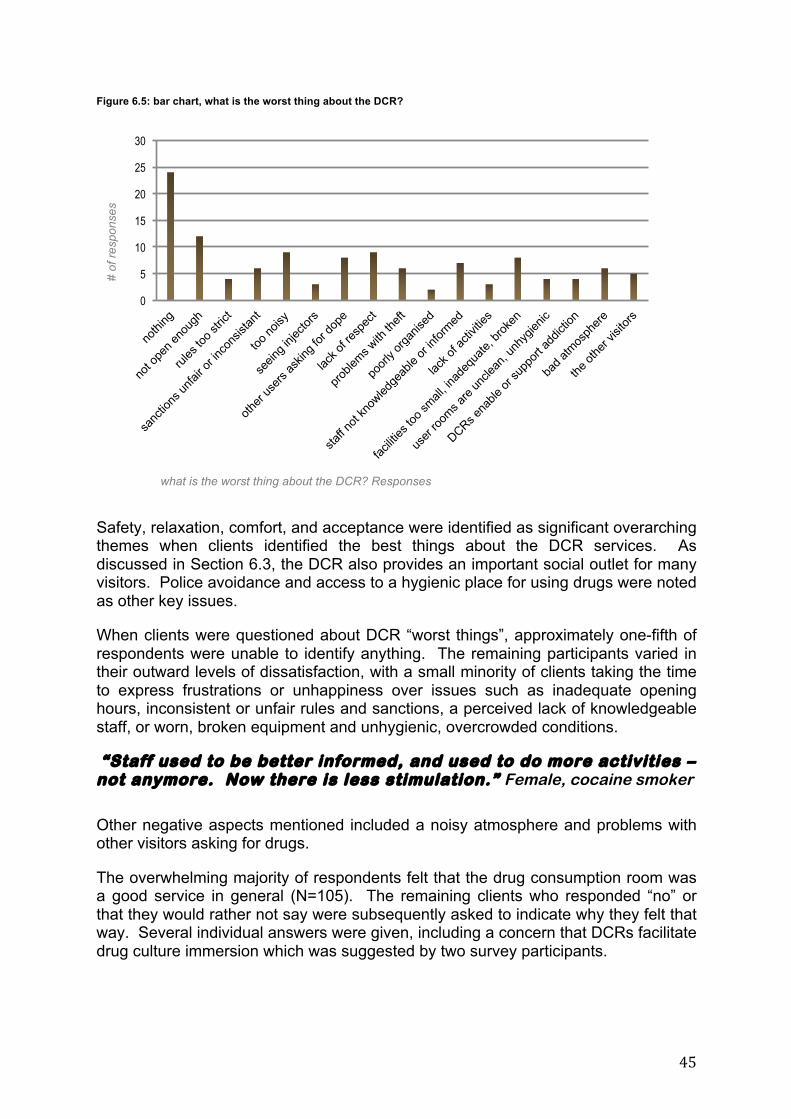
45
Figure 6.5: bar chart, what is the worst thing about the DCR?
Safety, relaxation, comfort, and acceptance were identified as significant overarching themes when clients identified the best things about the DCR services. As discussed in Section 6.3, the DCR also provides an important social outlet for many visitors. Police avoidance and access to a hygienic place for using drugs were noted as other key issues.
When clients were questioned about DCR “worst things”, approximately one-fifth of respondents were unable to identify anything. The remaining participants varied in their outward levels of dissatisfaction, with a small minority of clients taking the time to express frustrations or unhappiness over issues such as inadequate opening hours, inconsistent or unfair rules and sanctions, a perceived lack of knowledgeable staff, or worn, broken equipment and unhygienic, overcrowded conditions.
“Staff used to be better informed, and used to do more activities – not anymore. Now there is less stimulation.” Female, cocaine smoker Other negative aspects mentioned included a noisy atmosphere and problems with other visitors asking for drugs.
The overwhelming majority of respondents felt that the drug consumption room was a good service in general (N=105). The remaining clients who responded “no” or that they would rather not say were subsequently asked to indicate why they felt that way. Several individual answers were given, including a concern that DCRs facilitate drug culture immersion which was suggested by two survey participants.
0
5
10
15
20
25
30
# of
resp
onse
s
what is the worst thing about the DCR? Responses

46
7 Conclusion This report has provided an overview of the drug consumption room (DCR) client overview survey. The survey aims to provide a baseline, or starting point, from which to further inform the evidence base on the health and wellbeing of consumption room visitors in the Netherlands and, eventually, across Europe.
Four primary domains have been covered in this report. Domain One focussed predominantly on client demographics, including characteristics such as age, homelessness history, marital and employment status, and history of incarceration. Homelessness in particular has been highlighted as an important factor which impacts clients in a multitude of ways. As significant amounts of the NL cohort have experienced lengthy periods of homelessness in the past, or are currently homeless, this issue is one which deserves more discussion.
Details of Primary and most-frequently used substances were documented and discussed, as were specific issues such as polydrug use and the particular issues of IDUs. Routes of administration were also discussed, and a comparison potential between heroin, cocaine and both heroin/cocaine polydrug users was introduced. Histories of opiate substitution therapy were covered, and potential issues surrounding methadone dosing was discussed in detail. DCR attendance was analysed, and the extensive histories of registration and lengthy attendance episodes most clients report was presented as an ideal opportunity for staff to engage and support clients. The acute dangers of polydrug use have been clearly outlined; as 30-37% of respondents report crossover use between heroin and cocaine (and including methadone and alcohol), this is an issue of pressing importance.
Domain Two focussed on harm reduction and overdose: issues of harm reduction such as significant portions of clients transitioning from injecting to smoking, or practicing safer smoking techniques such as not smoking ash and using pipes with better quality screens were documented. Overdose awareness and management have been extensively discussed within the report: issues of polydrug use increasing overdose potential and non-fatal overdose dangers are two of the topics mentioned. Despite the fact that the vast majority of DCR clients smoke their drugs, and are therefore in a much lower fatal overdose risk category than IDUs, there still remains a need for overdose awareness within the population. 70% of Primary smokers had witnessed an overdose crisis either inside or outside of the DCR facility – a firmer understanding of overdose management and risks could potentially save lives.
Domain Three discussed DCR facility services, external services such as alcohol and drug treatment services, and access to social workers. Clearly, DCR clients make extensive use of the facilities and are offered large amounts of staff contact and opportunities to contemplate or request referrals. Most clients access the DCR for social and safety reasons – clients feel accepted, and part of a social group. Safety and hygiene were important factors for accessing DCR facilities also. As this is a primary aim for DCRs, it is clear that visitors are benefitting from the low threshold harm reduction services on offer. Clients frequently made use of the DCR social worker service, and those who did not accessed social care support through other agencies.
47
The majority of clients found DCR social workers to be helpful to varying degrees, and many had accessed alcohol or drug treatment either on their own or with the assistance of social workers.
Several clients also felt that accessing services was easier when assisted by a social worker.
Finally, Domain Five focussed on DCR rules and sanctions, DCR experiences, and public versus private use. When it comes to DCR rules, most respondents felt that they were fair, however a minority expressed dissatisfaction with issues such as inconsistent rules, or perceived favouritism. Sanctions are perceived as ‘fair’ by 70% of visitors, however the minority 30% felt that sanctions were too harsh, and that bans or expulsions lasted too long. As these measures are severe and potentially harmful, a review of procedures may be beneficial to all.
Clients generally reported a decrease in public drug use, and several visitors altered their use patterns so that they only used their Primary drug during DCR hours of operation. During the hours that the DCR facilities were closed, clients continued to use spaces such as public toilets and parks to smoke or inject drugs, albeit in low numbers. It is interesting to note, however, that the majority of clients who have access to their own home for drug use frequently chose to attend DCR sessions instead. Considering the frequency of attendance and the length of registration periods of most visitors (many have been registered clients for over a decade), it is clear that the DCR serves a larger purpose than “just” harm reduction. Clients rely heavily on the facilities as a normalising social outlet – acceptance and friendship are primary reasons visitors continue to access DCR facilities even when other private options for drug use were available.
Curiously, a large proportion of clients felt it is not their place to recommend DCR facilities to other drug users; this is an interesting phenomenon which deserves further exploration beyond the scope of this survey, however it has been introduced and briefly discussed in Section 6.3. Lastly, a review of client opinions on the ‘best’ and ‘worst’ aspects of consumption rooms was covered, and clients were asked if they felt that DCRs were good services, overall. Answers to these unstructured, open questions were thematically reviewed, and the primary categories of responses were grouped and charted.
Throughout the report, relevant client quotes from the survey interviews have been interspersed to add depth and character to the various sections.
48
Bibliography Ameijden, E.J.C. van & R.A. Coutinho (2001) ‘Large decline in injecting drug use in Amsterdam, 1986-1988: explanatory mechanisms and determinants of injecting transitions’. Journal of Epidemiology & Community Health, 55, 356-353. Aquilino, W.S. (1994) ‘Interview mode effects in surveys of drug and alcohol use: a field experiment’. The Public Opinion Quarterly, 58(2), 210-240. Boekhout van Solange, T. (1999) ‘Dutch drug policy in a European context’. Journal of Drug Issues, 29 (5), 511-528. Brugal, M.T., G. Barrio, L. De La Fuente, E. Regidor, L. Royuela & J.M. Suelves (2001) ‘Factors associated with non-fatal heroin overdose: assessing the effect of frequency and route of heroin administration’, Addiction, 97, 319-327. Clark, T. (2008) ‘‘‘We’re over-researched here!” Exploring accounts of research fatigue within qualitative research engagements’. Sociology, 42 (5), 953-970. Cornish, J.W. & C.P. O’Brien (1996) ‘Crack cocaine abuse: an epidemic with many public health consequences’, Annual Review of Public Health,17, 259-273. Darke, S., J. Ross & W. Hall (1996) ‘Overdose among heroin users in Sydney, Australia. I. Prevalence and correlates of non-fatal overdose’. Addiction, 91, 405-411. Darke, S. & J. Ross (2000) ‘Fatal heroin overdoses resulting from non-injecting routes of administration, NSW, Australia, 1992-96’. Addiction, 95, 560-573. DeBeck, K., J. Buxton, T. Kerr, J. Qi, J. Montaner & E. Wood (2011) ‘Public crack cocaine smoking and willingness to use a supervised inhalation facility: implications for street order’. Substance Abuse Treatment, Prevention, and Policy, 6(4) open access [On-line] available at: http://www.biomedcentral.com/content/pdf/1747-597X-6-4.pdf Dolan, K., & A. Wodak (1996) ‘Final Report on Injecting Rooms in Switzerland’, (unpublished manuscript). Dolan, K., J. Kimber, C. Fry, J. Fitzgerald, D. McDonald & F. Trautmann (2000) ‘Drug consumption facilities in Europe and the establishment of supervised injecting centres in Australia’. Drug and Alcohol Review, 19, 337-346. Dovey, K., J. Fitzgerald & Y. Choi (2001) ‘Safety becomes danger: dilemmas of drug-use in public space’. Health & Place, 7(4), 319-331. EMCDDA (2002) ‘Polydrug Use’, selected issue: EMCDDA 2002 Annual report on the state of the drugs problem in the European Union and Norway [On-line] available at: http://www.emcdda.europa.eu/html.cfm/index34913EN.html
49
Focus Migration (2007) Country Profile 11: Netherlands [On-line] available at: http://www.focus-migration.de/ Fry, C. & R. Dwyer (2001) ‘For love or money? An exploratory study of why injecting drug users participate in research’, Addiction, 96 (9), 1319-1325. Fry, C., W. Hall, A. Ritter & R. Jenkinson (2006) ‘The ethics of paying drug users who participate in research: a review and practical recommendations’. Journal of Empirical Research on Human Research Ethics: An International Journal, 1 (4), 21-36. Garretsen, H.F.L. (2010) ‘The Dutch and their drugs: The end of an era? Reflections on Dutch policies towards tobacco, alcohol and illegal drugs’, Drugs: education, prevention and policy, 17(5), 485-495. Grund, JP. & P. Blanken (1997) ‘From Chasing the Dragon to Chinezen: The diffusion of heroin smoking in the Netherlands’. IVO Series 3, Addiction Research Institute, Medical and Health faculty, Erasmus University, Rotterdam, the Netherlands. [On-line] available at: http://www.drugtext.org/pdf/grund02.pdf Grund, JP & J. Breeksema (2013) ‘Coffee Shops and Compromise: separated illicit drug markets in the Netherlands’. Global Drug Policy Program. New York: Open Society Foundations. Håkansson, A. & M. Berglund (2012) ‘Risk factors for criminal recidivism – a prospective follow-up study in prisoners with substance abuse’. BMC Psychiatry, 12:111 [on-line] available at: http://www.biomedcentral.com/1471-244X/12/111 Havinga, P., C. van der Velden, A. de Gee & A. van der Poel (2014) ‘Differences in sociodemographic, drug use and characteristics between never, former, and current injecting, problematic hard-drug users in the Netherlands’. Harm Reduction Journal, 11(6) [On-line] available at: http://www.harmreductionjournal.com/content/11/1/6 Hedrich, D. (2004) European report on drug consumption rooms. Lisbon: EMCDDA. Hedrich, D., T. Kerr & F. Dubois-Arber (2010) 'Chapter 11; Drug consumption facilities in Europe and beyond'. [On-line] available at: http://www.emcdda.europa.eu/publications/monographs/harm-reduction Hermans, K. (2012) ‘The Dutch Strategy to Combat Homelessness: From Ambition to Window Dressing? European Journal of Homelessness, 6 (2), 101-118. Hunt, N. (2008) 'Guidance on standards for the establishment and operation of drug consumption rooms in the UK'. [On-line] available at: http://www.jrf.org.uk/publications/guidance-standards-establishment-and-operation-drug-consumption-rooms-uk Joseph Rowntree Foundation (2006) 'The report of the Independent Working Group on Drug Consumption Rooms'. [On-line] available at: www.jrf.org.uk/sites/files/jrf/9781859354711.pdf
50
Kaye, S. & S. Darke (2004) ‘Non-fatal cocaine overdose among injecting and non-injecting cocaine users in Sydney, Australia’. Addiction, 9(10), 1315-1322. Kools, JP (2010) ‘From fix to foil: The Dutch experience in promoting transition away from injecting drug use 1991-2010’. [On-line] available at: http://www.exchangesupplies.org/article_moving_from_fix_to_foil_dutch_experience_by_John-Peter_Kools.php KPMG (2010) 'NSW Health; Further evaluation of the Medically Supervised Injecting Centre during its extended Trial period (2007 – 2011) Final report.' 14 September 2010. [On-line] available at: http://www.health.nsw.gov.au/mhdao/Documents/msic-fr.pdf Kumar, MS (2012) ‘UNODC Methadone Maintenance Treatment Intervention Toolkit’. Published by: United Nations Office on Drugs and Crime, Regional Office for South Asia. Larney, S. & K.A. Martire (2010) ‘Factors affecting criminal recidivism among participants in the Magistrates Early Referral Into Treatment (MERIT) program in New South Wales, Australia. Drug and Alcohol Review, 29 (6), 684-688. McCance-Katz, E.F., L.H. Price, C.J. McDougle, T.R. Kosten, J.E. Black & P.I. Jatlow (1993) ‘Concurrent cocaine-ethanol ingestion in humans: pharmacology, physiology, behaviour, and the role of cocaethylene’. Psychopharmacology, 111, 39-46. “NCETA” National Centre for Education and Training on Addiction, National Research Centre on Alcohol and other Drugs Workforce Development (Australia), ‘The National Drug Strategy, 2004-2009 – Harm Minimisation Statement’ [on-line] available at: http://nceta.flinders.edu.au/society/harm-minimisation/ Nougier, M. & E. Schatz (2012) Drug consumption rooms; Evidence and practice. London: International Drug Policy Consortium. Pearl, J. (2009) ‘Causal inference in statistics: An overview’. Statistics Surveys, 3, 96-146. Rhodes, T., J. Kimber, W. Small, J. Fitzgerald, T. Kerr, M. Hickman & G. Holloway (2006) ‘Public injecting and the need for ‘safer environment interventions’ in the reduction of drug-related harm’. Addiction, 101(10), 1384-1393. Stewart, D., M. Gossop, J Marsden & A. Rolfe (2000) ‘Drug misuse and acquisitive crime among clients recruited to the National Treatment Outcome Research Study (NTORS)’. Criminal Behaviour and Mental Health, 10 (1), 10-20. Strang, J. (2002) ‘Looking beyond death: paying attention to other important consequences of heroin overdose (Editorial)’. Addiction, 97(8), 927-928.
51
Van Laar, M., G. Cruts, M. van Ooyen-Houben, E. Croes, P. van der Pol, R. Meijer & T. Ketelaars (2013) ‘The Netherlands Drug Situation 2013: Report to the EMCDDA by the Reitox National Focal Point’ [draft version]. Van Stratten, B., C.T.M. Schrijvers, J. Van der Laan, S.N. Boersma, G. Rodenburg, J.R.L.M. Wolf, D. Van de Mheen (2014) ‘Intellectual Disability among Dutch homeless people: prevalence and related psychosocial problems’. PLoS ONE 9(1): [On-line] available at: e86112. doi:10.1371/journal.pone.0086112 Walter, M., G.A. Wiesbeck, V. Dittmann & M. Graf (2011) ‘Criminal recidivism in offenders with personality disorders and substance use disorders over 8 years of time at risk’. Psychiatry Research, 186 (2-3), 443-445. Warner-Smith, M., S. Darke, & C. Day (2002) ‘Morbidity associated with non-fatal heroin overdose’. Addiction, 97(8), 963-967. White, J.M. & R.J. Irvine (1999) ‘Mechanisms of fatal heroin overdose’. Addiction, 94, 961-972. Woods, S. (2014) ‘Drug consumption rooms in Europe: organisational overview’. Amsterdam: Correlation Network. World Health Organization (2009) ‘Guidelines for the Psychosocially Assisted Pharmacological Treatment of Opioid Dependence’. Geneva: WHO Press. Ysa, T., J. Colom, A. Albareda, A. Ramon & L. Segura (2011) Governance of Addictions: European Public Policies. Oxford: Oxford University Press.
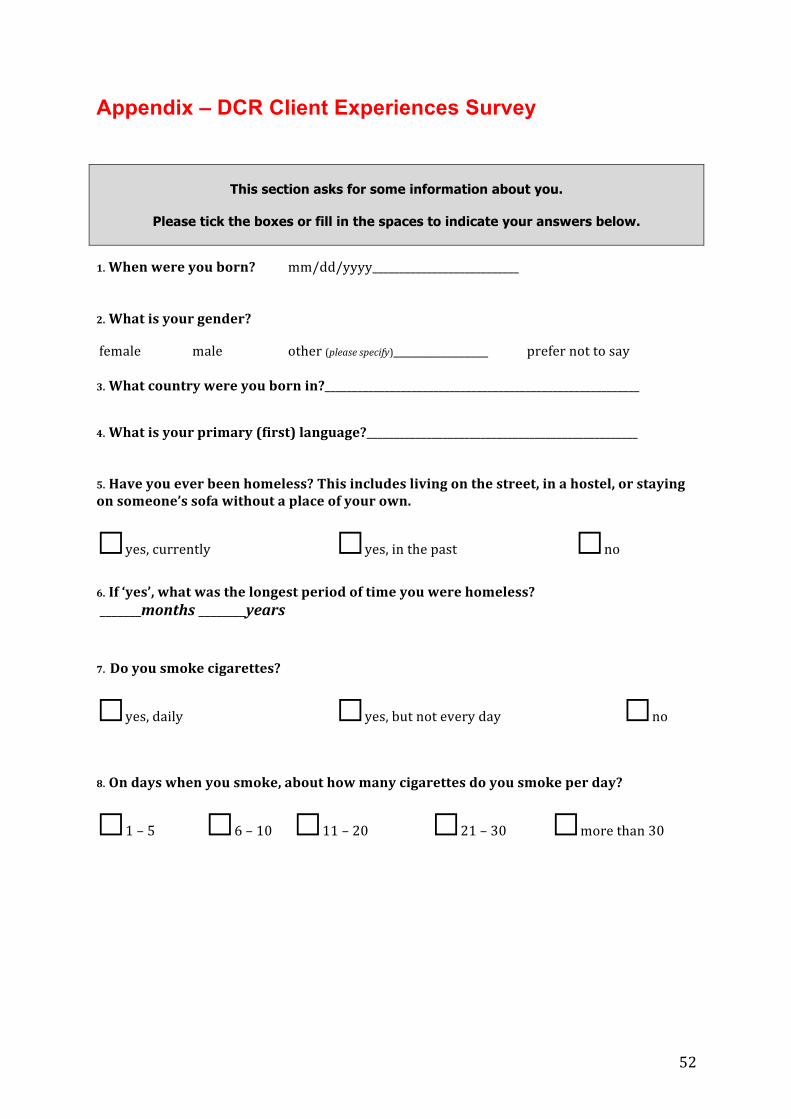
52
Appendix – DCR Client Experiences Survey
This section asks for some information about you.
Please tick the boxes or fill in the spaces to indicate your answers below. 1. When were you born? mm/dd/yyyy___________________________ 2. What is your gender? female male other (please specify)________________ prefer not to say 3. What country were you born in?__________________________________________________________ 4. What is your primary (first) language?__________________________________________________ 5. Have you ever been homeless? This includes living on the street, in a hostel, or staying on someone’s sofa without a place of your own.
□yes, currently □yes, in the past □no 6. If ‘yes’, what was the longest period of time you were homeless? _______months ________years 7. Do you smoke cigarettes?
□yes, daily □yes, but not every day □no 8. On days when you smoke, about how many cigarettes do you smoke per day?
□1 – 5 □6 – 10 □11 – 20 □21 – 30 □more than 30
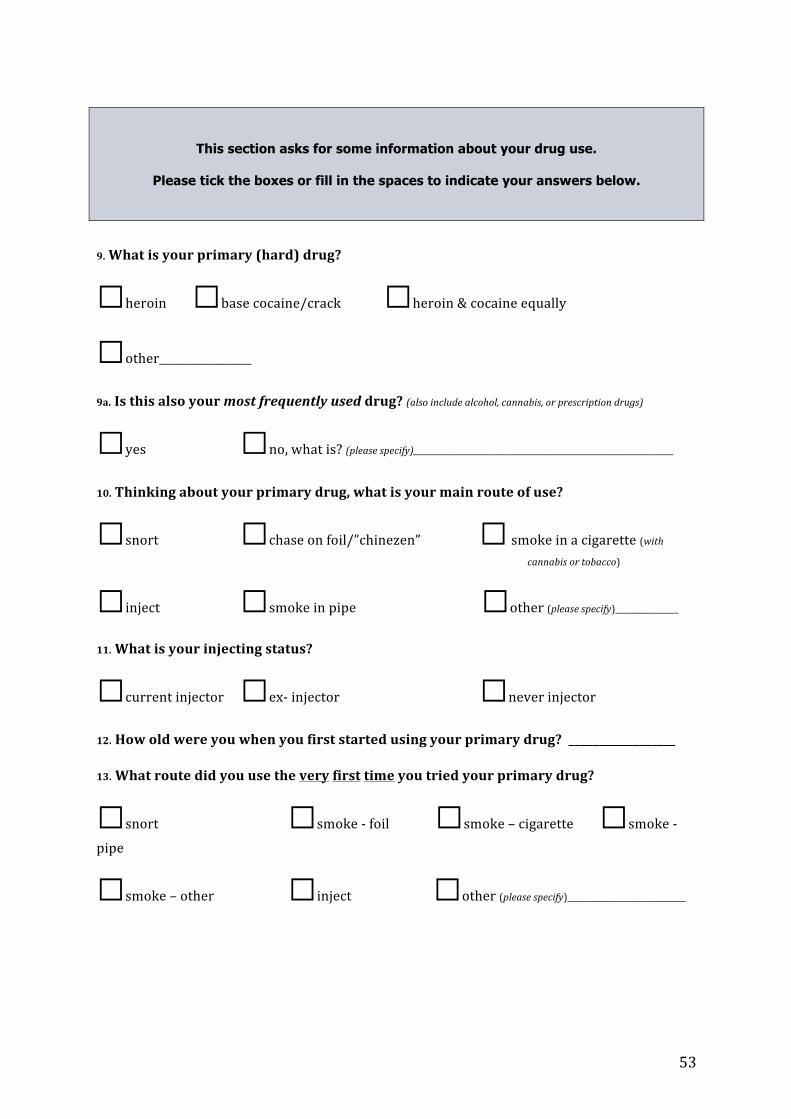
53
This section asks for some information about your drug use.
Please tick the boxes or fill in the spaces to indicate your answers below. 9. What is your primary (hard) drug?
□heroin □base cocaine/crack □heroin & cocaine equally
□other_________________ 9a. Is this also your most frequently used drug? (also include alcohol, cannabis, or prescription drugs)
□yes □no, what is? (please specify)__________________________________________________________________ 10. Thinking about your primary drug, what is your main route of use?
□snort □chase on foil/”chinezen” □ smoke in a cigarette (with cannabis or tobacco)
□inject □smoke in pipe □other (please specify)________________ 11. What is your injecting status?
□current injector □ex-‐ injector □never injector 12. How old were you when you first started using your primary drug? __________________ 13. What route did you use the very first time you tried your primary drug?
□snort □smoke -‐ foil □smoke – cigarette □smoke -‐
pipe
□smoke – other □inject □other (please specify)______________________________
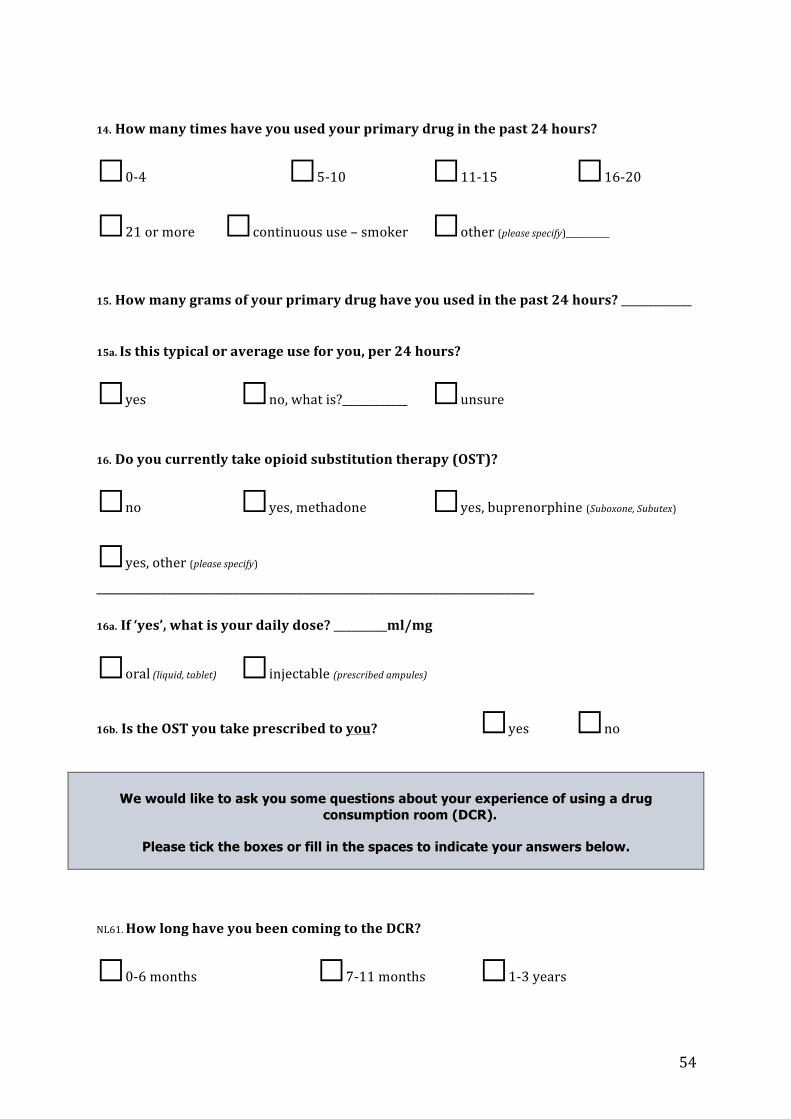
54
14. How many times have you used your primary drug in the past 24 hours?
□0-‐4 □5-‐10 □11-‐15 □16-‐20 □21 or more □continuous use – smoker □other (please specify)___________ 15. How many grams of your primary drug have you used in the past 24 hours? _____________ 15a. Is this typical or average use for you, per 24 hours?
□yes □no, what is?____________ □unsure 16. Do you currently take opioid substitution therapy (OST)?
□no □yes, methadone □yes, buprenorphine (Suboxone, Subutex)
□yes, other (please specify) __________________________________________________________________________ 16a. If ‘yes’, what is your daily dose? _________ml/mg
□oral (liquid, tablet) □injectable (prescribed ampules)
16b. Is the OST you take prescribed to you? □yes □no
We would like to ask you some questions about your experience of using a drug
consumption room (DCR).
Please tick the boxes or fill in the spaces to indicate your answers below.
NL61. How long have you been coming to the DCR?
□0-‐6 months □7-‐11 months □1-‐3 years
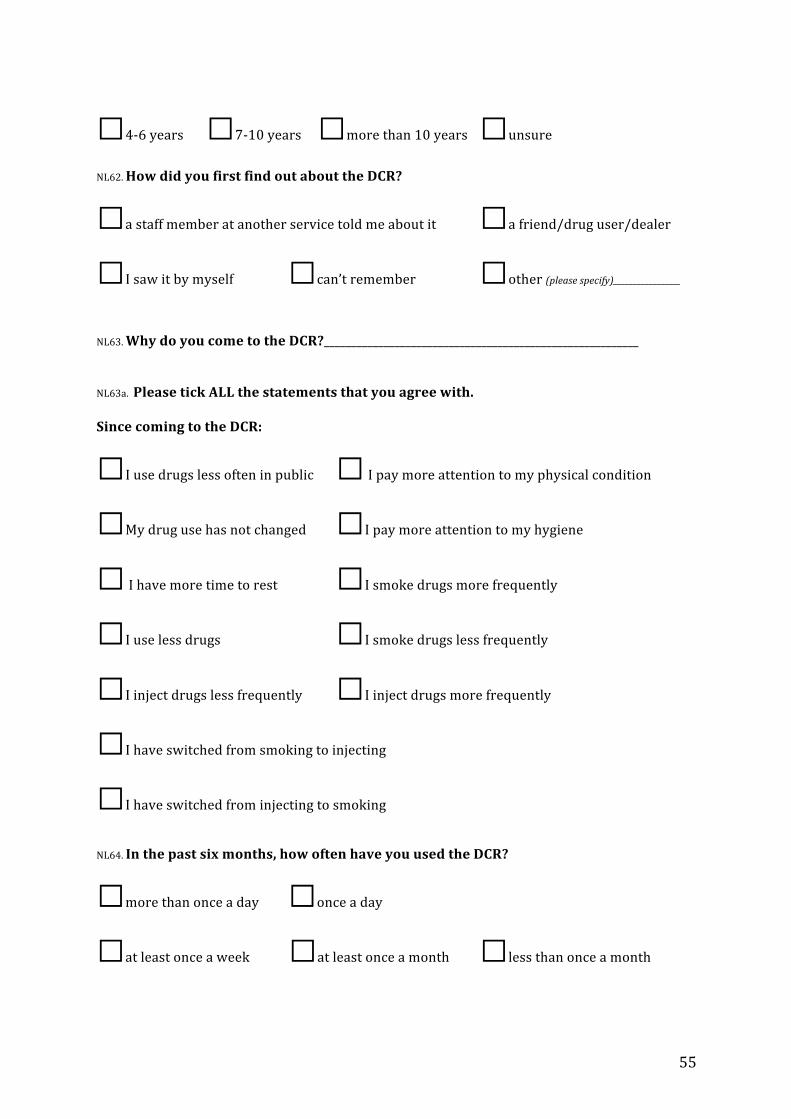
55
□4-‐6 years □7-‐10 years □more than 10 years □unsure NL62. How did you first find out about the DCR?
□a staff member at another service told me about it □a friend/drug user/dealer
□I saw it by myself □can’t remember □other (please specify)_________________ NL63. Why do you come to the DCR?__________________________________________________________ NL63a. Please tick ALL the statements that you agree with. Since coming to the DCR:
□I use drugs less often in public □ I pay more attention to my physical condition
□My drug use has not changed □I pay more attention to my hygiene
□ I have more time to rest □I smoke drugs more frequently
□I use less drugs □I smoke drugs less frequently
□I inject drugs less frequently □I inject drugs more frequently
□I have switched from smoking to injecting
□I have switched from injecting to smoking NL64. In the past six months, how often have you used the DCR?
□more than once a day □once a day
□at least once a week □at least once a month □less than once a month
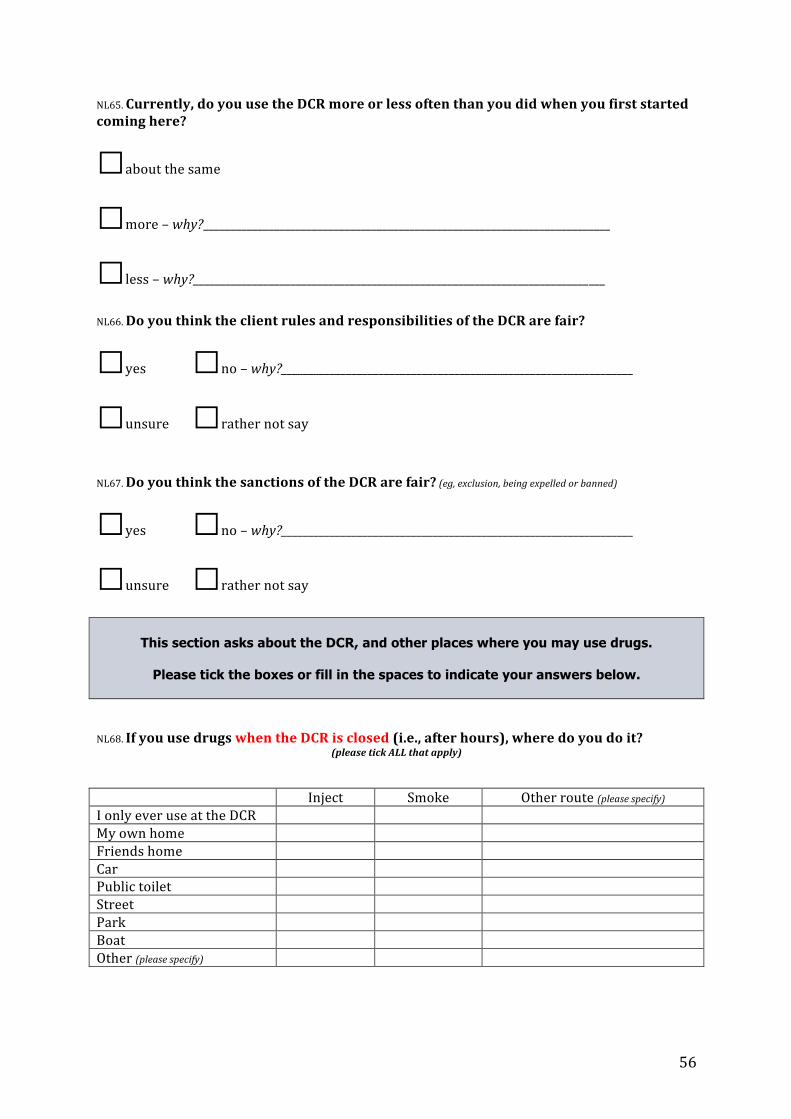
56
NL65. Currently, do you use the DCR more or less often than you did when you first started coming here?
□about the same
□more – why?___________________________________________________________________________
□less – why?____________________________________________________________________________
NL66. Do you think the client rules and responsibilities of the DCR are fair?
□yes □no – why?_________________________________________________________________
□unsure □rather not say NL67. Do you think the sanctions of the DCR are fair? (eg, exclusion, being expelled or banned)
□yes □no – why?_________________________________________________________________
□unsure □rather not say
This section asks about the DCR, and other places where you may use drugs.
Please tick the boxes or fill in the spaces to indicate your answers below.
NL68. If you use drugs when the DCR is closed (i.e., after hours), where do you do it?
(please tick ALL that apply)
Inject Smoke Other route (please specify) I only ever use at the DCR My own home Friends home Car Public toilet Street Park Boat Other (please specify)
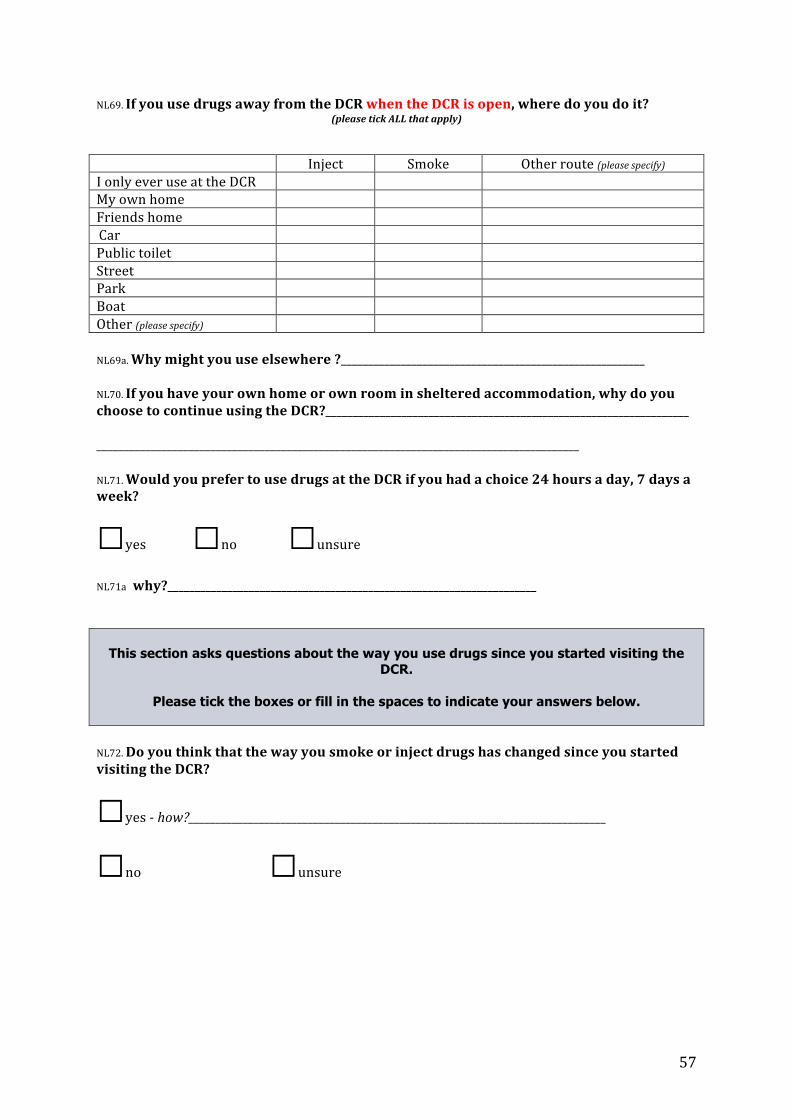
57
NL69. If you use drugs away from the DCR when the DCR is open, where do you do it? (please tick ALL that apply)
Inject Smoke Other route (please specify) I only ever use at the DCR My own home Friends home Car Public toilet Street Park Boat Other (please specify) NL69a. Why might you use elsewhere ?________________________________________________________ NL70. If you have your own home or own room in sheltered accommodation, why do you choose to continue using the DCR?___________________________________________________________________ _________________________________________________________________________________________ NL71. Would you prefer to use drugs at the DCR if you had a choice 24 hours a day, 7 days a week?
□yes □no □unsure
NL71a why?____________________________________________________________________
This section asks questions about the way you use drugs since you started visiting the
DCR.
Please tick the boxes or fill in the spaces to indicate your answers below.
NL72. Do you think that the way you smoke or inject drugs has changed since you started visiting the DCR?
□yes -‐ how?_____________________________________________________________________________
□no □unsure
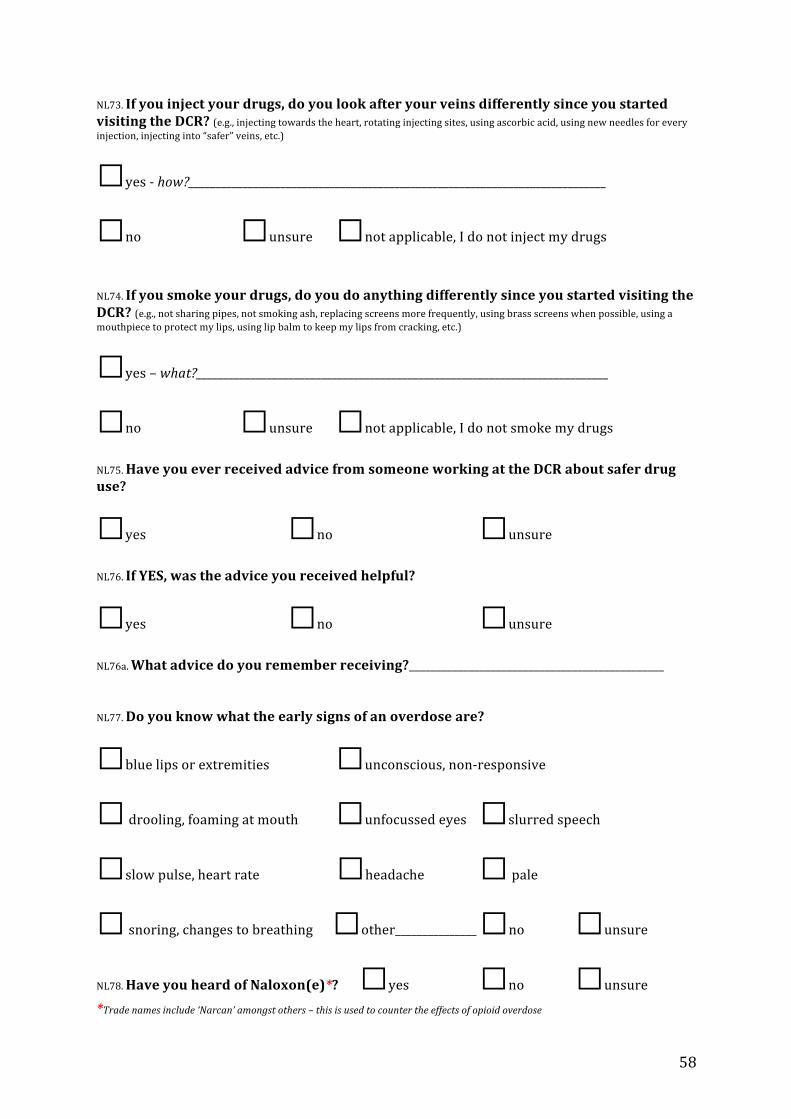
58
NL73. If you inject your drugs, do you look after your veins differently since you started visiting the DCR? (e.g., injecting towards the heart, rotating injecting sites, using ascorbic acid, using new needles for every injection, injecting into “safer” veins, etc.)
□yes -‐ how?_____________________________________________________________________________
□no □unsure □not applicable, I do not inject my drugs
NL74. If you smoke your drugs, do you do anything differently since you started visiting the DCR? (e.g., not sharing pipes, not smoking ash, replacing screens more frequently, using brass screens when possible, using a mouthpiece to protect my lips, using lip balm to keep my lips from cracking, etc.)
□yes – what?____________________________________________________________________________
□no □unsure □not applicable, I do not smoke my drugs NL75. Have you ever received advice from someone working at the DCR about safer drug use?
□yes □no □unsure NL76. If YES, was the advice you received helpful?
□yes □no □unsure NL76a. What advice do you remember receiving?_______________________________________________ NL77. Do you know what the early signs of an overdose are?
□blue lips or extremities □unconscious, non-‐responsive
□ drooling, foaming at mouth □unfocussed eyes □slurred speech
□slow pulse, heart rate □headache □ pale
□ snoring, changes to breathing □other_______________ □no □unsure
NL78. Have you heard of Naloxon(e)*? □yes □no □unsure *Trade names include ‘Narcan’ amongst others – this is used to counter the effects of opioid overdose
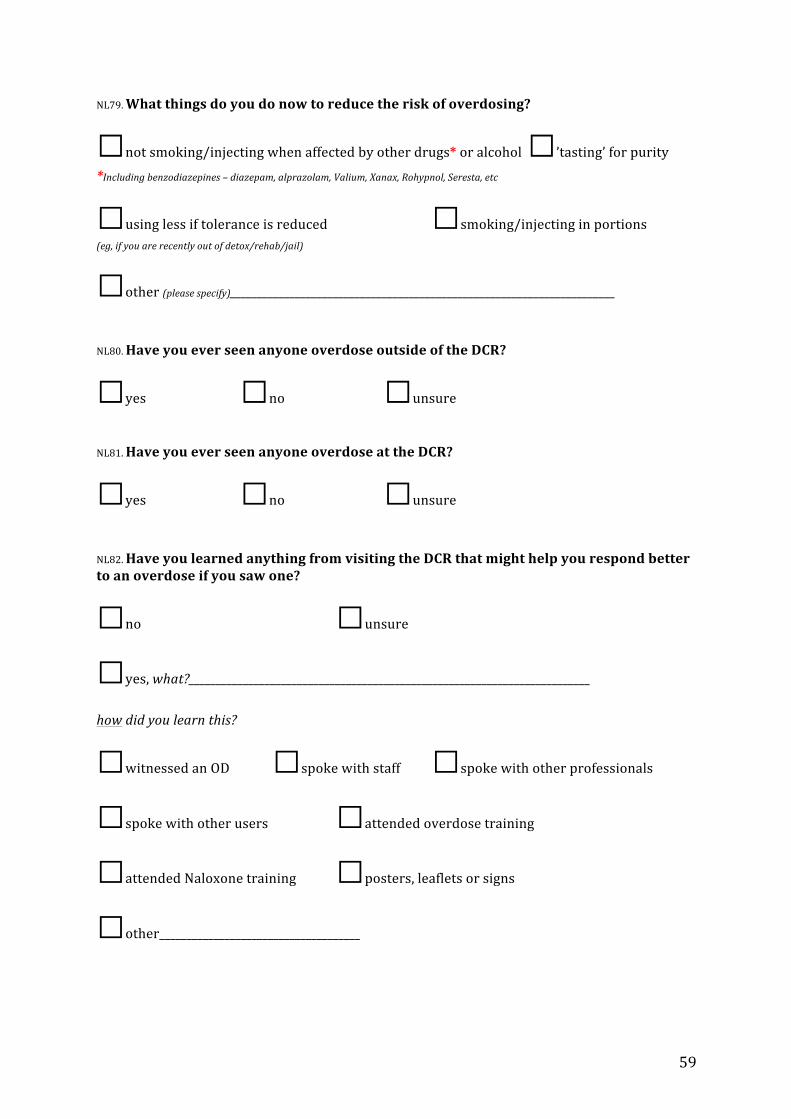
59
NL79. What things do you do now to reduce the risk of overdosing?
□not smoking/injecting when affected by other drugs* or alcohol □’tasting’ for purity *Including benzodiazepines – diazepam, alprazolam, Valium, Xanax, Rohypnol, Seresta, etc
□using less if tolerance is reduced □smoking/injecting in portions (eg, if you are recently out of detox/rehab/jail)
□other (please specify)_______________________________________________________________________ NL80. Have you ever seen anyone overdose outside of the DCR?
□yes □no □unsure
NL81. Have you ever seen anyone overdose at the DCR?
□yes □no □unsure
NL82. Have you learned anything from visiting the DCR that might help you respond better to an overdose if you saw one?
□no □unsure
□yes, what?__________________________________________________________________________
how did you learn this?
□witnessed an OD □spoke with staff □spoke with other professionals
□spoke with other users □attended overdose training
□attended Naloxone training □posters, leaflets or signs □other_____________________________________
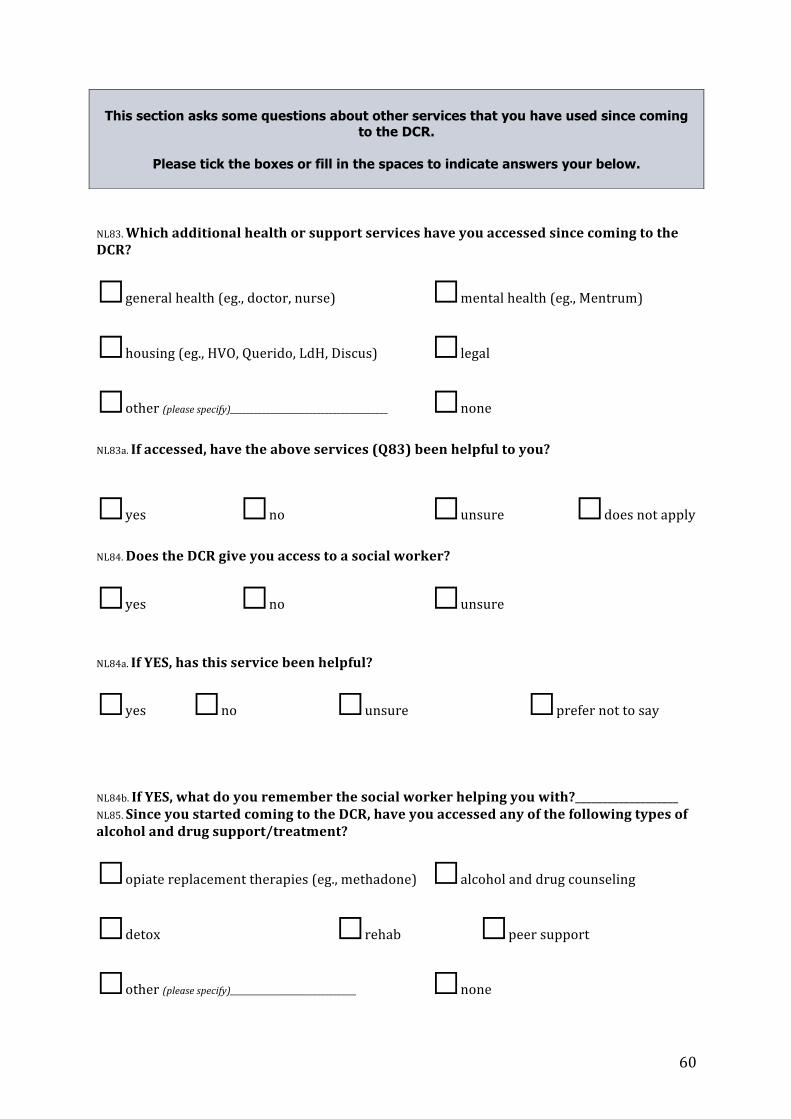
60
NL83. Which additional health or support services have you accessed since coming to the DCR?
□general health (eg., doctor, nurse) □mental health (eg., Mentrum)
□housing (eg., HVO, Querido, LdH, Discus) □legal
□other (please specify)________________________________________ □none
NL83a. If accessed, have the above services (Q83) been helpful to you?
□yes □no □unsure □does not apply NL84. Does the DCR give you access to a social worker?
□yes □no □unsure NL84a. If YES, has this service been helpful?
□yes □no □unsure □prefer not to say NL84b. If YES, what do you remember the social worker helping you with?___________________ NL85. Since you started coming to the DCR, have you accessed any of the following types of alcohol and drug support/treatment?
□opiate replacement therapies (eg., methadone) □alcohol and drug counseling □detox □rehab □peer support
□other (please specify)________________________________ □none
This section asks some questions about other services that you have used since coming
to the DCR.
Please tick the boxes or fill in the spaces to indicate answers your below.
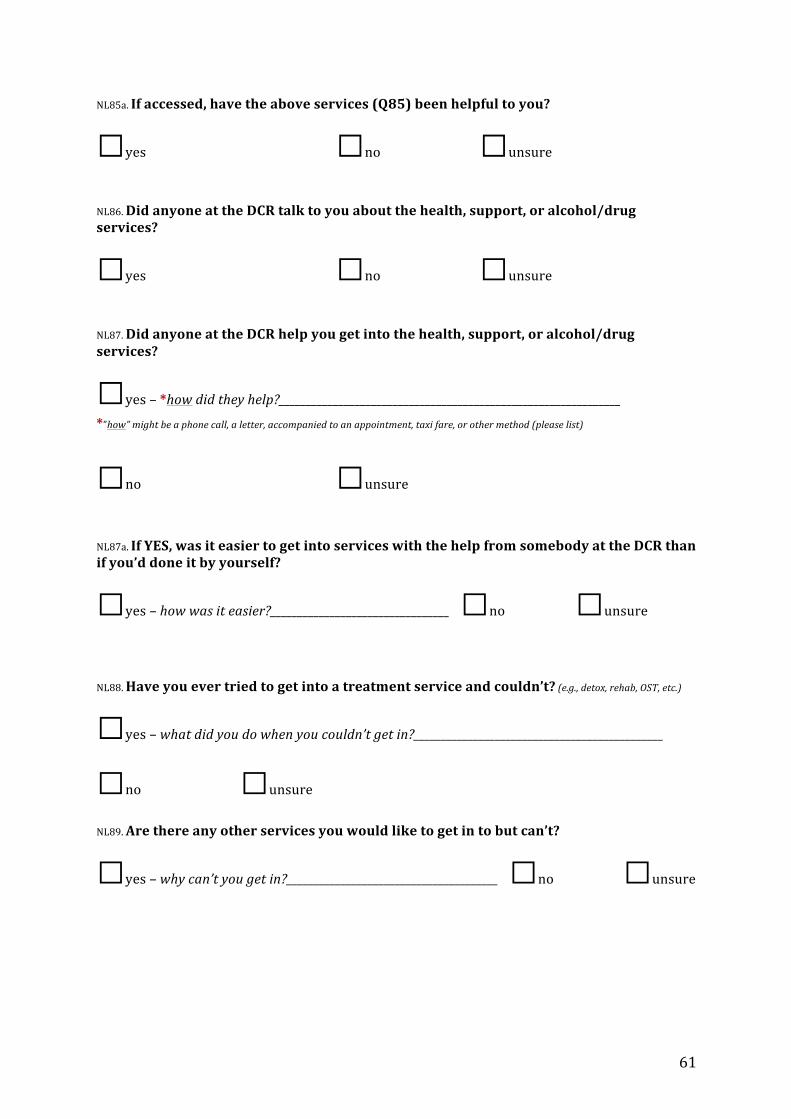
61
NL85a. If accessed, have the above services (Q85) been helpful to you?
□yes □no □unsure NL86. Did anyone at the DCR talk to you about the health, support, or alcohol/drug services?
□yes □no □unsure NL87. Did anyone at the DCR help you get into the health, support, or alcohol/drug services?
□yes – *how did they help?_______________________________________________________________ *”how” might be a phone call, a letter, accompanied to an appointment, taxi fare, or other method (please list)
□no □unsure NL87a. If YES, was it easier to get into services with the help from somebody at the DCR than if you’d done it by yourself?
□yes – how was it easier?_________________________________ □no □unsure
NL88. Have you ever tried to get into a treatment service and couldn’t? (e.g., detox, rehab, OST, etc.)
□yes – what did you do when you couldn’t get in?______________________________________________
□no □unsure NL89. Are there any other services you would like to get in to but can’t?
□yes – why can’t you get in?_______________________________________ □no □unsure
62
NL90. I make use of the following services at the facility:
□coffee and chat □eat a meal
□wash clothes □take a shower
□talk about personal problems □information or assistance (e.g., housing, debits, justice)
□medical care or treatment □needle and syringe exchange
□information on safer drug use □ information on therapy (e.g, methadone, abstinence)
□I come to use drugs only
NL91. Is there any additional information you would like to receive from DCR staff?
□yes □no □unsure NL91a. If YES, what topics would you like more information on?
□safer drug use □overdose □vein care □drug smoking
□services □other (please specify) ________________________________________ NL92. Do you encourage other drug users to come here?
□yes – why?_________________________________□no – why not?___________________________________ □unsure □rather not say
63
NL93. Do you know other drug users who do not use the DCR?
□yes – why don’t they use it?_____________________________________________________
□no □unsure □rather not say
NL94. What do you tell other drug users about the DCR?______________________ _________________________________________________________________________________________ NL95. In your opinion, what is the best thing about the DCR? _________________________________________________________________________________________ NL96. In your opinion, what is the worst thing about the DCR? _________________________________________________________________________________________ NL97. Overall, do you think the DCR is a good service?
□yes □no – why not?_______________________________________
□unsure □prefer not to say
This section asks the last few questions about you.
Please tick the boxes to indicate answers below.
98. What is your marital status?
□single □married or living with partner □separated or divorced □widowed □other (please specify) _________________________ 99. Who do you currently live with?_____________________________________________
64
100. Which of these best describes your employment situation? Please choose ONE option.
□full time employed □part time employed □unemployed
□Z! Krant/Big Issue vendor □student □carer
□longterm sick/disabled □volunteer □ other (please specify) ______ 101. Have you ever been convicted of a crime and sent to prison?
□yes □no □prefer not to say 101a. If ‘yes’, how many times? ____________________________
END
: