Embed Size (px)
Citation preview

1
Project Report June 2015
Development of South Asia Drought Monitoring System
Submitted by
International Water Management Institute (IWMI), Colombo, Sri Lanka
Grant Supported by:
Global Water Partnership (GWP) - World Meteorological Organization (WMO) as part of the
Integrated Drought Management Programme (IDMP) and
Climate Change, Agriculture and Food Security (CCAFS) and IWMI
2
Table of Contents
1. Project Summary ................................................................................................................................................. 3
2. Project Overview ................................................................................................................................................. 3
3. Literature review on drought monitoring ......................................................................................................... 4
4. Integration of remote sensing data and climate information in drought indices development ................... 5
5. Developing of Integrated Drought Severity Index (IDSI) and product evaluation in South Asia .................. 6
6. Integrated Drought Severity Index (IDSI) using principal component analysis (PCA).................................. 8
7. Drought Product Validation using standardized precipitation index (SPI) and Ground Verification ........ 12
8. IDSI product implemented using DMS tool ..................................................................................................... 15
9. Reconnaissance survey for the 2014 droughts in Sri Lanka and India ......................................................... 16
10. Conclusions ................................................................................................................................................... 20
11. References ..................................................................................................................................................... 21
3
1. Project Summary
Drought is a complex hazard caused by the breaking of water balance and it has always an impact on
agricultural, ecological and socio-economic spheres. Although the drought indices deriving from
remote sensing data have been used to monitor meteorological or agricultural drought, there are no
indices that can suitably reflect the comprehensive information of drought from meteorological to
agricultural aspects. The “South Asia Drought Monitoring System” project proposed innovative
approach of developing integrated drought severity index (IDSI) is defined as a principal component
of vegetation condition index (VCI), temperature condition index (TCI) and precipitation condition
index (PCI), Soil condition index (SCI). IDSI integrates multi-source remote sensing data from
moderate resolution imaging spectroradiometer (MODIS) and tropical rainfall measuring mission
(TRMM), ESA Soil Moisture (ASCAT) Products and it synthesizes precipitation deficits, soil thermal
stress and vegetation growth status in drought process. Therefore, this method is favorable to
monitor the comprehensive drought over South Asia. In our research, a heavy drought process was
accurately explored using IDSI in Sri Lanka and South India from 2000 to 2014. Finally, a validation
was implemented and its results show that IDSI is not only strongly correlated with 3-month scales
standardized precipitation index (SPI3), but also with variation of crop yield and drought-affected
crop areas. It was proved that this index is a comprehensive drought monitoring indicator and it can
contain not only the meteorological drought information but also it can reflect the drought influence
on agriculture. Below section provides detail description on various drought indices utilized and
satellite data image processing and results on drought maps, validation of drought product and field
investigation.
2. Project Overview
The aim is to develop an innovative approach for monitoring and assessment of the drought risk
based on integration of meteorological data, vegetation condition from satellite imagery and targeted
collection of ground truth moisture and crop-yield data that supports efforts directed at increased
resilience to droughts. The approach is designed to capitalize on the strengths of both satellite- and
climate-based indices (the later have been traditionally used for drought monitoring). The main
monitoring tool will be Integrated Drought Severity Index (IDSI) that reflects the effects of drought as
observed through both i) satellite-derived vegetation data and ii) the level of dryness expressed by
traditional climate-based drought indices. Additional biophysical/environmental characteristics
such as ecoregion, elevation, landuse / landcover (LULC) type, and soil type are also considered
because they can influence climate-vegetation interactions. Overall, input data that are used to
calculate IDSI can be categorized into three types: satellite, climate and biophysical. Detail
description on the approach is given in project document.
This research project has been brainstormed with various national partners in the region and
relevant global experts to provide necessary guidance in development of drought monitoring system.
The project report provides technical details on various work packages in development of DMS,
integration of satellite data sources, case study evaluation for major droughts in Sri Lanka,
Maharashtra and other Indian states and finally the field assessment carried out for the 2014
droughts in India and Sri Lanka is highlighted.
4
3. Literature review on drought monitoring
While in the process of developing drought monitoring system, the project team members evaluated
several research papers on the comparison of various drought indices in terms of usability and
applicability in the region, availability of datasets, procedure to calculate several indices were
assessed. Compared to in-situ indices, drought indices derived from remote sensing data are more
suitable for spatial drought conditions monitoring. Among many remote sensing techniques based
drought indices, the normalized difference vegetation index (NDVI)-based vegetation condition
index (VCI) (Kogan and Sullivan, 1993; Kogan, 199) and land surface temperature (LST)-based
temperature condition index (TCI) (Kogan, 1995) are two useful tools for monitoring the intensity,
duration and impact of drought on regional or global level (Singh et al., 2003).
Earlier researchers have found that VCI is suitable for monitoring large scale drought impact on
vegetation, including agricultural drought, and VCI has a strong correlation with the crop yield (Liu
and Kogan, 1996; Unganai and Kogan, 1998; Kogan et al., 2005; Salazar et al., 2007, 2008). A study in
a semi-arid region of the Iberian Peninsula also found that the interpretation of the VCI was more
complicated than other drought indices because it provides an indirect measure of moisture
(drought) conditions. Anything that stresses vegetation including insects, diseases, and lack of
nutrients will be represented by VCI (Vicente-Serrano, 2007). Furthermore, some studies found that
the synthesizing VCI and TCI together were better than separately and they developed a vegetation
health index (VHI) (Kogan, 1997; Kogan et al., 2004). However, in the humid regions of high-latitude,
where vegetation growth is primarily limited by lower temperatures which are opposite with low-
latitude regions, using VHI to monitor drought condition has to be undertaken with caution (Karnieli
et al., 2006). All those indices are not considering climate data, like precipitation and soil moisture
variation, which is one of the influencing factors of drought in semi-arid areas. The project uses,
remote sensing precipitation products of tropical rainfall measuring mission (TRMM), Advanced
SCATterometer (ASCAT) data can be used as an alternative data of meteorological station and
monitoring drought. Therefore, the remote sensing based drought indices synthesizing precipitation
and soil moisture is more appropriate for South Asia to address the complex process of drought.
As we know, drought is a slow process which begins with precipitation deficit, then it leads to soil
moisture deficit and a higher land surface temperature, and at last the vegetation growth will be
influenced by this process. Therefore, to monitor the comprehensive drought we must consider these
parameters which are derived from precipitation, soil and vegetation. In this project, we used TRMM,
ESA CCI data as a component from precipitation, soil moisture to calculate PCI, SCI and LST as a
component of temperate to calculate TCI and used NDVI as a component from vegetation to calculate
VCI. But, the problem is that drought does not have a linear relation with NDVI, LST and TRMM
anomalies in different season and regions, and there is always a correlation between them in some
case. Therefore, SDI, a synthesized drought index was proposed through principal component
analysis (PCA) method. PCA is a linear transformation which reduces redundancy by translating
and/or rotating the axes of the original feature space, so that the drought information can be
represented without correlation in a new component space (Lasaponara, 2006).
5
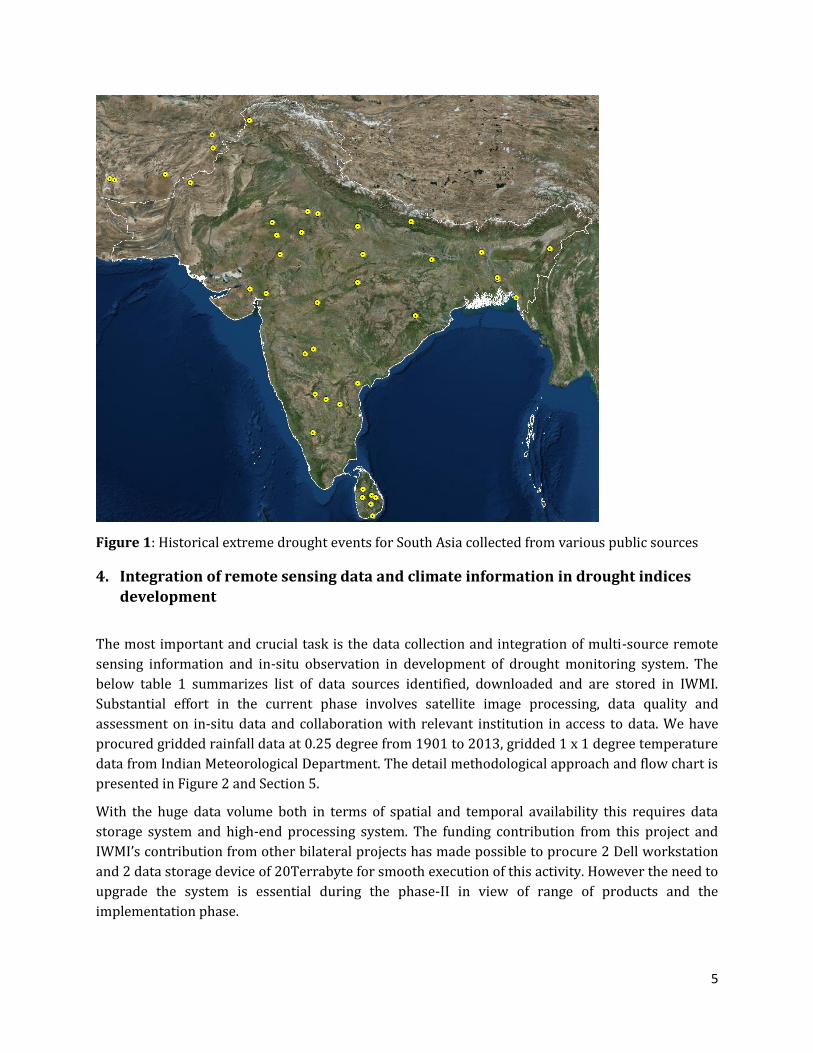
Figure 1: Historical extreme drought events for South Asia collected from various public sources
4. Integration of remote sensing data and climate information in drought indices
development
The most important and crucial task is the data collection and integration of multi-source remote
sensing information and in-situ observation in development of drought monitoring system. The
below table 1 summarizes list of data sources identified, downloaded and are stored in IWMI.
Substantial effort in the current phase involves satellite image processing, data quality and
assessment on in-situ data and collaboration with relevant institution in access to data. We have
procured gridded rainfall data at 0.25 degree from 1901 to 2013, gridded 1 x 1 degree temperature
data from Indian Meteorological Department. The detail methodological approach and flow chart is
presented in Figure 2 and Section 5.
With the huge data volume both in terms of spatial and temporal availability this requires data
storage system and high-end processing system. The funding contribution from this project and
IWMI’s contribution from other bilateral projects has made possible to procure 2 Dell workstation
and 2 data storage device of 20Terrabyte for smooth execution of this activity. However the need to
upgrade the system is essential during the phase-II in view of range of products and the
implementation phase.
6
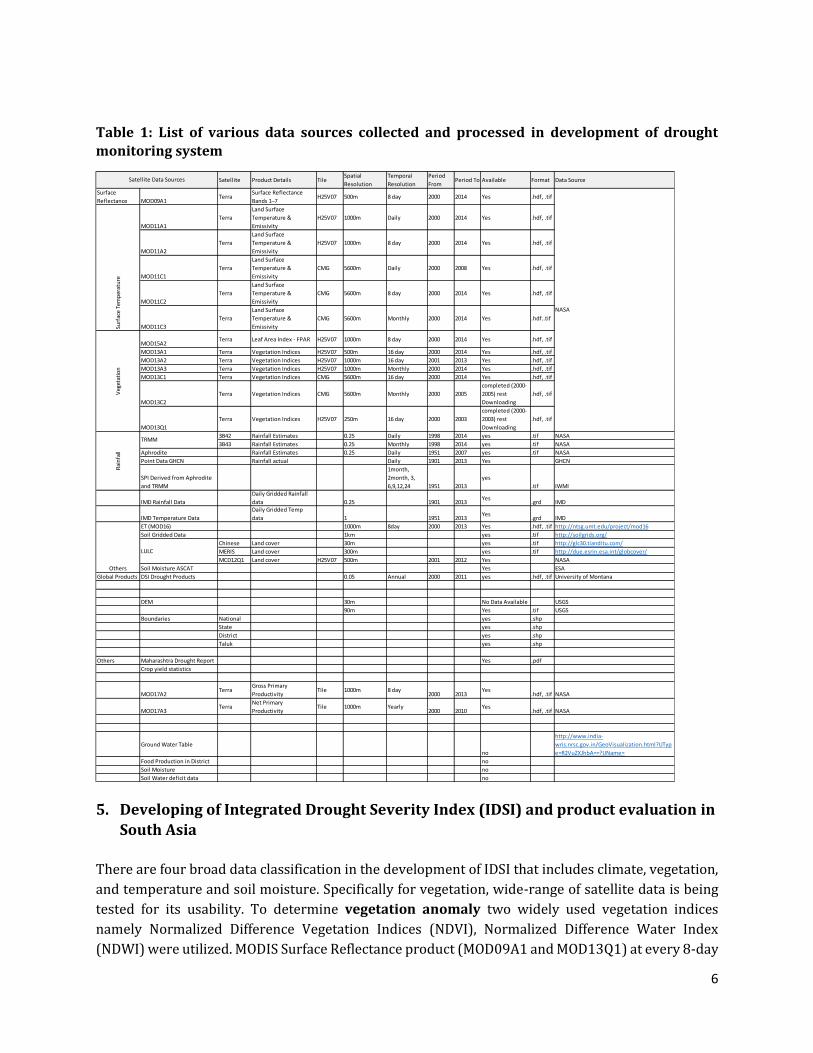
Table 1: List of various data sources collected and processed in development of drought
monitoring system
5. Developing of Integrated Drought Severity Index (IDSI) and product evaluation in
South Asia
There are four broad data classification in the development of IDSI that includes climate, vegetation,
and temperature and soil moisture. Specifically for vegetation, wide-range of satellite data is being
tested for its usability. To determine vegetation anomaly two widely used vegetation indices
namely Normalized Difference Vegetation Indices (NDVI), Normalized Difference Water Index
(NDWI) were utilized. MODIS Surface Reflectance product (MOD09A1 and MOD13Q1) at every 8-day
Satellite Product Details TileSpatial
Resolution
Temporal
Resolution
Period
FromPeriod To Available Format Data Source
Surface
Reflectance MOD09A1Terra
Surface Reflectance
Bands 1–7H25V07 500m 8 day 2000 2014 Yes .hdf, .tif
MOD11A1
Terra
Land Surface
Temperature &
Emissivity
H25V07 1000m Daily 2000 2014 Yes .hdf, .tif
MOD11A2
Terra
Land Surface
Temperature &
Emissivity
H25V07 1000m 8 day 2000 2014 Yes .hdf, .tif
MOD11C1
Terra
Land Surface
Temperature &
Emissivity
CMG 5600m Daily 2000 2008 Yes .hdf, .tif
MOD11C2
Terra
Land Surface
Temperature &
Emissivity
CMG 5600m 8 day 2000 2014 Yes .hdf, .tif
MOD11C3
Terra
Land Surface
Temperature &
Emissivity
CMG 5600m Monthly 2000 2014 Yes .hdf..tif
MOD15A2Terra Leaf Area Index - FPAR H25V07 1000m 8 day 2000 2014 Yes .hdf, .tif
MOD13A1 Terra Vegetation Indices H25V07 500m 16 day 2000 2014 Yes .hdf, .tif
MOD13A2 Terra Vegetation Indices H25V07 1000m 16 day 2001 2013 Yes .hdf, .tif
MOD13A3 Terra Vegetation Indices H25V07 1000m Monthly 2000 2014 Yes .hdf, .tif
MOD13C1 Terra Vegetation Indices CMG 5600m 16 day 2000 2014 Yes .hdf, .tif
MOD13C2
Terra Vegetation Indices CMG 5600m Monthly 2000 2005
completed (2000-
2005) rest
Downloading
.hdf, .tif
MOD13Q1
Terra Vegetation Indices H25V07 250m 16 day 2000 2003
completed (2000-
2003) rest
Downloading
.hdf, .tif
3B42 Rainfall Estimates 0.25 Daily 1998 2014 yes .tif NASA
3B43 Rainfall Estimates 0.25 Monthly 1998 2014 yes .tif NASA
Aphrodite Rainfall Estimates 0.25 Daily 1951 2007 yes .tif NASA
Point Data GHCN Rainfall actual Daily 1901 2013 Yes GHCN
SPI Derived from Aphrodite
and TRMM
1month,
2month, 3,
6,9,12,24 1951 2013
yes
.tif IWMI
IMD Rainfall Data
Daily Gridded Rainfall
data 0.25 1901 2013Yes
.grd IMD
IMD Temperature Data
Daily Gridded Temp
data 1 1951 2013Yes
.grd IMD
ET (MOD16) 1000m 8day 2000 2013 Yes .hdf, .tif http://ntsg.umt.edu/project/mod16
Soil Gridded Data 1km yes .tif http://soilgrids.org/
Chinese Land cover 30m yes .tif http://glc30.tianditu.com/
MERIS Land cover 300m yes .tif http://due.esrin.esa.int/globcover/
MCD12Q1 Land cover H25V07 500m 2001 2012 Yes NASA
Soil Moisture ASCAT Yes ESA
Global Products DSI Drought Products 0.05 Annual 2000 2011 yes .hdf, .tif University of Montana
DEM 30m No Data Available USGS
90m Yes .tif USGS
Boundaries National yes .shp
State yes .shp
District yes .shp
Taluk yes .shp
Others Maharashtra Drought Report Yes .pdf
Crop yield statistics
MOD17A2Terra
Gross Primary
ProductivityTile 1000m 8 day
2000 2013Yes
.hdf, .tif NASA
MOD17A3Terra
Net Primary
ProductivityTile 1000m Yearly
2000 2010Yes
.hdf, .tif NASA
Ground Water Table
no
http://www.india-
wris.nrsc.gov.in/GeoVisualization.html?UTyp
e=R2VuZXJhbA==?UName=
Food Production in District no
Soil Moisture no
Soil Water deficit data no
Satellite Data Sources
NASA
Others
Surf
ace
Tem
per
atu
reV
eget
atio
n
TRMM
Rai
nfa
ll
LULC
7
and 16-day interval was used to calculate vegetation anomaly. Prior using the satellite datasets, once
has to lot of pre-processing due to cloud contamination this includes filtering, noise elimination and
gap filling to improving the data quality. The final step is to smooth reflectance values using time-
series analysis that allow understanding on the crop seasonal pattern and its anomaly.
For vegetation regions, the weather-related NDVI changes are smaller than the ecosystem related
one and the drought impacts on vegetation cannot be easily detected from NDVI data directly. Thus
use of vegetation condition index (VCI) is a pixel based normalization of the NDVI in which the short
term climate signal of the NDVI was filtered by separating it from the long-term ecological signal. VCI
is a better indicator of drought stress on vegetation than NDVI (Figure 3).
On the temperature module, MODIS Land Surface temperature (MOD11A2) was used to derive
temperature condition index. Basically the land surface will meet a thermal stress. Hence, the
temperature condition index (TCI), a remote sensing based thermal stress indicator is proposed to
determine temperature-related drought phenomenon. The TCI algorithm was similar to the VCI one
and its conditions was estimated relative to the maximum/minimum temperatures is a given time
series.
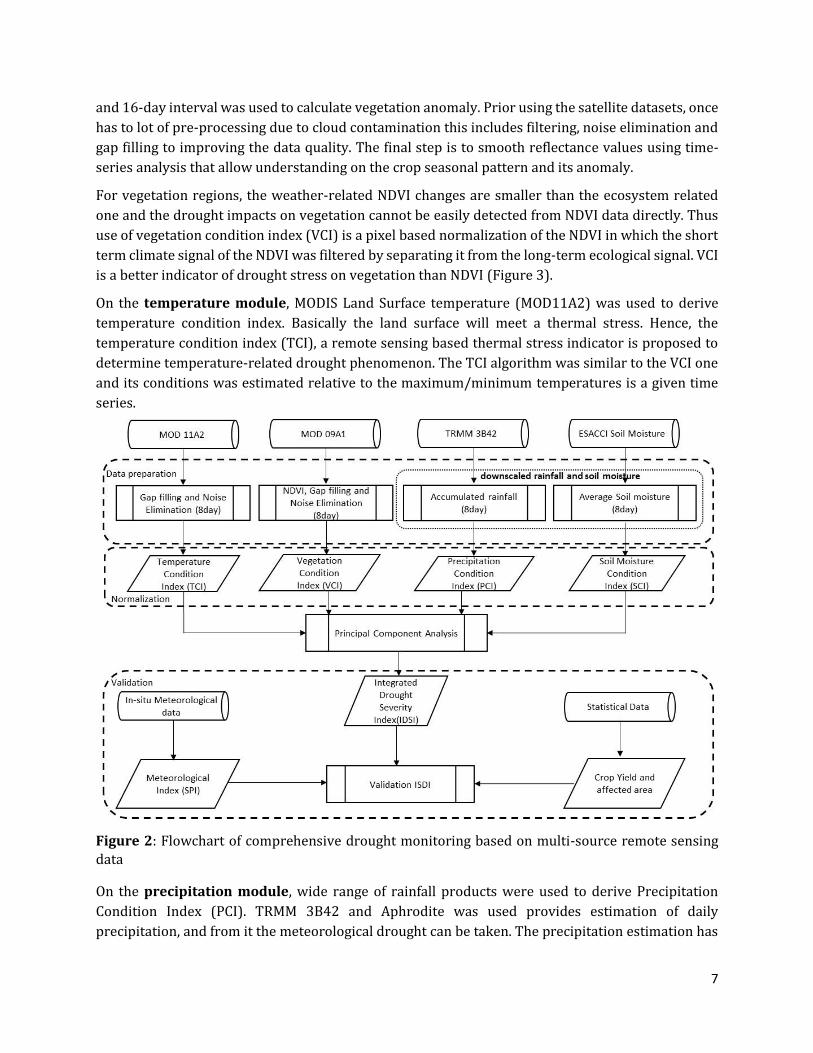
Figure 2: Flowchart of comprehensive drought monitoring based on multi-source remote sensing
data
On the precipitation module, wide range of rainfall products were used to derive Precipitation
Condition Index (PCI). TRMM 3B42 and Aphrodite was used provides estimation of daily
precipitation, and from it the meteorological drought can be taken. The precipitation estimation has
8
a spatial and temporal climate component but it cannot be directly analyzed with VCI and TCI.
Therefore, in this research, PCI which normalized by the TRMM 34B2 data using a similar algorithm
of VCI, was defined for the detection of the precipitation deficits from climate signal.
On the Soil Moisture module, Soil moisture monitoring is generally a superior executive mean for
agricultural drought assessment than precipitation. In India, rain-fed agriculture dominates over
irrigated agricultural systems, due to which precipitation is considered as the indicator for
agricultural drought. But only precipitation cannot serve as reliable indicator for assessment of
agricultural drought because of variability in water supply modes (Irrigation from canal, ground
water, storage tank, rainfall harvested and rain-fed water). Only rain-fed agricultural practices have
a strong relationship between rainfall amount and soil moisture. For the drought severity index, the
ESA CCI global soil moisture product is being used to develop IDSI. Basically the CCI uses active and
passive microwave space borne instruments and are freely distributed by ESA. Similar to PCI, Soil
Moisture index (SCI) was defined for the detection of the soil moisture deficits that affects crop stress
and affects the crop productivity.
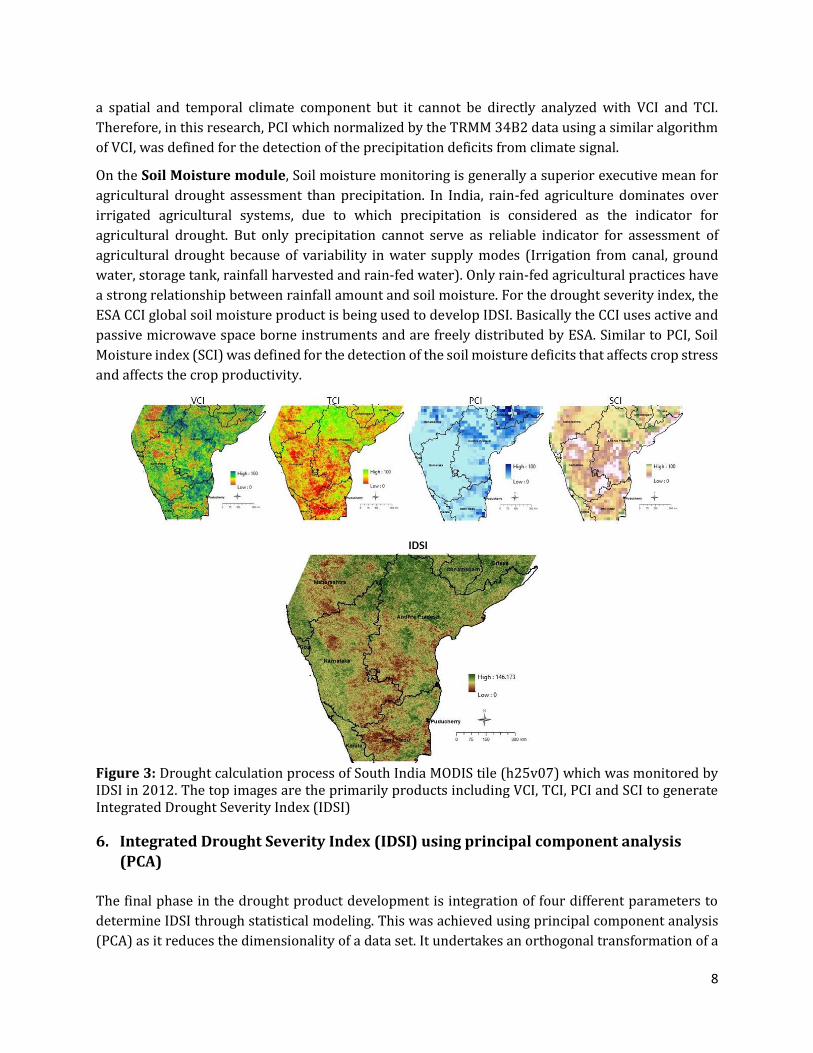
Figure 3: Drought calculation process of South India MODIS tile (h25v07) which was monitored by IDSI in 2012. The top images are the primarily products including VCI, TCI, PCI and SCI to generate Integrated Drought Severity Index (IDSI)
6. Integrated Drought Severity Index (IDSI) using principal component analysis
(PCA)
The final phase in the drought product development is integration of four different parameters to
determine IDSI through statistical modeling. This was achieved using principal component analysis
(PCA) as it reduces the dimensionality of a data set. It undertakes an orthogonal transformation of a
9
set of possibly correlated variables to create a new variable set with principal components that are
uncorrelated and are ordered in terms of the amount of variance exposed in the original data. As a
useful mathematical tool, PCA is mostly used in exploratory data analysis and for making predictive
models. The PCA procedure firstly computes the covariance matrix and eigenvalues, eigenvectors
among all input data, secondly it obtains the percent of total data set variance explained by each
component, and finally a series of new data (called eigen channels or components) are computed by
multiplying the eigenvector for the original input data (Lasaponara, 2006).
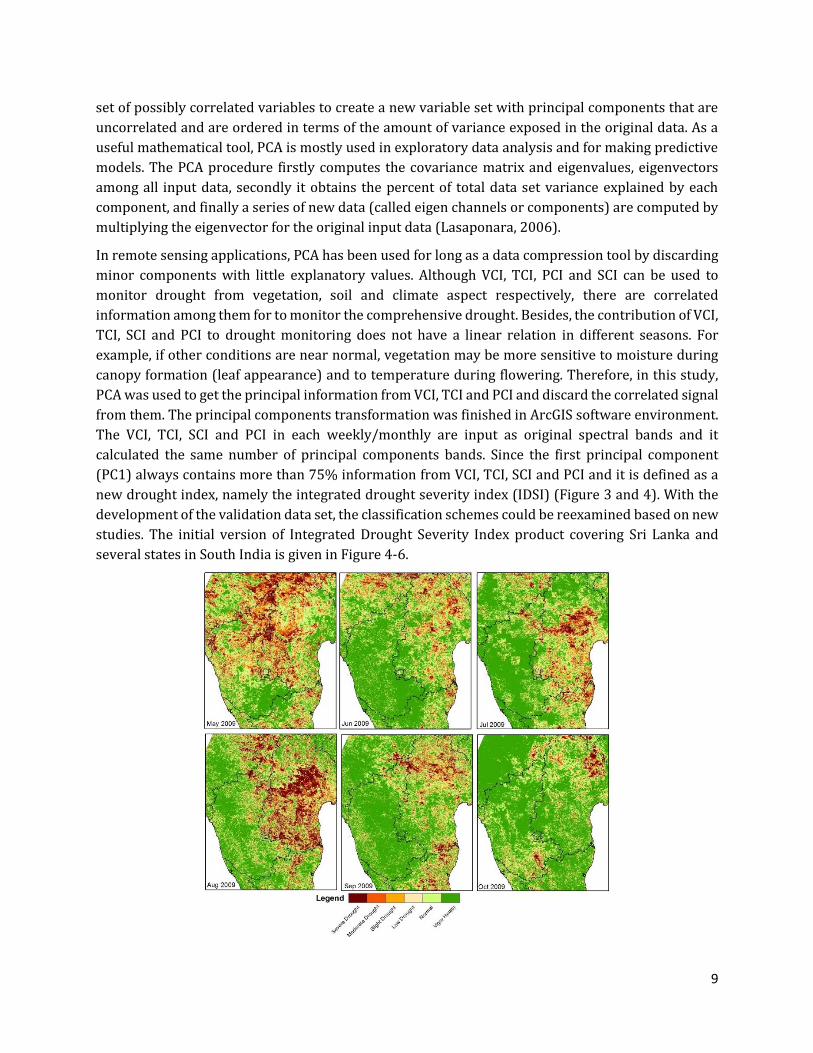
In remote sensing applications, PCA has been used for long as a data compression tool by discarding
minor components with little explanatory values. Although VCI, TCI, PCI and SCI can be used to
monitor drought from vegetation, soil and climate aspect respectively, there are correlated
information among them for to monitor the comprehensive drought. Besides, the contribution of VCI,
TCI, SCI and PCI to drought monitoring does not have a linear relation in different seasons. For
example, if other conditions are near normal, vegetation may be more sensitive to moisture during
canopy formation (leaf appearance) and to temperature during flowering. Therefore, in this study,
PCA was used to get the principal information from VCI, TCI and PCI and discard the correlated signal
from them. The principal components transformation was finished in ArcGIS software environment.
The VCI, TCI, SCI and PCI in each weekly/monthly are input as original spectral bands and it
calculated the same number of principal components bands. Since the first principal component
(PC1) always contains more than 75% information from VCI, TCI, SCI and PCI and it is defined as a
new drought index, namely the integrated drought severity index (IDSI) (Figure 3 and 4). With the
development of the validation data set, the classification schemes could be reexamined based on new
studies. The initial version of Integrated Drought Severity Index product covering Sri Lanka and
several states in South India is given in Figure 4-6.
10
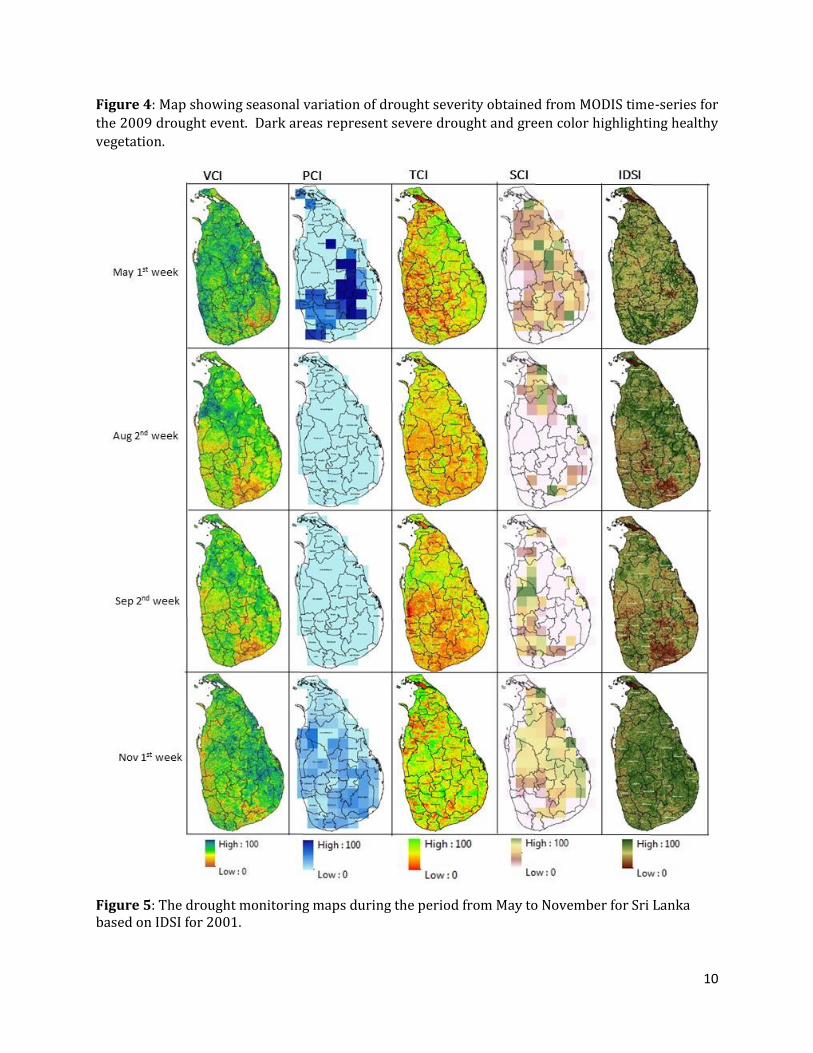
Figure 4: Map showing seasonal variation of drought severity obtained from MODIS time-series for
the 2009 drought event. Dark areas represent severe drought and green color highlighting healthy
vegetation.
Figure 5: The drought monitoring maps during the period from May to November for Sri Lanka based on IDSI for 2001.
11
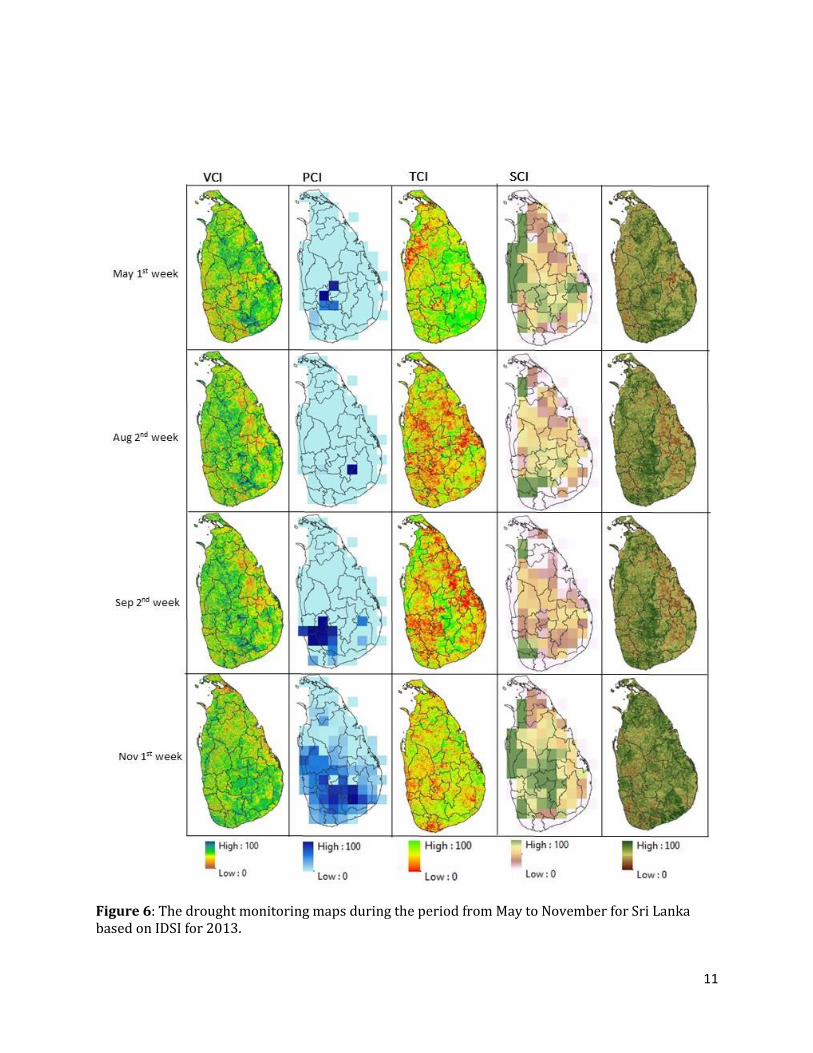
Figure 6: The drought monitoring maps during the period from May to November for Sri Lanka based on IDSI for 2013.
12
7. Drought Product Validation using standardized precipitation index (SPI) and
Ground Verification
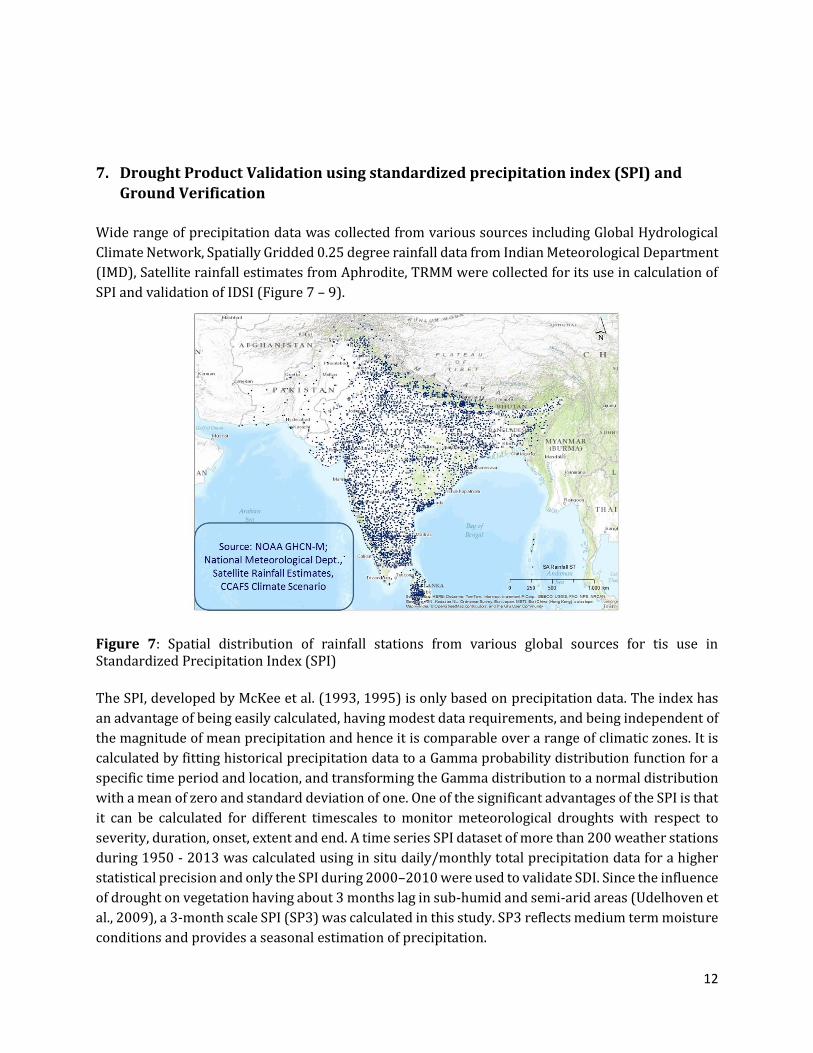
Wide range of precipitation data was collected from various sources including Global Hydrological
Climate Network, Spatially Gridded 0.25 degree rainfall data from Indian Meteorological Department
(IMD), Satellite rainfall estimates from Aphrodite, TRMM were collected for its use in calculation of
SPI and validation of IDSI (Figure 7 – 9).
Figure 7: Spatial distribution of rainfall stations from various global sources for tis use in Standardized Precipitation Index (SPI)
The SPI, developed by McKee et al. (1993, 1995) is only based on precipitation data. The index has
an advantage of being easily calculated, having modest data requirements, and being independent of
the magnitude of mean precipitation and hence it is comparable over a range of climatic zones. It is
calculated by fitting historical precipitation data to a Gamma probability distribution function for a
specific time period and location, and transforming the Gamma distribution to a normal distribution
with a mean of zero and standard deviation of one. One of the significant advantages of the SPI is that
it can be calculated for different timescales to monitor meteorological droughts with respect to
severity, duration, onset, extent and end. A time series SPI dataset of more than 200 weather stations
during 1950 - 2013 was calculated using in situ daily/monthly total precipitation data for a higher
statistical precision and only the SPI during 2000–2010 were used to validate SDI. Since the influence
of drought on vegetation having about 3 months lag in sub-humid and semi-arid areas (Udelhoven et
al., 2009), a 3-month scale SPI (SP3) was calculated in this study. SP3 reflects medium term moisture
conditions and provides a seasonal estimation of precipitation.
13
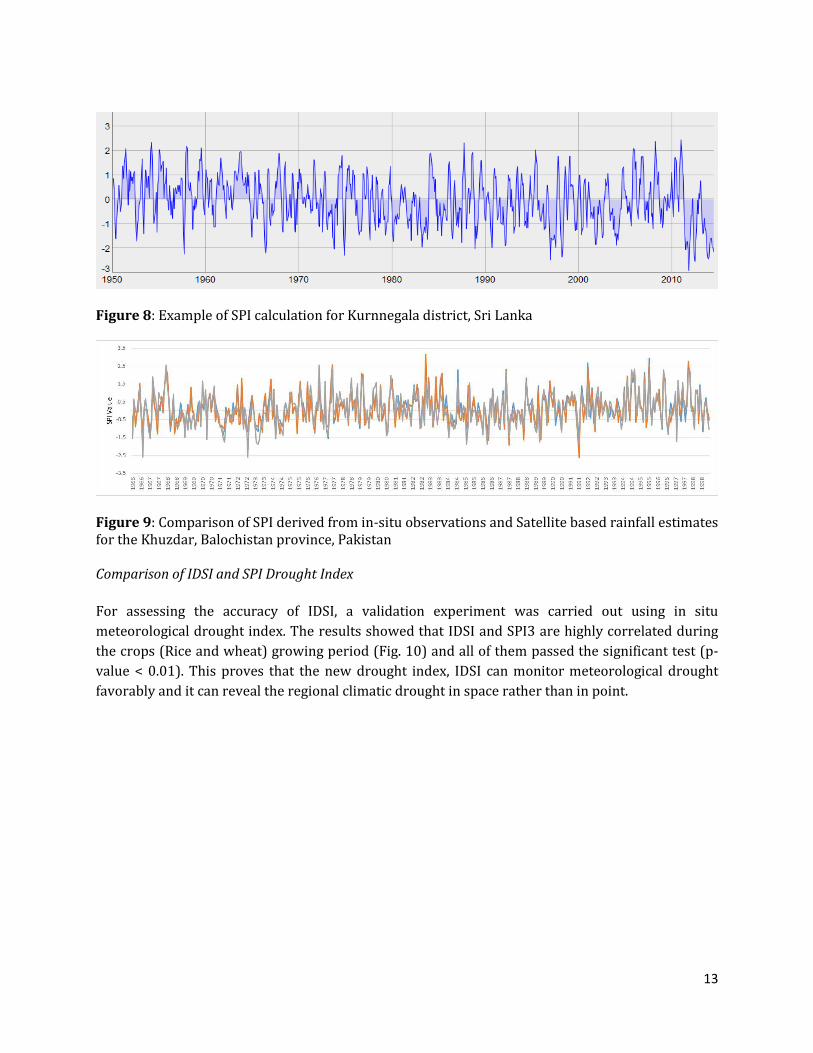
Figure 8: Example of SPI calculation for Kurnnegala district, Sri Lanka
Figure 9: Comparison of SPI derived from in-situ observations and Satellite based rainfall estimates for the Khuzdar, Balochistan province, Pakistan Comparison of IDSI and SPI Drought Index
For assessing the accuracy of IDSI, a validation experiment was carried out using in situ
meteorological drought index. The results showed that IDSI and SPI3 are highly correlated during
the crops (Rice and wheat) growing period (Fig. 10) and all of them passed the significant test (p-
value < 0.01). This proves that the new drought index, IDSI can monitor meteorological drought
favorably and it can reveal the regional climatic drought in space rather than in point.
14
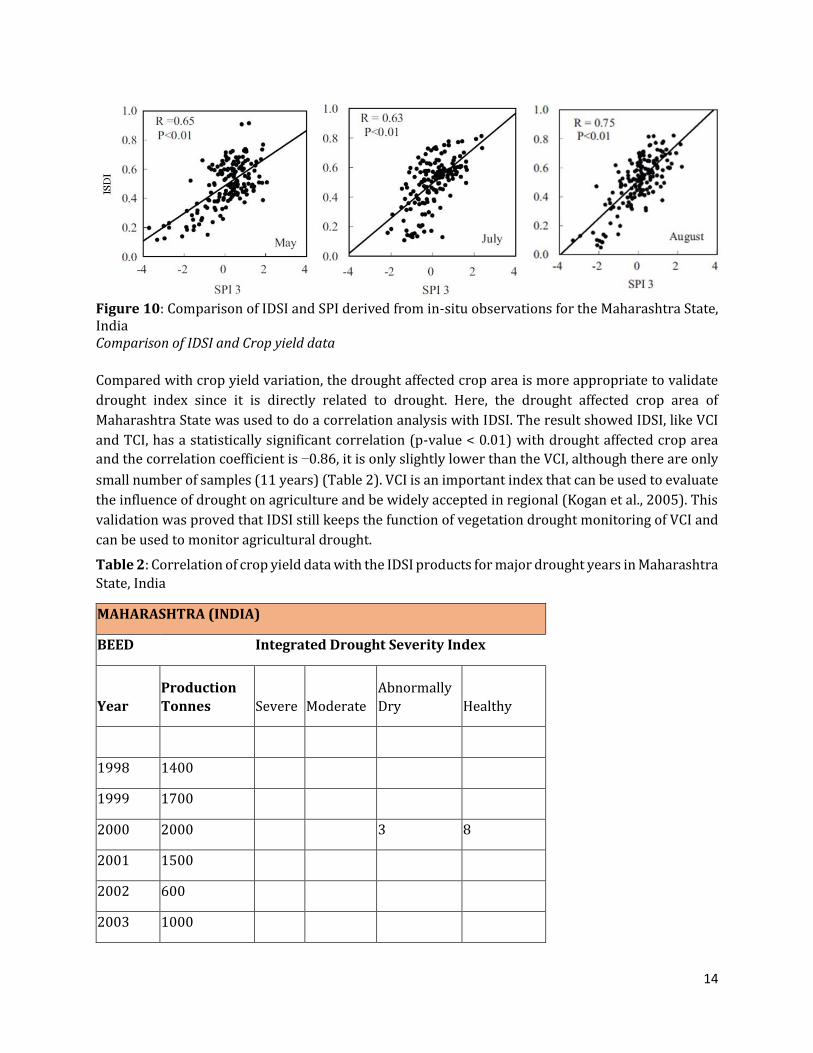
Figure 10: Comparison of IDSI and SPI derived from in-situ observations for the Maharashtra State, India Comparison of IDSI and Crop yield data
Compared with crop yield variation, the drought affected crop area is more appropriate to validate
drought index since it is directly related to drought. Here, the drought affected crop area of
Maharashtra State was used to do a correlation analysis with IDSI. The result showed IDSI, like VCI
and TCI, has a statistically significant correlation (p-value < 0.01) with drought affected crop area
and the correlation coefficient is −0.86, it is only slightly lower than the VCI, although there are only
small number of samples (11 years) (Table 2). VCI is an important index that can be used to evaluate
the influence of drought on agriculture and be widely accepted in regional (Kogan et al., 2005). This
validation was proved that IDSI still keeps the function of vegetation drought monitoring of VCI and
can be used to monitor agricultural drought.
Table 2: Correlation of crop yield data with the IDSI products for major drought years in Maharashtra
State, India
MAHARASHTRA (INDIA)
BEED Integrated Drought Severity Index
Year
Production
Tonnes Severe Moderate
Abnormally
Dry Healthy
1998 1400
1999 1700
2000 2000 3 8
2001 1500
2002 600
2003 1000
15
2004 600 7 3 1
2005 900
2006 1500
2007 7 9 2
2008 400 8 2 1
2009 200 5 3 2 1
2010 300
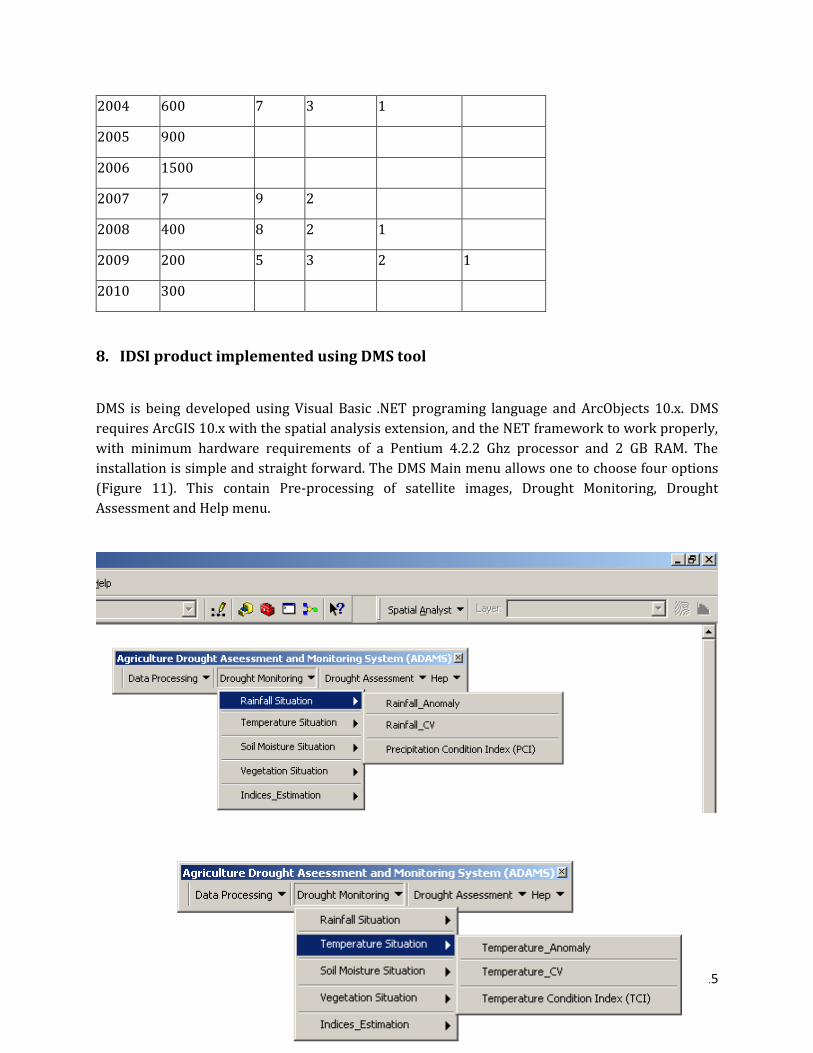
8. IDSI product implemented using DMS tool
DMS is being developed using Visual Basic .NET programing language and ArcObjects 10.x. DMS
requires ArcGIS 10.x with the spatial analysis extension, and the NET framework to work properly,
with minimum hardware requirements of a Pentium 4.2.2 Ghz processor and 2 GB RAM. The
installation is simple and straight forward. The DMS Main menu allows one to choose four options
(Figure 11). This contain Pre-processing of satellite images, Drought Monitoring, Drought
Assessment and Help menu.
16
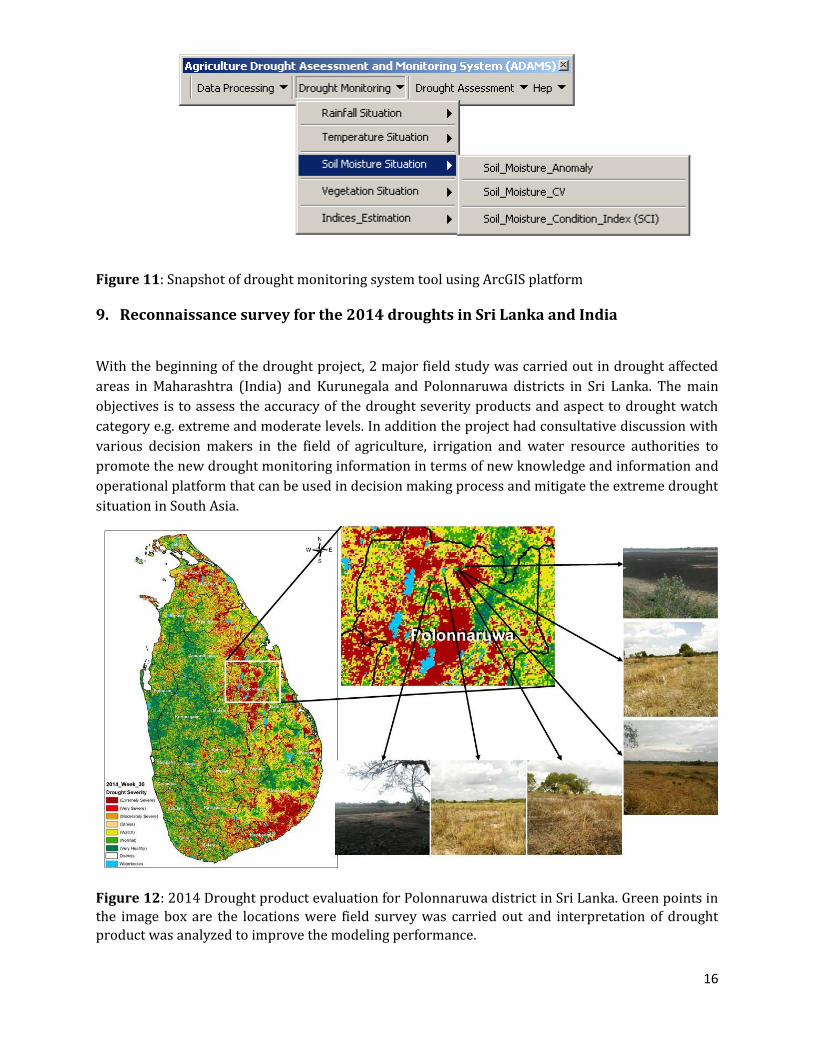
Figure 11: Snapshot of drought monitoring system tool using ArcGIS platform
9. Reconnaissance survey for the 2014 droughts in Sri Lanka and India
With the beginning of the drought project, 2 major field study was carried out in drought affected
areas in Maharashtra (India) and Kurunegala and Polonnaruwa districts in Sri Lanka. The main
objectives is to assess the accuracy of the drought severity products and aspect to drought watch
category e.g. extreme and moderate levels. In addition the project had consultative discussion with
various decision makers in the field of agriculture, irrigation and water resource authorities to
promote the new drought monitoring information in terms of new knowledge and information and
operational platform that can be used in decision making process and mitigate the extreme drought
situation in South Asia.
Figure 12: 2014 Drought product evaluation for Polonnaruwa district in Sri Lanka. Green points in
the image box are the locations were field survey was carried out and interpretation of drought
product was analyzed to improve the modeling performance.
17
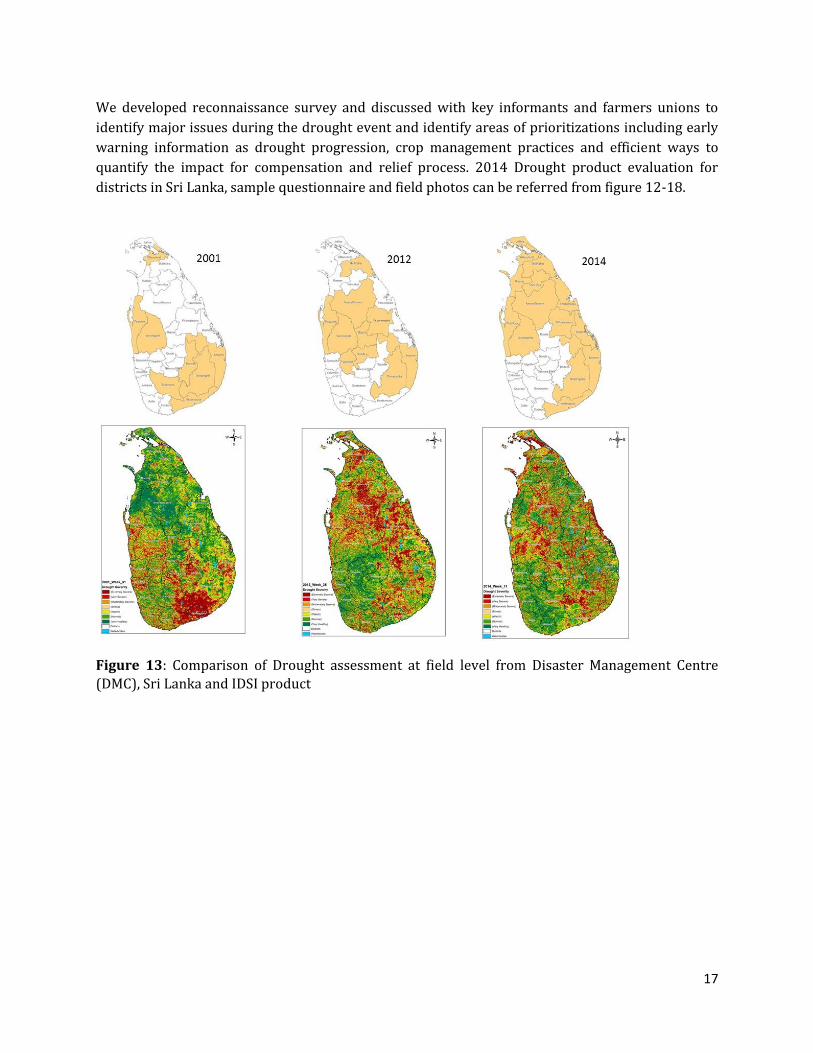
We developed reconnaissance survey and discussed with key informants and farmers unions to
identify major issues during the drought event and identify areas of prioritizations including early
warning information as drought progression, crop management practices and efficient ways to
quantify the impact for compensation and relief process. 2014 Drought product evaluation for
districts in Sri Lanka, sample questionnaire and field photos can be referred from figure 12-18.
Figure 13: Comparison of Drought assessment at field level from Disaster Management Centre
(DMC), Sri Lanka and IDSI product
18
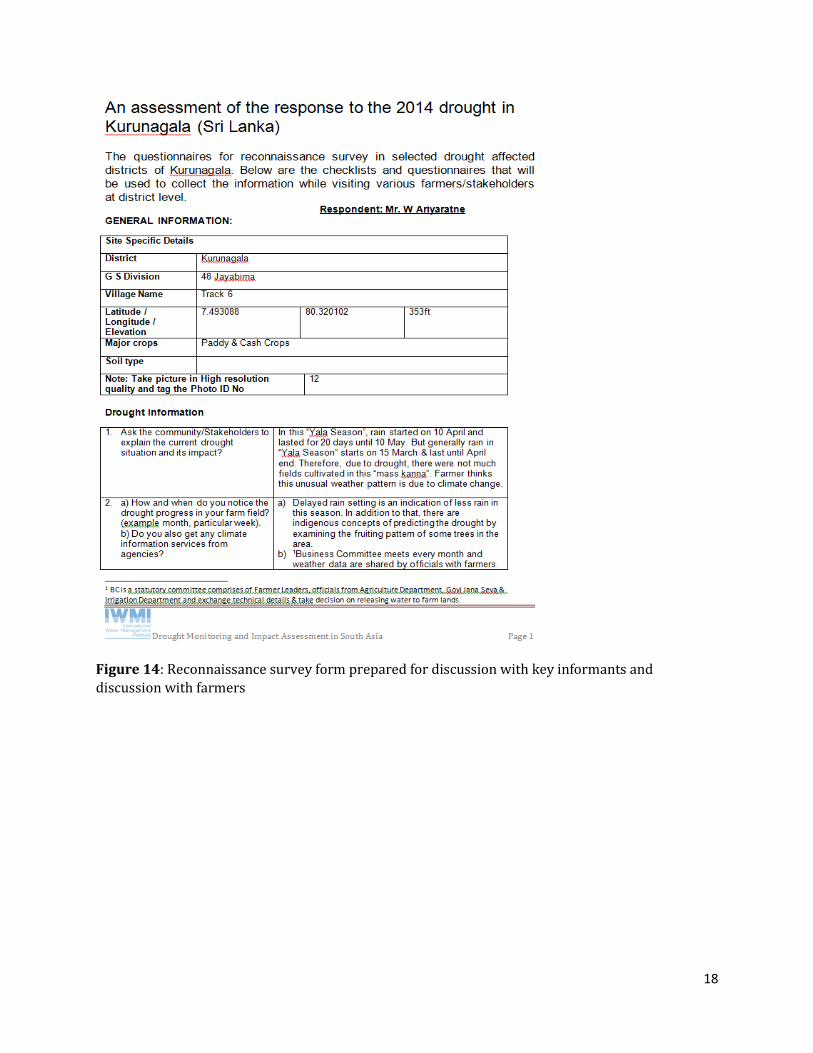
Figure 14: Reconnaissance survey form prepared for discussion with key informants and
discussion with farmers
19
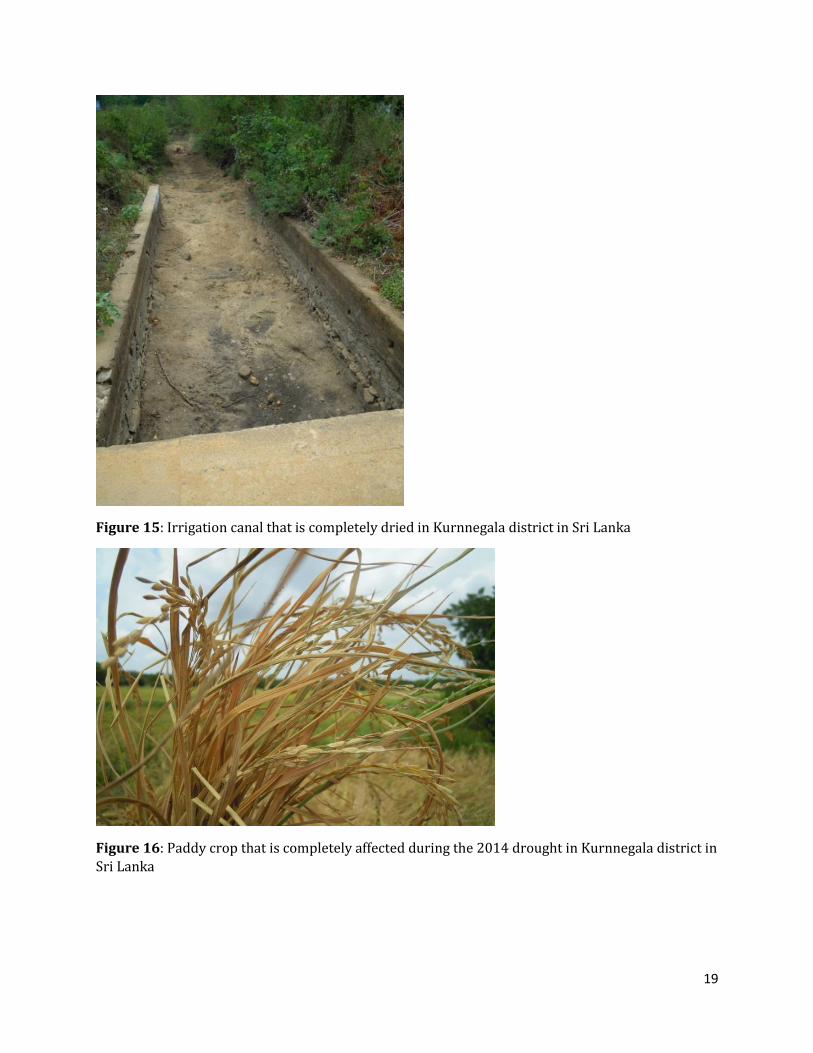
Figure 15: Irrigation canal that is completely dried in Kurnnegala district in Sri Lanka
Figure 16: Paddy crop that is completely affected during the 2014 drought in Kurnnegala district in
Sri Lanka
20
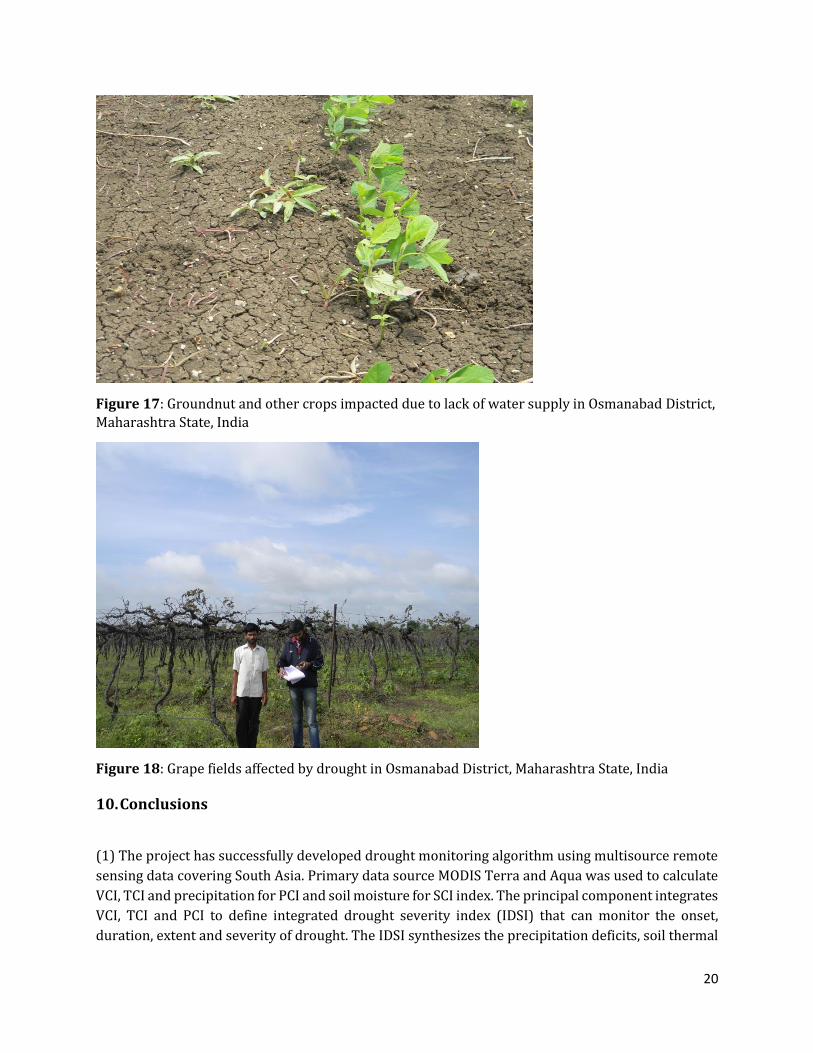
Figure 17: Groundnut and other crops impacted due to lack of water supply in Osmanabad District,
Maharashtra State, India
Figure 18: Grape fields affected by drought in Osmanabad District, Maharashtra State, India
10. Conclusions
(1) The project has successfully developed drought monitoring algorithm using multisource remote
sensing data covering South Asia. Primary data source MODIS Terra and Aqua was used to calculate
VCI, TCI and precipitation for PCI and soil moisture for SCI index. The principal component integrates
VCI, TCI and PCI to define integrated drought severity index (IDSI) that can monitor the onset,
duration, extent and severity of drought. The IDSI synthesizes the precipitation deficits, soil thermal
21
stress and vegetation growth status in drought process and it is favorable to monitor the
comprehensive drought. As an example, the historical drought from 2000 to 2014 was monitored by
this method to test the product performance in selected sites including Sri Lanka, Southern Indian
states and its results was consistent with actuality of drought occurred in past decades.
(2) For validating the accuracy of IDSI, a 3-month scales standardized precipitation index, SPI3 was
calculated from precipitation data of meteorological stations, the variation of crop yield which was
standardized from the annual crop yield of each prefecture city and the drought affected crop area of
whole Maharashtra State was used to do correlation analysis with IDSI. The IDSI is not only well
correlated with SPI3, but also has a correlation with the crop yield variation and the drought affected
crop area. This result proves that the new drought monitoring method integrating multi-source
remote sensing data is a comprehensive drought monitoring indicator, and it could not only contain
the meteorological drought information but it can reflect the drought influence on agriculture as well.
(3) The extension of Phase-II activities of this project includes seamless drought monitoring product
for complete South Asia, finalizing the DMS tool that uses ArcGIS interface, close coordination with
national partners in evaluation of drought product, drought product dissemination in web interface
and finally provide capacity development to relevant stakeholders on the use of remote sensing data
for drought monitoring.
Acknowledgement
This research was funded by the Global Water Partnership (GWP) and World Meteorological Organization (WMO) as part of the Integrated Drought Management Programme (IDMP), CGIAR Research Program on Climate Change, Agriculture and Food Security (CCAFS) and the International Water Management Institute (IWMI). We would like to thank various agencies including Indian Meteorological Agency (IMD), Departments of Meteorology, Irrigation Department, Agrarian in Sri Lanka, Disaster Management Centre (DMC) of Sri Lanka for data sharing and their inspiring guidance and encouragement.
11. References
Kogan, F.N., Yang, B., Wei, G., Zhiyuan, P., Xianfeng, J., 2005. Modelling corn production in China
using AVHRR-based vegetation health indices. International Journal of Remote Sensing 26 (11),
2325–2336.
Kogan, F.N., 1995a. Application of vegetation index and brightness temperature for drought
detection. Advances in Space Research 15 (11), 91–100.
Kogan, F.N., 1995b. Droughts of the late 1980s in the United States as derived from NOAA polar-
orbiting satellite data. Bulletin of the American Meteorological Society 76 (5), 655–668.
Kogan, F.N., 1997. Global drought watch from space. Bulletin of the American Meteorological
Society 78 (4), 621–636.
Vicente-Serrano, S.M., 2007. Evaluating the impact of drought using remote sensing in a
Mediterranean, semi-arid region. Natural Hazards 40 (1), 173–208.
22
Karnieli, A., Bayasgalan, M., Bayarjargal, Y., Agam, N., Khudulmur, S., Tucker, C.J., 2006. Comments
on the use of the vegetation health index over Mongolia. International Journal of Remote Sensing 27
(10),
Lasaponara, R., 2006. On the use of principal component analysis (PCA) for evaluating interannual
vegetation anomalies from SPOT/VEGETATION NDVI temporal series. Ecological Modelling 194 (4),
429–434.
McKee, T.B., Doesken, N.J., Kleist, J., 1993. The relationship of drought frequency and duration to time scales. In: Proceedings of Eighth Conference on Applied Climatology, Anaheim, CA. American Meteorological Society, Boston, MA, pp.179–184.
Salazar, L., Kogan, F., Roytman, L., 2007. Use of remote sensing data for estimation of winter wheat
yield in the United States. International Journal of Remote Sensing 28 (17), 3795–3811.
Salazar, L., Kogan, F., Roytman, L., 2008. Using vegetation health indices and partial least squares
method for estimation of corn yield. International Journal of Remote Sensing 29 (1), 175–189.
Singh, R.P., Roy, S., Kogan, F., 2003. Vegetation and temperature condition indices from NOAA
AVHRR data for drought monitoring over India. International Journal of Remote Sensing 24 (22),
4393–4402.
Disclaimer: The technical report on the South Asia Drought Monitoring System mainly uses multisource
remote sensing data with limited field observations. This is currently being improved with more
validation and stakeholder’s discussion for finalization of drought product.