Embed Size (px)
Citation preview

© 2017. Published by The Company of Biologists Ltd. This is an Open Access article distributed under the terms of the Creative Commons Attribution License
(http://creativecommons.org/licenses/by/3.0), which permits unrestricted use, distribution and reproduction in any medium provided that the original work is properly attributed.
Quantitative microscopy uncovers ploidy changes during mitosis in live
Drosophila embryos and their effect on nuclear size.
Wee Choo Puah1, Rambabu Chinta1 & Martin Wasser1, 2
Author affiliations
1Imaging Informatics Division, Bioinformatics Institute (BII), Agency for Science, Technology
and Research (A*STAR), Singapore Republic of Singapore
2Present address: BioImagingMW, Block 28D Dover Crescent, #31-73, Singapore 134028,
Republic of Singapore
Correspondence to
Martin Wasser
BioImagingMW
Block 28D Dover Crescent, #31-73
Singapore 134028
Phone: (65) 67733242
Key words: Drosophila, live imaging, maternal haploid, Spartan, quantitative microscopy, mitosis Summary statement: 3D time-lapse microscopy revealed karyotype changes during mitosis of live maternal-haploid Drosophila embryos. Image quantification demonstrated that DNA content and nuclear crowding determine nuclear size.
Bio
logy
Ope
n •
Adv
ance
art
icle
by guest on July 1, 2018http://bio.biologists.org/Downloaded from

ABSTRACT
Time-lapse microscopy is a powerful tool to investigate cellular and developmental
dynamics. In Drosophila melanogaster, it can be used to study division cycles in
embryogenesis. To obtain quantitative information from 3D time-lapse data and track
proliferating nuclei from the syncytial stage until gastrulation, we developed an image
analysis pipeline consisting of nuclear segmentation, tracking, annotation and quantification.
Image analysis of maternal-haploid (mh) embryos revealed that a fraction of haploid
syncytial nuclei fused to give rise to nuclei of higher ploidy (2n, 3n, 4n). Moreover, nuclear
densities in mh embryos at the mid-blastula transition varied over threefold. By tracking
synchronized nuclei of different karyotypes side-by-side, we show that DNA content
determines nuclear growth rate and size in early, while the nuclear to cytoplasmic ratio
constrains nuclear growth during late interphase. mh encodes the Drosophila ortholog of
human Spartan, a protein involved in DNA damage tolerance. To explore the link between
mh and chromosome instability, we fluorescently tagged Mh protein to study its subcellular
localization. We show Mh-mKO2 localizes to nuclear speckles that increase in numbers as
nuclei expand in interphase. In summary, quantitative microscopy can provide new insights
into well-studied genes and biological processes.
Bio
logy
Ope
n •
Adv
ance
art
icle
by guest on July 1, 2018http://bio.biologists.org/Downloaded from
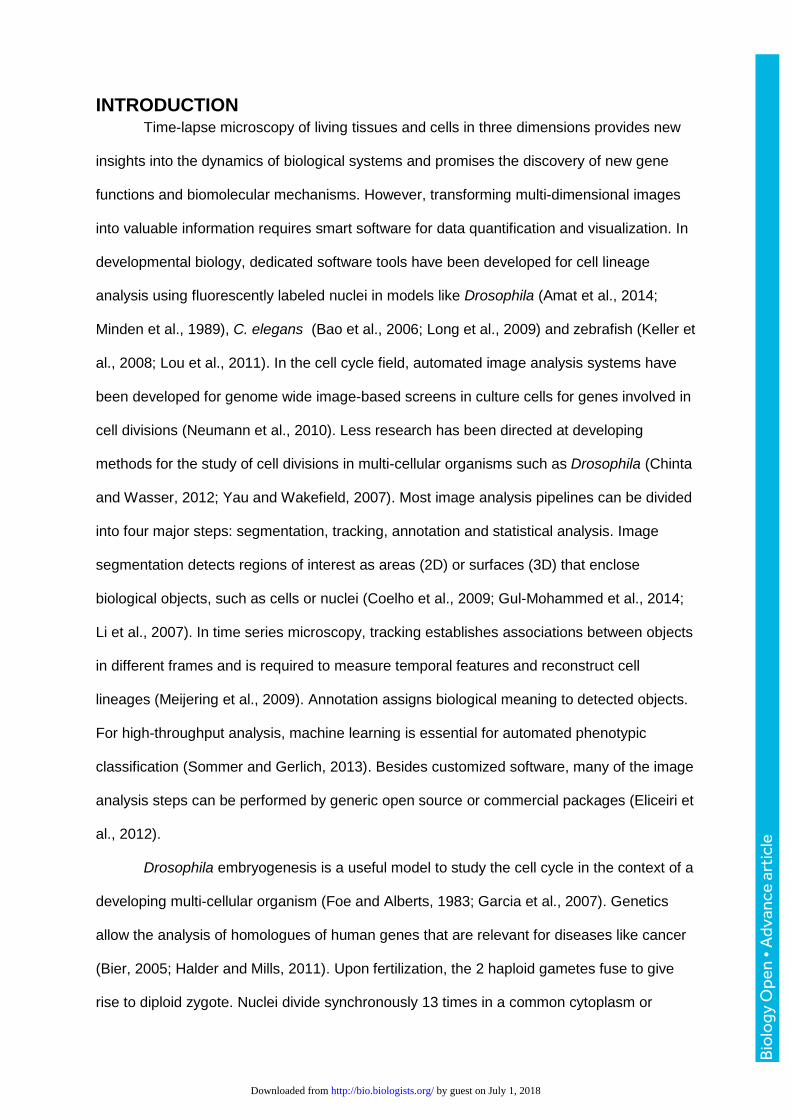
INTRODUCTION Time-lapse microscopy of living tissues and cells in three dimensions provides new
insights into the dynamics of biological systems and promises the discovery of new gene
functions and biomolecular mechanisms. However, transforming multi-dimensional images
into valuable information requires smart software for data quantification and visualization. In
developmental biology, dedicated software tools have been developed for cell lineage
analysis using fluorescently labeled nuclei in models like Drosophila (Amat et al., 2014;
Minden et al., 1989), C. elegans (Bao et al., 2006; Long et al., 2009) and zebrafish (Keller et
al., 2008; Lou et al., 2011). In the cell cycle field, automated image analysis systems have
been developed for genome wide image-based screens in culture cells for genes involved in
cell divisions (Neumann et al., 2010). Less research has been directed at developing
methods for the study of cell divisions in multi-cellular organisms such as Drosophila (Chinta
and Wasser, 2012; Yau and Wakefield, 2007). Most image analysis pipelines can be divided
into four major steps: segmentation, tracking, annotation and statistical analysis. Image
segmentation detects regions of interest as areas (2D) or surfaces (3D) that enclose
biological objects, such as cells or nuclei (Coelho et al., 2009; Gul-Mohammed et al., 2014;
Li et al., 2007). In time series microscopy, tracking establishes associations between objects
in different frames and is required to measure temporal features and reconstruct cell
lineages (Meijering et al., 2009). Annotation assigns biological meaning to detected objects.
For high-throughput analysis, machine learning is essential for automated phenotypic
classification (Sommer and Gerlich, 2013). Besides customized software, many of the image
analysis steps can be performed by generic open source or commercial packages (Eliceiri et
al., 2012).
Drosophila embryogenesis is a useful model to study the cell cycle in the context of a
developing multi-cellular organism (Foe and Alberts, 1983; Garcia et al., 2007). Genetics
allow the analysis of homologues of human genes that are relevant for diseases like cancer
(Bier, 2005; Halder and Mills, 2011). Upon fertilization, the 2 haploid gametes fuse to give
rise to diploid zygote. Nuclei divide synchronously 13 times in a common cytoplasm or
Bio
logy
Ope
n •
Adv
ance
art
icle
by guest on July 1, 2018http://bio.biologists.org/Downloaded from
syncytium. After completion of the syncytial blastoderm, nuclei are engulfed by a plasma
membrane to generate cells (Lecuit and Wieschaus, 2000). Once cellularization is complete,
cells, concurrent with gastrulation, resume divisions in so-called mitotic domains (Foe and
Alberts, 1983). The transparency of embryos enables live cell imaging using fluorescent
proteins. While early studies relied on the injection of fluorescently labeled antibodies or
proteins (Minden et al., 1989; Warn et al., 1987), modern approaches are based on readily
available genetically encoded fluorescent fusions such as histone tagged to green
fluorescent protein (GFP) or its variants (Shaner et al., 2005). In Drosophila, haploidy can
result from the failure of pronuclear fusion during fertilization. The mutation maternal haploid
(mh) was isolated in a screen for female sterile mutations (Gans et al., 1975). mh leads to
gynogenetic development due to the elimination of the male pronucleus (Santamaria, 1983)
which has been proposed to be caused by defects in sperm chromatin remodeling, DNA
replication or chromosome condensation (Loppin et al., 2001). The mh gene encodes the fly
ortholog of the recently identified human Spartan protein, a conserved regulator of DNA
damage tolerance (Delabaere et al., 2014).
The discovery that the sizes of cytoplasm and nucleus are positively correlated dates
back over a century. However, little is known about the mechanisms that establish and
maintain the nuclear-cytoplasmic (NC) ratio (Jevtić et al., 2014; Webster et al., 2009).
Understanding the mechanism is relevant because NC ratio is correlated with cancer and
ageing. The nucleoskeletal theory proposes that the amount and compaction of DNA
influences the size of the nucleus which in turn determines the size of the cell (Cavalier-
Smith, 1978). Conflicting with this idea are more recent data obtained in fission and budding
yeast that suggest that cell size determines nuclear size (Jorgensen et al., 2007; Neumann
and Nurse, 2007). Studies in Drosophila and Xenopus demonstrated the role of the nuclear
envelope in controlling nuclear size (Brandt et al., 2006; Levy and Heald, 2010).
Previously, we developed a 3D level-set based segmentation method for interphase
nuclei and mitotic chromosomes in Drosophila embryogenesis (Chinta and Wasser, 2012).
Here we report the extension of this work to detect and characterize phenotypic effects of
Bio
logy
Ope
n •
Adv
ance
art
icle
by guest on July 1, 2018http://bio.biologists.org/Downloaded from

cell cycle defects in selected lineages. To validate our approach in studying karyotype
changes resulting from mitotic division defects, we applied our method to time-lapse data of
mh embryos. We discovered that haploid nuclei in mh embryos can collide during the
syncytial blastoderm to give rise to diploid and polyploid nuclei that persist until gastrulation
and resume mitosis. Being able to track synchronized nuclei of different karyotypes side-by-
side in the same embryo allowed us to investigate the contributions of DNA content and NC
ratio to nuclear volume. In early interphase after exit from mitosis, nuclear growth is
proportional to DNA content, while in late interphase, the nuclear density imposes
constraints on volume expansion in the later stages of interphase. In addition, we
demonstrate that fluorescently tagged Mh-protein localizes to nuclear speckles and is able to
rescue female sterility of the mh1 mutation.
Bio
logy
Ope
n •
Adv
ance
art
icle
by guest on July 1, 2018http://bio.biologists.org/Downloaded from
RESULTS
Image analysis pipeline for the study of division cycles in live Drosophila
embryos
To track nuclei in early Drosophila, we acquired 3D time-lapse images of embryos
expressing the live chromosome reporter Histone H2Av-GFP, hereafter referred to as
histone-GFP (Clarkson and Saint, 1999). Image recording was carried out using a Zeiss 5
Live confocal laser scanning microscope from the syncytial blastoderm until gastrulation for
up to 4 hours at 55 to 60 second intervals. To measure and visualize the morphological
changes of interphase nuclei and mitotic chromosomes, we built a semi-automated image
analysis system that comprises five standalone modules (Fig. 1). (A) A batch file converter
(TLM-converter) fragments large multi-dimensional datasets for easier downstream
processing into smaller portions (Puah et al., 2011). (B) The batch 3D image segmentation
tool (Chinta and Wasser, 2012) detects the regions of interest (ROIs) that correspond to
nuclei. (C) The optional post-processing module extracts additional data from the primary
segmentation outputs. (D) The einSTA (editing and integration of Segmentation, Tracking
and Annotation) tool performs tracking and quantification of dynamic features. (E) The
DyVis3D module visualizes selected lineages by iso-surface volume rendering. While steps
B and C use images as inputs to detect ROIs and compute their features, steps D and E use
ROIs as inputs to perform tracking, quantification of cellular dynamics and 3D visualization.
The 3D nuclear segmentation method takes advantage of multiple level sets to adapt
to local variations in histone-GFP intensity due to cell cycle dependent variations in
chromatin compaction (Chinta and Wasser, 2012). For each detected nucleus, the tool
produces a primary segmentation output consisting of a 3D surface (represented as a stack
of 2D contours), a silhouette contour of the 3D shape, an optimal intensity threshold, and a
set of intensity and shape features (Fig. S1). einSTA performs time-series analysis of
detected ROIs which are represented by silhouette contours and centroids that are projected
onto maximum intensity projections (MIP) of image stacks. The visual cues help to spot
segmentation errors such as merged or fragmented ROIs (Fig. S2). In proliferating tissues,
Bio
logy
Ope
n •
Adv
ance
art
icle
by guest on July 1, 2018http://bio.biologists.org/Downloaded from
the size, shape, texture and brightness of biological structures such as chromosomes can
vary depending cell cycle phase or genotype. To improve robustness of image analysis
towards this phenotypic heterogeneity, we introduced the concept of composite
segmentation. Each frame in a time-series dataset is associated with one or more
segmentation layers (Fig. S2A, S2B), each of which represents a set of ROIs that was
produced by a different segmentation method and/or set of parameters applied to the same
image stack. An additional composite layer is then created to be populated with
combinations of ROIs derived from different segmentation layers. In our case study, we
initialized the composite layer with all ROIs detected by the MLS method using a parameter
set optimized for a set of ground truth images. The second layer was produced by applying a
shape-split operation to the ROIs of the primary layer (Fig. S3). Incorrectly segmented
objects in the composite layer were removed and substituted in an interactive fashion with
objects from the second layer.
Tracking creates temporal associations between ROIs of adjacent frames and is
required to determine dynamic features. We applied a bilateral nearest neighbor (NN) search
to find assignments between ROI centroids of subsequent frames. This automated step was
followed by manual correction of assignment errors. Based on 27818 ground truth
assignments with a mean displacement of 1.41 µm ± 1.61 µm (median 0.90) in 121 pairs of
frames in an embryo imaged from nuclear cycle 12 until cell cycles in gastrulation, recall and
precision rates of the NN search were estimated as 94.6% and 91.8%, respectively (Fig.
S4). Once the accuracy of selected tracks was verified, time-series data such as volume and
intensity changes were exported for further statistical analysis (see next chapters).
Fusions of nuclei in mh1 syncytial embryos lead to karyotype changes
Cell division defects can lead to alterations of chromosome number. To test if our
analysis system could detect variations in ploidy, we decided to compare maternal haploid
(mh1) with diploid wildtype embryos. Consistent with haploidy, histone-GFP labeled mitotic
Bio
logy
Ope
n •
Adv
ance
art
icle
by guest on July 1, 2018http://bio.biologists.org/Downloaded from
chromosomes of mh1 embryos occupied a discernibly smaller regions than in diploid
embryos (Fig. 2A, 2B) and the presence of 5 chromosome arms in haploids (one arm for the
X, 2 arms each 2nd and 3rd) instead of 10 in diploids could often be confirmed visually in
images of anaphase nuclei (Fig. S5). Volume measurements showed that mitotic
chromosomes occupied approximately half the space in haploid embryos compared to their
diploid counterparts (Fig. 2A, 2B). Furthermore, chromosomal volume statistics of mh1 and
control embryos showed that measurements during metaphase and anaphase were
proportional to DNA content (Fig. S6A). To assess the influence of variations in histone-GFP
reporter gene expression on volume measurements, we analyzed the fluorescence intensity
of detected objects. We noticed that mean histone-GFP intensity increased consistently
between subsequent nuclear cycles (29.5% ± 5.7%, p=0.000, mean mu>0, n=8). In contrast,
we did not observe a corresponding increase in measured volumes (-5.6% ± 10.6%,
p=0.179, µ ≠ 0), indicating that our image segmentation method was robust towards
variations in fluorescence intensity (Fig. S6B).
Unexpectedly, images of some post-blastoderm mh1 embryos showed nuclei of
variable sizes and chromosome numbers, indicating a mixture of karyotypes (Fig.2C).
Volume measurements of mitotic chromosomes in metaphase, anaphase and telophase
suggested that a fraction of cells contained between two to four times more DNA than
haploid cells in the same embryo. To understand the diversity in karyotypes, that had also
been reported in previous studies (Loppin et al., 2001; Santamaría and Gans, 1980), we
traced individual nuclei from the post-blastoderm (gastrula) back to the syncytial blastoderm
stage using the einSTA tool. Time-lapse image analysis revealed that increased ploidy arose
from collisions of mitotic chromosomes during the syncytial blastoderm (Fig. 2D, 2E; Movie
1, 2, 3). Collisions led to volume changes proportional to chromosome numbers. Diploid
nuclei in mutant mh1 embryos gave rise to mitotic chromosomes that occupied twice the
volumes of haploid chromosome sets in the same embryo in metaphase and anaphase, and
comparable volumes to diploid chromosome sets in control embryos. 3D visualization of
tracks in 3D helped to rule out segmentation errors as explanations for karyotype changes
Bio
logy
Ope
n •
Adv
ance
art
icle
by guest on July 1, 2018http://bio.biologists.org/Downloaded from
(Movie 3). All observed collisions (n=87) happened during metaphase (25%) or anaphase
(75%) of the syncytial blastoderm (Fig. 2D-E). Chromosome collisions were rare events. The
estimated proportion of nuclei per nuclear cycle involved in collisions was 4.5% ± 3.8%
(1399 nuclei in 9 nuclear cycles) (Fig. S7). As previously reported, mh1 embryos undergo 14
instead of 13 nuclear divisions prior to cellularization (Edgar et al., 1986). Hence it seemed
conceivable that chromosome fusions could arise from the increased density of nuclei during
nuclear cycle 14. However, we detected several fusions during the earlier nuclear cycles 12
and 13, indicating that physical crowding in the periphery of embryos was unlikely to be the
cause of nuclear collisions (Fig. S7). We did not observe any chromosome collisions during
the syncytial blastoderm of wildtype embryos (1015 nuclei during NC11-13 of 3 embryos).
Collisions in anaphase did not involve daughter nuclei from the same mother nucleus,
arguing against defects in chromosome segregation as an explanation for karyotype
changes. Moreover, we never observed fusions of interphase nuclei during syncytial
blastoderm or later in embryogenesis after cellularization. The majority of cases involved two
haploid nuclei merging to become diploid. In one case, three haploid genomes gave rise to
one haploid, diploid and triploid nucleus by colliding in anaphase (Fig. 2D). In another case,
we saw a simultaneous fusion of the three haploid genomes in metaphase (Fig. 2E). Our
tracking data did not provide any evidence that diploidy in haploid embryos resulted from
endoreplication during the cellular blastoderm since we did not to detect any track that
changed its ploidy between the last syncytial and the first non-synchronized division in
gastrulation. Another explanation of nuclear collision could be that haploidy could make
chromosomes more prone to collisions. However, we also observed diploid nuclei in mh1
embryos that fused to become tetraploid (Movie 2, 3). In summary, the combination of 3D
time-lapse imaging and image analysis enabled the discovery that chromosome collision
lead to karyotype changes in mh1 embryos.
Bio
logy
Ope
n •
Adv
ance
art
icle
by guest on July 1, 2018http://bio.biologists.org/Downloaded from
Diversity of nuclear densities in mh embryos at mid-blastula transition
Mitotic defects during the syncytial blastoderm stage are known to lead to an
elimination of surface nuclei (Philp et al., 1993). To quantify nuclear proliferation and
elimination, we implemented a method to estimate the density of surface nuclei (Fig. 3A-D).
The method computes a convex hull using the x-y components of nuclear centroids as
inputs. Nuclear density (ND) was determined as the number of nuclei divided by their
enclosing hull area (#nuclei/1000 µm2). We analyzed the time-lapse datasets of three control
and nine mh1 embryos labeled with histone-GFP. ND values determined 5.5 minutes after
start of anaphase of the final synchronized metaphase showed a greater variability in mh1
(mean=28.7 ± 11.7; ranging from 12.2 to 42.1) than in control embryos (26.5 ± 1.8; ranging
from 24.5 to 27.6) (Fig. 3E). Consistent with previous reports that mh1 embryos undergo an
additional nuclear cycle before entering mid-blastula transition (MBT, here defined at as the
period following the last synchronized division cycle), four mh1 embryos showed up to 60%
higher nuclear densities than controls after the exit from the last syncytial mitosis. Time
series plots revealed that ND decreased during the cellular blastoderm (Fig. 3F). As a result,
after 40 minutes, the increased ND over controls narrowed to less than 30%. The decreasing
ND was reflected by an elimination of surface nuclei that could be observed in the time-lapse
images of live mh1 embryos (Movie 1). Unexpectedly, we encountered a second group of mh
embryos that entered MBT with nuclear densities lower than (3 embryos) or similar to (2
embryos) controls (Fig. 3E, 3F). In summary, the quantification of nuclear density and its
developmental dynamics added new phenotypic insights about mh1 mutants.
Control of interphase nuclear volume during the cellular blastoderm
Published data contain conflicting theories on the factors that determine the size of
the nucleus. On one hand, the nucleoskeletal theory proposes that the amount of DNA is the
major determining factor (Cavalier-Smith, 1978), while on the other hand, experimental data
Bio
logy
Ope
n •
Adv
ance
art
icle
by guest on July 1, 2018http://bio.biologists.org/Downloaded from
in yeast suggest that cytoplasmic size dictates the volume of the nucleus independent of
ploidy (Jorgensen et al., 2007; Neumann and Nurse, 2007). The diversity in nuclear
densities and karyotypes at the onset of MBT in mh1 embryos opened the opportunity to
analyze the influence of DNA content and NC-ratio on nuclear growth rate and volume. We
focused our analysis on cellularization which begins after the exit from the last syncytial
mitosis and takes approximately one hour to complete (Lecuit, 2004). Time-series plots
comparing the volumes of individual nuclei of different karyotypes in the same embryo
showed that volumes were proportional to the amount of DNA (Fig. 4A). In addition, we
noticed two distinct phases of nuclear growth during the cellular blastoderm stage, an initial
rapid growth lasting 8-10 minutes (phase1) and a subsequent slow growth phase (phase2)
that lasts until the next mitosis (Fig. 4B). To estimate and compare nuclear growth rates
within and between embryos, we determined the slopes (µm3/minute) of the linear
regressions (volume versus time) that were computed for the first 10 frames (9.1 minutes)
after anaphase and the subsequent 30 frames (27.5 minutes) (Fig. 4B). We performed the
quantification of 89 nuclear tracks derived from 7 embryos (5 mh1 and 2 control) that were
recorded from the syncytial nuclear divisions until the post-blastoderm cell divisions (Table
S1). The mean R2 values of the tracks were 0.941±0.046 and 0.850±0.175 for phases 1 and
2, respectively, indicating that the linear growth model represented a good approximation.
Ploidies of the analyzed nuclei ranged from 1 to 4, while nuclear densities after exit from the
last syncytial mitosis ranged from 12.2 to 42.1 nuclei per 1000 µm2. The deceleration in
nuclear growth between early phase 1 and late phase 2 ranged from 2.9 to 9.6. When
comparing synchronized nuclei of different karyotypes within the same embryos, growth
rates (Fig. 4C, 4D) and volumes (Fig. S8) were always proportional to DNA content
throughout the cellular blastoderm stage, supporting the nucleoskeletal theory. Meanwhile,
we noticed that sizes of nuclei of the same ploidy showed increasing divergence between
embryos as interphase progressed (Fig. 5A-B). Plotting the mean volumes versus ND of
haploid and diploid nuclei at anaphase (Fig. 5C) and 36 minutes later in interphase (Fig. 5D)
further helped to visualize the negative effect of ND on nuclear size.
Bio
logy
Ope
n •
Adv
ance
art
icle
by guest on July 1, 2018http://bio.biologists.org/Downloaded from
Interphase of the nuclear cycles 1-13 only consists of S-phase and lacks the gap
phases G1 and G2, while interphase of the cellular blastoderm comprises S- and G2-phases
(Farrell and O’Farrell, 2014). To examine the influence of G2 on nuclear growth, we
quantified nuclear size changes during the last two synchronized cycles of control and mh1
embryos. During the penultimate nuclear cycles, we observed that a linear and rapid nuclear
growth was followed by DNA condensation (Fig. S9A), suggesting that the rapid nuclear
growth coincides with DNA replication and slow growth with G2. The comparison of nuclei of
different ploidy in mh1 embryos confirmed that, in the syncytial blastoderm, nuclear size (Fig.
S9B) and growth (Fig. S9C) scaled with ploidy.
To explore if a limited pool of maternally supplied nuclear assembly factors may
impose a collective constraint on nuclear growth, we determined the sum of nuclear volumes
relative to the area they occupy on the embryonic surface. We refer to the cumulative
nuclear volume as the volume to hull ratio (VHR). Time series plots indicate that VHR values
of different embryos converged to a narrow range from 4.2 to 5.9 (5.3 ± 0.6) despite the
diversity of karyotypes and nuclear densities (28.4 ± 9.4), supporting the idea that the NC-
ratio limits nuclear growth (Fig. S10). The collective volume analysis does not require
tracking of individual nuclei and is tolerant to segmentation errors like fusion or splitting of
ROIs, thus offering a more efficient way to analyze time-lapse data. In summary, we
demonstrate that nuclear growth rates are determined by both DNA content and the amount
of cytoplasm available for each nucleus.
MH-protein localizes to nuclear speckles in interphase nuclei
To better understand the nuclear fusion phenotype in mh embryos, we identified
CG9203 as the gene causing female sterility, as described below. The same gene was
independently isolated by the Loppin group using a different strategy (Delabaere et al.,
2014). We mapped the mh mutation to a 52.2 kbp region on the X-chromosome by finding
two overlapping duplications in the P[acman] BAC (bacterial artificial chromosome) collection
Bio
logy
Ope
n •
Adv
ance
art
icle
by guest on July 1, 2018http://bio.biologists.org/Downloaded from
(Venken et al., 2010) that could rescue female sterility of the mh1 allele. Upon genomic
sequencing and complementation tests (see Methods for details), we selected CG9203, the
Drosophila ortholog of human Spartan which is involved in DNA repair as a candidate gene
(Centore et al., 2012; Ghosal et al., 2012; Juhasz et al., 2012). CG9203 is expressed
maternally in ovaries (Gelbart and Emmert, 2013) and contains 5 non-synonymous
mutations, one of which involves a conserved methionine in the conserved Sprt domain.
Similar to the BAC clones, a 4432 bp genomic fragment containing the 2421 bp ORF, 1553
bp upstream and 282 bp downstream regions of CG9203 could rescue female sterility.
Rescue of mh1 sterility using the P[acman] clones and genomic DNA was partial.
Approximately 10% of embryos produced by mh1/mh1 females hatched into larvae (32 of 323
eggs laid by mh1/mh1; PBac{DC300}VK00033/+), compared to 0% for females without
CG9203 containing transgenes. The rescued larvae developed into adults without
discernible morphological abnormalities that gave rise to stable mh1 homozygous stocks.
The genomic duplication was able to rescue haploidy. 84.6% (22/26) of mh1;PBac{DC300}/+
fixed syncytial blastoderm embryos in meta- or anaphase were diploid, while the remaining
15.4% were haploid. In contrast, 100% (9/9) of mh1 embryos were haploid. Among the 22
rescued diploid mh1 embryos, none contained polyploidy nuclei, supporting the notion that
loss of mh is responsible for chromosome collisions.
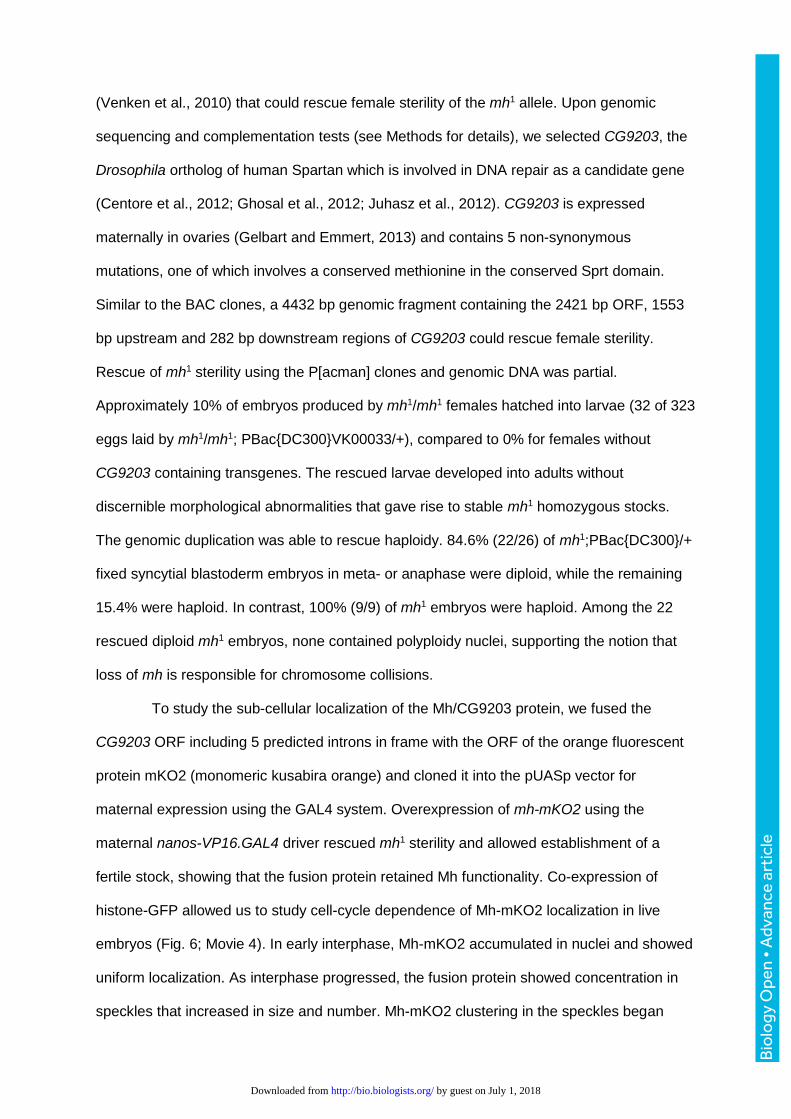
To study the sub-cellular localization of the Mh/CG9203 protein, we fused the
CG9203 ORF including 5 predicted introns in frame with the ORF of the orange fluorescent
protein mKO2 (monomeric kusabira orange) and cloned it into the pUASp vector for
maternal expression using the GAL4 system. Overexpression of mh-mKO2 using the
maternal nanos-VP16.GAL4 driver rescued mh1 sterility and allowed establishment of a
fertile stock, showing that the fusion protein retained Mh functionality. Co-expression of
histone-GFP allowed us to study cell-cycle dependence of Mh-mKO2 localization in live
embryos (Fig. 6; Movie 4). In early interphase, Mh-mKO2 accumulated in nuclei and showed
uniform localization. As interphase progressed, the fusion protein showed concentration in
speckles that increased in size and number. Mh-mKO2 clustering in the speckles began
Bio
logy
Ope
n •
Adv
ance
art
icle
by guest on July 1, 2018http://bio.biologists.org/Downloaded from
after 3-4 minutes of interphase, suggesting that speckle formation may correlate with the end
of DNA replication. Localization to nuclear speckles was also reported for human Spartan
(Machida et al., 2012). Once nuclei entered mitosis, the fusion protein was rapidly depleted
and did not co-localize with condensed chromosomes. Therefore, the localization in mitosis
does not provide a clue on how mh deficiency may contribute to chromosome fusion during
metaphase and anaphase.
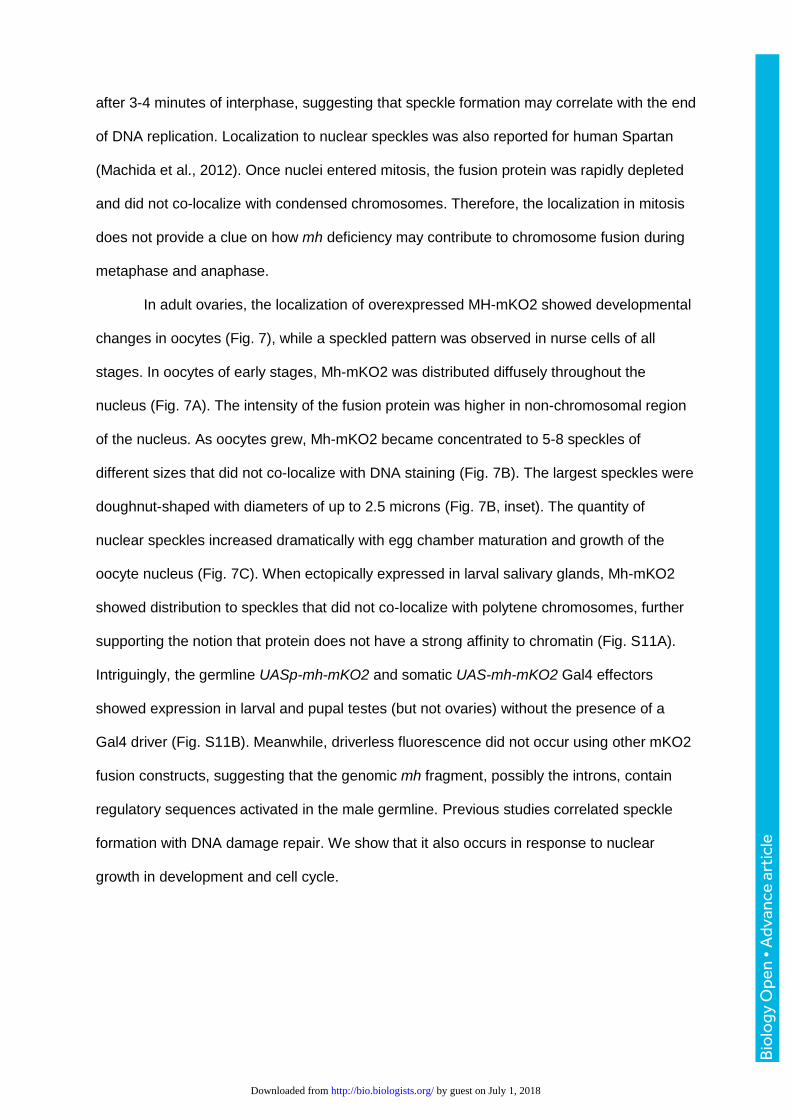
In adult ovaries, the localization of overexpressed MH-mKO2 showed developmental
changes in oocytes (Fig. 7), while a speckled pattern was observed in nurse cells of all
stages. In oocytes of early stages, Mh-mKO2 was distributed diffusely throughout the
nucleus (Fig. 7A). The intensity of the fusion protein was higher in non-chromosomal region
of the nucleus. As oocytes grew, Mh-mKO2 became concentrated to 5-8 speckles of
different sizes that did not co-localize with DNA staining (Fig. 7B). The largest speckles were
doughnut-shaped with diameters of up to 2.5 microns (Fig. 7B, inset). The quantity of
nuclear speckles increased dramatically with egg chamber maturation and growth of the
oocyte nucleus (Fig. 7C). When ectopically expressed in larval salivary glands, Mh-mKO2
showed distribution to speckles that did not co-localize with polytene chromosomes, further
supporting the notion that protein does not have a strong affinity to chromatin (Fig. S11A).
Intriguingly, the germline UASp-mh-mKO2 and somatic UAS-mh-mKO2 Gal4 effectors
showed expression in larval and pupal testes (but not ovaries) without the presence of a
Gal4 driver (Fig. S11B). Meanwhile, driverless fluorescence did not occur using other mKO2
fusion constructs, suggesting that the genomic mh fragment, possibly the introns, contain
regulatory sequences activated in the male germline. Previous studies correlated speckle
formation with DNA damage repair. We show that it also occurs in response to nuclear
growth in development and cell cycle.
Bio
logy
Ope
n •
Adv
ance
art
icle
by guest on July 1, 2018http://bio.biologists.org/Downloaded from
DISCUSSION
Quantitative microscopy of mitotic division cycles in embryogenesis
We developed a modular image analysis system for 3D time-lapse microscopy and
applied it to the phenotypic characterization of the maternal haploid mutation in Drosophila
embryos. Tracking and volume measurements demonstrated that nuclei of different ploidies
in mh embryos could be traced back to collisions of mitotic chromosomes during the
syncytial blastoderm stage. Nuclear collisions happened at metaphase or anaphase and
involved chromosomes of different nuclei. We did not encounter a single case where the
failure of sister chromatid segregation lead to increased ploidy. Fusions were observed at
nuclear densities seen in wildtype embryos during nuclear cycles 12 and 13, ruling out the
possibility that nuclear fusions resulted from crowding of nuclei. A previous study showed
that haploid nuclei from mh donor embryos injected into diploid host embryos could give rise
to haploid as well as diploid cell clones in adult flies (Santamaria, 1983). Our results provide
an explanation for these observations.
The mechanism of nuclear fusion and its relationship to the mh gene function remain
to be elucidated. Spartan, the homolog of the mh gene product is implicated in translesion
synthesis, a system that helps replication forks bypass sites of DNA damage (Delabaere et
al., 2014). As such, mh deficiency may lead to incomplete replication of the paternal
pronucleus and its elimination from the zygote. Four models may explain chromosome
collisions in syncytial embryos. First, loss of mh may affect the formation of actin-containing
metaphase furrow that shields neighboring spindles from colliding in the absence of plasma
membranes (Rikhy et al., 2015). Second, nuclear fusions in Centrosomin deficient embryos
were attributed to centrosomal malfunction and reduced spacing of mitotic spindles (Megraw
et al., 1999). Similarly, mh1 embryos may be more prone to centrosomal or spindles
malfunction. Third, the fusion phenotype may be an indirect consequence of losing the
paternal genome during fertilization, which may affect the formation of the metaphase furrow
or centrosome function. Fourth, a second mutation on the mh1 chromosome, such as the
female sterile mutation fs(1)RK4 (Loppin et al., 2001), could be responsible for the
Bio
logy
Ope
n •
Adv
ance
art
icle
by guest on July 1, 2018http://bio.biologists.org/Downloaded from
phenotype. However, we did not find polyploid nuclei in mh1 homozygous embryos whose
haploidy was rescued by a duplication of the mh gene, suggesting that haploidy and
chromosome collisions are linked. Future research should focus on possible replication-
independent functions since Mh-mKO2 accumulated in non-chromosomal nuclear speckles
in late interphase, presumably after completion of replication. One known function of nuclear
speckles is to serve as storage sites of RNA splicing factors (Lamond and Spector, 2003).
Interestingly, a link between chromosome instability and localization to nuclear speckles was
found for poly(ADP-ribose) polymerase-1 (PARP-1), which localizes to nuclear speckles in
mouse oocytes and predisposes female gametes to genome instability (Yang et al., 2009).
Nuclear size control
Taking advantage of the fact that we could track synchronized nuclei of different
karyotypes in the same cytoplasm, we investigated the control of nuclear size in the context
of Drosophila embryogenesis. Two opposing models explain the size of nuclei. While the
evolutionarily conserved scaling of nuclear volume with genome size supports the intuitive
model that DNA content is the main determinant of nuclear size, more recent evidence from
various experimental systems favors the idea that cytoplasmic volume and components
dictate nuclear volume (Edens et al., 2013). Our data show that both theories can be
reconciled (Fig. 8). During mitosis, condensed chromatin occupies a space that is
proportional to ploidy. In early interphase after exit from mitosis, nuclear volumes expand
rapidly and growth rates and absolute sizes remain correlated with ploidy, indicating that
some nuclear assembly factors are associated with chromatin. As interphase progresses,
nuclear growth slows and crowding exerts a negative effect on nuclear growth, indicating
that nuclei share a finite amount of other nuclear assembly factors that are deposited
maternally into the egg chambers. As a result, nuclear volumes of the same karyotype can
diverge between embryos. The conclusion that finite supplies of cytosolic factors are
recruited for nuclear assembly are consistent with the ‘limited flat membrane hypothesis’ that
Bio
logy
Ope
n •
Adv
ance
art
icle
by guest on July 1, 2018http://bio.biologists.org/Downloaded from
proposes that growth of the nucleus is limited by the amount of ER membranes available in
the cytoplasm for incorporation into the NE (Webster et al., 2009).
Based on our experiments, the variations of nuclear size and growth in mh embryos
can be explained by variations in ploidy and nuclear density. However, to fully rule out
genetic effects of the mh mutation and strengthen the argument of generality, we will need to
extend our analysis to other genetic perturbations. One example is the mutant daughterless-
abo-like (dal) where embryos, due to nuclear division defects, enter cellularization at half the
nuclear density of wildtype embryos (Sullivan et al., 1990). Although no quantification was
carried out, nuclei and cells were reported to be much larger than in wildtype embryos,
indicating that the inverse correlation between nuclear size and density in mh embryos may
reflect a general response of nuclei to increased cytoplasmic volume. While the literature
reports that mh embryos undergo 14 nuclear cycles, live imaging helped to uncover that a
subset of embryos undergo their final synchronized mitosis at nuclear densities similar to
wildtype embryos in nuclear cycles 12 or 13. Since nuclear density depends on the number
of division cycles and the depletion of nuclei, a key experiment would be to perform live
imaging of all nuclear cycles from the zygote onwards. However, the single photon CLSM
used in this study has limited depth penetration and could only image the cortical cycles 10-
13. Multi-photon confocal microscopy or light sheet microscopy (Keller et al., 2010) appear
suitable to overcome this optical limitation and record nuclear cycles 1-9 in the interior of the
egg.
Bio
logy
Ope
n •
Adv
ance
art
icle
by guest on July 1, 2018http://bio.biologists.org/Downloaded from
Materials and methods
Drosophila Stocks
Nuclei and mitotic chromosomes in live maternal haploid (mh1) and control
Drosophila embryos were visualized using the His2Av-GFP reporter gene on the 3rd
chromosome that expresses Histone-H2Av fused to green fluorescent protein (GFP)
(Clarkson and Saint, 1999). The reporter gene was combined with the X-chromosome y1 wa
mh1/FM7a (Bloomington stock no. B-7130). Fly stocks were obtained from the Bloomington
Drosophila stock center. Female sterility associated with mh1 could be rescued with two
overlapping BAC X-chromosomal duplications X: 15453241-15544202 and X: 15397371-
15505482 of the stocks w1118; Dp(1;3), PBac{DC300}VK00033 (B-30414) and w1118;
Dp(1;3), PBac{DC521}VK00033 (B-32322), respectively. The nanos:Gal4:Vp16 driver (B-
4937) was used for maternal overexpression, Smid-Gal4 (B-27893) for expression in salivary
glands. P-element mediated germline transformation was carried out by an external service
provider (BestGene, Chino Hill, CA). Stocks newly generated for this study were deposited
at Vienna Drosophila Resource Center (VDRC): http://stockcenter.vdrc.at.
Molecular Biology and identification of the mh gene
Genomic DNA of mh1 homozyogous adults was isolated using the Wizard Genomic
DNA purification kit (Promega, Madison, WI). Genomic DNA of the mutant X-chromosome
was re-sequenced by a service provider (BGI, Shenzhen, China). To rescue female sterility
linked to the mh1 chromosome, we amplified by PCR 4432 bp of genomic DNA from wildtype
Canton-S flies containing the CG9203 gene. The genomic DNA fragment (X: 15,476,953-
15,472,522) contained the 2432 bp ORF with 5 exons and 4 introns, a 1637 bp upstream
and 282 bp downstream region. The PCR primers included XbaI and XhoI restriction
enzyme (RE) sites that were used to insert the genomic fragment into the pCasper4
transformation vector. To study protein localization of the CG9203 gene product, the
CG9203 ORF was fused in frame with the cDNA of monomeric Kusabira orange 2 (mKO2)
Bio
logy
Ope
n •
Adv
ance
art
icle
by guest on July 1, 2018http://bio.biologists.org/Downloaded from
(Sakaue-Sawano et al., 2008) and cloned into pUASp and pUAST derived expression
vectors using the Gateway recombination system (Invitrogen, USA) as previously described
(Puah and Wasser, 2016). In short, the CG9203 ORF was amplified by PCR disabling the
predicted stop codon and cloned directionally by topoisomerase I to create a Gateway entry
vector. Recombination between entry clone and the pUASp-GC-mKO2/pUAST-GC-mKO2
destination vectors created the pUASp-gc9203-mKO2 and pUAST-cg9203-mKO2 P-element
germline transformation vectors.
Time-lapse microscopy
Sample preparation and in vivo imaging were performed as previously described
(Chinta and Wasser, 2012). 0 to 2 hour old embryos were dechorionated for two minutes
with a 50% bleach solution, washed with PBS, transferred to an uncoated 32 mm glass
bottom dish (MatTek, Ashland, Massachusetts) and covered with a solidified layer of 0.8%
low melting point agarose in PBS to prevent dehydration during imaging. Time-lapse imaging
was carried out at room temperature (21-23° C) using a high-speed, line-scanning Zeiss 5
Live confocal laser scanning inverted microscope (Carl Zeiss, Jena, Germany) and a 63x/1.4
oil DIC Plan-Apochromat objective. For single-channel imaging of histone-GFP, we used an
excitation wavelength of 489 nm at 0.5% to 1% laser power (max. output 100 mW). We
selected a 505 nm emission long pass filter and set the slit size to 10 µm. The optimal
spacing between z slices of 0.44 µm was suggested by the manufacturer's acquisition
software. We recorded the 3D image stacks, consisting of 66-70 slices of 1024x1024 pixels
(zoom 1.0, 8 bits), at 50 to 60 second intervals for up to 4 hours. Image acquisition focused
on the head region to limit the number of cells migrating out of the field of view due to
gastrulation. The voxel dimensions in x, y and z were 0.1x0.1x0.44 µm. Dual-channel
recording of histone-GFP and Mh-mKO2 was carried out at 50-second intervals using 488
nm and 532 nm lasers at 2.8% power (band pass filter NFT 535, long pass filter 550 nm). 3D
image stacks contained 37 optical sections with voxel dimensions of 0.1x0.1x0.71 µm
Bio
logy
Ope
n •
Adv
ance
art
icle
by guest on July 1, 2018http://bio.biologists.org/Downloaded from
(x,y,z). The imaging setup did not result in photo-toxicity as control embryos developed to
become larvae. Images were saved as LSM files using the Zeiss acquisition software.
Image analysis pipeline
Our image analysis pipeline consisted of five main steps: (A) image data
reorganization, (B) 3D image segmentation, (C) optional post-processing of segmentation
outputs, (D) time-series analysis, and (E) optional 3D visualization (Fig. 1). (A) 3D time-lapse
imaging generated sizeable datasets of 180-240 time points which were saved as LSM files
containing between 13 to 18 Gigabytes (GB) of data. To facilitate downstream processing,
we fragmented the 4D CLSM datasets into portions of 10 time points and saved them as
files of the open source Image cytometry standard (ICS) format (Dean et al., 1990) using our
custom-built TLM-converter software (Puah et al., 2011). The newly reported tools of the
pipeline (C-E) were implemented in C++ using the Open CV computer vision library
(http://opencv.org/), the libics v1.5 reference library (http://libics.sourceforge.net/) for reading
and writing multi-dimensional ICS files and the Visualization tool kit (Vtk) (Schroeder et al.,
2006). The graphical user interfaces were implemented in the .NET (Microsoft) environment.
Software, manuals and samples datasets are available for download at following link:
https://figshare.com/s/e030e8dec869d8095f53.
3D Image Segmentation
To detect and extract features of interphase nuclei and mitotic chromosomes, we
applied a fully automated 3D image segmentation tool (Chinta and Wasser, 2012). The
segmentation method is based on multiple level sets (MLS) and adapts to differences in
intensity, shape and size as chromosomes progress through the cell cycle phases. We used
the batch processing module of our tool to segment up to 8 datasets, containing 10 time
points each, in parallel. On a desktop PC with an Intel i7 core CPU, 80 time points were
processed in approximately 2 hours. We selected the same parameters for all 4D datasets
used in this study: 𝛥k0=0.5, 𝛥kM=0.5 and 𝛥kRG=0.2 are tuning factors for the surface
Bio
logy
Ope
n •
Adv
ance
art
icle
by guest on July 1, 2018http://bio.biologists.org/Downloaded from
evolution during the object detection, seed detection and region growing steps, respectively.
Minimum seed size was set to 1 µm3 and minimum detected object size to 5 µm3 to filter out
non-nuclear objects. The Batch 3D MLS segmentation tool exports four output files per
image stack (Fig. S1). (1) The master segmentation project file (*.SGPJ) stores information
about input images, segmentation parameters and the names of three associated output
files, which contain the contours and features of detected objects. (2) The segmented
objects file (.CSV format) contains a table of detected 3D objects and their features,
including a unique object ID, centroid coordinates, shape and intensity parameters. (3) 3D
surface files (.cont) store 3D ROIs as sets of overlapping 2D contours that can be used to
restore and modify segmentation projects during the post-processing step. (4) Silhouette
contour files (.cont) contain one silhouette contour per 3D object. Silhouette contours are
extracted from the projection of all polygons belonging to a 3D object and are used to
evaluate the boundaries of detected objects in MIP images.
Segmentation post-processing
As an optional step in the image analysis pipeline, the post-processing module
extracts additional features from segmentation outputs for the following purposes. (1) It
computes additional shape, intensity and texture features that not required for all
applications. Here, we obtained Mh-mKO2 intensity parameters within the regions of
histone-GFP labeled nuclei (Fig. 6B, 6C). In a previous study, we obtained 3D shape and
texture features required for cell cycle classification (Du et al., 2011). (2) It can save cropped
3D regions of 3D stacks for iso-surface rendering. (3) It helps to separate merged nuclei, a
segmentation error particularly affecting image stacks of the early cellular blastoderm stage.
We implemented a simple 3D shape-split algorithm that was applied to all 2D polygons of 3D
objects within a user-defined range of volumes (default 10 to 1000 µm3). The algorithm finds
the shortest cutting line between two contour points that fulfills three constraints (Fig. S3): (1)
a minimum area of the input polygon (default 700 pixels or 7 µm2), (2) minimum perimeter of
the smaller output polygon (default 70 pixels or 7 µm) and (3) a maximum ratio between
cutting distance and the perimeter of smaller output polygon (default 0.3). If any of the
Bio
logy
Ope
n •
Adv
ance
art
icle
by guest on July 1, 2018http://bio.biologists.org/Downloaded from
constraints are violated, no splitting occurs. Splitting is repeated until no input polygon is left
that meets all constraints. 3D objects are reconstructed from cut polygons based on a
minimum overlap between polygons in consecutive focal planes (default 50% with regards to
the smaller polygon).
Time-series analysis
Time-series analysis, such as tracking nuclei and quantifying morphological changes
during development, was performed using the einSTA (integration and editing of
Segmentation, Tracking and Annotation) custom software. einSTA saves computational
resources by only using processed data without the need to load large multi-dimensional
image data. The workflow of constructing and quantifying tracks of proliferating nuclei
consists of four main steps.
(1) Edit initial tracking project file. The user constructs an initial tracking project file
(.TRPJ) using a text editor (Fig. S1). The header lists file type (here "Tracking-Project 2"),
number of frames, image dimensions, and the names and types (integer, double, text) of
features. The current prototype uses up to 98 shape, intensity and texture features to
describe biological objects. The header is followed by a list of MIP images (1 per frame). The
third mandatory component is a list of segmented object files. Each row corresponds to a
single frame and can contain one or more comma separated ROI files. This way,
quantification can be performed with ROIs derived from the outputs of different segmentation
methods.
(2) Create Composite Segmentations. Biological objects, such as chromosomal
DNA in different cell cycle phases, can be heterogeneous in terms of intensity, shape,
texture and location, resulting in variable segmentation quality within the same image stack.
To improve segmentation quality, we introduced the concept of composite segmentation.
The composite segmentation contains a combination of ROIs derived from different
segmentation outputs. We evaluated segmentation quality using silhouette contours and
centroids drawn on MIP images (Fig. S2). Initially, we populated the composite with all ROIs
Bio
logy
Ope
n •
Adv
ance
art
icle
by guest on July 1, 2018http://bio.biologists.org/Downloaded from
from the most accurate segmentation. Later, errors such as fused, split or missing objects
were rectified by a range of editing functions. In this study, we created a second layer of
ROIs by applying a shape split method in the post-processing module to the original
segmentation (Fig. S3, see above).
(3) Tracking of nuclei. Tracking creates associations between objects in
subsequent frames and was performed in a semi-automated fashion. An automated bilateral
nearest neighbor search was combined with manual error correction. The nearest neighbor
search worked well during interphase when displacements were small (Fig. S4A). However,
this approach failed during anaphase of mitosis when mean displacements could be as high
as 15 µm microns per 55 seconds (Fig. S4C). A set of visualization techniques, such as
overlaying subsequent frames and displaying links between centroid (Fig. S4 A-C), helped to
validate tracks. Missing or wrong links were edited manually. Selected tracks and their
features were exported as comma separated text files for further statistical analysis.
(4) Quantification of nuclear densities. To monitor the proliferation and elimination
of nuclei on the cortex of embryos, we used the x and y components of the centroid
coordinates as inputs to determine convex hulls using the cvConvexHull2 function of the
OpenCV library. Dividing the number of ROIs by the hull area produced an estimate of
nuclear density. Prior to calculating the convex hull, we applied a set of constraints such as
ranges for volume (10 to 1000 µm3) and depth (0 to 25 µm). Nuclear hull statistics were
exported as flat files for further statistical analysis.
Dynamic iso-surface visualization (E)
We developed the custom tool DyVis3D (dynamic visualization in 3D) to generate
and view interactive animations of selected tracks using three steps. (1) Tracks of nuclei
created in einSTA are exported as flat files. (2) The post-processing module imports these
tracks to extract foreground regions of 3D ROIs within their bounding boxes, while
background regions are masked in black. Cropped image stacks are saved along with a
Bio
logy
Ope
n •
Adv
ance
art
icle
by guest on July 1, 2018http://bio.biologists.org/Downloaded from

time-lapse 3D (.TL3D) file describing the tracks. (3) In DyVis3D, the TL3D file is opened to
reconstruct a dynamic scene composed of wireframe models representing the nuclei. The
track information enables the selective rendering (color, transparency, level of detail, style)
of individual tracks. The optimal thresholds obtained during the MLS surface evolution were
used as initial intensity thresholds for iso-surface extraction.
Statistical Analysis
Statistical data analysis was performed using Excel (Microsoft), Minitab 16 (Minitab
Inc.), R statistical software and Python. R was used to compute Student’s t-tests, confidence
intervals of means and proportions. Minitab was applied to produce interval and box-and-
whisker plots (boxplots). Excel was applied to calculate basic statistics, perform regression
analysis and plot line and bar charts. The Python library matplotlib was used to generate
some of the 2D plots (Fig. 6B, 6C).
Bio
logy
Ope
n •
Adv
ance
art
icle
by guest on July 1, 2018http://bio.biologists.org/Downloaded from
Acknowledgements M.W. and W.C.P. were affiliated with the Bioinformatics Institute (BII) until 2013, R.C. until
2012. We thank the Bloomington Drosophila stock center for providing fly stocks. We thank
the IMCB (ACC and SC labs) for the use of Drosophila facilities.
Competing Interests The authors declare no competing interests.
Author contributions W.C.P. performed the experiments and analyzed data. R.C. developed the 3D image
segmentation software. M.W. conceived the study, developed the einSTA and DyVis3D
software, performed experiments, analyzed the data and wrote the manuscript.
Funding The study and publication costs were funded by the BII, Agency for Science, Technology
and Research (A*STAR), Singapore.
Data availability The previously published software tools “TLM-converter” and “3D Cell Nuclei Detection” are
available for download at http://web.bii.a-star.edu.sg/archive/TLM-
Converter/User_License_DownloadInstructions_TLM_rev01.htm and http://web.bii.a-
star.edu.sg/archive/MLSCellNucleiDetection/, respectively. The movies, the software tools
einSTA and DyVis3D, and sample datasets are available for download at
https://figshare.com/s/e030e8dec869d8095f53. Drosophila stocks generated for this study
have been deposited at the Vienna Drosophila Resource Center (VDRC):
http://stockcenter.vdrc.at.
Bio
logy
Ope
n •
Adv
ance
art
icle
by guest on July 1, 2018http://bio.biologists.org/Downloaded from
References
Amat, F., Lemon, W., Mossing, D. P., McDole, K., Wan, Y., Branson, K., Myers, E. W. and Keller, P. J. (2014). Fast, accurate reconstruction of cell lineages from large-scale fluorescence microscopy data. Nat. Methods 11, 951–958.
Bao, Z., Murray, J. I., Boyle, T., Ooi, S. L., Sandel, M. J. and Waterston, R. H. (2006). Automated cell lineage tracing in Caenorhabditis elegans. Proc. Natl. Acad. Sci. U.S.A 103, 2707–2712.
Bier, E. (2005). Drosophila, the golden bug, emerges as a tool for human genetics. Nat Rev Genet 6, 9–23.
Brandt, A., Papagiannouli, F., Wagner, N., Wilsch-Bräuninger, M., Braun, M., Furlong, E. E., Loserth, S., Wenzl, C., Pilot, F., Vogt, N., et al. (2006). Developmental Control of Nuclear Size and Shape by kugelkern and kurzkern. Current Biology 16, 543–552.
Cavalier-Smith, T. (1978). Nuclear volume control by nucleoskeletal DNA, selection for cell volume and cell growth rate, and the solution of the DNA C-value paradox. J. Cell. Sci 34, 247–278.
Centore, R. C., Yazinski, S. A., Tse, A. and Zou, L. (2012). Spartan/C1orf124, a reader of PCNA ubiquitylation and a regulator of UV-induced DNA damage response. Mol. Cell 46, 625–635.
Chinta, R. and Wasser, M. (2012). Three-dimensional segmentation of nuclei and mitotic chromosomes for the study of cell divisions in live Drosophila embryos. Cytometry A 81, 52–64.
Clarkson, M. and Saint, R. (1999). A His2AvDGFP fusion gene complements a lethal His2AvD mutant allele and provides an in vivo marker for Drosophila chromosome behavior. DNA Cell Biol 18, 457–462.
Coelho, L. P., Shariff, A. and Murphy, R. F. (2009). NUCLEAR SEGMENTATION IN MICROSCOPE CELL IMAGES: A HAND-SEGMENTED DATASET AND COMPARISON OF ALGORITHMS. Proc IEEE Int Symp Biomed Imaging 5193098, 518–521.
Dean, P., Mascio, L., Ow, D., Sudar, D. and Mullikin, J. (1990). Proposed standard for image cytometry data files. Cytometry 11, 561–569.
Delabaere, L., Orsi, G. A., Sapey-Triomphe, L., Horard, B., Couble, P. and Loppin, B. (2014). The Spartan ortholog maternal haploid is required for paternal chromosome integrity in the Drosophila zygote. Curr. Biol. 24, 2281–2287.
Du, T. H., Puah, W. C. and Wasser, M. (2011). Cell cycle phase classification in 3D in vivo microscopy of Drosophila embryogenesis. BMC Bioinformatics 12 Suppl 13, S18.
Edens, L. J., White, K. H., Jevtic, P., Li, X. and Levy, D. L. (2013). Nuclear size regulation: from single cells to development and disease. Trends Cell Biol. 23, 151–159.
Edgar, B. A., Kiehle, C. P. and Schubiger, G. (1986). Cell cycle control by the nucleo-cytoplasmic ratio in early Drosophila development. Cell 44, 365–372.
Bio
logy
Ope
n •
Adv
ance
art
icle
by guest on July 1, 2018http://bio.biologists.org/Downloaded from
Eliceiri, K. W., Berthold, M. R., Goldberg, I. G., Ibáñez, L., Manjunath, B. S., Martone, M. E., Murphy, R. F., Peng, H., Plant, A. L., Roysam, B., et al. (2012). Biological imaging software tools. Nat. Methods 9, 697–710.
Farrell, J. A. and O’Farrell, P. H. (2014). From egg to gastrula: How the cell cycle is remodeled during the Drosophila mid-blastula transition. Annu Rev Genet 48, 269–294.
Foe, V. E. and Alberts, B. M. (1983). Studies of nuclear and cytoplasmic behaviour during the five mitotic cycles that precede gastrulation in Drosophila embryogenesis. J. Cell. Sci 61, 31–70.
Gans, M., Audit, C. and Masson, M. (1975). Isolation and characterization of sex-linked female-sterile mutants in Drosophila melanogaster. Genetics 81, 683–704.
Garcia, K., Duncan, T. and Su, T. T. (2007). Analysis of the cell division cycle in Drosophila. Methods 41, 198–205.
Gelbart, W. M. and Emmert, D. B. (2013). FlyBase High Throughput Expression Pattern Data. FlyBase Analysis.
Ghosal, G., Leung, J. W.-C., Nair, B. C., Fong, K.-W. and Chen, J. (2012). Proliferating cell nuclear antigen (PCNA)-binding protein C1orf124 is a regulator of translesion synthesis. J. Biol. Chem. 287, 34225–34233.
Gul-Mohammed, J., Arganda-Carreras, I., Andrey, P., Galy, V. and Boudier, T. (2014). A generic classification-based method for segmentation of nuclei in 3D images of early embryos. BMC Bioinformatics 15, 9.
Halder, G. and Mills, G. B. (2011). Drosophila in cancer research: to boldly go where no one has gone before. Oncogene.
Jevtić, P., Edens, L. J., Vuković, L. D. and Levy, D. L. (2014). Sizing and shaping the nucleus: mechanisms and significance. Curr. Opin. Cell Biol. 28, 16–27.
Jorgensen, P., Edgington, N. P., Schneider, B. L., Rupes, I., Tyers, M. and Futcher, B. (2007). The size of the nucleus increases as yeast cells grow. Mol. Biol. Cell 18, 3523–3532.
Juhasz, S., Balogh, D., Hajdu, I., Burkovics, P., Villamil, M. A., Zhuang, Z. and Haracska, L. (2012). Characterization of human Spartan/C1orf124, an ubiquitin-PCNA interacting regulator of DNA damage tolerance. Nucleic Acids Res 40, 10795–10808.
Keller, P. J., Schmidt, A. D., Wittbrodt, J. and Stelzer, E. H. K. (2008). Reconstruction of zebrafish early embryonic development by scanned light sheet microscopy. Science 322, 1065–1069.
Keller, P. J., Schmidt, A. D., Santella, A., Khairy, K., Bao, Z., Wittbrodt, J. and Stelzer, E. H. K. (2010). Fast, high-contrast imaging of animal development with scanned light sheet-based structured-illumination microscopy. Nat. Methods 7, 637–642.
Lamond, A. I. and Spector, D. L. (2003). Nuclear speckles: a model for nuclear organelles. Nat. Rev. Mol. Cell Biol. 4, 605–612.
Lecuit, T. (2004). Junctions and vesicular trafficking during Drosophila cellularization. J. Cell. Sci 117, 3427–3433.
Bio
logy
Ope
n •
Adv
ance
art
icle
by guest on July 1, 2018http://bio.biologists.org/Downloaded from
Lecuit, T. and Wieschaus, E. (2000). Polarized insertion of new membrane from a cytoplasmic reservoir during cleavage of the Drosophila embryo. J. Cell Biol. 150, 849–860.
Levy, D. L. and Heald, R. (2010). Nuclear size is regulated by importin α and Ntf2 in Xenopus. Cell 143, 288–298.
Li, G., Liu, T., Tarokh, A., Nie, J., Guo, L., Mara, A., Holley, S. and Wong, S. T. C. (2007). 3D cell nuclei segmentation based on gradient flow tracking. BMC Cell Biol. 8, 40.
libics home
Long, F., Peng, H., Liu, X., Kim, S. K. and Myers, E. (2009). A 3D digital atlas of C. elegans and its application to single-cell analyses. Nat. Methods 6, 667–672.
Loppin, B., Berger, F. and Couble, P. (2001). Paternal chromosome incorporation into the zygote nucleus is controlled by maternal haploid in Drosophila. Dev. Biol 231, 383–396.
Lou, X., Kaster, F. O., Lindner, M. S., Kausler, B. X., Kothe, U., Hockendorf, B., Wittbrodt, J., Janicke, H. and Hamprecht, F. A. (2011). Deltr: Digital embryo lineage tree reconstructor. In Biomedical Imaging: From Nano to Macro, 2011 IEEE International Symposium on, pp. 1557–1560.
Machida, Y., Kim, M. S. and Machida, Y. J. (2012). Spartan/C1orf124 is important to prevent UV-induced mutagenesis. Cell Cycle 11, 3395–3402.
Megraw, T. L., Li, K., Kao, L. R. and Kaufman, T. C. (1999). The centrosomin protein is required for centrosome assembly and function during cleavage in Drosophila. Development 126, 2829–2839.
Meijering, E., Dzyubachyk, O., Smal, I. and van Cappellen, W. A. (2009). Tracking in cell and developmental biology. Semin. Cell Dev. Biol. 20, 894–902.
Minden, J. S., Agard, D. A., Sedat, J. W. and Alberts, B. M. (1989). Direct cell lineage analysis in Drosophila melanogaster by time-lapse, three-dimensional optical microscopy of living embryos. J. Cell Biol 109, 505–516.
Neumann, F. R. and Nurse, P. (2007). Nuclear size control in fission yeast. J. Cell Biol 179, 593–600.
Neumann, B., Walter, T., Hériché, J.-K., Bulkescher, J., Erfle, H., Conrad, C., Rogers, P., Poser, I., Held, M., Liebel, U., et al. (2010). Phenotypic profiling of the human genome by time-lapse microscopy reveals cell division genes. Nature 464, 721–727.
OpenCV | OpenCV
Philp, A. V., Axton, J. M., Saunders, R. D. and Glover, D. M. (1993). Mutations in the Drosophila melanogaster gene three rows permit aspects of mitosis to continue in the absence of chromatid segregation. J. Cell. Sci 106 ( Pt 1), 87–98.
Puah, W. C. and Wasser, M. (2016). Live imaging of muscles in Drosophila metamorphosis: Towards high-throughput gene identification and function analysis. Methods 96, 103–117.
Bio
logy
Ope
n •
Adv
ance
art
icle
by guest on July 1, 2018http://bio.biologists.org/Downloaded from
Puah, W. C., Cheok, L. P., Biro, M., Ng, W. T. and Wasser, M. (2011). TLM-Converter: reorganization of long time-lapse microscopy datasets for downstream image analysis. BioTechniques 51, 49–54.
Rikhy, R., Mavrakis, M. and Lippincott-Schwartz, J. (2015). Dynamin regulates metaphase furrow formation and plasma membrane compartmentalization in the syncytial Drosophila embryo. Biol Open 4, 301–311.
Sakaue-Sawano, A., Kurokawa, H., Morimura, T., Hanyu, A., Hama, H., Osawa, H., Kashiwagi, S., Fukami, K., Miyata, T., Miyoshi, H., et al. (2008). Visualizing spatiotemporal dynamics of multicellular cell-cycle progression. Cell 132, 487–498.
Santamaria, P. (1983). Analysis of haploid mosaics in Drosophila. Dev. Biol 96, 285–295.
Santamaría, P. and Gans, M. (1980). Chimaeras of Drosophila melanogaster obtained by injection of haploid nuclei. Nature 287, 143–144.
Schroeder, W., Martin, K., Lorensen, B. and Kitware, I. (2006). The visualization toolkit: an object-oriented approach to 3D graphics. [Clifton Park, N.Y.]: Kitware.
Shaner, N. C., Steinbach, P. A. and Tsien, R. Y. (2005). A guide to choosing fluorescent proteins. Nature Methods 2, 905–909.
Sommer, C. and Gerlich, D. W. (2013). Machine learning in cell biology - teaching computers to recognize phenotypes. J. Cell. Sci. 126, 5529–5539.
Sullivan, W., Minden, J. S. and Alberts, B. M. (1990). daughterless-abo-like, a Drosophila maternal-effect mutation that exhibits abnormal centrosome separation during the late blastoderm divisions. Development 110, 311–323.
Venken, K. J., Popodi, E., Holtzman, S. L., Schulze, K. L., Park, S., Carlson, J. W., Hoskins, R. A., Bellen, H. J. and Kaufman, T. C. (2010). A molecularly defined duplication set for the X chromosome of Drosophila melanogaster. Genetics 186, 1111–1125.
Warn, R. M., Flegg, L. and Warn, A. (1987). An investigation of microtubule organization and functions in living Drosophila embryos by injection of a fluorescently labeled antibody against tyrosinated alpha-tubulin. J. Cell Biol. 105, 1721–1730.
Webster, M., Witkin, K. L. and Cohen-Fix, O. (2009). Sizing up the nucleus: nuclear shape, size and nuclear-envelope assembly. J. Cell. Sci 122, 1477–1486.
Yang, F., Baumann, C. and De La Fuente, R. (2009). Persistence of histone H2AX phosphorylation after meiotic chromosome synapsis and abnormal centromere cohesion in Poly (ADP-ribose) polymerase (Parp-1) null oocytes. Dev Biol 331, 326–338.
Yau, C. and Wakefield, J. (2007). Quantitative Image Analysis of Chromosome Dynamics in Early Drosophila Embryos. In 4th IEEE International Symposium on Biomedical Imaging: From Nano to Macro, 2007. ISBI 2007, pp. 264–267.
Bio
logy
Ope
n •
Adv
ance
art
icle
by guest on July 1, 2018http://bio.biologists.org/Downloaded from
Figures
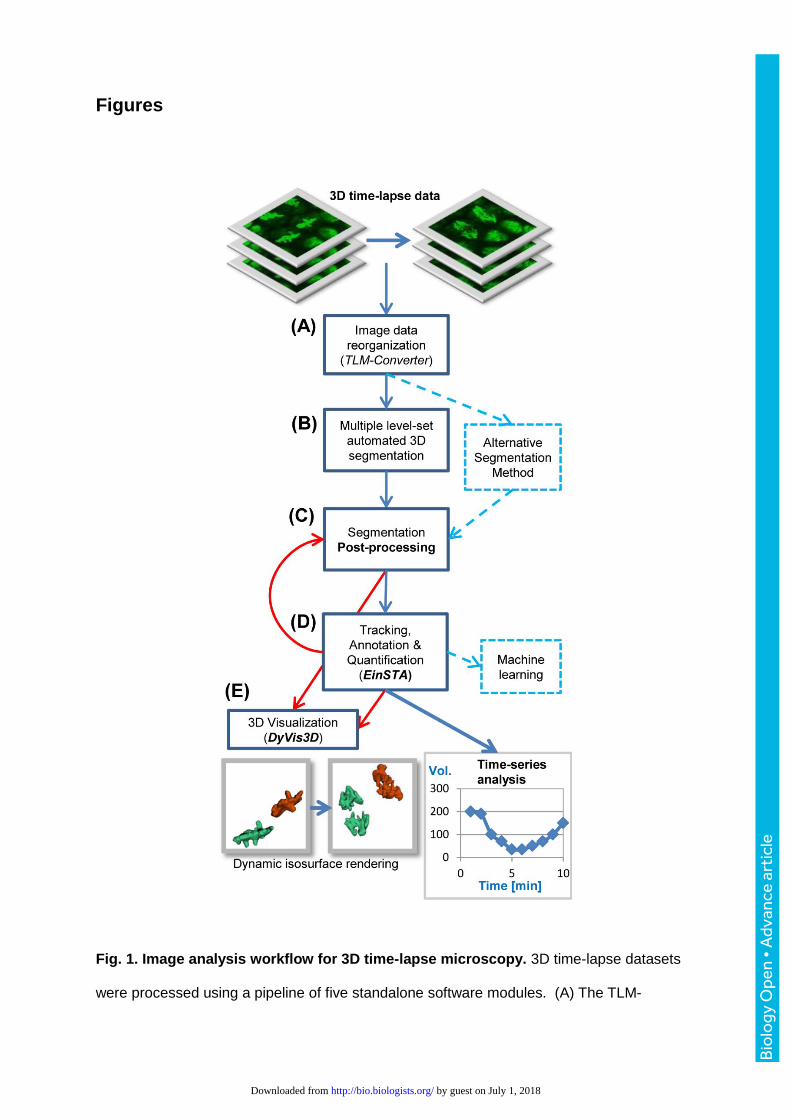
Fig. 1. Image analysis workflow for 3D time-lapse microscopy. 3D time-lapse datasets
were processed using a pipeline of five standalone software modules. (A) The TLM-
Bio
logy
Ope
n •
Adv
ance
art
icle
by guest on July 1, 2018http://bio.biologists.org/Downloaded from

Converter fragments the 3D image data to facilitate downstream processing tasks, such as
image segmentation. For this study, datasets were split into portions of 10 time-points. (B)
Automated 3D segmentation detected nuclei and saved their features and surfaces. (C) The
optional post-processing module split merged ROIs and calculated additional 3D features.
(D) The einSTA (editing and integration of Segmentation, Tracking and Annotation) tool
performs tracking and time-series analysis. Objects can be manually labeled and exported
for machine learning tasks. (E) The dynamic visualization module DyVis3D renders and
animates selected tracks in 3D.
Bio
logy
Ope
n •
Adv
ance
art
icle
by guest on July 1, 2018http://bio.biologists.org/Downloaded from
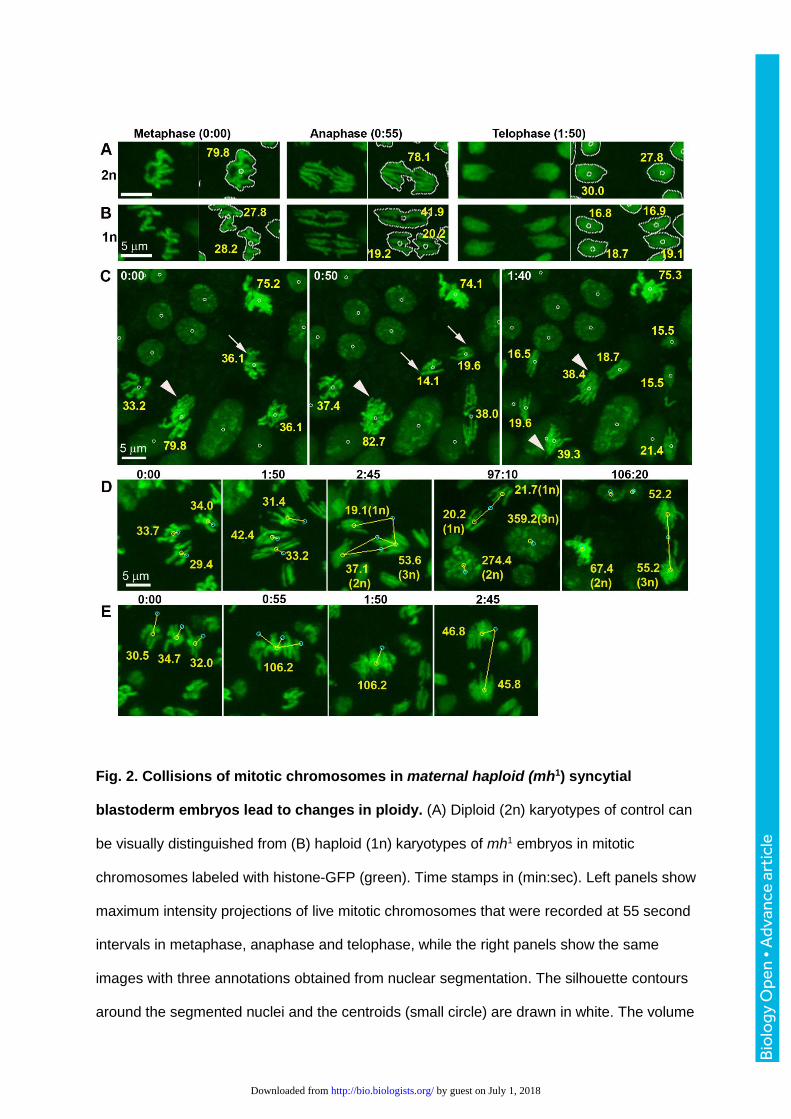
Fig. 2. Collisions of mitotic chromosomes in maternal haploid (mh1) syncytial
blastoderm embryos lead to changes in ploidy. (A) Diploid (2n) karyotypes of control can
be visually distinguished from (B) haploid (1n) karyotypes of mh1 embryos in mitotic
chromosomes labeled with histone-GFP (green). Time stamps in (min:sec). Left panels show
maximum intensity projections of live mitotic chromosomes that were recorded at 55 second
intervals in metaphase, anaphase and telophase, while the right panels show the same
images with three annotations obtained from nuclear segmentation. The silhouette contours
around the segmented nuclei and the centroids (small circle) are drawn in white. The volume
Bio
logy
Ope
n •
Adv
ance
art
icle
by guest on July 1, 2018http://bio.biologists.org/Downloaded from
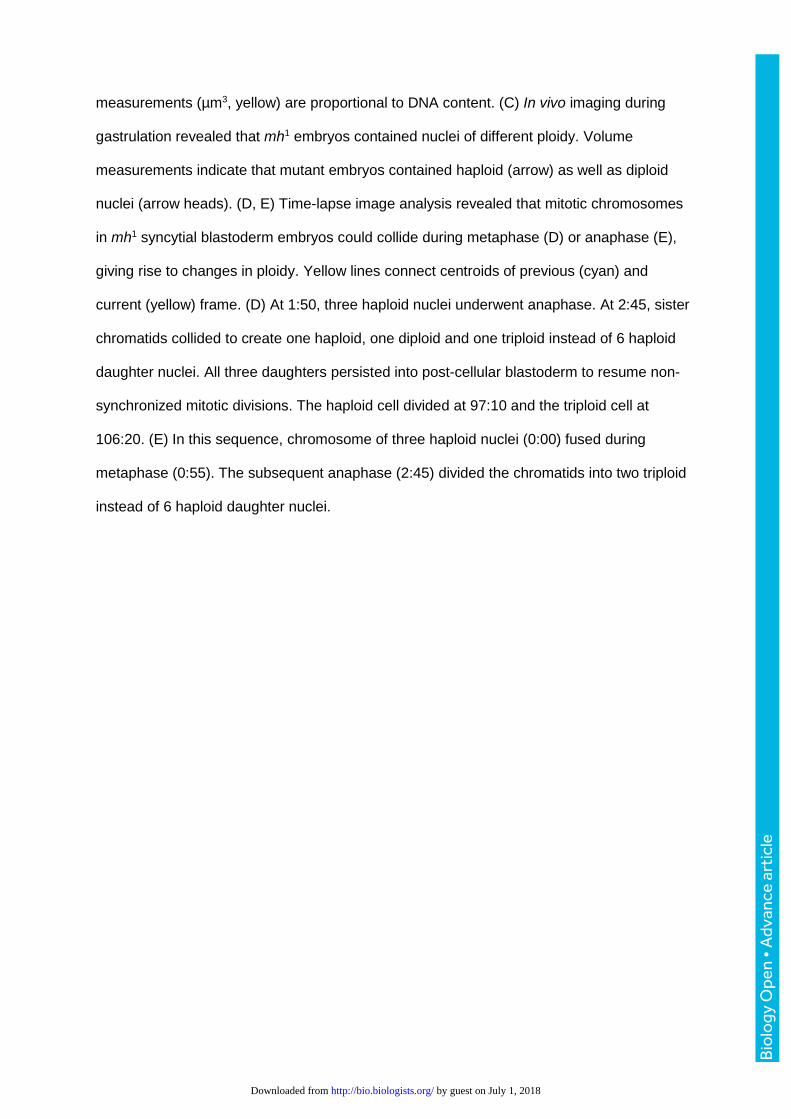
measurements (µm3, yellow) are proportional to DNA content. (C) In vivo imaging during
gastrulation revealed that mh1 embryos contained nuclei of different ploidy. Volume
measurements indicate that mutant embryos contained haploid (arrow) as well as diploid
nuclei (arrow heads). (D, E) Time-lapse image analysis revealed that mitotic chromosomes
in mh1 syncytial blastoderm embryos could collide during metaphase (D) or anaphase (E),
giving rise to changes in ploidy. Yellow lines connect centroids of previous (cyan) and
current (yellow) frame. (D) At 1:50, three haploid nuclei underwent anaphase. At 2:45, sister
chromatids collided to create one haploid, one diploid and one triploid instead of 6 haploid
daughter nuclei. All three daughters persisted into post-cellular blastoderm to resume non-
synchronized mitotic divisions. The haploid cell divided at 97:10 and the triploid cell at
106:20. (E) In this sequence, chromosome of three haploid nuclei (0:00) fused during
metaphase (0:55). The subsequent anaphase (2:45) divided the chromatids into two triploid
instead of 6 haploid daughter nuclei.
Bio
logy
Ope
n •
Adv
ance
art
icle
by guest on July 1, 2018http://bio.biologists.org/Downloaded from
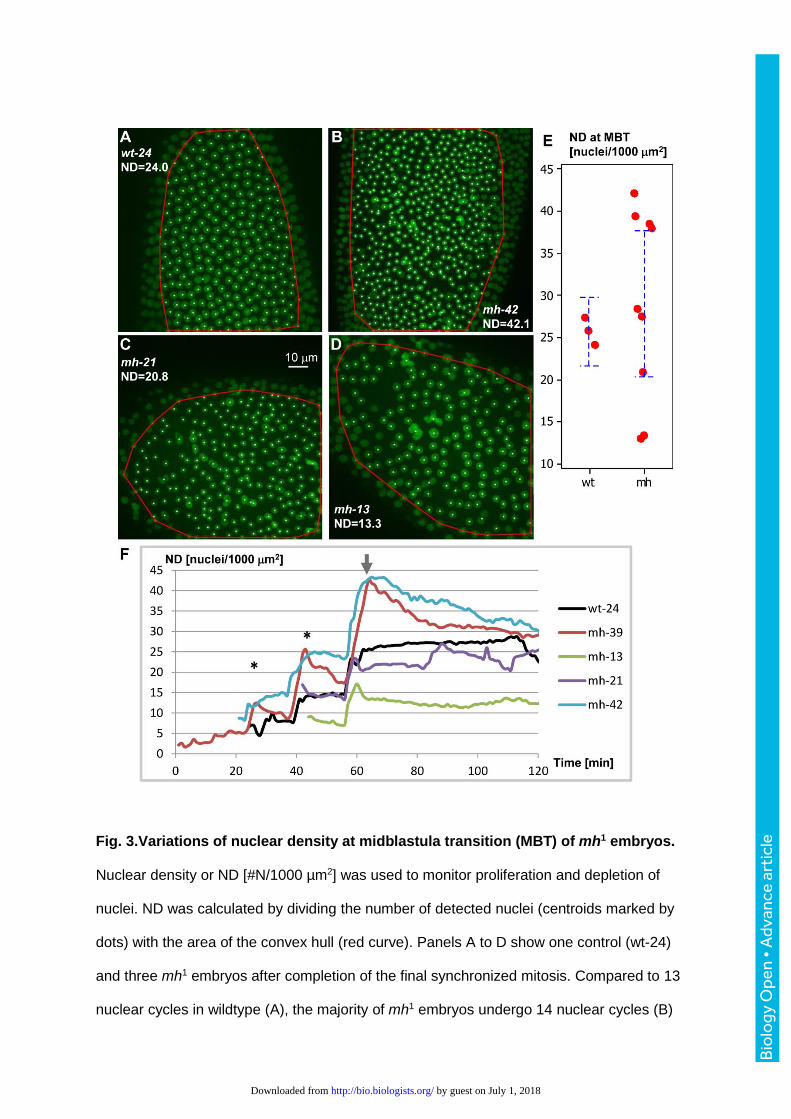
Fig. 3.Variations of nuclear density at midblastula transition (MBT) of mh1 embryos.
Nuclear density or ND [#N/1000 µm2] was used to monitor proliferation and depletion of
nuclei. ND was calculated by dividing the number of detected nuclei (centroids marked by
dots) with the area of the convex hull (red curve). Panels A to D show one control (wt-24)
and three mh1 embryos after completion of the final synchronized mitosis. Compared to 13
nuclear cycles in wildtype (A), the majority of mh1 embryos undergo 14 nuclear cycles (B)
Bio
logy
Ope
n •
Adv
ance
art
icle
by guest on July 1, 2018http://bio.biologists.org/Downloaded from
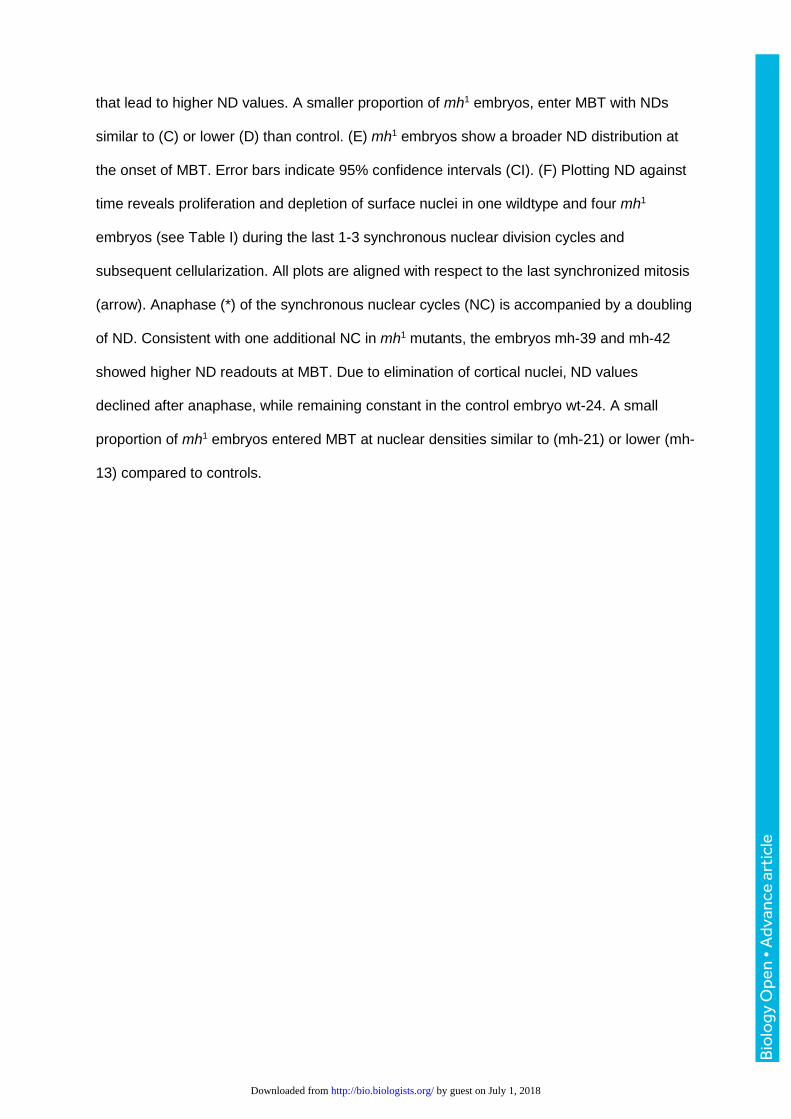
that lead to higher ND values. A smaller proportion of mh1 embryos, enter MBT with NDs
similar to (C) or lower (D) than control. (E) mh1 embryos show a broader ND distribution at
the onset of MBT. Error bars indicate 95% confidence intervals (CI). (F) Plotting ND against
time reveals proliferation and depletion of surface nuclei in one wildtype and four mh1
embryos (see Table I) during the last 1-3 synchronous nuclear division cycles and
subsequent cellularization. All plots are aligned with respect to the last synchronized mitosis
(arrow). Anaphase (*) of the synchronous nuclear cycles (NC) is accompanied by a doubling
of ND. Consistent with one additional NC in mh1 mutants, the embryos mh-39 and mh-42
showed higher ND readouts at MBT. Due to elimination of cortical nuclei, ND values
declined after anaphase, while remaining constant in the control embryo wt-24. A small
proportion of mh1 embryos entered MBT at nuclear densities similar to (mh-21) or lower (mh-
13) compared to controls.
Bio
logy
Ope
n •
Adv
ance
art
icle
by guest on July 1, 2018http://bio.biologists.org/Downloaded from
Bio
logy
Ope
n •
Adv
ance
art
icle
by guest on July 1, 2018http://bio.biologists.org/Downloaded from
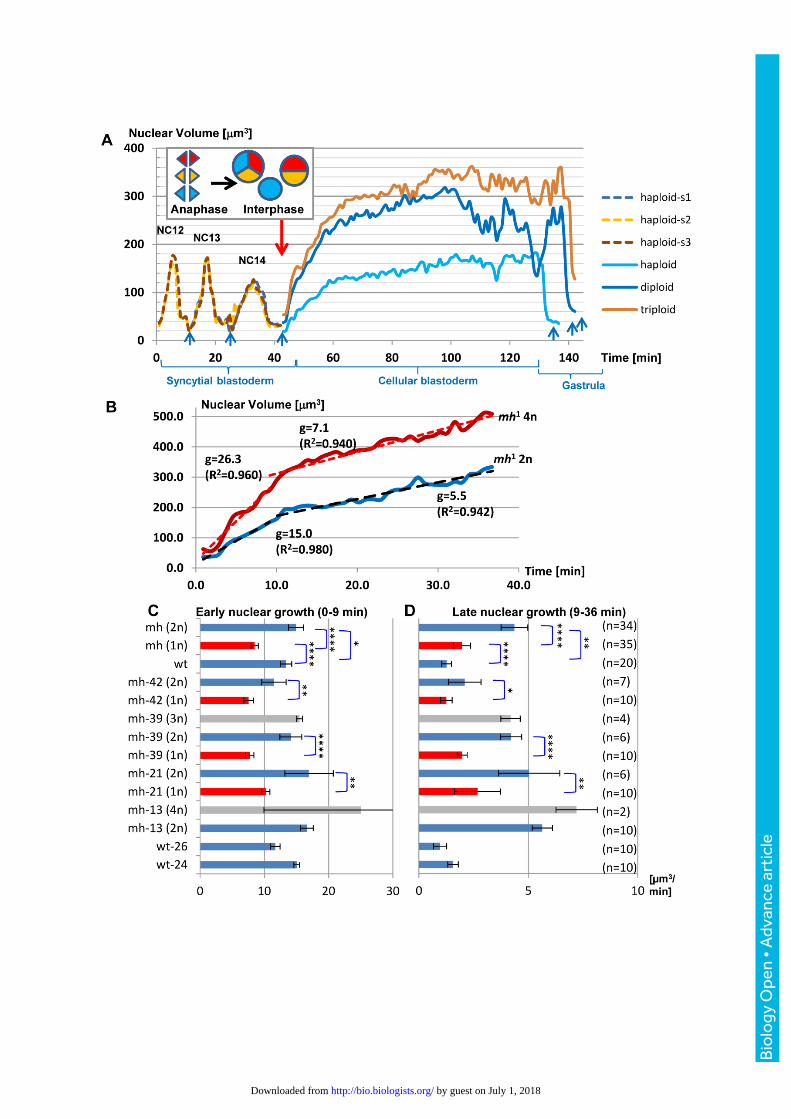
Fig. 4.The sizes of interphase nuclei and their growth rates positively correlate with
DNA content. (A) Mitotic chromosomes of three syncytial haploid nuclei (s1-s3) collided
during anaphase of NC14 (inset, red arrow) to give rise to synchronized daughter nuclei of
different ploides (1n, 2n, 3n). See Fig. 2D and Movie 1. The line plots indicate that nuclear
growth and size positively correlate with DNA content. Blue arrows indicate anaphase, the
peaks during syncytial blastoderm correspond to late interphase of the haploid nuclei from
NC12-14. (B) To quantify nuclear volume expansion following the last synchronous mitosis,
we divided interphase into a rapid early phase of 7 minutes and a late slow growth phase of
37 minutes and determined linear regression. This plot compares the volume changes of
diploid (2n) and tetraploid (4n) nuclei after exit from mitosis in embryo mh-13. Nuclear
growth rates g derived from linear regression are positively correlated with ploidy. R2 values
in brackets. (C, D) Bar charts compare early and late growth rates (mean ± 95% c.i.) of 2
control and 4 mh1 embryos (see Table S1). Within embryos, nuclear growth rates scale with
DNA, i.e. diploid grow significantly faster than haploid nuclei in the same syncytium. t-tests *
P ≤0.05, ** P ≤0.01, **** P≤0.0001.
Bio
logy
Ope
n •
Adv
ance
art
icle
by guest on July 1, 2018http://bio.biologists.org/Downloaded from
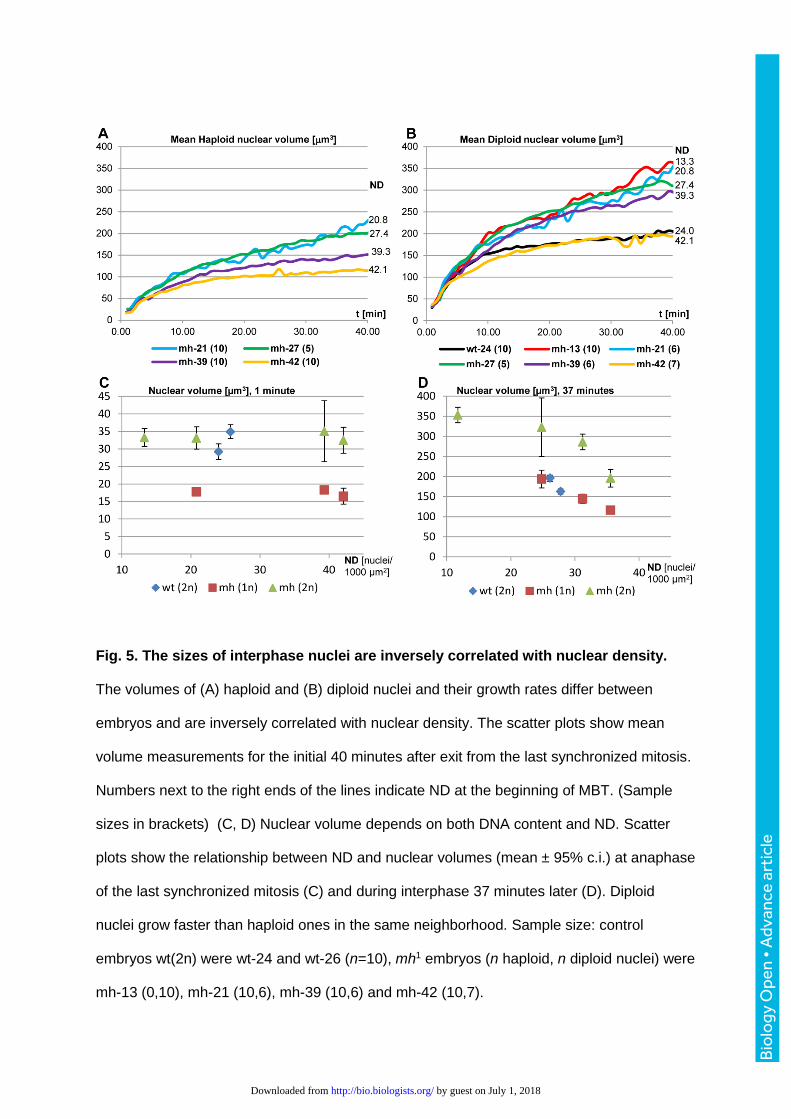
Fig. 5. The sizes of interphase nuclei are inversely correlated with nuclear density.
The volumes of (A) haploid and (B) diploid nuclei and their growth rates differ between
embryos and are inversely correlated with nuclear density. The scatter plots show mean
volume measurements for the initial 40 minutes after exit from the last synchronized mitosis.
Numbers next to the right ends of the lines indicate ND at the beginning of MBT. (Sample
sizes in brackets) (C, D) Nuclear volume depends on both DNA content and ND. Scatter
plots show the relationship between ND and nuclear volumes (mean ± 95% c.i.) at anaphase
of the last synchronized mitosis (C) and during interphase 37 minutes later (D). Diploid
nuclei grow faster than haploid ones in the same neighborhood. Sample size: control
embryos wt(2n) were wt-24 and wt-26 (n=10), mh1 embryos (n haploid, n diploid nuclei) were
mh-13 (0,10), mh-21 (10,6), mh-39 (10,6) and mh-42 (10,7).
Bio
logy
Ope
n •
Adv
ance
art
icle
by guest on July 1, 2018http://bio.biologists.org/Downloaded from
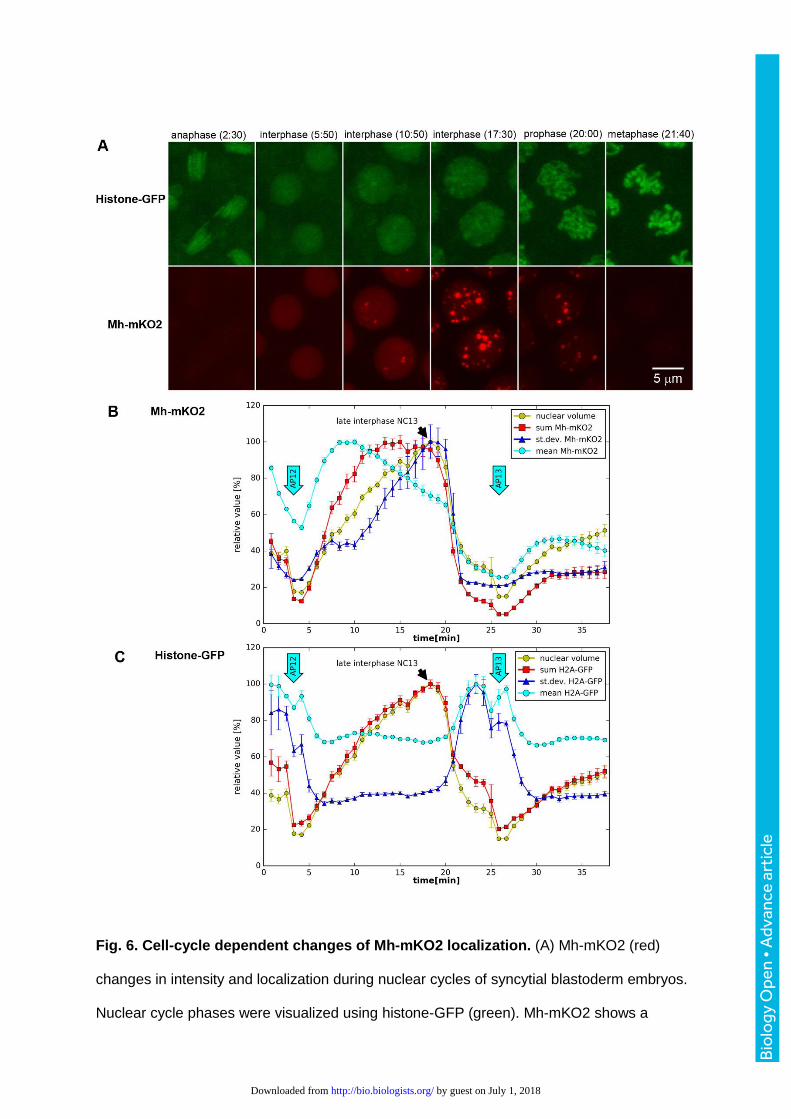
Fig. 6. Cell-cycle dependent changes of Mh-mKO2 localization. (A) Mh-mKO2 (red)
changes in intensity and localization during nuclear cycles of syncytial blastoderm embryos.
Nuclear cycle phases were visualized using histone-GFP (green). Mh-mKO2 shows a
Bio
logy
Ope
n •
Adv
ance
art
icle
by guest on July 1, 2018http://bio.biologists.org/Downloaded from

uniform distribution in early interphase. As interphase progresses, Mh-mKO2 localizes to
nuclear speckles that increase in number and brightness. The speckles are degraded during
the progression from prophase to metaphase (see Movie 4). UASp-mh-mKO2 was
expressed using the nos-Gal4:VP16 driver. Frames are MIPs of 3D stacks recorded using
CLSM. (B) Fluctuations of Mh-mKO2 fluorescence in (A) between end of NC 12 and early
interphase of NC14 were quantified in segmented nuclei. Mh-mKO2 intensity parameters
(sum, mean, standard deviation) and nuclear volume are shown in relative units (mean ±
95% c.i.). Arrows labeled AP12/13 indicate anaphase of nuclear cycles 12 and 13. Speckle
formation correlates with increased standard deviation. (C) The fluctuations of histone-GFP
intensity are shown for comparison. n=4 (until metaphase 12), n=8 (AP12 to metaphase 13),
n=16 (from AP13).
Bio
logy
Ope
n •
Adv
ance
art
icle
by guest on July 1, 2018http://bio.biologists.org/Downloaded from
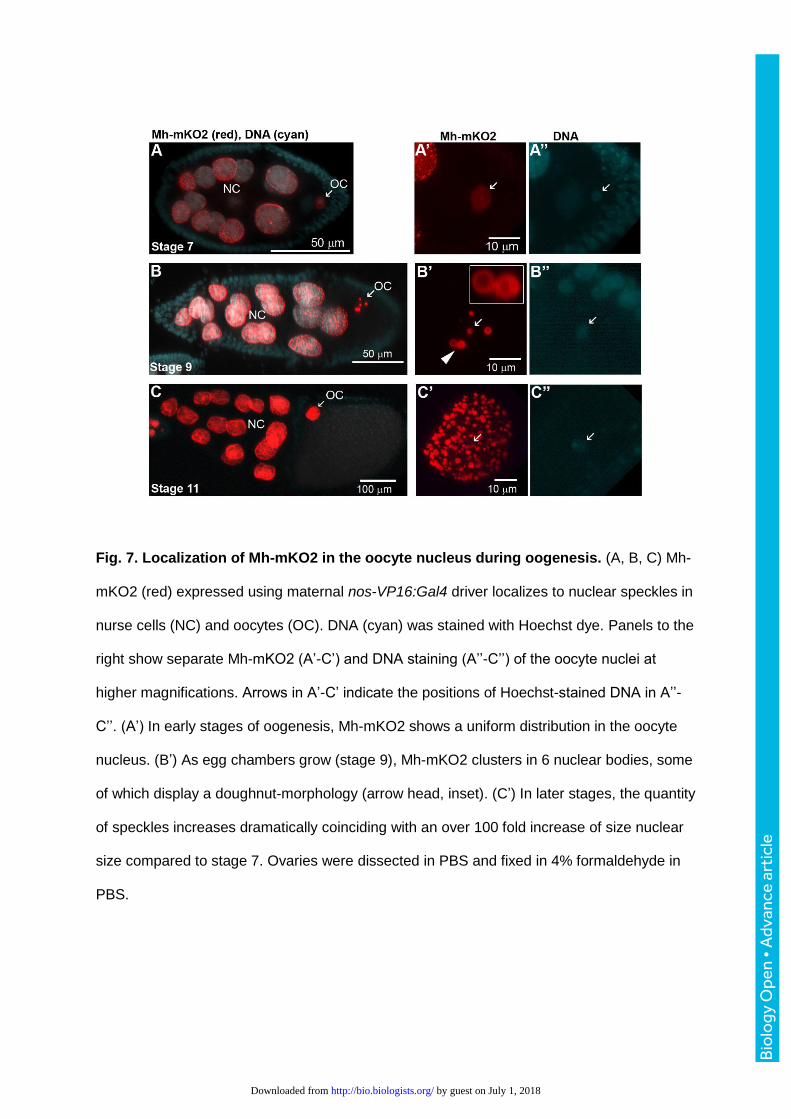
Fig. 7. Localization of Mh-mKO2 in the oocyte nucleus during oogenesis. (A, B, C) Mh-
mKO2 (red) expressed using maternal nos-VP16:Gal4 driver localizes to nuclear speckles in
nurse cells (NC) and oocytes (OC). DNA (cyan) was stained with Hoechst dye. Panels to the
right show separate Mh-mKO2 (A’-C’) and DNA staining (A’’-C’’) of the oocyte nuclei at
higher magnifications. Arrows in A’-C’ indicate the positions of Hoechst-stained DNA in A’’-
C’’. (A’) In early stages of oogenesis, Mh-mKO2 shows a uniform distribution in the oocyte
nucleus. (B’) As egg chambers grow (stage 9), Mh-mKO2 clusters in 6 nuclear bodies, some
of which display a doughnut-morphology (arrow head, inset). (C’) In later stages, the quantity
of speckles increases dramatically coinciding with an over 100 fold increase of size nuclear
size compared to stage 7. Ovaries were dissected in PBS and fixed in 4% formaldehyde in
PBS.
Bio
logy
Ope
n •
Adv
ance
art
icle
by guest on July 1, 2018http://bio.biologists.org/Downloaded from
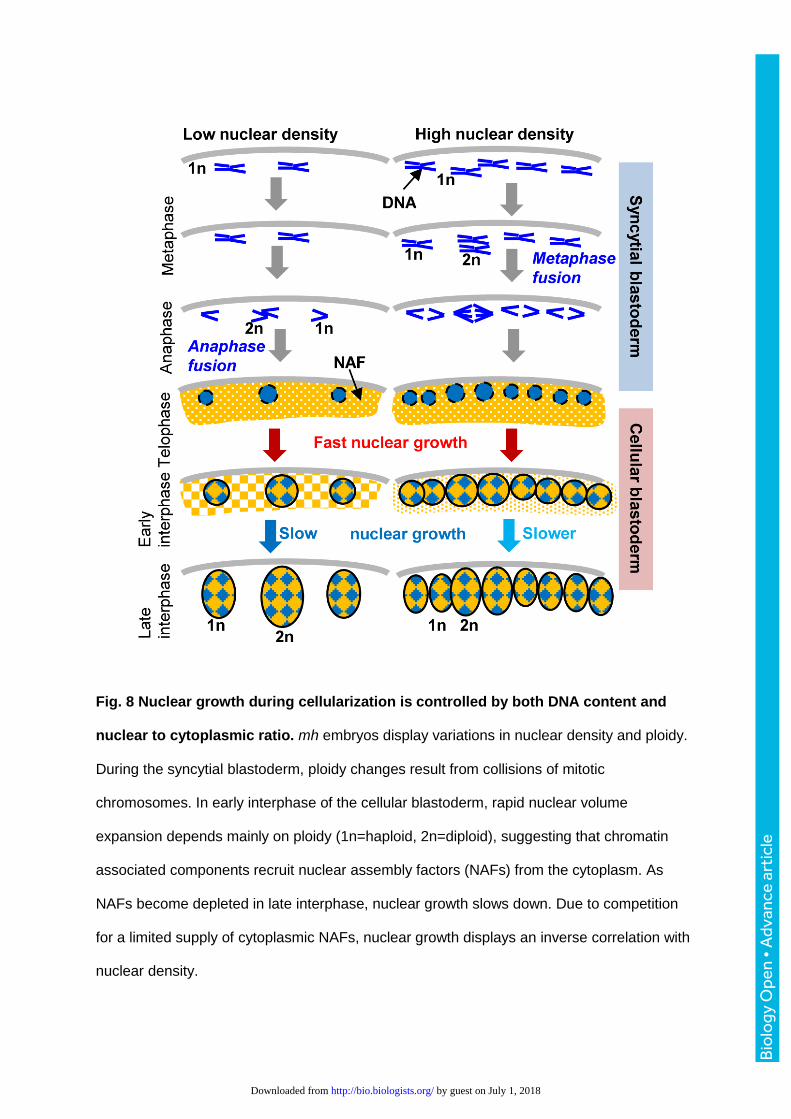
Fig. 8 Nuclear growth during cellularization is controlled by both DNA content and
nuclear to cytoplasmic ratio. mh embryos display variations in nuclear density and ploidy.
During the syncytial blastoderm, ploidy changes result from collisions of mitotic
chromosomes. In early interphase of the cellular blastoderm, rapid nuclear volume
expansion depends mainly on ploidy (1n=haploid, 2n=diploid), suggesting that chromatin
associated components recruit nuclear assembly factors (NAFs) from the cytoplasm. As
NAFs become depleted in late interphase, nuclear growth slows down. Due to competition
for a limited supply of cytoplasmic NAFs, nuclear growth displays an inverse correlation with
nuclear density.
Bio
logy
Ope
n •
Adv
ance
art
icle
by guest on July 1, 2018http://bio.biologists.org/Downloaded from
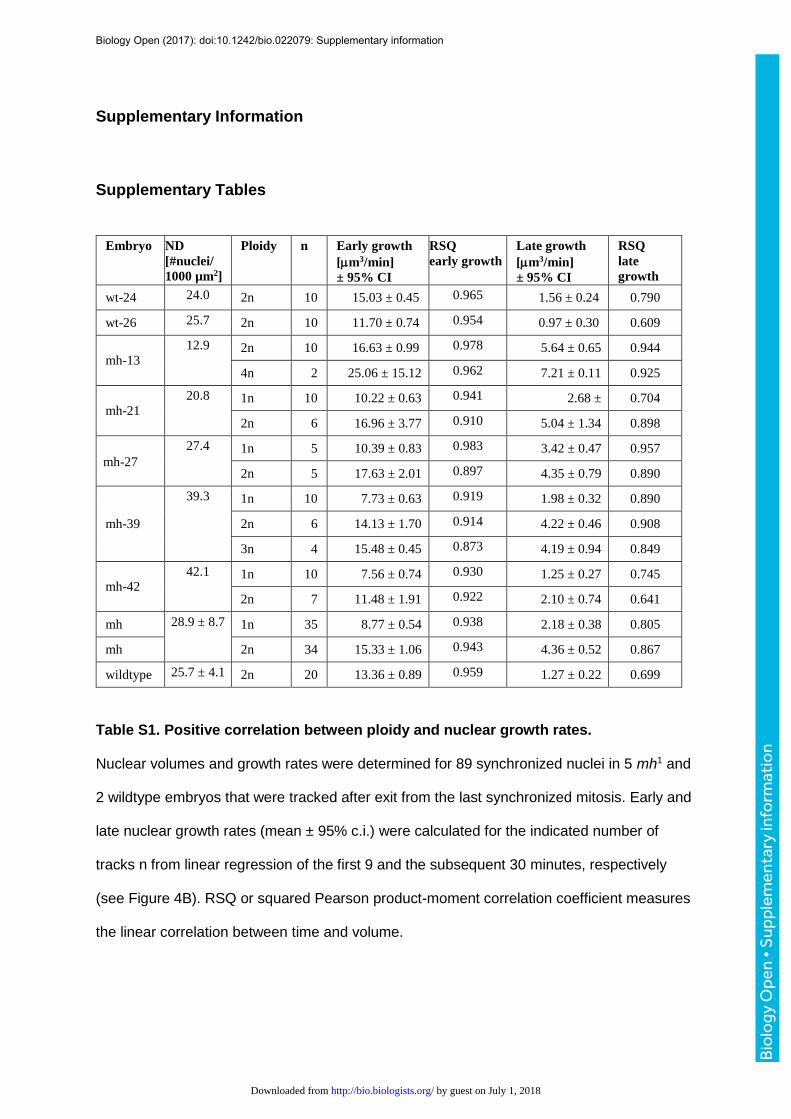
Supplementary Information
Supplementary Tables
Embryo ND
[#nuclei/
1000 µm2]
Ploidy n Early growth
[m3/min]
± 95% CI
RSQ
early growth
Late growth
[m3/min]
± 95% CI
RSQ
late
growth
wt-24 24.0 2n 10 15.03 ± 0.45 0.965 1.56 ± 0.24 0.790
wt-26 25.7 2n 10 11.70 ± 0.74 0.954 0.97 ± 0.30 0.609
mh-13
12.9 2n 10 16.63 ± 0.99 0.978 5.64 ± 0.65 0.944
4n 2 25.06 ± 15.12 0.962 7.21 ± 0.11 0.925
mh-21
20.8 1n 10 10.22 ± 0.63 0.941 2.68 ± 0.704
2n 6 16.96 ± 3.77 0.910 5.04 ± 1.34 0.898
mh-27
27.4 1n 5 10.39 ± 0.83 0.983 3.42 ± 0.47 0.957
2n 5 17.63 ± 2.01 0.897 4.35 ± 0.79 0.890
mh-39
39.3 1n 10 7.73 ± 0.63 0.919 1.98 ± 0.32 0.890
2n 6 14.13 ± 1.70 0.914 4.22 ± 0.46 0.908
3n 4 15.48 ± 0.45 0.873 4.19 ± 0.94 0.849
mh-42 42.1 1n 10 7.56 ± 0.74 0.930 1.25 ± 0.27 0.745
2n 7 11.48 ± 1.91 0.922 2.10 ± 0.74 0.641
mh 28.9 ± 8.7 1n 35 8.77 ± 0.54 0.938 2.18 ± 0.38 0.805
mh 2n 34 15.33 ± 1.06 0.943 4.36 ± 0.52 0.867
wildtype 25.7 ± 4.1 2n 20 13.36 ± 0.89 0.959 1.27 ± 0.22 0.699
Table S1. Positive correlation between ploidy and nuclear growth rates.
Nuclear volumes and growth rates were determined for 89 synchronized nuclei in 5 mh1 and
2 wildtype embryos that were tracked after exit from the last synchronized mitosis. Early and
late nuclear growth rates (mean ± 95% c.i.) were calculated for the indicated number of
tracks n from linear regression of the first 9 and the subsequent 30 minutes, respectively
(see Figure 4B). RSQ or squared Pearson product-moment correlation coefficient measures
the linear correlation between time and volume.
Biology Open (2017): doi:10.1242/bio.022079: Supplementary information
Bio
logy
Ope
n •
Sup
plem
enta
ry in
form
atio
n
by guest on July 1, 2018http://bio.biologists.org/Downloaded from
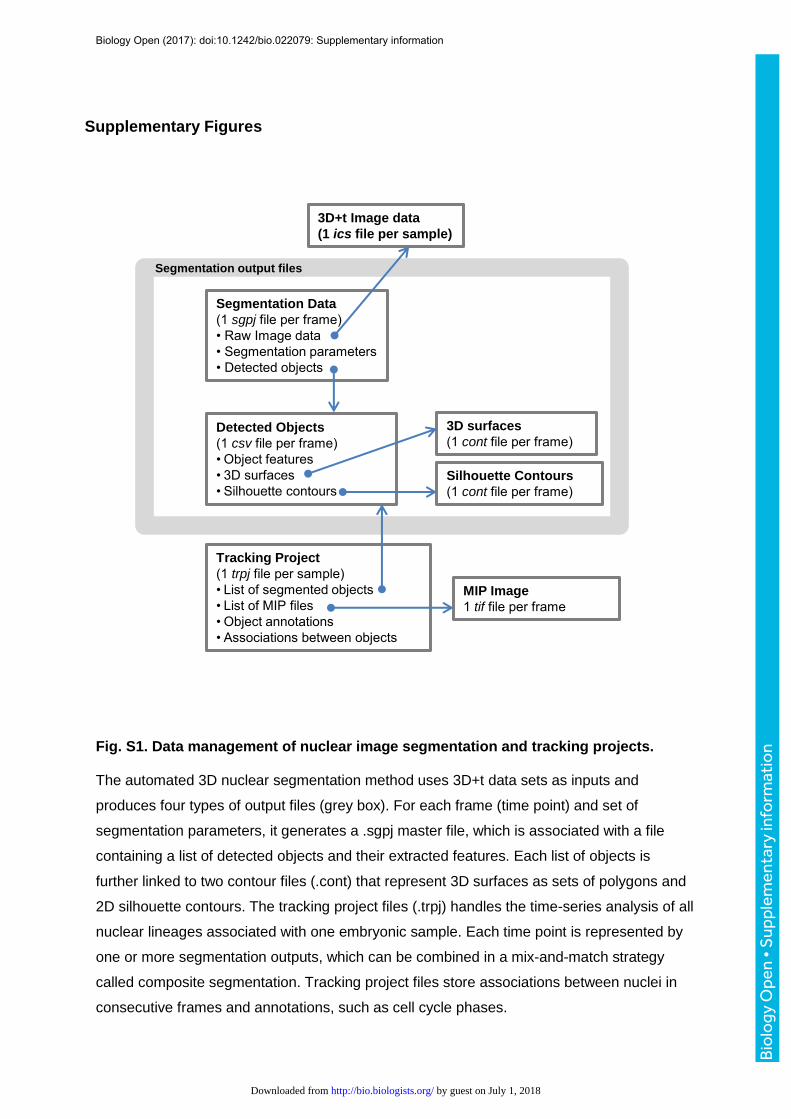
Supplementary Figures
Fig. S1. Data management of nuclear image segmentation and tracking projects.
The automated 3D nuclear segmentation method uses 3D+t data sets as inputs and
produces four types of output files (grey box). For each frame (time point) and set of
segmentation parameters, it generates a .sgpj master file, which is associated with a file
containing a list of detected objects and their extracted features. Each list of objects is
further linked to two contour files (.cont) that represent 3D surfaces as sets of polygons and
2D silhouette contours. The tracking project files (.trpj) handles the time-series analysis of all
nuclear lineages associated with one embryonic sample. Each time point is represented by
one or more segmentation outputs, which can be combined in a mix-and-match strategy
called composite segmentation. Tracking project files store associations between nuclei in
consecutive frames and annotations, such as cell cycle phases.
Segmentation output files
3D+t Image data
(1 ics file per sample)
Segmentation Data
(1 sgpj file per frame) • Raw Image data• Segmentation parameters• Detected objects
Detected Objects
(1 csv file per frame) • Object features• 3D surfaces• Silhouette contours
3D surfaces
(1 cont file per frame)
Silhouette Contours
(1 cont file per frame)
Tracking Project
(1 trpj file per sample) • List of segmented objects• List of MIP files• Object annotations• Associations between objects
MIP Image
1 tif file per frame
Biology Open (2017): doi:10.1242/bio.022079: Supplementary information
Bio
logy
Ope
n •
Sup
plem
enta
ry in
form
atio
n
by guest on July 1, 2018http://bio.biologists.org/Downloaded from
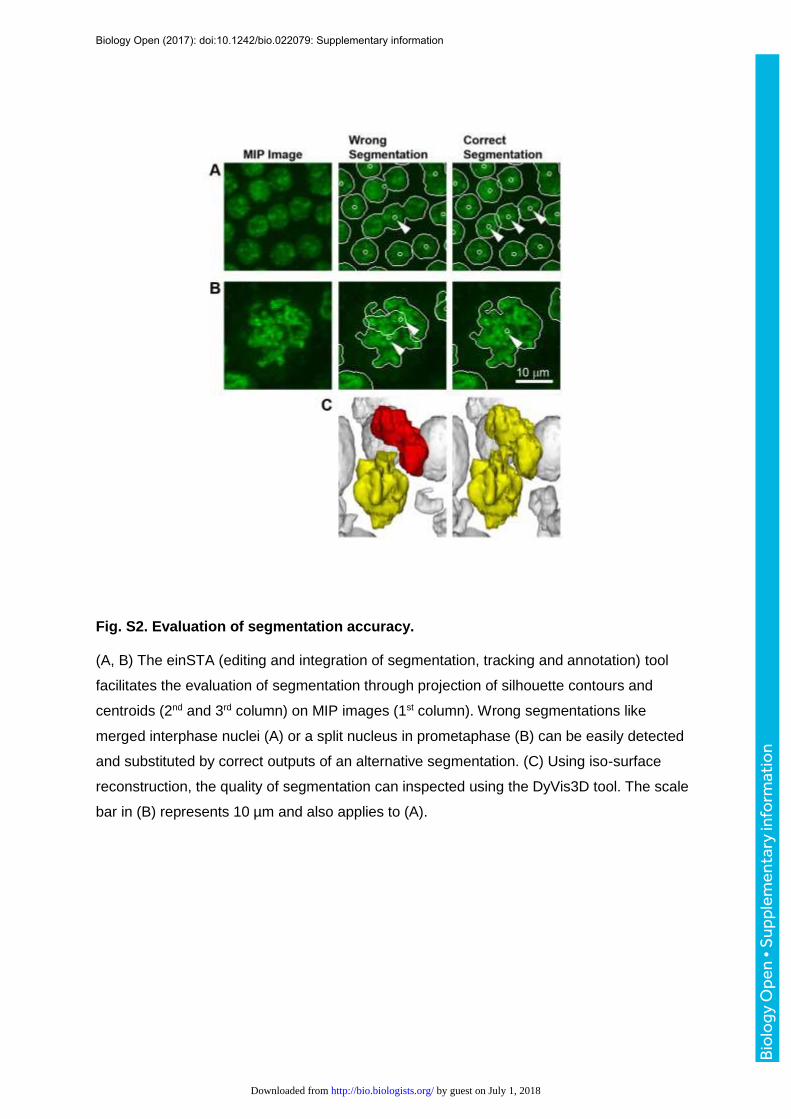
Fig. S2. Evaluation of segmentation accuracy.
(A, B) The einSTA (editing and integration of segmentation, tracking and annotation) tool
facilitates the evaluation of segmentation through projection of silhouette contours and
centroids (2nd and 3rd column) on MIP images (1st column). Wrong segmentations like
merged interphase nuclei (A) or a split nucleus in prometaphase (B) can be easily detected
and substituted by correct outputs of an alternative segmentation. (C) Using iso-surface
reconstruction, the quality of segmentation can inspected using the DyVis3D tool. The scale
bar in (B) represents 10 µm and also applies to (A).
Biology Open (2017): doi:10.1242/bio.022079: Supplementary information
Bio
logy
Ope
n •
Sup
plem
enta
ry in
form
atio
n
by guest on July 1, 2018http://bio.biologists.org/Downloaded from
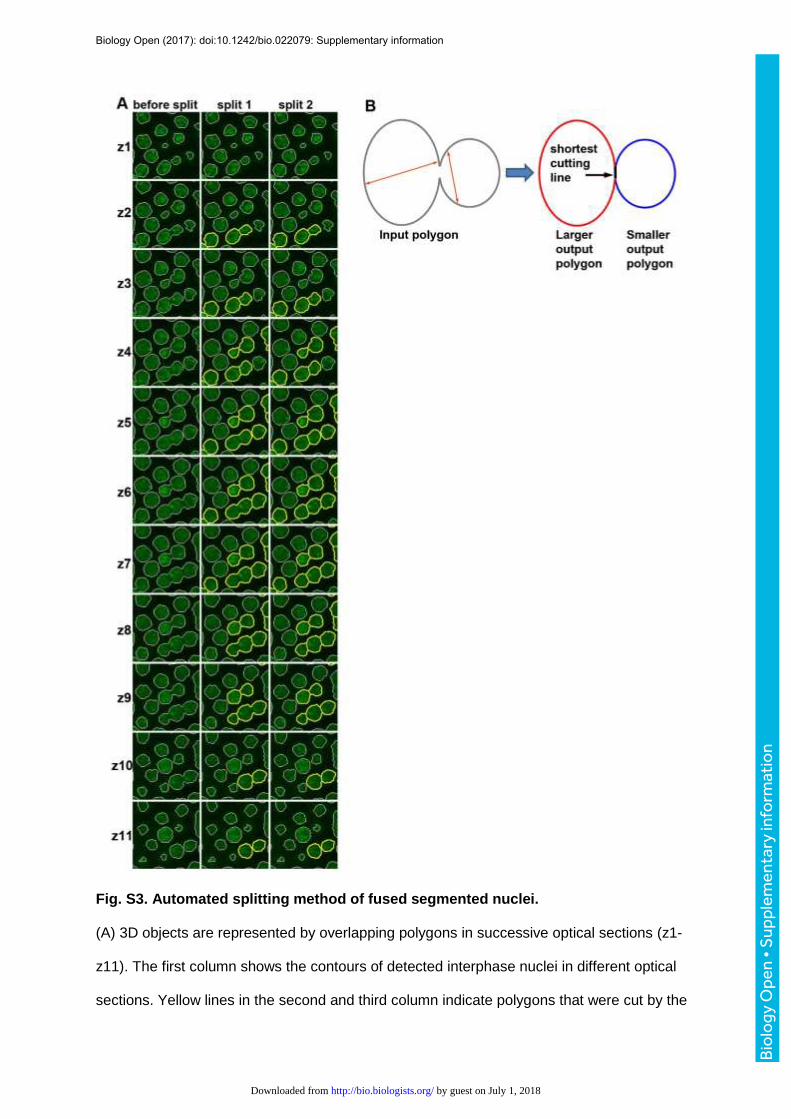
Fig. S3. Automated splitting method of fused segmented nuclei.
(A) 3D objects are represented by overlapping polygons in successive optical sections (z1-
z11). The first column shows the contours of detected interphase nuclei in different optical
sections. Yellow lines in the second and third column indicate polygons that were cut by the
Biology Open (2017): doi:10.1242/bio.022079: Supplementary information
Bio
logy
Ope
n •
Sup
plem
enta
ry in
form
atio
n
by guest on July 1, 2018http://bio.biologists.org/Downloaded from

splitting algorithm. Note that polygons in z5 to z9 split twice. (B) Splitting of merged objects
is achieved by iteratively searching for the shortest cutting line that fulfils a set of constraints
(see Material & Methods).
Biology Open (2017): doi:10.1242/bio.022079: Supplementary information
Bio
logy
Ope
n •
Sup
plem
enta
ry in
form
atio
n
by guest on July 1, 2018http://bio.biologists.org/Downloaded from
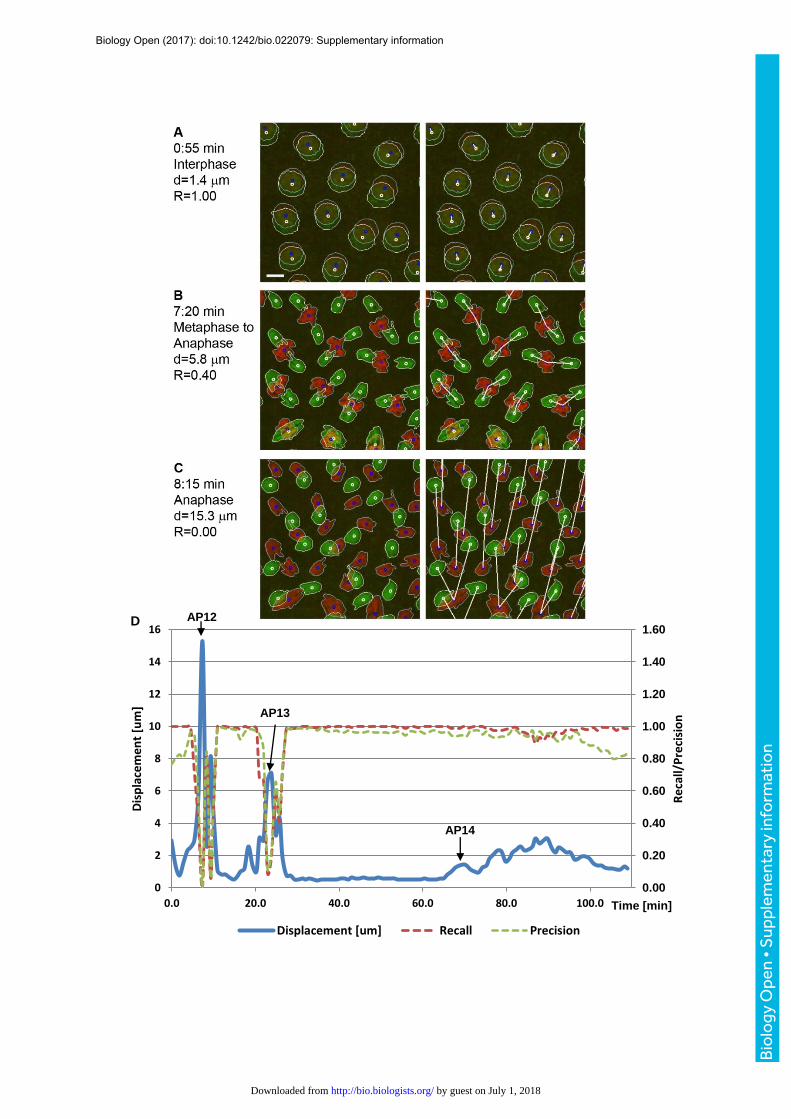
0.00
0.20
0.40
0.60
0.80
1.00
1.20
1.40
1.60
0
2
4
6
8
10
12
14
16
0.0 20.0 60.0 80.0 100.0
Re
call/
Pre
cisi
on
Dis
pla
cem
en
t [u
m]
40.0
Displacement [um] Recall Precision
Time [min]
AP12
AP13
D
AP14
Biology Open (2017): doi:10.1242/bio.022079: Supplementary information
Bio
logy
Ope
n •
Sup
plem
enta
ry in
form
atio
n
by guest on July 1, 2018http://bio.biologists.org/Downloaded from

Fig. S4. Automated tracking performance depends on the cell cycle phase.
(A-C) show histone-GFP labeled nuclei in nuclear cycle 12 (NC12) of a wildtype embryo.
Nuclei in current and previous frames are colorized green and red, respectively. White lines
in the second column between previous (blue) and current (white) object centroids indicate
the displacements during 55 second intervals. The three examples illustrate that the recall
rate R of a nearest neighbor tracking method correlates inversely with average displacement
d which is low during interphase (A) and high during anaphase (C). (D) The chart
corresponds to the same embryo and shows the relationship between average nuclear
displacement and the recall/precision rates of automated tracking from NC12 until
gastrulation. AP12/13= anaphase of NC12/13; AP14= start of non-synchronized post-
syncytial blastoderm mitosis.
Biology Open (2017): doi:10.1242/bio.022079: Supplementary information
Bio
logy
Ope
n •
Sup
plem
enta
ry in
form
atio
n
by guest on July 1, 2018http://bio.biologists.org/Downloaded from
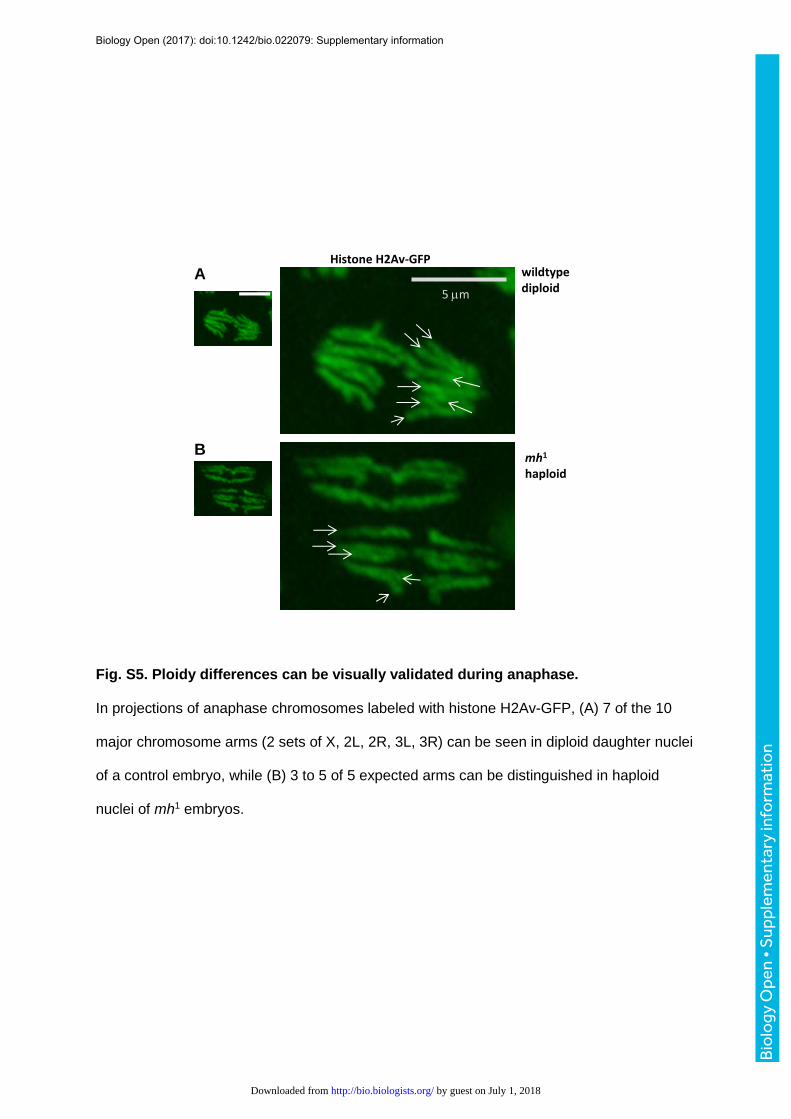
Fig. S5. Ploidy differences can be visually validated during anaphase.
In projections of anaphase chromosomes labeled with histone H2Av-GFP, (A) 7 of the 10
major chromosome arms (2 sets of X, 2L, 2R, 3L, 3R) can be seen in diploid daughter nuclei
of a control embryo, while (B) 3 to 5 of 5 expected arms can be distinguished in haploid
nuclei of mh1 embryos.
wildtype diploid
mh1
haploid
A
B
5 mm
Histone H2Av-GFP
Biology Open (2017): doi:10.1242/bio.022079: Supplementary information
Bio
logy
Ope
n •
Sup
plem
enta
ry in
form
atio
n
by guest on July 1, 2018http://bio.biologists.org/Downloaded from
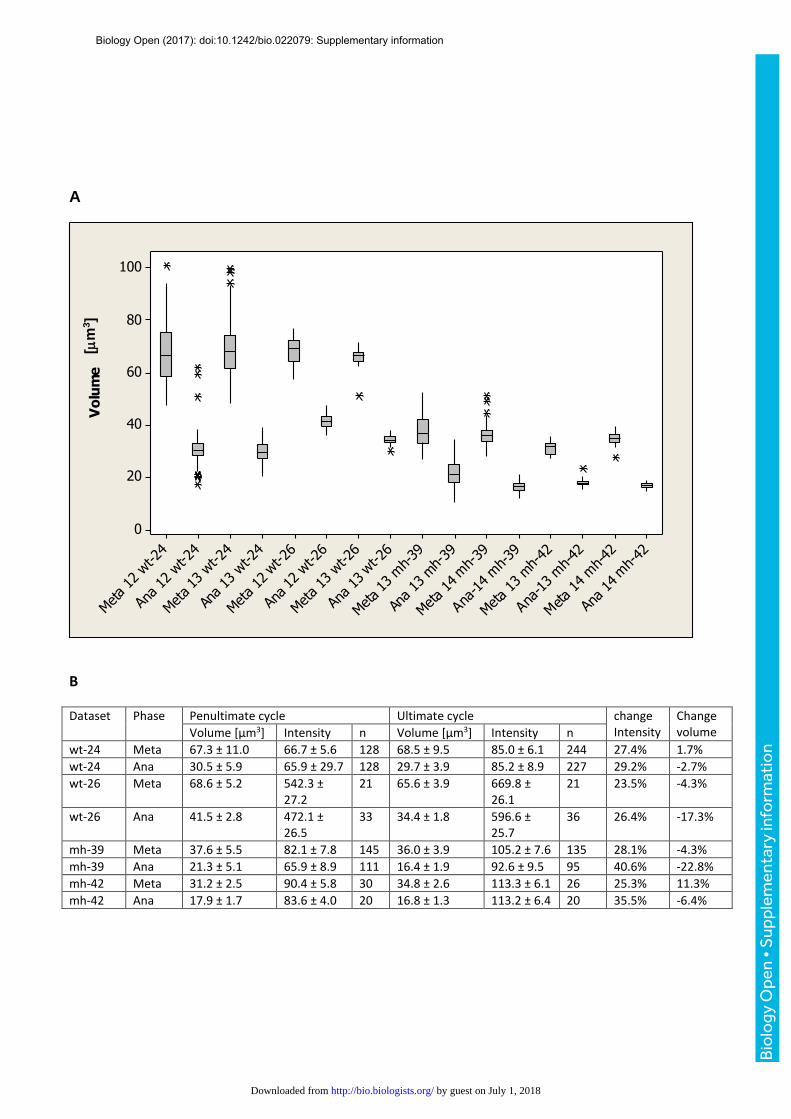
A
mh-
42
Ana
m14
h
-42
eta
m14
h
-42
naM
-
m13
h
-42
eta
A
m13
h
-39
naM
-
m14
h
-39
eta
A
m14
h
-39
Ana
M
m13
h
-39
eta 1
w3
t
-26
AnM
a
w1
t3
-
26
eta
w1
t3
-26
Ana
M
w1
t2
-
26
eta
w1
t2
-24
Ana
M
w1
t3
-
24
eta
w1
t3
-
24
Meta
A
1n
2a
M
w1
t2
-24
100
80
60
40
20
0
B
Dataset Phase Penultimate cycle Ultimate cycle change Intensity
Change volume Volume [µm3] Intensity n Volume [µm3] Intensity n
wt-24 Meta 67.3 ± 11.0 66.7 ± 5.6 128 68.5 ± 9.5 85.0 ± 6.1 244 27.4% 1.7%
wt-24 Ana 30.5 ± 5.9 65.9 ± 29.7 128 29.7 ± 3.9 85.2 ± 8.9 227 29.2% -2.7%
wt-26 Meta 68.6 ± 5.2 542.3 ± 27.2
21 65.6 ± 3.9 669.8 ± 26.1
21 23.5% -4.3%
wt-26 Ana 41.5 ± 2.8 472.1 ± 26.5
33 34.4 ± 1.8 596.6 ± 25.7
36 26.4% -17.3%
mh-39 Meta 37.6 ± 5.5 82.1 ± 7.8 145 36.0 ± 3.9 105.2 ± 7.6 135 28.1% -4.3%
mh-39 Ana 21.3 ± 5.1 65.9 ± 8.9 111 16.4 ± 1.9 92.6 ± 9.5 95 40.6% -22.8%
mh-42 Meta 31.2 ± 2.5 90.4 ± 5.8 30 34.8 ± 2.6 113.3 ± 6.1 26 25.3% 11.3%
mh-42 Ana 17.9 ± 1.7 83.6 ± 4.0 20 16.8 ± 1.3 113.2 ± 6.4 20 35.5% -6.4%
Volume
[m
3]
Biology Open (2017): doi:10.1242/bio.022079: Supplementary information
Bio
logy
Ope
n •
Sup
plem
enta
ry in
form
atio
n
by guest on July 1, 2018http://bio.biologists.org/Downloaded from
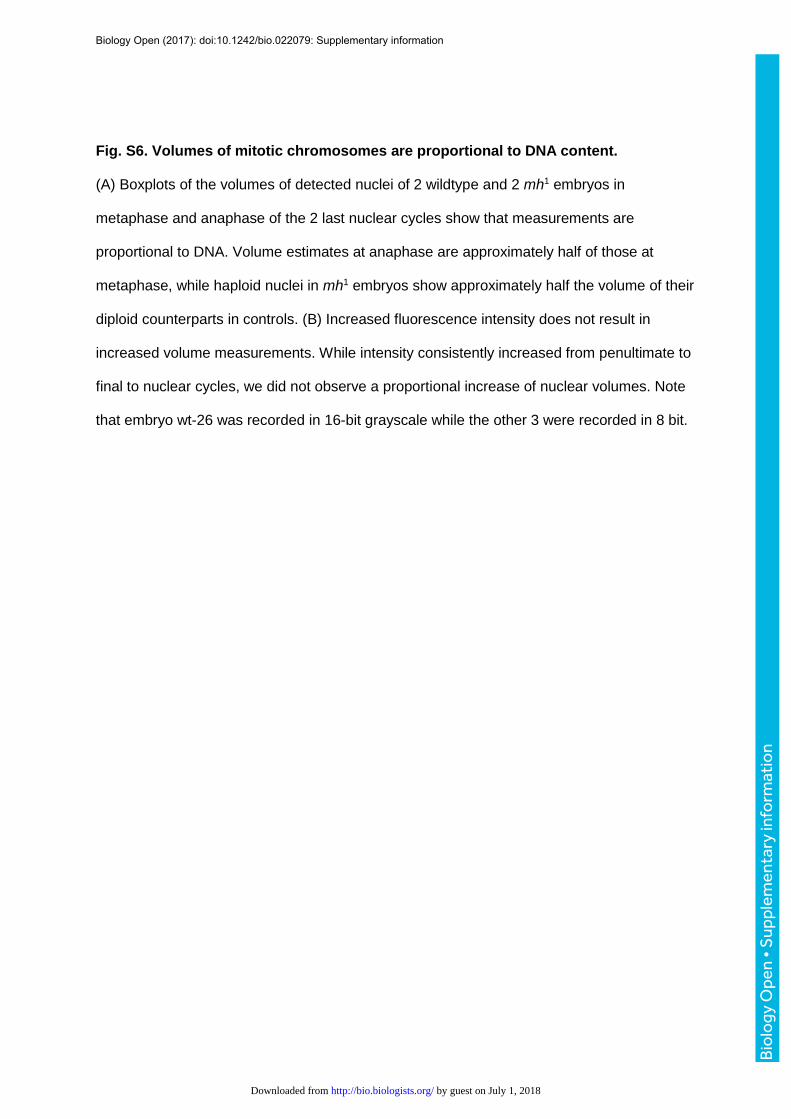
Fig. S6. Volumes of mitotic chromosomes are proportional to DNA content.
(A) Boxplots of the volumes of detected nuclei of 2 wildtype and 2 mh1 embryos in
metaphase and anaphase of the 2 last nuclear cycles show that measurements are
proportional to DNA. Volume estimates at anaphase are approximately half of those at
metaphase, while haploid nuclei in mh1 embryos show approximately half the volume of their
diploid counterparts in controls. (B) Increased fluorescence intensity does not result in
increased volume measurements. While intensity consistently increased from penultimate to
final to nuclear cycles, we did not observe a proportional increase of nuclear volumes. Note
that embryo wt-26 was recorded in 16-bit grayscale while the other 3 were recorded in 8 bit.
Biology Open (2017): doi:10.1242/bio.022079: Supplementary information
Bio
logy
Ope
n •
Sup
plem
enta
ry in
form
atio
n
by guest on July 1, 2018http://bio.biologists.org/Downloaded from
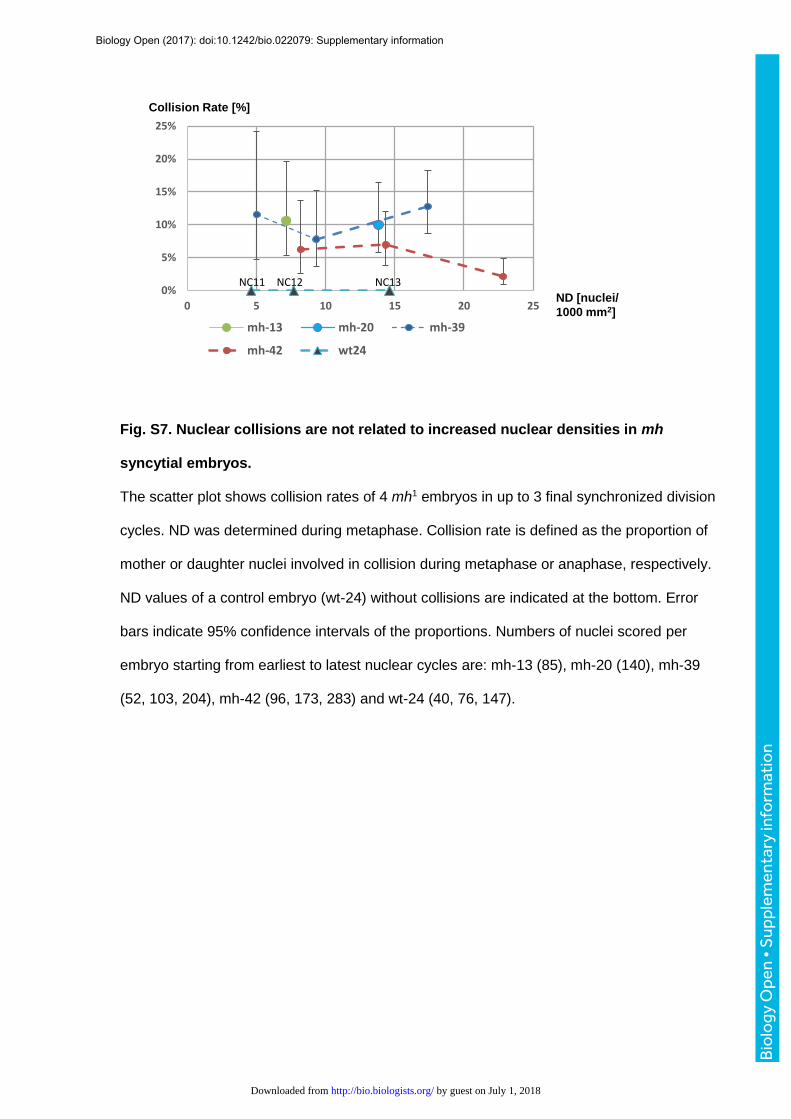
Fig. S7. Nuclear collisions are not related to increased nuclear densities in mh
syncytial embryos.
The scatter plot shows collision rates of 4 mh1 embryos in up to 3 final synchronized division
cycles. ND was determined during metaphase. Collision rate is defined as the proportion of
mother or daughter nuclei involved in collision during metaphase or anaphase, respectively.
ND values of a control embryo (wt-24) without collisions are indicated at the bottom. Error
bars indicate 95% confidence intervals of the proportions. Numbers of nuclei scored per
embryo starting from earliest to latest nuclear cycles are: mh-13 (85), mh-20 (140), mh-39
(52, 103, 204), mh-42 (96, 173, 283) and wt-24 (40, 76, 147).
0%
5%
10%
15%
20%
25%
0 5 10 15 20 25
mh-13 mh-20 mh-39
mh-42 wt24
NC11 NC12 NC13
ND [nuclei/
1000 mm2]
Collision Rate [%]
Biology Open (2017): doi:10.1242/bio.022079: Supplementary information
Bio
logy
Ope
n •
Sup
plem
enta
ry in
form
atio
n
by guest on July 1, 2018http://bio.biologists.org/Downloaded from
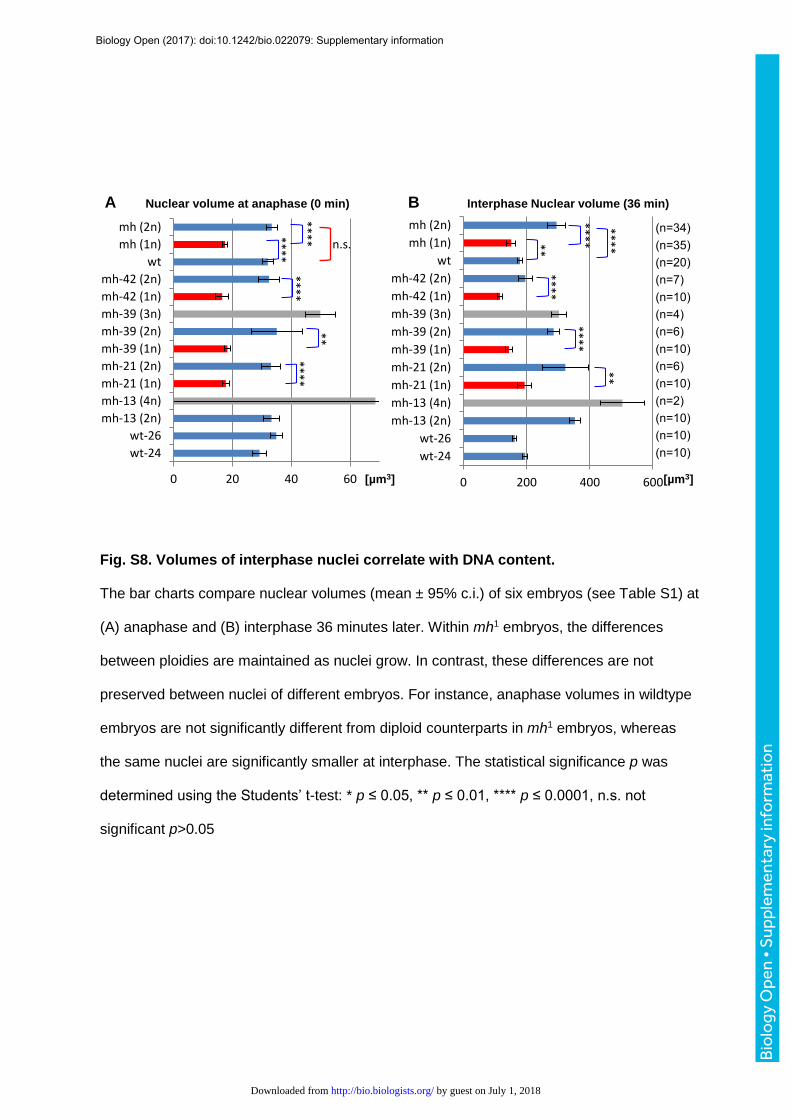
Fig. S8. Volumes of interphase nuclei correlate with DNA content.
The bar charts compare nuclear volumes (mean ± 95% c.i.) of six embryos (see Table S1) at
(A) anaphase and (B) interphase 36 minutes later. Within mh1 embryos, the differences
between ploidies are maintained as nuclei grow. In contrast, these differences are not
preserved between nuclei of different embryos. For instance, anaphase volumes in wildtype
embryos are not significantly different from diploid counterparts in mh1 embryos, whereas
the same nuclei are significantly smaller at interphase. The statistical significance p was
determined using the Students’ t-test: * p ≤ 0.05, ** p ≤ 0.01, **** p ≤ 0.0001, n.s. not
significant p>0.05
0 20 40 60
wt-24
wt-26
mh-13 (2n)
mh-13 (4n)
mh-21 (1n)
mh-21 (2n)
mh-39 (1n)
mh-39 (2n)
mh-39 (3n)
mh-42 (1n)
mh-42 (2n)
wt
mh (1n)
mh (2n)
0 200 400 600
wt-24
wt-26
mh-13 (2n)
mh-13 (4n)
mh-21 (1n)
mh-21 (2n)
mh-39 (1n)
mh-39 (2n)
mh-39 (3n)
mh-42 (1n)
mh-42 (2n)
wt
mh (1n)
mh (2n)
B Interphase Nuclear volume (36 min) A Nuclear volume at anaphase (0 min)
n.s.
****
****
****
**
****
****
****
**
**
**** **** [µm3] [µm3]
(n=34) (n=35) (n=20) (n=7) (n=10) (n=4) (n=6) (n=10) (n=6) (n=10) (n=2) (n=10) (n=10) (n=10)
Biology Open (2017): doi:10.1242/bio.022079: Supplementary information
Bio
logy
Ope
n •
Sup
plem
enta
ry in
form
atio
n
by guest on July 1, 2018http://bio.biologists.org/Downloaded from
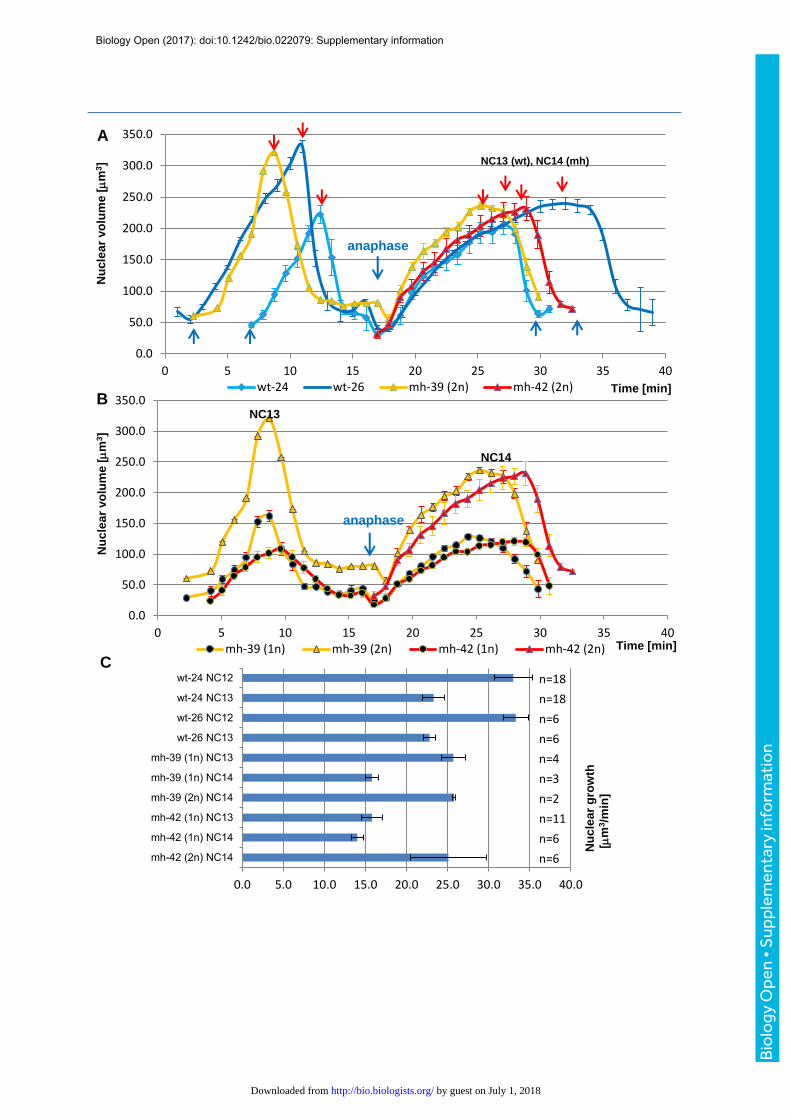
0.0
50.0
100.0
150.0
200.0
250.0
300.0
350.0
0 5 10 15 20 25 30 35 40wt-24 wt-26 mh-39 (2n) mh-42 (2n)
0.0
50.0
100.0
150.0
200.0
250.0
300.0
350.0
0 5 10 15 20 25 30 35 40mh-39 (1n) mh-39 (2n) mh-42 (1n) mh-42 (2n)
0.0 5.0 10.0 15.0 20.0 25.0 30.0 35.0 40.0
wt-24 NC12
wt-24 NC13
wt-26 NC12
wt-26 NC13
mh-39 (1n) NC13
mh-39 (1n) NC14
mh-39 (2n) NC14
mh-42 (1n) NC13
mh-42 (1n) NC14
mh-42 (2n) NC14
n=18
n=18
n=6
n=6
n=4
n=3
n=2
n=11
n=6
n=6
A
Nu
cle
ar
vo
lum
e [m
m3]
Nu
cle
ar
vo
lum
e [m
m3]
B
C
Time [min]
Time [min]
Nu
cle
ar
gro
wth
[m
m3/m
in]
NC13
NC14
anaphase
anaphase
NC13 (wt), NC14 (mh)
Biology Open (2017): doi:10.1242/bio.022079: Supplementary information
Bio
logy
Ope
n •
Sup
plem
enta
ry in
form
atio
n
by guest on July 1, 2018http://bio.biologists.org/Downloaded from

Fig. S9. Changes of nuclear volume during the syncytial blastoderm.
(A, B) We analyzed the last two synchronized nuclear cycles in two wildtype and two mh1
embryos. The time-series plots show time[min] versus nuclear volume [m3] (mean ± s.d.)
and were aligned relative to anaphase of the penultimate nuclear cycle (blue arrow). Number
of tracks (n) is shown in (C), except for one (n=1) diploid nucleus of embryo mh-39 in NC12.
(A) Nuclear growth during of NC12 of wildtype embryos shows a single rapid phase from
anaphase (blue arrow) to late interphase (red arrows), giving rise to a triangular curve. In
NC13, a longer interphase is associated with slower nuclear growth. Nuclear growth rates
and sizes are similar in diploid mh1 and control embryos. (B) Nuclear sizes in mh1 embryos
during the syncytial blastoderm are proportional to ploidy. The line plots compare haploid
(1n) and diploid (2n) nuclei of two embryos. (C) The bar chart compares nuclear growth
rates (mean ± s.d.) in the first 6 minutes of interphase of the control and mh1 embryos.
Biology Open (2017): doi:10.1242/bio.022079: Supplementary information
Bio
logy
Ope
n •
Sup
plem
enta
ry in
form
atio
n
by guest on July 1, 2018http://bio.biologists.org/Downloaded from
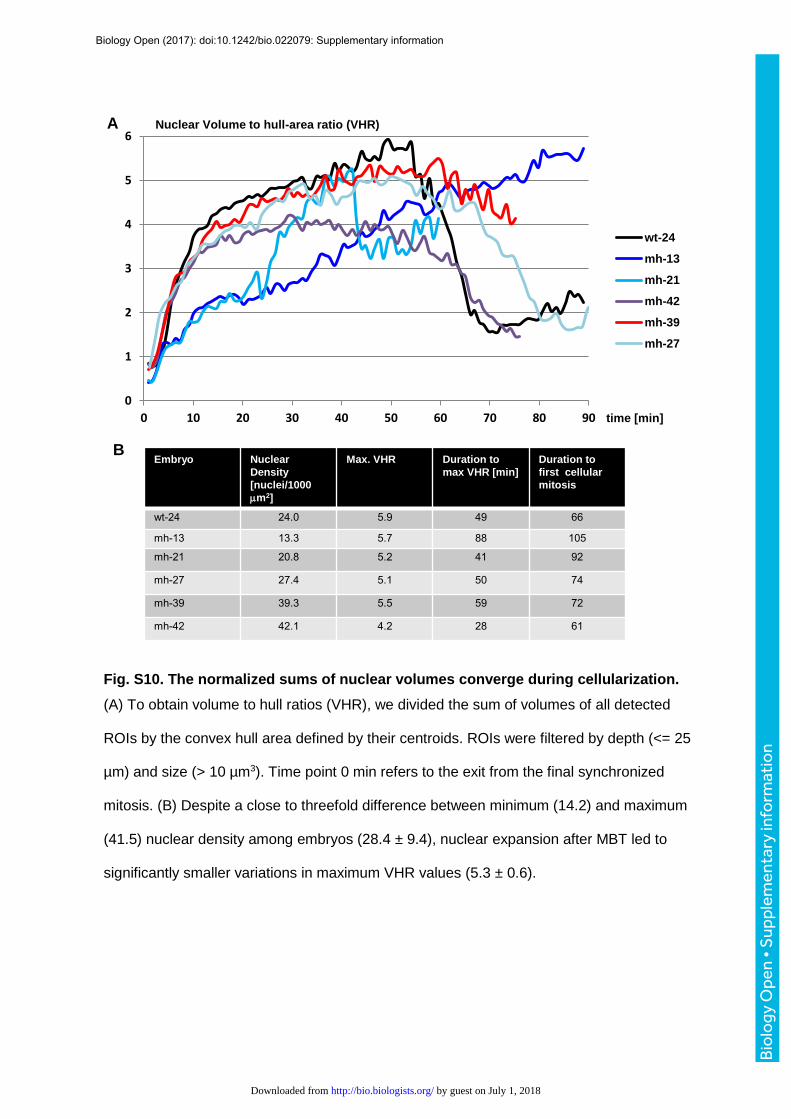
Fig. S10. The normalized sums of nuclear volumes converge during cellularization.
(A) To obtain volume to hull ratios (VHR), we divided the sum of volumes of all detected
ROIs by the convex hull area defined by their centroids. ROIs were filtered by depth (<= 25
µm) and size (> 10 µm3). Time point 0 min refers to the exit from the final synchronized
mitosis. (B) Despite a close to threefold difference between minimum (14.2) and maximum
(41.5) nuclear density among embryos (28.4 ± 9.4), nuclear expansion after MBT led to
significantly smaller variations in maximum VHR values (5.3 ± 0.6).
0
1
2
3
4
5
6
0 10 20 30 40 50 60 70 80 90 time [min]
wt-24
mh-13
mh-21
mh-42
mh-39
mh-27
Nuclear Volume to hull-area ratio (VHR)
Embryo Nuclear
Density
[nuclei/1000
mm2]
Max. VHR Duration to
max VHR [min]
Duration to
first cellular
mitosis
wt-24 24.0 5.9 49 66
mh-13 13.3 5.7 88 105
mh-21 20.8 5.2 41 92
mh-27 27.4 5.1 50 74
mh-39 39.3 5.5 59 72
mh-42 42.1 4.2 28 61
A
B
Biology Open (2017): doi:10.1242/bio.022079: Supplementary information
Bio
logy
Ope
n •
Sup
plem
enta
ry in
form
atio
n
by guest on July 1, 2018http://bio.biologists.org/Downloaded from
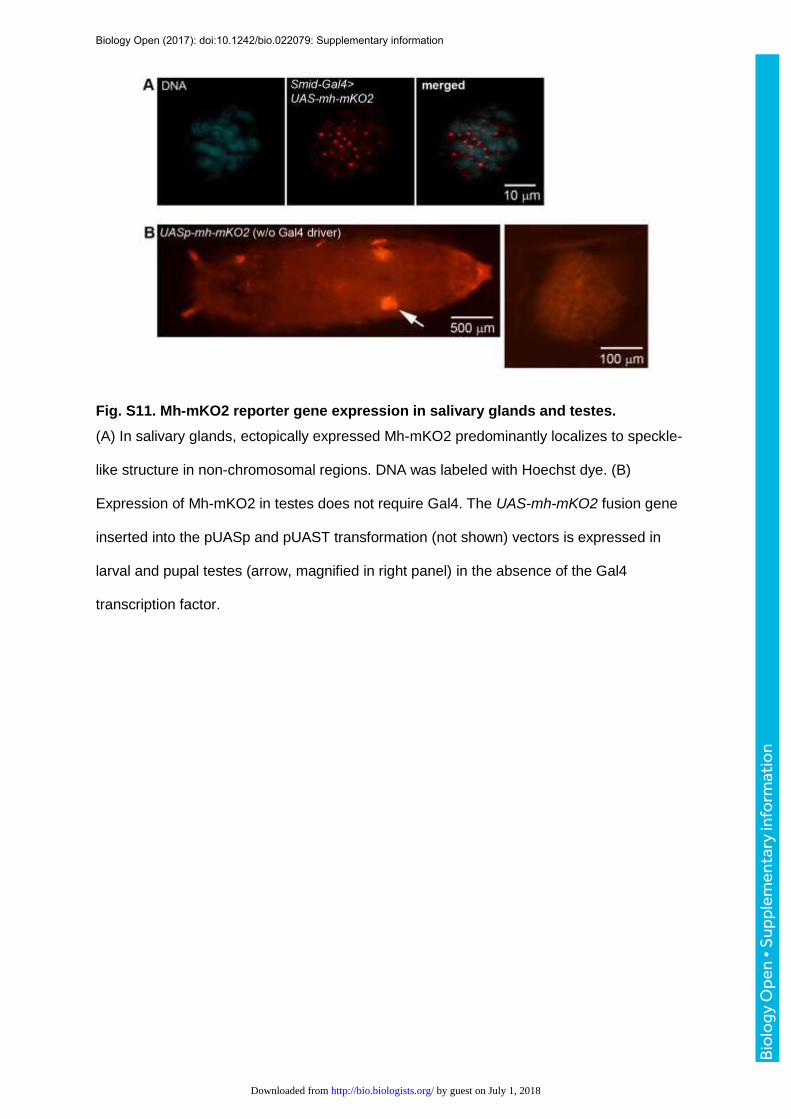
Fig. S11. Mh-mKO2 reporter gene expression in salivary glands and testes.
(A) In salivary glands, ectopically expressed Mh-mKO2 predominantly localizes to speckle-
like structure in non-chromosomal regions. DNA was labeled with Hoechst dye. (B)
Expression of Mh-mKO2 in testes does not require Gal4. The UAS-mh-mKO2 fusion gene
inserted into the pUASp and pUAST transformation (not shown) vectors is expressed in
larval and pupal testes (arrow, magnified in right panel) in the absence of the Gal4
transcription factor.
Biology Open (2017): doi:10.1242/bio.022079: Supplementary information
Bio
logy
Ope
n •
Sup
plem
enta
ry in
form
atio
n
by guest on July 1, 2018http://bio.biologists.org/Downloaded from
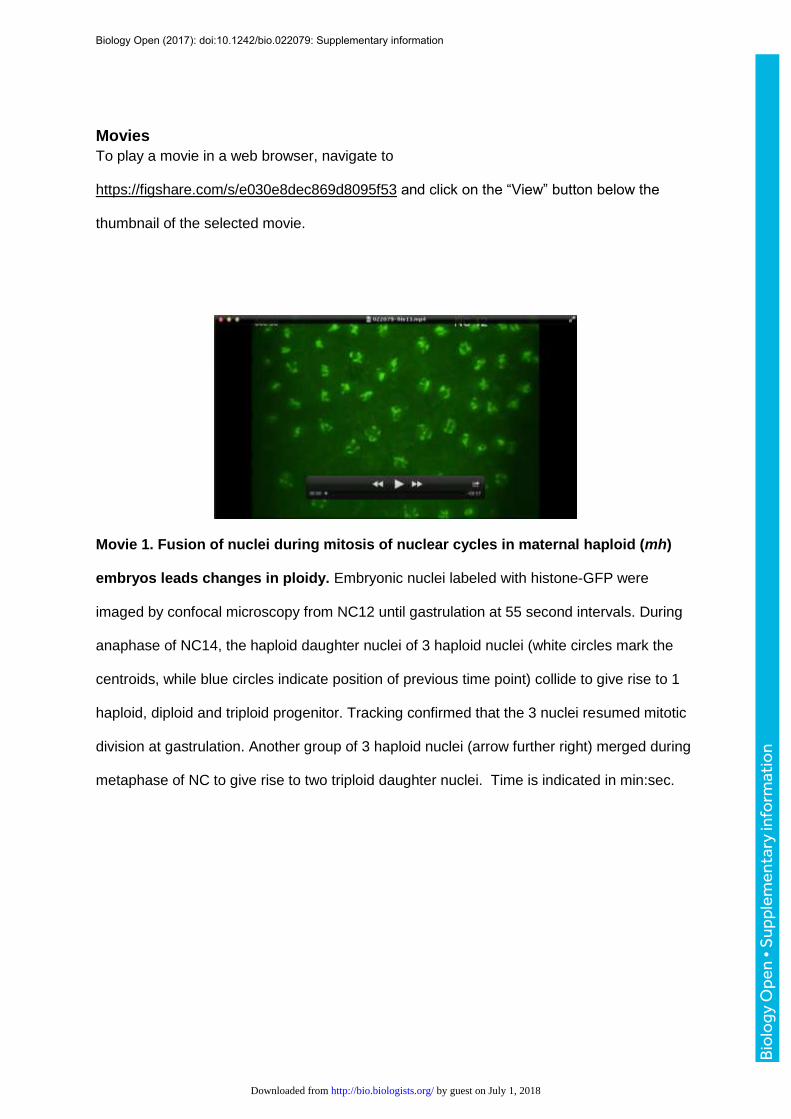
Movies
To play a movie in a web browser, navigate to
https://figshare.com/s/e030e8dec869d8095f53 and click on the “View” button below the
thumbnail of the selected movie.
Movie 1. Fusion of nuclei during mitosis of nuclear cycles in maternal haploid (mh)
embryos leads changes in ploidy. Embryonic nuclei labeled with histone-GFP were
imaged by confocal microscopy from NC12 until gastrulation at 55 second intervals. During
anaphase of NC14, the haploid daughter nuclei of 3 haploid nuclei (white circles mark the
centroids, while blue circles indicate position of previous time point) collide to give rise to 1
haploid, diploid and triploid progenitor. Tracking confirmed that the 3 nuclei resumed mitotic
division at gastrulation. Another group of 3 haploid nuclei (arrow further right) merged during
metaphase of NC to give rise to two triploid daughter nuclei. Time is indicated in min:sec.
Biology Open (2017): doi:10.1242/bio.022079: Supplementary information
Bio
logy
Ope
n •
Sup
plem
enta
ry in
form
atio
n
by guest on July 1, 2018http://bio.biologists.org/Downloaded from

Movie 2. Nuclear fusion in mh embryos during the syncytial blastoderm stage does
not depend on crowding or haploidy. White circles mark the centroids of diploid (2n)
nuclei that fuse during anaphase of the final nuclear division cycle to give rise to tetraploid
(4n) nuclei. Nuclear migration is visualized by lines connecting previous (blue circle) and
current centroids (white circle). The final syncytial division cycle prior to MBT occurred at a
nuclear density consistent with the penultimate nuclear cycle in wildtype embryos,
suggesting that fusion does not depend on the crowding or haploidy. After completion of
cellularization (100 minutes) tetraploid cells divide normally. A haploid cell (1n) is marked for
reference in bottom right region of the frame.
Biology Open (2017): doi:10.1242/bio.022079: Supplementary information
Bio
logy
Ope
n •
Sup
plem
enta
ry in
form
atio
n
by guest on July 1, 2018http://bio.biologists.org/Downloaded from
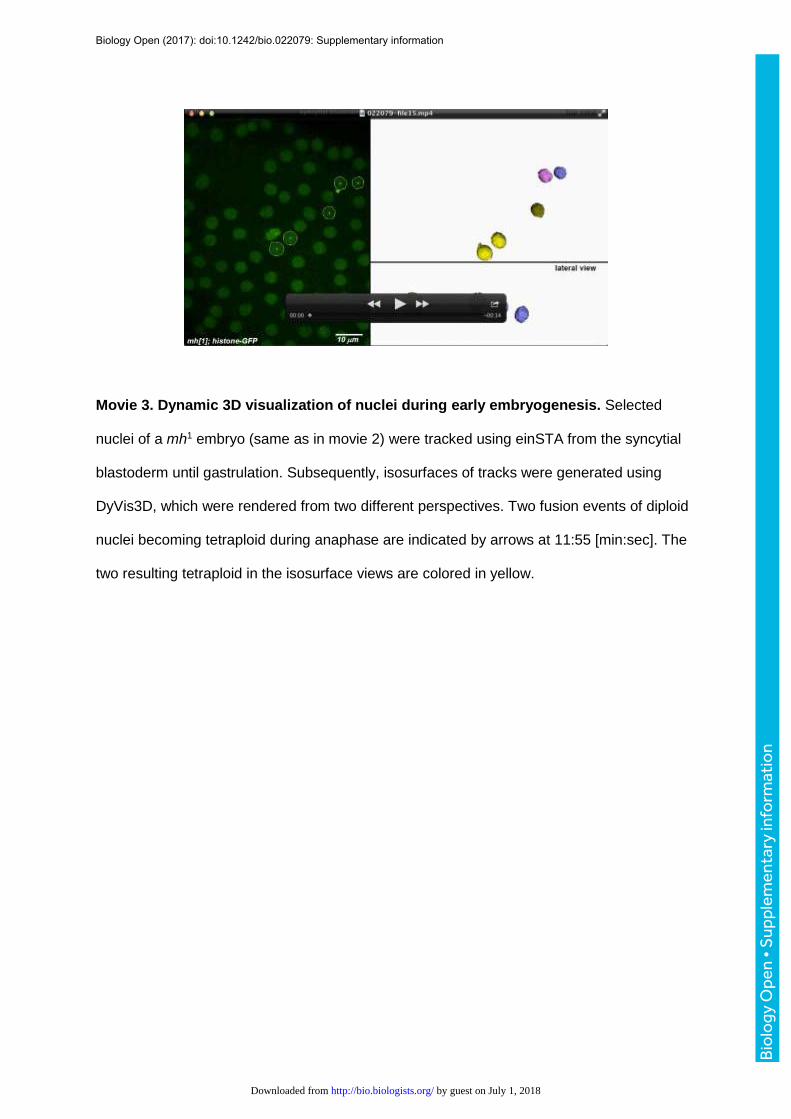
Movie 3. Dynamic 3D visualization of nuclei during early embryogenesis. Selected
nuclei of a mh1 embryo (same as in movie 2) were tracked using einSTA from the syncytial
blastoderm until gastrulation. Subsequently, isosurfaces of tracks were generated using
DyVis3D, which were rendered from two different perspectives. Two fusion events of diploid
nuclei becoming tetraploid during anaphase are indicated by arrows at 11:55 [min:sec]. The
two resulting tetraploid in the isosurface views are colored in yellow.
Biology Open (2017): doi:10.1242/bio.022079: Supplementary information
Bio
logy
Ope
n •
Sup
plem
enta
ry in
form
atio
n
by guest on July 1, 2018http://bio.biologists.org/Downloaded from
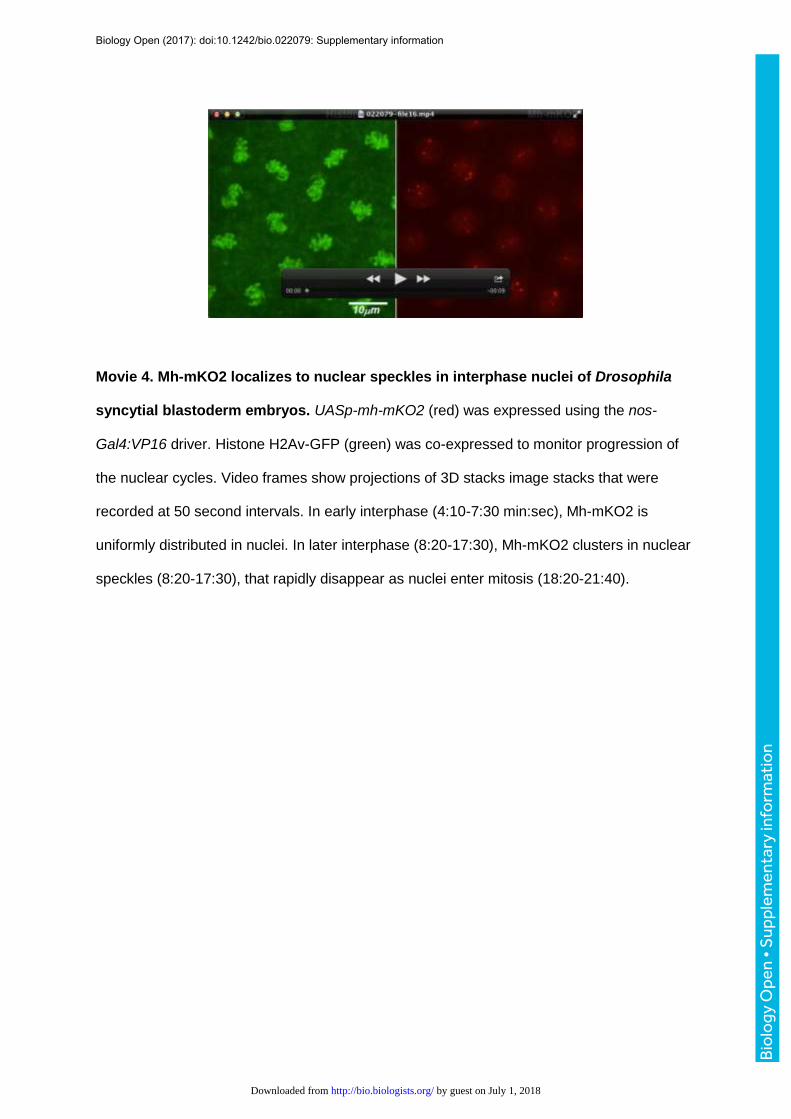
Movie 4. Mh-mKO2 localizes to nuclear speckles in interphase nuclei of Drosophila
syncytial blastoderm embryos. UASp-mh-mKO2 (red) was expressed using the nos-
Gal4:VP16 driver. Histone H2Av-GFP (green) was co-expressed to monitor progression of
the nuclear cycles. Video frames show projections of 3D stacks image stacks that were
recorded at 50 second intervals. In early interphase (4:10-7:30 min:sec), Mh-mKO2 is
uniformly distributed in nuclei. In later interphase (8:20-17:30), Mh-mKO2 clusters in nuclear
speckles (8:20-17:30), that rapidly disappear as nuclei enter mitosis (18:20-21:40).
Biology Open (2017): doi:10.1242/bio.022079: Supplementary information
Bio
logy
Ope
n •
Sup
plem
enta
ry in
form
atio
n
by guest on July 1, 2018http://bio.biologists.org/Downloaded from